

Tape Diagrams in Math: A Problem Solving Strategy
What is your go-to strategy for teaching word problems? I have always encouraged my students to model, model, model when solving word problems. Modeling is a way for students to make sense of a problem and catch mistakes before they happen. Sometimes, what seems like a good answer just doesn't work out once it's drawn as a model.
Until recently, I really didn't care what kind of model my kids used. Drawings, tally marks, symbols: anything was fair game. But as we've worked our way through multiplication and into division, I've found myself returning over and over again to the tape diagram. It's a nearly fail-proof way to work through a story problem and my students have become problem solving masters!
So, what exactly is a tape diagram?
A tape diagram is a drawing that looks like a segment of tape, used to illustrate number relationships. Also known as a strip diagram, bar model, fraction strip, or length model."
In practice, a tape diagram in math looks like this...
Tape diagrams have become my go-to model when teaching math. They work for any type of word problem, but I especially love them for solving multiplication and division.
how do you solve a tape diagram?
To solve problems using tape diagrams, students must first ask, "Do I know the whole amount?" If it's supplied by the problem, fill it in. If not, put a question mark at the bottom of the diagram. Then look for other information and fill that in. The question mark always represents whatever piece of information is missing.
Here is an example of how I use it to teach division problems:

Students will quickly begin to see a pattern... the bottom number is always the product of the top two numbers.
Therein lies the beauty of this model:
It is self-correcting. If the top two numbers, when multiplied, do not equal the bottom, you've done something wrong.
When teaching with this model, it's a good idea to have students write all four possible equations. So in the above example, we would also write ? x 4 = 32 and 32 ÷ ? = 4. This is important because it reinforces the concept of inverse operations and fact families. It also gives students a tool to use when the encounter problems with a missing factor or divisor.
Once my students are able to interpret story problems and solve using tape diagrams, I teach them to analyze a tape diagram and write their own story problems to go with it. This requires high-order thinking and really develops their mathematical minds.

how to use tape diagrams
To use tape diagrams with your students, I suggest following this instructional sequence...
Teacher supplies the story problem, draws the tape diagram, and models how to solve.
Teacher supplies the story problem, draws the tape diagram, and students help solve.
Teacher supplies the story problem, students help draw the diagram, and students solve on their own.
Teacher supplies the story problem, students draw and solve alone.
Teacher draws a tape diagram and students create a story problem to go with it.
Along the way, you'll want to move from including one equation that represents the problem to showing all four possible equations. This process, from introduction to proficiency, might take several weeks depending on the skills of your students. But it will pay off in the long run when your students become experts at solving word problems !

If you're interested in teaching your students to use this strategy, you may want to check out this resource:
Problem Solving with Tape Diagrams: A Model for Multiplication and Division
Related Posts
5 Great Reasons to Use Games in the Classroom
Keywords for Math Word Problems: A Bad Strategy?
How to Teach 3rd Grade Division: The Best Way to Build Division Skills
the video needs someone explaining the proses of the tape diagram
😓😓😓😓😓😓😓😓😓😓😓😓😓😓😓😓
😃😃😃😃😃😃😃😃😃😃😃😃😃😃😃😃😃
The Mathematics Master
How to Use Tape Diagram for Problem Solving
September 19, 2023
Imagine having a simple yet powerful tool at your fingertips to unravel math mysteries! That's where tape diagrams step into the spotlight.
Think of them as your math buddy – a visual representation resembling a snippet of tape that opens up a world of number connections. Whether you’ve heard them referred to as strip diagrams, bar models, fraction strips, or length models, they all point to the same idea. With tape diagrams, you’re not just solving math problems; you’re crafting a visual journey that untangles the knots of mathematical concepts . These diagrams are like keys to unlock the doors of word problems, helping you quickly organize information and share your brilliant mathematical insights.
What are Tape Diagrams?
Imagine a visual aid that effortlessly guides you through mathematical puzzles – that’s the magic of tape diagrams. These rectangular wonders, resembling strips of tape, are here to simplify your computations. Tape diagrams are your trusty sidekick if you grapple with word problems built on ratios.
Every student’s toolkit should include the skill of creating and using tape diagrams. Why? Because these diagrams hold the key to understanding mathematical concepts and depicting relationships within problems. With tape diagrams, you’re solving problems and bringing mathematical ideas to life. They become your artistic canvas, allowing you to showcase your problem-solving strategies and share your mathematical thoughts.
- Mastering Tape Diagrams
Tape diagrams might sound complex, but fear not! Let’s walk through the steps to craft these problem-solving marvels. Think of tape diagrams as your creative toolkit – they slice daunting tasks into bite-sized graphical goodness. Whether wrestling with tricky word problems or tackling equations head-on, tape diagrams are your reliable companion, making math a visual adventure. So, let’s dive into the artistic journey of creating tape diagrams, one step at a time.
Step 1: Analyze the Problem
Take a moment to read and dissect the problem statement or equation. This initial step is like getting to know the characters before writing a story – it’s essential! By absorbing the problem’s essence, you’ll grasp the scenario and envision pathways to crack it wide open.
Step 2: Gather Your Tools
Now that you’re on a first-name basis with the problem, it’s time to dissect it further. Think of it as breaking down a complex puzzle into its elemental pieces. What parts of the problem are like the corner pieces of a jigsaw puzzle, crucial for completing the whole picture? Identify these components, the building blocks that will populate your tape diagram.
Step 3: It’s Time to Draw the Tape Diagram
With your mental toolkit assembled, it’s time to create your masterpiece – the tape diagram. Envision a long, rectangular canvas resembling a piece of tape. Divide this canvas into smaller sections using neat little boxes. These sections will represent the components you identified in Step 2. Depending on the complexity of the problem, your diagram might have just a couple of sections or a handful. There’s no hard and fast rule, but aim for at least two sections to give your diagram a solid foundation.
Step 4: Solution
Your tape diagram is like a map guiding you to the treasure of the solution. It’s time to put your diagram to work. Solve the problem using the insights your diagram provides. Label the sections, incorporate your gathered information, and let the magic happen.
Putting It into Practice
Now, let’s bring all this theory to life with an example. Imagine a problem where you need to divide your allowance among different expenses. This is where your tape diagram steps in, carving out sections for each expense and revealing the mathematical treasure of how much to allocate where.
Tape diagrams might be simple in concept, but they’re versatile and mighty in practice. They’re not just sketches on paper but your companions on your mathematical journey, making complex problems a visual delight. So, the next time math gives you a puzzling stare, remember that tape diagrams are your secret weapon – transforming numbers into captivating stories of logic and creativity.
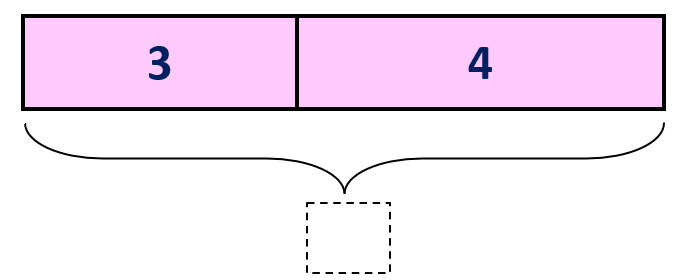
Example: Create a tape diagram that represents these equations.
( i ) \(4 + 8 = 12\)
( ii ) \(9 + 6 = 15\)
( i ) Crafting a tape diagram for \(4 + 8 = 12\) involves making four equal cells and adding eight more.
Another option for visual representation could be a complete rectangle divided into two segments, depicted below. It’s worth noting that the rectangle representing \(8\) is longer than the one corresponding to \(4\).
( ii ) Constructing a tape diagram to visualize \(9 + 6 = 15\) involves crafting nine identical cells and adding six more.
Another way to depict this would be a complete rectangle divided into two sections, as presented below. It’s important to observe that the rectangle representing \(9\) is longer than the one representing \(6\).
Tape Diagram for Multiplication and Division
Tape diagrams can also serve as a visual aid for word problems involving multiplication and division.
Examples: Draw a tape diagram that represents these equations.
( i ) \(3 × 9 = 27\)
( ii ) \(2 × 4 = 8\)
( i ) In the case of \(3 × 9 = 27\), \(3\) and \(9\) are called factors. To illustrate this with a tape diagram, let’s create nine equal cells, with three inscribed within each cell as a demonstration.
( ii ) To represent \(2 × 4 = 8\), sketch four identical cells and jot down the number \(2\) within each cell. This serves as an illustrative tape diagram for multiplication.
In essence, the tape diagram stands as an efficient tool for cracking mathematical puzzles. Compared to rote memorization, which can fall flat if grounded in understanding, the beauty of the tape diagram lies in its adaptability. It empowers students not only to master the “how” but also the “why” – fostering a genuine grasp of concepts. By embracing these visual aids, students embark on improved comprehension. As they unravel problems with the guidance of tape diagrams, they enhance their problem-solving prowess and nurture a deeper connection with the world of mathematics.
What are alternate terms for tape diagrams?
Tape diagrams often go by other names, such as strip diagrams, bar models, length models, or fraction strips. These terms are commonly used interchangeably to refer to this visual representation tool.
Why is it called a tape diagram?
A tape diagram earns its name from its resemblance to a strip of tape. This visual tool aids in tackling a variety of calculations, including ratios, addition , subtraction, and, most notably, multiplication . Its simplicity and effectiveness make it a versatile asset in mathematics.
What advantages do tape diagrams offer?
Tape diagrams shine by preventing students from memorizing concepts they may need help understanding. They encouraged a deeper understanding of mathematical ideas and proved to be particularly effective in successfully solving word problems in mathematics.
- Math Calculator
- math education
- Math Playground
- math stations
- mathematical puzzles
- multiplication and division
- strip diagrams
- Tape Diagrams
- tips and tricks
Can't find your query?
Fill out the form below with your query and we will get back to you in 24 hours.
Browse other categories
- Mathematics
- Online Calculator
Most commonly used free online Calculators
Quadratic calculator.
A quadratic Calculator is used to find t...
Sig Fig Calculator
An online sig fig calculator can convert...
Discriminant Calculator
A discriminant calculator can be used fo...
Dot Product Calculator
Introducing the Dot Product Calculator! ...
Endpoint Calculator
An online endpoint calculator can accura...
Completing the Square Calculator
The Completing the Square Calculator is ...
Square Root Calculator
You must be familiar with square roots i...
Pythagorean Theorem Calculator
The Pythagorean Theorem Calculator uses ...
The most Popular Blogs among people
Cartesian coordinates system – dimensions, formula....
Cartesian coordinates, sometimes called rectangular coordinates, are t...
Math Playground: A Hands-On Approach to Learning M...
Step into the math playground, where the wonders of numbers come to li...
How to Graph a Parabola – Formula, Properties, and...
When you discharge an arrow or throw a stone, it arcs into the air and...
Subscribe for the latest updates
Say goodbye to manual calculations and do math within a fraction of seconds with our easy to use and accurate free online calculators.
- Skip to main content
- Skip to primary sidebar
CLICK HERE TO LEARN ABOUT MTM ALL ACCESS MEMBERSHIP FOR GRADES 6-ALGEBRA 1
Maneuvering the Middle
Student-Centered Math Lessons
Using Tape Diagrams to Solve Problems

Welcome to Part 3 of our Problem Solving Strategy series! Today we are diving into helpful tape diagrams to solve problems.
If you want to learn more, check out this book, Mathematize It! , that covers the topic of teaching how to solve word problems in much more detail.
Be sure to read: Part 1: Three Word Problem Types to Teach | Part 2: Three Steps to Solving Word Problems
Diagrams are a way to model what is happening in a word problem. Diagrams help provide students with the “operational sense” that they need in order to write an equation and solve a problem. We cannot rely on keywords to determine an operation.
Let’s dive into two examples. ( You can see my example of open number line diagram here .)

Tape Diagrams in a Relationship Problem
Let’s start with an example problem:

After we have restated the problem, we use a diagram to represent the problem. Notice that this tape diagram is helpful because of the whole in relation to the part.

There are 2 parts to this marching band: those in percussion and those NOT in percussion. These 2 parts will make up the total number of members in the band (this is our whole).

We also know that there are 28 in percussion, so one part is 28. That leaves the unknown value as our other “part” – those not in percussion. So we will write the variable x in our model.
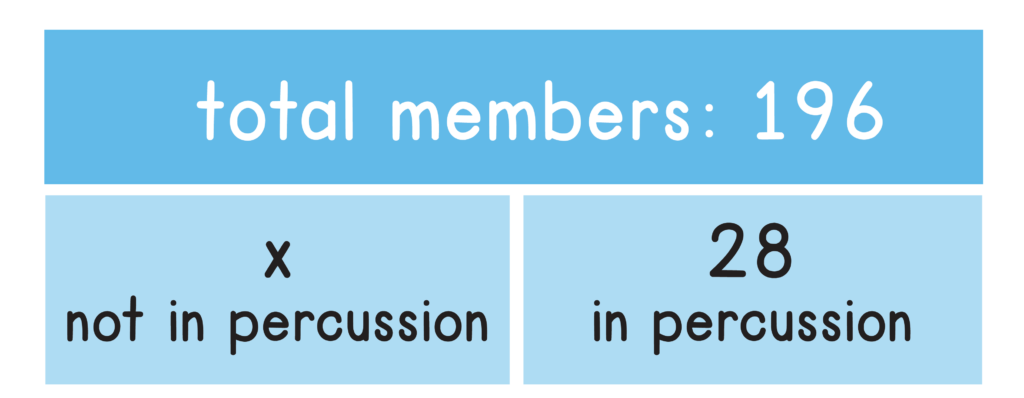
And now we can use the bar model to write an equation. We can see we need to add the two parts together and set it equal to the whole, so we could write the equation x + 28 = 196.

The model helps a student develop the operational sense to write an equation with addition , but then perform subtraction to find the difference between the two values. They can see that their solution needs to be a value smaller than the total number of members.
Tape Diagrams in a Comparison Problem

Without problem solving strategies, a student may write an equation like this, p + d + c = 10.50. They have an equation with 3 different variables and then are stuck. They don’t know how to solve for d, the price of the drink. Let’s try a tape diagram.

We know the popcorn is three times as expensive as the candy and the drink is twice as expensive as the candy. Let’s create a tape diagram under each food item in our bar model.

We know the popcorn is three times as expensive as the candy. This can be hard for students to grasp, so give them an example with simple numbers: “If candy is $1, how much is popcorn?” $3. We want students to see that popcorn is more expensive than candy and that the cost of 3 candies is equal to the cost of one popcorn.

Similarly, the drink is twice as expensive as the candy so the drink is equivalent to 2c’s.

Finally, we know the cost of the candy is represented with the variable c. Now we are ready to make a connection between our model and write an equation.

The model clearly shows that 6c = 10.50. We have taken a complex word problem and written a one-step equation to solve for the variable c. Once a student solves for the value of c, they can refer back to determine the cost of the drink and popcorn.
Grab our Problem Solving Poster freebie to display in your classroom!
How do you use tape diagrams in your classroom?
P.S. Check out these related posts: Math Problem Solving Strategies and How to Teach Word Problems and Problem Solving

Problem Solving Posters (Represent It! Bulletin Board)
Check out these related products from my shop.
Helping with Math
Tape Diagrams
Introduction.
In tape diagrams, rectangles are used to show the parts of a ratio visually. They require careful drawing because they are a visual model. They simplify and deconstruct complex mathematical word problems . They are shown as a strip of paper or a piece of tape.
Every learner needs to be able to draw and use a tape diagram to solve mathematical problems. It helps students learn arithmetic ideas and portray relationships in a math problem. Students can use it to communicate how they approach solving problems and organize their thoughts. Students can use these illustrations to solve any word problem.
We will learn more about tape diagrams in this article, including how teachers and students use them to solve mathematical problems that involve addition, subtraction , multiplication , division, ratio , fractions , and equations.
What are Tape Diagrams?
A tape diagram is a rectangular illustration that resembles a piece of tape and has sections to help with computations. It is a frequent graphic tool for resolving mathematical word problems with ratios as their basis. A strip diagram, a bar or length model, or a fraction strip are additional names for tape diagrams that are frequently used.
Each student must be able to create and use a tape diagram to solve mathematical problems. It helps students understand mathematical concepts and illustrate relationships in mathematical problems. Students can utilize it to share their ideas on any problem and how they would go about addressing it.
What are the advantages of using tape diagrams?
The tape diagram has the advantage of preventing students from memorization of ideas they do not comprehend. The tape diagram is used to solve a word problem in mathematics successfully. The table below shows examples of mathematical problems for which we typically use tape diagrams.
Steps in Creating a Tape Diagram
A tape diagram is simple to make if you follow a few simple steps. It uses a tape piece broken into more manageable rectangular sections to show difficult tasks graphically. Any difficult word problems are simplified with tape diagrams. To draw a tape diagram, adhere to these easy steps.
Step 1: Read and analyze the problem.
To understand the problem, reading the provided problem statement or math equation is essential. You will then comprehend the presented situation and the ways to solve it. There are many different sorts of equations and problems in arithmetic; therefore, it is essential to understand them before you try to answer them by creating a diagram.
Step 2: Gather information essential for the diagram.
After reading the problem description, the next step is to segment the problem to identify its simplest solution. By breaking the word problem down into smaller parts, you can see which parts are necessary for the diagram and which parts have already been resolved in the given data, saving you from having to do the work again.
Step 3: Draw the tape diagram.
The next step is to draw a long, rectangular segment that resembles a piece of tape and then divide it into several parts using small boxes. Depending on the problem statement, you will draw a different number of cells. There is no max limit, but you must construct at least two sections.
Step 4: Solve the problem.
Solving the problem determines whether the tape diagram is accurate by completing the provided task. Labeling the diagram and using the information provided helps to solve the entire mathematical equation.
For example, let us use a tape diagram to illustrate and solve the problem below.
Problem: There are six sheets of red colored paper and four sheets of green colored paper. How many sheets of colored paper are there?
The given problem requires us to identify the total number of sheets of colored paper.
Red colored paper: 6 sheets
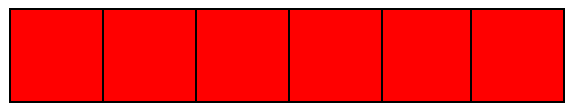
Green-colored paper: 4 sheets

Therefore, there is a total of 10 sheets of colored paper, 6 + 4 = 10.
How Do Tape Diagrams Work?
A tape diagram is a rectangular illustration that resembles a piece of tape and has sections to help with computations. The following examples use tape diagrams for addition, subtraction, multiplication, division, ratio, fractions , and equations.
Tape Diagrams for Addition and Subtraction
Tape diagrams are used for addition and subtraction as a visual tool to solve problems. The following are examples of how to show equations using tape diagrams.
Create a tape diagram that represents each equation.
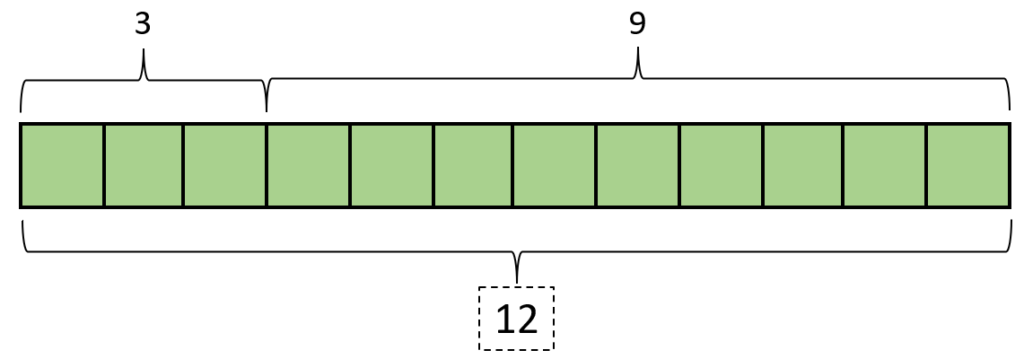
( a ) 3 + 9 = 12
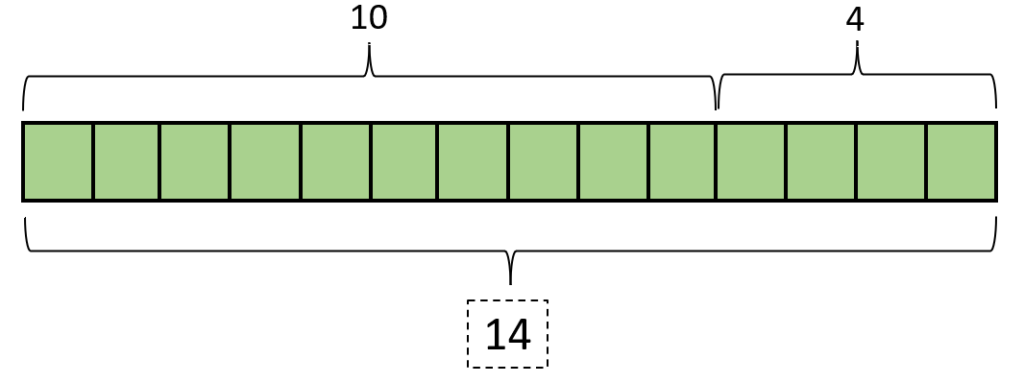
( b ) 10 + 4 = 14
(a ) To create a tape diagram for 3 + 9 = 12, we must create 3 equal cells and 9 more.
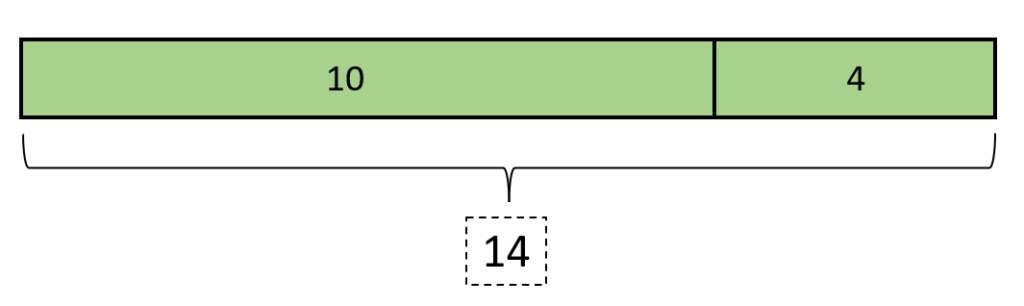
An alternative illustration would be a whole rectangle with two parts, as shown below. Notice that the rectangle for 9 is longer than that of 3.

(b ) To create a tape diagram for 10 + 4 = 14, we must create 10 equal cells and 4 more.
An alternative illustration would be a whole rectangle with two parts, as shown below. Notice that the rectangle for 10 is longer than that of 4.
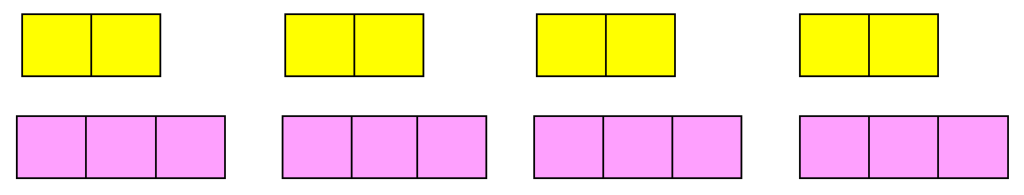
A florist chose seven red and five white flowers to make a bouquet. How many flowers did he use for the flower arrangement?
The problem requires us to find the total number of flowers the florist used for the flower arrangement. The following is the given information:
Let us use a tape diagram to visualize the problem.
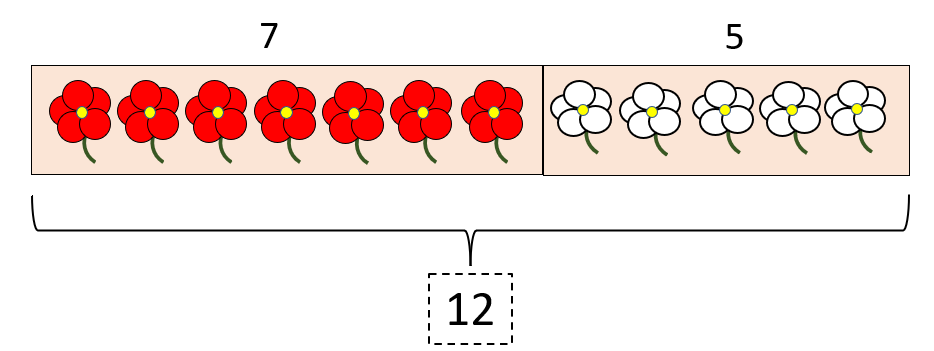
Using an equation, we may represent the solution to the problem as 7 + 5 = 12. Therefore, the florist used a total of 12 flowers in his bouquet.
Draw a tape diagram that represents each equation.
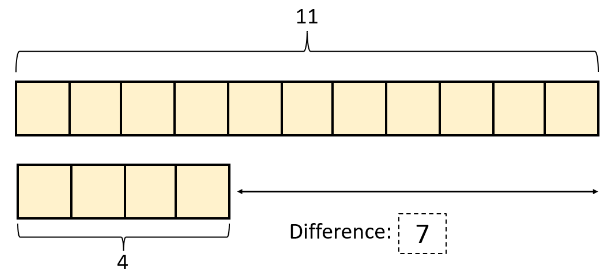
( a ) 11 – 4 = 7
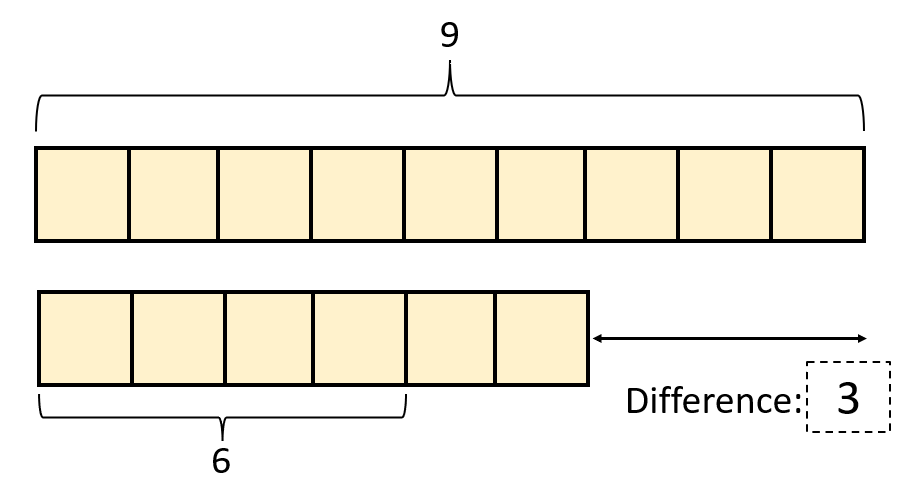
( b ) 9 – 6 = 3
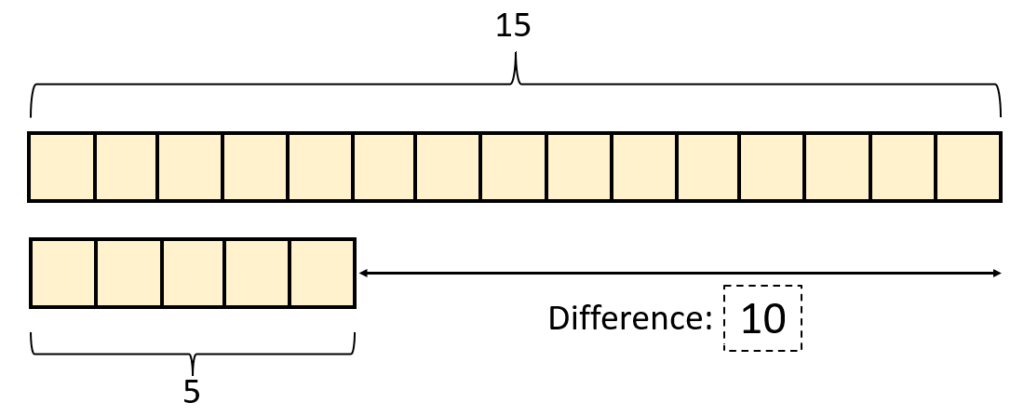
( c ) 15 – 5 = 10
( a ) To create a tape diagram for 11 – 4 = 7, we must create 11 equal cells for the minuend and 4 equal cells for the subtrahend. A tape diagram is shown in the figure below for the equation 11 – 4 = 7.
( b ) To create a tape diagram for 9 – 6 = 3, we must make 9 equal cells for the minuend and 6 equal cells for the subtrahend. A tape diagram is shown in the figure below for the equation 9 – 6 = 3.
( c ) To create a tape diagram for 15 – 5 = 10, we must create 15 equal cells for the minuend and 5 equal cells for the subtrahend. A tape diagram is shown in the figure below for the equation 15 – 5 = 10.
Tape Diagram for Multiplication and Division
Tape diagrams can also be a visual tool for multiplication and division-related word problems.
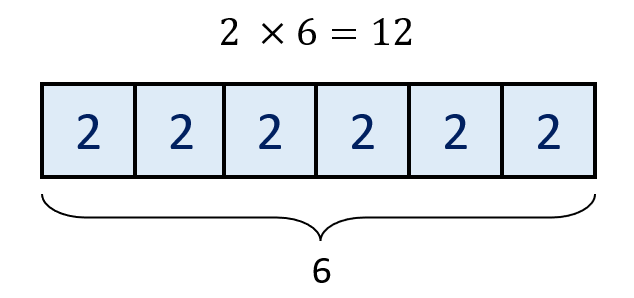
( a ) 2 × 6 = 12
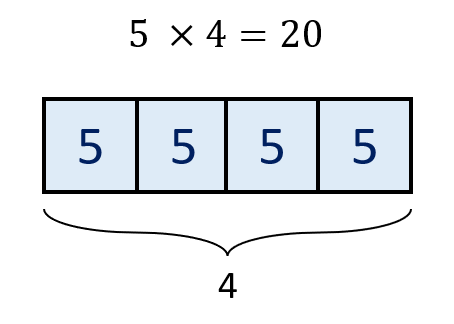
( b ) 5 × 4 = 20
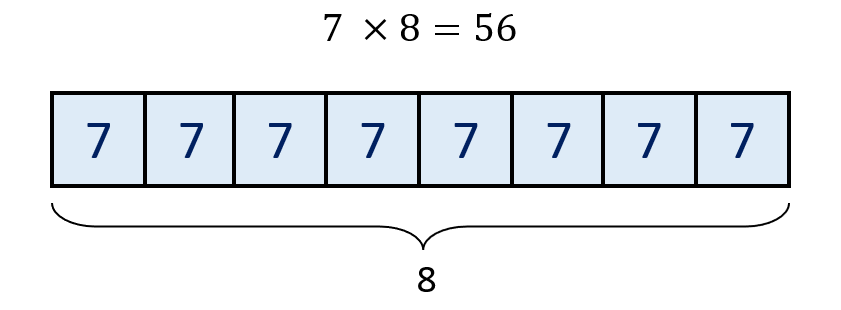
( c ) 7 × 8 = 56
( a ) For 2 × 6 = 12, both 2 and 6 are called factors . Make 6 equal cells with the number 2 written in each one as an example of a tape diagram for this.
( b ) For 5 × 4 = 20, draw 4 equal cells with the number 5 written in each one as an example of a tape diagram for this.
( c ) For ( c ) 7 × 8 = 56, draw 8 equal cells with the number 7 written in each one as an example of a tape diagram for this.
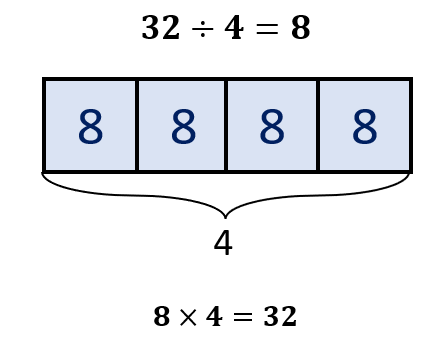
Francis has 32 candies and plans to give them to his 4 friends. Use a tape diagram to illustrate and solve the number of candies each person receives.
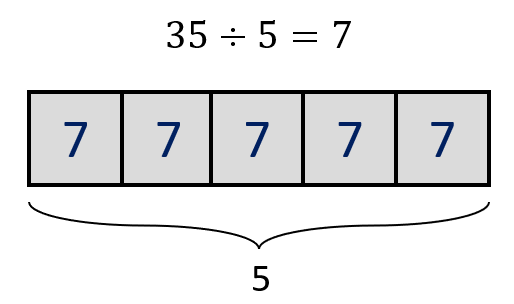
This requires the process of division to find how many each of Francis’ friends will receive. So, we have 32 ÷ 4 = 8. The tape diagram below is an illustration of the problem.
Tape Diagrams for Fractions
Use a tape diagram to solve 45 of 35.
In this example, since the fraction’s denominator is 5, it tells us that we must divide our tape diagram into 5 equal parts.
By the process of division , we can have 35 ÷ 5 = 7. Hence, we may label each cell as 7.
Since we need to find 4 parts of the whole, we must multiply 7 by 4.
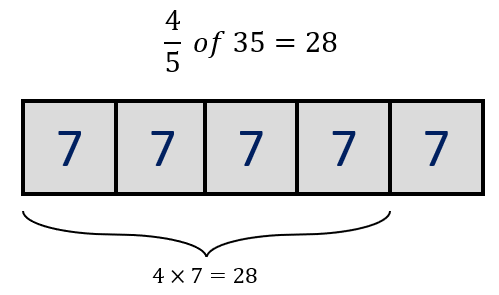
Therefore, 45 of 35 is equal to 28.
Stephanie is planning a party. She purchased a total of 3 dozen balloons. ¼ of these balloons are red, and the rest are blue; how many of each color did she purchase?
Let us start by determining the total number of balloons Stephanie purchased. Since she has three dozen balloons, we must multiply 3 by 12 since there are 12 balloons for every dozen. Hence, Stephanie purchased a total of 36 balloons.
The tape diagram that must be created has 4 equal parts since it is given from the denominator of the fraction ¼. Hence, 36 ÷ 4 = 9. So, let us label each cell in our tape diagram as 9.
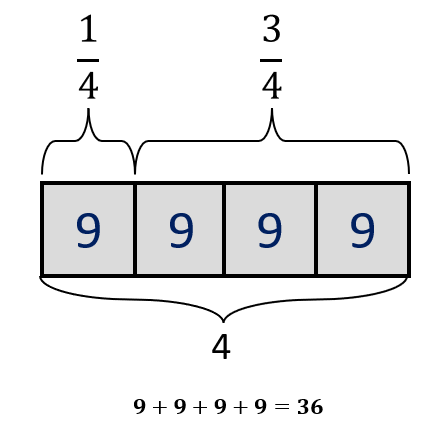
Since ¼ of the balloons are red and ¾ are blue balloons, then we have the following solution:
Red balloons : 9 × 1 = 9
Blue balloons: 9 × 3 = 27
Stephanie bought 36 balloons, 27 of which were blue and 9 red.
Tape Diagrams for Ratio
Another illustration of a ratio is a tape diagram. Every part in the diagram that is the same size has the same value.
The ratio of pencils to pens in Nathalie’s collection is 3: 7. If there are 18 pencils in her collection, how many are pens?
The ratio of pencils to pens in Nathalie’s collection is shown in the diagrams below.
Since it is given that there is a total of 18 pencils, we can have 18 ÷ 3 = 6. The quotient 6 will be used as a factor to get the total number of pens.
Thus, 7 × 6 = 42.
With a ratio of pencils to pens of 3: 7, Nathalie has 18 pencils and 42 pens.
Diana uses a paint mixture of 8 cups yellow and 12 cups pink. Find the ratio of yellow paint to pink paint in the mixture.
The tape diagram below illustrates the paint mixture ratio
The ratio of the number of cups of yellow paint to the pink paint is 8: 12. However, 8 : 12 can still be simplified as 2 : 3 since both numbers have 4 as their common factor.
8 ÷ 4 = 2 12 ÷ 4 = 3
Therefore, the ratio of the number of cups of yellow paint to pink paint, which Diana uses in her mixture, is 2 : 3.
The tape diagram below shows that for every 2 cups of yellow paint, 3 cups of pink paint are used.
A box of black and blue marbles has a ratio of 3 to 8. If you have 15 black marbles, how many marbles in total do you have?
Let us start by finding the total number of blue marbles in the box. If the ratio is 3: 8, and you have 15 black marbles, then we can compute for the factor which makes 3 to 15. Hence, we have,
Thus, we must multiply 5 by 8 to find the total number of blue marbles. So, we have,
Since we have 18 black and 40 blue marbles, the total number of marbles in the box is 55 ( 15 + 40 = 55 ).
Tape Diagrams for Equations
For each of the diagrams below, write an equation and indicate the length of each diagram.
( b )
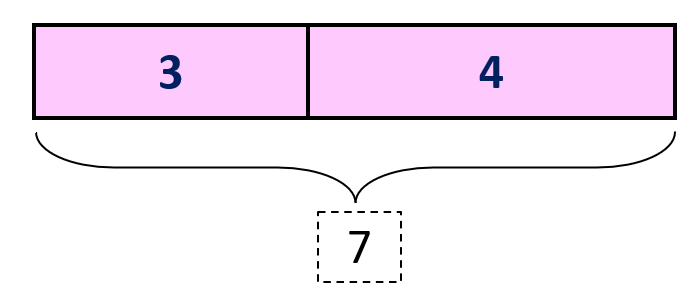
( a ) Equation: 3 + 4 = 7
The total length of the diagram = 7
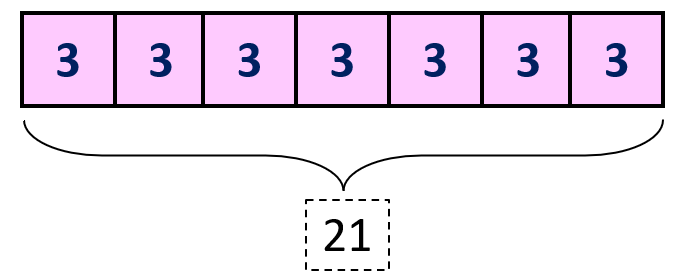
( b ) Equation: 3 × 7 = 21
The total length of the diagram = 21
Samantha is trying to solve for the value of m in 6×m= 42. Use a tape diagram to represent the equation and find the value of m.
To illustrate the problem using a tape diagram, we will use a rectangle with a total length of 42; it must be divided into 5 equal cells or parts.
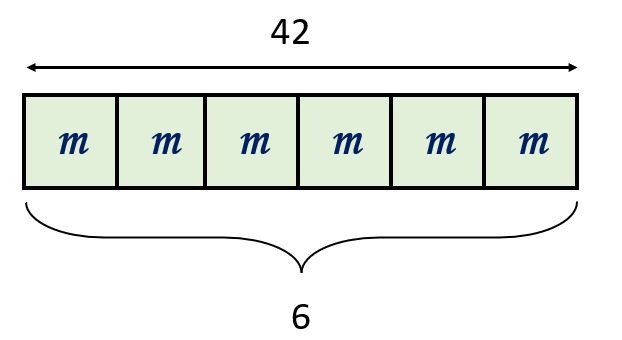
We may find the value of m using the division process; we have 42÷6=7.
Therefore, m = 7.
A technique for quickly solving mathematical problems is the tape diagram. The tape diagram has the benefit of preventing students from memorization of ideas they don’t comprehend. A rule that is remembered won’t help a student unless they know how to apply it or adapt it to other circumstances. The tape diagrams, on the other hand, are simple visual aids that help students comprehend a topic better. By applying them, they will improve as problem solvers.
The following are the four easy steps to follow in using a tape diagram to answer mathematical problems.
Step 1: Read and analyze the problem. Step 2: Gather information essential for the diagram. Step 3: Draw the tape diagram. Step 4: Solve the problem.
Frequently Asked Questions on Tape Diagrams (FAQs)
What is meant by tape diagrams.
A tape diagram is a rectangular illustration that resembles a piece of tape and has sections to help with computations. It is a frequent graphic tool for solving mathematical word problems with ratios as their basis.
A tape diagram is a technique for quickly solving mathematical concepts. The tape diagram has the benefit of preventing students from memorization of ideas they do not comprehend. A rule that is remembered won’t help a student unless they know how to apply it or adapt it to other circumstances. The tape diagrams, on the other hand, are simple visual aids that help students comprehend a topic better. By applying them, they will improve as problem solvers.
What are other terms for tape diagrams?
A strip diagram, a bar or length model, or a fraction strip are additional names for tape diagrams that are frequently used.
Why do we call it a tape diagram?
A tape diagram is a visual representation that looks like a piece of tape and is used to help with ratio calculations, addition, subtraction, and, most frequently, multiplication.
What are the steps in creating tape diagrams?
A tape diagram is simple to make if you follow a few simple steps. It uses a tape piece broken into more manageable rectangular sections to show difficult tasks graphically. Any difficult word problems are simplified with tape diagrams.
Why do teachers use tape diagrams?
At its foundation, a tape diagram is a straightforward solution to a challenging mathematical problem. Teachers frequently use it to improve the way they instruct their students. The diagram helps teachers by enabling them to incorporate a fun component into learning. Students who struggle with math can more easily determine which computations are required to answer word problems using tape diagrams. Additionally, tape diagrams can be utilized to create more effective learning settings where students can discover various solutions to challenging situations. They are straightforward to use for fractions, ratios, multiplication, division, addition, and subtraction.
Why do students need to learn tape diagrams?
These diagrams can be used by students of all grade levels to solve mathematical problems and equations. Students are transitioning to new grades and working with advanced arithmetic benefit greatly from knowing tape diagrams.
What are the benefits of using tape diagrams?
Recommended worksheets.
Tape Diagrams (St. Patrick’s Day Themed) Math Worksheets Mapping Diagram (Spring Equinox Themed) Math Worksheets Pictogram (National Hispanic Heritage Month Themed) Math Worksheets
Link/Reference Us
We spend a lot of time researching and compiling the information on this site. If you find this useful in your research, please use the tool below to properly link to or reference Helping with Math as the source. We appreciate your support!
<a href="https://helpingwithmath.com/tape-diagrams/">Tape Diagrams</a>
"Tape Diagrams". Helping with Math . Accessed on April 23, 2024. https://helpingwithmath.com/tape-diagrams/.
"Tape Diagrams". Helping with Math , https://helpingwithmath.com/tape-diagrams/. Accessed 23 April, 2024.
Additional Graphs and Charts Theory:
Latest worksheets.
The worksheets below are the mostly recently added to the site.
Understanding the properties of rotations, reflections, and translations of 2D figures 8th Grade Math Worksheets

Solving Linear Equations in One Variable Integral Coefficients and Rational Coefficients 8th Grade Math Worksheets

Interpreting linear functions in a form of y=mx+b and its graph 8th Grade Math Worksheets

Performing Operations using Scientific Notation 8th Grade Math Worksheets

Understanding Irrational Numbers 8th Grade Math Worksheets

Understanding Fundamental Counting Principle and Probability of Events 7th Grade Math Worksheets

Solving Area, Volume, and Surface Area of 2D and 3D Objects 7th Grade Math Worksheets

Solving Proportional Relationships Between Two Quantities 7th Grade Math Worksheets

Solving Word Problems Involving Linear Equations and Linear Inequalities 7th Grade Math Worksheets

Understanding Supplementary, Complementary, Vertical and Adjacent Angles 7th Grade Math Worksheets

If you're seeing this message, it means we're having trouble loading external resources on our website.
If you're behind a web filter, please make sure that the domains *.kastatic.org and *.kasandbox.org are unblocked.
To log in and use all the features of Khan Academy, please enable JavaScript in your browser.
Course: 6th grade > Unit 1
Ratios with tape diagrams.
- Ratios with tape diagrams (part:whole)
- Equivalent ratio word problems
- Simplify a ratio from a tape diagram
- Equivalent ratios with equal groups
- Ratios and double number lines
- Create double number lines
- Ratios with double number lines
- Relate double number lines and ratio tables
Want to join the conversation?
- Upvote Button navigates to signup page
- Downvote Button navigates to signup page
- Flag Button navigates to signup page

Video transcript

- school Campus Bookshelves
- menu_book Bookshelves
- perm_media Learning Objects
- login Login
- how_to_reg Request Instructor Account
- hub Instructor Commons
- Download Page (PDF)
- Download Full Book (PDF)
- Periodic Table
- Physics Constants
- Scientific Calculator
- Reference & Cite
- Tools expand_more
- Readability
selected template will load here
This action is not available.
6.1.3: Reasoning about Equations with Tape Diagrams
- Last updated
- Save as PDF
- Page ID 38420

- Illustrative Mathematics
- OpenUp Resources
Let's see how equations can describe tape diagrams.
Exercise \(\PageIndex{1}\): Find Equivalent Expressions
Select all the expressions that are equivalent to \(7(2-3n)\). Explain how you know each expression you select is equivalent.
- \((2-3n)\cdot 7\)
- \(7\cdot 2\cdot (-3n)\)
Exercise \(\PageIndex{2}\): Matching Equations to Tape Diagrams

- Match each equation to one of the tape diagrams. Be prepared to explain how the equation matches the diagram.
- Sort the equations into categories of your choosing. Explain the criteria for each category.
- \(2x+5=19\)
- \(2+5x=19\)
- \(2(x+5)=19\)
- \(5(x+2)=19\)
- \(19=5+2x\)
- \((x+5)\cdot 2=19\)
- \(19=(x+2)\cdot 5\)
- \(19\div 2=x+5\)
- \(19-2=5x\)
Exercise \(\PageIndex{3}\): Drawing Tape Diagrams to Represent Equations
- \(114=3x+18\)
- \(114=3(y+18)\)
- Use any method to find values for \(x\) and \(y\) that make the equations true.
Are you ready for more?
To make a Koch snowflake:
- Start with an equilateral triangle that has side lengths of 1. This is step 1.
- Replace the middle third of each line segment with a small equilateral triangle with the middle third of the segment forming the base. This is step 2.
- Do the same to each of the line segments. This is step 3.
- Keep repeating this process.

- What is the perimeter after step 2? Step 3?
- What happens to the perimeter, or the length of line traced along the outside of the figure, as the process continues?
We have seen how tape diagrams represent relationships between quantities. Because of the meaning and properties of addition and multiplication, more than one equation can often be used to represent a single tape diagram.
Let’s take a look at two tape diagrams.

We can describe this diagram with several different equations. Here are some of them:
- \(26+4x=46\), because the parts add up to the whole.
- \(4x+26=46\), because addition is commutative.
- \(46=4x+26\), because if two quantities are equal, it doesn’t matter how we arrange them around the equal sign.
- \(4x=46-26\), because one part (the part made up of \(4x\)’s) is the difference between the whole and the other part.

For this diagram:
- \(4(x+9)=76\), because multiplication means having multiple groups of the same size.
- \((x+9) \cdot 4=76\), because multiplication is commutative.
- \(76\div 4=x+9\), because division tells us the size of each equal part.
Glossary Entries
Definition: Equivalent Expressions
Equivalent expressions are always equal to each other. If the expressions have variables, they are equal whenever the same value is used for the variable in each expression.
For example, \(3x+4x\) is equivalent to \(5x+2x\). No matter what value we use for \(x\), these expressions are always equal. When \(x\) is 3, both expressions equal 21. When \(x\) is 10, both expressions equal 70.
Exercise \(\PageIndex{4}\)
Solve each equation mentally.
- \(\frac{1}{3}x=6\)
- \(-\frac{1}{2}x=-7\)
(From Unit 5.5.1)
Exercise \(\PageIndex{5}\)
Complete the magic squares so that the sum of each row, each column, and each diagonal in a grid are all equal.

(From Unit 5.2.2)
Exercise \(\PageIndex{6}\)
Draw a tape diagram to match each equation.
- \(5(x+1)=20\)
- \(5x+1=20\)
Exercise \(\PageIndex{7}\)
Select all the equations that match the tape diagram.

- \(35=8+x+x+x+x+x+x\)
- \(35=8+6x\)
- \(6+8x=35\)
- \(6x+8=35\)
- \(6x+8x=35x\)
- \(35-8=6x\)
Exercise \(\PageIndex{8}\)
Each car is traveling at a constant speed. Find the number of miles each car travels in 1 hour at the given rate.
- \(135\) miles in \(3\) hours
- \(22\) miles in \(\frac{1}{2}\) hour
- \(7.5\) miles in \(\frac{1}{4}\) hour
- \(\frac{100}{3}\) miles in \(\frac{2}{3}\) hour
- \(97\frac{1}{2}\) miles in \(\frac{3}{2}\) hour
(From Unit 4.1.2)
Standards Alignment
Assessments, professional learning, family engagement, case studies.
NEW EUREKA MATH 2 ® PILOT PACKAGE
Are you looking for new ways to advance equity and build knowledge in your math classroom with high-quality instructional materials? EdReports recently reviewed Eureka Math 2 . Scan the QR code or access the final report .
Check out our special pilot package for only $10 per student.
Shop Online

SEE THE SCIENCE OF READING IN ACTION
At Great Minds ® , we’re committed to ensuring our curricula are aligned to the latest research on how students best learn to read, write, and build knowledge.
Explore webinars, blogs, research briefs, and more to discover how we incorporate this important body of research.

FREE CLASSROOM PRINTABLES
At Great Minds®, we’re committed to supporting educators with high-quality curricula and resources.
Explore resources designed to aid students in science and engineering and spark classroom conversation.
Webinar Library
Instructional resources, trending topics, knowledge-building, the science of reading, lesson design, universal design for learning (udl), background knowledge.
Palm Springs, CA
Houston, TX
New Orleans, LA
SOLVING WORD PROBLEMS with tape diagrams
This free webinar led by the teacher-writers of Eureka Math /EngageNY Math explains how the tape diagram model supports solving word problems.
During this webinar, you will:
- Learn how the tape diagram model supports understanding of both the text and the operations of word problems.
- Explore part-whole relationships.
- Practice modeling single- and multi-step word problems
- Learn methods for scaffolding as students encounter increasingly complex problems.
NOTE: The webinar content is focused on grades 3-6, but educators and administrators from all grade-bands are encouraged to watch.

every child is capable of greatness
- Job Openings
- Digital Support
- Print Support
- Media Inquiries
Let’s Connect
- Terms of Service
- Privacy Policy
- System Status
- CA Residents: Do Not Sell My Info
Christophe Garon
A spider bite is worth the chance of becoming spider-man....
- Geopolitics
- Computer Science
- Health Science
- Exercise Science
- Behavioral Science
- Engineering
- Mathematics
New Strength Gains From Bar Speed & Acceleration

I’ll warn you right off the bat, this article gets pretty conceptual, but sometimes it helps to look at things from a new perspective. When we test our strength gains by maxing out in the gym what we are essentially… Continue Reading →
Quantifying Risk Aversion to Optimize Your Decisions

One commonly known tendency of humans is that we are often more afraid of loss than we are motivated by the possibility of gain. While this feature of humans often works in our favor, there are many times when it… Continue Reading →
Predicting Sunsets with Machine Learning

This is the machine learning python program that I created to model sunsets and tweet a daily sunset prediction based on the current weather metrics. The following three functions are to collect location and contact info for first time users…. Continue Reading →
Scraping Google Trends With Python

If you’ve ever done SEO research or tried to coming up with content ideas, you how useful Google Trends can be when it comes to determining what people are interested in your niche. I was making SEO trend reports at… Continue Reading →
Different Is Not Always Unique

I remember back in University my Psych professor was explaining the categories of human needs, among which is the need for affiliation. He went on to mention that the counterpart of affiliation has become more prevalent over the past few… Continue Reading →
Altruism Is an Illusion and That’s Okay

What is Altruism? A quick google search for altruism and you would find it defined as, “the unselfish regard for or devotion to the welfare of others.” In other words, altruism is the idea that someone can do something for another… Continue Reading →
Scraping Linkedin Posts With Selenium & Beautiful Soup

This is a program that I build to scrape post data from LinkedIn pages. It currently extracts the date, media type, text, like count, comment count, share count, and any media links. Let’s get into this.. Required Python Packages and… Continue Reading →
How to Scrape Tweets Containing Keywords with Python

This is the code I wrote to scrape tweets from Twitter with python through the Twitter Search (Rest) API. I designed it to search twitter for various keywords tweeted by users and return the result in table. Introducing this program… Continue Reading →
Can Your Metabolism Actually Be Damaged from Dieting?

The term “Damaged Metabolism” is thrown around quite often in the diet and fitness internet sphere. The idea behind it is that by dieting or restricting for a period of time, your metabolism slows down and no longer function the… Continue Reading →
Don’t Throw Tai Lopez Out With the Bathwater

“Here in my Garage, just bought this new Lamborghini here…” You may recognize this line from the infamous Tai Lopez advertisement where he shows off his cars and books before instructing you to visit his website. Although the ad has… Continue Reading →
Become Your Ideal Self Through Comfort Challenges

When we watch movies, there is usually one character that catches our attention. You may admire or even imagine yourself as him or her. Let me ask you: What are the common traits of these characters? Chances are these characters… Continue Reading →
Increase Your Deadlift 100 Pounds (Step-By-Step Guide)

My main strength goal in 2018 was to increase my deadlift by 100 pounds and finally obtain a 600-pound deadlift. I started my journey with a deadlifting PR of 500 pounds in January and hit many minor personal records along… Continue Reading →
Is Price Gouging Really That Bad?

Anytime there is a storm or some other disaster I often hear the mention of price gouging. Whether discussed on the local news or Facebook comments, price gouging is almost always portrayed in a negative light. What is Price Gouging? Price gouging… Continue Reading →
Exploring Beauty Theory: A Philosophical Perspective on Aesthetics

Beauty, a concept that transcends time and culture, has intrigued philosophers and thinkers for centuries. Beauty theory delves into the intricate nature of what we find visually pleasing and the underlying principles that guide our perceptions. This article aims to… Continue Reading →
Beauty Theory: Exploring the Philosophy of Aesthetics

Beauty theory, also known as the philosophy of aesthetics, is a branch of philosophy that examines the nature of beauty and taste. It explores questions such as what makes something beautiful, how beauty is perceived, and how it impacts individuals… Continue Reading →
Understanding Trait Theory: Insights into Personality and Behavior

Trait theory is a fundamental approach to understanding personality and behavior. By examining the importance of personality traits and their influence on behavioral patterns, we can gain valuable insights into what makes individuals unique. In this article, we will explore… Continue Reading →
Integrated Attachment Theory: Thais Gibson’s Groundbreaking Work in Psychology
Integrated Attachment Theory, developed by psychologist Thais Gibson, is a groundbreaking approach that combines attachment theory with other psychological frameworks to provide a comprehensive understanding of human behavior and relationships. This theory has significant implications for improving mental health, enhancing… Continue Reading →
Is String Theory Dead? Examining Its Relevance and Future
String theory, a theoretical framework that attempts to unify quantum mechanics and general relativity, has been a topic of intense research and debate in the physics community for decades. Despite its mathematical elegance and potential to solve long-standing problems in… Continue Reading →
What Is The Fastest Way To Heal A Broken Shoulder

A broken shoulder, also known as a fractured humerus or shoulder fracture, can be a painful and debilitating injury. If you’ve suffered a broken shoulder, you’re likely eager to find the fastest way to heal and achieve a speedy recovery… Continue Reading →
What Is The Fastest Dinosaur? Exploring Dinosaur Running Speeds

Dinosaurs have captured our imaginations for centuries, and one question that often arises is: What is the fastest dinosaur? While we may never know the exact speeds at which these prehistoric creatures ran, scientists have used various methods to estimate… Continue Reading →
What Is The Fastest Plane In GTA 5? Discover The Speedy Aircraft

When it comes to GTA 5 aircraft, speed is the name of the game for many players. Soaring through the skies of Los Santos in the fastest plane in GTA 5 is an exhilarating experience. But which plane takes the… Continue Reading →
Which Distribution Channel Drives Results Fastest

In today’s fast-paced business environment, companies are constantly seeking ways to drive results fast and efficiently. One critical aspect of achieving this goal is selecting the right distribution channel that can deliver quick result delivery. With the advent of new… Continue Reading →
Why Would a Sealed Warrant Be Issued in a Legal Process?
In the legal process, a sealed warrant is a type of warrant that is kept confidential from the public and even the person it is issued against. There are several reasons why a warrant may be sealed, primarily related to… Continue Reading →
STAY IN THE LOOP
© 2024 Christophe Garon — Powered by WordPress
Theme by Anders Noren — Up ↑
IMAGES
VIDEO
COMMENTS
Tape Diagrams in Math: A Problem Solving Strategy. What is your go-to strategy for teaching word problems? I have always encouraged my students to model, model, model when solving word problems. Modeling is a way for students to make sense of a problem and catch mistakes before they happen. Sometimes, what seems like a good answer just doesn't ...
Step 4: Solution. Your tape diagram is like a map guiding you to the treasure of the solution. It's time to put your diagram to work. Solve the problem using the insights your diagram provides. Label the sections, incorporate your gathered information, and let the magic happen.
Tape Diagrams in a Comparison Problem. Without problem solving strategies, a student may write an equation like this, p + d + c = 10.50. They have an equation with 3 different variables and then are stuck. They don't know how to solve for d, the price of the drink. Let's try a tape diagram.
A technique for quickly solving mathematical problems is the tape diagram. The tape diagram has the benefit of preventing students from memorization of ideas they don't comprehend. A rule that is remembered won't help a student unless they know how to apply it or adapt it to other circumstances.
One example of a tape diagram in math is when solving a problem involving fractions. For instance, consider the problem: "Sarah ate 3/4 of a pizza, and Tom ate 1/6 of the same pizza. How much pizza is left?" To solve this problem using a tape diagram, you would draw a bar representing the whole pizza, divided into four equal parts.
A tape diagram is a simple, yet powerful tool used in math to help students understand, interpret, and solve word problems. Tape diagrams can also be called strip diagrams, bar models, fraction strips, or length models. This tool uses varying lengths of rectangles, or 'tapes', to depict mathematical relationships and reveal parts of an ...
Summary. Tape diagrams can help us understand relationships between quantities and how operations describe those relationships. Figure 31.1.3 31.1. 3. Diagram A has 3 parts that add to 21. Each part is labeled with the same letter, so we know the three parts are equal. Here are some equations that all represent diagram A: x + x + x 3 ⋅ x x x ...
Tape diagrams, also known as bar models, are visual tools used in Eureka Math to help students understand and solve mathematical problems. They are particularly useful for representing and solving word problems involving addition, subtraction, multiplication, and division. Tape diagrams provide a visual representation of the relationship ...
Through the RDW process, the student would read and reread the problem, draw a tape diagram to help make sense of the information in the problem, solve the problem mathematically, write an answer statement, and then revisit the original problem to determine if his/her answer makes sense. Consider the following dialogue as a possible interaction ...
Tape diagrams are visual models that use rectangles to represent the parts of a ratio. Since they are a visual model, drawing them requires attention to detail in the setup. In this problem David and Jason have numbers of marbles in a ratio of 2:3. This ratio is modeled here by drawing 2 rectangles to represent David's portion, and 3 ...
Tape diagrams can help students break down word problems by allowing them to write an equation or number sentence to represent the situation. Let's take a look at some examples of just how meaningful a tape diagram can be in your classroom. Imagine your 5th-grade students solving this problem without a model: There are 32 students in a class.
Need a strategy to help your students understand and solve word problems? Check out our Tape Diagram playlist! In this lesson, we introduce the four differen...
We have seen how tape diagrams represent relationships between quantities. Because of the meaning and properties of addition and multiplication, more than one equation can often be used to represent a single tape diagram. Let's take a look at two tape diagrams. Figure \(\PageIndex{3}\) We can describe this diagram with several different ...
A tape diagram is a model that pictorially represents a word problem. Once the word problem is accurately modeled, the student has an easier time seeing which operations to use in solving the problem. The tape diagram does not do the calculations for the student, but it does make it easier for the student to see which calculations might be needed.
Tape diagrams also allow students to model and solve ratio problems using a step-by-step approach, making the problem-solving process more systematic and organized. Example: Suppose we are given a ratio problem where the ratio of boys to girls in a classroom is 3:5.
In summary, tape diagrams are a useful tool for solving equations as they provide a visual representation of the problem's context and the relationship between known and unknown quantities. By using tape diagrams, students can better understand and solve mathematical problems in a more concrete and visual way.
By using tape diagrams, students can better understand the relationship between different parts of a problem and visualize the problem-solving process. Tape diagrams are commonly used in elementary and middle school math classrooms as a tool to help students visualize and solve various types of problems, including addition, subtraction ...
Benefits of Using Tape Diagrams for Ratio Problem Solving. Tape diagrams are a powerful tool for solving ratio problems because they provide a visual representation of the relationships between quantities. They help students to understand the concept of ratio by breaking it down into more manageable parts and making it easier to see the ...
Problem Solving Skills: Using tape diagrams in 2nd grade math helps students develop strong problem-solving skills. The diagrams allow students to break down complex problems into simpler parts, making it easier for them to solve. They can use the diagrams to visually represent the known and unknown quantities, making it easier to identify the ...
Alternatively, a tape diagram allows students to visualize the problem and develop their strategy. Using a tape diagram, students can draw a picture showing 3/8 of 32. They start by drawing a ...
SOLVING WORD PROBLEMS with tape diagrams. This free webinar led by the teacher-writers of Eureka Math /EngageNY Math explains how the tape diagram model supports solving word problems. During this webinar, you will: Learn how the tape diagram model supports understanding of both the text and the operations of word problems. Explore part-whole ...
Tape diagrams are a visual representation tool commonly used in elementary math to aid problem-solving. It allows students to break down problems and understand the relationship between quantities. While there is a controversial truth surrounding tape diagrams, it can be a useful tool when used appropriately and in conjunction with other ...
Tape diagram ratios are an essential tool in mastering mathematical concepts and problem-solving skills. By understanding and using tape diagrams, you can take your math abilities to the next level. Tape diagrams provide a visual representation of ratios, making complex problems more accessible and easier to solve.
10 Problem-Solving Cause and Effect Diagram Analysis. Cause and Effect Diagram Analysis involves systematically examining the potential causes of a problem or effect depicted in a Cause and Effect Diagram (also known as a Fishbone Diagram or Ishikawa Diagram). Here's a step-by-step guide to conducting Cause and Effect Diagram Analysis: