Research Methods
Chapter 2 introduction.
Maybe you have already gained some experience in doing research, for example in your bachelor studies, or as part of your work.
The challenge in conducting academic research at masters level, is that it is multi-faceted.
The types of activities are:
- Finding and reviewing literature on your research topic;
- Designing a research project that will answer your research questions;
- Collecting relevant data from one or more sources;
- Analyzing the data, statistically or otherwise, and
- Writing up and presenting your findings.
Some researchers are strong on some parts but weak on others.
We do not require perfection. But we do require high quality.
Going through all stages of the research project, with the guidance of your supervisor, is a learning process.
The journey is hard at times, but in the end your thesis is considered an academic publication, and we want you to be proud of what you have achieved!
Probably the biggest challenge is, where to begin?
- What will be your topic?
- And once you have selected a topic, what are the questions that you want to answer, and how?
In the first chapter of the book, you will find several views on the nature and scope of business research.
Since a study in business administration derives its relevance from its application to real-life situations, an MBA typically falls in the grey area between applied research and basic research.
The focus of applied research is on finding solutions to problems, and on improving (y)our understanding of existing theories of management.
Applied research that makes use of existing theories, often leads to amendments or refinements of these theories. That is, the applied research feeds back to basic research.
In the early stages of your research, you will feel like you are running around in circles.
You start with an idea for a research topic. Then, after reading literature on the topic, you will revise or refine your idea. And start reading again with a clearer focus ...
A thesis research/project typically consists of two main stages.
The first stage is the research proposal .
Once the research proposal has been approved, you can start with the data collection, analysis and write-up (including conclusions and recommendations).
Stage 1, the research proposal consists of he first three chapters of the commonly used five-chapter structure :
- Chapter 1: Introduction
- An introduction to the topic.
- The research questions that you want to answer (and/or hypotheses that you want to test).
- A note on why the research is of academic and/or professional relevance.
- Chapter 2: Literature
- A review of relevant literature on the topic.
- Chapter 3: Methodology
The methodology is at the core of your research. Here, you define how you are going to do the research. What data will be collected, and how?
Your data should allow you to answer your research questions. In the research proposal, you will also provide answers to the questions when and how much . Is it feasible to conduct the research within the given time-frame (say, 3-6 months for a typical master thesis)? And do you have the resources to collect and analyze the data?
In stage 2 you collect and analyze the data, and write the conclusions.
- Chapter 4: Data Analysis and Findings
- Chapter 5: Summary, Conclusions and Recommendations
This video gives a nice overview of the elements of writing a thesis.

An official website of the United States government
The .gov means it’s official. Federal government websites often end in .gov or .mil. Before sharing sensitive information, make sure you’re on a federal government site.
The site is secure. The https:// ensures that you are connecting to the official website and that any information you provide is encrypted and transmitted securely.
- Publications
- Account settings
Preview improvements coming to the PMC website in October 2024. Learn More or Try it out now .
- Advanced Search
- Journal List
- J Korean Med Sci
- v.37(16); 2022 Apr 25

A Practical Guide to Writing Quantitative and Qualitative Research Questions and Hypotheses in Scholarly Articles
Edward barroga.
1 Department of General Education, Graduate School of Nursing Science, St. Luke’s International University, Tokyo, Japan.
Glafera Janet Matanguihan
2 Department of Biological Sciences, Messiah University, Mechanicsburg, PA, USA.
The development of research questions and the subsequent hypotheses are prerequisites to defining the main research purpose and specific objectives of a study. Consequently, these objectives determine the study design and research outcome. The development of research questions is a process based on knowledge of current trends, cutting-edge studies, and technological advances in the research field. Excellent research questions are focused and require a comprehensive literature search and in-depth understanding of the problem being investigated. Initially, research questions may be written as descriptive questions which could be developed into inferential questions. These questions must be specific and concise to provide a clear foundation for developing hypotheses. Hypotheses are more formal predictions about the research outcomes. These specify the possible results that may or may not be expected regarding the relationship between groups. Thus, research questions and hypotheses clarify the main purpose and specific objectives of the study, which in turn dictate the design of the study, its direction, and outcome. Studies developed from good research questions and hypotheses will have trustworthy outcomes with wide-ranging social and health implications.
INTRODUCTION
Scientific research is usually initiated by posing evidenced-based research questions which are then explicitly restated as hypotheses. 1 , 2 The hypotheses provide directions to guide the study, solutions, explanations, and expected results. 3 , 4 Both research questions and hypotheses are essentially formulated based on conventional theories and real-world processes, which allow the inception of novel studies and the ethical testing of ideas. 5 , 6
It is crucial to have knowledge of both quantitative and qualitative research 2 as both types of research involve writing research questions and hypotheses. 7 However, these crucial elements of research are sometimes overlooked; if not overlooked, then framed without the forethought and meticulous attention it needs. Planning and careful consideration are needed when developing quantitative or qualitative research, particularly when conceptualizing research questions and hypotheses. 4
There is a continuing need to support researchers in the creation of innovative research questions and hypotheses, as well as for journal articles that carefully review these elements. 1 When research questions and hypotheses are not carefully thought of, unethical studies and poor outcomes usually ensue. Carefully formulated research questions and hypotheses define well-founded objectives, which in turn determine the appropriate design, course, and outcome of the study. This article then aims to discuss in detail the various aspects of crafting research questions and hypotheses, with the goal of guiding researchers as they develop their own. Examples from the authors and peer-reviewed scientific articles in the healthcare field are provided to illustrate key points.
DEFINITIONS AND RELATIONSHIP OF RESEARCH QUESTIONS AND HYPOTHESES
A research question is what a study aims to answer after data analysis and interpretation. The answer is written in length in the discussion section of the paper. Thus, the research question gives a preview of the different parts and variables of the study meant to address the problem posed in the research question. 1 An excellent research question clarifies the research writing while facilitating understanding of the research topic, objective, scope, and limitations of the study. 5
On the other hand, a research hypothesis is an educated statement of an expected outcome. This statement is based on background research and current knowledge. 8 , 9 The research hypothesis makes a specific prediction about a new phenomenon 10 or a formal statement on the expected relationship between an independent variable and a dependent variable. 3 , 11 It provides a tentative answer to the research question to be tested or explored. 4
Hypotheses employ reasoning to predict a theory-based outcome. 10 These can also be developed from theories by focusing on components of theories that have not yet been observed. 10 The validity of hypotheses is often based on the testability of the prediction made in a reproducible experiment. 8
Conversely, hypotheses can also be rephrased as research questions. Several hypotheses based on existing theories and knowledge may be needed to answer a research question. Developing ethical research questions and hypotheses creates a research design that has logical relationships among variables. These relationships serve as a solid foundation for the conduct of the study. 4 , 11 Haphazardly constructed research questions can result in poorly formulated hypotheses and improper study designs, leading to unreliable results. Thus, the formulations of relevant research questions and verifiable hypotheses are crucial when beginning research. 12
CHARACTERISTICS OF GOOD RESEARCH QUESTIONS AND HYPOTHESES
Excellent research questions are specific and focused. These integrate collective data and observations to confirm or refute the subsequent hypotheses. Well-constructed hypotheses are based on previous reports and verify the research context. These are realistic, in-depth, sufficiently complex, and reproducible. More importantly, these hypotheses can be addressed and tested. 13
There are several characteristics of well-developed hypotheses. Good hypotheses are 1) empirically testable 7 , 10 , 11 , 13 ; 2) backed by preliminary evidence 9 ; 3) testable by ethical research 7 , 9 ; 4) based on original ideas 9 ; 5) have evidenced-based logical reasoning 10 ; and 6) can be predicted. 11 Good hypotheses can infer ethical and positive implications, indicating the presence of a relationship or effect relevant to the research theme. 7 , 11 These are initially developed from a general theory and branch into specific hypotheses by deductive reasoning. In the absence of a theory to base the hypotheses, inductive reasoning based on specific observations or findings form more general hypotheses. 10
TYPES OF RESEARCH QUESTIONS AND HYPOTHESES
Research questions and hypotheses are developed according to the type of research, which can be broadly classified into quantitative and qualitative research. We provide a summary of the types of research questions and hypotheses under quantitative and qualitative research categories in Table 1 .
Research questions in quantitative research
In quantitative research, research questions inquire about the relationships among variables being investigated and are usually framed at the start of the study. These are precise and typically linked to the subject population, dependent and independent variables, and research design. 1 Research questions may also attempt to describe the behavior of a population in relation to one or more variables, or describe the characteristics of variables to be measured ( descriptive research questions ). 1 , 5 , 14 These questions may also aim to discover differences between groups within the context of an outcome variable ( comparative research questions ), 1 , 5 , 14 or elucidate trends and interactions among variables ( relationship research questions ). 1 , 5 We provide examples of descriptive, comparative, and relationship research questions in quantitative research in Table 2 .
Hypotheses in quantitative research
In quantitative research, hypotheses predict the expected relationships among variables. 15 Relationships among variables that can be predicted include 1) between a single dependent variable and a single independent variable ( simple hypothesis ) or 2) between two or more independent and dependent variables ( complex hypothesis ). 4 , 11 Hypotheses may also specify the expected direction to be followed and imply an intellectual commitment to a particular outcome ( directional hypothesis ) 4 . On the other hand, hypotheses may not predict the exact direction and are used in the absence of a theory, or when findings contradict previous studies ( non-directional hypothesis ). 4 In addition, hypotheses can 1) define interdependency between variables ( associative hypothesis ), 4 2) propose an effect on the dependent variable from manipulation of the independent variable ( causal hypothesis ), 4 3) state a negative relationship between two variables ( null hypothesis ), 4 , 11 , 15 4) replace the working hypothesis if rejected ( alternative hypothesis ), 15 explain the relationship of phenomena to possibly generate a theory ( working hypothesis ), 11 5) involve quantifiable variables that can be tested statistically ( statistical hypothesis ), 11 6) or express a relationship whose interlinks can be verified logically ( logical hypothesis ). 11 We provide examples of simple, complex, directional, non-directional, associative, causal, null, alternative, working, statistical, and logical hypotheses in quantitative research, as well as the definition of quantitative hypothesis-testing research in Table 3 .
Research questions in qualitative research
Unlike research questions in quantitative research, research questions in qualitative research are usually continuously reviewed and reformulated. The central question and associated subquestions are stated more than the hypotheses. 15 The central question broadly explores a complex set of factors surrounding the central phenomenon, aiming to present the varied perspectives of participants. 15
There are varied goals for which qualitative research questions are developed. These questions can function in several ways, such as to 1) identify and describe existing conditions ( contextual research question s); 2) describe a phenomenon ( descriptive research questions ); 3) assess the effectiveness of existing methods, protocols, theories, or procedures ( evaluation research questions ); 4) examine a phenomenon or analyze the reasons or relationships between subjects or phenomena ( explanatory research questions ); or 5) focus on unknown aspects of a particular topic ( exploratory research questions ). 5 In addition, some qualitative research questions provide new ideas for the development of theories and actions ( generative research questions ) or advance specific ideologies of a position ( ideological research questions ). 1 Other qualitative research questions may build on a body of existing literature and become working guidelines ( ethnographic research questions ). Research questions may also be broadly stated without specific reference to the existing literature or a typology of questions ( phenomenological research questions ), may be directed towards generating a theory of some process ( grounded theory questions ), or may address a description of the case and the emerging themes ( qualitative case study questions ). 15 We provide examples of contextual, descriptive, evaluation, explanatory, exploratory, generative, ideological, ethnographic, phenomenological, grounded theory, and qualitative case study research questions in qualitative research in Table 4 , and the definition of qualitative hypothesis-generating research in Table 5 .
Qualitative studies usually pose at least one central research question and several subquestions starting with How or What . These research questions use exploratory verbs such as explore or describe . These also focus on one central phenomenon of interest, and may mention the participants and research site. 15
Hypotheses in qualitative research
Hypotheses in qualitative research are stated in the form of a clear statement concerning the problem to be investigated. Unlike in quantitative research where hypotheses are usually developed to be tested, qualitative research can lead to both hypothesis-testing and hypothesis-generating outcomes. 2 When studies require both quantitative and qualitative research questions, this suggests an integrative process between both research methods wherein a single mixed-methods research question can be developed. 1
FRAMEWORKS FOR DEVELOPING RESEARCH QUESTIONS AND HYPOTHESES
Research questions followed by hypotheses should be developed before the start of the study. 1 , 12 , 14 It is crucial to develop feasible research questions on a topic that is interesting to both the researcher and the scientific community. This can be achieved by a meticulous review of previous and current studies to establish a novel topic. Specific areas are subsequently focused on to generate ethical research questions. The relevance of the research questions is evaluated in terms of clarity of the resulting data, specificity of the methodology, objectivity of the outcome, depth of the research, and impact of the study. 1 , 5 These aspects constitute the FINER criteria (i.e., Feasible, Interesting, Novel, Ethical, and Relevant). 1 Clarity and effectiveness are achieved if research questions meet the FINER criteria. In addition to the FINER criteria, Ratan et al. described focus, complexity, novelty, feasibility, and measurability for evaluating the effectiveness of research questions. 14
The PICOT and PEO frameworks are also used when developing research questions. 1 The following elements are addressed in these frameworks, PICOT: P-population/patients/problem, I-intervention or indicator being studied, C-comparison group, O-outcome of interest, and T-timeframe of the study; PEO: P-population being studied, E-exposure to preexisting conditions, and O-outcome of interest. 1 Research questions are also considered good if these meet the “FINERMAPS” framework: Feasible, Interesting, Novel, Ethical, Relevant, Manageable, Appropriate, Potential value/publishable, and Systematic. 14
As we indicated earlier, research questions and hypotheses that are not carefully formulated result in unethical studies or poor outcomes. To illustrate this, we provide some examples of ambiguous research question and hypotheses that result in unclear and weak research objectives in quantitative research ( Table 6 ) 16 and qualitative research ( Table 7 ) 17 , and how to transform these ambiguous research question(s) and hypothesis(es) into clear and good statements.
a These statements were composed for comparison and illustrative purposes only.
b These statements are direct quotes from Higashihara and Horiuchi. 16
a This statement is a direct quote from Shimoda et al. 17
The other statements were composed for comparison and illustrative purposes only.
CONSTRUCTING RESEARCH QUESTIONS AND HYPOTHESES
To construct effective research questions and hypotheses, it is very important to 1) clarify the background and 2) identify the research problem at the outset of the research, within a specific timeframe. 9 Then, 3) review or conduct preliminary research to collect all available knowledge about the possible research questions by studying theories and previous studies. 18 Afterwards, 4) construct research questions to investigate the research problem. Identify variables to be accessed from the research questions 4 and make operational definitions of constructs from the research problem and questions. Thereafter, 5) construct specific deductive or inductive predictions in the form of hypotheses. 4 Finally, 6) state the study aims . This general flow for constructing effective research questions and hypotheses prior to conducting research is shown in Fig. 1 .

Research questions are used more frequently in qualitative research than objectives or hypotheses. 3 These questions seek to discover, understand, explore or describe experiences by asking “What” or “How.” The questions are open-ended to elicit a description rather than to relate variables or compare groups. The questions are continually reviewed, reformulated, and changed during the qualitative study. 3 Research questions are also used more frequently in survey projects than hypotheses in experiments in quantitative research to compare variables and their relationships.
Hypotheses are constructed based on the variables identified and as an if-then statement, following the template, ‘If a specific action is taken, then a certain outcome is expected.’ At this stage, some ideas regarding expectations from the research to be conducted must be drawn. 18 Then, the variables to be manipulated (independent) and influenced (dependent) are defined. 4 Thereafter, the hypothesis is stated and refined, and reproducible data tailored to the hypothesis are identified, collected, and analyzed. 4 The hypotheses must be testable and specific, 18 and should describe the variables and their relationships, the specific group being studied, and the predicted research outcome. 18 Hypotheses construction involves a testable proposition to be deduced from theory, and independent and dependent variables to be separated and measured separately. 3 Therefore, good hypotheses must be based on good research questions constructed at the start of a study or trial. 12
In summary, research questions are constructed after establishing the background of the study. Hypotheses are then developed based on the research questions. Thus, it is crucial to have excellent research questions to generate superior hypotheses. In turn, these would determine the research objectives and the design of the study, and ultimately, the outcome of the research. 12 Algorithms for building research questions and hypotheses are shown in Fig. 2 for quantitative research and in Fig. 3 for qualitative research.

EXAMPLES OF RESEARCH QUESTIONS FROM PUBLISHED ARTICLES
- EXAMPLE 1. Descriptive research question (quantitative research)
- - Presents research variables to be assessed (distinct phenotypes and subphenotypes)
- “BACKGROUND: Since COVID-19 was identified, its clinical and biological heterogeneity has been recognized. Identifying COVID-19 phenotypes might help guide basic, clinical, and translational research efforts.
- RESEARCH QUESTION: Does the clinical spectrum of patients with COVID-19 contain distinct phenotypes and subphenotypes? ” 19
- EXAMPLE 2. Relationship research question (quantitative research)
- - Shows interactions between dependent variable (static postural control) and independent variable (peripheral visual field loss)
- “Background: Integration of visual, vestibular, and proprioceptive sensations contributes to postural control. People with peripheral visual field loss have serious postural instability. However, the directional specificity of postural stability and sensory reweighting caused by gradual peripheral visual field loss remain unclear.
- Research question: What are the effects of peripheral visual field loss on static postural control ?” 20
- EXAMPLE 3. Comparative research question (quantitative research)
- - Clarifies the difference among groups with an outcome variable (patients enrolled in COMPERA with moderate PH or severe PH in COPD) and another group without the outcome variable (patients with idiopathic pulmonary arterial hypertension (IPAH))
- “BACKGROUND: Pulmonary hypertension (PH) in COPD is a poorly investigated clinical condition.
- RESEARCH QUESTION: Which factors determine the outcome of PH in COPD?
- STUDY DESIGN AND METHODS: We analyzed the characteristics and outcome of patients enrolled in the Comparative, Prospective Registry of Newly Initiated Therapies for Pulmonary Hypertension (COMPERA) with moderate or severe PH in COPD as defined during the 6th PH World Symposium who received medical therapy for PH and compared them with patients with idiopathic pulmonary arterial hypertension (IPAH) .” 21
- EXAMPLE 4. Exploratory research question (qualitative research)
- - Explores areas that have not been fully investigated (perspectives of families and children who receive care in clinic-based child obesity treatment) to have a deeper understanding of the research problem
- “Problem: Interventions for children with obesity lead to only modest improvements in BMI and long-term outcomes, and data are limited on the perspectives of families of children with obesity in clinic-based treatment. This scoping review seeks to answer the question: What is known about the perspectives of families and children who receive care in clinic-based child obesity treatment? This review aims to explore the scope of perspectives reported by families of children with obesity who have received individualized outpatient clinic-based obesity treatment.” 22
- EXAMPLE 5. Relationship research question (quantitative research)
- - Defines interactions between dependent variable (use of ankle strategies) and independent variable (changes in muscle tone)
- “Background: To maintain an upright standing posture against external disturbances, the human body mainly employs two types of postural control strategies: “ankle strategy” and “hip strategy.” While it has been reported that the magnitude of the disturbance alters the use of postural control strategies, it has not been elucidated how the level of muscle tone, one of the crucial parameters of bodily function, determines the use of each strategy. We have previously confirmed using forward dynamics simulations of human musculoskeletal models that an increased muscle tone promotes the use of ankle strategies. The objective of the present study was to experimentally evaluate a hypothesis: an increased muscle tone promotes the use of ankle strategies. Research question: Do changes in the muscle tone affect the use of ankle strategies ?” 23
EXAMPLES OF HYPOTHESES IN PUBLISHED ARTICLES
- EXAMPLE 1. Working hypothesis (quantitative research)
- - A hypothesis that is initially accepted for further research to produce a feasible theory
- “As fever may have benefit in shortening the duration of viral illness, it is plausible to hypothesize that the antipyretic efficacy of ibuprofen may be hindering the benefits of a fever response when taken during the early stages of COVID-19 illness .” 24
- “In conclusion, it is plausible to hypothesize that the antipyretic efficacy of ibuprofen may be hindering the benefits of a fever response . The difference in perceived safety of these agents in COVID-19 illness could be related to the more potent efficacy to reduce fever with ibuprofen compared to acetaminophen. Compelling data on the benefit of fever warrant further research and review to determine when to treat or withhold ibuprofen for early stage fever for COVID-19 and other related viral illnesses .” 24
- EXAMPLE 2. Exploratory hypothesis (qualitative research)
- - Explores particular areas deeper to clarify subjective experience and develop a formal hypothesis potentially testable in a future quantitative approach
- “We hypothesized that when thinking about a past experience of help-seeking, a self distancing prompt would cause increased help-seeking intentions and more favorable help-seeking outcome expectations .” 25
- “Conclusion
- Although a priori hypotheses were not supported, further research is warranted as results indicate the potential for using self-distancing approaches to increasing help-seeking among some people with depressive symptomatology.” 25
- EXAMPLE 3. Hypothesis-generating research to establish a framework for hypothesis testing (qualitative research)
- “We hypothesize that compassionate care is beneficial for patients (better outcomes), healthcare systems and payers (lower costs), and healthcare providers (lower burnout). ” 26
- Compassionomics is the branch of knowledge and scientific study of the effects of compassionate healthcare. Our main hypotheses are that compassionate healthcare is beneficial for (1) patients, by improving clinical outcomes, (2) healthcare systems and payers, by supporting financial sustainability, and (3) HCPs, by lowering burnout and promoting resilience and well-being. The purpose of this paper is to establish a scientific framework for testing the hypotheses above . If these hypotheses are confirmed through rigorous research, compassionomics will belong in the science of evidence-based medicine, with major implications for all healthcare domains.” 26
- EXAMPLE 4. Statistical hypothesis (quantitative research)
- - An assumption is made about the relationship among several population characteristics ( gender differences in sociodemographic and clinical characteristics of adults with ADHD ). Validity is tested by statistical experiment or analysis ( chi-square test, Students t-test, and logistic regression analysis)
- “Our research investigated gender differences in sociodemographic and clinical characteristics of adults with ADHD in a Japanese clinical sample. Due to unique Japanese cultural ideals and expectations of women's behavior that are in opposition to ADHD symptoms, we hypothesized that women with ADHD experience more difficulties and present more dysfunctions than men . We tested the following hypotheses: first, women with ADHD have more comorbidities than men with ADHD; second, women with ADHD experience more social hardships than men, such as having less full-time employment and being more likely to be divorced.” 27
- “Statistical Analysis
- ( text omitted ) Between-gender comparisons were made using the chi-squared test for categorical variables and Students t-test for continuous variables…( text omitted ). A logistic regression analysis was performed for employment status, marital status, and comorbidity to evaluate the independent effects of gender on these dependent variables.” 27
EXAMPLES OF HYPOTHESIS AS WRITTEN IN PUBLISHED ARTICLES IN RELATION TO OTHER PARTS
- EXAMPLE 1. Background, hypotheses, and aims are provided
- “Pregnant women need skilled care during pregnancy and childbirth, but that skilled care is often delayed in some countries …( text omitted ). The focused antenatal care (FANC) model of WHO recommends that nurses provide information or counseling to all pregnant women …( text omitted ). Job aids are visual support materials that provide the right kind of information using graphics and words in a simple and yet effective manner. When nurses are not highly trained or have many work details to attend to, these job aids can serve as a content reminder for the nurses and can be used for educating their patients (Jennings, Yebadokpo, Affo, & Agbogbe, 2010) ( text omitted ). Importantly, additional evidence is needed to confirm how job aids can further improve the quality of ANC counseling by health workers in maternal care …( text omitted )” 28
- “ This has led us to hypothesize that the quality of ANC counseling would be better if supported by job aids. Consequently, a better quality of ANC counseling is expected to produce higher levels of awareness concerning the danger signs of pregnancy and a more favorable impression of the caring behavior of nurses .” 28
- “This study aimed to examine the differences in the responses of pregnant women to a job aid-supported intervention during ANC visit in terms of 1) their understanding of the danger signs of pregnancy and 2) their impression of the caring behaviors of nurses to pregnant women in rural Tanzania.” 28
- EXAMPLE 2. Background, hypotheses, and aims are provided
- “We conducted a two-arm randomized controlled trial (RCT) to evaluate and compare changes in salivary cortisol and oxytocin levels of first-time pregnant women between experimental and control groups. The women in the experimental group touched and held an infant for 30 min (experimental intervention protocol), whereas those in the control group watched a DVD movie of an infant (control intervention protocol). The primary outcome was salivary cortisol level and the secondary outcome was salivary oxytocin level.” 29
- “ We hypothesize that at 30 min after touching and holding an infant, the salivary cortisol level will significantly decrease and the salivary oxytocin level will increase in the experimental group compared with the control group .” 29
- EXAMPLE 3. Background, aim, and hypothesis are provided
- “In countries where the maternal mortality ratio remains high, antenatal education to increase Birth Preparedness and Complication Readiness (BPCR) is considered one of the top priorities [1]. BPCR includes birth plans during the antenatal period, such as the birthplace, birth attendant, transportation, health facility for complications, expenses, and birth materials, as well as family coordination to achieve such birth plans. In Tanzania, although increasing, only about half of all pregnant women attend an antenatal clinic more than four times [4]. Moreover, the information provided during antenatal care (ANC) is insufficient. In the resource-poor settings, antenatal group education is a potential approach because of the limited time for individual counseling at antenatal clinics.” 30
- “This study aimed to evaluate an antenatal group education program among pregnant women and their families with respect to birth-preparedness and maternal and infant outcomes in rural villages of Tanzania.” 30
- “ The study hypothesis was if Tanzanian pregnant women and their families received a family-oriented antenatal group education, they would (1) have a higher level of BPCR, (2) attend antenatal clinic four or more times, (3) give birth in a health facility, (4) have less complications of women at birth, and (5) have less complications and deaths of infants than those who did not receive the education .” 30
Research questions and hypotheses are crucial components to any type of research, whether quantitative or qualitative. These questions should be developed at the very beginning of the study. Excellent research questions lead to superior hypotheses, which, like a compass, set the direction of research, and can often determine the successful conduct of the study. Many research studies have floundered because the development of research questions and subsequent hypotheses was not given the thought and meticulous attention needed. The development of research questions and hypotheses is an iterative process based on extensive knowledge of the literature and insightful grasp of the knowledge gap. Focused, concise, and specific research questions provide a strong foundation for constructing hypotheses which serve as formal predictions about the research outcomes. Research questions and hypotheses are crucial elements of research that should not be overlooked. They should be carefully thought of and constructed when planning research. This avoids unethical studies and poor outcomes by defining well-founded objectives that determine the design, course, and outcome of the study.
Disclosure: The authors have no potential conflicts of interest to disclose.
Author Contributions:
- Conceptualization: Barroga E, Matanguihan GJ.
- Methodology: Barroga E, Matanguihan GJ.
- Writing - original draft: Barroga E, Matanguihan GJ.
- Writing - review & editing: Barroga E, Matanguihan GJ.
Key Concepts in Quantitative Research
In this module, we are going to explore the nuances of quantitative research, including the main types of quantitative research, more exploration into variables (including confounding and extraneous variables), and causation.
Content includes:
- Flaws, “Proof”, and Rigor
- The Steps of Quantitative Methodology
- Major Classes of Quantitative Research
- Experimental versus Non-Experimental Research
- Types of Experimental Research
- Types of Non-Experimental Research
- Research Variables
- Confounding/Extraneous Variables
- Causation versus correlation/association
Objectives:
- Discuss the flaws, proof, and rigor in research.
- Describe the differences between independent variables and dependent variables.
- Describe the steps in quantitative research methodology.
- Describe experimental, quasi-experimental, and non-experimental research studies
- Describe confounding and extraneous variables.
- Differentiate cause-and-effect (causality) versus association/correlation
Flaws, Proof, and Rigor in Research
One of the biggest hurdles that students and seasoned researchers alike struggle to grasp, is that research cannot “ prove ” nor “ disprove ”. Research can only support a hypothesis with reasonable, statistically significant evidence.
Indeed. You’ve heard it incorrectly your entire life. You will hear professors, scientists, radio ads, podcasts, and even researchers comment something to the effect of, “It has been proven that…” or “Research proves that…” or “Finally! There is proof that…”
We have been duped. Consider the “ prove ” word a very bad word in this course. The forbidden “P” word. Do not say it, write it, allude to it, or repeat it. And, for the love of avocados and all things fluffy, do not include the “P” word on your EBP poster. You will be deducted some major points.
We can only conclude with reasonable certainty through statistical analyses that there is a high probability that something did not happen by chance but instead happened due to the intervention that the researcher tested. Got that? We will come back to that concept but for now know that it is called “statistical significance”.
All research has flaws. We might not know what those flaws are, but we will be learning about confounding and extraneous variables later on in this module to help explain how flaws can happen.
Remember this: Sometimes, the researcher might not even know that there was a flaw that occurred. No research project is perfect. There is no 100% awesome. This is a major reason why it is so important to be able to duplicate a research project and obtain similar results. The more we can duplicate research with the same exact methodology and protocols, the more certainty we have in the results and we can start accounting for flaws that may have sneaked in.
Finally, not all research is equal. Some research is done very sloppily, and other research has a very high standard of rigor. How do we know which is which when reading an article? Well, within this module, we will start learning about some things to look for in a published research article to help determine rigor. We do not want lazy research to determine our actions as nurses, right? We want the strongest, most reliable, most valid, most rigorous research evidence possible so that we can take those results and embed them into patient care. Who wants shoddy evidence determining the actions we take with your grandmother’s heart surgery?
Independent Variables and Dependent Variables
As we were already introduced to, there are measures called “variables” in research. This will be a bit of a review but it is important to bring up again, as it is a hallmark of quantitative research. In quantitative studies, the concepts being measured are called variables (AKA: something that varies). Variables are something that can change – either by manipulation or from something causing a change. In the article snapshots that we have looked at, researchers are trying to find causes for phenomena. Does a nursing intervention cause an improvement in patient outcomes? Does the cholesterol medication cause a decrease in cholesterol level? Does smoking cause cancer?
The presumed cause is called the independent variable. The presumed effect is called the dependent variable. The dependent variable is “dependent” on something causing it to change. The dependent variable is the outcome that a researcher is trying to understand, explain, or predict.
Think back to our PICO questions. You can think of the intervention (I) as the independent variable and the outcome (O) as the dependent variable.
The independent variable is manipulated by the researcher or can be variants of influence. Whereas the dependent variable is never manipulated.

Variables do not always measure cause-and-effect. They can also measure a direction of influence.
Here is an example of that: If we compared levels of depression among men and women diagnosed with pancreatic cancer and found men to be more depressed, we cannot conclude that depression was caused by gender. However, we can note that the direction of influence clearly runs from gender to depression. It makes no sense to suggest the depression influenced their gender.
In the above example, what is the independent variable (IV) and what is the dependent variable (DV)? If you guessed gender as the IV and depression as the DV, you are correct! Important to note in this case that the researcher did not manipulate the IV, but the IV is manipulated on its own (male or female).
Researchers do not always have just one IV. In some cases, more than one IV may be measured. Take, for instance, a study that wants to measure the factors that influence one’s study habits. Independent variables of gender, sleep habits, and hours of work may be considered. Likewise, multiple DVs can be measured. For example, perhaps we want to measure weight and abdominal girth on a plant-based diet (IV).
Now, some studies do not have an intervention. We will come back to that when we talk about non-experimental research.
The point of variables is so that researchers have a very specific measurement that they seek to study.
Let’s look at a couple of examples:
Now you try! Identify the IVs and DVs:
IV and DV Case Studies (Leibold, 2020)
Case Three: Independent variable: Healthy Lifestyle education with a focus on physical activity; Dependent variable: Physical activity rate before and after education intervention, Heart rate before and after education intervention, Blood pressures before and after education intervention.
Case Four: Independent variable: Playing classical music; Dependent variable: Grade point averages post classical music, compared to pre-classical music.
Case Five: Independent variable: No independent variable as there is no intervention. Dependent variable: The themes that emerge from the qualitative data.
The Steps in Quantitative Research Methodology
Now, as we learned in the last module, quantitative research is completely objective. There is no subjectivity to it. Why is this? Well, as we have learned, the purpose of quantitative research is to make an inference about the results in order to generalize these results to the population.
In quantitative studies, there is a very systematic approach that moves from the beginning point of the study (writing a research question) to the end point (obtaining an answer). This is a very linear and purposeful flow across the study, and all quantitative research should follow the same sequence.
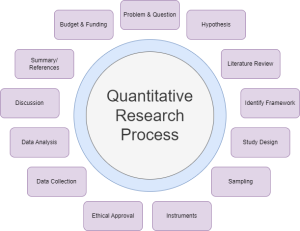
- Identifying a problem and formulating a research question . Quantitative research begins with a theory . As in, “something is wrong and we want to fix it or improve it”. Think back to when we discussed research problems and formulating a research question. Here we are! That is the first step in formulating a quantitative research plan.
- Formulate a hypothesis . This step is key. Researchers need to know exactly what they are testing so that testing the hypothesis can be achieved through specific statistical analyses.
- A thorough literature review . At this step, researchers strive to understand what is already known about a topic and what evidence already exists.
- Identifying a framework . When an appropriate framework is identified, the findings of a study may have broader significance and utility (Polit & Beck, 2021).
- Choosing a study design . The research design will determine exactly how the researcher will obtain the answers to the research question(s). The entire design needs to be structured and controlled, with the overarching goal of minimizing bias and errors. The design determines what data will be collected and how, how often data will be collected, what types of comparisons will be made. You can think of the study design as the architectural backbone of the entire study.
- Sampling . The researcher needs to determine a subset of the population that is to be studied. We will come back to the sampling concept in the next module. However, the goal of sampling is to choose a subset of the population that adequate reflects the population of interest.
- I nstruments to be used to collect data (with reliability and validity as a priority). Researchers must find a way to measure the research variables (intervention and outcome) accurately. The task of measuring is complex and challenging, as data needs to be collected reliably (measuring consistently each time) and valid. Reliability and validity are both about how well a method measures something. The next module will cover this in detail.
- Obtaining approval for ethical/legal human rights procedures . As we will learn in an upcoming module, there needs to be methods in place to safeguard human rights.
- Data collection . The fun part! Finally, after everything has been organized and planned, the researcher(s) begin to collect data. The pre-established plan (methodology) determines when data collection begins, how to accomplish it, how data collection staff will be trained, and how data will be recorded.
- Data analysis . Here comes the statistical analyses. The next module will dive into this.
- Discussion . After all the analyses have been complete, the researcher then needs to interpret the results and examine the implications. Researchers attempt to explain the findings in light of the theoretical framework, prior evidence, theory, clinical experience, and any limitations in the study now that it has been completed. Often, the researcher discusses not just the statistical significance, but also the clinical significance, as it is common to have one without the other.
- Summary/references . Part of the final steps of any research project is to disseminate (AKA: share) the findings. This may be in a published article, conference, poster session, etc. The point of this step is to communicate to others the information found through the study. All references are collected so that the researchers can give credit to others.
- Budget and funding . As a last mention in the overall steps, budget and funding for research is a consideration. Research can be expensive. Often, researchers can obtain a grant or other funding to help offset the costs.
Edit: Steps in Quantitative Research video. Step 12 should say “Dissemination” (sharing the results).
Experimental, Quasi-Experimental, and Non-Experimental Studies
To start this section, please watch this wonderful video by Jenny Barrow, MSN, RN, CNE, that explains experimental versus nonexperimental research.
(Jenny Barrow, 2019)
Now that you have that overview, continue reading this module.
Experimental Research : In experimental research, the researcher is seeking to draw a conclusion between an independent variable and a dependent variable. This design attempts to establish cause-effect relationships among the variables. You could think of experimental research as experimenting with “something” to see if it caused “something else”.
A true experiment is called a Randomized Controlled Trial (or RCT). An RCT is at the top of the echelon as far as quantitative experimental research. It’s the gold standard of scientific research. An RCT, a true experimental design, must have 3 features:
- An intervention : The experiment does something to the participants by the option of manipulating the independent variable.
- Control : Some participants in the study receive either the standard care, or no intervention at all. This is also called the counterfactual – meaning, it shows what would happen if no intervention was introduced.
- Randomization : Randomization happens when the researcher makes sure that it is completely random who receives the intervention and who receives the control. The purpose is to make the groups equal regarding all other factors except receipt of the intervention.
Note: There is a lot of confusion with students (and even some researchers!) when they refer to “ random assignment ” versus “ random sampling ”. Random assignment is a signature of a true experiment. This means that if participants are not truly randomly assigned to intervention groups, then it is not a true experiment. We will talk more about random sampling in the next module.
One very common method for RCT’s is called a pretest-posttest design . This is when the researcher measures the outcome before and after the intervention. For example, if the researcher had an IV (intervention/treatment) of a pain medication, the DV (pain) would be measured before the intervention is given and after it is given. The control group may just receive a placebo. This design permits the researcher to see if the change in pain was caused by the pain medication because only some people received it (Polit & Beck, 2021).
Another experimental design is called a crossover design . This type of design involves exposing participants to more than one treatment. For example, subject 1 first receives treatment A, then treatment B, then treatment C. Subject 2 might first receive treatment B, then treatment A, and then treatment C. In this type of study, the three conditions for an experiment are met: Intervention, randomization, and control – with the subjects serving as their own control group.
Control group conditions can be done in 4 ways:
- No intervention is used; control group gets no treatment at all
- “Usual care” or standard of care or normal procedures used
- An alternative intervention is uses (e.g. auditory versus visual stimulation)
- A placebo or pseudo-intervention, presumed to have no therapeutic value, is used
Quasi-Experimental Research : Quasi-experiments involve an experiment just like true experimental research. However, they lack randomization and some even lack a control group. Therefore, there is implementation and testing of an intervention, but there is an absence of randomization.
For example, perhaps we wanted to measure the effect of yoga for nursing students. The IV (intervention of yoga) is being offered to all nursing students and therefore randomization is not possible. For comparison, we could measure quality of life data on nursing students at a different university. Data is collected from both groups at baseline and then again after the yoga classes. Note, that in quasi-experiments, the phrase “comparison group” is sometimes used instead of “control group” against which outcome measures are collected.
Sometimes there is no comparison group either. This would be called a one-group pretest-posttest design .
Non-Experimental Research : Sometimes, cause-problem research questions cannot be answered with an experimental or quasi-experimental design because the IV cannot be manipulated. For example, if we want to measure what impact prerequisite grades have on student success in nursing programs, we obviously cannot manipulate the prerequisite grades. In another example, if we wanted to investigate how low birth weight impacts developmental progression in children, we cannot manipulate the birth weight. Often, you will see the word “observational” in lieu of non-experimental researcher. This does not mean the researcher is just standing and watching people, but instead it refers to the method of observing data that has already been established without manipulation.
There are various types of non-experimental research:
Correlational research : A correlational research design investigates relationships between two variables (or more) without the researcher controlling or manipulating any of them. In the example of prerequisites and nursing program success, that is a correlational design. Consider hypothetically, a researcher is studying a correlation between cancer and marriage. In this study, there are two variables: disease and marriage. Let us say marriage has a negative association with cancer. This means that married people are less likely to develop cancer.
Cohort design (also called a prospective design) : In a cohort study, the participants do not have the outcome of interest to begin with. They are selected based on the exposure status of the individual. They are then followed over time to evaluate for the occurrence of the outcome of interest. Cohorts may be divided into exposure categories once baseline measurements of a defined population are made. For example, the Framingham Cardiovascular Disease Study (CVD) used baseline measurements to divide the population into categories of CVD risk factors. Another example: An example of a cohort study is comparing the test scores of one group of people who underwent extensive tutoring and a special curriculum and those who did not receive any extra help. The group could be studied for years to assess whether their scores improve over time and at what rate.
Retrospective design : In retrospective studies, the outcome of interest has already occurred (or not occurred – e.g., in controls) in each individual by the time s/he is enrolled, and the data are collected either from records or by asking participants to recall exposures. There is no follow-up of participants. For example, a researcher might examine the medical histories of 1000 elderly women to identify the causes of health problems.
Case-control design : A study that compares two groups of people: those with the disease or condition under study (cases) and a very similar group of people who do not have the condition. For example, investigators conducted a case-control study to determine if there is an association between colon cancer and a high fat diet. Cases were all confirmed colon cancer cases in North Carolina in 2010. Controls were a sample of North Carolina residents without colon cancer.
Descriptive research : Descriptive research design is a type of research design that aims to obtain information to systematically describe a phenomenon, situation, or population. More specifically, it helps answer the what, when, where, and how questions regarding the research problem, rather than the why. For example, the researcher might wish to discover the percentage of motorists who tailgate – the prevalence of a certain behavior.
There are two other designs to mention, which are both on a time continuum basis.
Cross-sectional design : All data are collected at a single point in time. Retrospective studies are usually cross-sectional. The IV usually concerns events or behaviors occurring in the past. One cross-sectional study example in medicine is a data collection of smoking habits and lung cancer incidence in a given population. A cross-sectional study like this cannot solely determine that smoking habits cause lung cancer, but it can suggest a relationship that merits further investigation. Cross-sectional studies serve many purposes, and the cross-sectional design is the most relevant design when assessing the prevalence of disease, attitudes and knowledge among patients and health personnel, in validation studies comparing, for example, different measurement instruments, and in reliability studies.
Longitudinal design : Data are collected two or more times over an extended period. Longitudinal designs are better at showing patterns of change and at clarifying whether a cause occurred before an effect (outcome). A challenge in longitudinal studies is attrition or the loss of participants over time. In a longitudinal study subjects are followed over time with continuous or repeated monitoring of risk factors or health outcomes, or both. Such investigations vary enormously in their size and complexity. At one extreme a large population may be studied over decades. An example of a longitudinal design is a multiyear comparative study of the same children in an urban and a suburban school to record their cognitive development in depth.
Confounding and Extraneous Variables
Confounding variables are a type of extraneous variable that occur which interfere with or influence the relationship between the independent and dependent variables. In research that investigates a potential cause-and-effect relationship, a confounding variable is an unmeasured third variable that influences both the supposed cause and the supposed effect.
It’s important to consider potential confounding variables and account for them in research designs to ensure results are valid. You can imagine that if something sneaks in to influence the measured variables, it can really muck up the study!
Here is an example:
You collect data on sunburns and ice cream consumption. You find that higher ice cream consumption is associated with a higher probability of sunburn. Does that mean ice cream consumption causes sunburn?
Here, the confounding variable is temperature: hot temperatures cause people to both eat more ice cream and spend more time outdoors under the sun, resulting in more sunburns.

To ensure the internal validity of research, the researcher must account for confounding variables. If he/she fails to do so, the results may not reflect the actual relationship between the variables that they are interested in.
For instance, they may find a cause-and-effect relationship that does not actually exist, because the effect they measure is caused by the confounding variable (and not by the independent variable).
Here is another example:
The researcher finds that babies born to mothers who smoked during their pregnancies weigh significantly less than those born to non-smoking mothers. However, if the researcher does not account for the fact that smokers are more likely to engage in other unhealthy behaviors, such as drinking or eating less healthy foods, then he/she might overestimate the relationship between smoking and low birth weight.
Extraneous variables are any variables that the researcher is not investigating that can potentially affect the outcomes of the research study. If left uncontrolled, extraneous variables can lead to inaccurate conclusions about the relationship between IVs and DVs.
Extraneous variables can threaten the internal validity of a study by providing alternative explanations for the results. In an experiment, the researcher manipulates an independent variable to study its effects on a dependent variable.
In a study on mental performance, the researcher tests whether wearing a white lab coat, the independent variable (IV), improves scientific reasoning, the dependent variable (DV).
Students from a university are recruited to participate in the study. The researcher manipulates the independent variable by splitting participants into two groups:
- Participants in the experimental group are asked to wear a lab coat during the study.
- Participants in the control group are asked to wear a casual coat during the study.
All participants are given a scientific knowledge quiz, and their scores are compared between groups.
When extraneous variables are uncontrolled, it’s hard to determine the exact effects of the independent variable on the dependent variable, because the effects of extraneous variables may mask them.
Uncontrolled extraneous variables can also make it seem as though there is a true effect of the independent variable in an experiment when there’s actually none.
In the above experiment example, these extraneous variables can affect the science knowledge scores:
- Participant’s major (e.g., STEM or humanities)
- Participant’s interest in science
- Demographic variables such as gender or educational background
- Time of day of testing
- Experiment environment or setting
If these variables systematically differ between the groups, you can’t be sure whether your results come from your independent variable manipulation or from the extraneous variables.
In summary, an extraneous variable is anything that could influence the dependent variable. A confounding variable influences the dependent variable, and also correlates with or causally affects the independent variable.

Cause-and-Effect (Causality) Versus Association/Correlation
A very important concept to understand is cause-and-effect, also known as causality, versus correlation. Let’s look at these two concepts in very simplified statements. Causation means that one thing caused another thing to happen. Correlation means there is some association between the two thing we are measuring.
It would be nice if it were as simple as that. These two concepts can indeed by confused by many. Let’s dive deeper.
Two or more variables are considered to be related or associated, in a statistical context, if their values change so that as the value of one variable increases or decreases so does the value of the other variable (or the opposite direction).
For example, for the two variables of “hours worked” and “income earned”, there is a relationship between the two if the increase in hours is associated with an increase in income earned.
However, correlation is a statistical measure that describes the size and direction of a relationship between two or more variables. A correlation does not automatically mean that the change in one variable caused the change in value in the other variable.
Theoretically, the difference between the two types of relationships is easy to identify — an action or occurrence can cause another (e.g. smoking causes an increase in the risk of developing lung cancer), or it can correlate with another (e.g. smoking is correlated with alcoholism, but it does not cause alcoholism). In practice, however, it remains difficult to clearly establish cause and effect, compared with establishing correlation.
Simplified in this image, we can say that hot and sunny weather causes an increase in ice cream consumption. Similarly, we can demise that hot and sunny weather increases the incidence of sunburns. However, we cannot say that ice cream caused a sunburn (or that a sunburn increases consumption of ice cream). It is purely coincidental. In this example, it is pretty easy to anecdotally surmise correlation versus causation. However, in research, we have statistical tests that help researchers differentiate via specialized analyses.

Here is a great Khan Academy video of about 5 minutes that shows a worked example of correlation versus causation with regard to sledding accidents and frostbite cases:
https://www.khanacademy.org/test-prep/praxis-math/praxis-math-lessons/gtp–praxis-math–lessons–statistics-and-probability/v/gtp–praxis-math–video–correlation-and-causation
References & Attribution
“ Light bulb doodle ” by rawpixel licensed CC0 .
“ Magnifying glass ” by rawpixel licensed CC0
“ Orange flame ” by rawpixel licensed CC0 .
Jenny Barrow. (2019). Experimental versus nonexperimental research. https://www.youtube.com/watch?v=FJo8xyXHAlE
Leibold, N. (2020). Research variables. Measures and Concepts Commonly Encountered in EBP. Creative Commons License: BY NC
Polit, D. & Beck, C. (2021). Lippincott CoursePoint Enhanced for Polit’s Essentials of Nursing Research (10th ed.). Wolters Kluwer Health.
Evidence-Based Practice & Research Methodologies Copyright © by Tracy Fawns is licensed under a Creative Commons Attribution-NonCommercial-ShareAlike 4.0 International License , except where otherwise noted.
Share This Book

Evaluation Methods in Biomedical and Health Informatics pp 103–127 Cite as
The Structure of Quantitative Studies
- Charles P. Friedman 4 ,
- Jeremy C. Wyatt 5 &
- Joan S. Ash 6
- First Online: 10 February 2022
1403 Accesses
Part of the book series: Health Informatics ((HI))
This chapter introduces the methods of quantitative studies. It describes the process of measurement, which is fundamental to all quantitative methods, and then offers an important distinction between measurement and demonstration studies. The chapter concludes with a description of three types of demonstration studies: descriptive, interventional, and correlational.
This is a preview of subscription content, log in via an institution .
Buying options
- Available as PDF
- Read on any device
- Instant download
- Own it forever
- Available as EPUB and PDF
- Compact, lightweight edition
- Dispatched in 3 to 5 business days
- Free shipping worldwide - see info
- Durable hardcover edition
Tax calculation will be finalised at checkout
Purchases are for personal use only
Terms such as “accuracy” and “precision” are used loosely in this chapter. They will be defined more rigorously in Chap. 7 .
The concept of the measurement study in informatics can be traced to the work of Michaelis et al. ( 1990 ).
Binning JF. Construct. In: Encyclopedia Britannica. 2016. https://www.britannica.com/science/construct . Accessed 30 Dec 2020.
Clarke JR, Webber BL, Gertner A, Rymon KJ. On-line decision support for emergency trauma management. Proc Symp Comput Applications Med Care. 1994;18:1028.
Google Scholar
Daraz L, Morrow AS, Ponce OJ, Beuschel B, Farah MH, Katabi A, et al. Can patients trust online health information? A meta-narrative systematic review addressing the quality of health information on the internet. J Gen Intern Med. 2019;34:1884–91.
Article Google Scholar
Dawber TR. The Framingham study: the epidemiology of atherosclerotic disease. Harvard University Press; 2013.
Dykes PC, Hurley A, Cashen M, Bakken S, Duffy ME. Development and psychometric evaluation of the Impact of Health Information Technology (I-HIT) scale. J Am Med Inform Assoc. 2007;14:507–14.
Feinstein AR. Clinimetrics. New Haven: Yale University Press; 1987. p. viii.
Book Google Scholar
Graber ML, Mathew A. Performance of a web-based clinical diagnosis support system for internists. J Gen Intern Med. 2008;23:37–40.
Hasman A, Ammenwerth E, Dickhaus H, Knaup P, Lovis C, Mantas J, et al. Biomedical informatics–a confluence of disciplines? Methods Inf Med. 2011;50:508–24.
Article CAS Google Scholar
Kern LM, Malhotra S, Barrón Y, Quaresimo J, Dhopeshwarkar R, Pichardo M, et al. Accuracy of electronically reported “meaningful use” clinical quality measures: a cross-sectional study. Ann Int Med. 2013;158:77–83.
McDonald CJ, Hui SL, Smith DM, et al. Reminders to physicians from an introspective computer medical record: a two-year randomized trial. Ann Intern Med. 1984;100:130–8.
Michaelis J, Wellek S, Willems JL. Reference standards for software evaluation. Methods Inf Med. 1990;29:289–97.
Palen TE, Ross C, Powers JD, Xu S. Association of online patient access to clinicians and medical records with use of clinical services. JAMA. 2012;308:2012–9.
Ramnarayan P, Kapoor RR, Coren M, Nanduri V, Tomlinson AL, Taylor PM, et al. Measuring the impact of diagnostic decision support on the quality of clinical decision making: development of a reliable and valid composite score. J Am Med Inform Assoc. 2003;10:563–72.
Roque NA, Boot WR. A new tool for assessing mobile device proficiency in older adults: the mobile device proficiency questionnaire. J Appl Gerontol. 2018;37:131–56.
Scott PJ, Brown AW, Adedeji T, Wyatt JC, Georgiou A, Eisenstein EL, et al. A review of measurement practice in studies of clinical decision support systems 1998–2017. J Am Med Inform Assoc. 2019;26:1120–8.
Terwee CB, Jansma EP, Riphagen II, de Vet HC. Development of a methodological PubMed search filter for finding studies on measurement properties of measurement instruments. Qual Life Res. 2009;18:1115–23.
Yen PY, Sousa KH, Bakken S. Examining construct and predictive validity of the Health-IT Usability Evaluation Scale: confirmatory factor analysis and structural equation modeling results. J Am Med Inform Assoc. 2014;21:e241–8.
Zhou L, Bao J, Setiawan IM, Saptono A, Parmanto B. The mHealth APP usability questionnaire (MAUQ): development and validation study. JMIR. 2019;7:e11500.
Download references
Author information
Authors and affiliations.
Department of Learning Health Sciences, University of Michigan Medical School, Ann Arbor, MI, USA
Charles P. Friedman
Department of Primary Care, Population Sciences and Medical Education, School of Medicine, University of Southampton, Southampton, UK
Jeremy C. Wyatt
Department of Medical Informatics and Clinical Epidemiology, School of Medicine, Oregon Health & Science University, Portland, OR, USA
Joan S. Ash
You can also search for this author in PubMed Google Scholar
Corresponding author
Correspondence to Charles P. Friedman .
Answers to Self-tests
Self-test 6.1.
The attribute is “appropriateness” of each alert. “Alerts” comprise the object class. (Although the panelists need access to the cases to perform the ratings, cases are not the object class here because each alert is what is directly rated—the attribute of “appropriateness” is a characteristic of each alert—and because each case may have generated multiple alerts related to its different clinical aspects.) The instrumentation is the rating form as completed by a human judge. Each individual judge’s rating of the appropriateness of an alert constitutes an independent observation.
The attribute is “knowledge about the administrative information system.” Staff members are the object class. The instrument is the written test. Each question on the test constitutes an independent observation.
The attribute is “ease of use” of the app. Tasks are the object class. The independent observations are the ratings by each tester.
Self-test 6.2
Interval (In IQ testing, the average score of 100 is completely arbitrary)
Self-test 6.3
This is a measurement study. The stated purposes of the study have nothing to do with the actual quality of TraumAID’s advice. The purposes are exclusively concerned with how well this quality, whatever it turns out to be, can be measured. The quality of TraumAID’s advice would be the focus of a separate demonstration study.
Self-test 6.4
It is an interventional study because the study team presumably had some control over where the resource was or was not deployed. The site is the “subject” for this study. (Note that this point is a bit ambiguous. Patients could possibly be seen as the subjects in the study; however, as the question is phrased, the enrollment rates at the sites are going to be the basis of comparison. Because the enrollment rate must be computed for a site , then site must be the “subject.”) It follows that the dependent variable is the protocol enrollment rate; the independent variable is the presence or absence of the resource.
It is a descriptive study. Nurses using the system are the subjects. There is no independent variable. Dependent variables are the extent of workstation use for each purpose.
It is a correlational study. Patients are the subjects. The independent variables are the characteristics of the patients; the dependent variable is the extent of use of information resources.
This is also a correlational study. Patients are the subjects. The independent variable is the genetic information; the dependent variable is the diseases they develop. There is, however, no manipulation or purposeful intervention.
Interventional study. Students are the subjects. Independent variable(s) are the version of the database and time of assessment. The dependent variable is the score on each problem-solving assessment.
Rights and permissions
Reprints and permissions
Copyright information
© 2022 Springer Nature Switzerland AG
About this chapter
Cite this chapter.
Friedman, C.P., Wyatt, J.C., Ash, J.S. (2022). The Structure of Quantitative Studies. In: Evaluation Methods in Biomedical and Health Informatics. Health Informatics. Springer, Cham. https://doi.org/10.1007/978-3-030-86453-8_6
Download citation
DOI : https://doi.org/10.1007/978-3-030-86453-8_6
Published : 10 February 2022
Publisher Name : Springer, Cham
Print ISBN : 978-3-030-86452-1
Online ISBN : 978-3-030-86453-8
eBook Packages : Medicine Medicine (R0)
Share this chapter
Anyone you share the following link with will be able to read this content:
Sorry, a shareable link is not currently available for this article.
Provided by the Springer Nature SharedIt content-sharing initiative
- Publish with us
Policies and ethics
- Find a journal
- Track your research
- Chapter Four: Quantitative Methods (Part 3 - Making Sense of Your Study)
After you have designed your study, collected your data, and analyzed it, you have to figure out what it means and communicate that to potential interested audiences. This section of the chapter is about how to make sense of your study, in terms of data interpretation, data write-up, and data presentation, as seen in the above diagram.
- Chapter One: Introduction
- Chapter Two: Understanding the distinctions among research methods
- Chapter Three: Ethical research, writing, and creative work
- Chapter Four: Quantitative Methods (Part 1)
- Chapter Four: Quantitative Methods (Part 2 - Doing Your Study)
- Chapter Five: Qualitative Methods (Part 1)
- Chapter Five: Qualitative Data (Part 2)
- Chapter Six: Critical / Rhetorical Methods (Part 1)
- Chapter Six: Critical / Rhetorical Methods (Part 2)
- Chapter Seven: Presenting Your Results
Data Interpretation
Once you have run your statistics, you have to figure out what your findings mean or interpret your data. To do this, you need to tie back your findings to your research questions and/or hypotheses, think about how your findings relate to what you discovered beforehand about the already existing literature, and determine how your findings take the literature or current theory in the field further. Your interpretation of the data you collected will be found in the last section of your paper, what is commonly called the "discussion" section.
Remember Your RQs/Hs
Your research questions and hypotheses, once developed, should guide your study throughout the research process. As you are choosing your research design, choosing how to operationalize your variables, and choosing/conducting your statistical tests, you should always keep your RQs and Hs in mind.
What were you wanting to discover by your study? What were you wanting to test? Make sure you answer these questions clearly for the reader of your study in both the results and discussion section of the paper. (Specific guidelines for these sections will be covered later in this chapter, including the common practice of placing the data as you present it with each research question in the results section.)
Tie Findings to Your Literature Review
As you have seen in chapter 3 and the Appendix, and will see in chapter 7, the literature review is what you use to set up your quantitative study and to show why there is a need for your study. It should start out broad, with the context for your study, and lead into showing what still needs to be known and studied about your topic area, justifying your focus in the study. It will be brought in again in the last section of the paper you write, i.e., the discussion section.
Your paper is like an hourglass – starting out broad and narrowing down in the middle with your actual study and findings, and then moving to broad implications for the larger context of your study near the end.
Think about Relationship of Findings to Theory
One of the things you will write about in your discussion or last section of your paper is the implications of what you found. These implications are both practical and theoretical. Practical implications are how the research can provide practical applications to real-world people and issues. Theoretical implications are how the research takes the current academic literature further, specifically, in relationship to theory-building.
Did any of the research you reviewed for your literature review mention a theory your findings could expand upon? If so, you should think about how your findings related to this theory. If not, then think about the theories you have already studied in your communication classes. Would any of them provide a possible explanation of what you found? Would your findings help expand that theory to a different context, the context you studied? Does a theory need to be developed in the area of your research? If so, then what aspects of that theory could your findings help explain?
Data Write-Up
All quantitative studies, when written, have four parts. The first part is the introduction and literature review, the second part is the methods section, the third section is the results or findings, and the fourth section is the discussion section. This portion of this chapter will explain what elements you will need to include in each of these sections.
Literature Review
The beginning of your paper and first few pages sets the tone for your study. It tells the reader what the context of your study is and what other people who are also interested in your topic have studied about your topic.
There are many ways to organize a literature review, as can be seen in the following website. Literature Reviews — The Writing Center at UNC-Chapel Hill
After you have done a thorough literature search on your topic, then you have to organize your literature into topics of some kind. Your main goal is to show what has been done and what still needs to be done, to show the need for your study, so at the end of each section of your literature review, you should identify what still needs to be known about that particular area.
For quantitative research, you should do your literature review before coming up with your research questions/hypotheses. Your questions and hypotheses should flow from the literature. This is different from the other two research methods discussed in this book, which do not rely so heavily on a literature review to situation the study before conducting it.
In the methods section, you should tell your reader how you conducted your study, from start to finish, explaining why you made the choices you did along the way. A reader should be able to replicate your study from the descriptions you provide in this section of your write-up. Common headings in the methods section include a description of the participants, procedures, and analysis.
Participants
For the participants' subheading of the methods section, you should minimally report the demographics of your sample in terms of biological sex (frequencies/percentages), age (range of ages and mean), and ethnicity (frequencies/percentages). If you collected data on other demographics, such as socioeconomic status, religious affiliation, type of occupation, etc., then you can report data for that also in the participants' sub-section.
For the procedures sub-section, you report everything you did to collect your data: how you recruited your participants, including what type of sampling you used (probability or non-probability) and informed consent procedures; how you operationalized your variables (including your survey questions, which often are explained in the methods section briefly while the whole survey can be found in an appendix of your paper); the validity and reliability of your survey instrument or methods you used; and what type of study design you had (experimental, quasi-experimental, or non-experimental). For each one of these design issues, in this sub-section of the methods part, you need to explain why you made the decisions you did in order to answer your research questions or test your hypotheses.
In this section, you explain how you converted your data for analysis and how you analyzed your data. You need to explain what statistics you chose to run for each of your research questions/hypotheses and why.
In this section of your paper, you organize the results by your research questions/hypotheses. For each research question/hypothesis, you should present any descriptive statistic results first and then your inferential statistics results. You do not make any interpretation of what your results mean or why you think you got the results you did. You merely report your results.
Reporting Significant Results
For each of the inferential statistics, there is a typical template you can follow when reporting significant results: reporting the test statistic value, the degrees of freedom 3 , and the probability level. Examples follow for each of the statistics we have talked about in this text.
T-test results
"T-tests results show there was a significant difference found between men and women on their levels of self-esteem, t (df) = t value, p < .05, with men's self-esteem being higher (or lower) (men's mean & standard deviation) than women's self-esteem (women's mean & standard deviation)."
ANOVA results
"ANOVA results indicate there was a significant difference found between [levels of independent variable] on [dependent variable], F (df) = F value, p < .05."
If doing a factorial ANOVA, you would report the above sentence for all of your independent variables (main effects), as well as for the interaction (interaction effect), with language something like: "ANOVA results indicate a significant main effect for [independent variable] on [dependent variable], F (df) = F value, p < .05. .... ANOVA results indicate a significant interaction effect between [independent variables] on [dependent variable], F (df) = F value, p < .05."
See example YouTube tutorial for writing up a two-way ANOVA at the following website.
Factorial Design (Part C): Writing Up Results
Chi-square results
For goodness of fit results, your write-up would look something like: "Using a chi-square goodness of fit test, there was a significant difference found between observed and expected values of [variable], χ2 (df) = chi-square value, p < .05." For test of independence results, it would like like: "Using a chi-square test of independence, there was a significant interaction between [your two variables], χ2 (df) = chi-square value, p < .05."
Correlation results
"Using Pearson's [or Spearman's] correlation coefficient, there was a significant relationship found between [two variables], r (df) = r value, p < .05." If there are a lot of significant correlation results, these results are often presented in a table form.
For more information on these types of tables, see the following website: Correlation Tables .
Regression results
Reporting regression results is more complicated, but generally, you want to inform the reader about how much variance is accounted by the regression model, the significance level of the model, and the significance of the predictor variable. For example:
A regression analysis, predicting GPA scores from GRE scores, was statistically significant, F (1,8) = 10.34, p < .05.
Coefficientsa
The regression equation is: Ŷ = .411 * .005X. For every one unit increase in GRE score, there is a corresponding increase in GPA of .005 (Walen-Frederick, n.d., p. 4).
For more write-up help on regression and other statistics, see the following website location:
Multiple Regression (pp. 217-220)
Reporting Non-Significant Results
You can follow a similar template when reporting non-significant results for all of the above inferential statistics. It is the same as provided in the above examples, except the word "non-significant" replaces the word "significant," and the p values are adjusted to indicate p > .05.
Many times readers of articles do not read the whole article, especially if they are afraid of the statistical sections. When this happens, they often read the discussion section, which makes this a very important section in your writing. You should include the following elements in your discussion section: (a) a summary of your findings, (b) implications, (c) limitations, and (d) future research ideas.
Summary of Findings
You should summarize the answers to your research questions or what you found when testing your hypotheses in this sub-section of the discussion section. You should not report any statistical data here, but just put your results into narrative form. What did you find out that you did not know before doing your study? Answer that question in this sub- section.
Implications
You need to indicate why your study was important, both theoretically and practically. For the theoretical implications, you should relate what you found to the already existing literature, as discussed earlier when the "hourglass" format was mentioned as a way of conceptualizing your whole paper. If your study added anything to the existing theory on a particular topic, you talk about this here as well.
For practical implications, you need to identify for the reader how this study can help people in their real-world experiences related to your topic. You do not want your study to just be important to academic researchers, but also to other professionals and persons interested in your topic.
Limitations
As you get through conducting your study, you are going to realize there are things you wish you had done differently. Rather than hide these things from the reader, it is better to forthrightly state these for the reader. Explain why your study is limited and what you wish you had done in this sub-section.
Future Research
The limitations sub-section usually is tied directly to the future research sub-section, as your limitations mean that future research should be done to deal with these limitations. There may also be other things that could be studied, however, as a result of what you have found. What would other people say are the "gaps" your study left unstudied on your topic? These should be identified, with some suggestions on how they might be studied.
Other Aspects of the Paper
There are other parts of the academic paper you should include in your final write-up. We have provided useful resources for you to consider when including these aspects as part of your paper. For an example paper that uses the required APA format for a research paper write-up, see the following source: Varying Definitions of Online Communication .
Abstract & Titles.
Research Abstracts General Format
Tables, References, & Other Materials.
APA Tables and Figures 1 Reference List: Basic Rules
Data Presentation
You will probably be called upon to present your data in other venues besides in writing. Two of the most common venues are oral presentations such as in class or at conferences, and poster presentations, such as what you might find at conferences. You might also be called upon to not write an academic write-up of your study, but rather to provide an executive summary of the results of your study to the "powers that be," who do not have time to read more than 5 pages or so of a summary. There are good resources for doing all of these online, so we have provided these here.
Oral Presentations
Oral Presentations Delivering Presentations
Poster Presentations
Executive Summary
Executive Summaries Complete the Report Good & Poor Examples of Executive Summaries with the following link: http://unilearning.uow.edu.au/report/4bi1.html
Congratulations! You have learned a great deal about how to go about using quantitative methods for your future research projects. You have learned how to design a quantitative study, conduct a quantitative study, and write about a quantitative study. You have some good resources you can take with you when you leave this class. Now, you just have to apply what you have learned to projects that will come your way in the future.
Remember, just because you may not like one method the best does not mean you should not use it. Your research questions/hypotheses should ALWAYS drive your choice of which method you use. And remember also that you can do quantitative methods!
[NOTE: References are not provided for the websites cited in the text, even though if this was an actual research article, they would need to be cited.]
Baker, E., Baker, W., & Tedesco, J. C. (2007). Organizations respond to phishing: Exploring the public relations tackle box. Communication Research Reports, 24 (4), 327-339.
Benoit, W. L., & Hansen, G. J. (2004). Presidential debate watching, issue knowledge, character evaluation, and vote choice. Human Communication Research, 30 (1), 121-144.
Chatham, A. (1991). Home vs. public schooling: What about relationships in adolescence? Doctoral dissertation, University of Oklahoma.
Cousineau, T. M., Rancourt, D., and Green, T. C. (2006). Web chatter before and after the women's health initiative results: A content analysis of on-line menopause message boards. Journal of Health Communication, 11 (2), 133-147.
Derlega, V., Winstead, B. A., Mathews, A., and Braitman, A. L. (2008). Why does someone reveal highly personal information?: Attributions for and against self-disclosure in close relationships. Communication Research Reports, 25 , 115-130.
Fischer, J., & Corcoran, K. (2007). Measures for clinical practice and research: A sourcebook (volumes 1 & 2) . New York: Oxford University Press.
Guay, S., Boisvert, J.-M., & Freeston, M. H. (2003). Validity of three measures of communication for predicting relationship adjustment and stability among a sample of young couples. Psychological Assessment , 15(3), 392-398.
Holbert, R. L., Tschida, D. A., Dixon, M., Cherry, K., Steuber, K., & Airne, D. (2005). The West Wing and depictions of the American Presidency: Expanding the domains of framing in political communication. Communication Quarterly, 53 (4), 505-522.
Jensen, J. D. (2008). Scientific uncertainty in news coverage of cancer research: Effects of hedging on scientists' and journalists' credibility. Human Communication Research, 34 , 347- 369.
Keyton, J. (2011). Communicating research: Asking questions, finding answers . New York: McGraw Hill.
Lenhart, A., Ling, R., Campbell, S., & Purcell, K. (2010, Apr. 10). Teens and mobile phones . Report from the Pew Internet and American Life Project, retrieved from http://www.pewinternet.org/Reports/2010/Teens-and-Mobile-Phones.aspx .
Maddy, T. (2008). Tests: A comprehensive reference for assessments in psychology, education, and business . Austin, TX: Pro-Ed.
McCollum Jr., J. F., & Bryant, J. (2003). Pacing in children's television programming. Mass Communication and Society, 6 (2), 115-136.
Medved, C. E., Brogan, S. M., McClanahan, A. M., Morris, J. F., & Shepherd, G. J. (2006). Family and work socializing communication: Messages, gender, and ideological implications. Journal of Family Communication, 6 (3), 161-180.
Moyer-Gusé, E., & Nabi, R. L. (2010). Explaining the effects of narrative in an entertainment television program: Overcoming resistance to persuasion. Human Communication Research, 36 , 26-52.
Nabi, R. L. (2009). Cosmetic surgery makeover programs and intentions to undergo cosmetic enhancements: A consideration of three models of media effects. Human Communication Research, 35 , 1-27.
Pearson, J. C., DeWitt, L., Child, J. T., Kahl Jr., D. H., and Dandamudi, V. (2007). Facing the fear: An analysis of speech-anxiety content in public-speaking textbooks. Communication Research Reports, 24 (2), 159-168.
Rubin. R. B., Rubin, A. M., Graham, E., Perse, E. M., & Seibold, D. (2009). Communication research measures II: A sourcebook . New York: Routledge.
Serota, K. B., Levine, T. R., and Boster, F. J. (2010). The prevalence of lying in America: Three studies of reported deception. Human Communication Research, 36 , 1-24.
Sheldon, P. (2008). The relationship between unwillingness-to-communicate and students' facebook use. Journal of Media Psychology, 20 (2), 67–75.
Trochim, W. M. K. (2006). Reliability and validity. Research methods data base , retrieved from http://www.socialresearchmethods.net/kb/relandval.php .
Walen-Frederick, H. (n.d.). Help sheet for reading SPSS printouts . Retrieved from http://www.scribd.com/doc/51982223/help-sheet-for-reading-spss-printouts .
Weaver, A. J., & Wilson, B. J. (2009). The role of graphic and sanitized violence in the enjoyment of television dramas. Human Communication Research, 35 (3), 442-463.
Weber, K., Corrigan, M., Fornash, B., & Neupauer, N. C. (2003). The effect of interest on recall: An experiment. Communication Research Reports, 20 (2), 116-123.
Witt, P. L., & Schrodt, P. (2006). The influence of instructional technology use and teacher immediacy on student affect for teacher and course. Communication Reports, 19 (1), 1-15.
3 Degrees of freedom (df) relate to your sample size and to the number of groups being compared. SPSS always computes the df for your statistics. For more information on degrees of freedom, see the following web-based resources: http://www.youtube.com/watch?v=wsvfasNpU2s and http://www.creative-wisdom.com/pub/df/index.htm .
Back to Previous Spot
Chapter 2. Research Design
Getting started.
When I teach undergraduates qualitative research methods, the final product of the course is a “research proposal” that incorporates all they have learned and enlists the knowledge they have learned about qualitative research methods in an original design that addresses a particular research question. I highly recommend you think about designing your own research study as you progress through this textbook. Even if you don’t have a study in mind yet, it can be a helpful exercise as you progress through the course. But how to start? How can one design a research study before they even know what research looks like? This chapter will serve as a brief overview of the research design process to orient you to what will be coming in later chapters. Think of it as a “skeleton” of what you will read in more detail in later chapters. Ideally, you will read this chapter both now (in sequence) and later during your reading of the remainder of the text. Do not worry if you have questions the first time you read this chapter. Many things will become clearer as the text advances and as you gain a deeper understanding of all the components of good qualitative research. This is just a preliminary map to get you on the right road.

Research Design Steps
Before you even get started, you will need to have a broad topic of interest in mind. [1] . In my experience, students can confuse this broad topic with the actual research question, so it is important to clearly distinguish the two. And the place to start is the broad topic. It might be, as was the case with me, working-class college students. But what about working-class college students? What’s it like to be one? Why are there so few compared to others? How do colleges assist (or fail to assist) them? What interested me was something I could barely articulate at first and went something like this: “Why was it so difficult and lonely to be me?” And by extension, “Did others share this experience?”
Once you have a general topic, reflect on why this is important to you. Sometimes we connect with a topic and we don’t really know why. Even if you are not willing to share the real underlying reason you are interested in a topic, it is important that you know the deeper reasons that motivate you. Otherwise, it is quite possible that at some point during the research, you will find yourself turned around facing the wrong direction. I have seen it happen many times. The reason is that the research question is not the same thing as the general topic of interest, and if you don’t know the reasons for your interest, you are likely to design a study answering a research question that is beside the point—to you, at least. And this means you will be much less motivated to carry your research to completion.
Researcher Note
Why do you employ qualitative research methods in your area of study? What are the advantages of qualitative research methods for studying mentorship?
Qualitative research methods are a huge opportunity to increase access, equity, inclusion, and social justice. Qualitative research allows us to engage and examine the uniquenesses/nuances within minoritized and dominant identities and our experiences with these identities. Qualitative research allows us to explore a specific topic, and through that exploration, we can link history to experiences and look for patterns or offer up a unique phenomenon. There’s such beauty in being able to tell a particular story, and qualitative research is a great mode for that! For our work, we examined the relationships we typically use the term mentorship for but didn’t feel that was quite the right word. Qualitative research allowed us to pick apart what we did and how we engaged in our relationships, which then allowed us to more accurately describe what was unique about our mentorship relationships, which we ultimately named liberationships ( McAloney and Long 2021) . Qualitative research gave us the means to explore, process, and name our experiences; what a powerful tool!
How do you come up with ideas for what to study (and how to study it)? Where did you get the idea for studying mentorship?
Coming up with ideas for research, for me, is kind of like Googling a question I have, not finding enough information, and then deciding to dig a little deeper to get the answer. The idea to study mentorship actually came up in conversation with my mentorship triad. We were talking in one of our meetings about our relationship—kind of meta, huh? We discussed how we felt that mentorship was not quite the right term for the relationships we had built. One of us asked what was different about our relationships and mentorship. This all happened when I was taking an ethnography course. During the next session of class, we were discussing auto- and duoethnography, and it hit me—let’s explore our version of mentorship, which we later went on to name liberationships ( McAloney and Long 2021 ). The idea and questions came out of being curious and wanting to find an answer. As I continue to research, I see opportunities in questions I have about my work or during conversations that, in our search for answers, end up exposing gaps in the literature. If I can’t find the answer already out there, I can study it.
—Kim McAloney, PhD, College Student Services Administration Ecampus coordinator and instructor
When you have a better idea of why you are interested in what it is that interests you, you may be surprised to learn that the obvious approaches to the topic are not the only ones. For example, let’s say you think you are interested in preserving coastal wildlife. And as a social scientist, you are interested in policies and practices that affect the long-term viability of coastal wildlife, especially around fishing communities. It would be natural then to consider designing a research study around fishing communities and how they manage their ecosystems. But when you really think about it, you realize that what interests you the most is how people whose livelihoods depend on a particular resource act in ways that deplete that resource. Or, even deeper, you contemplate the puzzle, “How do people justify actions that damage their surroundings?” Now, there are many ways to design a study that gets at that broader question, and not all of them are about fishing communities, although that is certainly one way to go. Maybe you could design an interview-based study that includes and compares loggers, fishers, and desert golfers (those who golf in arid lands that require a great deal of wasteful irrigation). Or design a case study around one particular example where resources were completely used up by a community. Without knowing what it is you are really interested in, what motivates your interest in a surface phenomenon, you are unlikely to come up with the appropriate research design.
These first stages of research design are often the most difficult, but have patience . Taking the time to consider why you are going to go through a lot of trouble to get answers will prevent a lot of wasted energy in the future.
There are distinct reasons for pursuing particular research questions, and it is helpful to distinguish between them. First, you may be personally motivated. This is probably the most important and the most often overlooked. What is it about the social world that sparks your curiosity? What bothers you? What answers do you need in order to keep living? For me, I knew I needed to get a handle on what higher education was for before I kept going at it. I needed to understand why I felt so different from my peers and whether this whole “higher education” thing was “for the likes of me” before I could complete my degree. That is the personal motivation question. Your personal motivation might also be political in nature, in that you want to change the world in a particular way. It’s all right to acknowledge this. In fact, it is better to acknowledge it than to hide it.
There are also academic and professional motivations for a particular study. If you are an absolute beginner, these may be difficult to find. We’ll talk more about this when we discuss reviewing the literature. Simply put, you are probably not the only person in the world to have thought about this question or issue and those related to it. So how does your interest area fit into what others have studied? Perhaps there is a good study out there of fishing communities, but no one has quite asked the “justification” question. You are motivated to address this to “fill the gap” in our collective knowledge. And maybe you are really not at all sure of what interests you, but you do know that [insert your topic] interests a lot of people, so you would like to work in this area too. You want to be involved in the academic conversation. That is a professional motivation and a very important one to articulate.
Practical and strategic motivations are a third kind. Perhaps you want to encourage people to take better care of the natural resources around them. If this is also part of your motivation, you will want to design your research project in a way that might have an impact on how people behave in the future. There are many ways to do this, one of which is using qualitative research methods rather than quantitative research methods, as the findings of qualitative research are often easier to communicate to a broader audience than the results of quantitative research. You might even be able to engage the community you are studying in the collecting and analyzing of data, something taboo in quantitative research but actively embraced and encouraged by qualitative researchers. But there are other practical reasons, such as getting “done” with your research in a certain amount of time or having access (or no access) to certain information. There is nothing wrong with considering constraints and opportunities when designing your study. Or maybe one of the practical or strategic goals is about learning competence in this area so that you can demonstrate the ability to conduct interviews and focus groups with future employers. Keeping that in mind will help shape your study and prevent you from getting sidetracked using a technique that you are less invested in learning about.
STOP HERE for a moment
I recommend you write a paragraph (at least) explaining your aims and goals. Include a sentence about each of the following: personal/political goals, practical or professional/academic goals, and practical/strategic goals. Think through how all of the goals are related and can be achieved by this particular research study . If they can’t, have a rethink. Perhaps this is not the best way to go about it.
You will also want to be clear about the purpose of your study. “Wait, didn’t we just do this?” you might ask. No! Your goals are not the same as the purpose of the study, although they are related. You can think about purpose lying on a continuum from “ theory ” to “action” (figure 2.1). Sometimes you are doing research to discover new knowledge about the world, while other times you are doing a study because you want to measure an impact or make a difference in the world.

Basic research involves research that is done for the sake of “pure” knowledge—that is, knowledge that, at least at this moment in time, may not have any apparent use or application. Often, and this is very important, knowledge of this kind is later found to be extremely helpful in solving problems. So one way of thinking about basic research is that it is knowledge for which no use is yet known but will probably one day prove to be extremely useful. If you are doing basic research, you do not need to argue its usefulness, as the whole point is that we just don’t know yet what this might be.
Researchers engaged in basic research want to understand how the world operates. They are interested in investigating a phenomenon to get at the nature of reality with regard to that phenomenon. The basic researcher’s purpose is to understand and explain ( Patton 2002:215 ).
Basic research is interested in generating and testing hypotheses about how the world works. Grounded Theory is one approach to qualitative research methods that exemplifies basic research (see chapter 4). Most academic journal articles publish basic research findings. If you are working in academia (e.g., writing your dissertation), the default expectation is that you are conducting basic research.
Applied research in the social sciences is research that addresses human and social problems. Unlike basic research, the researcher has expectations that the research will help contribute to resolving a problem, if only by identifying its contours, history, or context. From my experience, most students have this as their baseline assumption about research. Why do a study if not to make things better? But this is a common mistake. Students and their committee members are often working with default assumptions here—the former thinking about applied research as their purpose, the latter thinking about basic research: “The purpose of applied research is to contribute knowledge that will help people to understand the nature of a problem in order to intervene, thereby allowing human beings to more effectively control their environment. While in basic research the source of questions is the tradition within a scholarly discipline, in applied research the source of questions is in the problems and concerns experienced by people and by policymakers” ( Patton 2002:217 ).
Applied research is less geared toward theory in two ways. First, its questions do not derive from previous literature. For this reason, applied research studies have much more limited literature reviews than those found in basic research (although they make up for this by having much more “background” about the problem). Second, it does not generate theory in the same way as basic research does. The findings of an applied research project may not be generalizable beyond the boundaries of this particular problem or context. The findings are more limited. They are useful now but may be less useful later. This is why basic research remains the default “gold standard” of academic research.
Evaluation research is research that is designed to evaluate or test the effectiveness of specific solutions and programs addressing specific social problems. We already know the problems, and someone has already come up with solutions. There might be a program, say, for first-generation college students on your campus. Does this program work? Are first-generation students who participate in the program more likely to graduate than those who do not? These are the types of questions addressed by evaluation research. There are two types of research within this broader frame; however, one more action-oriented than the next. In summative evaluation , an overall judgment about the effectiveness of a program or policy is made. Should we continue our first-gen program? Is it a good model for other campuses? Because the purpose of such summative evaluation is to measure success and to determine whether this success is scalable (capable of being generalized beyond the specific case), quantitative data is more often used than qualitative data. In our example, we might have “outcomes” data for thousands of students, and we might run various tests to determine if the better outcomes of those in the program are statistically significant so that we can generalize the findings and recommend similar programs elsewhere. Qualitative data in the form of focus groups or interviews can then be used for illustrative purposes, providing more depth to the quantitative analyses. In contrast, formative evaluation attempts to improve a program or policy (to help “form” or shape its effectiveness). Formative evaluations rely more heavily on qualitative data—case studies, interviews, focus groups. The findings are meant not to generalize beyond the particular but to improve this program. If you are a student seeking to improve your qualitative research skills and you do not care about generating basic research, formative evaluation studies might be an attractive option for you to pursue, as there are always local programs that need evaluation and suggestions for improvement. Again, be very clear about your purpose when talking through your research proposal with your committee.
Action research takes a further step beyond evaluation, even formative evaluation, to being part of the solution itself. This is about as far from basic research as one could get and definitely falls beyond the scope of “science,” as conventionally defined. The distinction between action and research is blurry, the research methods are often in constant flux, and the only “findings” are specific to the problem or case at hand and often are findings about the process of intervention itself. Rather than evaluate a program as a whole, action research often seeks to change and improve some particular aspect that may not be working—maybe there is not enough diversity in an organization or maybe women’s voices are muted during meetings and the organization wonders why and would like to change this. In a further step, participatory action research , those women would become part of the research team, attempting to amplify their voices in the organization through participation in the action research. As action research employs methods that involve people in the process, focus groups are quite common.
If you are working on a thesis or dissertation, chances are your committee will expect you to be contributing to fundamental knowledge and theory ( basic research ). If your interests lie more toward the action end of the continuum, however, it is helpful to talk to your committee about this before you get started. Knowing your purpose in advance will help avoid misunderstandings during the later stages of the research process!
The Research Question
Once you have written your paragraph and clarified your purpose and truly know that this study is the best study for you to be doing right now , you are ready to write and refine your actual research question. Know that research questions are often moving targets in qualitative research, that they can be refined up to the very end of data collection and analysis. But you do have to have a working research question at all stages. This is your “anchor” when you get lost in the data. What are you addressing? What are you looking at and why? Your research question guides you through the thicket. It is common to have a whole host of questions about a phenomenon or case, both at the outset and throughout the study, but you should be able to pare it down to no more than two or three sentences when asked. These sentences should both clarify the intent of the research and explain why this is an important question to answer. More on refining your research question can be found in chapter 4.
Chances are, you will have already done some prior reading before coming up with your interest and your questions, but you may not have conducted a systematic literature review. This is the next crucial stage to be completed before venturing further. You don’t want to start collecting data and then realize that someone has already beaten you to the punch. A review of the literature that is already out there will let you know (1) if others have already done the study you are envisioning; (2) if others have done similar studies, which can help you out; and (3) what ideas or concepts are out there that can help you frame your study and make sense of your findings. More on literature reviews can be found in chapter 9.
In addition to reviewing the literature for similar studies to what you are proposing, it can be extremely helpful to find a study that inspires you. This may have absolutely nothing to do with the topic you are interested in but is written so beautifully or organized so interestingly or otherwise speaks to you in such a way that you want to post it somewhere to remind you of what you want to be doing. You might not understand this in the early stages—why would you find a study that has nothing to do with the one you are doing helpful? But trust me, when you are deep into analysis and writing, having an inspirational model in view can help you push through. If you are motivated to do something that might change the world, you probably have read something somewhere that inspired you. Go back to that original inspiration and read it carefully and see how they managed to convey the passion that you so appreciate.
At this stage, you are still just getting started. There are a lot of things to do before setting forth to collect data! You’ll want to consider and choose a research tradition and a set of data-collection techniques that both help you answer your research question and match all your aims and goals. For example, if you really want to help migrant workers speak for themselves, you might draw on feminist theory and participatory action research models. Chapters 3 and 4 will provide you with more information on epistemologies and approaches.
Next, you have to clarify your “units of analysis.” What is the level at which you are focusing your study? Often, the unit in qualitative research methods is individual people, or “human subjects.” But your units of analysis could just as well be organizations (colleges, hospitals) or programs or even whole nations. Think about what it is you want to be saying at the end of your study—are the insights you are hoping to make about people or about organizations or about something else entirely? A unit of analysis can even be a historical period! Every unit of analysis will call for a different kind of data collection and analysis and will produce different kinds of “findings” at the conclusion of your study. [2]
Regardless of what unit of analysis you select, you will probably have to consider the “human subjects” involved in your research. [3] Who are they? What interactions will you have with them—that is, what kind of data will you be collecting? Before answering these questions, define your population of interest and your research setting. Use your research question to help guide you.
Let’s use an example from a real study. In Geographies of Campus Inequality , Benson and Lee ( 2020 ) list three related research questions: “(1) What are the different ways that first-generation students organize their social, extracurricular, and academic activities at selective and highly selective colleges? (2) how do first-generation students sort themselves and get sorted into these different types of campus lives; and (3) how do these different patterns of campus engagement prepare first-generation students for their post-college lives?” (3).
Note that we are jumping into this a bit late, after Benson and Lee have described previous studies (the literature review) and what is known about first-generation college students and what is not known. They want to know about differences within this group, and they are interested in ones attending certain kinds of colleges because those colleges will be sites where academic and extracurricular pressures compete. That is the context for their three related research questions. What is the population of interest here? First-generation college students . What is the research setting? Selective and highly selective colleges . But a host of questions remain. Which students in the real world, which colleges? What about gender, race, and other identity markers? Will the students be asked questions? Are the students still in college, or will they be asked about what college was like for them? Will they be observed? Will they be shadowed? Will they be surveyed? Will they be asked to keep diaries of their time in college? How many students? How many colleges? For how long will they be observed?
Recommendation
Take a moment and write down suggestions for Benson and Lee before continuing on to what they actually did.
Have you written down your own suggestions? Good. Now let’s compare those with what they actually did. Benson and Lee drew on two sources of data: in-depth interviews with sixty-four first-generation students and survey data from a preexisting national survey of students at twenty-eight selective colleges. Let’s ignore the survey for our purposes here and focus on those interviews. The interviews were conducted between 2014 and 2016 at a single selective college, “Hilltop” (a pseudonym ). They employed a “purposive” sampling strategy to ensure an equal number of male-identifying and female-identifying students as well as equal numbers of White, Black, and Latinx students. Each student was interviewed once. Hilltop is a selective liberal arts college in the northeast that enrolls about three thousand students.
How did your suggestions match up to those actually used by the researchers in this study? It is possible your suggestions were too ambitious? Beginning qualitative researchers can often make that mistake. You want a research design that is both effective (it matches your question and goals) and doable. You will never be able to collect data from your entire population of interest (unless your research question is really so narrow to be relevant to very few people!), so you will need to come up with a good sample. Define the criteria for this sample, as Benson and Lee did when deciding to interview an equal number of students by gender and race categories. Define the criteria for your sample setting too. Hilltop is typical for selective colleges. That was a research choice made by Benson and Lee. For more on sampling and sampling choices, see chapter 5.
Benson and Lee chose to employ interviews. If you also would like to include interviews, you have to think about what will be asked in them. Most interview-based research involves an interview guide, a set of questions or question areas that will be asked of each participant. The research question helps you create a relevant interview guide. You want to ask questions whose answers will provide insight into your research question. Again, your research question is the anchor you will continually come back to as you plan for and conduct your study. It may be that once you begin interviewing, you find that people are telling you something totally unexpected, and this makes you rethink your research question. That is fine. Then you have a new anchor. But you always have an anchor. More on interviewing can be found in chapter 11.
Let’s imagine Benson and Lee also observed college students as they went about doing the things college students do, both in the classroom and in the clubs and social activities in which they participate. They would have needed a plan for this. Would they sit in on classes? Which ones and how many? Would they attend club meetings and sports events? Which ones and how many? Would they participate themselves? How would they record their observations? More on observation techniques can be found in both chapters 13 and 14.
At this point, the design is almost complete. You know why you are doing this study, you have a clear research question to guide you, you have identified your population of interest and research setting, and you have a reasonable sample of each. You also have put together a plan for data collection, which might include drafting an interview guide or making plans for observations. And so you know exactly what you will be doing for the next several months (or years!). To put the project into action, there are a few more things necessary before actually going into the field.
First, you will need to make sure you have any necessary supplies, including recording technology. These days, many researchers use their phones to record interviews. Second, you will need to draft a few documents for your participants. These include informed consent forms and recruiting materials, such as posters or email texts, that explain what this study is in clear language. Third, you will draft a research protocol to submit to your institutional review board (IRB) ; this research protocol will include the interview guide (if you are using one), the consent form template, and all examples of recruiting material. Depending on your institution and the details of your study design, it may take weeks or even, in some unfortunate cases, months before you secure IRB approval. Make sure you plan on this time in your project timeline. While you wait, you can continue to review the literature and possibly begin drafting a section on the literature review for your eventual presentation/publication. More on IRB procedures can be found in chapter 8 and more general ethical considerations in chapter 7.
Once you have approval, you can begin!
Research Design Checklist
Before data collection begins, do the following:
- Write a paragraph explaining your aims and goals (personal/political, practical/strategic, professional/academic).
- Define your research question; write two to three sentences that clarify the intent of the research and why this is an important question to answer.
- Review the literature for similar studies that address your research question or similar research questions; think laterally about some literature that might be helpful or illuminating but is not exactly about the same topic.
- Find a written study that inspires you—it may or may not be on the research question you have chosen.
- Consider and choose a research tradition and set of data-collection techniques that (1) help answer your research question and (2) match your aims and goals.
- Define your population of interest and your research setting.
- Define the criteria for your sample (How many? Why these? How will you find them, gain access, and acquire consent?).
- If you are conducting interviews, draft an interview guide.
- If you are making observations, create a plan for observations (sites, times, recording, access).
- Acquire any necessary technology (recording devices/software).
- Draft consent forms that clearly identify the research focus and selection process.
- Create recruiting materials (posters, email, texts).
- Apply for IRB approval (proposal plus consent form plus recruiting materials).
- Block out time for collecting data.
- At the end of the chapter, you will find a " Research Design Checklist " that summarizes the main recommendations made here ↵
- For example, if your focus is society and culture , you might collect data through observation or a case study. If your focus is individual lived experience , you are probably going to be interviewing some people. And if your focus is language and communication , you will probably be analyzing text (written or visual). ( Marshall and Rossman 2016:16 ). ↵
- You may not have any "live" human subjects. There are qualitative research methods that do not require interactions with live human beings - see chapter 16 , "Archival and Historical Sources." But for the most part, you are probably reading this textbook because you are interested in doing research with people. The rest of the chapter will assume this is the case. ↵
One of the primary methodological traditions of inquiry in qualitative research, ethnography is the study of a group or group culture, largely through observational fieldwork supplemented by interviews. It is a form of fieldwork that may include participant-observation data collection. See chapter 14 for a discussion of deep ethnography.
A methodological tradition of inquiry and research design that focuses on an individual case (e.g., setting, institution, or sometimes an individual) in order to explore its complexity, history, and interactive parts. As an approach, it is particularly useful for obtaining a deep appreciation of an issue, event, or phenomenon of interest in its particular context.
The controlling force in research; can be understood as lying on a continuum from basic research (knowledge production) to action research (effecting change).
In its most basic sense, a theory is a story we tell about how the world works that can be tested with empirical evidence. In qualitative research, we use the term in a variety of ways, many of which are different from how they are used by quantitative researchers. Although some qualitative research can be described as “testing theory,” it is more common to “build theory” from the data using inductive reasoning , as done in Grounded Theory . There are so-called “grand theories” that seek to integrate a whole series of findings and stories into an overarching paradigm about how the world works, and much smaller theories or concepts about particular processes and relationships. Theory can even be used to explain particular methodological perspectives or approaches, as in Institutional Ethnography , which is both a way of doing research and a theory about how the world works.
Research that is interested in generating and testing hypotheses about how the world works.
A methodological tradition of inquiry and approach to analyzing qualitative data in which theories emerge from a rigorous and systematic process of induction. This approach was pioneered by the sociologists Glaser and Strauss (1967). The elements of theory generated from comparative analysis of data are, first, conceptual categories and their properties and, second, hypotheses or generalized relations among the categories and their properties – “The constant comparing of many groups draws the [researcher’s] attention to their many similarities and differences. Considering these leads [the researcher] to generate abstract categories and their properties, which, since they emerge from the data, will clearly be important to a theory explaining the kind of behavior under observation.” (36).
An approach to research that is “multimethod in focus, involving an interpretative, naturalistic approach to its subject matter. This means that qualitative researchers study things in their natural settings, attempting to make sense of, or interpret, phenomena in terms of the meanings people bring to them. Qualitative research involves the studied use and collection of a variety of empirical materials – case study, personal experience, introspective, life story, interview, observational, historical, interactional, and visual texts – that describe routine and problematic moments and meanings in individuals’ lives." ( Denzin and Lincoln 2005:2 ). Contrast with quantitative research .
Research that contributes knowledge that will help people to understand the nature of a problem in order to intervene, thereby allowing human beings to more effectively control their environment.
Research that is designed to evaluate or test the effectiveness of specific solutions and programs addressing specific social problems. There are two kinds: summative and formative .
Research in which an overall judgment about the effectiveness of a program or policy is made, often for the purpose of generalizing to other cases or programs. Generally uses qualitative research as a supplement to primary quantitative data analyses. Contrast formative evaluation research .
Research designed to improve a program or policy (to help “form” or shape its effectiveness); relies heavily on qualitative research methods. Contrast summative evaluation research
Research carried out at a particular organizational or community site with the intention of affecting change; often involves research subjects as participants of the study. See also participatory action research .
Research in which both researchers and participants work together to understand a problematic situation and change it for the better.
The level of the focus of analysis (e.g., individual people, organizations, programs, neighborhoods).
The large group of interest to the researcher. Although it will likely be impossible to design a study that incorporates or reaches all members of the population of interest, this should be clearly defined at the outset of a study so that a reasonable sample of the population can be taken. For example, if one is studying working-class college students, the sample may include twenty such students attending a particular college, while the population is “working-class college students.” In quantitative research, clearly defining the general population of interest is a necessary step in generalizing results from a sample. In qualitative research, defining the population is conceptually important for clarity.
A fictional name assigned to give anonymity to a person, group, or place. Pseudonyms are important ways of protecting the identity of research participants while still providing a “human element” in the presentation of qualitative data. There are ethical considerations to be made in selecting pseudonyms; some researchers allow research participants to choose their own.
A requirement for research involving human participants; the documentation of informed consent. In some cases, oral consent or assent may be sufficient, but the default standard is a single-page easy-to-understand form that both the researcher and the participant sign and date. Under federal guidelines, all researchers "shall seek such consent only under circumstances that provide the prospective subject or the representative sufficient opportunity to consider whether or not to participate and that minimize the possibility of coercion or undue influence. The information that is given to the subject or the representative shall be in language understandable to the subject or the representative. No informed consent, whether oral or written, may include any exculpatory language through which the subject or the representative is made to waive or appear to waive any of the subject's rights or releases or appears to release the investigator, the sponsor, the institution, or its agents from liability for negligence" (21 CFR 50.20). Your IRB office will be able to provide a template for use in your study .
An administrative body established to protect the rights and welfare of human research subjects recruited to participate in research activities conducted under the auspices of the institution with which it is affiliated. The IRB is charged with the responsibility of reviewing all research involving human participants. The IRB is concerned with protecting the welfare, rights, and privacy of human subjects. The IRB has the authority to approve, disapprove, monitor, and require modifications in all research activities that fall within its jurisdiction as specified by both the federal regulations and institutional policy.
Introduction to Qualitative Research Methods Copyright © 2023 by Allison Hurst is licensed under a Creative Commons Attribution-ShareAlike 4.0 International License , except where otherwise noted.
IMAGES
VIDEO
COMMENTS
for Quantitative Research CHAPTER2 Learning Objectives After reading this chapter, you will be able to do the following: 1. Define basic terms for quantitative research. 2. Describe the research circle. 3. Identify the four major goals of social research. 4. Write a checklist of the W's. 5. Understand the reasons for both reporting and ...
Chapter 2 Introduction. Chapter 2. Introduction. Maybe you have already gained some experience in doing research, for example in your bachelor studies, or as part of your work. The challenge in conducting academic research at masters level, is that it is multi-faceted. The types of activities are: Writing up and presenting your findings.
INTRODUCTION. Scientific research is usually initiated by posing evidenced-based research questions which are then explicitly restated as hypotheses.1,2 The hypotheses provide directions to guide the study, solutions, explanations, and expected results.3,4 Both research questions and hypotheses are essentially formulated based on conventional theories and real-world processes, which allow the ...
The five major steps in any typical applied and quantitative economic research process are as follows: 1. Statement of Research Problem 2. Survey of Related Literature 3. Theoretical Model: Formulation of Hypothesis 4. Analysis of Data: Testing of Hypothesis 5. Write-up of Research Report. 2.1 Statement of Research Problem "A problem well put ...
Two explanations for the observed outcomes are possible: (1) The intervention was effective in educating diabetics or (2) the mean difference in this sample was due to chance (sampling error). In the first explanation of an effective educational program, that is considered the research hypothesis.
Chapter 2. Overview of Semester-Long EBP Project. III. Chapter 3. ... Part of the final steps of any research project is to disseminate (AKA: share) the findings. This may be in a published article, conference, poster session, etc. ... Now that you have a better idea of quantitative research methodology, you should be able to discern variables ...
This chapter considers the overall model of quantitative research, its main steps, its main principles and goals, and also its criticisms. It shows that quantitative research is only one possible approach to studying social world, with its own preoccupations, advantages and disadvantages. The Main Steps in Quantitative Research.
Revised on June 22, 2023. Quantitative research is the process of collecting and analyzing numerical data. It can be used to find patterns and averages, make predictions, test causal relationships, and generalize results to wider populations. Quantitative research is the opposite of qualitative research, which involves collecting and analyzing ...
The specificity of quantitative research lies in the next part of the defini-tion. In quantitative research we collect numerical data. This is closely connected to the final part of the definition: analysis using mathematically Chapter 1 Introduction to quantitative research 1 9079 Chapter 01 (1-12) 1/4/04 1:18 PM Page 1
research designs used in each of these approaches will be reviewed. Finally, this chapter will conclude with examples of published quantitative and qualitative research in medical imaging and radiation therapy. 2.1 What Is Quantitative Research? Quantitative research makes use of the scientic method (Chap. 1) through the application of a dened ...
This chapter begins the exploration of quantitative studies in detail. Chapters 6 through 13 address the design of studies, along with how to develop measurement procedures to collect data and how subsequently to analyze the data collected. The methods introduced relate directly to the comparison-based, objectives-based, and decision-facilitation approaches to evaluation described in Chap. 2.
NS674 Hoare Z, Hoe J (2012) Understanding quantitative research: part 2. Nursing Standard. 2 7, 18, 48 -55. Date of submission: July 1 2011; date of acceptance: March 2 2012. Abstract. This ...
This chapter is our introduction to the three major research methodology paradigms. A paradigm is a perspective based on a set of assumptions, concepts, and values that are held and practiced by a community of researchers. For the most of the 20th century the quantitative paradigm was dominant. During the 1980s, the qualitative paradigm came of ...
In part 2 of this chapter, we discussed how p-levels represent statistical "significance," or the probability of finding a "significant" answer only by chance, when no such relationship between variables actually exists in a particular subject population. ... As noted in Part 1 of this chapter, in quantitative research, you will often hear ...
These parts can also be used as a checklist when working through the steps of your study. Specifically, part 1 focuses on planning a quantitative study (collecting data), part two explains the steps involved in doing a quantitative study, and part three discusses how to make sense of your results (organizing and analyzing data). Research Methods.
This chapter is our introduction to the three research methodology paradigms. A paradigm is a perspective based on a set of assumptions, concepts, and values that are held by a community or researchers. For the most of the 20th century the quantitative paradigm was dominant. During the 1980s, the qualitative paradigm came of age as an ...
the problem and its background chapter 1 -brief overview / background of the study - use an introductory sentences/paragraph that will catch the attention of the readers -introduces the topic specifically the variables of the study -includes most important study or related literature -discuss the research gap/reason & main purpose in conducting the study -ideally 500 to 1000 words & in present ...
quantitative research process. Involves conceptualizing a research project, planning and implementing that project, and communicating the findings. quasi-experimental research. Examines causal relationships or determines the effect of one variable on another. reading a research report.
Chapter Two: Understanding the distinctions among research methods. Chapter Three: Ethical research, writing, and creative work. Chapter Four: Quantitative Methods. Chapter Four: Quantitative Methods (Part 1) Chapter Five: Qualitative Methods. Chapter Six: Critical / Rhetorical Methods. Chapter Seven: Presenting Your Results.
variety of settings, including in the classroom, at home via the Internet, while commuting or as part of a work-study program. Mode refers to the way that content is delivered by technology, typically through blended learning, fully online courses or technology- enhanced experience. ... Chapter 2- Quantitative research study about readiness of ...
outline a 7-part process, as well as a set of tools for schools to use to create authentically inclusive schools. W endelborg, Christian; T ossebro, Jan (2011) conducted a study on Educational
Chapter 2. Research Design Getting Started. ... If this is also part of your motivation, you will want to design your research project in a way that might have an impact on how people behave in the future. There are many ways to do this, one of which is using qualitative research methods rather than quantitative research methods, as the ...
CHAPTER 2 METHOD. Research Design. The researchers used the quantitative descriptive research design in doing the research study. The goal of the study is to know the impacts of discrimaination of grade 12 STEM students' social and mental health in Agusan National High School.