
Statistics Made Easy

What is a Directional Hypothesis? (Definition & Examples)
A statistical hypothesis is an assumption about a population parameter . For example, we may assume that the mean height of a male in the U.S. is 70 inches.
The assumption about the height is the statistical hypothesis and the true mean height of a male in the U.S. is the population parameter .
To test whether a statistical hypothesis about a population parameter is true, we obtain a random sample from the population and perform a hypothesis test on the sample data.
Whenever we perform a hypothesis test, we always write down a null and alternative hypothesis:
- Null Hypothesis (H 0 ): The sample data occurs purely from chance.
- Alternative Hypothesis (H A ): The sample data is influenced by some non-random cause.
A hypothesis test can either contain a directional hypothesis or a non-directional hypothesis:
- Directional hypothesis: The alternative hypothesis contains the less than (“<“) or greater than (“>”) sign. This indicates that we’re testing whether or not there is a positive or negative effect.
- Non-directional hypothesis: The alternative hypothesis contains the not equal (“≠”) sign. This indicates that we’re testing whether or not there is some effect, without specifying the direction of the effect.
Note that directional hypothesis tests are also called “one-tailed” tests and non-directional hypothesis tests are also called “two-tailed” tests.
Check out the following examples to gain a better understanding of directional vs. non-directional hypothesis tests.
Example 1: Baseball Programs
A baseball coach believes a certain 4-week program will increase the mean hitting percentage of his players, which is currently 0.285.
To test this, he measures the hitting percentage of each of his players before and after participating in the program.
He then performs a hypothesis test using the following hypotheses:
- H 0 : μ = .285 (the program will have no effect on the mean hitting percentage)
- H A : μ > .285 (the program will cause mean hitting percentage to increase)
This is an example of a directional hypothesis because the alternative hypothesis contains the greater than “>” sign. The coach believes that the program will influence the mean hitting percentage of his players in a positive direction.
Example 2: Plant Growth
A biologist believes that a certain pesticide will cause plants to grow less during a one-month period than they normally do, which is currently 10 inches.
To test this, she applies the pesticide to each of the plants in her laboratory for one month.
She then performs a hypothesis test using the following hypotheses:
- H 0 : μ = 10 inches (the pesticide will have no effect on the mean plant growth)
- H A : μ < 10 inches (the pesticide will cause mean plant growth to decrease)
This is also an example of a directional hypothesis because the alternative hypothesis contains the less than “<” sign. The biologist believes that the pesticide will influence the mean plant growth in a negative direction.
Example 3: Studying Technique
A professor believes that a certain studying technique will influence the mean score that her students receive on a certain exam, but she’s unsure if it will increase or decrease the mean score, which is currently 82.
To test this, she lets each student use the studying technique for one month leading up to the exam and then administers the same exam to each of the students.
- H 0 : μ = 82 (the studying technique will have no effect on the mean exam score)
- H A : μ ≠ 82 (the studying technique will cause the mean exam score to be different than 82)
This is an example of a non-directional hypothesis because the alternative hypothesis contains the not equal “≠” sign. The professor believes that the studying technique will influence the mean exam score, but doesn’t specify whether it will cause the mean score to increase or decrease.
Additional Resources
Introduction to Hypothesis Testing Introduction to the One Sample t-test Introduction to the Two Sample t-test Introduction to the Paired Samples t-test
Featured Posts

Hey there. My name is Zach Bobbitt. I have a Masters of Science degree in Applied Statistics and I’ve worked on machine learning algorithms for professional businesses in both healthcare and retail. I’m passionate about statistics, machine learning, and data visualization and I created Statology to be a resource for both students and teachers alike. My goal with this site is to help you learn statistics through using simple terms, plenty of real-world examples, and helpful illustrations.
Leave a Reply Cancel reply
Your email address will not be published. Required fields are marked *
Directional Hypothesis: Definition and 10 Examples

A directional hypothesis refers to a type of hypothesis used in statistical testing that predicts a particular direction of the expected relationship between two variables.
In simpler terms, a directional hypothesis is an educated, specific guess about the direction of an outcome—whether an increase, decrease, or a proclaimed difference in variable sets.
For example, in a study investigating the effects of sleep deprivation on cognitive performance, a directional hypothesis might state that as sleep deprivation (Independent Variable) increases, cognitive performance (Dependent Variable) decreases (Killgore, 2010). Such a hypothesis offers a clear, directional relationship whereby a specific increase or decrease is anticipated.
Global warming provides another notable example of a directional hypothesis. A researcher might hypothesize that as carbon dioxide (CO2) levels increase, global temperatures also increase (Thompson, 2010). In this instance, the hypothesis clearly articulates an upward trend for both variables.
In any given circumstance, it’s imperative that a directional hypothesis is grounded on solid evidence. For instance, the CO2 and global temperature relationship is based on substantial scientific evidence, and not on a random guess or mere speculation (Florides & Christodoulides, 2009).
Directional vs Non-Directional vs Null Hypotheses
A directional hypothesis is generally contrasted to a non-directional hypothesis. Here’s how they compare:
- Directional hypothesis: A directional hypothesis provides a perspective of the expected relationship between variables, predicting the direction of that relationship (either positive, negative, or a specific difference).
- Non-directional hypothesis: A non-directional hypothesis denotes the possibility of a relationship between two variables ( the independent and dependent variables ), although this hypothesis does not venture a prediction as to the direction of this relationship (Ali & Bhaskar, 2016). For example, a non-directional hypothesis might state that there exists a relationship between a person’s diet (independent variable) and their mood (dependent variable), without indicating whether improvement in diet enhances mood positively or negatively. Overall, the choice between a directional or non-directional hypothesis depends on the known or anticipated link between the variables under consideration in research studies.
Another very important type of hypothesis that we need to know about is a null hypothesis :
- Null hypothesis : The null hypothesis stands as a universality—the hypothesis that there is no observed effect in the population under study, meaning there is no association between variables (or that the differences are down to chance). For instance, a null hypothesis could be constructed around the idea that changing diet (independent variable) has no discernible effect on a person’s mood (dependent variable) (Yan & Su, 2016). This proposition is the one that we aim to disprove in an experiment.
While directional and non-directional hypotheses involve some integrated expectations about the outcomes (either distinct direction or a vague relationship), a null hypothesis operates on the premise of negating such relationships or effects.
The null hypotheses is typically proposed to be negated or disproved by statistical tests, paving way for the acceptance of an alternate hypothesis (either directional or non-directional).
Directional Hypothesis Examples
1. exercise and heart health.
Research suggests that as regular physical exercise (independent variable) increases, the risk of heart disease (dependent variable) decreases (Jakicic, Davis, Rogers, King, Marcus, Helsel, Rickman, Wahed, Belle, 2016). In this example, a directional hypothesis anticipates that the more individuals maintain routine workouts, the lesser would be their odds of developing heart-related disorders. This assumption is based on the underlying fact that routine exercise can help reduce harmful cholesterol levels, regulate blood pressure, and bring about overall health benefits. Thus, a direction – a decrease in heart disease – is expected in relation with an increase in exercise.
2. Screen Time and Sleep Quality
Another classic instance of a directional hypothesis can be seen in the relationship between the independent variable, screen time (especially before bed), and the dependent variable, sleep quality. This hypothesis predicts that as screen time before bed increases, sleep quality decreases (Chang, Aeschbach, Duffy, Czeisler, 2015). The reasoning behind this hypothesis is the disruptive effect of artificial light (especially blue light from screens) on melatonin production, a hormone needed to regulate sleep. As individuals spend more time exposed to screens before bed, it is predictably hypothesized that their sleep quality worsens.
3. Job Satisfaction and Employee Turnover
A typical scenario in organizational behavior research posits that as job satisfaction (independent variable) increases, the rate of employee turnover (dependent variable) decreases (Cheng, Jiang, & Riley, 2017). This directional hypothesis emphasizes that an increased level of job satisfaction would lead to a reduced rate of employees leaving the company. The theoretical basis for this hypothesis is that satisfied employees often tend to be more committed to the organization and are less likely to seek employment elsewhere, thus reducing turnover rates.
4. Healthy Eating and Body Weight
Healthy eating, as the independent variable, is commonly thought to influence body weight, the dependent variable, in a positive way. For example, the hypothesis might state that as consumption of healthy foods increases, an individual’s body weight decreases (Framson, Kristal, Schenk, Littman, Zeliadt, & Benitez, 2009). This projection is based on the premise that healthier foods, such as fruits and vegetables, are generally lower in calories than junk food, assisting in weight management.
5. Sun Exposure and Skin Health
The association between sun exposure (independent variable) and skin health (dependent variable) allows for a definitive hypothesis declaring that as sun exposure increases, the risk of skin damage or skin cancer increases (Whiteman, Whiteman, & Green, 2001). The premise aligns with the understanding that overexposure to the sun’s ultraviolet rays can deteriorate skin health, leading to conditions like sunburn or, in extreme cases, skin cancer.
6. Study Hours and Academic Performance
A regularly assessed relationship in academia suggests that as the number of study hours (independent variable) rises, so too does academic performance (dependent variable) (Nonis, Hudson, Logan, Ford, 2013). The hypothesis proposes a positive correlation , with an increase in study time expected to contribute to enhanced academic outcomes.
7. Screen Time and Eye Strain
It’s commonly hypothesized that as screen time (independent variable) increases, the likelihood of experiencing eye strain (dependent variable) also increases (Sheppard & Wolffsohn, 2018). This is based on the idea that prolonged engagement with digital screens—computers, tablets, or mobile phones—can cause discomfort or fatigue in the eyes, attributing to symptoms of eye strain.
8. Physical Activity and Stress Levels
In the sphere of mental health, it’s often proposed that as physical activity (independent variable) increases, levels of stress (dependent variable) decrease (Stonerock, Hoffman, Smith, Blumenthal, 2015). Regular exercise is known to stimulate the production of endorphins, the body’s natural mood elevators, helping to alleviate stress.
9. Water Consumption and Kidney Health
A common health-related hypothesis might predict that as water consumption (independent variable) increases, the risk of kidney stones (dependent variable) decreases (Curhan, Willett, Knight, & Stampfer, 2004). Here, an increase in water intake is inferred to reduce the risk of kidney stones by diluting the substances that lead to stone formation.
10. Traffic Noise and Sleep Quality
In urban planning research, it’s often supposed that as traffic noise (independent variable) increases, sleep quality (dependent variable) decreases (Muzet, 2007). Increased noise levels, particularly during the night, can result in sleep disruptions, thus, leading to poor sleep quality.
11. Sugar Consumption and Dental Health
In the field of dental health, an example might be stating as one’s sugar consumption (independent variable) increases, dental health (dependent variable) decreases (Sheiham, & James, 2014). This stems from the fact that sugar is a major factor in tooth decay, and increased consumption of sugary foods or drinks leads to a decline in dental health due to the high likelihood of cavities.
See 15 More Examples of Hypotheses Here
A directional hypothesis plays a critical role in research, paving the way for specific predicted outcomes based on the relationship between two variables. These hypotheses clearly illuminate the expected direction—the increase or decrease—of an effect. From predicting the impacts of healthy eating on body weight to forecasting the influence of screen time on sleep quality, directional hypotheses allow for targeted and strategic examination of phenomena. In essence, directional hypotheses provide the crucial path for inquiry, shaping the trajectory of research studies and ultimately aiding in the generation of insightful, relevant findings.
Ali, S., & Bhaskar, S. (2016). Basic statistical tools in research and data analysis. Indian Journal of Anaesthesia, 60 (9), 662-669. doi: https://doi.org/10.4103%2F0019-5049.190623
Chang, A. M., Aeschbach, D., Duffy, J. F., & Czeisler, C. A. (2015). Evening use of light-emitting eReaders negatively affects sleep, circadian timing, and next-morning alertness. Proceeding of the National Academy of Sciences, 112 (4), 1232-1237. doi: https://doi.org/10.1073/pnas.1418490112
Cheng, G. H. L., Jiang, D., & Riley, J. H. (2017). Organizational commitment and intrinsic motivation of regular and contractual primary school teachers in China. New Psychology, 19 (3), 316-326. Doi: https://doi.org/10.4103%2F2249-4863.184631
Curhan, G. C., Willett, W. C., Knight, E. L., & Stampfer, M. J. (2004). Dietary factors and the risk of incident kidney stones in younger women: Nurses’ Health Study II. Archives of Internal Medicine, 164 (8), 885–891.
Florides, G. A., & Christodoulides, P. (2009). Global warming and carbon dioxide through sciences. Environment international , 35 (2), 390-401. doi: https://doi.org/10.1016/j.envint.2008.07.007
Framson, C., Kristal, A. R., Schenk, J. M., Littman, A. J., Zeliadt, S., & Benitez, D. (2009). Development and validation of the mindful eating questionnaire. Journal of the American Dietetic Association, 109 (8), 1439-1444. doi: https://doi.org/10.1016/j.jada.2009.05.006
Jakicic, J. M., Davis, K. K., Rogers, R. J., King, W. C., Marcus, M. D., Helsel, D., … & Belle, S. H. (2016). Effect of wearable technology combined with a lifestyle intervention on long-term weight loss: The IDEA randomized clinical trial. JAMA, 316 (11), 1161-1171.
Khan, S., & Iqbal, N. (2013). Study of the relationship between study habits and academic achievement of students: A case of SPSS model. Higher Education Studies, 3 (1), 14-26.
Killgore, W. D. (2010). Effects of sleep deprivation on cognition. Progress in brain research , 185 , 105-129. doi: https://doi.org/10.1016/B978-0-444-53702-7.00007-5
Marczinski, C. A., & Fillmore, M. T. (2014). Dissociative antagonistic effects of caffeine on alcohol-induced impairment of behavioral control. Experimental and Clinical Psychopharmacology, 22 (4), 298–311. doi: https://psycnet.apa.org/doi/10.1037/1064-1297.11.3.228
Muzet, A. (2007). Environmental Noise, Sleep and Health. Sleep Medicine Reviews, 11 (2), 135-142. doi: https://doi.org/10.1016/j.smrv.2006.09.001
Nonis, S. A., Hudson, G. I., Logan, L. B., & Ford, C. W. (2013). Influence of perceived control over time on college students’ stress and stress-related outcomes. Research in Higher Education, 54 (5), 536-552. doi: https://doi.org/10.1023/A:1018753706925
Sheiham, A., & James, W. P. (2014). A new understanding of the relationship between sugars, dental caries and fluoride use: implications for limits on sugars consumption. Public health nutrition, 17 (10), 2176-2184. Doi: https://doi.org/10.1017/S136898001400113X
Sheppard, A. L., & Wolffsohn, J. S. (2018). Digital eye strain: prevalence, measurement and amelioration. BMJ open ophthalmology , 3 (1), e000146. doi: http://dx.doi.org/10.1136/bmjophth-2018-000146
Stonerock, G. L., Hoffman, B. M., Smith, P. J., & Blumenthal, J. A. (2015). Exercise as Treatment for Anxiety: Systematic Review and Analysis. Annals of Behavioral Medicine, 49 (4), 542–556. doi: https://doi.org/10.1007/s12160-014-9685-9
Thompson, L. G. (2010). Climate change: The evidence and our options. The Behavior Analyst , 33 , 153-170. Doi: https://doi.org/10.1007/BF03392211
Whiteman, D. C., Whiteman, C. A., & Green, A. C. (2001). Childhood sun exposure as a risk factor for melanoma: a systematic review of epidemiologic studies. Cancer Causes & Control, 12 (1), 69-82. doi: https://doi.org/10.1023/A:1008980919928
Yan, X., & Su, X. (2009). Linear regression analysis: theory and computing . New Jersey: World Scientific.

Chris Drew (PhD)
Dr. Chris Drew is the founder of the Helpful Professor. He holds a PhD in education and has published over 20 articles in scholarly journals. He is the former editor of the Journal of Learning Development in Higher Education. [Image Descriptor: Photo of Chris]
- Chris Drew (PhD) https://helpfulprofessor.com/author/chris-drew-phd/ 5 Top Tips for Succeeding at University
- Chris Drew (PhD) https://helpfulprofessor.com/author/chris-drew-phd/ 50 Durable Goods Examples
- Chris Drew (PhD) https://helpfulprofessor.com/author/chris-drew-phd/ 100 Consumer Goods Examples
- Chris Drew (PhD) https://helpfulprofessor.com/author/chris-drew-phd/ 30 Globalization Pros and Cons
Leave a Comment Cancel Reply
Your email address will not be published. Required fields are marked *
What is a Directional Hypothesis? (Definition & Examples)
Table of Contents
A directional hypothesis is a type of hypothesis that predicts the direction of the relationship between two variables. It states that there will be a specific and expected change in one variable based on the change in the other variable. This type of hypothesis is often used in experiments and research studies to make a clear prediction and guide the direction of the study. For example, “Increasing the amount of exercise will lead to a decrease in cholesterol levels” is a directional hypothesis as it predicts a specific direction of change in cholesterol levels based on the change in exercise. In contrast, a non-directional hypothesis would simply state that there is a relationship between exercise and cholesterol levels without specifying the direction of the relationship. Overall, a directional hypothesis helps researchers to make informed and focused conclusions about the relationship between variables.
A statistical hypothesis is an assumption about a . For example, we may assume that the mean height of a male in the U.S. is 70 inches.
The assumption about the height is the statistical hypothesis and the true mean height of a male in the U.S. is the population parameter .
To test whether a statistical hypothesis about a population parameter is true, we obtain a random sample from the population and perform a hypothesis test on the sample data.
Whenever we perform a hypothesis test, we always write down a null and alternative hypothesis:
- Null Hypothesis (H 0 ): The sample data occurs purely from chance.
- Alternative Hypothesis (H A ): The sample data is influenced by some non-random cause.
A hypothesis test can either contain a directional hypothesis or a non-directional hypothesis:
- Directional hypothesis: The alternative hypothesis contains the less than (“<“) or greater than (“>”) sign. This indicates that we’re testing whether or not there is a positive or negative effect.
- Non-directional hypothesis: The alternative hypothesis contains the not equal (“≠”) sign. This indicates that we’re testing whether or not there is some effect, without specifying the direction of the effect.
Note that directional hypothesis tests are also called “one-tailed” tests and non-directional hypothesis tests are also called “two-tailed” tests.
Check out the following examples to gain a better understanding of directional vs. non-directional hypothesis tests.
Example 1: Baseball Programs
A baseball coach believes a certain 4-week program will increase the mean hitting percentage of his players, which is currently 0.285.
To test this, he measures the hitting percentage of each of his players before and after participating in the program.
He then performs a hypothesis test using the following hypotheses:
- H 0 : μ = .285 (the program will have no effect on the mean hitting percentage)
- H A : μ > .285 (the program will cause mean hitting percentage to increase)
This is an example of a directional hypothesis because the alternative hypothesis contains the greater than “>” sign. The coach believes that the program will influence the mean hitting percentage of his players in a positive direction.
Example 2: Plant Growth
A biologist believes that a certain pesticide will cause plants to grow less during a one-month period than they normally do, which is currently 10 inches.
She then performs a hypothesis test using the following hypotheses:
- H 0 : μ = 10 inches (the pesticide will have no effect on the mean plant growth)
- H A : μ < 10 inches (the pesticide will cause mean plant growth to decrease)
This is also an example of a directional hypothesis because the alternative hypothesis contains the less than “<” sign. The biologist believes that the pesticide will influence the mean plant growth in a negative direction.
Example 3: Studying Technique
A professor believes that a certain studying technique will influence the mean score that her students receive on a certain exam, but she’s unsure if it will increase or decrease the mean score, which is currently 82.
To test this, she lets each student use the studying technique for one month leading up to the exam and then administers the same exam to each of the students.
- H 0 : μ = 82 (the studying technique will have no effect on the mean exam score)
- H A : μ ≠ 82 (the studying technique will cause the mean exam score to be different than 82)
This is an example of a non-directional hypothesis because the alternative hypothesis contains the not equal “≠” sign. The professor believes that the studying technique will influence the mean exam score, but doesn’t specify whether it will cause the mean score to increase or decrease.
Additional Resources
Related terms:.
- Directional Hypothesis
- What is a directional hypothesis?
- What are five examples of a null hypothesis?
- How to Perform Hypothesis Testing in Python (With Examples)
- How to Write Hypothesis Test Conclusions (With Examples)
- 4 Examples of Hypothesis Testing in Real Life?
- What is the definition of the Central Limit Theorem and can you provide some examples of its application?
- What is the definition of concomitant variable and what are some examples?
- What is the definition of omitted variable bias and what are some examples of it?
- What is Curvilinear Regression? (Definition & Examples)
Directional and non-directional hypothesis: A Comprehensive Guide
Karolina Konopka
Customer support manager

In the world of research and statistical analysis, hypotheses play a crucial role in formulating and testing scientific claims. Understanding the differences between directional and non-directional hypothesis is essential for designing sound experiments and drawing accurate conclusions. Whether you’re a student, researcher, or simply curious about the foundations of hypothesis testing, this guide will equip you with the knowledge and tools to navigate this fundamental aspect of scientific inquiry.
Understanding Directional Hypothesis
Understanding directional hypotheses is crucial for conducting hypothesis-driven research, as they guide the selection of appropriate statistical tests and aid in the interpretation of results. By incorporating directional hypotheses, researchers can make more precise predictions, contribute to scientific knowledge, and advance their fields of study.
Definition of directional hypothesis
Directional hypotheses, also known as one-tailed hypotheses, are statements in research that make specific predictions about the direction of a relationship or difference between variables. Unlike non-directional hypotheses, which simply state that there is a relationship or difference without specifying its direction, directional hypotheses provide a focused and precise expectation.
A directional hypothesis predicts either a positive or negative relationship between variables or predicts that one group will perform better than another. It asserts a specific direction of effect or outcome. For example, a directional hypothesis could state that “increased exposure to sunlight will lead to an improvement in mood” or “participants who receive the experimental treatment will exhibit higher levels of cognitive performance compared to the control group.”
Directional hypotheses are formulated based on existing theory, prior research, or logical reasoning, and they guide the researcher’s expectations and analysis. They allow for more targeted predictions and enable researchers to test specific hypotheses using appropriate statistical tests.
The role of directional hypothesis in research
Directional hypotheses also play a significant role in research surveys. Let’s explore their role specifically in the context of survey research:
- Objective-driven surveys : Directional hypotheses help align survey research with specific objectives. By formulating directional hypotheses, researchers can focus on gathering data that directly addresses the predicted relationship or difference between variables of interest.
- Question design and measurement : Directional hypotheses guide the design of survey question types and the selection of appropriate measurement scales. They ensure that the questions are tailored to capture the specific aspects related to the predicted direction, enabling researchers to obtain more targeted and relevant data from survey respondents.
- Data analysis and interpretation : Directional hypotheses assist in data analysis by directing researchers towards appropriate statistical tests and methods. Researchers can analyze the survey data to specifically test the predicted relationship or difference, enhancing the accuracy and reliability of their findings. The results can then be interpreted within the context of the directional hypothesis, providing more meaningful insights.
- Practical implications and decision-making : Directional hypotheses in surveys often have practical implications. When the predicted relationship or difference is confirmed, it informs decision-making processes, program development, or interventions. The survey findings based on directional hypotheses can guide organizations, policymakers, or practitioners in making informed choices to achieve desired outcomes.
- Replication and further research : Directional hypotheses in survey research contribute to the replication and extension of studies. Researchers can replicate the survey with different populations or contexts to assess the generalizability of the predicted relationships. Furthermore, if the directional hypothesis is supported, it encourages further research to explore underlying mechanisms or boundary conditions.
By incorporating directional hypotheses in survey research, researchers can align their objectives, design effective surveys, conduct focused data analysis, and derive practical insights. They provide a framework for organizing survey research and contribute to the accumulation of knowledge in the field.
Examples of research questions for directional hypothesis
Here are some examples of research questions that lend themselves to directional hypotheses:
- Does increased daily exercise lead to a decrease in body weight among sedentary adults?
- Is there a positive relationship between study hours and academic performance among college students?
- Does exposure to violent video games result in an increase in aggressive behavior among adolescents?
- Does the implementation of a mindfulness-based intervention lead to a reduction in stress levels among working professionals?
- Is there a difference in customer satisfaction between Product A and Product B, with Product A expected to have higher satisfaction ratings?
- Does the use of social media influence self-esteem levels, with higher social media usage associated with lower self-esteem?
- Is there a negative relationship between job satisfaction and employee turnover, indicating that lower job satisfaction leads to higher turnover rates?
- Does the administration of a specific medication result in a decrease in symptoms among individuals with a particular medical condition?
- Does increased access to early childhood education lead to improved cognitive development in preschool-aged children?
- Is there a difference in purchase intention between advertisements with celebrity endorsements and advertisements without, with celebrity endorsements expected to have a higher impact?
These research questions generate specific predictions about the direction of the relationship or difference between variables and can be tested using appropriate research methods and statistical analyses.
Definition of non-directional hypothesis
Non-directional hypotheses, also known as two-tailed hypotheses, are statements in research that indicate the presence of a relationship or difference between variables without specifying the direction of the effect. Instead of making predictions about the specific direction of the relationship or difference, non-directional hypotheses simply state that there is an association or distinction between the variables of interest.
Non-directional hypotheses are often used when there is no prior theoretical basis or clear expectation about the direction of the relationship. They leave the possibility open for either a positive or negative relationship, or for both groups to differ in some way without specifying which group will perform better or worse.
Advantages and utility of non-directional hypothesis
Non-directional hypotheses in survey s offer several advantages and utilities, providing flexibility and comprehensive analysis of survey data. Here are some of the key advantages and utilities of using non-directional hypotheses in surveys:
- Exploration of Relationships : Non-directional hypotheses allow researchers to explore and examine relationships between variables without assuming a specific direction. This is particularly useful in surveys where the relationship between variables may not be well-known or there may be conflicting evidence regarding the direction of the effect.
- Flexibility in Question Design : With non-directional hypotheses, survey questions can be designed to measure the relationship between variables without being biased towards a particular outcome. This flexibility allows researchers to collect data and analyze the results more objectively.
- Open to Unexpected Findings : Non-directional hypotheses enable researchers to be open to unexpected or surprising findings in survey data. By not committing to a specific direction of the effect, researchers can identify and explore relationships that may not have been initially anticipated, leading to new insights and discoveries.
- Comprehensive Analysis : Non-directional hypotheses promote comprehensive analysis of survey data by considering the possibility of an effect in either direction. Researchers can assess the magnitude and significance of relationships without limiting their analysis to only one possible outcome.
- S tatistical Validity : Non-directional hypotheses in surveys allow for the use of two-tailed statistical tests, which provide a more conservative and robust assessment of significance. Two-tailed tests consider both positive and negative deviations from the null hypothesis, ensuring accurate and reliable statistical analysis of survey data.
- Exploratory Research : Non-directional hypotheses are particularly useful in exploratory research, where the goal is to gather initial insights and generate hypotheses. Surveys with non-directional hypotheses can help researchers explore various relationships and identify patterns that can guide further research or hypothesis development.
It is worth noting that the choice between directional and non-directional hypotheses in surveys depends on the research objectives, existing knowledge, and the specific variables being investigated. Researchers should carefully consider the advantages and limitations of each approach and select the one that aligns best with their research goals and survey design.
- Share with others
- Twitter Twitter Icon
- LinkedIn LinkedIn Icon
Related posts
How to implement nps surveys: a step-by-step guide, 15 best website survey questions to ask your visitors, how to write a good survey introduction, 7 best ai survey generators, multiple choice questions: types, examples & samples, how to make a gdpr compliant survey, get answers today.
- No credit card required
- No time limit on Free plan
You can modify this template in every possible way.
All templates work great on every device.

Directional Hypothesis
Definition:
A directional hypothesis is a specific type of hypothesis statement in which the researcher predicts the direction or effect of the relationship between two variables.
Key Features
1. Predicts direction:
Unlike a non-directional hypothesis, which simply states that there is a relationship between two variables, a directional hypothesis specifies the expected direction of the relationship.
2. Involves one-tailed test:
Directional hypotheses typically require a one-tailed statistical test, as they are concerned with whether the relationship is positive or negative, rather than simply whether a relationship exists.
3. Example:
An example of a directional hypothesis would be: “Increasing levels of exercise will result in greater weight loss.”
4. Researcher’s prior belief:
A directional hypothesis is often formed based on the researcher’s prior knowledge, theoretical understanding, or previous empirical evidence relating to the variables under investigation.
5. Confirmatory nature:
Directional hypotheses are considered confirmatory, as they provide a specific prediction that can be tested statistically, allowing researchers to either support or reject the hypothesis.
6. Advantages and disadvantages:
Directional hypotheses help focus the research by explicitly stating the expected relationship, but they can also limit exploration of alternative explanations or unexpected findings.

How to Write a Directional Hypothesis: A Step-by-Step Guide
In research, hypotheses play a crucial role in guiding investigations and making predictions about relationships between variables.
One type of hypothesis that researchers often encounter is the directional hypothesis, also known as a one-tailed hypothesis.
In this blog post, we’ll explore what a directional hypothesis is, why it’s important, and provide a step-by-step guide on how to write one effectively.
Table of Contents
What is a Directional Hypothesis?
A directional hypothesis is a statement that predicts the direction of the relationship between two variables. Unlike non-directional hypotheses, which simply state that there is a relationship between variables without specifying the direction, directional hypotheses make a clear prediction about the expected outcome.
For example, a directional hypothesis might predict that an increase in one variable will lead to a decrease in another.
Examples of Directional Hypotheses
- Increasing the amount of sunlight exposure will lead to higher levels of vitamin D in the body.
- Decreasing the amount of sugar consumption will result in lower body weight among participants.
- Introducing mindfulness meditation techniques will reduce symptoms of anxiety in patients with generalized anxiety disorder.
Why to Write a Directional Hypothesis?
Directional hypotheses offer several advantages in research. They provide researchers with a more focused prediction, allowing them to test specific hypotheses rather than exploring all possible relationships between variables.
This can help streamline research efforts and increase the likelihood of finding meaningful results. Additionally, directional hypotheses are often used in experimental research, where researchers manipulate variables to observe their effects on outcomes.
Step 1: Identify the Variables
Start by identifying the independent variable (the variable you are manipulating) and the dependent variable (the variable you are measuring). Understanding the relationship between these variables is essential for writing a directional hypothesis.
Step 2: Predict the Direction
Based on your understanding of the relationship between the variables, predict the direction of the effect.
Will an increase in the independent variable lead to an increase or decrease in the dependent variable?
Be specific in your prediction.
Step 3: Use Clear Language
Write your directional hypothesis using clear and concise language. Avoid technical jargon or terms that may be difficult for readers to understand. Your hypothesis should be easily understood by both researchers and non-experts.
Step 4: Ensure Testability
Ensure that your hypothesis is testable by collecting data and conducting statistical analysis. You should be able to measure the variables and determine whether the observed results support or refute your hypothesis.
Step 5: Revise and Refine
Review your directional hypothesis to ensure that it accurately reflects your research question and predictions. Make any necessary revisions to improve clarity and specificity.
Writing a directional hypothesis is an essential skill for researchers conducting experiments and investigations.
By following the steps outlined in this guide, you can effectively formulate hypotheses that make clear predictions about the relationship between variables.
Whether you’re a researcher or just starting out in the field, mastering the art of writing directional hypotheses will enhance the quality and rigor of your research endeavors.

Related Posts
Advantages and disadvantages of snowball sampling, exploring qualitative researcher skills: what they are and how to develop them, difference between quota sampling and stratified sampling, what is purposive sampling | examples, quota sampling in research, top ai tools for literature review , research design | importance, types of research design examples, 9 qualitative research designs and research methods, tips to increase your journal citation score, types of research quiz.
Comments are closed.
Want to create or adapt books like this? Learn more about how Pressbooks supports open publishing practices.
17 Introduction to Hypothesis Testing
Jenna Lehmann
What is Hypothesis Testing?
Hypothesis testing is a big part of what we would actually consider testing for inferential statistics. It’s a procedure and set of rules that allow us to move from descriptive statistics to make inferences about a population based on sample data. It is a statistical method that uses sample data to evaluate a hypothesis about a population.
This type of test is usually used within the context of research. If we expect to see a difference between a treated and untreated group (in some cases the untreated group is the parameters we know about the population), we expect there to be a difference in the means between the two groups, but that the standard deviation remains the same, as if each individual score has had a value added or subtracted from it.
Steps of Hypothesis Testing
The following steps will be tailored to fit the first kind of hypothesis testing we will learn first: single-sample z-tests. There are many other kinds of tests, so keep this in mind.
- Null Hypothesis (H0): states that in the general population there is no change, no difference, or no relationship, or in the context of an experiment, it predicts that the independent variable has no effect on the dependent variable.
- Alternative Hypothesis (H1): states that there is a change, a difference, or a relationship for the general population, or in the context of an experiment, it predicts that the independent variable has an effect on the dependent variable.

- Critical Region: Composed of the extreme sample values that are very unlikely to be obtained if the null hypothesis is true. Determined by alpha level. If sample data fall in the critical region, the null hypothesis is rejected, because it’s very unlikely they’ve fallen there by chance.
- After collecting the data, we find the sample mean. Now we can compare the sample mean with the null hypothesis by computing a z-score that describes where the sample mean is located relative to the hypothesized population mean. We use the z-score formula.
- We decided previously what the two z-score boundaries are for a critical score. If the z-score we get after plugging the numbers in the aforementioned equation is outside of that critical region, we reject the null hypothesis. Otherwise, we would say that we failed to reject the null hypothesis.
Regions of the Distribution
Because we’re making judgments based on probability and proportion, our normal distributions and certain regions within them come into play.
The Critical Region is composed of the extreme sample values that are very unlikely to be obtained if the null hypothesis is true. Determined by alpha level. If sample data fall in the critical region, the null hypothesis is rejected, because it’s very unlikely they’ve fallen there by chance.
These regions come into play when talking about different errors.
A Type I Error occurs when a researcher rejects a null hypothesis that is actually true; the researcher concludes that a treatment has an effect when it actually doesn’t. This happens when a researcher unknowingly obtains an extreme, non-representative sample. This goes back to alpha level: it’s the probability that the test will lead to a Type I error if the null hypothesis is true.

A result is said to be significant or statistically significant if it is very unlikely to occur when the null hypothesis is true. That is, the result is sufficient to reject the null hypothesis. For instance, two means can be significantly different from one another.
Factors that Influence and Assumptions of Hypothesis Testing
Assumptions of Hypothesis Testing:
- Random sampling: it is assumed that the participants used in the study were selected randomly so that we can confidently generalize our findings from the sample to the population.
- Independent observation: two observations are independent if there is no consistent, predictable relationship between the first observation and the second. The value of σ is unchanged by the treatment; if the population standard deviation is unknown, we assume that the standard deviation for the unknown population (after treatment) is the same as it was for the population before treatment. There are ways of checking to see if this is true in SPSS or Excel.
- Normal sampling distribution: in order to use the unit normal table to identify the critical region, we need the distribution of sample means to be normal (which means we need the population to be distributed normally and/or each sample size needs to be 30 or greater based on what we know about the central limit theorem).
Factors that influence hypothesis testing:
- The variability of the scores, which is measured by either the standard deviation or the variance. The variability influences the size of the standard error in the denominator of the z-score.
- The number of scores in the sample. This value also influences the size of the standard error in the denominator.
Test statistic: indicates that the sample data are converted into a single, specific statistic that is used to test the hypothesis (in this case, the z-score statistic).
Directional Hypotheses and Tailed Tests
In a directional hypothesis test , also known as a one-tailed test, the statistical hypotheses specify with an increase or decrease in the population mean. That is, they make a statement about the direction of the effect.
The Hypotheses for a Directional Test:
- H0: The test scores are not increased/decreased (the treatment doesn’t work)
- H1: The test scores are increased/decreased (the treatment works as predicted)
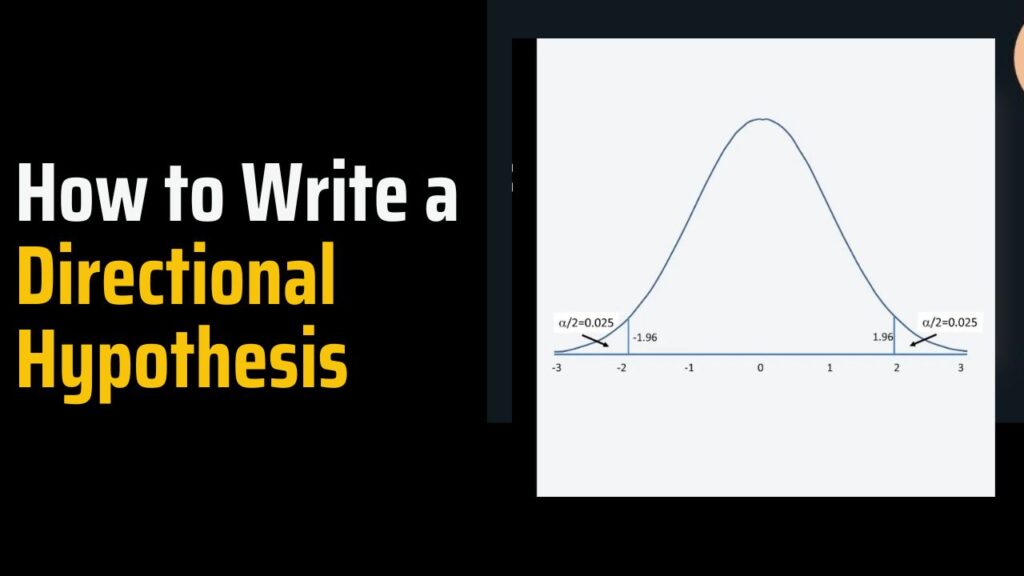
Because we’re only worried about scores that are either greater or less than the scores predicted by the null hypothesis, we only worry about what’s going on in one tail meaning that the critical region only exists within one tail. This means that all of the alpha is contained in one tail rather than split up into both (so the whole 5% is located in the tail we care about, rather than 2.5% in each tail). So before, we cared about what’s going on at the 0.025 mark of the unit normal table to look at both tails, but now we care about 0.05 because we’re only looking at one tail.
A one-tailed test allows you to reject the null hypothesis when the difference between the sample and the population is relatively small, as long as that difference is in the direction that you predicted. A two-tailed test, on the other hand, requires a relatively large difference independent of direction. In practice, researchers hypothesize using a one-tailed method but base their findings off of whether the results fall into the critical region of a two-tailed method. For the purposes of this class, make sure to calculate your results using the test that is specified in the problem.
Effect Size
A measure of effect size is intended to provide a measurement of the absolute magnitude of a treatment effect, independent of the size of the sample(s) being used. Usually done with Cohen’s d. If you imagine the two distributions, they’re layered over one another. The more they overlap, the smaller the effect size (the means of the two distributions are close). The more they are spread apart, the greater the effect size (the means of the two distributions are farther apart).
Statistical Power
The power of a statistical test is the probability that the test will correctly reject a false null hypothesis. It’s usually what we’re hoping to get when we run an experiment. It’s displayed in the table posted above. Power and effect size are connected. So, we know that the greater the distance between the means, the greater the effect size. If the two distributions overlapped very little, there would be a greater chance of selecting a sample that leads to rejecting the null hypothesis.
This chapter was originally posted to the Math Support Center blog at the University of Baltimore on June 11, 2019.
Math and Statistics Guides from UB's Math & Statistics Center Copyright © by Jenna Lehmann is licensed under a Creative Commons Attribution-NonCommercial-ShareAlike 4.0 International License , except where otherwise noted.
Share This Book
8.3.2 - Hypothesis Testing
Below are the procedures for conducting a hypothesis test for two paired means. This is often referred to as a "paired means \(t\) test," "dependent means \(t\) test," or "matched pairs \(t\) test."
Data must be paired. The difference between the two groups must be normally distributed in the population or the sample size must be at least 30.
The possible combinations of null and alternative hypotheses are:
Where \( \mu_d \) is the hypothesized difference in the population.
The calculation of the test statistic for dependent samples is similar to the calculation you performed earlier in this lesson for a single sample mean. In this formula, \(\overline{x}_d\) is used in place of \(\overline{x}\) and \(s_d\) is used in place of \(s\):
\(t=\frac{\bar{x}_d-\mu_0}{\dfrac{s_d}{\sqrt{n}}}\)
\(\overline{x}_d\) = observed sample mean difference \(\mu_0\) = mean difference specified in the null hypothesis \(s_d\) = standard deviation of the differences \(n\) = sample size (i.e., number of unique individuals)
When testing hypotheses about a mean difference, a \(t\) distribution is used to find the \(p\) value. The degrees of freedom are equal to \(n-1\) where \(n\) is the number of pairs.
If \(p \leq \alpha\) reject the null hypothesis. If \(p>\alpha\) fail to reject the null hypothesis.
Based on your decision in Step 4, write a conclusion in terms of the original research question.
8.3.2.1 - Example: Quiz Scores
Below is an example of conducting a paired means \(t\) test by hand using raw data. Next, you will learn how this can be conducted most efficiently in Minitab.
Research question: Are scores on two quizzes different?
Data were collected from 9 students and a paired means \(t\) test was performed using hand calculations:
There are two assumptions: (1) data are paired and (2) distribution of differences is normally distribution in the population or the sample size is at least 30. The data are paired because for each student we have a quiz 1 and a quiz 2 score. We do not know if the differences are normally distributed in the population and the sample size is small, but in the video above we created a histogram of the differences and found that the sample was approximately normally distributed, so this assumption has been met and we can perform a paired means \(t\) test.
Given \(\mu_d = \mu_1 - \mu_2\), our hypotheses are: \(H_0: \mu_d = 0\) \(H_a: \mu_d \ne 0\)
\(t=\frac{\bar{x}_d-\mu_0}{\frac{s_d}{\sqrt{n}}}\)
Mean of the differences: \(\overline{X}_d=\frac{\Sigma{X}_d}{n}=\frac{1}{9}\)
For a review of computing standard deviation, see Lesson 2 .
Sum of squares: \(\Sigma (X_d - \overline{X}_d)^2 = 54.889\)
Standard deviation of the differences: \(s_d=\sqrt{\frac{\sum (X_d-\overline{X}_d)^{2}}{n-1}} = \sqrt{\frac{54.889}{9-1}}=2.619\)
Test statistic: \(t=\frac{\overline{X}_d- \mu_0}{\frac{s_d}{\sqrt{n}}}=\frac{\frac{1}{9}}{\frac{2.619}{\sqrt{9}}}=0.127\)
\(df=n-1=9-1=8\)
We can construct a \(t\) distribution with 8 degrees of freedom and determine what proportion of the curve falls beyond a \(t\) score of 0.127. This is a two-tailed test, so we need to take into account both the left and right sides of the curve.

\(p=0.4510+0.4510=0.9020\)
We will compare our \(p\)-value from step 3 to a standard alpha level of 0.05.
Because \(p>\alpha\), we fail to reject the null hypothesis.
There is not sufficient evidence to state that scores on the two quizzes are different.
What is a Directional Hypothesis? (Definition & Examples)
A statistical hypothesis is an assumption about a population parameter . For example, we may assume that the mean height of a male in the U.S. is 70 inches.
The assumption about the height is the statistical hypothesis and the true mean height of a male in the U.S. is the population parameter .
To test whether a statistical hypothesis about a population parameter is true, we obtain a random sample from the population and perform a hypothesis test on the sample data.
Whenever we perform a hypothesis test, we always write down a null and alternative hypothesis:
- Null Hypothesis (H 0 ): The sample data occurs purely from chance.
- Alternative Hypothesis (H A ): The sample data is influenced by some non-random cause.
A hypothesis test can either contain a directional hypothesis or a non-directional hypothesis:
- Directional hypothesis: The alternative hypothesis contains the less than (“”) sign. This indicates that we’re testing whether or not there is a positive or negative effect.
- Non-directional hypothesis: The alternative hypothesis contains the not equal (“≠”) sign. This indicates that we’re testing whether or not there is some effect, without specifying the direction of the effect.
Note that directional hypothesis tests are also called “one-tailed” tests and non-directional hypothesis tests are also called “two-tailed” tests.
Check out the following examples to gain a better understanding of directional vs. non-directional hypothesis tests.
Example 1: Baseball Programs
A baseball coach believes a certain 4-week program will increase the mean hitting percentage of his players, which is currently 0.285.
To test this, he measures the hitting percentage of each of his players before and after participating in the program.
He then performs a hypothesis test using the following hypotheses:
- H 0 : μ = .285 (the program will have no effect on the mean hitting percentage)
- H A : μ > .285 (the program will cause mean hitting percentage to increase)
This is an example of a directional hypothesis because the alternative hypothesis contains the greater than “>” sign. The coach believes that the program will influence the mean hitting percentage of his players in a positive direction.
Example 2: Plant Growth
A biologist believes that a certain pesticide will cause plants to grow less during a one-month period than they normally do, which is currently 10 inches.
To test this, she applies the pesticide to each of the plants in her laboratory for one month.
She then performs a hypothesis test using the following hypotheses:
- H 0 : μ = 10 inches (the pesticide will have no effect on the mean plant growth)
This is also an example of a directional hypothesis because the alternative hypothesis contains the less than “negative direction.
Example 3: Studying Technique
A professor believes that a certain studying technique will influence the mean score that her students receive on a certain exam, but she’s unsure if it will increase or decrease the mean score, which is currently 82.
To test this, she lets each student use the studying technique for one month leading up to the exam and then administers the same exam to each of the students.
- H 0 : μ = 82 (the studying technique will have no effect on the mean exam score)
- H A : μ ≠ 82 (the studying technique will cause the mean exam score to be different than 82)
This is an example of a non-directional hypothesis because the alternative hypothesis contains the not equal “≠” sign. The professor believes that the studying technique will influence the mean exam score, but doesn’t specify whether it will cause the mean score to increase or decrease.
Additional Resources
Introduction to Hypothesis Testing Introduction to the One Sample t-test Introduction to the Two Sample t-test Introduction to the Paired Samples t-test
How to Perform a Partial F-Test in Excel
4 examples of confidence intervals in real life, related posts, how to normalize data between -1 and 1, vba: how to check if string contains another..., how to interpret f-values in a two-way anova, how to create a vector of ones in..., how to determine if a probability distribution is..., what is a symmetric histogram (definition & examples), how to find the mode of a histogram..., how to find quartiles in even and odd..., how to calculate sxy in statistics (with example), how to calculate sxx in statistics (with example).
Research Hypothesis In Psychology: Types, & Examples
Saul Mcleod, PhD
Editor-in-Chief for Simply Psychology
BSc (Hons) Psychology, MRes, PhD, University of Manchester
Saul Mcleod, PhD., is a qualified psychology teacher with over 18 years of experience in further and higher education. He has been published in peer-reviewed journals, including the Journal of Clinical Psychology.
Learn about our Editorial Process
Olivia Guy-Evans, MSc
Associate Editor for Simply Psychology
BSc (Hons) Psychology, MSc Psychology of Education
Olivia Guy-Evans is a writer and associate editor for Simply Psychology. She has previously worked in healthcare and educational sectors.
On This Page:
A research hypothesis, in its plural form “hypotheses,” is a specific, testable prediction about the anticipated results of a study, established at its outset. It is a key component of the scientific method .
Hypotheses connect theory to data and guide the research process towards expanding scientific understanding
Some key points about hypotheses:
- A hypothesis expresses an expected pattern or relationship. It connects the variables under investigation.
- It is stated in clear, precise terms before any data collection or analysis occurs. This makes the hypothesis testable.
- A hypothesis must be falsifiable. It should be possible, even if unlikely in practice, to collect data that disconfirms rather than supports the hypothesis.
- Hypotheses guide research. Scientists design studies to explicitly evaluate hypotheses about how nature works.
- For a hypothesis to be valid, it must be testable against empirical evidence. The evidence can then confirm or disprove the testable predictions.
- Hypotheses are informed by background knowledge and observation, but go beyond what is already known to propose an explanation of how or why something occurs.
Predictions typically arise from a thorough knowledge of the research literature, curiosity about real-world problems or implications, and integrating this to advance theory. They build on existing literature while providing new insight.
Types of Research Hypotheses
Alternative hypothesis.
The research hypothesis is often called the alternative or experimental hypothesis in experimental research.
It typically suggests a potential relationship between two key variables: the independent variable, which the researcher manipulates, and the dependent variable, which is measured based on those changes.
The alternative hypothesis states a relationship exists between the two variables being studied (one variable affects the other).
A hypothesis is a testable statement or prediction about the relationship between two or more variables. It is a key component of the scientific method. Some key points about hypotheses:
- Important hypotheses lead to predictions that can be tested empirically. The evidence can then confirm or disprove the testable predictions.
In summary, a hypothesis is a precise, testable statement of what researchers expect to happen in a study and why. Hypotheses connect theory to data and guide the research process towards expanding scientific understanding.
An experimental hypothesis predicts what change(s) will occur in the dependent variable when the independent variable is manipulated.
It states that the results are not due to chance and are significant in supporting the theory being investigated.
The alternative hypothesis can be directional, indicating a specific direction of the effect, or non-directional, suggesting a difference without specifying its nature. It’s what researchers aim to support or demonstrate through their study.
Null Hypothesis
The null hypothesis states no relationship exists between the two variables being studied (one variable does not affect the other). There will be no changes in the dependent variable due to manipulating the independent variable.
It states results are due to chance and are not significant in supporting the idea being investigated.
The null hypothesis, positing no effect or relationship, is a foundational contrast to the research hypothesis in scientific inquiry. It establishes a baseline for statistical testing, promoting objectivity by initiating research from a neutral stance.
Many statistical methods are tailored to test the null hypothesis, determining the likelihood of observed results if no true effect exists.
This dual-hypothesis approach provides clarity, ensuring that research intentions are explicit, and fosters consistency across scientific studies, enhancing the standardization and interpretability of research outcomes.
Nondirectional Hypothesis
A non-directional hypothesis, also known as a two-tailed hypothesis, predicts that there is a difference or relationship between two variables but does not specify the direction of this relationship.
It merely indicates that a change or effect will occur without predicting which group will have higher or lower values.
For example, “There is a difference in performance between Group A and Group B” is a non-directional hypothesis.
Directional Hypothesis
A directional (one-tailed) hypothesis predicts the nature of the effect of the independent variable on the dependent variable. It predicts in which direction the change will take place. (i.e., greater, smaller, less, more)
It specifies whether one variable is greater, lesser, or different from another, rather than just indicating that there’s a difference without specifying its nature.
For example, “Exercise increases weight loss” is a directional hypothesis.

Falsifiability
The Falsification Principle, proposed by Karl Popper , is a way of demarcating science from non-science. It suggests that for a theory or hypothesis to be considered scientific, it must be testable and irrefutable.
Falsifiability emphasizes that scientific claims shouldn’t just be confirmable but should also have the potential to be proven wrong.
It means that there should exist some potential evidence or experiment that could prove the proposition false.
However many confirming instances exist for a theory, it only takes one counter observation to falsify it. For example, the hypothesis that “all swans are white,” can be falsified by observing a black swan.
For Popper, science should attempt to disprove a theory rather than attempt to continually provide evidence to support a research hypothesis.
Can a Hypothesis be Proven?
Hypotheses make probabilistic predictions. They state the expected outcome if a particular relationship exists. However, a study result supporting a hypothesis does not definitively prove it is true.
All studies have limitations. There may be unknown confounding factors or issues that limit the certainty of conclusions. Additional studies may yield different results.
In science, hypotheses can realistically only be supported with some degree of confidence, not proven. The process of science is to incrementally accumulate evidence for and against hypothesized relationships in an ongoing pursuit of better models and explanations that best fit the empirical data. But hypotheses remain open to revision and rejection if that is where the evidence leads.
- Disproving a hypothesis is definitive. Solid disconfirmatory evidence will falsify a hypothesis and require altering or discarding it based on the evidence.
- However, confirming evidence is always open to revision. Other explanations may account for the same results, and additional or contradictory evidence may emerge over time.
We can never 100% prove the alternative hypothesis. Instead, we see if we can disprove, or reject the null hypothesis.
If we reject the null hypothesis, this doesn’t mean that our alternative hypothesis is correct but does support the alternative/experimental hypothesis.
Upon analysis of the results, an alternative hypothesis can be rejected or supported, but it can never be proven to be correct. We must avoid any reference to results proving a theory as this implies 100% certainty, and there is always a chance that evidence may exist which could refute a theory.
How to Write a Hypothesis
- Identify variables . The researcher manipulates the independent variable and the dependent variable is the measured outcome.
- Operationalized the variables being investigated . Operationalization of a hypothesis refers to the process of making the variables physically measurable or testable, e.g. if you are about to study aggression, you might count the number of punches given by participants.
- Decide on a direction for your prediction . If there is evidence in the literature to support a specific effect of the independent variable on the dependent variable, write a directional (one-tailed) hypothesis. If there are limited or ambiguous findings in the literature regarding the effect of the independent variable on the dependent variable, write a non-directional (two-tailed) hypothesis.
- Make it Testable : Ensure your hypothesis can be tested through experimentation or observation. It should be possible to prove it false (principle of falsifiability).
- Clear & concise language . A strong hypothesis is concise (typically one to two sentences long), and formulated using clear and straightforward language, ensuring it’s easily understood and testable.
Consider a hypothesis many teachers might subscribe to: students work better on Monday morning than on Friday afternoon (IV=Day, DV= Standard of work).
Now, if we decide to study this by giving the same group of students a lesson on a Monday morning and a Friday afternoon and then measuring their immediate recall of the material covered in each session, we would end up with the following:
- The alternative hypothesis states that students will recall significantly more information on a Monday morning than on a Friday afternoon.
- The null hypothesis states that there will be no significant difference in the amount recalled on a Monday morning compared to a Friday afternoon. Any difference will be due to chance or confounding factors.
More Examples
- Memory : Participants exposed to classical music during study sessions will recall more items from a list than those who studied in silence.
- Social Psychology : Individuals who frequently engage in social media use will report higher levels of perceived social isolation compared to those who use it infrequently.
- Developmental Psychology : Children who engage in regular imaginative play have better problem-solving skills than those who don’t.
- Clinical Psychology : Cognitive-behavioral therapy will be more effective in reducing symptoms of anxiety over a 6-month period compared to traditional talk therapy.
- Cognitive Psychology : Individuals who multitask between various electronic devices will have shorter attention spans on focused tasks than those who single-task.
- Health Psychology : Patients who practice mindfulness meditation will experience lower levels of chronic pain compared to those who don’t meditate.
- Organizational Psychology : Employees in open-plan offices will report higher levels of stress than those in private offices.
- Behavioral Psychology : Rats rewarded with food after pressing a lever will press it more frequently than rats who receive no reward.
If you still have questions or prefer to get help directly from an agent, please submit a request. We’ll get back to you as soon as possible.
Please fill out the contact form below and we will reply as soon as possible.
- Economics, Finance, & Analytics
- Research, Quantitative Analysis, & Decision Science
One-Tailed Test - Explained
What is a one-tailed test.

Written by Jason Gordon
Updated at April 22nd, 2024
- Marketing, Advertising, Sales & PR Principles of Marketing Sales Advertising Public Relations SEO, Social Media, Direct Marketing
- Accounting, Taxation, and Reporting Managerial & Financial Accounting & Reporting Business Taxation
- Professionalism & Career Development
- Law, Transactions, & Risk Management Government, Legal System, Administrative Law, & Constitutional Law Legal Disputes - Civil & Criminal Law Agency Law HR, Employment, Labor, & Discrimination Business Entities, Corporate Governance & Ownership Business Transactions, Antitrust, & Securities Law Real Estate, Personal, & Intellectual Property Commercial Law: Contract, Payments, Security Interests, & Bankruptcy Consumer Protection Insurance & Risk Management Immigration Law Environmental Protection Law Inheritance, Estates, and Trusts
- Business Management & Operations Operations, Project, & Supply Chain Management Strategy, Entrepreneurship, & Innovation Business Ethics & Social Responsibility Global Business, International Law & Relations Business Communications & Negotiation Management, Leadership, & Organizational Behavior
- Economics, Finance, & Analytics Economic Analysis & Monetary Policy Research, Quantitative Analysis, & Decision Science Investments, Trading, and Financial Markets Banking, Lending, and Credit Industry Business Finance, Personal Finance, and Valuation Principles
One-tailed test, also called directional test or directional hypothesis, is a test widely used in statistics to determine if the critical region of a distribution is in one direction, or one-sided so as to know if its value is either less or more than a specific value. If the experiment lies in the one-sided critical region, it will result in the acceptance of the alternate hypothesis, and not the null hypothesis.
How is a One-Tailed Test Used?
Hypothesis testing is a fundamental subject in inferential statistics. This test is conducted in order to ascertain the authenticity of a claim, provided a population measure. When a test aims to know if the sample mean is more than and less than the population mean, it is considered to be a two-tailed test. In contrast to this, when the experiments are performed to prove that the sample would be either more or less than the mean of a population, it is known as a one-tailed test. As this test performs experiment on one of the tails or sides of a normal distribution, it is known as a one-tailed test. Besides, the test is also applicable in other non-normal distributions. In hypothesis testing, the null and alternative hypotheses are formed prior to conducting one-tailed test. A null hypothesis involves the claim that the researcher doesnt want to go with, or wishes to reject. The alternative hypothesis involves the measurement favored by not going with the null hypothesis. In case of a financial analyst who wishes to exhibit that the portfolio manager surpassed the S&P 500 index in a specific year, he or she may consider setting up the null (H0) and alternative hypothesis (Ha) for a value, say, 16.91%. H0: 16.91 Ha: > 16.91 The value that the analyst wishes to reject is known as null hypothesis. The alternative hypothesis will be the claim that analyst makes that the performance of the portfolio manager was more than S&P 500. If the null hypothesis gets rejected in the outcome of the one-tailed tests, it will lead to the acceptance of the alternative hypothesis. However, if the outcome of the experiment cannot reject the null hypothesis, the analyst can further analyze the performance of the portfolio manager. The region of rejection for the one-tailed test is on either of the sides of the sampling distribution.
Measuring Significance
A level of significance must be mentioned in order to measure the extent of difference in returns. Probability, abbreviated as p, represents the significance level that is the probability of misinterpreting that the null hypothesis is not true. In the one-tailed test, the most commonly used significance values are 1%, 5%, or 10%. However, the analyst can use any probability determination tool as significance value. The value of probability is ascertained based on the assumption that the null hypothesis is true. This signifies that if the p-value is lower, there would be more probability that the null hypothesis is false. When the final p-value is lower than 5%, then both the observations will have a significance difference, leading the rejection of the null hypothesis. For instance, in case of p-value being 3%, the analyst will be 97% confident that the returns from portfolio were neither equivalent nor below the market returns for the given year. Hence, it will result in the rejection of H0 and will favor the claim that the portfolio manager surpassed the index. If the same tools of measurements were observed during both one-tailed and two-tailed tests, then the probability ascertained in one-tailed distribution test will be half of that of a two-tailed test. At the time of using a one-tailed test, the analyst experiments the possibility of the relationship in a single direction of interest, and discards the possibility of a relationship in any other direction. Continuing with the above example, the analyst now wants to know if the returns that a portfolio offers are more than the market returns. Also, he doesnt have to be accountable for the case where the RoI is lower than the returns offered by S&P 500 index. Thats why, analysts find using one-tailed test right only when they dont have to measure the outcome in the other direction of the distribution.
Related Articles
- Chi Square Distribution - Explained
- A Posteriori - Explained
- Kurtosis - Explained
- Random Factor Analysis - Explained
Tools, Technologies and Training for Healthcare Laboratories
- Z-Stats / Basic Statistics
Z-8: Two-Sample and Directional Hypothesis Testing
This lesson describes some refinements to the hypothesis testing approach that was introduced in the previous lesson. The truth of the matter is that the previous lesson was somewhat oversimplified in order to focus on the concept and general steps in the hypothesis testing procedure. With that background, we can now get into some of the finer points of hypothesis testing.
EdD, Assistant Professor Clinical Laboratory Science Program, University of Louisville Louisville, Kentucky October 1999
Refinements in calculations, refinements in procedure, a two-tailed test for our mice, a one-tailed test for our mice.
- Critical t-values for one-tailed and two-tailed tests
- About the Author
Two sample case
The "two sample case" is a special case in which the difference between two sample means is examined. This sounds like what we did in the last lesson, but we actually looked at the difference between an observed or sample group mean and a control group mean, which was treated as if it were a population mean (rather than an observed or sample mean). There are some fine points that need to be considered about the calculations and the procedure.
Mathematically, there are some differences in the formula that should be used. Recall the form of the equation for calculating a t-value:
where Xbar is the mean of the experimental group, and µ is a population parameter or the mean of the population. In the last lesson, we substituted the control group mean XbarB for µ. However, the control group was actually a sample from the population of all such mice (in this example) and following suit, the experimental group was also just a sample from its population. Phrasing the situation this way, there are now two sets of differences that must be considered: the difference between sample means or XbarA-XbarB and the difference between population means from which these samples came or µA-µB. Those expressions should be substituted into the t calc formula to give the proper mathematical form:
- In this new equation, the difference between means (Xbar A - XbarB) is called bias and is important in determining test accuracy, so even though this discussion is getting more complicated, the statistic that we are deriving is very important.
- When the square root is taken, the result is called the standard deviation of the difference between means , SDd , which is shown by the formula:
- The proper equation for calculating the t-value for the two-sample case then becomes:
Remember the steps for testing a hypothesis are: (1) State the hypotheses; (2) Set the criterion for rejection of Ho; (3) Compute the test statistic; (4) Decide about Ho.
- The null hypothesis can be stated as: Ho: µA = µB or µA - µB = 0. But it may be more revealing to say Ho: (XbarA-XbarB) - (µA - µB) = 0. The difference between the sample means minus the difference between the population means equals zero.
- The alternative hypothesis can be stated as: Ha: µA is not equal to µB or Ha: (XbarA-XbarB) - (µA - µB) is not equal to 0, i.e., the means of the two groups are not equal.
- The criteria for rejection or the alpha level is 0.05.
- The test statistic is computed as:
- Since it is hypothesized that the two methods are comparable and the difference between the means of the two populations is zero (µA - µB = 0), the calculation can be simplified as follows:
- If this t calc is greater than 1.96 then the null hypothesis of no difference can be overturned (p0.05).
- Even though we have used several different mathematical formulae, the interpretations are the same as before.
Directional hypothesis testing vs non-directional testing
Remember the example of testing the effect of antibiotics on mice in Lesson 7. The point of the study was to find out if the mice who were treated with the antibiotic would outlive those who were not treated (i.e., the control group). Are you surprised that the researcher did not hypothesize that the control group might outlive the treatment group? Would it make any difference in how the hypothesis testing were carried out? These questions raise the issue of directional testing, or one-tailed vs two-tailed tests.
The issue of two-side vs one-side tests becomes important when selecting the critical t-value. In the earlier discussion of this example, the alpha level was set to 0.05, but that 0.05 was actually divided equally between the left and right tails of the distribution curve. The condition being tested is that group A has a "different" life span as compared to group B, which represents a two-tailed test as illustrated in Figure 8-2.
Critical t-values for one-tailed and two tailed tests
This can be confusing and it should be helpful to think about having one or two gates on the curve. For example, for an alpha level of 0.05 and a two-tail test, there are two gates - one at -1.96 and one at +1.96. If you "walk" out of either of those gates, then you have demonstrated significance at p=0.05 or less. For a one-tail test, there is only one gate at +1.65. If you "walk" out of this gate, you have demonstrated significance at p=0.05 or less.
To reiterate, if you are standing right at the gate (1.96) for a two-tail test, then you have just barely met the p=0.05 requirement. However, if you are standing at the 1.96 point when running a one-tail test, then you have already exceeded the 1.65 gate and the probability must be even more significant, say p=0.025. It's important to find the critical t-value that is correct for the intended directional nature of the test.
About the author: Madelon F. Zady
Madelon F. Zady is an Assistant Professor at the University of Louisville, School of Allied Health Sciences Clinical Laboratory Science program and has over 30 years experience in teaching. She holds BS, MAT and EdD degrees from the University of Louisville, has taken other advanced course work from the School of Medicine and School of Education, and also advanced courses in statistics. She is a registered MT(ASCP) and a credentialed CLS(NCA) and has worked part-time as a bench technologist for 14 years. She is a member of the: American Society for Clinical Laboratory Science, Kentucky State Society for Clinical Laboratory Science, American Educational Research Association, and the National Science Teachers Association. Her teaching areas are clinical chemistry and statistics. Her research areas are metacognition and learning theory.
- "Westgard Rules"
- Basic QC Practices
- High Reliability
- "Housekeeping"
- Maryland General
- Method Validation
- Quality Requirements and Standards
- Quality of Laboratory Testing
- Guest Essay
- Risk Management
- Sigma Metric Analysis
- Quality Standards
- Basic Planning for Quality
- Basic Method Validation
- Quality Management
- Advanced Quality Management / Six Sigma
- Patient Safety Concepts
- Quality Requirements
- CLIA Final Rule
- Course Orders
- Feedback Form

- school Campus Bookshelves
- menu_book Bookshelves
- perm_media Learning Objects
- login Login
- how_to_reg Request Instructor Account
- hub Instructor Commons
- Download Page (PDF)
- Download Full Book (PDF)
- Periodic Table
- Physics Constants
- Scientific Calculator
- Reference & Cite
- Tools expand_more
- Readability
selected template will load here
This action is not available.
7.5.1: Critical Values
- Last updated
- Save as PDF
- Page ID 22071

- Michelle Oja
- Taft College
Okay, this whole chapter is full of complex theoretical ideas. Critical values and null hypothesis significance testing is a TOUGH concept to get. Here's another description of critical values, p-values, and significance. Everyone learns differently, so hopefully this slightly different explanation will help understand the prior section.
We understand that we need a research hypothesis that predicts the relationship between two groups on an measured outcome (DV), and that each research hypothesis has a null hypothesis that says that there is no relationship between the two groups on the measured outcome (the means of the DV are similar). If we reject the null hypothesis (which says that the means are similar), we are saying that the means are different; this may or may not be in the direction that we predicted in the research hypothesis so we may or may not support the research hypothesis. If we retain (fail to reject) the null hypothesis, we are saying that the means are similar and then we cannot support the research hypothesis. Got it?
But how do we decide again to retain or reject the null hypothesis? We compare a calculated statistic (there are many, depending on your variables, that we'll cover for the rest of this textbook) to a critical value from a table. The table uses probability (p-values) to tell us what calculated values are so extreme to be absolutely unlikely.
Critical Regions and Critical Values
The critical region of any test corresponds to those values of the test statistic that would lead us to reject null hypothesis (which is why the critical region is also sometimes called the rejection region). How do we find this critical region? Well, let’s consider what we know:
- The test statistic should be very big or very small (extreme) in order to reject the null hypothesis.
- If α=.05 (α is "alpha," and is just another notation for probability; we'll talk about it more in the section on errors), the critical region must cover 5% of a Standard Normal Distribution.
It’s only important to make sure you understand this last point when you are dealing with non-directional hypotheses (which we will only do for Confidence Intervals). The critical region corresponds to those values of the test statistic for which we would reject the null hypothesis, and the Standard Normal Distribution describes the probability that we would obtain a particular value if the null hypothesis (that the means are similar) were actually true. Now, let’s suppose that we chose a critical region that covers 20% of the Standard Normal Distribution, and suppose that the null hypothesis is actually true. What would be the probability of incorrectly rejecting the null (saying that there is a difference between the means when there really isn't a difference)? The answer is 20%. And therefore, we would have built a test that had an α level of 0.2. If we want α=.05, the critical region only covers 5% of the Standard Normal Distribution.
Huh? Let's draw that out. Figure \(\PageIndex{1}\) shows the critical region associated with a non-directional hypothesis test (also called a "two-sided test" because the calculated value might be in either tail of the distribution). Figure \(\PageIndex{1}\) itself shows the sampling distribution of X (the scores we got). The grey bars correspond to those values for which we would retain the null hypothesis. The blue (dark) bars show the critical region: those values for which we would reject the null. In this example, the research hypothesis was non-directional, so the critical region covers both tails of the distribution. To ensure an α level of .05, we need to ensure that each of the two regions encompasses 2.5% of the sampling distribution.

Our critical region consists of the most extreme values , known as the tails of the distribution.
At this point, our hypothesis test is essentially complete: (1) we choose an α level (e.g., α=.05, (2) come up with some test statistic (more on this step later) that does a good job (in some meaningful sense) of comparing the null hypothesis to the research hypothesis, (3) calculate the critical region that produces an appropriate α level, and then (4) calculate the value of the test statistic for the real data and then compare it to the critical values to make our decision. If we reject the null hypothesis, we say that the test has produced a significant result.
A note on statistical “significance”
Like other occult techniques of divination, the statistical method has a private jargon deliberately contrived to obscure its methods from non-practitioners. – Attributed to G. O. Ashley*
A very brief digression is in order at this point, regarding the word “significant”. The concept of statistical significance is actually a very simple one, but has a very unfortunate name. If the data allow us to reject the null hypothesis, we say that “the result is statistically significant ”, which is often shortened to “the result is significant”. This terminology is rather old, and dates back to a time when “significant” just meant something like “indicated”, rather than its modern meaning, which is much closer to “important”. As a result, a lot of modern readers get very confused when they start learning statistics, because they think that a “significant result” must be an important one. It doesn’t mean that at all. All that “statistically significant” means is that the data allowed us to reject a null hypothesis. Whether or not the result is actually important in the real world is a very different question, and depends on all sorts of other things.
Directional and Non-Directional Hypotheses
There’s one more thing to point out about the hypothesis test that we’ve just constructed. In statistical language, this is an example of a non-directional hypothesis, also known as a two-sided test. It’s called this because the alternative hypothesis covers the area on both “sides” of the null hypothesis, and as a consequence the critical region of the test covers both tails of the sampling distribution (2.5% on either side if α=.05), as illustrated earlier in Figure \(\PageIndex{1}\).
However, that’s not the only possibility, and not the situation that we'll be using with our directional research hypotheses (the ones that predict which group will have a higher mean). A directional research hypothesis would only cover the possibility that p>.5, and as a consequence the null hypothesis now becomes p≤.5. When this happens, we have what’s called a one-sided test , and when this happens the critical region only covers one tail of the sampling distribution. This is illustrated in Figure \(\PageIndex{2}\). In this case, we would only reject the null hypothesis for large values of of our test statistic (values that are more extreme but only in one direction). As a consequence, the critical region only covers the upper tail of the sampling distribution; specifically the upper 5% of the distribution. Contrast this to the two-sided version earlier in Figure \(\PageIndex{1}\).

Clear as mud? Let's try one more way to describe how research hypotheses, null hypotheses, p-values, and null hypothesis significance testing work.
*The internet seems fairly convinced that Ashley said this, though I can’t for the life of me find anyone willing to give a source for the claim.
Contributors and Attributions
- Danielle Navarro ( University of New South Wales )
Dr. MO ( Taft College )
psychologyrocks
Hypotheses; directional and non-directional, what is the difference between an experimental and an alternative hypothesis.
Nothing much! If the study is a laboratory experiment then we can call the hypothesis “an experimental hypothesis”, where we make a prediction about how the IV causes an effect on the DV. If we have a non-experimental design, i.e. we are not able to manipulate the IV as in a natural or quasi-experiment , or if some other research method has been used, then we call it an “alternativehypothesis”, alternative to the null.
Directional hypothesis: A directional (or one tailed hypothesis) states which way you think the results are going to go, for example in an experimental study we might say…”Participants who have been deprived of sleep for 24 hours will have more cold symptoms in the following week after exposure to a virus than participants who have not been sleep deprived”; the hypothesis compares the two groups/conditions and states which one will ….have more/less, be quicker/slower, etc.
If we had a correlational study, the directional hypothesis would state whether we expect a positive or a negative correlation, we are stating how the two variables will be related to each other, e.g. there will be a positive correlation between the number of stressful life events experienced in the last year and the number of coughs and colds suffered, whereby the more life events you have suffered the more coughs and cold you will have had”. The directional hypothesis can also state a negative correlation, e.g. the higher the number of face-book friends, the lower the life satisfaction score “
Non-directional hypothesis: A non-directional (or two tailed hypothesis) simply states that there will be a difference between the two groups/conditions but does not say which will be greater/smaller, quicker/slower etc. Using our example above we would say “There will be a difference between the number of cold symptoms experienced in the following week after exposure to a virus for those participants who have been sleep deprived for 24 hours compared with those who have not been sleep deprived for 24 hours.”
When the study is correlational, we simply state that variables will be correlated but do not state whether the relationship will be positive or negative, e.g. there will be a significant correlation between variable A and variable B.
Null hypothesis The null hypothesis states that the alternative or experimental hypothesis is NOT the case, if your experimental hypothesis was directional you would say…
Participants who have been deprived of sleep for 24 hours will NOT have more cold symptoms in the following week after exposure to a virus than participants who have not been sleep deprived and any difference that does arise will be due to chance alone.
or with a directional correlational hypothesis….
There will NOT be a positive correlation between the number of stress life events experienced in the last year and the number of coughs and colds suffered, whereby the more life events you have suffered the more coughs and cold you will have had”
With a non-directional or two tailed hypothesis…
There will be NO difference between the number of cold symptoms experienced in the following week after exposure to a virus for those participants who have been sleep deprived for 24 hours compared with those who have not been sleep deprived for 24 hours.
or for a correlational …
there will be NO correlation between variable A and variable B.
When it comes to conducting an inferential stats test, if you have a directional hypothesis , you must do a one tailed test to find out whether your observed value is significant. If you have a non-directional hypothesis , you must do a two tailed test .
Exam Techniques/Advice
- Remember, a decent hypothesis will contain two variables, in the case of an experimental hypothesis there will be an IV and a DV; in a correlational hypothesis there will be two co-variables
- both variables need to be fully operationalised to score the marks, that is you need to be very clear and specific about what you mean by your IV and your DV; if someone wanted to repeat your study, they should be able to look at your hypothesis and know exactly what to change between the two groups/conditions and exactly what to measure (including any units/explanation of rating scales etc, e.g. “where 1 is low and 7 is high”)
- double check the question, did it ask for a directional or non-directional hypothesis?
- if you were asked for a null hypothesis, make sure you always include the phrase “and any difference/correlation (is your study experimental or correlational?) that does arise will be due to chance alone”
Practice Questions:
- Mr Faraz wants to compare the levels of attendance between his psychology group and those of Mr Simon, who teaches a different psychology group. Which of the following is a suitable directional (one tailed) hypothesis for Mr Faraz’s investigation?
A There will be a difference in the levels of attendance between the two psychology groups.
B Students’ level of attendance will be higher in Mr Faraz’s group than Mr Simon’s group.
C Any difference in the levels of attendance between the two psychology groups is due to chance.
D The level of attendance of the students will depend upon who is teaching the groups.
2. Tracy works for the local council. The council is thinking about reducing the number of people it employs to pick up litter from the street. Tracy has been asked to carry out a study to see if having the streets cleaned at less regular intervals will affect the amount of litter the public will drop. She studies a street to compare how much litter is dropped at two different times, once when it has just been cleaned and once after it has not been cleaned for a month.
Write a fully operationalised non-directional (two-tailed) hypothesis for Tracy’s study. (2)
3. Jamila is conducting a practical investigation to look at gender differences in carrying out visuo-spatial tasks. She decides to give males and females a jigsaw puzzle and will time them to see who completes it the fastest. She uses a random sample of pupils from a local school to get her participants.
(a) Write a fully operationalised directional (one tailed) hypothesis for Jamila’s study. (2) (b) Outline one strength and one weakness of the random sampling method. You may refer to Jamila’s use of this type of sampling in your answer. (4)
4. Which of the following is a non-directional (two tailed) hypothesis?
A There is a difference in driving ability with men being better drivers than women
B Women are better at concentrating on more than one thing at a time than men
C Women spend more time doing the cooking and cleaning than men
D There is a difference in the number of men and women who participate in sports
Revision Activity
writing-hypotheses-revision-sheet
Quizizz link for teachers: https://quizizz.com/admin/quiz/5bf03f51add785001bc5a09e
Share this:
- Already have a WordPress.com account? Log in now.
- Subscribe Subscribed
- Copy shortlink
- Report this content
- View post in Reader
- Manage subscriptions
- Collapse this bar
Live revision! Join us for our free exam revision livestreams Watch now →
Reference Library
Collections
- See what's new
- All Resources
- Student Resources
- Assessment Resources
- Teaching Resources
- CPD Courses
- Livestreams
Study notes, videos, interactive activities and more!
Psychology news, insights and enrichment
Currated collections of free resources
Browse resources by topic
- All Psychology Resources
Resource Selections
Currated lists of resources
Directional Hypothesis
A directional hypothesis is a one-tailed hypothesis that states the direction of the difference or relationship (e.g. boys are more helpful than girls).
- Share on Facebook
- Share on Twitter
- Share by Email
Research Methods: MCQ Revision Test 1 for AQA A Level Psychology
Topic Videos
Example Answers for Research Methods: A Level Psychology, Paper 2, June 2018 (AQA)
Exam Support
Example Answer for Question 14 Paper 2: AS Psychology, June 2017 (AQA)
Model answer for question 11 paper 2: as psychology, june 2016 (aqa), a level psychology topic quiz - research methods.
Quizzes & Activities
Our subjects
- › Criminology
- › Economics
- › Geography
- › Health & Social Care
- › Psychology
- › Sociology
- › Teaching & learning resources
- › Student revision workshops
- › Online student courses
- › CPD for teachers
- › Livestreams
- › Teaching jobs
Boston House, 214 High Street, Boston Spa, West Yorkshire, LS23 6AD Tel: 01937 848885
- › Contact us
- › Terms of use
- › Privacy & cookies
© 2002-2024 Tutor2u Limited. Company Reg no: 04489574. VAT reg no 816865400.

Directional vs Non-Directional Hypothesis – Collect Feedback More Effectively
To conduct a perfect survey, you should know the basics of good research . That’s why in Startquestion we would like to share with you our knowledge about basic terms connected to online surveys and feedback gathering . Knowing the basis you can create surveys and conduct research in more effective ways and thanks to this get meaningful feedback from your customers, employees, and users. That’s enough for the introduction – let’s get to work. This time we will tell you about the hypothesis .
What is a Hypothesis?
A Hypothesis can be described as a theoretical statement built upon some evidence so that it can be tested as if it is true or false. In other words, a hypothesis is a speculation or an idea, based on insufficient evidence that allows it further analysis and experimentation.
The purpose of a hypothetical statement is to work like a prediction based on studied research and to provide some estimated results before it ha happens in a real position. There can be more than one hypothesis statement involved in a research study, where you need to question and explore different aspects of a proposed research topic. Before putting your research into directional vs non-directional hypotheses, let’s have some basic knowledge.
Most often, a hypothesis describes a relation between two or more variables. It includes:
An Independent variable – One that is controlled by the researcher
Dependent Variable – The variable that the researcher observes in association with the Independent variable.
Try one of the best survey tools for free!
Start trial period without any credit card or subscription. Easily conduct your research and gather feedback via link, social media, email, and more.
Create first survey
No credit card required · Cancel any time · GDRP Compilant
How to write an effective Hypothesis?
To write an effective hypothesis follow these essential steps.
- Inquire a Question
The very first step in writing an effective hypothesis is raising a question. Outline the research question very carefully keeping your research purpose in mind. Build it in a precise and targeted way. Here you must be clear about the research question vs hypothesis. A research question is the very beginning point of writing an effective hypothesis.
Do Literature Review
Once you are done with constructing your research question, you can start the literature review. A literature review is a collection of preliminary research studies done on the same or relevant topics. There is a diversified range of literature reviews. The most common ones are academic journals but it is not confined to that. It can be anything including your research, data collection, and observation.
At this point, you can build a conceptual framework. It can be defined as a visual representation of the estimated relationship between two variables subjected to research.
Frame an Answer
After a collection of literature reviews, you can find ways how to answer the question. Expect this stage as a point where you will be able to make a stand upon what you believe might have the exact outcome of your research. You must formulate this answer statement clearly and concisely.
Build a Hypothesis
At this point, you can firmly build your hypothesis. By now, you knew the answer to your question so make a hypothesis that includes:
- Applicable Variables
- Particular Group being Studied (Who/What)
- Probable Outcome of the Experiment
Remember, your hypothesis is a calculated assumption, it has to be constructed as a sentence, not a question. This is where research question vs hypothesis starts making sense.
Refine a Hypothesis
Make necessary amendments to the constructed hypothesis keeping in mind that it has to be targeted and provable. Moreover, you might encounter certain circumstances where you will be studying the difference between one or more groups. It can be correlational research. In such instances, you must have to testify the relationships that you believe you will find in the subject variables and through this research.
Build Null Hypothesis
Certain research studies require some statistical investigation to perform a data collection. Whenever applying any scientific method to construct a hypothesis, you must have adequate knowledge of the Null Hypothesis and an Alternative hypothesis.
Null Hypothesis:
A null Hypothesis denotes that there is no statistical relationship between the subject variables. It is applicable for a single group of variables or two groups of variables. A Null Hypothesis is denoted as an H0. This is the type of hypothesis that the researcher tries to invalidate. Some of the examples of null hypotheses are:
– Hyperactivity is not associated with eating sugar.
– All roses have an equal amount of petals.
– A person’s preference for a dress is not linked to its color.
Alternative Hypothesis:
An alternative hypothesis is a statement that is simply inverse or opposite of the null hypothesis and denoted as H1. Simply saying, it is an alternative statement for the null hypothesis. The same examples will go this way as an alternative hypothesis:
– Hyperactivity is associated with eating sugar.
– All roses do not have an equal amount of petals.
– A person’s preference for a dress is linked to its color.
Start your research right now: use professional survey templates
- Brand Awareness Survey
- Survey for the thesis
- Website Evaluation Survey
See more templates
Types of Hypothesis
Apart from null and alternative hypotheses, research hypotheses can be categorized into different types. Let’s have a look at them:
Simple Hypothesis:
This type of hypothesis is used to state a relationship between a particular independent variable and only a dependent variable.
Complex Hypothesis:
A statement that states the relationship between two or more independent variables and two or more dependent variables, is termed a complex hypothesis.
Associative and Causal Hypothesis:
This type of hypothesis involves predicting that there is a point of interdependency between two variables. It says that any kind of change in one variable will cause a change in the other one. Similarly, a casual hypothesis says that a change in the dependent variable is due to some variations in the independent variable.
Directional vs non-directional hypothesis
Directional hypothesis:.
A hypothesis that is built upon a certain directional relationship between two variables and constructed upon an already existing theory, is called a directional hypothesis. To understand more about what is directional hypothesis here is an example, Girls perform better than boys (‘better than’ shows the direction predicted)
Non-directional Hypothesis:
It involves an open-ended non-directional hypothesis that predicts that the independent variable will influence the dependent variable; however, the nature or direction of a relationship between two subject variables is not defined or clear.
For Example, there will be a difference in the performance of girls & boys (Not defining what kind of difference)
As a professional, we suggest you apply a non-directional alternative hypothesis when you are not sure of the direction of the relationship. Maybe you’re observing potential gender differences on some psychological test, but you don’t know whether men or women would have the higher ratio. Normally, this would say that you are lacking practical knowledge about the proposed variables. A directional test should be more common for tests.

Author: Ula Kamburov-Niepewna
Updated: 18 November 2022

12 Post Event Survey Questions to Ask
After your meticulously planned event concludes, there’s one crucial step left: gathering feedback. Post-event surveys are invaluable tools for understanding attendee experiences, identifying areas for improvement, and maintaining attendee satisfaction.

Yes or No Questions in Online Surveys
This article will discuss the benefits of using yes or no questions, explore common examples, and provide practical tips for using them effectively in your surveys.

How to Write Good Survey Questions
In this comprehensive guide, we will explore the impact of poorly designed survey questions, offer tips for crafting excellent and unbiased questionnaires, and provide examples of valid survey questions.
IMAGES
VIDEO
COMMENTS
A hypothesis test can either contain a directional hypothesis or a non-directional hypothesis: Directional hypothesis: The alternative hypothesis contains the less than ("<") or greater than (">") sign. This indicates that we're testing whether or not there is a positive or negative effect. Non-directional hypothesis: The alternative ...
A directional hypothesis refers to a type of hypothesis used in statistical testing that predicts a particular direction of the expected relationship between two variables. In simpler terms, a directional hypothesis is an educated, specific guess about the direction of an outcome—whether an increase, decrease, or a proclaimed difference in ...
One-tailed hypothesis tests are also known as directional and one-sided tests because you can test for effects in only one direction. When you perform a one-tailed test, the entire significance level percentage goes into the extreme end of one tail of the distribution. In the examples below, I use an alpha of 5%.
Hypothesis Testing >. A directional test is a hypothesis test where a direction is specified (e.g. above or below a certain threshold). For example you might be interested in whether a hypothesized mean is greater than a certain number (you're testing in the positive direction on the number line), or you might want to know if the mean is less ...
A statistical hypothesis is an assumption about a . For example, we may assume that the mean height of a male in the U.S. is 70 inches. The assumption about the height is the statistical hypothesis and the true mean height of a male in the U.S. is the population parameter.. To test whether a statistical hypothesis about a population parameter is true, we obtain a random sample from the ...
Directional hypotheses, also known as one-tailed hypotheses, are statements in research that make specific predictions about the direction of a relationship or difference between variables. Unlike non-directional hypotheses, which simply state that there is a relationship or difference without specifying its direction, directional hypotheses ...
5.2 - Writing Hypotheses. The first step in conducting a hypothesis test is to write the hypothesis statements that are going to be tested. For each test you will have a null hypothesis ( H 0) and an alternative hypothesis ( H a ). When writing hypotheses there are three things that we need to know: (1) the parameter that we are testing (2) the ...
There are 5 main steps in hypothesis testing: State your research hypothesis as a null hypothesis and alternate hypothesis (H o) and (H a or H 1 ). Collect data in a way designed to test the hypothesis. Perform an appropriate statistical test. Decide whether to reject or fail to reject your null hypothesis. Present the findings in your results ...
Definition: A directional hypothesis is a specific type of hypothesis statement in which the researcher predicts the direction or effect of the relationship between two variables. 1. ... Involves one-tailed test: Directional hypotheses typically require a one-tailed statistical test, as they are concerned with whether the relationship is ...
A directional hypothesis is a statement that predicts the direction of the relationship between two variables. Unlike non-directional hypotheses, which simply state that there is a relationship between variables without specifying the direction, directional hypotheses make a clear prediction about the expected outcome.
In a directional hypothesis test, also known as a one-tailed test, the statistical hypotheses specify with an increase or decrease in the population mean. That is, they make a statement about the direction of the effect. The Hypotheses for a Directional Test: H0: The test scores are not increased/decreased (the treatment doesn't work)
Type of Hypothesis Test: Two-tailed, non-directional: Right-tailed, directional: Left-tailed, directional: ... the z distribution is a normal distribution with a mean of 0 and standard deviation of 1. If we are conducting a one-tailed (i.e., right- or left-tailed) test, we look up the area of the sampling distribution that is beyond our test ...
Type of Hypothesis Test: Two-tailed, non-directional: Right-tailed, directional: ... When testing hypotheses about a mean difference, a \(t\) distribution is used to find the \(p\) value. The degrees of freedom are equal to \(n-1\) where \(n\) is the number of pairs. 4. Decide between the null and alternative hypotheses.
HYPOTHESIS TESTING. A clinical trial begins with an assumption or belief, and then proceeds to either prove or disprove this assumption. In statistical terms, this belief or assumption is known as a hypothesis. Counterintuitively, what the researcher believes in (or is trying to prove) is called the "alternate" hypothesis, and the opposite ...
A statistical hypothesis is an assumption about a population parameter.For example, we may assume that the mean height of a male in the U.S. is 70 inches. The assumption about the height is the statistical hypothesis and the true mean height of a male in the U.S. is the population parameter.. To test whether a statistical hypothesis about a population parameter is true, we obtain a random ...
Examples. A research hypothesis, in its plural form "hypotheses," is a specific, testable prediction about the anticipated results of a study, established at its outset. It is a key component of the scientific method. Hypotheses connect theory to data and guide the research process towards expanding scientific understanding.
One-tailed test, also called directional test or directional hypothesis, is a test widely used in statistics to determine if the critical region of a distribution is in one direction, or one-sided so as to know if its value is either less or more than a specific value. If the experiment lies in the one-sided critical region, it will result in ...
Directional hypothesis testing vs non-directional testing. ... We're testing to see if the mean of the sample group is either less than or greater than the mean of the control group, which - in statistical terms - is considered to be a two-direction or two-tailed test. Remember that the hypotheses were Ho:XbarA = XbarB and Ha: XbarA is not ...
Figure 7.5.1.1 7.5.1. 1 shows the critical region associated with a non-directional hypothesis test (also called a "two-sided test" because the calculated value might be in either tail of the distribution). Figure 7.5.1.1 7.5.1. 1 itself shows the sampling distribution of X (the scores we got).
The directional hypothesis can also state a negative correlation, e.g. the higher the number of face-book friends, the lower the life satisfaction score ". Non-directional hypothesis: A non-directional (or two tailed hypothesis) simply states that there will be a difference between the two groups/conditions but does not say which will be ...
There are seven different types of research hypotheses. Simple Hypothesis. A simple hypothesis predicts the relationship between a single dependent variable and a single independent variable. Complex Hypothesis. A complex hypothesis predicts the relationship between two or more independent and dependent variables. Directional Hypothesis.
A directional hypothesis is a one-tailed hypothesis that states the direction of the difference or relationship (e.g. boys are more helpful than girls). ... MCQ Revision Test 1 for AQA A Level Psychology Topic Videos. Example Answers for Research Methods: A Level Psychology, Paper 2, June 2018 (AQA) Exam Support ...
The Experimental Hypothesis: Directional A directional experimental hypothesis (also known as one-tailed) predicts the direction of the change/difference (it anticipates more specifically what might happen); A directional hypothesis is usually used when there is previous research which support a particular theory or outcome i.e. what a researcher might expect to happen
A Null Hypothesis is denoted as an H0. This is the type of hypothesis that the researcher tries to invalidate. Some of the examples of null hypotheses are: - Hyperactivity is not associated with eating sugar. - All roses have an equal amount of petals. - A person's preference for a dress is not linked to its color.