Social Work Research Methods That Drive the Practice

Social workers advocate for the well-being of individuals, families and communities. But how do social workers know what interventions are needed to help an individual? How do they assess whether a treatment plan is working? What do social workers use to write evidence-based policy?
Social work involves research-informed practice and practice-informed research. At every level, social workers need to know objective facts about the populations they serve, the efficacy of their interventions and the likelihood that their policies will improve lives. A variety of social work research methods make that possible.

Data-Driven Work
Data is a collection of facts used for reference and analysis. In a field as broad as social work, data comes in many forms.
Quantitative vs. Qualitative
As with any research, social work research involves both quantitative and qualitative studies.
Quantitative Research
Answers to questions like these can help social workers know about the populations they serve — or hope to serve in the future.
- How many students currently receive reduced-price school lunches in the local school district?
- How many hours per week does a specific individual consume digital media?
- How frequently did community members access a specific medical service last year?
Quantitative data — facts that can be measured and expressed numerically — are crucial for social work.
Quantitative research has advantages for social scientists. Such research can be more generalizable to large populations, as it uses specific sampling methods and lends itself to large datasets. It can provide important descriptive statistics about a specific population. Furthermore, by operationalizing variables, it can help social workers easily compare similar datasets with one another.
Qualitative Research
Qualitative data — facts that cannot be measured or expressed in terms of mere numbers or counts — offer rich insights into individuals, groups and societies. It can be collected via interviews and observations.
- What attitudes do students have toward the reduced-price school lunch program?
- What strategies do individuals use to moderate their weekly digital media consumption?
- What factors made community members more or less likely to access a specific medical service last year?
Qualitative research can thereby provide a textured view of social contexts and systems that may not have been possible with quantitative methods. Plus, it may even suggest new lines of inquiry for social work research.
Mixed Methods Research
Combining quantitative and qualitative methods into a single study is known as mixed methods research. This form of research has gained popularity in the study of social sciences, according to a 2019 report in the academic journal Theory and Society. Since quantitative and qualitative methods answer different questions, merging them into a single study can balance the limitations of each and potentially produce more in-depth findings.
However, mixed methods research is not without its drawbacks. Combining research methods increases the complexity of a study and generally requires a higher level of expertise to collect, analyze and interpret the data. It also requires a greater level of effort, time and often money.
The Importance of Research Design
Data-driven practice plays an essential role in social work. Unlike philanthropists and altruistic volunteers, social workers are obligated to operate from a scientific knowledge base.
To know whether their programs are effective, social workers must conduct research to determine results, aggregate those results into comprehensible data, analyze and interpret their findings, and use evidence to justify next steps.
Employing the proper design ensures that any evidence obtained during research enables social workers to reliably answer their research questions.
Research Methods in Social Work
The various social work research methods have specific benefits and limitations determined by context. Common research methods include surveys, program evaluations, needs assessments, randomized controlled trials, descriptive studies and single-system designs.
Surveys involve a hypothesis and a series of questions in order to test that hypothesis. Social work researchers will send out a survey, receive responses, aggregate the results, analyze the data, and form conclusions based on trends.
Surveys are one of the most common research methods social workers use — and for good reason. They tend to be relatively simple and are usually affordable. However, surveys generally require large participant groups, and self-reports from survey respondents are not always reliable.
Program Evaluations
Social workers ally with all sorts of programs: after-school programs, government initiatives, nonprofit projects and private programs, for example.
Crucially, social workers must evaluate a program’s effectiveness in order to determine whether the program is meeting its goals and what improvements can be made to better serve the program’s target population.
Evidence-based programming helps everyone save money and time, and comparing programs with one another can help social workers make decisions about how to structure new initiatives. Evaluating programs becomes complicated, however, when programs have multiple goal metrics, some of which may be vague or difficult to assess (e.g., “we aim to promote the well-being of our community”).
Needs Assessments
Social workers use needs assessments to identify services and necessities that a population lacks access to.
Common social work populations that researchers may perform needs assessments on include:
- People in a specific income group
- Everyone in a specific geographic region
- A specific ethnic group
- People in a specific age group
In the field, a social worker may use a combination of methods (e.g., surveys and descriptive studies) to learn more about a specific population or program. Social workers look for gaps between the actual context and a population’s or individual’s “wants” or desires.
For example, a social worker could conduct a needs assessment with an individual with cancer trying to navigate the complex medical-industrial system. The social worker may ask the client questions about the number of hours they spend scheduling doctor’s appointments, commuting and managing their many medications. After learning more about the specific client needs, the social worker can identify opportunities for improvements in an updated care plan.
In policy and program development, social workers conduct needs assessments to determine where and how to effect change on a much larger scale. Integral to social work at all levels, needs assessments reveal crucial information about a population’s needs to researchers, policymakers and other stakeholders. Needs assessments may fall short, however, in revealing the root causes of those needs (e.g., structural racism).
Randomized Controlled Trials
Randomized controlled trials are studies in which a randomly selected group is subjected to a variable (e.g., a specific stimulus or treatment) and a control group is not. Social workers then measure and compare the results of the randomized group with the control group in order to glean insights about the effectiveness of a particular intervention or treatment.
Randomized controlled trials are easily reproducible and highly measurable. They’re useful when results are easily quantifiable. However, this method is less helpful when results are not easily quantifiable (i.e., when rich data such as narratives and on-the-ground observations are needed).
Descriptive Studies
Descriptive studies immerse the researcher in another context or culture to study specific participant practices or ways of living. Descriptive studies, including descriptive ethnographic studies, may overlap with and include other research methods:
- Informant interviews
- Census data
- Observation
By using descriptive studies, researchers may glean a richer, deeper understanding of a nuanced culture or group on-site. The main limitations of this research method are that it tends to be time-consuming and expensive.
Single-System Designs
Unlike most medical studies, which involve testing a drug or treatment on two groups — an experimental group that receives the drug/treatment and a control group that does not — single-system designs allow researchers to study just one group (e.g., an individual or family).
Single-system designs typically entail studying a single group over a long period of time and may involve assessing the group’s response to multiple variables.
For example, consider a study on how media consumption affects a person’s mood. One way to test a hypothesis that consuming media correlates with low mood would be to observe two groups: a control group (no media) and an experimental group (two hours of media per day). When employing a single-system design, however, researchers would observe a single participant as they watch two hours of media per day for one week and then four hours per day of media the next week.
These designs allow researchers to test multiple variables over a longer period of time. However, similar to descriptive studies, single-system designs can be fairly time-consuming and costly.
Learn More About Social Work Research Methods
Social workers have the opportunity to improve the social environment by advocating for the vulnerable — including children, older adults and people with disabilities — and facilitating and developing resources and programs.
Learn more about how you can earn your Master of Social Work online at Virginia Commonwealth University . The highest-ranking school of social work in Virginia, VCU has a wide range of courses online. That means students can earn their degrees with the flexibility of learning at home. Learn more about how you can take your career in social work further with VCU.
From M.S.W. to LCSW: Understanding Your Career Path as a Social Worker
How Palliative Care Social Workers Support Patients With Terminal Illnesses
How to Become a Social Worker in Health Care
Gov.uk, Mixed Methods Study
MVS Open Press, Foundations of Social Work Research
Open Social Work Education, Scientific Inquiry in Social Work
Open Social Work, Graduate Research Methods in Social Work: A Project-Based Approach
Routledge, Research for Social Workers: An Introduction to Methods
SAGE Publications, Research Methods for Social Work: A Problem-Based Approach
Theory and Society, Mixed Methods Research: What It Is and What It Could Be
READY TO GET STARTED WITH OUR ONLINE M.S.W. PROGRAM FORMAT?
Bachelor’s degree is required.
VCU Program Helper
This AI chatbot provides automated responses, which may not always be accurate. By continuing with this conversation, you agree that the contents of this chat session may be transcribed and retained. You also consent that this chat session and your interactions, including cookie usage, are subject to our privacy policy .
S371 Social Work Research - Jill Chonody: What is Quantitative Research?
- Choosing a Topic
- Choosing Search Terms
- What is Quantitative Research?
- Requesting Materials
Quantitative Research in the Social Sciences
This page is courtesy of University of Southern California: http://libguides.usc.edu/content.php?pid=83009&sid=615867
Quantitative methods emphasize objective measurements and the statistical, mathematical, or numerical analysis of data collected through polls, questionnaires, and surveys, or by manipulating pre-existing statistical data using computational techniques . Quantitative research focuses on gathering numerical data and generalizing it across groups of people or to explain a particular phenomenon.
Babbie, Earl R. The Practice of Social Research . 12th ed. Belmont, CA: Wadsworth Cengage, 2010; Muijs, Daniel. Doing Quantitative Research in Education with SPSS . 2nd edition. London: SAGE Publications, 2010.
Characteristics of Quantitative Research
Your goal in conducting quantitative research study is to determine the relationship between one thing [an independent variable] and another [a dependent or outcome variable] within a population. Quantitative research designs are either descriptive [subjects usually measured once] or experimental [subjects measured before and after a treatment]. A descriptive study establishes only associations between variables; an experimental study establishes causality.
Quantitative research deals in numbers, logic, and an objective stance. Quantitative research focuses on numberic and unchanging data and detailed, convergent reasoning rather than divergent reasoning [i.e., the generation of a variety of ideas about a research problem in a spontaneous, free-flowing manner].
Its main characteristics are :
- The data is usually gathered using structured research instruments.
- The results are based on larger sample sizes that are representative of the population.
- The research study can usually be replicated or repeated, given its high reliability.
- Researcher has a clearly defined research question to which objective answers are sought.
- All aspects of the study are carefully designed before data is collected.
- Data are in the form of numbers and statistics, often arranged in tables, charts, figures, or other non-textual forms.
- Project can be used to generalize concepts more widely, predict future results, or investigate causal relationships.
- Researcher uses tools, such as questionnaires or computer software, to collect numerical data.
The overarching aim of a quantitative research study is to classify features, count them, and construct statistical models in an attempt to explain what is observed.
Things to keep in mind when reporting the results of a study using quantiative methods :
- Explain the data collected and their statistical treatment as well as all relevant results in relation to the research problem you are investigating. Interpretation of results is not appropriate in this section.
- Report unanticipated events that occurred during your data collection. Explain how the actual analysis differs from the planned analysis. Explain your handling of missing data and why any missing data does not undermine the validity of your analysis.
- Explain the techniques you used to "clean" your data set.
- Choose a minimally sufficient statistical procedure ; provide a rationale for its use and a reference for it. Specify any computer programs used.
- Describe the assumptions for each procedure and the steps you took to ensure that they were not violated.
- When using inferential statistics , provide the descriptive statistics, confidence intervals, and sample sizes for each variable as well as the value of the test statistic, its direction, the degrees of freedom, and the significance level [report the actual p value].
- Avoid inferring causality , particularly in nonrandomized designs or without further experimentation.
- Use tables to provide exact values ; use figures to convey global effects. Keep figures small in size; include graphic representations of confidence intervals whenever possible.
- Always tell the reader what to look for in tables and figures .
NOTE: When using pre-existing statistical data gathered and made available by anyone other than yourself [e.g., government agency], you still must report on the methods that were used to gather the data and describe any missing data that exists and, if there is any, provide a clear explanation why the missing datat does not undermine the validity of your final analysis.
Babbie, Earl R. The Practice of Social Research . 12th ed. Belmont, CA: Wadsworth Cengage, 2010; Brians, Craig Leonard et al. Empirical Political Analysis: Quantitative and Qualitative Research Methods . 8th ed. Boston, MA: Longman, 2011; McNabb, David E. Research Methods in Public Administration and Nonprofit Management: Quantitative and Qualitative Approaches . 2nd ed. Armonk, NY: M.E. Sharpe, 2008; Quantitative Research Methods . Writing@CSU. Colorado State University; Singh, Kultar. Quantitative Social Research Methods . Los Angeles, CA: Sage, 2007.
Basic Research Designs for Quantitative Studies
Before designing a quantitative research study, you must decide whether it will be descriptive or experimental because this will dictate how you gather, analyze, and interpret the results. A descriptive study is governed by the following rules: subjects are generally measured once; the intention is to only establish associations between variables; and, the study may include a sample population of hundreds or thousands of subjects to ensure that a valid estimate of a generalized relationship between variables has been obtained. An experimental design includes subjects measured before and after a particular treatment, the sample population may be very small and purposefully chosen, and it is intended to establish causality between variables. Introduction The introduction to a quantitative study is usually written in the present tense and from the third person point of view. It covers the following information:
- Identifies the research problem -- as with any academic study, you must state clearly and concisely the research problem being investigated.
- Reviews the literature -- review scholarship on the topic, synthesizing key themes and, if necessary, noting studies that have used similar methods of inquiry and analysis. Note where key gaps exist and how your study helps to fill these gaps or clarifies existing knowledge.
- Describes the theoretical framework -- provide an outline of the theory or hypothesis underpinning your study. If necessary, define unfamiliar or complex terms, concepts, or ideas and provide the appropriate background information to place the research problem in proper context [e.g., historical, cultural, economic, etc.].
Methodology The methods section of a quantitative study should describe how each objective of your study will be achieved. Be sure to provide enough detail to enable the reader can make an informed assessment of the methods being used to obtain results associated with the research problem. The methods section should be presented in the past tense.
- Study population and sampling -- where did the data come from; how robust is it; note where gaps exist or what was excluded. Note the procedures used for their selection;
- Data collection – describe the tools and methods used to collect information and identify the variables being measured; describe the methods used to obtain the data; and, note if the data was pre-existing [i.e., government data] or you gathered it yourself. If you gathered it yourself, describe what type of instrument you used and why. Note that no data set is perfect--describe any limitations in methods of gathering data.
- Data analysis -- describe the procedures for processing and analyzing the data. If appropriate, describe the specific instruments of analysis used to study each research objective, including mathematical techniques and the type of computer software used to manipulate the data.
Results The finding of your study should be written objectively and in a succinct and precise format. In quantitative studies, it is common to use graphs, tables, charts, and other non-textual elements to help the reader understand the data. Make sure that non-textual elements do not stand in isolation from the text but are being used to supplement the overall description of the results and to help clarify key points being made. Further information about how to effectively present data using charts and graphs can be found here .
- Statistical analysis -- how did you analyze the data? What were the key findings from the data? The findings should be present in a logical, sequential order. Describe but do not interpret these trends or negative results; save that for the discussion section. The results should be presented in the past tense.
Discussion Discussions should be analytic, logical, and comprehensive. The discussion should meld together your findings in relation to those identified in the literature review, and placed within the context of the theoretical framework underpinning the study. The discussion should be presented in the present tense.
- Interpretation of results -- reiterate the research problem being investigated and compare and contrast the findings with the research questions underlying the study. Did they affirm predicted outcomes or did the data refute it?
- Description of trends, comparison of groups, or relationships among variables -- describe any trends that emerged from your analysis and explain all unanticipated and statistical insignificant findings.
- Discussion of implications – what is the meaning of your results? Highlight key findings based on the overall results and note findings that you believe are important. How have the results helped fill gaps in understanding the research problem?
- Limitations -- describe any limitations or unavoidable bias in your study and, if necessary, note why these limitations did not inhibit effective interpretation of the results.
Conclusion End your study by to summarizing the topic and provide a final comment and assessment of the study.
- Summary of findings – synthesize the answers to your research questions. Do not report any statistical data here; just provide a narrative summary of the key findings and describe what was learned that you did not know before conducting the study.
- Recommendations – if appropriate to the aim of the assignment, tie key findings with policy recommendations or actions to be taken in practice.
- Future research – note the need for future research linked to your study’s limitations or to any remaining gaps in the literature that were not addressed in your study.
Black, Thomas R. Doing Quantitative Research in the Social Sciences: An Integrated Approach to Research Design, Measurement and Statistics . London: Sage, 1999; Gay,L. R. and Peter Airasain. Educational Research: Competencies for Analysis and Applications . 7th edition. Upper Saddle River, NJ: Merril Prentice Hall, 2003; Hector, Anestine. An Overview of Quantitative Research in Compostion and TESOL . Department of English, Indiana University of Pennsylvania; Hopkins, Will G. “Quantitative Research Design.” Sportscience 4, 1 (2000); A Strategy for Writing Up Research Results . The Structure, Format, Content, and Style of a Journal-Style Scientific Paper. Department of Biology. Bates College; Nenty, H. Johnson. "Writing a Quantitative Research Thesis." International Journal of Educational Science 1 (2009): 19-32; Ouyang, Ronghua (John). Basic Inquiry of Quantitative Research . Kennesaw State University.
- << Previous: Finding Quantitative Research
- Next: Databases >>
- Last Updated: Jul 11, 2023 1:03 PM
- URL: https://libguides.iun.edu/S371socialworkresearch
Graduate research methods in social work
(2 reviews)
Matt DeCarlo, La Salle University
Cory Cummings, Nazareth University
Kate Agnelli, Virginia Commonwealth University
Copyright Year: 2021
ISBN 13: 9781949373219
Publisher: Open Social Work Education
Language: English
Formats Available
Conditions of use.
Learn more about reviews.
Reviewed by Laura Montero, Full-time Lecturer and Course Lead, Metropolitan State University of Denver on 12/23/23
Graduate Research Methods in Social Work by DeCarlo, et al., is a comprehensive and well-structured guide that serves as an invaluable resource for graduate students delving into the intricate world of social work research. The book is divided... read more
Comprehensiveness rating: 4 see less
Graduate Research Methods in Social Work by DeCarlo, et al., is a comprehensive and well-structured guide that serves as an invaluable resource for graduate students delving into the intricate world of social work research. The book is divided into five distinct parts, each carefully curated to provide a step-by-step approach to mastering research methods in the field. Topics covered include an intro to basic research concepts, conceptualization, quantitative & qualitative approaches, as well as research in practice. At 800+ pages, however, the text could be received by students as a bit overwhelming.
Content Accuracy rating: 5
Content appears consistent and reliable when compared to similar textbooks in this topic.
Relevance/Longevity rating: 5
The book's well-structured content begins with fundamental concepts, such as the scientific method and evidence-based practice, guiding readers through the initiation of research projects with attention to ethical considerations. It seamlessly transitions to detailed explorations of both quantitative and qualitative methods, covering topics like sampling, measurement, survey design, and various qualitative data collection approaches. Throughout, the authors emphasize ethical responsibilities, cultural respectfulness, and critical thinking. These are crucial concepts we cover in social work and I was pleased to see these being integrated throughout.
Clarity rating: 5
The level of the language used is appropriate for graduate-level study.
Consistency rating: 5
Book appears to be consistent in the tone and terminology used.
Modularity rating: 4
The images and videos included, help to break up large text blocks.
Organization/Structure/Flow rating: 5
Topics covered are well-organized and comprehensive. I appreciate the thorough preamble the authors include to situate the role of the social worker within a research context.
Interface rating: 4
When downloaded as a pdf, the book does not begin until page 30+ so it may be a bit difficult to scroll so long for students in order to access the content for which they are searching. Also, making the Table of Contents clickable, would help in navigating this very long textbook.
Grammatical Errors rating: 5
I did not find any grammatical errors or typos in the pages reviewed.
Cultural Relevance rating: 5
I appreciate the efforts made to integrate diverse perspectives, voices, and images into the text. The discussion around ethics and cultural considerations in research was nuanced and comprehensive as well.
Overall, the content of the book aligns with established principles of social work research, providing accurate and up-to-date information in a format that is accessible to graduate students and educators in the field.
Reviewed by Elisa Maroney, Professor, Western Oregon University on 1/2/22
With well over 800 pages, this text is beyond comprehensive! read more
Comprehensiveness rating: 5 see less
With well over 800 pages, this text is beyond comprehensive!
I perused the entire text, but my focus was on "Part 4: Using qualitative methods." This section seems accurate.
As mentioned above, my primary focus was on the qualitative methods section. This section is relevant to the students I teach in interpreting studies (not a social sciences discipline).
This book is well-written and clear.
Navigating this text is easy, because the formatting is consistent
Modularity rating: 5
My favorite part of this text is that I can be easily customized, so that I can use the sections on qualitative methods.
The text is well-organized and easy to find and link to related sections in the book.
Interface rating: 5
There are no distracting or confusing features. The book is long; being able to customize makes it easier to navigate.
I did not notice grammatical errors.
The authors offer resources for Afrocentricity for social work practice (among others, including those related to Feminist and Queer methodologies). These are relevant to the field of interpreting studies.
I look forward to adopting this text in my qualitative methods course for graduate students in interpreting studies.
Table of Contents
- 1. Science and social work
- 2. Starting your research project
- 3. Searching the literature
- 4. Critical information literacy
- 5. Writing your literature review
- 6. Research ethics
- 7. Theory and paradigm
- 8. Reasoning and causality
- 9. Writing your research question
- 10. Quantitative sampling
- 11. Quantitative measurement
- 12. Survey design
- 13. Experimental design
- 14. Univariate analysis
- 15. Bivariate analysis
- 16. Reporting quantitative results
- 17. Qualitative data and sampling
- 18. Qualitative data collection
- 19. A survey of approaches to qualitative data analysis
- 20. Quality in qualitative studies: Rigor in research design
- 21. Qualitative research dissemination
- 22. A survey of qualitative designs
- 23. Program evaluation
- 24. Sharing and consuming research
Ancillary Material
About the book.
We designed our book to help graduate social work students through every step of the research process, from conceptualization to dissemination. Our textbook centers cultural humility, information literacy, pragmatism, and an equal emphasis on quantitative and qualitative methods. It includes extensive content on literature reviews, cultural bias and respectfulness, and qualitative methods, in contrast to traditionally used commercial textbooks in social work research.
Our author team spans across academic, public, and nonprofit social work research. We love research, and we endeavored through our book to make research more engaging, less painful, and easier to understand. Our textbook exercises direct students to apply content as they are reading the book to an original research project. By breaking it down step-by-step, writing in approachable language, as well as using stories from our life, practice, and research experience, our textbook helps professors overcome students’ research methods anxiety and antipathy.
If you decide to adopt our resource, we ask that you complete this short Adopter’s Survey that helps us keep track of our community impact. You can also contact [email protected] for a student workbook, homework assignments, slideshows, a draft bank of quiz questions, and a course calendar.
About the Contributors
Matt DeCarlo , PhD, MSW is an assistant professor in the Department of Social Work at La Salle University. He is the co-founder of Open Social Work (formerly Open Social Work Education), a collaborative project focusing on open education, open science, and open access in social work and higher education. His first open textbook, Scientific Inquiry in Social Work, was the first developed for social work education, and is now in use in over 60 campuses, mostly in the United States. He is a former OER Research Fellow with the OpenEd Group. Prior to his work in OER, Dr. DeCarlo received his PhD from Virginia Commonwealth University and has published on disability policy.
Cory Cummings , Ph.D., LCSW is an assistant professor in the Department of Social Work at Nazareth University. He has practice experience in community mental health, including clinical practice and administration. In addition, Dr. Cummings has volunteered at safety net mental health services agencies and provided support services for individuals and families affected by HIV. In his current position, Dr. Cummings teaches in the BSW program and MSW programs; specifically in the Clinical Practice with Children and Families concentration. Courses that he teaches include research, social work practice, and clinical field seminar. His scholarship focuses on promoting health equity for individuals experiencing symptoms of severe mental illness and improving opportunities to increase quality of life. Dr. Cummings received his PhD from Virginia Commonwealth University.
Kate Agnelli , MSW, is an adjunct professor at VCU’s School of Social Work, teaching masters-level classes on research methods, public policy, and social justice. She also works as a senior legislative analyst with the Joint Legislative Audit and Review Commission (JLARC), a policy research organization reporting to the Virginia General Assembly. Before working for JLARC, Ms. Agnelli worked for several years in government and nonprofit research and program evaluation. In addition, she has several publications in peer-reviewed journals, has presented at national social work conferences, and has served as a reviewer for Social Work Education. She received her MSW from Virginia Commonwealth University.
Contribute to this Page
- Technical Support
- Find My Rep
You are here
The Handbook of Social Work Research Methods
- Bruce Thyer - Florida State University, USA
- Description
Click on the Supplements tab above for further details on the different versions of SPSS programs. The canonical Handbook is completely updated with more student-friendly features
The Handbook of Social Work Research Methods is a cutting-edge volume that covers all the major topics that are relevant for Social Work Research methods. Edited by Bruce Thyer and containing contributions by leading authorities, this Handbook covers both qualitative and quantitative approaches as well as a section that delves into more general issues such as evidence based practice, ethics, gender, ethnicity, International Issues, integrating both approaches, and applying for grants.
New to this Edition
- More content on qualitative methods and mixed methods
- More coverage of evidence-based practice
- More support to help students effectively use the Internet
- A companion Web site at www.sagepub.com/thyerhdbk2e containing a test bank and PowerPoint slides for instructors and relevant SAGE journal articles for students.
This Handbook serves as a primary text in the methods courses in MSW programs and doctoral level programs. It can also be used as a reference and research design tool for anyone doing scholarly research in social work or human services.
See what’s new to this edition by selecting the Features tab on this page. Should you need additional information or have questions regarding the HEOA information provided for this title, including what is new to this edition, please email [email protected] . Please include your name, contact information, and the name of the title for which you would like more information. For information on the HEOA, please go to http://ed.gov/policy/highered/leg/hea08/index.html .
For assistance with your order: Please email us at [email protected] or connect with your SAGE representative.
SAGE 2455 Teller Road Thousand Oaks, CA 91320 www.sagepub.com
This book was not a good fit for my course. I adopted Research Methods in Practice (Remler and Van Ryzin) instead.
This textbook is exactly what I was looking for to update my course! It is comprehensive, yet easy to digest for an introduction course.
The topics were too dispersed - it could be a resource book but not my primary book.
I like Thyer's book, but I will use it as a recommended text, rather than a main text my research methods course. It can be a great resource for the doctoral students. For my needs, the text I currently use, Engel and Schutt, I think does a better job in covering Social Work research methodology. It has good structure and a continuity of ideas and themes.
Not as well written or as thorough as Essential Research Methods for Social Workers (Rubin)
- An outstanding cast of contributors
- Offers students the depth of topic that is difficult to achieve with a single authored text.
- More coverage of Evidence Based Practice
Sample Materials & Chapters
Chapter 1 - Introductory Principles of SocialWork Research
Chapter 3 - Probability and Sampling
For instructors
Select a purchasing option.

This title is also available on SAGE Research Methods , the ultimate digital methods library. If your library doesn’t have access, ask your librarian to start a trial .
- Help & Terms of Use
Quantitative Research Methods for Social Work: Making Social Work Count
- School for Policy Studies
Research output : Book/Report › Authored book
- Quantitative Research Methods
- Social Work
- Persistent link
Fingerprint
- Social Work Social Sciences 100%
- Quantitative Research Method Social Sciences 100%
- Books Social Sciences 40%
- Research Social Sciences 40%
- Social Scientists Social Sciences 40%
- Understanding Social Sciences 40%
- UK Social Sciences 40%
- Skills Social Sciences 40%
T1 - Quantitative Research Methods for Social Work
T2 - Making Social Work Count
AU - Teater, Barbra
AU - Devaney, John
AU - Forrester, Donald
AU - Scourfield, Jonathan
AU - Carpenter, John
PY - 2017/1/1
Y1 - 2017/1/1
N2 - Social work knowledge and understanding draws heavily on research, and the ability to critically analyse research findings is a core skill for social workers. However, while many social work students are confident in reading qualitative data, a lack of understanding in basic statistical concepts means that this same confidence does not always apply to quantitative data.The book arose from a curriculum development project funded by the Economic and Social Research Council (ESRC), in conjunction with the Higher Education Funding Council for England, the British Academy and the Nuffield Foundation. This was part of a wider initiative to increase the numbers of quantitative social scientists in the UK in order to address an identified skills gap. This gap related to both the conduct of quantitative research and the literacy of social scientists in being able to read and interpret statistical information. The book is a comprehensive resource for students and educators. It is packed with activities and examples from social work covering the basic concepts of quantitative research methods – including reliability, validity, probability, variables and hypothesis testing – and explores key areas of data collection, analysis and evaluation, providing a detailed examination of their application to social work practice.
AB - Social work knowledge and understanding draws heavily on research, and the ability to critically analyse research findings is a core skill for social workers. However, while many social work students are confident in reading qualitative data, a lack of understanding in basic statistical concepts means that this same confidence does not always apply to quantitative data.The book arose from a curriculum development project funded by the Economic and Social Research Council (ESRC), in conjunction with the Higher Education Funding Council for England, the British Academy and the Nuffield Foundation. This was part of a wider initiative to increase the numbers of quantitative social scientists in the UK in order to address an identified skills gap. This gap related to both the conduct of quantitative research and the literacy of social scientists in being able to read and interpret statistical information. The book is a comprehensive resource for students and educators. It is packed with activities and examples from social work covering the basic concepts of quantitative research methods – including reliability, validity, probability, variables and hypothesis testing – and explores key areas of data collection, analysis and evaluation, providing a detailed examination of their application to social work practice.
KW - Quantitative Research Methods
KW - Social Work
M3 - Authored book
SN - 978-1-137-40026-0
BT - Quantitative Research Methods for Social Work
PB - Palgrave Macmillan
CY - London
- Search Menu
- Advance articles
- Editor's Choice
- Author Guidelines
- Submission Site
- Open Access
- About The British Journal of Social Work
- About the British Association of Social Workers
- Editorial Board
- Advertising and Corporate Services
- Journals Career Network
- Self-Archiving Policy
- Dispatch Dates
- Journals on Oxford Academic
- Books on Oxford Academic

Article Contents
- Introduction
- Quantitative research in social work
- Limitations
- Acknowledgements
- < Previous
Nature and Extent of Quantitative Research in Social Work Journals: A Systematic Review from 2016 to 2020
- Article contents
- Figures & tables
- Supplementary Data
Sebastian Kurten, Nausikaä Brimmel, Kathrin Klein, Katharina Hutter, Nature and Extent of Quantitative Research in Social Work Journals: A Systematic Review from 2016 to 2020, The British Journal of Social Work , Volume 52, Issue 4, June 2022, Pages 2008–2023, https://doi.org/10.1093/bjsw/bcab171
- Permissions Icon Permissions
This study reviews 1,406 research articles published between 2016 and 2020 in the European Journal of Social Work (EJSW), the British Journal of Social Work (BJSW) and Research on Social Work Practice (RSWP). It assesses the proportion and complexity of quantitative research designs amongst published articles and investigates differences between the journals. Furthermore, the review investigates the complexity of the statistical methods employed and identifies the most frequently addressed topics. From the 1,406 articles, 504 (35.8 percent) used a qualitative methodology, 389 (27.7 percent) used a quantitative methodology, 85 (6 percent) used the mixed methods (6 percent), 253 (18 percent) articles were theoretical in nature, 148 (10.5 percent) conducted reviews and 27 (1.9 percent) gave project overviews. The proportion of quantitative research articles was higher in RSWP (55.4 percent) than in the EJSW (14.1 percent) and the BJSW (20.5 percent). The topic analysis could identify at least forty different topics addressed by the articles. Although the proportion of quantitative research is rather small in social work research, the review could not find evidence that it is of low sophistication. Finally, this study concludes that future research would benefit from making explicit why a certain methodology was chosen.
Email alerts
Citing articles via.
- Recommend to your Library
Affiliations
- Online ISSN 1468-263X
- Print ISSN 0045-3102
- Copyright © 2024 British Association of Social Workers
- About Oxford Academic
- Publish journals with us
- University press partners
- What we publish
- New features
- Open access
- Institutional account management
- Rights and permissions
- Get help with access
- Accessibility
- Advertising
- Media enquiries
- Oxford University Press
- Oxford Languages
- University of Oxford
Oxford University Press is a department of the University of Oxford. It furthers the University's objective of excellence in research, scholarship, and education by publishing worldwide
- Copyright © 2024 Oxford University Press
- Cookie settings
- Cookie policy
- Privacy policy
- Legal notice
This Feature Is Available To Subscribers Only
Sign In or Create an Account
This PDF is available to Subscribers Only
For full access to this pdf, sign in to an existing account, or purchase an annual subscription.
- Subject List
- Take a Tour
- For Authors
- Subscriber Services
- Publications
- African American Studies
- African Studies
- American Literature
- Anthropology
- Architecture Planning and Preservation
- Art History
- Atlantic History
- Biblical Studies
- British and Irish Literature
- Childhood Studies
- Chinese Studies
- Cinema and Media Studies
- Communication
- Criminology
- Environmental Science
- Evolutionary Biology
- International Law
- International Relations
- Islamic Studies
- Jewish Studies
- Latin American Studies
- Latino Studies
- Linguistics
- Literary and Critical Theory
- Medieval Studies
- Military History
- Political Science
- Public Health
- Renaissance and Reformation
Social Work
- Urban Studies
- Victorian Literature
- Browse All Subjects
How to Subscribe
- Free Trials
In This Article Expand or collapse the "in this article" section Social Work Research Methods
Introduction.
- History of Social Work Research Methods
- Feasibility Issues Influencing the Research Process
- Measurement Methods
- Existing Scales
- Group Experimental and Quasi-Experimental Designs for Evaluating Outcome
- Single-System Designs for Evaluating Outcome
- Program Evaluation
- Surveys and Sampling
- Introductory Statistics Texts
- Advanced Aspects of Inferential Statistics
- Qualitative Research Methods
- Qualitative Data Analysis
- Historical Research Methods
- Meta-Analysis and Systematic Reviews
- Research Ethics
- Culturally Competent Research Methods
- Teaching Social Work Research Methods
Related Articles Expand or collapse the "related articles" section about
About related articles close popup.
Lorem Ipsum Sit Dolor Amet
Vestibulum ante ipsum primis in faucibus orci luctus et ultrices posuere cubilia Curae; Aliquam ligula odio, euismod ut aliquam et, vestibulum nec risus. Nulla viverra, arcu et iaculis consequat, justo diam ornare tellus, semper ultrices tellus nunc eu tellus.
- Community-Based Participatory Research
- Economic Evaluation
- Evidence-based Social Work Practice
- Evidence-based Social Work Practice: Finding Evidence
- Evidence-based Social Work Practice: Issues, Controversies, and Debates
- Experimental and Quasi-Experimental Designs
- Impact of Emerging Technology in Social Work Practice
- Implementation Science and Practice
- Interviewing
- Measurement, Scales, and Indices
- Meta-analysis
- Occupational Social Work
- Postmodernism and Social Work
- Qualitative Research
- Research, Best Practices, and Evidence-based Group Work
- Social Intervention Research
- Social Work Profession
- Systematic Review Methods
- Technology for Social Work Interventions
Other Subject Areas
Forthcoming articles expand or collapse the "forthcoming articles" section.
- Child Welfare Effectiveness
- Rare and Orphan Diseases and Social Work Practice
- Unaccompanied Immigrant and Refugee Children
- Find more forthcoming articles...
- Export Citations
- Share This Facebook LinkedIn Twitter
Social Work Research Methods by Allen Rubin LAST REVIEWED: 14 December 2009 LAST MODIFIED: 14 December 2009 DOI: 10.1093/obo/9780195389678-0008
Social work research means conducting an investigation in accordance with the scientific method. The aim of social work research is to build the social work knowledge base in order to solve practical problems in social work practice or social policy. Investigating phenomena in accordance with the scientific method requires maximal adherence to empirical principles, such as basing conclusions on observations that have been gathered in a systematic, comprehensive, and objective fashion. The resources in this entry discuss how to do that as well as how to utilize and teach research methods in social work. Other professions and disciplines commonly produce applied research that can guide social policy or social work practice. Yet no commonly accepted distinction exists at this time between social work research methods and research methods in allied fields relevant to social work. Consequently useful references pertaining to research methods in allied fields that can be applied to social work research are included in this entry.
This section includes basic textbooks that are used in courses on social work research methods. Considerable variation exists between textbooks on the broad topic of social work research methods. Some are comprehensive and delve into topics deeply and at a more advanced level than others. That variation is due in part to the different needs of instructors at the undergraduate and graduate levels of social work education. Most instructors at the undergraduate level prefer shorter and relatively simplified texts; however, some instructors teaching introductory master’s courses on research prefer such texts too. The texts in this section that might best fit their preferences are by Yegidis and Weinbach 2009 and Rubin and Babbie 2007 . The remaining books might fit the needs of instructors at both levels who prefer a more comprehensive and deeper coverage of research methods. Among them Rubin and Babbie 2008 is perhaps the most extensive and is often used at the doctoral level as well as the master’s and undergraduate levels. Also extensive are Drake and Jonson-Reid 2007 , Grinnell and Unrau 2007 , Kreuger and Neuman 2006 , and Thyer 2001 . What distinguishes Drake and Jonson-Reid 2007 is its heavy inclusion of statistical and Statistical Package for the Social Sciences (SPSS) content integrated with each chapter. Grinnell and Unrau 2007 and Thyer 2001 are unique in that they are edited volumes with different authors for each chapter. Kreuger and Neuman 2006 takes Neuman’s social sciences research text and adapts it to social work. The Practitioner’s Guide to Using Research for Evidence-based Practice ( Rubin 2007 ) emphasizes the critical appraisal of research, covering basic research methods content in a relatively simplified format for instructors who want to teach research methods as part of the evidence-based practice process instead of with the aim of teaching students how to produce research.
Drake, Brett, and Melissa Jonson-Reid. 2007. Social work research methods: From conceptualization to dissemination . Boston: Allyn and Bacon.
This introductory text is distinguished by its use of many evidence-based practice examples and its heavy coverage of statistical and computer analysis of data.
Grinnell, Richard M., and Yvonne A. Unrau, eds. 2007. Social work research and evaluation: Quantitative and qualitative approaches . 8th ed. New York: Oxford Univ. Press.
Contains chapters written by different authors, each focusing on a comprehensive range of social work research topics.
Kreuger, Larry W., and W. Lawrence Neuman. 2006. Social work research methods: Qualitative and quantitative applications . Boston: Pearson, Allyn, and Bacon.
An adaptation to social work of Neuman's social sciences research methods text. Its framework emphasizes comparing quantitative and qualitative approaches. Despite its title, quantitative methods receive more attention than qualitative methods, although it does contain considerable qualitative content.
Rubin, Allen. 2007. Practitioner’s guide to using research for evidence-based practice . Hoboken, NJ: Wiley.
This text focuses on understanding quantitative and qualitative research methods and designs for the purpose of appraising research as part of the evidence-based practice process. It also includes chapters on instruments for assessment and monitoring practice outcomes. It can be used at the graduate or undergraduate level.
Rubin, Allen, and Earl R. Babbie. 2007. Essential research methods for social work . Belmont, CA: Thomson Brooks Cole.
This is a shorter and less advanced version of Rubin and Babbie 2008 . It can be used for research methods courses at the undergraduate or master's levels of social work education.
Rubin, Allen, and Earl R. Babbie. Research Methods for Social Work . 6th ed. Belmont, CA: Thomson Brooks Cole, 2008.
This comprehensive text focuses on producing quantitative and qualitative research as well as utilizing such research as part of the evidence-based practice process. It is widely used for teaching research methods courses at the undergraduate, master’s, and doctoral levels of social work education.
Thyer, Bruce A., ed. 2001 The handbook of social work research methods . Thousand Oaks, CA: Sage.
This comprehensive compendium includes twenty-nine chapters written by esteemed leaders in social work research. It covers quantitative and qualitative methods as well as general issues.
Yegidis, Bonnie L., and Robert W. Weinbach. 2009. Research methods for social workers . 6th ed. Boston: Allyn and Bacon.
This introductory paperback text covers a broad range of social work research methods and does so in a briefer fashion than most lengthier, hardcover introductory research methods texts.
back to top
Users without a subscription are not able to see the full content on this page. Please subscribe or login .
Oxford Bibliographies Online is available by subscription and perpetual access to institutions. For more information or to contact an Oxford Sales Representative click here .
- About Social Work »
- Meet the Editorial Board »
- Adolescent Depression
- Adolescent Pregnancy
- Adolescents
- Adoption Home Study Assessments
- Adult Protective Services in the United States
- African Americans
- Aging out of foster care
- Aging, Physical Health and
- Alcohol and Drug Abuse Problems
- Alcohol and Drug Problems, Prevention of Adolescent and Yo...
- Alcohol Problems: Practice Interventions
- Alcohol Use Disorder
- Alzheimer's Disease and Other Dementias
- Anti-Oppressive Practice
- Asian Americans
- Asian-American Youth
- Autism Spectrum Disorders
- Baccalaureate Social Workers
- Behavioral Health
- Behavioral Social Work Practice
- Bereavement Practice
- Bisexuality
- Brief Therapies in Social Work: Task-Centered Model and So...
- Bullying and Social Work Intervention
- Canadian Social Welfare, History of
- Case Management in Mental Health in the United States
- Central American Migration to the United States
- Child Maltreatment Prevention
- Child Neglect and Emotional Maltreatment
- Child Poverty
- Child Sexual Abuse
- Child Welfare
- Child Welfare and Child Protection in Europe, History of
- Child Welfare and Parents with Intellectual and/or Develop...
- Child Welfare, Immigration and
- Child Welfare Practice with LGBTQ Youth and Families
- Children of Incarcerated Parents
- Christianity and Social Work
- Chronic Illness
- Clinical Social Work Practice with Adult Lesbians
- Clinical Social Work Practice with Males
- Cognitive Behavior Therapies with Diverse and Stressed Pop...
- Cognitive Processing Therapy
- Cognitive-Behavioral Therapy
- Community Development
- Community Policing
- Community-Needs Assessment
- Comparative Social Work
- Computational Social Welfare: Applying Data Science in Soc...
- Conflict Resolution
- Council on Social Work Education
- Counseling Female Offenders
- Criminal Justice
- Crisis Interventions
- Cultural Competence and Ethnic Sensitive Practice
- Culture, Ethnicity, Substance Use, and Substance Use Disor...
- Dementia Care
- Dementia Care, Ethical Aspects of
- Depression and Cancer
- Development and Infancy (Birth to Age Three)
- Differential Response in Child Welfare
- Digital Storytelling for Social Work Interventions
- Direct Practice in Social Work
- Disabilities
- Disability and Disability Culture
- Domestic Violence Among Immigrants
- Early Pregnancy and Parenthood Among Child Welfare–Involve...
- Eating Disorders
- Ecological Framework
- Elder Mistreatment
- End-of-Life Decisions
- Epigenetics for Social Workers
- Ethical Issues in Social Work and Technology
- Ethics and Values in Social Work
- European Institutions and Social Work
- European Union, Justice and Home Affairs in the
- Evidence-based Social Work Practice: Issues, Controversies...
- Families with Gay, Lesbian, or Bisexual Parents
- Family Caregiving
- Family Group Conferencing
- Family Policy
- Family Services
- Family Therapy
- Family Violence
- Fathering Among Families Served By Child Welfare
- Fetal Alcohol Spectrum Disorders
- Field Education
- Financial Literacy and Social Work
- Financing Health-Care Delivery in the United States
- Forensic Social Work
- Foster Care
- Foster care and siblings
- Gender, Violence, and Trauma in Immigration Detention in t...
- Generalist Practice and Advanced Generalist Practice
- Grounded Theory
- Group Work across Populations, Challenges, and Settings
- Group Work, Research, Best Practices, and Evidence-based
- Harm Reduction
- Health Care Reform
- Health Disparities
- Health Social Work
- History of Social Work and Social Welfare, 1900–1950
- History of Social Work and Social Welfare, 1950-1980
- History of Social Work and Social Welfare, pre-1900
- History of Social Work from 1980-2014
- History of Social Work in China
- History of Social Work in Northern Ireland
- History of Social Work in the Republic of Ireland
- History of Social Work in the United Kingdom
- HIV/AIDS and Children
- HIV/AIDS Prevention with Adolescents
- Homelessness
- Homelessness: Ending Homelessness as a Grand Challenge
- Homelessness Outside the United States
- Human Needs
- Human Trafficking, Victims of
- Immigrant Integration in the United States
- Immigrant Policy in the United States
- Immigrants and Refugees
- Immigrants and Refugees: Evidence-based Social Work Practi...
- Immigration and Health Disparities
- Immigration and Intimate Partner Violence
- Immigration and Poverty
- Immigration and Spirituality
- Immigration and Substance Use
- Immigration and Trauma
- Impaired Professionals
- Indigenous Peoples
- Individual Placement and Support (IPS) Supported Employmen...
- In-home Child Welfare Services
- Intergenerational Transmission of Maltreatment
- International Human Trafficking
- International Social Welfare
- International Social Work
- International Social Work and Education
- International Social Work and Social Welfare in Southern A...
- Internet and Video Game Addiction
- Interpersonal Psychotherapy
- Intervention with Traumatized Populations
- Intimate-Partner Violence
- Juvenile Justice
- Kinship Care
- Korean Americans
- Latinos and Latinas
- Law, Social Work and the
- LGBTQ Populations and Social Work
- Mainland European Social Work, History of
- Major Depressive Disorder
- Management and Administration in Social Work
- Maternal Mental Health
- Medical Illness
- Men: Health and Mental Health Care
- Mental Health
- Mental Health Diagnosis and the Addictive Substance Disord...
- Mental Health Needs of Older People, Assessing the
- Mental Health Services from 1990 to 2023
- Mental Illness: Children
- Mental Illness: Elders
- Microskills
- Middle East and North Africa, International Social Work an...
- Military Social Work
- Mixed Methods Research
- Moral distress and injury in social work
- Motivational Interviewing
- Multiculturalism
- Native Americans
- Native Hawaiians and Pacific Islanders
- Neighborhood Social Cohesion
- Neuroscience and Social Work
- Nicotine Dependence
- Organizational Development and Change
- Pain Management
- Palliative Care
- Palliative Care: Evolution and Scope of Practice
- Pandemics and Social Work
- Parent Training
- Personalization
- Person-in-Environment
- Philosophy of Science and Social Work
- Physical Disabilities
- Podcasts and Social Work
- Police Social Work
- Political Social Work in the United States
- Positive Youth Development
- Postsecondary Education Experiences and Attainment Among Y...
- Post-Traumatic Stress Disorder (PTSD)
- Practice Interventions and Aging
- Practice Interventions with Adolescents
- Practice Research
- Primary Prevention in the 21st Century
- Productive Engagement of Older Adults
- Profession, Social Work
- Program Development and Grant Writing
- Promoting Smart Decarceration as a Grand Challenge
- Psychiatric Rehabilitation
- Psychoanalysis and Psychodynamic Theory
- Psychoeducation
- Psychometrics
- Psychopathology and Social Work Practice
- Psychopharmacology and Social Work Practice
- Psychosocial Framework
- Psychosocial Intervention with Women
- Psychotherapy and Social Work
- Race and Racism
- Readmission Policies in Europe
- Redefining Police Interactions with People Experiencing Me...
- Rehabilitation
- Religiously Affiliated Agencies
- Reproductive Health
- Restorative Justice
- Risk Assessment in Child Protection Services
- Risk Management in Social Work
- Rural Social Work in China
- Rural Social Work Practice
- School Social Work
- School Violence
- School-Based Delinquency Prevention
- Services and Programs for Pregnant and Parenting Youth
- Severe and Persistent Mental Illness: Adults
- Sexual and Gender Minority Immigrants, Refugees, and Asylu...
- Sexual Assault
- Single-System Research Designs
- Social and Economic Impact of US Immigration Policies on U...
- Social Development
- Social Insurance and Social Justice
- Social Justice and Social Work
- Social Movements
- Social Planning
- Social Policy
- Social Policy in Denmark
- Social Security in the United States (OASDHI)
- Social Work and Islam
- Social Work and Social Welfare in East, West, and Central ...
- Social Work and Social Welfare in Europe
- Social Work Education and Research
- Social Work Leadership
- Social Work Luminaries: Luminaries Contributing to the Cla...
- Social Work Luminaries: Luminaries contributing to the fou...
- Social Work Luminaries: Luminaries Who Contributed to Soci...
- Social Work Regulation
- Social Work Research Methods
- Social Work with Interpreters
- Solution-Focused Therapy
- Strategic Planning
- Strengths Perspective
- Strengths-Based Models in Social Work
- Supplemental Security Income
- Survey Research
- Sustainability: Creating Social Responses to a Changing En...
- Syrian Refugees in Turkey
- Task-Centered Practice
- Technology Adoption in Social Work Education
- Technology, Human Relationships, and Human Interaction
- Technology in Social Work
- Terminal Illness
- The Impact of Systemic Racism on Latinxs’ Experiences with...
- Transdisciplinary Science
- Translational Science and Social Work
- Transnational Perspectives in Social Work
- Transtheoretical Model of Change
- Trauma-Informed Care
- Triangulation
- Tribal child welfare practice in the United States
- United States, History of Social Welfare in the
- Universal Basic Income
- Veteran Services
- Vicarious Trauma and Resilience in Social Work Practice wi...
- Vicarious Trauma Redefining PTSD
- Victim Services
- Virtual Reality and Social Work
- Welfare State Reform in France
- Welfare State Theory
- Women and Macro Social Work Practice
- Women's Health Care
- Work and Family in the German Welfare State
- Workforce Development of Social Workers Pre- and Post-Empl...
- Working with Non-Voluntary and Mandated Clients
- Young and Adolescent Lesbians
- Youth at Risk
- Youth Services
- Privacy Policy
- Cookie Policy
- Legal Notice
- Accessibility
Powered by:
- [66.249.64.20|81.177.182.159]
- 81.177.182.159

19 11. Quantitative measurement
Chapter outline.
- Conceptual definitions (17 minute read)
- Operational definitions (36 minute read)
- Measurement quality (21 minute read)
- Ethical and social justice considerations (15 minute read)
Content warning: examples in this chapter contain references to ethnocentrism, toxic masculinity, racism in science, drug use, mental health and depression, psychiatric inpatient care, poverty and basic needs insecurity, pregnancy, and racism and sexism in the workplace and higher education.
11.1 Conceptual definitions
Learning objectives.
Learners will be able to…
- Define measurement and conceptualization
- Apply Kaplan’s three categories to determine the complexity of measuring a given variable
- Identify the role previous research and theory play in defining concepts
- Distinguish between unidimensional and multidimensional concepts
- Critically apply reification to how you conceptualize the key variables in your research project
In social science, when we use the term measurement , we mean the process by which we describe and ascribe meaning to the key facts, concepts, or other phenomena that we are investigating. At its core, measurement is about defining one’s terms in as clear and precise a way as possible. Of course, measurement in social science isn’t quite as simple as using a measuring cup or spoon, but there are some basic tenets on which most social scientists agree when it comes to measurement. We’ll explore those, as well as some of the ways that measurement might vary depending on your unique approach to the study of your topic.
An important point here is that measurement does not require any particular instruments or procedures. What it does require is a systematic procedure for assigning scores, meanings, and descriptions to individuals or objects so that those scores represent the characteristic of interest. You can measure phenomena in many different ways, but you must be sure that how you choose to measure gives you information and data that lets you answer your research question. If you’re looking for information about a person’s income, but your main points of measurement have to do with the money they have in the bank, you’re not really going to find the information you’re looking for!
The question of what social scientists measure can be answered by asking yourself what social scientists study. Think about the topics you’ve learned about in other social work classes you’ve taken or the topics you’ve considered investigating yourself. Let’s consider Melissa Milkie and Catharine Warner’s study (2011) [1] of first graders’ mental health. In order to conduct that study, Milkie and Warner needed to have some idea about how they were going to measure mental health. What does mental health mean, exactly? And how do we know when we’re observing someone whose mental health is good and when we see someone whose mental health is compromised? Understanding how measurement works in research methods helps us answer these sorts of questions.
As you might have guessed, social scientists will measure just about anything that they have an interest in investigating. For example, those who are interested in learning something about the correlation between social class and levels of happiness must develop some way to measure both social class and happiness. Those who wish to understand how well immigrants cope in their new locations must measure immigrant status and coping. Those who wish to understand how a person’s gender shapes their workplace experiences must measure gender and workplace experiences (and get more specific about which experiences are under examination). You get the idea. Social scientists can and do measure just about anything you can imagine observing or wanting to study. Of course, some things are easier to observe or measure than others.

Observing your variables
In 1964, philosopher Abraham Kaplan (1964) [2] wrote The Conduct of Inquiry, which has since become a classic work in research methodology (Babbie, 2010). [3] In his text, Kaplan describes different categories of things that behavioral scientists observe. One of those categories, which Kaplan called “observational terms,” is probably the simplest to measure in social science. Observational terms are the sorts of things that we can see with the naked eye simply by looking at them. Kaplan roughly defines them as conditions that are easy to identify and verify through direct observation. If, for example, we wanted to know how the conditions of playgrounds differ across different neighborhoods, we could directly observe the variety, amount, and condition of equipment at various playgrounds.
Indirect observables , on the other hand, are less straightforward to assess. In Kaplan’s framework, they are conditions that are subtle and complex that we must use existing knowledge and intuition to define. If we conducted a study for which we wished to know a person’s income, we’d probably have to ask them their income, perhaps in an interview or a survey. Thus, we have observed income, even if it has only been observed indirectly. Birthplace might be another indirect observable. We can ask study participants where they were born, but chances are good we won’t have directly observed any of those people being born in the locations they report.
Sometimes the measures that we are interested in are more complex and more abstract than observational terms or indirect observables. Think about some of the concepts you’ve learned about in other social work classes—for example, ethnocentrism. What is ethnocentrism? Well, from completing an introduction to social work class you might know that it has something to do with the way a person judges another’s culture. But how would you measure it? Here’s another construct: bureaucracy. We know this term has something to do with organizations and how they operate but measuring such a construct is trickier than measuring something like a person’s income. The theoretical concepts of ethnocentrism and bureaucracy represent ideas whose meanings we have come to agree on. Though we may not be able to observe these abstractions directly, we can observe their components.
Kaplan referred to these more abstract things that behavioral scientists measure as constructs. Constructs are “not observational either directly or indirectly” (Kaplan, 1964, p. 55), [4] but they can be defined based on observables. For example, the construct of bureaucracy could be measured by counting the number of supervisors that need to approve routine spending by public administrators. The greater the number of administrators that must sign off on routine matters, the greater the degree of bureaucracy. Similarly, we might be able to ask a person the degree to which they trust people from different cultures around the world and then assess the ethnocentrism inherent in their answers. We can measure constructs like bureaucracy and ethnocentrism by defining them in terms of what we can observe. [5]
The idea of coming up with your own measurement tool might sound pretty intimidating at this point. The good news is that if you find something in the literature that works for you, you can use it (with proper attribution, of course). If there are only pieces of it that you like, you can reuse those pieces (with proper attribution and describing/justifying any changes). You don’t always have to start from scratch!
Look at the variables in your research question.
- Classify them as direct observables, indirect observables, or constructs.
- Do you think measuring them will be easy or hard?
- What are your first thoughts about how to measure each variable? No wrong answers here, just write down a thought about each variable.

Measurement starts with conceptualization
In order to measure the concepts in your research question, we first have to understand what we think about them. As an aside, the word concept has come up quite a bit, and it is important to be sure we have a shared understanding of that term. A concept is the notion or image that we conjure up when we think of some cluster of related observations or ideas. For example, masculinity is a concept. What do you think of when you hear that word? Presumably, you imagine some set of behaviors and perhaps even a particular style of self-presentation. Of course, we can’t necessarily assume that everyone conjures up the same set of ideas or images when they hear the word masculinity . While there are many possible ways to define the term and some may be more common or have more support than others, there is no universal definition of masculinity. What counts as masculine may shift over time, from culture to culture, and even from individual to individual (Kimmel, 2008). This is why defining our concepts is so important.\
Not all researchers clearly explain their theoretical or conceptual framework for their study, but they should! Without understanding how a researcher has defined their key concepts, it would be nearly impossible to understand the meaning of that researcher’s findings and conclusions. Back in Chapter 7 , you developed a theoretical framework for your study based on a survey of the theoretical literature in your topic area. If you haven’t done that yet, consider flipping back to that section to familiarize yourself with some of the techniques for finding and using theories relevant to your research question. Continuing with our example on masculinity, we would need to survey the literature on theories of masculinity. After a few queries on masculinity, I found a wonderful article by Wong (2010) [6] that analyzed eight years of the journal Psychology of Men & Masculinity and analyzed how often different theories of masculinity were used . Not only can I get a sense of which theories are more accepted and which are more marginal in the social science on masculinity, I am able to identify a range of options from which I can find the theory or theories that will inform my project.
Identify a specific theory (or more than one theory) and how it helps you understand…
- Your independent variable(s).
- Your dependent variable(s).
- The relationship between your independent and dependent variables.
Rather than completing this exercise from scratch, build from your theoretical or conceptual framework developed in previous chapters.
In quantitative methods, conceptualization involves writing out clear, concise definitions for our key concepts. These are the kind of definitions you are used to, like the ones in a dictionary. A conceptual definition involves defining a concept in terms of other concepts, usually by making reference to how other social scientists and theorists have defined those concepts in the past. Of course, new conceptual definitions are created all the time because our conceptual understanding of the world is always evolving.
Conceptualization is deceptively challenging—spelling out exactly what the concepts in your research question mean to you. Following along with our example, think about what comes to mind when you read the term masculinity. How do you know masculinity when you see it? Does it have something to do with men or with social norms? If so, perhaps we could define masculinity as the social norms that men are expected to follow. That seems like a reasonable start, and at this early stage of conceptualization, brainstorming about the images conjured up by concepts and playing around with possible definitions is appropriate. However, this is just the first step. At this point, you should be beyond brainstorming for your key variables because you have read a good amount of research about them
In addition, we should consult previous research and theory to understand the definitions that other scholars have already given for the concepts we are interested in. This doesn’t mean we must use their definitions, but understanding how concepts have been defined in the past will help us to compare our conceptualizations with how other scholars define and relate concepts. Understanding prior definitions of our key concepts will also help us decide whether we plan to challenge those conceptualizations or rely on them for our own work. Finally, working on conceptualization is likely to help in the process of refining your research question to one that is specific and clear in what it asks. Conceptualization and operationalization (next section) are where “the rubber meets the road,” so to speak, and you have to specify what you mean by the question you are asking. As your conceptualization deepens, you will often find that your research question becomes more specific and clear.
If we turn to the literature on masculinity, we will surely come across work by Michael Kimmel , one of the preeminent masculinity scholars in the United States. After consulting Kimmel’s prior work (2000; 2008), [7] we might tweak our initial definition of masculinity. Rather than defining masculinity as “the social norms that men are expected to follow,” perhaps instead we’ll define it as “the social roles, behaviors, and meanings prescribed for men in any given society at any one time” (Kimmel & Aronson, 2004, p. 503). [8] Our revised definition is more precise and complex because it goes beyond addressing one aspect of men’s lives (norms), and addresses three aspects: roles, behaviors, and meanings. It also implies that roles, behaviors, and meanings may vary across societies and over time. Using definitions developed by theorists and scholars is a good idea, though you may find that you want to define things your own way.
As you can see, conceptualization isn’t as simple as applying any random definition that we come up with to a term. Defining our terms may involve some brainstorming at the very beginning. But conceptualization must go beyond that, to engage with or critique existing definitions and conceptualizations in the literature. Once we’ve brainstormed about the images associated with a particular word, we should also consult prior work to understand how others define the term in question. After we’ve identified a clear definition that we’re happy with, we should make sure that every term used in our definition will make sense to others. Are there terms used within our definition that also need to be defined? If so, our conceptualization is not yet complete. Our definition includes the concept of “social roles,” so we should have a definition for what those mean and become familiar with role theory to help us with our conceptualization. If we don’t know what roles are, how can we study them?
Let’s say we do all of that. We have a clear definition of the term masculinity with reference to previous literature and we also have a good understanding of the terms in our conceptual definition…then we’re done, right? Not so fast. You’ve likely met more than one man in your life, and you’ve probably noticed that they are not the same, even if they live in the same society during the same historical time period. This could mean there are dimensions of masculinity. In terms of social scientific measurement, concepts can be said to have multiple dimensions when there are multiple elements that make up a single concept. With respect to the term masculinity , dimensions could based on gender identity, gender performance, sexual orientation, etc.. In any of these cases, the concept of masculinity would be considered to have multiple dimensions.
While you do not need to spell out every possible dimension of the concepts you wish to measure, it is important to identify whether your concepts are unidimensional (and therefore relatively easy to define and measure) or multidimensional (and therefore require multi-part definitions and measures). In this way, how you conceptualize your variables determines how you will measure them in your study. Unidimensional concepts are those that are expected to have a single underlying dimension. These concepts can be measured using a single measure or test. Examples include simple concepts such as a person’s weight, time spent sleeping, and so forth.
One frustrating this is that there is no clear demarcation between concepts that are inherently unidimensional or multidimensional. Even something as simple as age could be broken down into multiple dimensions including mental age and chronological age, so where does conceptualization stop? How far down the dimensional rabbit hole do we have to go? Researchers should consider two things. First, how important is this variable in your study? If age is not important in your study (maybe it is a control variable), it seems like a waste of time to do a lot of work drawing from developmental theory to conceptualize this variable. A unidimensional measure from zero to dead is all the detail we need. On the other hand, if we were measuring the impact of age on masculinity, conceptualizing our independent variable (age) as multidimensional may provide a richer understanding of its impact on masculinity. Finally, your conceptualization will lead directly to your operationalization of the variable, and once your operationalization is complete, make sure someone reading your study could follow how your conceptual definitions informed the measures you chose for your variables.
Write a conceptual definition for your independent and dependent variables.
- Cite and attribute definitions to other scholars, if you use their words.
- Describe how your definitions are informed by your theoretical framework.
- Place your definition in conversation with other theories and conceptual definitions commonly used in the literature.
- Are there multiple dimensions of your variables?
- Are any of these dimensions important for you to measure?
Do researchers actually know what we’re talking about?
Conceptualization proceeds differently in qualitative research compared to quantitative research. Since qualitative researchers are interested in the understandings and experiences of their participants, it is less important for them to find one fixed definition for a concept before starting to interview or interact with participants. The researcher’s job is to accurately and completely represent how their participants understand a concept, not to test their own definition of that concept.
If you were conducting qualitative research on masculinity, you would likely consult previous literature like Kimmel’s work mentioned above. From your literature review, you may come up with a working definition for the terms you plan to use in your study, which can change over the course of the investigation. However, the definition that matters is the definition that your participants share during data collection. A working definition is merely a place to start, and researchers should take care not to think it is the only or best definition out there.
In qualitative inquiry, your participants are the experts (sound familiar, social workers?) on the concepts that arise during the research study. Your job as the researcher is to accurately and reliably collect and interpret their understanding of the concepts they describe while answering your questions. Conceptualization of concepts is likely to change over the course of qualitative inquiry, as you learn more information from your participants. Indeed, getting participants to comment on, extend, or challenge the definitions and understandings of other participants is a hallmark of qualitative research. This is the opposite of quantitative research, in which definitions must be completely set in stone before the inquiry can begin.
The contrast between qualitative and quantitative conceptualization is instructive for understanding how quantitative methods (and positivist research in general) privilege the knowledge of the researcher over the knowledge of study participants and community members. Positivism holds that the researcher is the “expert,” and can define concepts based on their expert knowledge of the scientific literature. This knowledge is in contrast to the lived experience that participants possess from experiencing the topic under examination day-in, day-out. For this reason, it would be wise to remind ourselves not to take our definitions too seriously and be critical about the limitations of our knowledge.
Conceptualization must be open to revisions, even radical revisions, as scientific knowledge progresses. While I’ve suggested consulting prior scholarly definitions of our concepts, you should not assume that prior, scholarly definitions are more real than the definitions we create. Likewise, we should not think that our own made-up definitions are any more real than any other definition. It would also be wrong to assume that just because definitions exist for some concept that the concept itself exists beyond some abstract idea in our heads. Building on the paradigmatic ideas behind interpretivism and the critical paradigm, researchers call the assumption that our abstract concepts exist in some concrete, tangible way is known as reification . It explores the power dynamics behind how we can create reality by how we define it.
Returning again to our example of masculinity. Think about our how our notions of masculinity have developed over the past few decades, and how different and yet so similar they are to patriarchal definitions throughout history. Conceptual definitions become more or less popular based on the power arrangements inside of social science the broader world. Western knowledge systems are privileged, while others are viewed as unscientific and marginal. The historical domination of social science by white men from WEIRD countries meant that definitions of masculinity were imbued their cultural biases and were designed explicitly and implicitly to preserve their power. This has inspired movements for cognitive justice as we seek to use social science to achieve global development.
Key Takeaways
- Measurement is the process by which we describe and ascribe meaning to the key facts, concepts, or other phenomena that we are investigating.
- Kaplan identified three categories of things that social scientists measure including observational terms, indirect observables, and constructs.
- Some concepts have multiple elements or dimensions.
- Researchers often use measures previously developed and studied by other researchers.
- Conceptualization is a process that involves coming up with clear, concise definitions.
- Conceptual definitions are based on the theoretical framework you are using for your study (and the paradigmatic assumptions underlying those theories).
- Whether your conceptual definitions come from your own ideas or the literature, you should be able to situate them in terms of other commonly used conceptual definitions.
- Researchers should acknowledge the limited explanatory power of their definitions for concepts and how oppression can shape what explanations are considered true or scientific.
Think historically about the variables in your research question.
- How has our conceptual definition of your topic changed over time?
- What scholars or social forces were responsible for this change?
Take a critical look at your conceptual definitions.
- How participants might define terms for themselves differently, in terms of their daily experience?
- On what cultural assumptions are your conceptual definitions based?
- Are your conceptual definitions applicable across all cultures that will be represented in your sample?
11.2 Operational definitions
- Define and give an example of indicators and attributes for a variable
- Apply the three components of an operational definition to a variable
- Distinguish between levels of measurement for a variable and how those differences relate to measurement
- Describe the purpose of composite measures like scales and indices
Conceptual definitions are like dictionary definitions. They tell you what a concept means by defining it using other concepts. In this section we will move from the abstract realm (theory) to the real world (measurement). Operationalization is the process by which researchers spell out precisely how a concept will be measured in their study. It involves identifying the specific research procedures we will use to gather data about our concepts. If conceptually defining your terms means looking at theory, how do you operationally define your terms? By looking for indicators of when your variable is present or not, more or less intense, and so forth. Operationalization is probably the most challenging part of quantitative research, but once it’s done, the design and implementation of your study will be straightforward.

Operationalization works by identifying specific indicators that will be taken to represent the ideas we are interested in studying. If we are interested in studying masculinity, then the indicators for that concept might include some of the social roles prescribed to men in society such as breadwinning or fatherhood. Being a breadwinner or a father might therefore be considered indicators of a person’s masculinity. The extent to which a man fulfills either, or both, of these roles might be understood as clues (or indicators) about the extent to which he is viewed as masculine.
Let’s look at another example of indicators. Each day, Gallup researchers poll 1,000 randomly selected Americans to ask them about their well-being. To measure well-being, Gallup asks these people to respond to questions covering six broad areas: physical health, emotional health, work environment, life evaluation, healthy behaviors, and access to basic necessities. Gallup uses these six factors as indicators of the concept that they are really interested in, which is well-being .
Identifying indicators can be even simpler than the examples described thus far. Political party affiliation is another relatively easy concept for which to identify indicators. If you asked a person what party they voted for in the last national election (or gained access to their voting records), you would get a good indication of their party affiliation. Of course, some voters split tickets between multiple parties when they vote and others swing from party to party each election, so our indicator is not perfect. Indeed, if our study were about political identity as a key concept, operationalizing it solely in terms of who they voted for in the previous election leaves out a lot of information about identity that is relevant to that concept. Nevertheless, it’s a pretty good indicator of political party affiliation.
Choosing indicators is not an arbitrary process. As described earlier, utilizing prior theoretical and empirical work in your area of interest is a great way to identify indicators in a scholarly manner. And you conceptual definitions will point you in the direction of relevant indicators. Empirical work will give you some very specific examples of how the important concepts in an area have been measured in the past and what sorts of indicators have been used. Often, it makes sense to use the same indicators as previous researchers; however, you may find that some previous measures have potential weaknesses that your own study will improve upon.
All of the examples in this chapter have dealt with questions you might ask a research participant on a survey or in a quantitative interview. If you plan to collect data from other sources, such as through direct observation or the analysis of available records, think practically about what the design of your study might look like and how you can collect data on various indicators feasibly. If your study asks about whether the participant regularly changes the oil in their car, you will likely not observe them directly doing so. Instead, you will likely need to rely on a survey question that asks them the frequency with which they change their oil or ask to see their car maintenance records.
- What indicators are commonly used to measure the variables in your research question?
- How can you feasibly collect data on these indicators?
- Are you planning to collect your own data using a questionnaire or interview? Or are you planning to analyze available data like client files or raw data shared from another researcher’s project?
Remember, you need raw data . You research project cannot rely solely on the results reported by other researchers or the arguments you read in the literature. A literature review is only the first part of a research project, and your review of the literature should inform the indicators you end up choosing when you measure the variables in your research question.
Unlike conceptual definitions which contain other concepts, operational definition consists of the following components: (1) the variable being measured and its attributes, (2) the measure you will use, (3) how you plan to interpret the data collected from that measure to draw conclusions about the variable you are measuring.
Step 1: Specifying variables and attributes
The first component, the variable, should be the easiest part. At this point in quantitative research, you should have a research question that has at least one independent and at least one dependent variable. Remember that variables must be able to vary. For example, the United States is not a variable. Country of residence is a variable, as is patriotism. Similarly, if your sample only includes men, gender is a constant in your study, not a variable. A constant is a characteristic that does not change in your study.
When social scientists measure concepts, they sometimes use the language of variables and attributes. A variable refers to a quality or quantity that varies across people or situations. Attributes are the characteristics that make up a variable. For example, the variable hair color would contain attributes like blonde, brown, black, red, gray, etc. A variable’s attributes determine its level of measurement. There are four possible levels of measurement: nominal, ordinal, interval, and ratio. The first two levels of measurement are categorical , meaning their attributes are categories rather than numbers. The latter two levels of measurement are continuous , meaning their attributes are numbers.

Levels of measurement
Hair color is an example of a nominal level of measurement. Nominal measures are categorical, and those categories cannot be mathematically ranked. As a brown-haired person (with some gray), I can’t say for sure that brown-haired people are better than blonde-haired people. As with all nominal levels of measurement, there is no ranking order between hair colors; they are simply different. That is what constitutes a nominal level of gender and race are also measured at the nominal level.
What attributes are contained in the variable hair color ? While blonde, brown, black, and red are common colors, some people may not fit into these categories if we only list these attributes. My wife, who currently has purple hair, wouldn’t fit anywhere. This means that our attributes were not exhaustive. Exhaustiveness means that all possible attributes are listed. We may have to list a lot of colors before we can meet the criteria of exhaustiveness. Clearly, there is a point at which exhaustiveness has been reasonably met. If a person insists that their hair color is light burnt sienna , it is not your responsibility to list that as an option. Rather, that person would reasonably be described as brown-haired. Perhaps listing a category for other color would suffice to make our list of colors exhaustive.
What about a person who has multiple hair colors at the same time, such as red and black? They would fall into multiple attributes. This violates the rule of mutual exclusivity , in which a person cannot fall into two different attributes. Instead of listing all of the possible combinations of colors, perhaps you might include a multi-color attribute to describe people with more than one hair color.
Making sure researchers provide mutually exclusive and exhaustive is about making sure all people are represented in the data record. For many years, the attributes for gender were only male or female. Now, our understanding of gender has evolved to encompass more attributes that better reflect the diversity in the world. Children of parents from different races were often classified as one race or another, even if they identified with both cultures. The option for bi-racial or multi-racial on a survey not only more accurately reflects the racial diversity in the real world but validates and acknowledges people who identify in that manner. If we did not measure race in this way, we would leave empty the data record for people who identify as biracial or multiracial, impairing our search for truth.
Unlike nominal-level measures, attributes at the ordinal level can be rank ordered. For example, someone’s degree of satisfaction in their romantic relationship can be ordered by rank. That is, you could say you are not at all satisfied, a little satisfied, moderately satisfied, or highly satisfied. Note that even though these have a rank order to them (not at all satisfied is certainly worse than highly satisfied), we cannot calculate a mathematical distance between those attributes. We can simply say that one attribute of an ordinal-level variable is more or less than another attribute.
This can get a little confusing when using rating scales . If you have ever taken a customer satisfaction survey or completed a course evaluation for school, you are familiar with rating scales. “On a scale of 1-5, with 1 being the lowest and 5 being the highest, how likely are you to recommend our company to other people?” That surely sounds familiar. Rating scales use numbers, but only as a shorthand, to indicate what attribute (highly likely, somewhat likely, etc.) the person feels describes them best. You wouldn’t say you are “2” likely to recommend the company, but you would say you are not very likely to recommend the company. Ordinal-level attributes must also be exhaustive and mutually exclusive, as with nominal-level variables.
At the interval level, attributes must also be exhaustive and mutually exclusive and there is equal distance between attributes. Interval measures are also continuous, meaning their attributes are numbers, rather than categories. IQ scores are interval level, as are temperatures in Fahrenheit and Celsius. Their defining characteristic is that we can say how much more or less one attribute differs from another. We cannot, however, say with certainty what the ratio of one attribute is in comparison to another. For example, it would not make sense to say that a person with an IQ score of 140 has twice the IQ of a person with a score of 70. However, the difference between IQ scores of 80 and 100 is the same as the difference between IQ scores of 120 and 140.
While we cannot say that someone with an IQ of 140 is twice as intelligent as someone with an IQ of 70 because IQ is measured at the interval level, we can say that someone with six siblings has twice as many as someone with three because number of siblings is measured at the ratio level. Finally, at the ratio level, attributes are mutually exclusive and exhaustive, attributes can be rank ordered, the distance between attributes is equal, and attributes have a true zero point. Thus, with these variables, we can say what the ratio of one attribute is in comparison to another. Examples of ratio-level variables include age and years of education. We know that a person who is 12 years old is twice as old as someone who is 6 years old. Height measured in meters and weight measured in kilograms are good examples. So are counts of discrete objects or events such as the number of siblings one has or the number of questions a student answers correctly on an exam. The differences between each level of measurement are visualized in Table 11.1.
Levels of measurement=levels of specificity
We have spent time learning how to determine our data’s level of measurement. Now what? How could we use this information to help us as we measure concepts and develop measurement tools? First, the types of statistical tests that we are able to use are dependent on our data’s level of measurement. With nominal-level measurement, for example, the only available measure of central tendency is the mode. With ordinal-level measurement, the median or mode can be used as indicators of central tendency. Interval and ratio-level measurement are typically considered the most desirable because they permit for any indicators of central tendency to be computed (i.e., mean, median, or mode). Also, ratio-level measurement is the only level that allows meaningful statements about ratios of scores. The higher the level of measurement, the more complex statistical tests we are able to conduct. This knowledge may help us decide what kind of data we need to gather, and how.
That said, we have to balance this knowledge with the understanding that sometimes, collecting data at a higher level of measurement could negatively impact our studies. For instance, sometimes providing answers in ranges may make prospective participants feel more comfortable responding to sensitive items. Imagine that you were interested in collecting information on topics such as income, number of sexual partners, number of times someone used illicit drugs, etc. You would have to think about the sensitivity of these items and determine if it would make more sense to collect some data at a lower level of measurement (e.g., asking if they are sexually active or not (nominal) versus their total number of sexual partners (ratio).
Finally, sometimes when analyzing data, researchers find a need to change a data’s level of measurement. For example, a few years ago, a student was interested in studying the relationship between mental health and life satisfaction. This student used a variety of measures. One item asked about the number of mental health symptoms, reported as the actual number. When analyzing data, my student examined the mental health symptom variable and noticed that she had two groups, those with none or one symptoms and those with many symptoms. Instead of using the ratio level data (actual number of mental health symptoms), she collapsed her cases into two categories, few and many. She decided to use this variable in her analyses. It is important to note that you can move a higher level of data to a lower level of data; however, you are unable to move a lower level to a higher level.
- Check that the variables in your research question can vary…and that they are not constants or one of many potential attributes of a variable.
- Think about the attributes your variables have. Are they categorical or continuous? What level of measurement seems most appropriate?

Step 2: Specifying measures for each variable
Let’s pick a social work research question and walk through the process of operationalizing variables to see how specific we need to get. I’m going to hypothesize that residents of a psychiatric unit who are more depressed are less likely to be satisfied with care. Remember, this would be a inverse relationship—as depression increases, satisfaction decreases. In this question, depression is my independent variable (the cause) and satisfaction with care is my dependent variable (the effect). Now we have identified our variables, their attributes, and levels of measurement, we move onto the second component: the measure itself.
So, how would you measure my key variables: depression and satisfaction? What indicators would you look for? Some students might say that depression could be measured by observing a participant’s body language. They may also say that a depressed person will often express feelings of sadness or hopelessness. In addition, a satisfied person might be happy around service providers and often express gratitude. While these factors may indicate that the variables are present, they lack coherence. Unfortunately, what this “measure” is actually saying is that “I know depression and satisfaction when I see them.” While you are likely a decent judge of depression and satisfaction, you need to provide more information in a research study for how you plan to measure your variables. Your judgment is subjective, based on your own idiosyncratic experiences with depression and satisfaction. They couldn’t be replicated by another researcher. They also can’t be done consistently for a large group of people. Operationalization requires that you come up with a specific and rigorous measure for seeing who is depressed or satisfied.
Finding a good measure for your variable depends on the kind of variable it is. Variables that are directly observable don’t come up very often in my students’ classroom projects, but they might include things like taking someone’s blood pressure, marking attendance or participation in a group, and so forth. To measure an indirectly observable variable like age, you would probably put a question on a survey that asked, “How old are you?” Measuring a variable like income might require some more thought, though. Are you interested in this person’s individual income or the income of their family unit? This might matter if your participant does not work or is dependent on other family members for income. Do you count income from social welfare programs? Are you interested in their income per month or per year? Even though indirect observables are relatively easy to measure, the measures you use must be clear in what they are asking, and operationalization is all about figuring out the specifics of what you want to know. For more complicated constructs, you will need compound measures (that use multiple indicators to measure a single variable).
How you plan to collect your data also influences how you will measure your variables. For social work researchers using secondary data like client records as a data source, you are limited by what information is in the data sources you can access. If your organization uses a given measurement for a mental health outcome, that is the one you will use in your study. Similarly, if you plan to study how long a client was housed after an intervention using client visit records, you are limited by how their caseworker recorded their housing status in the chart. One of the benefits of collecting your own data is being able to select the measures you feel best exemplify your understanding of the topic.
Measuring unidimensional concepts
The previous section mentioned two important considerations: how complicated the variable is and how you plan to collect your data. With these in hand, we can use the level of measurement to further specify how you will measure your variables and consider specialized rating scales developed by social science researchers.
Measurement at each level
Nominal measures assess categorical variables. These measures are used for variables or indicators that have mutually exclusive attributes, but that cannot be rank-ordered. Nominal measures ask about the variable and provide names or labels for different attribute values like social work, counseling, and nursing for the variable profession. Nominal measures are relatively straightforward.
Ordinal measures often use a rating scale. It is an ordered set of responses that participants must choose from. Figure 11.1 shows several examples. The number of response options on a typical rating scale is usualy five or seven, though it can range from three to 11. Five-point scales are best for unipolar scales where only one construct is tested, such as frequency (Never, Rarely, Sometimes, Often, Always). Seven-point scales are best for bipolar scales where there is a dichotomous spectrum, such as liking (Like very much, Like somewhat, Like slightly, Neither like nor dislike, Dislike slightly, Dislike somewhat, Dislike very much). For bipolar questions, it is useful to offer an earlier question that branches them into an area of the scale; if asking about liking ice cream, first ask “Do you generally like or dislike ice cream?” Once the respondent chooses like or dislike, refine it by offering them relevant choices from the seven-point scale. Branching improves both reliability and validity (Krosnick & Berent, 1993). [9] Although you often see scales with numerical labels, it is best to only present verbal labels to the respondents but convert them to numerical values in the analyses. Avoid partial labels or length or overly specific labels. In some cases, the verbal labels can be supplemented with (or even replaced by) meaningful graphics. The last rating scale shown in Figure 11.1 is a visual-analog scale, on which participants make a mark somewhere along the horizontal line to indicate the magnitude of their response.
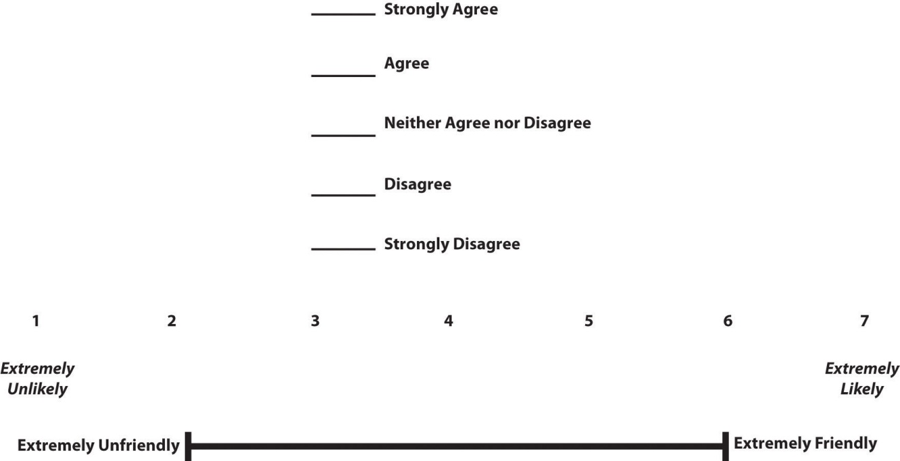
Interval measures are those where the values measured are not only rank-ordered, but are also equidistant from adjacent attributes. For example, the temperature scale (in Fahrenheit or Celsius), where the difference between 30 and 40 degree Fahrenheit is the same as that between 80 and 90 degree Fahrenheit. Likewise, if you have a scale that asks respondents’ annual income using the following attributes (ranges): $0 to 10,000, $10,000 to 20,000, $20,000 to 30,000, and so forth, this is also an interval measure, because the mid-point of each range (i.e., $5,000, $15,000, $25,000, etc.) are equidistant from each other. The intelligence quotient (IQ) scale is also an interval measure, because the measure is designed such that the difference between IQ scores 100 and 110 is supposed to be the same as between 110 and 120 (although we do not really know whether that is truly the case). Interval measures allow us to examine “how much more” is one attribute when compared to another, which is not possible with nominal or ordinal measures. You may find researchers who “pretend” (incorrectly) that ordinal rating scales are actually interval measures so that we can use different statistical techniques for analyzing them. As we will discuss in the latter part of the chapter, this is a mistake because there is no way to know whether the difference between a 3 and a 4 on a rating scale is the same as the difference between a 2 and a 3. Those numbers are just placeholders for categories.
Ratio measures are those that have all the qualities of nominal, ordinal, and interval scales, and in addition, also have a “true zero” point (where the value zero implies lack or non-availability of the underlying construct). Think about how to measure the number of people working in human resources at a social work agency. It could be one, several, or none (if the company contracts out for those services). Measuring interval and ratio data is relatively easy, as people either select or input a number for their answer. If you ask a person how many eggs they purchased last week, they can simply tell you they purchased `a dozen eggs at the store, two at breakfast on Wednesday, or none at all.
Commonly used rating scales in questionnaires
The level of measurement will give you the basic information you need, but social scientists have developed specialized instruments for use in questionnaires, a common tool used in quantitative research. As we mentioned before, if you plan to source your data from client files or previously published results
Although Likert scale is a term colloquially used to refer to almost any rating scale (e.g., a 0-to-10 life satisfaction scale), it has a much more precise meaning. In the 1930s, researcher Rensis Likert (pronounced LICK-ert) created a new approach for measuring people’s attitudes (Likert, 1932) . [10] It involves presenting people with several statements—including both favorable and unfavorable statements—about some person, group, or idea. Respondents then express their agreement or disagreement with each statement on a 5-point scale: Strongly Agree , Agree , Neither Agree nor Disagree , Disagree , Strongly Disagree . Numbers are assigned to each response a nd then summed across all items to produce a score representing the attitude toward the person, group, or idea. For items that are phrased in an opposite direction (e.g., negatively worded statements instead of positively worded statements), reverse coding is used so that the numerical scoring of statements also runs in the opposite direction. The entire set of items came to be called a Likert scale, as indicated in Table 11.2 below.
Unless you are measuring people’s attitude toward something by assessing their level of agreement with several statements about it, it is best to avoid calling it a Likert scale. You are probably just using a rating scale. Likert scales allow for more granularity (more finely tuned response) than yes/no items, including whether respondents are neutral to the statement. Below is an example of how we might use a Likert scale to assess your attitudes about research as you work your way through this textbook.
Semantic differential scales are composite (multi-item) scales in which respondents are asked to indicate their opinions or feelings toward a single statement using different pairs of adjectives framed as polar opposites. Whereas in the above Likert scale, the participant is asked how much they agree or disagree with a statement, in a semantic differential scale the participant is asked to indicate how they feel about a specific item. This makes the s emantic differential scale an excellent technique for measuring people’s attitudes or feelings toward objects, events, or behaviors. Table 11.3 is an example of a semantic differential scale that was created to assess participants’ feelings about this textbook.
This composite scale was designed by Louis Guttman and uses a series of items arranged in increasing order of intensity (least intense to most intense) of the concept. This type of scale allows us to understand the intensity of beliefs or feelings. Each item in the above Guttman scale has a weight (this is not indicated on the tool) which varies with the intensity of that item, and the weighted combination of each response is used as an aggregate measure of an observation.
Example Guttman Scale Items
- I often felt the material was not engaging Yes/No
- I was often thinking about other things in class Yes/No
- I was often working on other tasks during class Yes/No
- I will work to abolish research from the curriculum Yes/No
Notice how the items move from lower intensity to higher intensity. A researcher reviews the yes answers and creates a score for each participant.
Composite measures: Scales and indices
Depending on your research design, your measure may be something you put on a survey or pre/post-test that you give to your participants. For a variable like age or income, one well-worded question may suffice. Unfortunately, most variables in the social world are not so simple. Depression and satisfaction are multidimensional concepts. Relying on a single indicator like a question that asks “Yes or no, are you depressed?” does not encompass the complexity of depression, including issues with mood, sleeping, eating, relationships, and happiness. There is no easy way to delineate between multidimensional and unidimensional concepts, as its all in how you think about your variable. Satisfaction could be validly measured using a unidimensional ordinal rating scale. However, if satisfaction were a key variable in our study, we would need a theoretical framework and conceptual definition for it. That means we’d probably have more indicators to ask about like timeliness, respect, sensitivity, and many others, and we would want our study to say something about what satisfaction truly means in terms of our other key variables. However, if satisfaction is not a key variable in your conceptual framework, it makes sense to operationalize it as a unidimensional concept.
For more complicated measures, researchers use scales and indices (sometimes called indexes) to measure their variables because they assess multiple indicators to develop a composite (or total) score. Co mposite scores provide a much greater understanding of concepts than a single item could. Although we won’t delve too deeply into the process of scale development, we will cover some important topics for you to understand how scales and indices developed by other researchers can be used in your project.
Although they exhibit differences (which will later be discussed) the two have in common various factors.
- Both are ordinal measures of variables.
- Both can order the units of analysis in terms of specific variables.
- Both are composite measures .
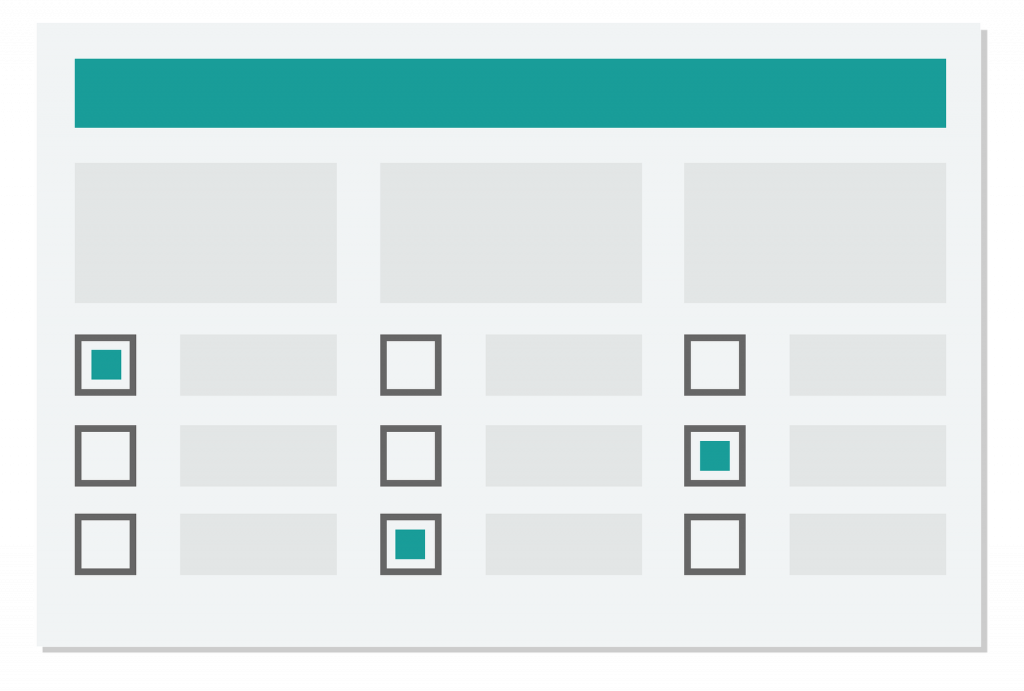
The previous section discussed how to measure respondents’ responses to predesigned items or indicators belonging to an underlying construct. But how do we create the indicators themselves? The process of creating the indicators is called scaling. More formally, scaling is a branch of measurement that involves the construction of measures by associating qualitative judgments about unobservable constructs with quantitative, measurable metric units. Stevens (1946) [11] said, “Scaling is the assignment of objects to numbers according to a rule.” This process of measuring abstract concepts in concrete terms remains one of the most difficult tasks in empirical social science research.
The outcome of a scaling process is a scale , which is an empirical structure for measuring items or indicators of a given construct. Understand that multidimensional “scales”, as discussed in this section, are a little different from “rating scales” discussed in the previous section. A rating scale is used to capture the respondents’ reactions to a given item on a questionnaire. For example, an ordinally scaled item captures a value between “strongly disagree” to “strongly agree.” Attaching a rating scale to a statement or instrument is not scaling. Rather, scaling is the formal process of developing scale items, before rating scales can be attached to those items.
If creating your own scale sounds painful, don’t worry! For most multidimensional variables, you would likely be duplicating work that has already been done by other researchers. Specifically, this is a branch of science called psychometrics. You do not need to create a scale for depression because scales such as the Patient Health Questionnaire (PHQ-9), the Center for Epidemiologic Studies Depression Scale (CES-D), and Beck’s Depression Inventory (BDI) have been developed and refined over dozens of years to measure variables like depression. Similarly, scales such as the Patient Satisfaction Questionnaire (PSQ-18) have been developed to measure satisfaction with medical care. As we will discuss in the next section, these scales have been shown to be reliable and valid. While you could create a new scale to measure depression or satisfaction, a study with rigor would pilot test and refine that new scale over time to make sure it measures the concept accurately and consistently. This high level of rigor is often unachievable in student research projects because of the cost and time involved in pilot testing and validating, so using existing scales is recommended.
Unfortunately, there is no good one-stop=shop for psychometric scales. The Mental Measurements Yearbook provides a searchable database of measures for social science variables, though it woefully incomplete and often does not contain the full documentation for scales in its database. You can access it from a university library’s list of databases. If you can’t find anything in there, your next stop should be the methods section of the articles in your literature review. The methods section of each article will detail how the researchers measured their variables, and often the results section is instructive for understanding more about measures. In a quantitative study, researchers may have used a scale to measure key variables and will provide a brief description of that scale, its names, and maybe a few example questions. If you need more information, look at the results section and tables discussing the scale to get a better idea of how the measure works. Looking beyond the articles in your literature review, searching Google Scholar using queries like “depression scale” or “satisfaction scale” should also provide some relevant results. For example, searching for documentation for the Rosenberg Self-Esteem Scale (which we will discuss in the next section), I found this report from researchers investigating acceptance and commitment therapy which details this scale and many others used to assess mental health outcomes. If you find the name of the scale somewhere but cannot find the documentation (all questions and answers plus how to interpret the scale), a general web search with the name of the scale and “.pdf” may bring you to what you need. Or, to get professional help with finding information, always ask a librarian!
Unfortunately, these approaches do not guarantee that you will be able to view the scale itself or get information on how it is interpreted. Many scales cost money to use and may require training to properly administer. You may also find scales that are related to your variable but would need to be slightly modified to match your study’s needs. You could adapt a scale to fit your study, however changing even small parts of a scale can influence its accuracy and consistency. While it is perfectly acceptable in student projects to adapt a scale without testing it first (time may not allow you to do so), pilot testing is always recommended for adapted scales, and researchers seeking to draw valid conclusions and publish their results must take this additional step.
An index is a composite score derived from aggregating measures of multiple concepts (called components) using a set of rules and formulas. It is different from a scale. Scales also aggregate measures; however, these measures examine different dimensions or the same dimension of a single construct. A well-known example of an index is the consumer price index (CPI), which is computed every month by the Bureau of Labor Statistics of the U.S. Department of Labor. The CPI is a measure of how much consumers have to pay for goods and services (in general) and is divided into eight major categories (food and beverages, housing, apparel, transportation, healthcare, recreation, education and communication, and “other goods and services”), which are further subdivided into more than 200 smaller items. Each month, government employees call all over the country to get the current prices of more than 80,000 items. Using a complicated weighting scheme that takes into account the location and probability of purchase for each item, analysts then combine these prices into an overall index score using a series of formulas and rules.
Another example of an index is the Duncan Socioeconomic Index (SEI). This index is used to quantify a person’s socioeconomic status (SES) and is a combination of three concepts: income, education, and occupation. Income is measured in dollars, education in years or degrees achieved, and occupation is classified into categories or levels by status. These very different measures are combined to create an overall SES index score. However, SES index measurement has generated a lot of controversy and disagreement among researchers.
The process of creating an index is similar to that of a scale. First, conceptualize (define) the index and its constituent components. Though this appears simple, there may be a lot of disagreement on what components (concepts/constructs) should be included or excluded from an index. For instance, in the SES index, isn’t income correlated with education and occupation? And if so, should we include one component only or all three components? Reviewing the literature, using theories, and/or interviewing experts or key stakeholders may help resolve this issue. Second, operationalize and measure each component. For instance, how will you categorize occupations, particularly since some occupations may have changed with time (e.g., there were no Web developers before the Internet)? As we will see in step three below, researchers must create a rule or formula for calculating the index score. Again, this process may involve a lot of subjectivity, so validating the index score using existing or new data is important.
Scale and index development at often taught in their own course in doctoral education, so it is unreasonable for you to expect to develop a consistently accurate measure within the span of a week or two. Using available indices and scales is recommended for this reason.
Differences between scales and indices
Though indices and scales yield a single numerical score or value representing a concept of interest, they are different in many ways. First, indices often comprise components that are very different from each other (e.g., income, education, and occupation in the SES index) and are measured in different ways. Conversely, scales typically involve a set of similar items that use the same rating scale (such as a five-point Likert scale about customer satisfaction).
Second, indices often combine objectively measurable values such as prices or income, while scales are designed to assess subjective or judgmental constructs such as attitude, prejudice, or self-esteem. Some argue that the sophistication of the scaling methodology makes scales different from indexes, while others suggest that indexing methodology can be equally sophisticated. Nevertheless, indexes and scales are both essential tools in social science research.
Scales and indices seem like clean, convenient ways to measure different phenomena in social science, but just like with a lot of research, we have to be mindful of the assumptions and biases underneath. What if a scale or an index was developed using only White women as research participants? Is it going to be useful for other groups? It very well might be, but when using a scale or index on a group for whom it hasn’t been tested, it will be very important to evaluate the validity and reliability of the instrument, which we address in the rest of the chapter.
Finally, it’s important to note that while scales and indices are often made up of nominal or ordinal variables, when we analyze them into composite scores, we will treat them as interval/ratio variables.
- Look back to your work from the previous section, are your variables unidimensional or multidimensional?
- Describe the specific measures you will use (actual questions and response options you will use with participants) for each variable in your research question.
- If you are using a measure developed by another researcher but do not have all of the questions, response options, and instructions needed to implement it, put it on your to-do list to get them.
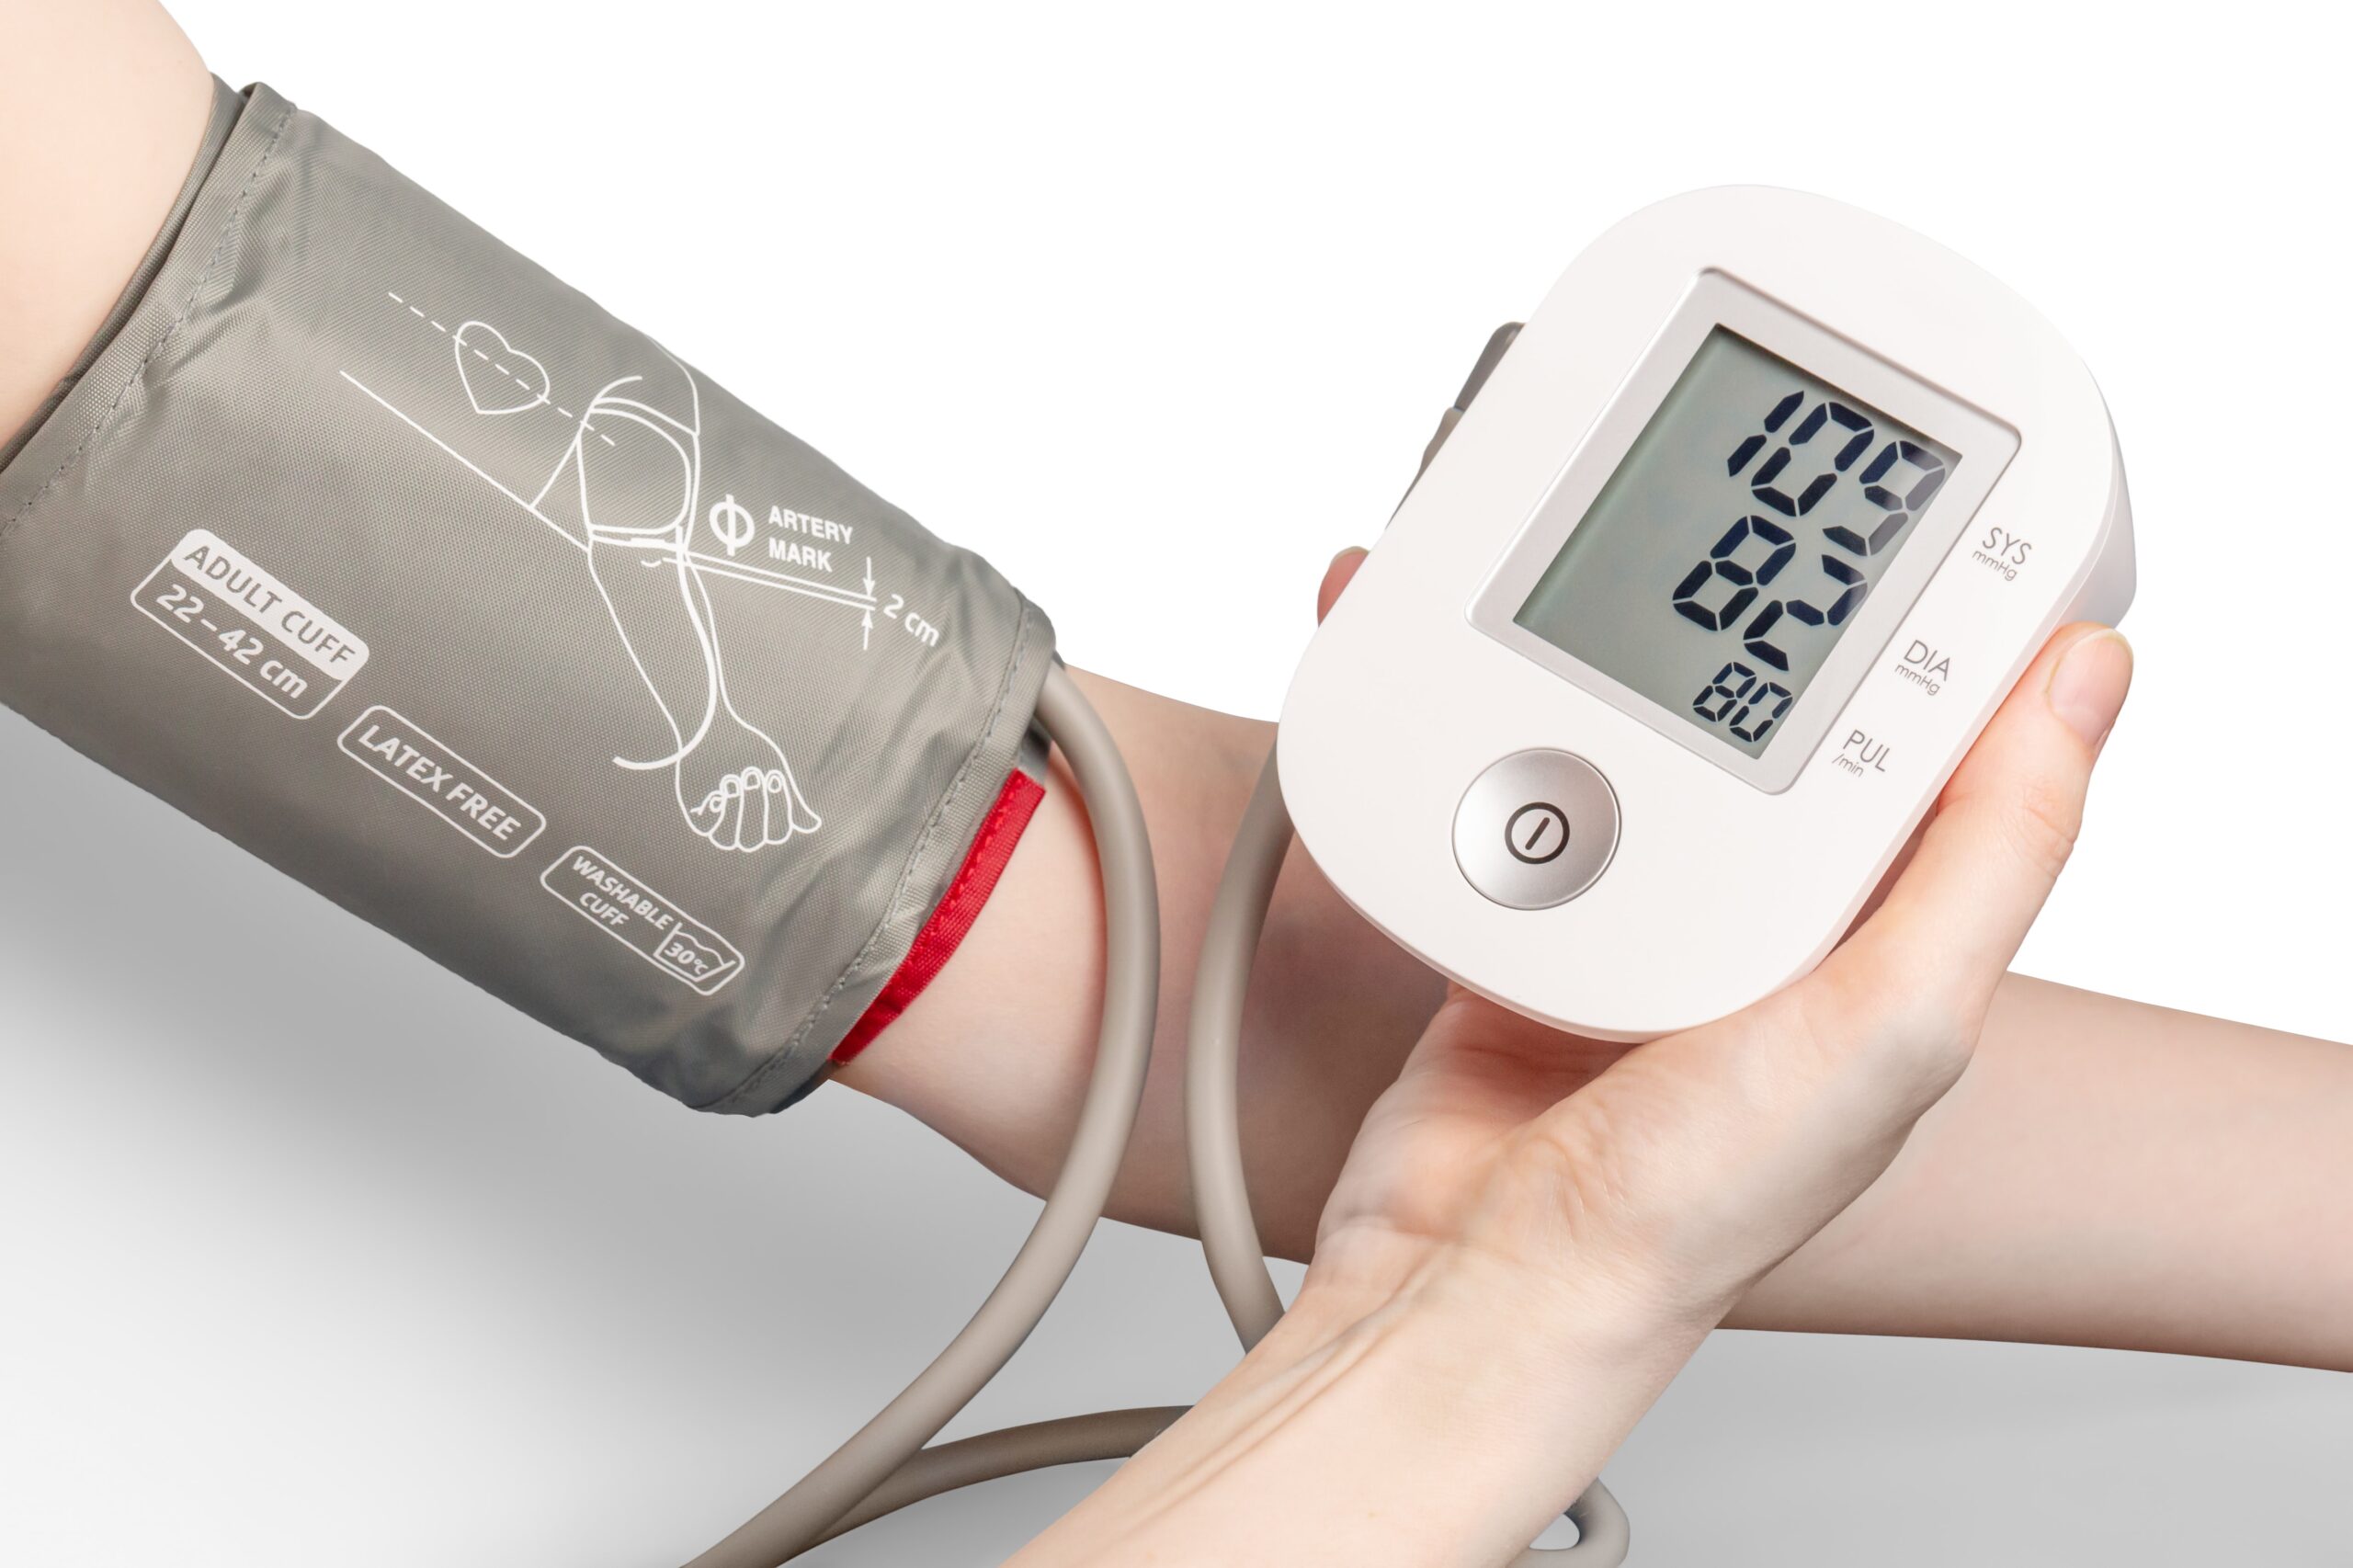
Step 3: How you will interpret your measures
The final stage of operationalization involves setting the rules for how the measure works and how the researcher should interpret the results. Sometimes, interpreting a measure can be incredibly easy. If you ask someone their age, you’ll probably interpret the results by noting the raw number (e.g., 22) someone provides and that it is lower or higher than other people’s ages. However, you could also recode that person into age categories (e.g., under 25, 20-29-years-old, generation Z, etc.). Even scales may be simple to interpret. If there is a scale of problem behaviors, one might simply add up the number of behaviors checked off–with a range from 1-5 indicating low risk of delinquent behavior, 6-10 indicating the student is moderate risk, etc. How you choose to interpret your measures should be guided by how they were designed, how you conceptualize your variables, the data sources you used, and your plan for analyzing your data statistically. Whatever measure you use, you need a set of rules for how to take any valid answer a respondent provides to your measure and interpret it in terms of the variable being measured.
For more complicated measures like scales, refer to the information provided by the author for how to interpret the scale. If you can’t find enough information from the scale’s creator, look at how the results of that scale are reported in the results section of research articles. For example, Beck’s Depression Inventory (BDI-II) uses 21 statements to measure depression and respondents rate their level of agreement on a scale of 0-3. The results for each question are added up, and the respondent is put into one of three categories: low levels of depression (1-16), moderate levels of depression (17-30), or severe levels of depression (31 and over).
One common mistake I see often is that students will introduce another variable into their operational definition. This is incorrect. Your operational definition should mention only one variable—the variable being defined. While your study will certainly draw conclusions about the relationships between variables, that’s not what operationalization is. Operationalization specifies what instrument you will use to measure your variable and how you plan to interpret the data collected using that measure.
Operationalization is probably the trickiest component of basic research methods, so please don’t get frustrated if it takes a few drafts and a lot of feedback to get to a workable definition. At the time of this writing, I am in the process of operationalizing the concept of “attitudes towards research methods.” Originally, I thought that I could gauge students’ attitudes toward research methods by looking at their end-of-semester course evaluations. As I became aware of the potential methodological issues with student course evaluations, I opted to use focus groups of students to measure their common beliefs about research. You may recall some of these opinions from Chapter 1 , such as the common beliefs that research is boring, useless, and too difficult. After the focus group, I created a scale based on the opinions I gathered, and I plan to pilot test it with another group of students. After the pilot test, I expect that I will have to revise the scale again before I can implement the measure in a real social work research project. At the time I’m writing this, I’m still not completely done operationalizing this concept.
- Operationalization involves spelling out precisely how a concept will be measured.
- Operational definitions must include the variable, the measure, and how you plan to interpret the measure.
- There are four different levels of measurement: nominal, ordinal, interval, and ratio (in increasing order of specificity).
- Scales and indices are common ways to collect information and involve using multiple indicators in measurement.
- A key difference between a scale and an index is that a scale contains multiple indicators for one concept, whereas an indicator examines multiple concepts (components).
- Using scales developed and refined by other researchers can improve the rigor of a quantitative study.
Use the research question that you developed in the previous chapters and find a related scale or index that researchers have used. If you have trouble finding the exact phenomenon you want to study, get as close as you can.
- What is the level of measurement for each item on each tool? Take a second and think about why the tool’s creator decided to include these levels of measurement. Identify any levels of measurement you would change and why.
- If these tools don’t exist for what you are interested in studying, why do you think that is?
11.3 Measurement quality
- Define and describe the types of validity and reliability
- Assess for systematic error
The previous chapter provided insight into measuring concepts in social work research. We discussed the importance of identifying concepts and their corresponding indicators as a way to help us operationalize them. In essence, we now understand that when we think about our measurement process, we must be intentional and thoughtful in the choices that we make. This section is all about how to judge the quality of the measures you’ve chosen for the key variables in your research question.
Reliability
First, let’s say we’ve decided to measure alcoholism by asking people to respond to the following question: Have you ever had a problem with alcohol? If we measure alcoholism this way, then it is likely that anyone who identifies as an alcoholic would respond “yes.” This may seem like a good way to identify our group of interest, but think about how you and your peer group may respond to this question. Would participants respond differently after a wild night out, compared to any other night? Could an infrequent drinker’s current headache from last night’s glass of wine influence how they answer the question this morning? How would that same person respond to the question before consuming the wine? In each cases, the same person might respond differently to the same question at different points, so it is possible that our measure of alcoholism has a reliability problem. Reliability in measurement is about consistency.
One common problem of reliability with social scientific measures is memory. If we ask research participants to recall some aspect of their own past behavior, we should try to make the recollection process as simple and straightforward for them as possible. Sticking with the topic of alcohol intake, if we ask respondents how much wine, beer, and liquor they’ve consumed each day over the course of the past 3 months, how likely are we to get accurate responses? Unless a person keeps a journal documenting their intake, there will very likely be some inaccuracies in their responses. On the other hand, we might get more accurate responses if we ask a participant how many drinks of any kind they have consumed in the past week.
Reliability can be an issue even when we’re not reliant on others to accurately report their behaviors. Perhaps a researcher is interested in observing how alcohol intake influences interactions in public locations. They may decide to conduct observations at a local pub by noting how many drinks patrons consume and how their behavior changes as their intake changes. What if the researcher has to use the restroom, and the patron next to them takes three shots of tequila during the brief period the researcher is away from their seat? The reliability of this researcher’s measure of alcohol intake depends on their ability to physically observe every instance of patrons consuming drinks. If they are unlikely to be able to observe every such instance, then perhaps their mechanism for measuring this concept is not reliable.
The following subsections describe the types of reliability that are important for you to know about, but keep in mind that you may see other approaches to judging reliability mentioned in the empirical literature.
Test-retest reliability
When researchers measure a construct that they assume to be consistent across time, then the scores they obtain should also be consistent across time. Test-retest reliability is the extent to which this is actually the case. For example, intelligence is generally thought to be consistent across time. A person who is highly intelligent today will be highly intelligent next week. This means that any good measure of intelligence should produce roughly the same scores for this individual next week as it does today. Clearly, a measure that produces highly inconsistent scores over time cannot be a very good measure of a construct that is supposed to be consistent.
Assessing test-retest reliability requires using the measure on a group of people at one time, using it again on the same group of people at a later time. Unlike an experiment, you aren’t giving participants an intervention but trying to establish a reliable baseline of the variable you are measuring. Once you have these two measurements, you then look at the correlation between the two sets of scores. This is typically done by graphing the data in a scatterplot and computing the correlation coefficient. Figure 11.2 shows the correlation between two sets of scores of several university students on the Rosenberg Self-Esteem Scale, administered two times, a week apart. The correlation coefficient for these data is +.95. In general, a test-retest correlation of +.80 or greater is considered to indicate good reliability.

Again, high test-retest correlations make sense when the construct being measured is assumed to be consistent over time, which is the case for intelligence, self-esteem, and the Big Five personality dimensions. But other constructs are not assumed to be stable over time. The very nature of mood, for example, is that it changes. So a measure of mood that produced a low test-retest correlation over a period of a month would not be a cause for concern.
Internal consistency
Another kind of reliability is internal consistency , which is the consistency of people’s responses across the items on a multiple-item measure. In general, all the items on such measures are supposed to reflect the same underlying construct, so people’s scores on those items should be correlated with each other. On the Rosenberg Self-Esteem Scale, people who agree that they are a person of worth should tend to agree that they have a number of good qualities. If people’s responses to the different items are not correlated with each other, then it would no longer make sense to claim that they are all measuring the same underlying construct. This is as true for behavioral and physiological measures as for self-report measures. For example, people might make a series of bets in a simulated game of roulette as a measure of their level of risk seeking. This measure would be internally consistent to the extent that individual participants’ bets were consistently high or low across trials. A specific statistical test known as Cronbach’s Alpha provides a way to measure how well each question of a scale is related to the others.
Interrater reliability
Many behavioral measures involve significant judgment on the part of an observer or a rater. Interrater reliability is the extent to which different observers are consistent in their judgments. For example, if you were interested in measuring university students’ social skills, you could make video recordings of them as they interacted with another student whom they are meeting for the first time. Then you could have two or more observers watch the videos and rate each student’s level of social skills. To the extent that each participant does, in fact, have some level of social skills that can be detected by an attentive observer, different observers’ ratings should be highly correlated with each other.

Validity , another key element of assessing measurement quality, is the extent to which the scores from a measure represent the variable they are intended to. But how do researchers make this judgment? We have already considered one factor that they take into account—reliability. When a measure has good test-retest reliability and internal consistency, researchers should be more confident that the scores represent what they are supposed to. There has to be more to it, however, because a measure can be extremely reliable but have no validity whatsoever. As an absurd example, imagine someone who believes that people’s index finger length reflects their self-esteem and therefore tries to measure self-esteem by holding a ruler up to people’s index fingers. Although this measure would have extremely good test-retest reliability, it would have absolutely no validity. The fact that one person’s index finger is a centimeter longer than another’s would indicate nothing about which one had higher self-esteem.
Discussions of validity usually divide it into several distinct “types.” But a good way to interpret these types is that they are other kinds of evidence—in addition to reliability—that should be taken into account when judging the validity of a measure.
Face validity
Face validity is the extent to which a measurement method appears “on its face” to measure the construct of interest. Most people would expect a self-esteem questionnaire to include items about whether they see themselves as a person of worth and whether they think they have good qualities. So a questionnaire that included these kinds of items would have good face validity. The finger-length method of measuring self-esteem, on the other hand, seems to have nothing to do with self-esteem and therefore has poor face validity. Although face validity can be assessed quantitatively—for example, by having a large sample of people rate a measure in terms of whether it appears to measure what it is intended to—it is usually assessed informally.
Face validity is at best a very weak kind of evidence that a measurement method is measuring what it is supposed to. One reason is that it is based on people’s intuitions about human behavior, which are frequently wrong. It is also the case that many established measures in psychology work quite well despite lacking face validity. The Minnesota Multiphasic Personality Inventory-2 (MMPI-2) measures many personality characteristics and disorders by having people decide whether each of over 567 different statements applies to them—where many of the statements do not have any obvious relationship to the construct that they measure. For example, the items “I enjoy detective or mystery stories” and “The sight of blood doesn’t frighten me or make me sick” both measure the suppression of aggression. In this case, it is not the participants’ literal answers to these questions that are of interest, but rather whether the pattern of the participants’ responses to a series of questions matches those of individuals who tend to suppress their aggression.
Content validity
Content validity is the extent to which a measure “covers” the construct of interest. For example, if a researcher conceptually defines test anxiety as involving both sympathetic nervous system activation (leading to nervous feelings) and negative thoughts, then his measure of test anxiety should include items about both nervous feelings and negative thoughts. Or consider that attitudes are usually defined as involving thoughts, feelings, and actions toward something. By this conceptual definition, a person has a positive attitude toward exercise to the extent that they think positive thoughts about exercising, feels good about exercising, and actually exercises. So to have good content validity, a measure of people’s attitudes toward exercise would have to reflect all three of these aspects. Like face validity, content validity is not usually assessed quantitatively. Instead, it is assessed by carefully checking the measurement method against the conceptual definition of the construct.
Criterion validity
Criterion validity is the extent to which people’s scores on a measure are correlated with other variables (known as criteria) that one would expect them to be correlated with. For example, people’s scores on a new measure of test anxiety should be negatively correlated with their performance on an important school exam. If it were found that people’s scores were in fact negatively correlated with their exam performance, then this would be a piece of evidence that these scores really represent people’s test anxiety. But if it were found that people scored equally well on the exam regardless of their test anxiety scores, then this would cast doubt on the validity of the measure.
A criterion can be any variable that one has reason to think should be correlated with the construct being measured, and there will usually be many of them. For example, one would expect test anxiety scores to be negatively correlated with exam performance and course grades and positively correlated with general anxiety and with blood pressure during an exam. Or imagine that a researcher develops a new measure of physical risk taking. People’s scores on this measure should be correlated with their participation in “extreme” activities such as snowboarding and rock climbing, the number of speeding tickets they have received, and even the number of broken bones they have had over the years. When the criterion is measured at the same time as the construct, criterion validity is referred to as concurrent validity ; however, when the criterion is measured at some point in the future (after the construct has been measured), it is referred to as predictive validity (because scores on the measure have “predicted” a future outcome).
Discriminant validity
Discriminant validity , on the other hand, is the extent to which scores on a measure are not correlated with measures of variables that are conceptually distinct. For example, self-esteem is a general attitude toward the self that is fairly stable over time. It is not the same as mood, which is how good or bad one happens to be feeling right now. So people’s scores on a new measure of self-esteem should not be very highly correlated with their moods. If the new measure of self-esteem were highly correlated with a measure of mood, it could be argued that the new measure is not really measuring self-esteem; it is measuring mood instead.
Increasing the reliability and validity of measures
We have reviewed the types of errors and how to evaluate our measures based on reliability and validity considerations. However, what can we do while selecting or creating our tool so that we minimize the potential of errors? Many of our options were covered in our discussion about reliability and validity. Nevertheless, the following table provides a quick summary of things that you should do when creating or selecting a measurement tool. While not all of these will be feasible in your project, it is important to include easy-to-implement measures in your research context.
Make sure that you engage in a rigorous literature review so that you understand the concept that you are studying. This means understanding the different ways that your concept may manifest itself. This review should include a search for existing instruments. [12]
- Do you understand all the dimensions of your concept? Do you have a good understanding of the content dimensions of your concept(s)?
- What instruments exist? How many items are on the existing instruments? Are these instruments appropriate for your population?
- Are these instruments standardized? Note: If an instrument is standardized, that means it has been rigorously studied and tested.
Consult content experts to review your instrument. This is a good way to check the face validity of your items. Additionally, content experts can also help you understand the content validity. [13]
- Do you have access to a reasonable number of content experts? If not, how can you locate them?
- Did you provide a list of critical questions for your content reviewers to use in the reviewing process?
Pilot test your instrument on a sufficient number of people and get detailed feedback. [14] Ask your group to provide feedback on the wording and clarity of items. Keep detailed notes and make adjustments BEFORE you administer your final tool.
- How many people will you use in your pilot testing?
- How will you set up your pilot testing so that it mimics the actual process of administering your tool?
- How will you receive feedback from your pilot testing group? Have you provided a list of questions for your group to think about?
Provide training for anyone collecting data for your project. [15] You should provide those helping you with a written research protocol that explains all of the steps of the project. You should also problem solve and answer any questions that those helping you may have. This will increase the chances that your tool will be administered in a consistent manner.
- How will you conduct your orientation/training? How long will it be? What modality?
- How will you select those who will administer your tool? What qualifications do they need?
When thinking of items, use a higher level of measurement, if possible. [16] This will provide more information and you can always downgrade to a lower level of measurement later.
- Have you examined your items and the levels of measurement?
- Have you thought about whether you need to modify the type of data you are collecting? Specifically, are you asking for information that is too specific (at a higher level of measurement) which may reduce participants’ willingness to participate?
Use multiple indicators for a variable. [17] Think about the number of items that you will include in your tool.
- Do you have enough items? Enough indicators? The correct indicators?
Conduct an item-by-item assessment of multiple-item measures. [18] When you do this assessment, think about each word and how it changes the meaning of your item.
- Are there items that are redundant? Do you need to modify, delete, or add items?

Types of error
As you can see, measures never perfectly describe what exists in the real world. Good measures demonstrate validity and reliability but will always have some degree of error. Systematic error (also called bias) causes our measures to consistently output incorrect data in one direction or another on a measure, usually due to an identifiable process. Imagine you created a measure of height, but you didn’t put an option for anyone over six feet tall. If you gave that measure to your local college or university, some of the taller students might not be measured accurately. In fact, you would be under the mistaken impression that the tallest person at your school was six feet tall, when in actuality there are likely people taller than six feet at your school. This error seems innocent, but if you were using that measure to help you build a new building, those people might hit their heads!
A less innocent form of error arises when researchers word questions in a way that might cause participants to think one answer choice is preferable to another. For example, if I were to ask you “Do you think global warming is caused by human activity?” you would probably feel comfortable answering honestly. But what if I asked you “Do you agree with 99% of scientists that global warming is caused by human activity?” Would you feel comfortable saying no, if that’s what you honestly felt? I doubt it. That is an example of a leading question , a question with wording that influences how a participant responds. We’ll discuss leading questions and other problems in question wording in greater detail in Chapter 12 .
In addition to error created by the researcher, your participants can cause error in measurement. Some people will respond without fully understanding a question, particularly if the question is worded in a confusing way. Let’s consider another potential source or error. If we asked people if they always washed their hands after using the bathroom, would we expect people to be perfectly honest? Polling people about whether they wash their hands after using the bathroom might only elicit what people would like others to think they do, rather than what they actually do. This is an example of social desirability bias , in which participants in a research study want to present themselves in a positive, socially desirable way to the researcher. People in your study will want to seem tolerant, open-minded, and intelligent, but their true feelings may be closed-minded, simple, and biased. Participants may lie in this situation. This occurs often in political polling, which may show greater support for a candidate from a minority race, gender, or political party than actually exists in the electorate.
A related form of bias is called acquiescence bias , also known as “yea-saying.” It occurs when people say yes to whatever the researcher asks, even when doing so contradicts previous answers. For example, a person might say yes to both “I am a confident leader in group discussions” and “I feel anxious interacting in group discussions.” Those two responses are unlikely to both be true for the same person. Why would someone do this? Similar to social desirability, people want to be agreeable and nice to the researcher asking them questions or they might ignore contradictory feelings when responding to each question. You could interpret this as someone saying “yeah, I guess.” Respondents may also act on cultural reasons, trying to “save face” for themselves or the person asking the questions. Regardless of the reason, the results of your measure don’t match what the person truly feels.
So far, we have discussed sources of error that come from choices made by respondents or researchers. Systematic errors will result in responses that are incorrect in one direction or another. For example, social desirability bias usually means that the number of people who say they will vote for a third party in an election is greater than the number of people who actually vote for that candidate. Systematic errors such as these can be reduced, but random error can never be eliminated. Unlike systematic error, which biases responses consistently in one direction or another, random error is unpredictable and does not consistently result in scores that are consistently higher or lower on a given measure. Instead, random error is more like statistical noise, which will likely average out across participants.
Random error is present in any measurement. If you’ve ever stepped on a bathroom scale twice and gotten two slightly different results, maybe a difference of a tenth of a pound, then you’ve experienced random error. Maybe you were standing slightly differently or had a fraction of your foot off of the scale the first time. If you were to take enough measures of your weight on the same scale, you’d be able to figure out your true weight. In social science, if you gave someone a scale measuring depression on a day after they lost their job, they would likely score differently than if they had just gotten a promotion and a raise. Even if the person were clinically depressed, our measure is subject to influence by the random occurrences of life. Thus, social scientists speak with humility about our measures. We are reasonably confident that what we found is true, but we must always acknowledge that our measures are only an approximation of reality.
Humility is important in scientific measurement, as errors can have real consequences. At the time I’m writing this, my wife and I are expecting our first child. Like most people, we used a pregnancy test from the pharmacy. If the test said my wife was pregnant when she was not pregnant, that would be a false positive . On the other hand, if the test indicated that she was not pregnant when she was in fact pregnant, that would be a false negative . Even if the test is 99% accurate, that means that one in a hundred women will get an erroneous result when they use a home pregnancy test. For us, a false positive would have been initially exciting, then devastating when we found out we were not having a child. A false negative would have been disappointing at first and then quite shocking when we found out we were indeed having a child. While both false positives and false negatives are not very likely for home pregnancy tests (when taken correctly), measurement error can have consequences for the people being measured.
- Reliability is a matter of consistency.
- Validity is a matter of accuracy.
- There are many types of validity and reliability.
- Systematic error may arise from the researcher, participant, or measurement instrument.
- Systematic error biases results in a particular direction, whereas random error can be in any direction.
- All measures are prone to error and should interpreted with humility.
Use the measurement tools you located in the previous exercise. Evaluate the reliability and validity of these tools. Hint: You will need to go into the literature to “research” these tools.
- Provide a clear statement regarding the reliability and validity of these tools. What strengths did you notice? What were the limitations?
- Think about your target population . Are there changes that need to be made in order for one of these tools to be appropriate for your population?
- If you decide to create your own tool, how will you assess its validity and reliability?
11.4 Ethical and social justice considerations
- Identify potential cultural, ethical, and social justice issues in measurement.
With your variables operationalized, it’s time to take a step back and look at how measurement in social science impact our daily lives. As we will see, how we measure things is both shaped by power arrangements inside our society, and more insidiously, by establishing what is scientifically true, measures have their own power to influence the world. Just like reification in the conceptual world, how we operationally define concepts can reinforce or fight against oppressive forces.

Data equity
How we decide to measure our variables determines what kind of data we end up with in our research project. Because scientific processes are a part of our sociocultural context, the same biases and oppressions we see in the real world can be manifested or even magnified in research data. Jagadish and colleagues (2021) [19] presents four dimensions of data equity that are relevant to consider: in representation of non-dominant groups within data sets; in how data is collected, analyzed, and combined across datasets; in equitable and participatory access to data, and finally in the outcomes associated with the data collection. Historically, we have mostly focused on the outcomes of measures producing outcomes that are biased in one way or another, and this section reviews many such examples. However, it is important to note that equity must also come from designing measures that respond to questions like:
- Are groups historically suppressed from the data record represented in the sample?
- Are equity data gathered by researchers and used to uncover and quantify inequity?
- Are the data accessible across domains and levels of expertise, and can community members participate in the design, collection, and analysis of the public data record?
- Are the data collected used to monitor and mitigate inequitable impacts?
So, it’s not just about whether measures work for one population for another. Data equity is about the context in which data are created from how we measure people and things. We agree with these authors that data equity should be considered within the context of automated decision-making systems and recognizing a broader literature around the role of administrative systems in creating and reinforcing discrimination. To combat the inequitable processes and outcomes we describe below, researchers must foreground equity as a core component of measurement.
Flawed measures & missing measures
At the end of every semester, students in just about every university classroom in the United States complete similar student evaluations of teaching (SETs). Since every student is likely familiar with these, we can recognize many of the concepts we discussed in the previous sections. There are number of rating scale questions that ask you to rate the professor, class, and teaching effectiveness on a scale of 1-5. Scores are averaged across students and used to determine the quality of teaching delivered by the faculty member. SETs scores are often a principle component of how faculty are reappointed to teaching positions. Would it surprise you to learn that student evaluations of teaching are of questionable quality? If your instructors are assessed with a biased or incomplete measure, how might that impact your education?
Most often, student scores are averaged across questions and reported as a final average. This average is used as one factor, often the most important factor, in a faculty member’s reappointment to teaching roles. We learned in this chapter that rating scales are ordinal, not interval or ratio, and the data are categories not numbers. Although rating scales use a familiar 1-5 scale, the numbers 1, 2, 3, 4, & 5 are really just helpful labels for categories like “excellent” or “strongly agree.” If we relabeled these categories as letters (A-E) rather than as numbers (1-5), how would you average them?
Averaging ordinal data is methodologically dubious, as the numbers are merely a useful convention. As you will learn in Chapter 14 , taking the median value is what makes the most sense with ordinal data. Median values are also less sensitive to outliers. So, a single student who has strong negative or positive feelings towards the professor could bias the class’s SETs scores higher or lower than what the “average” student in the class would say, particularly for classes with few students or in which fewer students completed evaluations of their teachers.
We care about teaching quality because more effective teachers will produce more knowledgeable and capable students. However, student evaluations of teaching are not particularly good indicators of teaching quality and are not associated with the independently measured learning gains of students (i.e., test scores, final grades) (Uttl et al., 2017). [20] This speaks to the lack of criterion validity. Higher teaching quality should be associated with better learning outcomes for students, but across multiple studies stretching back years, there is no association that cannot be better explained by other factors. To be fair, there are scholars who find that SETs are valid and reliable. For a thorough defense of SETs as well as a historical summary of the literature see Benton & Cashin (2012). [21]
Even though student evaluations of teaching often contain dozens of questions, researchers often find that the questions are so highly interrelated that one concept (or factor, as it is called in a factor analysis ) explains a large portion of the variance in teachers’ scores on student evaluations (Clayson, 2018). [22] Personally, I believe based on completing SETs myself that factor is probably best conceptualized as student satisfaction, which is obviously worthwhile to measure, but is conceptually quite different from teaching effectiveness or whether a course achieved its intended outcomes. The lack of a clear operational and conceptual definition for the variable or variables being measured in student evaluations of teaching also speaks to a lack of content validity. Researchers check content validity by comparing the measurement method with the conceptual definition, but without a clear conceptual definition of the concept measured by student evaluations of teaching, it’s not clear how we can know our measure is valid. Indeed, the lack of clarity around what is being measured in teaching evaluations impairs students’ ability to provide reliable and valid evaluations. So, while many researchers argue that the class average SETs scores are reliable in that they are consistent over time and across classes, it is unclear what exactly is being measured even if it is consistent (Clayson, 2018). [23]
As a faculty member, there are a number of things I can do to influence my evaluations and disrupt validity and reliability. Since SETs scores are associated with the grades students perceive they will receive (e.g., Boring et al., 2016), [24] guaranteeing everyone a final grade of A in my class will likely increase my SETs scores and my chances at tenure and promotion. I could time an email reminder to complete SETs with releasing high grades for a major assignment to boost my evaluation scores. On the other hand, student evaluations might be coincidentally timed with poor grades or difficult assignments that will bias student evaluations downward. Students may also infer I am manipulating them and give me lower SET scores as a result. To maximize my SET scores and chances and promotion, I also need to select which courses I teach carefully. Classes that are more quantitatively oriented generally receive lower ratings than more qualitative and humanities-driven classes, which makes my decision to teach social work research a poor strategy (Uttl & Smibert, 2017). [25] The only manipulative strategy I will admit to using is bringing food (usually cookies or donuts) to class during the period in which students are completing evaluations. Measurement is impacted by context.
As a white cis-gender male educator, I am adversely impacted by SETs because of their sketchy validity, reliability, and methodology. The other flaws with student evaluations actually help me while disadvantaging teachers from oppressed groups. Heffernan (2021) [26] provides a comprehensive overview of the sexism, racism, ableism, and prejudice baked into student evaluations:
“In all studies relating to gender, the analyses indicate that the highest scores are awarded in subjects filled with young, white, male students being taught by white English first language speaking, able-bodied, male academics who are neither too young nor too old (approx. 35–50 years of age), and who the students believe are heterosexual. Most deviations from this scenario in terms of student and academic demographics equates to lower SET scores. These studies thus highlight that white, able-bodied, heterosexual, men of a certain age are not only the least affected, they benefit from the practice. When every demographic group who does not fit this image is significantly disadvantaged by SETs, these processes serve to further enhance the position of the already privileged” (p. 5).
The staggering consistency of studies examining prejudice in SETs has led to some rather superficial reforms like reminding students to not submit racist or sexist responses in the written instructions given before SETs. Yet, even though we know that SETs are systematically biased against women, people of color, and people with disabilities, the overwhelming majority of universities in the United States continue to use them to evaluate faculty for promotion or reappointment. From a critical perspective, it is worth considering why university administrators continue to use such a biased and flawed instrument. SETs produce data that make it easy to compare faculty to one another and track faculty members over time. Furthermore, they offer students a direct opportunity to voice their concerns and highlight what went well.
As the people with the greatest knowledge about what happened in the classroom as whether it met their expectations, providing students with open-ended questions is the most productive part of SETs. Personally, I have found focus groups written, facilitated, and analyzed by student researchers to be more insightful than SETs. MSW student activists and leaders may look for ways to evaluate faculty that are more methodologically sound and less systematically biased, creating institutional change by replacing or augmenting traditional SETs in their department. There is very rarely student input on the criteria and methodology for teaching evaluations, yet students are the most impacted by helpful or harmful teaching practices.
Students should fight for better assessment in the classroom because well-designed assessments provide documentation to support more effective teaching practices and discourage unhelpful or discriminatory practices. Flawed assessments like SETs, can lead to a lack of information about problems with courses, instructors, or other aspects of the program. Think critically about what data your program uses to gauge its effectiveness. How might you introduce areas of student concern into how your program evaluates itself? Are there issues with food or housing insecurity, mentorship of nontraditional and first generation students, or other issues that faculty should consider when they evaluate their program? Finally, as you transition into practice, think about how your agency measures its impact and how it privileges or excludes client and community voices in the assessment process.
Let’s consider an example from social work practice. Let’s say you work for a mental health organization that serves youth impacted by community violence. How should you measure the impact of your services on your clients and their community? Schools may be interested in reducing truancy, self-injury, or other behavioral concerns. However, by centering delinquent behaviors in how we measure our impact, we may be inattentive to the role of trauma, family dynamics, and other cognitive and social processes beyond “delinquent behavior.” Indeed, we may bias our interventions by focusing on things that are not as important to clients’ needs. Social workers want to make sure their programs are improving over time, and we rely on our measures to indicate what to change and what to keep. If our measures present a partial or flawed view, we lose our ability to establish and act on scientific truths.
While writing this section, one of the authors wrote this commentary article addressing potential racial bias in social work licensing exams. If you are interested in an example of missing or flawed measures that relates to systems your social work practice is governed by (rather than SETs which govern our practice in higher education) check it out!
You may also be interested in similar arguments against the standard grading scale (A-F), and why grades (numerical, letter, etc.) do not do a good job of measuring learning. Think critically about the role that grades play in your life as a student, your self-concept, and your relationships with teachers. Your test and grade anxiety is due in part to how your learning is measured. Those measurements end up becoming an official record of your scholarship and allow employers or funders to compare you to other scholars. The stakes for measurement are the same for participants in your research study.

Self-reflection and measurement
Student evaluations of teaching are just like any other measure. How we decide to measure what we are researching is influenced by our backgrounds, including our culture, implicit biases, and individual experiences. For me as a middle-class, cisgender white woman, the decisions I make about measurement will probably default to ones that make the most sense to me and others like me, and thus measure characteristics about us most accurately if I don’t think carefully about it. There are major implications for research here because this could affect the validity of my measurements for other populations.
This doesn’t mean that standardized scales or indices, for instance, won’t work for diverse groups of people. What it means is that researchers must not ignore difference in deciding how to measure a variable in their research. Doing so may serve to push already marginalized people further into the margins of academic research and, consequently, social work intervention. Social work researchers, with our strong orientation toward celebrating difference and working for social justice, are obligated to keep this in mind for ourselves and encourage others to think about it in their research, too.
This involves reflecting on what we are measuring, how we are measuring, and why we are measuring. Do we have biases that impacted how we operationalized our concepts? Did we include stakeholders and gatekeepers in the development of our concepts? This can be a way to gain access to vulnerable populations. What feedback did we receive on our measurement process and how was it incorporated into our work? These are all questions we should ask as we are thinking about measurement. Further, engaging in this intentionally reflective process will help us maximize the chances that our measurement will be accurate and as free from bias as possible.
The NASW Code of Ethics discusses social work research and the importance of engaging in practices that do not harm participants. This is especially important considering that many of the topics studied by social workers are those that are disproportionately experienced by marginalized and oppressed populations. Some of these populations have had negative experiences with the research process: historically, their stories have been viewed through lenses that reinforced the dominant culture’s standpoint. Thus, when thinking about measurement in research projects, we must remember that the way in which concepts or constructs are measured will impact how marginalized or oppressed persons are viewed. It is important that social work researchers examine current tools to ensure appropriateness for their population(s). Sometimes this may require researchers to use existing tools. Other times, this may require researchers to adapt existing measures or develop completely new measures in collaboration with community stakeholders. In summary, the measurement protocols selected should be tailored and attentive to the experiences of the communities to be studied.
Unfortunately, social science researchers do not do a great job of sharing their measures in a way that allows social work practitioners and administrators to use them to evaluate the impact of interventions and programs on clients. Few scales are published under an open copyright license that allows other people to view it for free and share it with others. Instead, the best way to find a scale mentioned in an article is often to simply search for it in Google with “.pdf” or “.docx” in the query to see if someone posted a copy online (usually in violation of copyright law). As we discussed in Chapter 4 , this is an issue of information privilege, or the structuring impact of oppression and discrimination on groups’ access to and use of scholarly information. As a student at a university with a research library, you can access the Mental Measurement Yearbook to look up scales and indexes that measure client or program outcomes while researchers unaffiliated with university libraries cannot do so. Similarly, the vast majority of scholarship in social work and allied disciplines does not share measures, data, or other research materials openly, a best practice in open and collaborative science. It is important to underscore these structural barriers to using valid and reliable scales in social work practice. An invalid or unreliable outcome test may cause ineffective or harmful programs to persist or may worsen existing prejudices and oppressions experienced by clients, communities, and practitioners.
But it’s not just about reflecting and identifying problems and biases in our measurement, operationalization, and conceptualization—what are we going to do about it? Consider this as you move through this book and become a more critical consumer of research. Sometimes there isn’t something you can do in the immediate sense—the literature base at this moment just is what it is. But how does that inform what you will do later?
A place to start: Stop oversimplifying race
We will address many more of the critical issues related to measurement in the next chapter. One way to get started in bringing cultural awareness to scientific measurement is through a critical examination of how we analyze race quantitatively. There are many important methodological objections to how we measure the impact of race. We encourage you to watch Dr. Abigail Sewell’s three-part workshop series called “Nested Models for Critical Studies of Race & Racism” for the Inter-university Consortium for Political and Social Research (ICPSR). She discusses how to operationalize and measure inequality, racism, and intersectionality and critiques researchers’ attempts to oversimplify or overlook racism when we measure concepts in social science. If you are interested in developing your social work research skills further, consider applying for financial support from your university to attend an ICPSR summer seminar like Dr. Sewell’s where you can receive more advanced and specialized training in using research for social change.
- Part 1: Creating Measures of Supraindividual Racism (2-hour video)
- Part 2: Evaluating Population Risks of Supraindividual Racism (2-hour video)
- Part 3: Quantifying Intersectionality (2-hour video)
- Social work researchers must be attentive to personal and institutional biases in the measurement process that affect marginalized groups.
- What is measured and how it is measured is shaped by power, and social workers must be critical and self-reflective in their research projects.
Think about your current research question and the tool(s) that you will use to gather data. Even if you haven’t chosen your tools yet, think of some that you have encountered in the literature so far.
- How does your positionality and experience shape what variables you are choosing to measure and how you measure them?
- Evaluate the measures in your study for potential biases.
- If you are using measures developed by another researcher, investigate whether it is valid and reliable in other studies across cultures.
- Milkie, M. A., & Warner, C. H. (2011). Classroom learning environments and the mental health of first grade children. Journal of Health and Social Behavior, 52 , 4–22 ↵
- Kaplan, A. (1964). The conduct of inquiry: Methodology for behavioral science . San Francisco, CA: Chandler Publishing Company. ↵
- Earl Babbie offers a more detailed discussion of Kaplan’s work in his text. You can read it in: Babbie, E. (2010). The practice of social research (12th ed.). Belmont, CA: Wadsworth. ↵
- In this chapter, we will use the terms concept and construct interchangeably. While each term has a distinct meaning in research conceptualization, we do not believe this distinction is important enough to warrant discussion in this chapter. ↵
- Wong, Y. J., Steinfeldt, J. A., Speight, Q. L., & Hickman, S. J. (2010). Content analysis of Psychology of men & masculinity (2000–2008). Psychology of Men & Masculinity , 11 (3), 170. ↵
- Kimmel, M. (2000). The gendered society . New York, NY: Oxford University Press; Kimmel, M. (2008). Masculinity. In W. A. Darity Jr. (Ed.), International encyclopedia of the social sciences (2nd ed., Vol. 5, p. 1–5). Detroit, MI: Macmillan Reference USA ↵
- Kimmel, M. & Aronson, A. B. (2004). Men and masculinities: A-J . Denver, CO: ABL-CLIO. ↵
- Krosnick, J.A. & Berent, M.K. (1993). Comparisons of party identification and policy preferences: The impact of survey question format. American Journal of Political Science, 27 (3), 941-964. ↵
- Likert, R. (1932). A technique for the measurement of attitudes. Archives of Psychology,140 , 1–55. ↵
- Stevens, S. S. (1946). On the Theory of Scales of Measurement. Science , 103 (2684), 677-680. ↵
- Sullivan G. M. (2011). A primer on the validity of assessment instruments. Journal of graduate medical education, 3 (2), 119–120. doi:10.4300/JGME-D-11-00075.1 ↵
- Engel, R. & Schutt, R. (2013). The practice of research in social work (3rd. ed.) . Thousand Oaks, CA: SAGE. ↵
- Engel, R. & Schutt, R. (2013). The practice of research in social work (3rd. ed.). Thousand Oaks, CA: SAGE. ↵
- Jagadish, H. V., Stoyanovich, J., & Howe, B. (2021). COVID-19 Brings Data Equity Challenges to the Fore. Digital Government: Research and Practice , 2 (2), 1-7. ↵
- Uttl, B., White, C. A., & Gonzalez, D. W. (2017). Meta-analysis of faculty's teaching effectiveness: Student evaluation of teaching ratings and student learning are not related. Studies in Educational Evaluation , 54 , 22-42. ↵
- Benton, S. L., & Cashin, W. E. (2014). Student ratings of instruction in college and university courses. In Higher education: Handbook of theory and research (pp. 279-326). Springer, Dordrecht. ↵
- Clayson, D. E. (2018). Student evaluation of teaching and matters of reliability. Assessment & Evaluation in Higher Education , 43 (4), 666-681. ↵
- Clayson, D. E. (2018). Student evaluation of teaching and matters of reliability. Assessment & Evaluation in Higher Education , 43 (4), 666-681. ↵
- Boring, A., Ottoboni, K., & Stark, P. (2016). Student evaluations of teaching (mostly) do not measure teaching effectiveness. ScienceOpen Research . ↵
- Uttl, B., & Smibert, D. (2017). Student evaluations of teaching: teaching quantitative courses can be hazardous to one’s career. Peer Journal , 5 , e3299. ↵
- Heffernan, T. (2021). Sexism, racism, prejudice, and bias: a literature review and synthesis of research surrounding student evaluations of courses and teaching. Assessment & Evaluation in Higher Education , 1-11. ↵
The process by which we describe and ascribe meaning to the key facts, concepts, or other phenomena under investigation in a research study.
In measurement, conditions that are easy to identify and verify through direct observation.
In measurement, conditions that are subtle and complex that we must use existing knowledge and intuition to define.
Conditions that are not directly observable and represent states of being, experiences, and ideas.
A mental image that summarizes a set of similar observations, feelings, or ideas
developing clear, concise definitions for the key concepts in a research question
concepts that are comprised of multiple elements
concepts that are expected to have a single underlying dimension
assuming that abstract concepts exist in some concrete, tangible way
process by which researchers spell out precisely how a concept will be measured in their study
Clues that demonstrate the presence, intensity, or other aspects of a concept in the real world
unprocessed data that researchers can analyze using quantitative and qualitative methods (e.g., responses to a survey or interview transcripts)
a characteristic that does not change in a study
The characteristics that make up a variable
variables whose values are organized into mutually exclusive groups but whose numerical values cannot be used in mathematical operations.
variables whose values are mutually exclusive and can be used in mathematical operations
The lowest level of measurement; categories cannot be mathematically ranked, though they are exhaustive and mutually exclusive
Exhaustive categories are options for closed ended questions that allow for every possible response (no one should feel like they can't find the answer for them).
Mutually exclusive categories are options for closed ended questions that do not overlap, so people only fit into one category or another, not both.
Level of measurement that follows nominal level. Has mutually exclusive categories and a hierarchy (rank order), but we cannot calculate a mathematical distance between attributes.
An ordered set of responses that participants must choose from.
A level of measurement that is continuous, can be rank ordered, is exhaustive and mutually exclusive, and for which the distance between attributes is known to be equal. But for which there is no zero point.
The highest level of measurement. Denoted by mutually exclusive categories, a hierarchy (order), values can be added, subtracted, multiplied, and divided, and the presence of an absolute zero.
measuring people’s attitude toward something by assessing their level of agreement with several statements about it
Composite (multi-item) scales in which respondents are asked to indicate their opinions or feelings toward a single statement using different pairs of adjectives framed as polar opposites.
A composite scale using a series of items arranged in increasing order of intensity of the construct of interest, from least intense to most intense.
measurements of variables based on more than one one indicator
An empirical structure for measuring items or indicators of the multiple dimensions of a concept.
a composite score derived from aggregating measures of multiple concepts (called components) using a set of rules and formulas
The ability of a measurement tool to measure a phenomenon the same way, time after time. Note: Reliability does not imply validity.
The extent to which scores obtained on a scale or other measure are consistent across time
The consistency of people’s responses across the items on a multiple-item measure. Responses about the same underlying construct should be correlated, though not perfectly.
The extent to which different observers are consistent in their assessment or rating of a particular characteristic or item.
The extent to which the scores from a measure represent the variable they are intended to.
The extent to which a measurement method appears “on its face” to measure the construct of interest
The extent to which a measure “covers” the construct of interest, i.e., it's comprehensiveness to measure the construct.
The extent to which people’s scores on a measure are correlated with other variables (known as criteria) that one would expect them to be correlated with.
A type of criterion validity. Examines how well a tool provides the same scores as an already existing tool administered at the same point in time.
A type of criterion validity that examines how well your tool predicts a future criterion.
The extent to which scores on a measure are not correlated with measures of variables that are conceptually distinct.
(also known as bias) refers to when a measure consistently outputs incorrect data, usually in one direction and due to an identifiable process
When a participant's answer to a question is altered due to the way in which a question is written. In essence, the question leads the participant to answer in a specific way.
Social desirability bias occurs when we create questions that lead respondents to answer in ways that don't reflect their genuine thoughts or feelings to avoid being perceived negatively.
In a measure, when people say yes to whatever the researcher asks, even when doing so contradicts previous answers.
Unpredictable error that does not result in scores that are consistently higher or lower on a given measure but are nevertheless inaccurate.
when a measure indicates the presence of a phenomenon, when in reality it is not present
when a measure does not indicate the presence of a phenomenon, when in reality it is present
the group of people whose needs your study addresses
The value in the middle when all our values are placed in numerical order. Also called the 50th percentile.
individuals or groups who have an interest in the outcome of the study you conduct
the people or organizations who control access to the population you want to study
Graduate research methods in social work Copyright © 2021 by Matthew DeCarlo, Cory Cummings, Kate Agnelli is licensed under a Creative Commons Attribution-NonCommercial-ShareAlike 4.0 International License , except where otherwise noted.
Share This Book
- Science & Math
- Mathematics
Enjoy fast, free delivery, exclusive deals, and award-winning movies & TV shows with Prime Try Prime and start saving today with fast, free delivery
Amazon Prime includes:
Fast, FREE Delivery is available to Prime members. To join, select "Try Amazon Prime and start saving today with Fast, FREE Delivery" below the Add to Cart button.
- Cardmembers earn 5% Back at Amazon.com with a Prime Credit Card.
- Unlimited Free Two-Day Delivery
- Streaming of thousands of movies and TV shows with limited ads on Prime Video.
- A Kindle book to borrow for free each month - with no due dates
- Listen to over 2 million songs and hundreds of playlists
- Unlimited photo storage with anywhere access
Important: Your credit card will NOT be charged when you start your free trial or if you cancel during the trial period. If you're happy with Amazon Prime, do nothing. At the end of the free trial, your membership will automatically upgrade to a monthly membership.
Return this item for free
Free returns are available for the shipping address you chose. You can return the item for any reason in new and unused condition: no shipping charges
- Go to your orders and start the return
- Select the return method
Download the free Kindle app and start reading Kindle books instantly on your smartphone, tablet, or computer - no Kindle device required .
Read instantly on your browser with Kindle for Web.
Using your mobile phone camera - scan the code below and download the Kindle app.

Image Unavailable

- To view this video download Flash Player
Quantitative Research Methods for Social Work: Making Social Work Count 1st ed. 2017 Edition
Purchase options and add-ons.
- ISBN-10 9781137400260
- ISBN-13 978-1137400260
- Edition 1st ed. 2017
- Publisher Red Globe Press
- Publication date November 11, 2016
- Language English
- Dimensions 6.14 x 0.61 x 9.21 inches
- Print length 276 pages
- See all details

Editorial Reviews
From the back cover.
Social work knowledge and understanding draws heavily on research, and the ability to critically analyse research findings is a core skill for social workers. However, while many social work students are confident in reading qualitative data, a lack of understanding in some basic statistical concepts means that this same confidence does not always apply to quantitative data.
In this authoritative text, a collection of leading names in social work research and academia unpack the basic concepts of quantitative research methods – including reliability, validity, probability, variables and hypothesis testing – and explore key areas of data collection, analysis and evaluation, providing a detailed examination of their application to social work practice.
About the Author
Barbra Teater is Associate Professor in Social Work at the College of Staten Island, City University of New York, USA. John Devaney is Senior Lecturer in Social Work at Queen's University Belfast, UK. Donald Forrester is Professor of Child and Family Social Work at Cardiff University, UK. Jonathan Scourfield is Professor of Social Work at Cardiff University, UK. John Carpenter is Professor of Social Work & Applied Social Sciences at the University of Bristol, UK. Barbra Teater is Associate Professor in Social Work at the College of Staten Island, City University of New York, USA. John Devaney is Senior Lecturer in Social Work at Queen's University Belfast, UK. Donald Forrester is Professor of Child and Family Social Work at Cardiff University, UK. Jonathan Scourfield is Professor of Social Work at Cardiff University, UK. John Carpenter is Professor of Social Work & Applied Social Sciences at the University of Bristol, UK.
Product details
- ASIN : 1137400269
- Publisher : Red Globe Press; 1st ed. 2017 edition (November 11, 2016)
- Language : English
- Paperback : 276 pages
- ISBN-10 : 9781137400260
- ISBN-13 : 978-1137400260
- Item Weight : 14.6 ounces
- Dimensions : 6.14 x 0.61 x 9.21 inches
- #7,557 in Statistics (Books)
- #14,493 in Social Work (Books)
- #154,494 in Social Sciences (Books)
Customer reviews
Customer Reviews, including Product Star Ratings help customers to learn more about the product and decide whether it is the right product for them.
To calculate the overall star rating and percentage breakdown by star, we don’t use a simple average. Instead, our system considers things like how recent a review is and if the reviewer bought the item on Amazon. It also analyzed reviews to verify trustworthiness.
- Sort reviews by Top reviews Most recent Top reviews
Top reviews from the United States
Top reviews from other countries.

- Amazon Newsletter
- About Amazon
- Accessibility
- Sustainability
- Press Center
- Investor Relations
- Amazon Devices
- Amazon Science
- Sell on Amazon
- Sell apps on Amazon
- Supply to Amazon
- Protect & Build Your Brand
- Become an Affiliate
- Become a Delivery Driver
- Start a Package Delivery Business
- Advertise Your Products
- Self-Publish with Us
- Become an Amazon Hub Partner
- › See More Ways to Make Money
- Amazon Visa
- Amazon Store Card
- Amazon Secured Card
- Amazon Business Card
- Shop with Points
- Credit Card Marketplace
- Reload Your Balance
- Amazon Currency Converter
- Your Account
- Your Orders
- Shipping Rates & Policies
- Amazon Prime
- Returns & Replacements
- Manage Your Content and Devices
- Recalls and Product Safety Alerts
- Conditions of Use
- Privacy Notice
- Consumer Health Data Privacy Disclosure
- Your Ads Privacy Choices

- school Campus Bookshelves
- menu_book Bookshelves
- perm_media Learning Objects
- login Login
- how_to_reg Request Instructor Account
- hub Instructor Commons
Margin Size
- Download Page (PDF)
- Download Full Book (PDF)
- Periodic Table
- Physics Constants
- Scientific Calculator
- Reference & Cite
- Tools expand_more
- Readability
selected template will load here
This action is not available.
10.2: Sampling approaches for quantitative research
- Last updated
- Save as PDF
- Page ID 135139

- Matthew DeCarlo, Cory Cummings, & Kate Agnelli
- Open Social Work Education
\( \newcommand{\vecs}[1]{\overset { \scriptstyle \rightharpoonup} {\mathbf{#1}} } \)
\( \newcommand{\vecd}[1]{\overset{-\!-\!\rightharpoonup}{\vphantom{a}\smash {#1}}} \)
\( \newcommand{\id}{\mathrm{id}}\) \( \newcommand{\Span}{\mathrm{span}}\)
( \newcommand{\kernel}{\mathrm{null}\,}\) \( \newcommand{\range}{\mathrm{range}\,}\)
\( \newcommand{\RealPart}{\mathrm{Re}}\) \( \newcommand{\ImaginaryPart}{\mathrm{Im}}\)
\( \newcommand{\Argument}{\mathrm{Arg}}\) \( \newcommand{\norm}[1]{\| #1 \|}\)
\( \newcommand{\inner}[2]{\langle #1, #2 \rangle}\)
\( \newcommand{\Span}{\mathrm{span}}\)
\( \newcommand{\id}{\mathrm{id}}\)
\( \newcommand{\kernel}{\mathrm{null}\,}\)
\( \newcommand{\range}{\mathrm{range}\,}\)
\( \newcommand{\RealPart}{\mathrm{Re}}\)
\( \newcommand{\ImaginaryPart}{\mathrm{Im}}\)
\( \newcommand{\Argument}{\mathrm{Arg}}\)
\( \newcommand{\norm}[1]{\| #1 \|}\)
\( \newcommand{\Span}{\mathrm{span}}\) \( \newcommand{\AA}{\unicode[.8,0]{x212B}}\)
\( \newcommand{\vectorA}[1]{\vec{#1}} % arrow\)
\( \newcommand{\vectorAt}[1]{\vec{\text{#1}}} % arrow\)
\( \newcommand{\vectorB}[1]{\overset { \scriptstyle \rightharpoonup} {\mathbf{#1}} } \)
\( \newcommand{\vectorC}[1]{\textbf{#1}} \)
\( \newcommand{\vectorD}[1]{\overrightarrow{#1}} \)
\( \newcommand{\vectorDt}[1]{\overrightarrow{\text{#1}}} \)
\( \newcommand{\vectE}[1]{\overset{-\!-\!\rightharpoonup}{\vphantom{a}\smash{\mathbf {#1}}}} \)
Learning Objectives
Learners will be able to…
- Determine whether you will use probability or non-probability sampling, given the strengths and limitations of each specific sampling approach
- Distinguish between approaches to probability sampling and detail the reasons to use each approach
Sampling in quantitative research projects is done because it is not feasible to study the whole population, and researchers hope to take what we learn about a small group of people (your sample) and apply it to a larger population. There are many ways to approach this process, and they can be grouped into two categories—probability sampling and non-probability sampling. Sampling approaches are inextricably linked with recruitment, and researchers should ensure that their proposal’s recruitment strategy matches the sampling approach.
Probability sampling approaches use a random process, usually a computer program, to select participants from the sampling frame so that everyone has an equal chance of being included. It’s important to note that random means the researcher used a process that is truly random . In a project sampling college students, standing outside of the building in which your social work department is housed and surveying everyone who walks past is not random. Because of the location, you are likely to recruit a disproportionately large number of social work students and fewer from other disciplines. Depending on the time of day, you may recruit more traditional undergraduate students, who take classes during the day, or more graduate students, who take classes in the evenings.
In this example, you are actually using non-probability sampling . Another way to say this is that you are using the most common sampling approach for student projects, availability sampling . Also called convenience sampling, this approach simply recruits people who are convenient or easily available to the researcher. If you have ever been asked by a friend to participate in their research study for their class or seen an advertisement for a study on a bulletin board or social media, you were being recruited using an availability sampling approach.
There are a number of benefits to the availability sampling approach. First and foremost, it is less costly and time-consuming for the researcher. As long as the person you are attempting to recruit has knowledge of the topic you are studying, the information you get from the sample you recruit will be relevant to your topic (although your sample may not necessarily be representative of a larger population). Availability samples can also be helpful when random sampling isn’t practical. If you are planning to survey students in an LGBTQ+ support group on campus but attendance varies from meeting to meeting, you may show up at a meeting and ask anyone present to participate in your study. A support group with varied membership makes it impossible to have a real list—or sampling frame—from which to randomly select individuals. Availability sampling would help you reach that population.
Availability sampling is appropriate for student and smaller-scale projects, but it comes with significant limitations. The purpose of sampling in quantitative research is to generalize from a small sample to a larger population. Because availability sampling does not use a random process to select participants, the researcher cannot be sure their sample is representative of the population they hope to generalize to. Instead, the recruitment processes may have been structured by other factors that may bias the sample to be different in some way than the overall population.
So, for instance, if we asked social work students about their level of satisfaction with the services at the student health center, and we sampled in the evenings, we would get most likely get a biased perspective of the issue. Students taking only night classes are much more likely to commute to school, spend less time on campus, and use fewer campus services. Our results would not represent what all social work students feel about the topic. We might get the impression that no social work student had ever visited the health center, when that is not actually true at all. Sampling bias will be discussed in detail in Section 10.3.

Approaches to probability sampling
What might be a better strategy is getting a list of all email addresses of social work students and randomly selecting email addresses of students to whom you can send your survey. This would be an example of simple random sampling . It’s important to note that you need a real list of people in your sampling frame from which to select your email addresses. For projects where the people who could potentially participate is not known by the researcher, probability sampling is not possible. It is likely that administrators at your school’s registrar would be reluctant to share the list of students’ names and email addresses. Always remember to consider the feasibility and ethical implications of the sampling approach you choose.
Usually, simple random sampling is accomplished by assigning each person, or element , in your sampling frame a number and selecting your participants using a random number generator. You would follow an identical process if you were sampling records or documents as your elements, rather than people. True randomness is difficult to achieve, and it takes complex computational calculations to do so. Although you think you can select things at random, human-generated randomness is actually quite predictable, as it falls into patterns called heuristics . To truly randomly select elements, researchers must rely on computer-generated help. Many free websites have good pseudo-random number generators. A good example is the website Random.org , which contains a random number generator that can also randomize lists of participants. Sometimes, researchers use a table of numbers that have been generated randomly. There are several possible sources for obtaining a random number table. Some statistics and research methods textbooks provide such tables in an appendix.
Though simple, this approach to sampling can be tedious since the researcher must assign a number to each person in a sampling frame. Systematic sampling techniques are somewhat less tedious but offer the benefits of a random sample. As with simple random samples, you must possess a list of everyone in your sampling frame. Once you’ve done that, to draw a systematic sample you’d simply select every k th element on your list. But what is k , and where on the list of population elements does one begin the selection process?

Figure 10.2 Systematic sampling
k is your selection interval or the distance between the elements you select for inclusion in your study. To begin the selection process, you’ll need to figure out how many elements you wish to include in your sample. Let’s say you want to survey 25 social work students and there are 100 social work students on your campus. In this case, your selection interval, or k , is 4. To get your selection interval, simply divide the total number of population elements by your desired sample size. Systematic sampling starts by randomly selecting a number between 1 and k to start from, and then recruiting every kth person. In our example, we may start at number 3 and then select the 7th, 11th, 15th (and so forth) person on our list of email addresses. In Figure 10.2, you can see the researcher starts at number 2 and then selects every third person for inclusion in the sample.
There is one clear instance in which systematic sampling should not be employed. If your sampling frame has any pattern to it, you could inadvertently introduce bias into your sample by using a systemic sampling strategy. (Bias will be discussed in more depth in section 10.3.) This is sometimes referred to as the problem of periodicity. Periodicity refers to the tendency for a pattern to occur at regular intervals.
To stray a bit from our example, imagine we were sampling client charts based on the date they entered a health center and recording the reason for their visit. We may expect more admissions for issues related to alcohol consumption on the weekend than we would during the week. The periodicity of alcohol intoxication may bias our sample towards either overrepresenting or underrepresenting this issue, depending on our sampling interval and whether we collected data on a weekday or weekend.
Advanced probability sampling techniques
Returning again to our idea of sampling student email addresses, one of the challenges in our study will be the different types of students. If we are interested in all social work students, it may be helpful to divide our sampling frame, or list of students, into three lists—one for traditional, full-time undergraduate students, another for part-time undergraduate students, and one more for full-time graduate students—and then randomly select from these lists. This is particularly important if we wanted to make sure our sample had the same proportion of each type of student compared with the general population.
This approach is called stratified random sampling . In stratified random sampling, a researcher will divide the study population into relevant subgroups or strata and then draw a sample from each subgroup, or stratum. Strata is the plural of stratum, so it refers to all of the groups while stratum refers to each group. This can be used to make sure your sample has the same proportion of people from each stratum. If, for example, our sample had many more graduate students than undergraduate students, we may draw incorrect conclusions that do not represent what all social work students experience.

Figure 10.3 Stratified sampling
Generally, the goal of stratified random sampling is to recruit a sample that makes sure all elements of the population are included sufficiently that conclusions can be drawn about them. Usually, the purpose is to create a sample that is identical to the overall population along whatever strata you’ve identified. In our sample, it would be graduate and undergraduate students. Stratified random sampling is also useful when a subgroup of interest makes up a relatively small proportion of the overall sample. For example, if your social work program contained relatively few Asian students but you wanted to make sure you recruited enough Asian students to conduct statistical analysis, you could use race to divide people into subgroups or strata and then disproportionately sample from the Asian students to make sure enough of them were in your sample to draw meaningful conclusions. Statistical tests may have a minimum number
Up to this point in our discussion of probability samples, we’ve assumed that researchers will be able to access a list of population elements in order to create a sampling frame. This, as you might imagine, is not always the case. Let’s say, for example, that you wish to conduct a study of health center usage across students at each social work program in your state. Just imagine trying to create a list of every single social work student in the state. Even if you could find a way to generate such a list, attempting to do so might not be the most practical use of your time or resources. When this is the case, researchers turn to cluster sampling. Cluster sampling occurs when a researcher begins by sampling groups (or clusters) of population elements and then selects elements from within those groups.

Figure 10.4 Cluster sampling
Let’s work through how we might use cluster sampling. While creating a list of all social work students in your state would be next to impossible, you could easily create a list of all social work programs in your state. Then, you could draw a random sample of social work programs (your cluster) and then draw another random sample of elements (in this case, social work students) from each of the programs you randomly selected from the list of all programs.
Cluster sampling often works in stages. In this example, we sampled in two stages—(1) social work programs and (2) social work students at each program we selected. However, we could add another stage if it made sense to do so. We could randomly select (1) states in the United States (2) social work programs in that state and (3) individual social work students. As you might have guessed, sampling in multiple stages does introduce a greater possibility of error. Each stage is subject to its own sampling problems. But, cluster sampling is nevertheless a highly efficient method.
Jessica Holt and Wayne Gillespie (2008)\(^3\) used cluster sampling in their study of students’ experiences with violence in intimate relationships. Specifically, the researchers randomly selected 14 classes on their campus and then drew a random sub-sample of students from those classes. But you probably know from your experience with college classes that not all classes are the same size. So, if Holt and Gillespie had simply randomly selected 14 classes and then selected the same number of students from each class to complete their survey, then students in the smaller of those classes would have had a greater chance of being selected for the study than students in the larger classes. Keep in mind, with random sampling the goal is to make sure that each element has the same chance of being selected. When clusters are of different sizes, as in the example of sampling college classes, researchers often use a method called probability proportionate to size (PPS). This means that they take into account that their clusters are of different sizes. They do this by giving clusters different chances of being selected based on their size so that each element within those clusters winds up having an equal chance of being selected.
To summarize, probability samples allow a researcher to make conclusions about larger groups. Probability samples require a sampling frame from which elements, usually human beings, can be selected at random from a list. The use of random selection reduces the error and bias present in non-probability samples, which we will discuss in greater detail in section 10.3, though some error will always remain. In relying on a random number table or generator, researchers can more accurately state that their sample represents the population from which it was drawn. This strength is common to all probability sampling approaches summarized in Table 10.2.
Table 10.2 Types of probability samples
In determining which probability sampling approach makes the most sense for your project, it helps to know more about your population. A simple random sample and systematic sample are relatively similar to carry out. They both require a list all elements in your sampling frame. Systematic sampling is slightly easier in that it does not require you to use a random number generator, instead using a sampling interval that is easy to calculate by hand.
However, the relative simplicity of both approaches is counterweighted by their lack of sensitivity to characteristics of your population. Stratified samples can better account for periodicity by creating strata that reduce or eliminate its effects. Stratified sampling also ensure that smaller subgroups are included in your sample, thereby making your sample more representative of the overall population. While these benefits are important, creating strata for this purpose requires having information about your population before beginning the sampling process. In our social work student example, we would need to know which students are full-time or part-time, graduate or undergraduate, in order to make sure our sample contained the same proportions. Would you know if someone was a graduate student or part-time student, just based on their email address? If the true population parameters are unknown, stratified sampling becomes significantly more challenging.
Common to each of the previous probability sampling approaches is the necessity of using a real list of all elements in your sampling frame. Cluster sampling is different. It allows a researcher to perform probability sampling in cases for which a list of elements is not available or feasible to create. Cluster sampling is also useful for making claims about a larger population (in our previous example, all social work students within a state). However, because sampling occurs at multiple stages in the process, (in our previous example, at the university and student level), sampling error increases. For many researchers, the benefits of cluster sampling outweigh this weaknesses.
Matching recruitment and sampling approach
Recruitment must match the sampling approach you choose in section 10.2. For many students, that will mean using recruitment techniques most relevant to availability sampling. These may include public postings such as flyers, mass emails, or social media posts. However, these methods would not make sense for a study using probability sampling. Probability sampling requires a list of names or other identifying information so you can use a random process to generate a list of people to recruit into your sample. Posting a flyer or social media message means you don’t know who is looking at the flyer, and thus, your sample could not be randomly drawn. Probability sampling often requires knowing how to contact specific participants. For example, you may do as I did, and contact potential participants via phone and email. Even then, it’s important to note that not everyone you contact will enter your study. We will discuss more about evaluating the quality of your sample in section 10.3.
Key Takeaways
- Probability sampling approaches are more accurate when the researcher wants to generalize from a smaller sample to a larger population. However, non-probability sampling approaches are often more feasible. You will have to weigh advantages and disadvantages of each when designing your project.
- There are many kinds of probability sampling approaches, though each require you know some information about people who potentially would participate in your study.
- Probability sampling also requires that you assign people within the sampling frame a number and select using a truly random process.
Building on the step-by-step sampling plan from the exercises in section 10.1:
- Identify one of the sampling approaches listed in this chapter that might be appropriate to answering your question and list the strengths and limitations of it.
- Describe how you will recruit your participants and how your plan makes sense with the sampling approach you identified.
Examine one of the empirical articles from your literature review.
- Identify what sampling approach they used and how they carried it out from start to finish.
Intergenerational Ambivalence, Self-differentiation and Ethnic Identity: A Mixed-methods Study on Family Ethnic Socialization
- Original Paper
- Open access
- Published: 08 May 2024
Cite this article
You have full access to this open access article

- Hong Yao 1 ,
- Yajie Hou 2 ,
- Carolina Hausmann-Stabile 3 &
- Angel Hor Yan Lai 4
139 Accesses
6 Altmetric
Explore all metrics
Ethnic identity, profoundly influenced by familial factors, embodies multifaceted layers; yet, the intricate process of family ethnic socialization warrants deeper exploration. This study focuses on exploring the complexities of ethnic identity formation, specifically within the context of Yi adolescents. Employing a mixed-methods approach, it delves into family ethnic socialization dynamics among Yi adolescents. The research engaged 606 surveyed participants and conducted interviews with 188 individuals in focused group settings in Liangshan Yi Autonomous Prefecture, Sichuan Province, China. Quantitative analysis revealed correlations between caregiver-adolescent relationships (CAR) and ethnic identity. Adolescents experiencing ambivalent, positive, or neutral CAR exhibited higher ethnic identity levels than those with negative CAR. Qualitative analysis highlighted two key themes. Firstly, families tended to acculturate love through traditional cultural expectations and socialization, demonstrated through unconscious integration of Yi culture and a focus on individual modernity within family values. Secondly, ethnic identity attainment was observed through self-differentiation, including reflexive awareness of Yi ethnicity, enrichment of Yi identity through peer interactions, and the connection of self-actualization with Yi prosperity. The findings emphasize the need for culturally sensitive support, particularly for social workers, to facilitate reflexive self-differentiation among ethnic minority adolescents during family ethnic socialization.
Directional Effects in Cultural Identity: A Family Systems Approach for Immigrant Latinx Families

Malleable Identity and Parental Identity Accommodation in Multiethnic-Racial Families in the United States: Implications for Psychosocial Well-Being

Investigating How Parental Support Varies Across Racially Diverse Mothers and Fathers in Relation to Emerging Adults’ Multiracial Experiences and Psychological Distress
Avoid common mistakes on your manuscript.
In China’s diverse ethnic landscape, home to 56 distinct ethnic groups, the Yi community stands as a culturally rich and significant minority group. Known for their unique traits, including a distinct language, intricate customs, and traditional practices, the Yi represent a unique segment of China’s vast ethnic mosaic. These characteristics, deeply embedded in their daily lives and social structures, are critical in shaping the Yi’s socialization processes within their families, influencing everything from daily interactions to broader communal engagements (Tao et al. 2020 ). This rich cultural backdrop provides a fertile ground for examining ethnic identity and socialization, key elements in understanding how minority groups like the Yi navigate their cultural and individual identities within a broader societal context.
The exploration of ethnic identity within the Yi community is compelling due to their distinct cultural heritage. Ethnic identity development, involving a dynamic process from unexamined identity to active exploration and achievement as proposed by Phinney ( 1993 ), is particularly salient for the Yi. Their rich cultural practices, languages, and traditions significantly contribute to the development of a cohesive ethnic identity. Understanding this process is crucial, as it forms a core component of an individual’s self-concept and well-being, especially within minority groups (Ong et al. 2010 ). The ethnic identity formation in minority communities like the Yi is influenced by a multitude of factors, including cultural preservation, intergenerational transmission of values, and adaptation to broader societal contexts (Umaña-Taylor et al. 2014 ).
The exploration of ethnic identity within the Yi community revolves around the pivotal concept of family ethnic socialization, encapsulating the diverse ways families impart values, traditions, and customs associated with their ethnic-racial group (Umaña-Taylor, and Hill, 2020 ). Contemporary research in ethnic-racial socialization underscores the profound influence of parent-child relationships on the efficacy of these practices (Hu et al. 2015 ; Parke, and Buriel, 2006 ). Children, nurtured within warm and supportive relationships, are more likely to internalize cultural messages and values, fostering the development of a robust and positive ethnic identity (Hughes et al. 2006 ). This insight holds particular relevance for the Yi, where familial bonds and intergenerational relationships intricately intertwine with cultural traditions and practices. Consequently, examining the dynamics of parent-child interactions within Yi families becomes instrumental in comprehending ethnic socialization’s impact on the formation of ethnic identity among Yi youth.
The intricate interplay of parent-child relationships within Yi families finds its grounding in theories of parent-adolescent communication, relational trust, and intergenerational transmission of values. These frameworks provide invaluable perspectives for understanding how familial interactions, characterized by varying degrees of warmth, trust, and communication quality, shape the development of ethnic identity among Yi youth (King, 2015 ; McLoyd et al. 2000 ). In the context of the Yi community, where traditional values intersect with modern influences, created intricate and multilayered experiences, like other (multi)ethnic-racial families (Roy and Rollins, 2022 ). This study adopts a mixed-methods approach to comprehensively explore both the processes and outcomes of family ethnic socialization among the Yi. By combining qualitative and quantitative methods, the research endeavors to capture the multifaceted nature of parent-child dynamics and their profound influence on the development of ethnic identity among Yi youth.
This study used sequential mixed methods explanatory design consisting of a quantitative and a qualitative strand. Quantitative data ( n = 631 adolescents, grades 7–9) were obtained in Oct 2018, followed by qualitative focus group interviews conducted in May 2021. The research was conducted with the support of local community organizations serving Yi students in Liangshan. Ethical approval was obtained at institutions involved in the project (Reference no: HASC/17-18/0540). Informed consent was obtained from Yi adolescents and their legal guardians prior to the research.
Quantitative Participants
After data cleaning, the quantitative analysis included data from 606 students from grades 7 through 9, from five rural boarding schools in Liangshan Yi Autonomous Prefecture and Sichuan Province. These five schools are affiliated with the partner organization, which has been serving Yi students in rural educational settings since 2006. Approximately 72% of participants were women, and 93% were Yi. The ages of participants ranged from 9 to 19. Details are found in Table 1 .
Qualitative Participants
For the qualitative study, one classroom of students from these five schools was selected to participate, yielding a pool of 15 classrooms. However, because one of the selected classrooms was not available during the time of the study, only 14 classrooms were recruited. Among these students, 92.5% were Yi, 7% were Han, and 0.5% were from other ethnic groups. For the purposes of the study, only Yi students were selected to participate in the qualitative interviews. All of the selected students agreed to join the focus group interviews. The focus group process ceased when the data were saturated. Students who were not selected were invited to participate in cultural activities led by our research team members. As a result, a total of 188 Yi youths (aged 12 to 18), with a mean age of 14.77 (SD = 1.35) participated in 30 focus group interviews, with each group consisting of five to seven participants. The majority of the participants were females (females = 73.4%; males = 26.6%).
Quantitative Measures
To achieve the research goals, four measures were included in quantitative analysis. Demographic information also included age, gender (0 = male; 1 = female), ethnicity (0 = Yi; 1 = Others), and caregiver (1 = parent as caregiver; 0 = family relatives as caregivers, such as grandparents, aunts, uncles, etc).
Caregiver-Adolescent Relationship (CAR)
In this study, the Emotional Quality Subscale of The Self-Reported Relatedness Questionnaire (Lynch and Cicchetti, 1997 ) had been adapted to evaluate the concept of Caregiver-Adolescent Relatedness (CAR) among Yi adolescents. This subscale measured the intensity of specific positive and negative emotions experienced in the presence of primary caregivers. Participants rated their feelings on a 4-point scale with items such as “When I’m with [primary caregiver], I feel happy” to capture positive emotions, and “When I’m with [primary caregiver], I feel ignored” for negative emotions. Cronbach’s alpha values for negative subscale and positive subscale were 0.72 and 0.74 in this study.
Based on these responses, CAR was categorized into four distinct types using the medians of scores of positive emotions and negative emotions. Ambivalent CAR was identified by both high positive (positive emotions scores > 21) and high negative scores (negative emotions scores> 7), reflecting a complex, multifaceted relationship with caregivers. The amicable type was characterized by high positive (positive emotions scores > 21) and low negative scores (negative emotions scores ≤ 7), indicating predominantly positive relationships. The negative CAR type was defined by low positive (positive emotions scores ≤ 21) and high negative scores (negative emotions scores > 7), suggesting relationships dominated by negative feelings. Lastly, the neutral type, marked by low scores in both positive (positive emotions scores ≤ 21) and negative (negative emotions scores ≤ 7) dimensions, implied a relationship lacking strong emotional ties. This nuanced categorization provided a deeper understanding of the varied emotional dynamics in caregiver-adolescent relationships.
Ethnic Identity
Ethnic identity was measured with the revised 12-item Multigroup Ethnic Identity Measure–Revised, consisting of two subscales: Exploration and Commitment (Lai et al. 2019 ). There were five items measuring exploration (e.g., “I participate in cultural practices of my own group”) and seven items measuring commitment (e.g., “I have a lot of pride in my ethnic group”). Cronbach’s alpha value was 0.8 in this study. Participants responded on a scale ranging from 1 (strongly disagree) to 4 (strongly agree), with higher scores indicating stronger EI.
Peer Support
Peer support was measured by a 4-item Chinese version of the Classmate Support Scale (Torsheim et al. 2016 ). A total score was generated by summarizing responses to four items. Participants responded on a scale of 1 (strongly disagree) to 5 (strongly agree) to items such as “My classmates accept me.” Higher scores indicated a higher level of peer support perceived by individuals. The Cronbach’s alpha for the current study was 0.71.
Data Collection
In the parent study, a multistage sampling approach, with a convenience sampling strategy in stage one and random sampling strategy in stage two, was used to collect the quantitative data. In stage one, we selected five out of the eight schools recommended by local community organizations within their school serving network. The local organization selected these schools as they have a relatively representable population of Yi students and also they have a deeper working relationships with the school management there. The team then contacted the schools via the partnering organization to invite them to join the study. All selected schools agreed to participate in the research.
In stage two, we randomly selected one class of students (grade 7 to 9) from each secondary level of each participating school. All students from the selected class were invited to complete a survey that included demographic information, parental relatedness, ethnic identity, peer support, trauma experience, and more. Prior to the administration of the survey, consent from the students’ guardian were also obtained. During survey administration, the team first explained the purposes of the research and the potential benefits and risks of filling out the survey to the teacher in charge and students in the classroom. All participation was voluntary and students were informed that they could withdraw from filling out the survey any time. All selected students accepted the invitation to fill out the survey. Informed consent was then obtained from all participants before the study. After the survey was administered, a small incentive was given to each student for their participation.
Focus groups were conducted to collect qualitative data. A non-random purposive sampling strategy was used to select the participants based on the students’ attachment to their Yi ethnic group membership. Students who scored in the top 25% (i.e., 1st Quartile) and bottom 20% (i.e., 4th Quartile) in their self-reported ethnic identity scores relative to their classmate in each classroom were selected to join the focus group interviews. This selection strategy allows the team to obtain richer information with a variety of participants based on their connection to their ethnic community. After the participants selection process, the research team then contact the school to invite the selected students to join the interview. Again, the students were reminded of their rights to decline participation or to withdraw anytime without any consequences. All invited students joined the study.
The participating schools assigned the research team to a private indoor or outdoor area, depending on space availability, in which to conduct the interviews. All focus groups were audiotaped after obtaining informed consent from the participants. Each focus group lasted approximately 45 to 60 min. All focus group interviews were conducted by at least two members of the research team, with one person moderating the interview while the other observed. Notes were taken during the interviews to facilitate subsequent analyses, and the interviewers’ observations were triangulated for cross-validation.
The guidelines for the focus group interviews included questions regarding family ethnic socialization (i.e., “What does your family think of being Yi?” and “What did your parents/family teach you about Yi?”), attitudes about Yi ethnicity (i.e., “What do you like/dislike about Yi ethnicity?” and “How do you feel about being Yi?”), and school ethnic socialization (i.e., “What do you think of the Han majority?” and “What is the difference between Yi and Han?”). To ensure that all students in the focus group interviews had a chance to express themselves, the moderator encouraged each participant to share his or her opinions throughout the data collection. If participants indicated that they had nothing to share, the moderator proposed topics from the interview guidelines.
Data Analysis
Quantitative analysis adopted linear regressions to investigate the relationships between CAR and ethnic identity. In comparison to negative CAR, ambivalent CAR(H1), positive CAR(H2), and neutral(H3). CAR were positively associated with ethnic identity. Age, gender, ethnicity, caregiver (caregiver as parents or as relatives) and peer support were controlled as covariates. All qualitative data were analysed by the first and second authors independently. After data collection, two researchers first read the transcripts multiple times to become familiar with the data, then coded the transcripts independently and generated meaning initial codes line by line. Then, we highlighted codes and quotes that were relevant to our research questions, thereby generating an initial list of codes that were illustrated with specific segments of texts. Those codes were used to develop a preliminary analytic framework upon which subsequent transcriptions were then coded. With the text segments, we created data matrices in an Excel spreadsheet (Ose, 2016 ). Next, we categorized the codes into emergent themes. In the final stage, we refined, named, and analysed the themes. When discrepancies were found, we revisited the themes and deliberated with the research team until we reached a consensus.
Quantitative analysis investigated the associations between perceived caregiver relatedness and ethnic identity. Moreover, qualitative analysis further elaborated on the family process of ethnic socialization among young Yi.
Quantitative Analysis: The Impacts of CAR on EI
We used regression analysis to examine the relations between caregiver-adolescent relationship (CAR) and the outcome variables of (i) ethnic exploration (EE) (ii) ethnic commitment (EC) and (iii) ethnic identity (EI), controlling for age, ethnicity, having parent as caregiver, and level of peer support. With EE as outcome variable, we found that ambivalent, positive, and neutral CAR are significant positive contributors, F (1, 606) = 8.79, p < 0.01, ∆R2 = 0.105. Approximately 10% of the variance of EE was accounted for by ambivalent, positive, and neutral CAR while controlling covariates. Compared to negative CAR, students with the other three CAR were more likely to achieve ethnic identity. Second, with EC as outcome variable, ambivalent, positive, and neutral CAR were significantly and positive associated with ethnic commitment, F (1, 606) = 15.53, p < 0.01, ∆R2 = 0.17. Third, a significant relation between ambivalent, positive, and neutral CAR and the outcome variable of EI was found, with negative CAR as a reference, F (1, 606) = 15.56, p < 0.01, ∆R2 = 0.17. Peer support tended to have significant and positive correlations with EE, EC, and total EI. However, the interaction between peer support and CAR was insignificant (Table 2 ).
Qualitative Analysis: Family Process of Ethnic Socialization
Based on qualitative data analysis, two themes emerged, namely “acculturating love through traditional cultural expectations and socialization” and “ethnic identity achievement through self-differentiation”. Exemplar quotations were provided for each theme. Each quotation was identified with the participant ID.
Acculturating Love Through Traditional Cultural Expectations and Socialization
During the ethnic socialization process, family tended to socialize the youth with their ethnic values, beliefs, norms, and behaviors through their daily child-rearing practices, rather than through conscious teachings. However, parental or familial affection and love was conveyed through expecting the best for the adolescents’ future. Viewing education as a life-changing path, parents or caregivers were always aware of their roles in urging their children to take initiatives in study, which might have benefitted their adjustment into civilized social lives outside of their hometown. The tension between unaware family process of practicing Yi and reinforcement the importance of education shaped a complex and even conflicting family ethnic socialization, out of which a youth’s ambivalence towards parents or family might grow.
Unaware Family Process of Practising Yi
Based on data analysis, interviewees enacted a sense of ethnicity through unconscious normative family practices, such as celebrations of Yi festivals, caregivers’ accounts of Yi cultural stories, and daily behaviors. Family practices of transmitting Yi values and behaviors included exposing children to culturally relevant folktales, teaching music and dance, celebrating traditions and holidays, eating ethnic foods, wearing Yi accessories and clothes, and communicating with the family’s native language.
I learned rituals of Torch festivals Footnote 1 from my grandparents. We walked around our house, holding a torch and murmuring prayer words in Yi language, which is supposed to chase the ghosts away and keep us safe. (FS17)
My parents told me the history of Yi, as well as the ghost stories. (FS113)
Moreover, family ethnic socialization practices were embedded in the localized community, where the situational context of Yi might vary slightly.
The story of our ancestor was a story of a boy moving from place to place. Some versions of the story indicate that the boy was born out of a peach. Other versions tell that a couple had two peaches. The wife grew a peach into a boy, while the husband ate half of another peach, and the second half turned into a girl, eventually. We (family members) talk about ancestor stories whenever we have time. (GMAG)
Family ethnic socialization practices were also reflected in the rules and rituals of daily activities taught by parents and senior family members. They taught the young Yi to respect the elderly, internalize a sense of family obligations, supervise younger siblings, provide help when demanded by others, and handle illness through Yi rituals. These rules and rituals were intimately attached to the spirit of Yi, particularly highlighting the cohesive integration of self, Yi ethnicity, nature, and existential humanity.
If someone gets sick, we (family) practice bimbo to pray for his recovery. Otherwise, we (family) do it annually. (FS190)
Yi people are somewhat refined in our rough ways. We are taught to respect the elderly and care for children. We are not allowed to bully the weak. (EI7)
Family Values on Individual Modernity
Families of interviewees, like many of the Yi ethnic minority, might have feelings of inferiority and being un-modernized compared to the Han majority (Postiglione, 2017 ). Therefore, families were expected to have a modern and even “civilized” lifestyle for the future of their children who do not need to repeat their lifestyles of labor-intensive, low-income jobs and less education. Although these caregivers are traditionally and authentically committed to Yi, they still expected that their children might move away from their ethnic communities and adjusting to modern lives in developed areas of China, which is reflected their unconditional love and affection for their children. Furthermore, even when young Yi finally return, family members assume that the interviewees will be able to find stable and well-paid occupations (i.e., civil servants or teachers) in local communities after years of educational experiences in developed cities.
Many young Yi mentioned that they grew up as part of a family where academic achievement and educational productivity were highly valued and that parents often emphasized the importance of higher education and decent jobs. If financially possible, Yi families were likely to list their children’s academic achievements as a priority and hoped for a better life for their children through education. For the young Yi, parents and families served as a continuous and stable resource for their autonomous motivation in education.
My grandma is my favorite. She told me to study hard. When she was a child, her family could not afford education. Although my mom and aunt were excellent in terms of academic performance, they had to work early for a living. Now, I have the chance for education, and my grandmother constantly to encourages me to seize the opportunity to change my life. (FS165)
Education can change my life. Though it is not the only pathway, I was told by my parents that it was the best pathway. (CC16)
Both intrinsic and extrinsic motivations were found among the young Yi in the focus group. Many students mentioned their improved self-satisfaction and self-efficacy through academic growth, while others indicated extrinsic motivations derived from parental appraisals, teachers’ encouragements, and peer support. In particular, the young Yi repeatedly mentioned that their families value education as a life-changing opportunity for their and their family’s social economic status.
Ethnic Identity Achievement through Self-differentiation
As mentioned before, the young Yi’s perceptions, interpretations, and practices of being Yi was mainly influenced by their parents and families, while their self-differentiation included their cognitive efforts in clarifying, bargaining, and recognizing that inherited information about being Yi. During this process, the young Yi actively achieve a reflexive awareness of Yi ethnicity, enrich their understandings of being Yi through peer interactions, and internalize a notion of self-actualization for Yi development.
Reflexive Awareness of Yi Ethnicity
In the current study, reflexivity refers to an action that comes after an individual has become aware of and reflected on their own ethnicity (Chatterton and McKay, 2015 ). Years of family ethnic socialization helped to enact a cultural system within young Yi, manifesting a collection of patterns of meaning through time. With this intrapersonal cultural system, interviewees were more capable of absorbing cultural norms and behaviors that they approbated, simultaneously abandoning those they disconfirmed.
As Yi, we are proud of our Torch festivals, Yi New Year, and our own faith. However, I am also frustrated by some traditions, such as Wawa Qin (child betrothals). (EI33)
Since I am Yi, I love Yi ethnicity 100%. However, I know we have shortcomings, such as low quality of our people. They are less educated and not receptive to new knowledge and science. In poor families with many children, parents might discourage us from going to school if they cannot afford fees for all kids. We (children) have to insist on receiving education as one in multi-child families; otherwise, you might drop out if siblings went to school. Putting myself into parents’ shoes, I could do nothing but wanted to change their thoughts. All I can do is be excellent in every aspect and help my family. (EI1)
Many interviewees experienced distress due to negative comments or social stigma assigned to Yi people, such as being unhygienic, lazy, and crude. However, a resilient aspect of reflexive awareness was triggered by the youth’s forgiveness of being judged or discriminated against from external environments. In discussions of social stigma about Yi ethnicity, interviewees reflected a sense of ethnic confidence and psychological resilience:
As Yi, we should have confidence in own ethnicity; of course, we need to change some negative habits too. (EBAF6113)
We, Yi people, might have had less education, but we kept our integrity as human beings, which matters most. Thus, I love my Yi identity. (EI9)
Enriching Yi through Peer Interactions
Prior to attending their current school, most of the interviewees had completed their early education in local villages, immersed in environments predominantly inhabited by their family members and a specific subset of the Yi people. Upon transitioning to their current school, which hosts a mix of Yi and Han students, these interviewees found themselves in a linguistically and culturally varied setting, shaping their ethnic identity in new ways. The ethnic identity perceptions of Yi youth often showed a marked difference from the views held by their families. Yet, these individual perspectives were deeply intertwined with their personal aspirations, mirroring their unique sense of self amidst a complex web of relationships, encompassing both their ethnic community and broader societal interactions. Consequently, the construction of their ethnic identity emerged as a dynamic process, influenced by a confluence of personal factors, contextual surroundings, language use, and interactions, particularly with peers.
I had no idea of black or white Yi Footnote 2 before coming to this school. I’ve made friends arriving here, later finding out that my new friend is black Yi. I went to my mom and asked her about it, and she explained the differences to me then. (FS44)
They speak a Yi dialect that different from my Yi dialect. I cannot understand what they say. (EMAB 3125)
For young Yi, equality was a concept applied to both in-group and out-group interactions, rather than limited to the relationships between Yi and Han. Social interactions among same-ethnicity peers were conducive to increasing ethnic identity because such interactions offered opportunities to experience and express their ethnicity. For interviewees, even among Yi students, differences in Yi language proficiency, mastery of different Yi dialects, family cultural orientations, and exposure to cultural knowledge could affect what ethnicity meant to them and, ultimately, their self-identity formation.
We should treat people as the same. I felt that it was wrong to treat white and black Yi differently; after all, we are both Yi. (EI10)
Sometimes, the Yi ethnicity is given negative labels. Maybe there are some Yi people who behave badly, but it could not be applied to the whole Yi ethnicity. Han people just applied it to all Yi. (EI35)
Connecting Self-actualization to Yi Prosperity
It was important to understand the meanings assigned by the youth to the connection between self-actualization and Yi prosperity. For interviewees, belonging to a native place is essential to their ethnic and personal identity, creating a sense of native-place identity, such as bendiren , butuo -ness, and laojia Footnote 3 . This native-place belonging, through interacting with ethnic identity and witnessing the under-developmental native places, nurtured a seed of social changes at the bottom of youths’ hearts.
Knowledge was helpful in changing the conservative thought of older generations. I am going to be a teacher in our village and convey knowledge to the next generation in case they remained conservative, like our grandparents.
I would like to be a doctor; because Yi people are quite feudal, most of them are superstitious. When they get sick, they do not go to see a doctor. As a result, treatment time is delayed, and many might lose their lives. When I got sick, my educated father would take me to the hospital… but mother and my grandfather stopped him on the road and insisted on superstitious things. I was not fully conscious at that time and do not remember how my father convinced them. In our village, there are a lot of sick young. children or middle-aged people who get superstitious therapies and die in the end. (GHAH)
In fact, the living conditions of the Yi people have gradually improved since China initiated its nationwide poverty eradication policy in 2012. However, many interviewees’ ideal occupations were teacher and doctor, as they believed that education and medical care need to be further enhanced. They believed that their individualistic self-actualization, becoming educators and medical professionals, could not only address practical demands, but also contribute to the prosperity of the Yi community through changing indigenous stereotypes of illness and education.
One day, when I am capable, I will go outside to learn to bring the new knowledge and experiences back to the Yi community. I will come back to develop our Yi ethnicity. (EBAF)
When I grow up, my dream and goal is to develop our Yi ethnicity through educating children and enhancing their virtues and thoughts. As individuals, motivated children will complete education; as a group, they may contribute to the development of Yi ethnicity. (EMAA)
The triangulation of quantitative and qualitative data in the current study provided several conclusions regarding family ethnic socialization. The study findings indicated that young Yi who had ambivalent relationships with caregivers reported higher levels of ethnic exploration in comparison to counterparts with negative or neutral child-caregiver relationships. With parents or caregivers as significant figures who symbolically represented or practically conveyed Yi culture, these adolescents might have struggled with the tensions between socialization by caregivers and agency in defining Yi ethnic identity, leading to ambivalence. Such mixed emotions were widely found among offspring who had to accept parental expectations on their own attainments of social roles, such as being married, employed, or dependent (Beaton et al. 2003 ; Birditt et al. 2010 ; Bucx et al. 2010 ). Some qualitative excerpts further confirmed that reflexive self-differentiation was meaningful in navigating the process of ethnic exploration and resolution, especially with the presence of intergenerational ambivalence. Self-differentiation appeared to be a bargaining between autonomy and relatedness, though autonomy has often been viewed as conflicting with relatedness (Chung and Gale, 2006 ). With reflexive self-differentiation, the construction of ethnic identity was then associated with an integrated sense of self and might have even served as a strong predictor of mental health among young Yi.
Intergenerational ambivalence might essentially reflect the crux of family ethnic socialization as a dynamic context for the ethnic identity formation of young Yi. Born and raised in Liangshan, parents and grandparents practiced their ethnic identity through ethnic rituals, such as the Torch Festival and Yi New Year, and daily routines and norms. With fewer opportunities to step out of the local community, they might be authentically committed to Yi cultural beliefs and norms that they inherited from their original families and unable to reflect on what Yi stood for by comparing it with other ethnic groups. Without an active ethnic exploration process, their ethnic commitment might not contribute to resolution in self-identity. In recent decades, China’s government implemented a series of poverty elimination and national revival movements. Especially in Southwest provinces where Liangshan is located, efforts had been made to ensure the provision of high-quality education for Yi children and adolescents. With increasing knowledge and experiences in schooling, young Yi are more likely to gain a comprehensive and critical understanding about Yi and their ethnic identities through constantly comparing Yi with other ethnicities (Sladek et al. 2021 ). Thus, their reflective awareness of ethnicity itself might differ from or contradict what the previous generation practiced, resulting in an adjustment in identification.
Although a cultural system was mentally established through family ethnic socialization, the majority of interviewees in focus groups showed high self-differentiation from family interpretations about practicing Yi. Familism, a significant feature of Chinese culture, tended to influence the concept of self for interviewed Yi students. Empirical evidence showed that youth played an active role in their own ethnic identity formation, rather than being a container for family ethnic socialization (Umana-Taylor et al. 2013 ). Self-differentiation, mainly referring to the level of differentiating the self from their family-of-origin, was associated with their psychological and social development. For interviewees, their self-differentiation from family ethnic socialization was achieved by their reflexivity of accepting, interpreting, and contributing to Yi ethnicity, which eventually brought a cohesive sense of self. As young Yi, ethnic identity appeared to be a reflexive self-relation as a unity of self, necessarily connected to a negotiation between native culture and mainstream culture. A mature ethnic identity was an important developmental competence contributing to sense of self, academic adjustment, and psychosocial wellbeing (Lai et al. 2019 ; Lai et al. 2017 ).
Together with family, exposure to school and community might collectively contribute to the youths’ construction of ethnic identity (Eng and Tram, 2021 ). Although family are the primary transmitters of ethnic-racial socialization, transmitters within the school context are also important in the development of youth from ethnic minorities (Saleem and Byrd, 2021 ). Furthermore, family ethnic socialization served as a developmental asset for school-based ethnic-racial identity programs aiming at nurturing a mature ethnic-racial identity (Sladek et al. 2021 ). In this way, family and schools should be cooperative in building a healthy climate for youth from ethnic minorities to explore their ethnicity. A recent meta-analysis indicated that social dominance orientation, intergroup anxiety, identification with the national ingroup, and parental prejudice contributed to increasing later levels of adolescents’ prejudice; however, intergroup friendship contributed to lessening it (Crocetti et al. 2021 ). Yi ethnic minority have often expressed feeling inferior and un-modernized compared to the Han majority (Harrell, 2012 ). However, ingroup and outgroup interactions in school might provide the youth with chances to examine their perceptions regarding their own and other ethnicities then come to forgive the prejudices and stigma assigned to Yi (Degener et al. 2021 ). Given that Yi is often downwardly compared, it makes sense that they may be academically motivated to devote themselves to the economic and social development of the local community and Yi ethnicity.
This study carries some limitations. Firstly, we focus on a single case of ethnicity in China, thus, findings in current study should be carefully used for generalizability. Future research should consider diverse samples from various regions and ethnic groups both within and outside China to enhance representativeness. Additionally, our study acknowledges the limitation of lacking detailed familial data, which restricts our capacity to deeply analyze how aspects like parental education, occupation, and socioeconomic status affect the aspirations of Yi youths and their connection with different CAR types. Future study should design to provide a clearer understanding of the interplay between familial backgrounds and the development of ethnic identity and aspirations among minority youth.
Practical Implications
Firstly, the findings indicate the crucial role of reflexive self-differentiation in ethnic identity achievement. As a facet of self-identity, the construction of Yi youths’ ethnic identity may be shaped by exposure to mainstream culture; thus, ethnic minority young people have to navigate and handle the duality of native and mainstream cultures (Umana-Taylor et al. 2014 ). Social works should be equipped with cultural sensitivity and competence in order to provide high-quality services when ethnic minority young people are struggling with ambivalent feelings towards family ethnic socialization. Particularly, future social work interventions should endeavor to mobilize the unique family resources of youth from ethnic minorities in China to build their ethnic identity, despite ambivalence.
Secondly, dissimilarity in values and beliefs in parent-child relationships could result in estrangement between children and parents, ultimately affecting the mental health of both generations (Coleman et al. 2006 ). Although youths’ differing perceptions of ethnicity as compared to the previous generation might create opportunities for their own ethnic identity exploration and resolution, it could also cause intergenerational tensions for the family and psychosocial maladjustment for the youth. Family social workers might facilitate ethnic minority families to clarify the fact that ethnic identity as Yi is not only collective, but also personal. Acceptance and an embrace of incongruence in terms of ethnic identity might lead to ethnic resolution for both generations.
Lastly, the mixed results highlight dynamics between family and systems beyond family (i.e., school) during the process of ethnic socialization, emphasizing the importance of school, community, and family collaboration on the positive development of ethnic minority young people (Eng and Tram, 2021 ; Torres et al. 2019 ). Psychosocial interventions should be collectively designed and implemented by an alliance of multiple stake takers (i.e., parents and caregivers, peers, teachers, social workers, and policy makers) to enhance the reflexive self-differentiation of youth from ethnic minorities and more effectively prepare them to navigate multi-ethnic social contexts (Laird, 2011 ).
Findings suggested that family ethnic socialization, as a primary context, interplayed with interactions in schools and communities, ultimately contributing to ethnic identity formation among Yi adolescents. Moreover, reflexive self-differentiation was crucial in achieving ethnic identity resolution, providing motivations for youth from ethnic minorities in academic and life goals.
The Yi Torch Festival, or “Dutzie,” celebrated in China’s Liangshan Yi Autonomous Prefecture, is a vibrant cultural event rooted in ancient Yi fire worship traditions. Held over three days in the sixth lunar month, it features bullfighting, horse racing, traditional dances, and rituals. Attracting millions, the festival, recognized as a national intangible cultural heritage, showcases Yi culture and is a significant tourist draw. More information about Torch Festival could be found at Tao et al. ( 2020 ).
“Black Yi” and “White Yi” are terms that refer to specific social strata within the old Yi society. These terms are not literal descriptions of race or skin color but rather indicate social status and roles within the Yi community. The “Black Yi” (nuoho) and “White Yi” (qunuo) represent different levels of social hierarchy, with each group having its distinct roles and societal functions. The differentiation of these groups is deeply rooted in the historical and cultural context of the Yi society. More information could be found at Erzi ( 2003 )
Bendiren refers to being a native person, emphasizing a strong, inherent connection to one’s place of origin. Butuo-ness signifies a unique identity associated with Butuo, indicating a unique sense of belonging or characteristics associated with this area. Laojia , meaning “old home” or “hometown,” denotes a profound connection to one’s roots.
Beaton, J. M., Norris, J. E., & Pratt, M. W. (2003). Unresolved issues in adult children’s marital relationships involving intergenerational problems. Family Relations , 52 (2), 143–153. http://www.jstor.org/stable/3700216 .
Article Google Scholar
Birditt, K. S., Fingerman, K. L., & Zarit, S. H. (2010). Adult children’s problems and successes: implications for intergenerational ambivalence. The Journals of Gerontology. Series B, Psychological Sciences and Social Sciences , 65B (2), 145–153. https://doi.org/10.1093/geronb/gbp125 .
Article PubMed PubMed Central Google Scholar
Bucx, F., Raaijmakers, Q., & Van Wel, F. (2010). Life course stage in young adulthood and intergenerational congruence in family attitudes. Journal of Marriage and Family , 72 (1), 117–134. http://www.jstor.org/stable/27752559 .
Chatterton, S., & McKay, B. (2015) Relationships 1: promoting change, working in partnership with families [Powerpoint slides for Advanced Certificate in Systemic Practice with Families in a Safeguarding Context]. London: Institute of Family Therapy.
Chung, H., & Gale, J. (2006). Comparing self-differentiation and psychological well-being between Korean and European American Students. Contemporary Family Therapy , 28 (3), 367–381. https://doi.org/10.1007/s10591-006-9013-z .
Coleman, M., Ganong, L. H., & Rothrauff, T. C. (2006). Racial And Ethnic Similarities And Differences In Beliefs About Intergenerational Assistance To Older Adults After Divorce And Remarriage. Family Relations , 55 (5), 576–587. http://www.jstor.org/stable/40005354 .
Connidis, I. A. (2015). Exploring ambivalence in family ties: progress and prospects. Journal of Marriage and Family , 77 (1), 77–95. https://doi.org/10.1111/jomf.12150 .
Crocetti, E., Albarello, F., Prati, F., & Rubini, M. (2021). Development of prejudice against immigrants and ethnic minorities in adolescence: A systematic review with meta-analysis of longitudinal studies. Developmental Review , 60 . https://doi.org/10.1016/j.dr.2021.100959
Degener, C. J., Bergen, D. D., & Grietens, H. W. E. (2021). “Being one, but not being the same”: A dyadic comparative analysis on ethnic socialization in transcultural foster families in the Netherlands. Child & Family Social Work . https://doi.org/10.1111/cfs.12861
Eng, S. M., & Tram, J. M. (2021). The influence of family and community factors on ethnic identity. Journal of Multicultural Counseling and Development , 49 (1), 32–44. https://doi.org/10.1002/jmcd.12204 .
Erzi, M. (2003). A new understanding of the old liangshan Yi Social Structure and an Analysis of” Black Yi” and” White Yi”. Chinese Sociology & Anthropology , 36 (1), 75–93.
Fingerman, K. L., Cheng, Y.-P., Cichy, K. E., Birditt, K. S., & Zarit, S. (2013). Help With ‘strings attached’: offspring perceptions that middle-aged parents offer conflicted support. Journals of Gerontology Series B: Psychological Sciences and Social Sciences , 68 (6), 902–911. https://doi.org/10.1093/geronb/gbt032 .
Gilligan, M., Suitor, J. J., Feld, S., & Pillemer, K. (2015). Do positive feelings hurt? Disaggregating positive and negative components of intergenerational ambivalence. Journal of Marriage and Family , 77 (1), 261–276. https://doi.org/10.1111/jomf.12146 .
Article PubMed Google Scholar
Harrell, S. (2012). Ways of Being Ethnic in Southwest China : University of Washington Press.
Hu, A. W., Anderson, K. N., & Lee, R. M. (2015). Let’s talk about race and ethnicity: Cultural socialization, parenting quality, and ethnic identity development. Family Science , 6 (1), 87–93.
Hughes, D., Rodriguez, J., Smith, E. P., Johnson, D. J., Stevenson, H. C., & Spicer, P. (2006). Parents’ ethnic-racial socialization practices: a review of research and directions for future study. Developmental Psychology , 42 (5), 747–770. https://doi.org/10.1037/0012-1649.42.5.747 .
King, R. B. (2015). Sense of relatedness boosts engagement, achievement, and well-being: A latent growth model study. Contemporary Educational Psychology , 42 , 26–38. https://doi.org/10.1016/j.cedpsych.2015.04.002 .
Knight, G. P., Berkel, C., Umana-Taylor, A. J., Gonzales, N. A., Ettekal, I., Jaconis, M., & Boyd, B. M. (2011). The familial socialization of culturally related values in Mexican American Families. Journal of Marriage and Family , 73 (5), 913–925. https://doi.org/10.1111/j.1741-3737.2011.00856.x .
Lai, A. H. Y., Chui, C. H.-K., Wong, K.-Y., & Chan, C. L. W. (2019). Academic motivations of Yi youths in China: Classmate support and ethnic identity. The Journal of Educational Research , 112 (4), 550–563. https://doi.org/10.1080/00220671.2019.1602820 .
Lai, A. H. Y., Chui, C. H. K., Lo, P. H. Y., Jordan, L. P., & Chan, C. L. W. (2017). The buffering effect of child-caregiver relationships: Social skills development of ethnic minority children with maladaptive behaviors in rural China. Children and Youth Services Review , 79 , 333–340. https://doi.org/10.1016/j.childyouth.2017.06.038 .
Laird, S. E. (2011). Social work with children and families in Ghana: negotiating tradition and modernity. Child & Family Social Work , 16 (4), 434–443. https://doi.org/10.1111/j.1365-2206.2011.00758.x .
Lendon, J. P. (2017). A decade of love and hate: Trajectories of intergenerational ambivalence experienced by two cohorts of older parents and adult children. Journal of Family Issues , 38 (3), 336–357. https://doi.org/10.1177/0192513X16634763 .
Lynch, M., & Cicchetti, D. (1997). Children’s relationships with adults and peers: An examination of elementary and junior high school students. Journal of School Psychology , 35 , 81–89.
McLoyd, V. C., Cauce, A. M. T. D., & Wilson, L. (2000). Marital processes and parental socialization in families of color: A decade review of research. Journal of Marriage and Family , 62 (4), 1070–1093.
Ong, A. D., Fuller-Rowell, T. E., & Phinney, J. S. (2010). Measurement of ethnic identity: Recurrent and emergent issues. Identity , 10 (1), 39–49. https://doi.org/10.1080/15283481003676226 .
Ose, S. O. (2016). Using excel and word to structure qualitative data. Journal of Applied Social Science , 10 (2), 147–162. https://doi.org/10.1177/1936724416664948 .
Parke, R. D., & Buriel, R. (2006). Socialization in the Family: Ethnic and Ecological Perspectives. In N. Eisenberg, W. Damon, & R. M. Lerner (Eds.), Handbook of child psychology: Social, emotional, and personality development (6th ed., pp. 429–504). John Wiley & Sons, Inc.
Phinney, J. S. (1993). A three-stage model of ethnic identity development in adolescence. In Ethnic identity: Formation and transmission among Hispanics and other minorities (pp. 61–79).
Postiglione, G. A. (2017). Education, ethnicity, society and global change in Asia: the selected works of Gerard A. Postiglione : Routledge.
Rivas-Drake, D., Seaton, E. K., Markstrom, C., Quintana, S., Syed, M., & Lee, R. M., Racial Identity in the 21st Century Study, G. (2014). Ethnic and racial identity in adolescence: Implications for psychosocial, academic, and health outcomes. Child Developmental , 85 (1), 40–57. https://doi.org/10.1111/cdev.12200 .
Roy, R. N., & Rollins, A. (2022). Dual realities: The unique and multilayered experiences in multiracial families. Journal of Child and Family Studies , 31 (3), 623–628.
Saleem, F. T., & Byrd, C. M. (2021). Unpacking school ethnic‐racial socialization: A new conceptual model. Journal of Social Issues , 77 (4), 1106–1125.
Sladek, M. R., Umana-Taylor, A. J., Wantchekon, K. A., McDermott, E. R., & Updegraff, K. A. (2021). Contextual moderators of a school-based ethnic-racial identity intervention: The roles of family ethnic socialization and ethnic-racial background. Prevention Science , 22 (3), 378–385. https://doi.org/10.1007/s11121-020-01166-8 .
Tao, C., Huang, S., & Brown, G. (2020). The impact of festival participation on ethnic identity: The Case of Yi torch festival. Event Management , 24 (4), 527–536. https://doi.org/10.3727/152599519x15506259856156 .
Tighe, L. A., Birditt, K. S., & Antonucci, T. C. (2016). Intergenerational ambivalence in adolescence and early adulthood: Implications for depressive symptoms over time. Developmental Psychology , 52 (5), 824–834. https://doi.org/10.1037/a0040146 .
Torres, L., Morgan Consoli, M. L., Unzueta, E., Meza, D., Sanchez, A., & Najar, N. (2019). Thriving and ethnic discrimination: A mixed‐methods study. Journal of Multicultural Counseling and Development , 47 (4), 256–273. https://doi.org/10.1002/jmcd.12157 .
Torsheim, T., Wold, B., & Samdal, O. (2016). The teacher and classmate support scale. School Psychology International , 21 (2), 195–212. https://doi.org/10.1177/0143034300212006 .
Umana-Taylor, A. J., & Guimond, A. B. (2010). A longitudinal examination of parenting behaviors and perceived discrimination predicting Latino adolescents’ ethnic identity. Development Psychology , 46 (3), 636–650. https://doi.org/10.1037/a0019376 .
Umana-Taylor, A. J., Zeiders, K. H., & Updegraff, K. A. (2013). Family ethnic socialization and ethnic identity: a family-driven, youth-driven, or reciprocal process? Journal Family Psychology , 27 (1), 137–146. https://doi.org/10.1037/a0031105 .
Umana-Taylor, A. J., Quintana, S. M., Lee, R. M., Cross, W. E Jr., Rivas-Drake, D., & Schwartz, S. J., Racial Identity in the 21st Century Study, G. (2014). Ethnic and racial identity during adolescence and into young adulthood: an integrated conceptualization. Child Development , 85 (1), 21–39. https://doi.org/10.1111/cdev.12196 .
Umaña-Taylor, A. J., Yazedjian, A., & Bámaca-Gómez, M. (2004). Developing the ethnic identity scale using Eriksonian and social identity perspectives. Identity , 4 (1), 9–38. https://doi.org/10.1207/s1532706xid0401_2 .
Umaña‐Taylor, A. J., & Hill, N. E. (2020). Ethnic–racial socialization in the family: A decade’s advance on precursors and outcomes. Journal of Marriage and Family , 82 (1), 244–271.
Umaña‐Taylor, A. J., Alfaro, E. C., Bámaca, M. Y., & Guimond, A. B. (2009). The central role of familial ethnic socialization in Latino adolescents’ cultural orientation. Journal of Marriage and Family , 71 (1), 46–60.
Wang, M. T., & Huguley, J. P. (2012). Parental racial socialization as a moderator of the effects of racial discrimination on educational success among African American adolescents. Child Development , 83 (5), 1716–1731. https://doi.org/10.1111/j.1467-8624.2012.01808.x .
Wang, M. T., Henry, D. A., Smith, L. V., Huguley, J. P., & Guo, J. (2020). Parental ethnic-racial socialization practices and children of color’s psychosocial and behavioral adjustment: A systematic review and meta-analysis. American Psychologist , 75 (1), 1.
Download references
Open access funding provided by The Hong Kong Polytechnic University.
Author information
Authors and affiliations.
School of Ethnology and Sociology, Minzu University of China, Beijing, China
China Population and Development Research Center, Beijing, China
Department of Behavioral Health and Intellectual Disability Services, Population Health for the City of Philadelphia, Philadelphia, PA, USA
Carolina Hausmann-Stabile
Department of Applied Social Science, The Hong Kong Polytechnic University, Hung Hom, Hong Kong
Angel Hor Yan Lai
You can also search for this author in PubMed Google Scholar
Corresponding authors
Correspondence to Yajie Hou or Angel Hor Yan Lai .
Ethics declarations
Conflict of interest.
The authors declare no competing interests.
Additional information
Publisher’s note Springer Nature remains neutral with regard to jurisdictional claims in published maps and institutional affiliations.
Rights and permissions
Open Access This article is licensed under a Creative Commons Attribution 4.0 International License, which permits use, sharing, adaptation, distribution and reproduction in any medium or format, as long as you give appropriate credit to the original author(s) and the source, provide a link to the Creative Commons licence, and indicate if changes were made. The images or other third party material in this article are included in the article’s Creative Commons licence, unless indicated otherwise in a credit line to the material. If material is not included in the article’s Creative Commons licence and your intended use is not permitted by statutory regulation or exceeds the permitted use, you will need to obtain permission directly from the copyright holder. To view a copy of this licence, visit http://creativecommons.org/licenses/by/4.0/ .
Reprints and permissions
About this article
Yao, H., Hou, Y., Hausmann-Stabile, C. et al. Intergenerational Ambivalence, Self-differentiation and Ethnic Identity: A Mixed-methods Study on Family Ethnic Socialization. J Child Fam Stud (2024). https://doi.org/10.1007/s10826-024-02819-w
Download citation
Accepted : 09 February 2024
Published : 08 May 2024
DOI : https://doi.org/10.1007/s10826-024-02819-w
Share this article
Anyone you share the following link with will be able to read this content:
Sorry, a shareable link is not currently available for this article.
Provided by the Springer Nature SharedIt content-sharing initiative
- Family ethnic socialization
- Self-differentiation
- Ethnic identity
- Ethnic minority
- Adolescents
- Find a journal
- Publish with us
- Track your research
IMAGES
VIDEO
COMMENTS
Hugh McLaughlin, Quantitative Research Methods for Social Work: Making Social Work Count, Barbra Teater, John Devaney, ... The book is unusual for the UK in that its major focus is on quantitative methods unlike other social work research methods books which tend to cover both qualitative and quantitative methods (Campbell et al., 2017; ...
Social work researchers will send out a survey, receive responses, aggregate the results, analyze the data, and form conclusions based on trends. Surveys are one of the most common research methods social workers use — and for good reason. They tend to be relatively simple and are usually affordable.
Quantitative methods emphasize objective measurements and the statistical, mathematical, or numerical analysis of data collected through polls, questionnaires, and surveys, or by manipulating pre-existing statistical data using computational techniques.Quantitative research focuses on gathering numerical data and generalizing it across groups of people or to explain a particular phenomenon.
Second, social work researchers should incorporate the latest advances in methods from other disciplines. Third, researchers should use quantitative methods to address the most pressing and challenging issues of social work research and practice.
We designed our book to help graduate social work students through every step of the research process, from conceptualization to dissemination. Our textbook centers cultural humility, information literacy, pragmatism, and an equal emphasis on quantitative and qualitative methods. It includes extensive content on literature reviews, cultural bias and respectfulness, and qualitative methods, in ...
Quantitative social work research does face peculiarly acute difficulties arising from the intangible nature of its variables, the fluid, probabilistic way in which these variables are connected, and the degree to which outcome criteria are subject to dispute. ... In Gray M., Webb S. (Eds.), Social work theory and methods (pp. 184-194 ...
The importance of quantitative research in the social sciences generally and social work specifically has been highlighted in recent years, in both an international and a British context. Consensus opinion in the UK is that quantitative work is the 'poor relation' in social work research, leading to a number of initiatives.
Abstract. Mixed methods are a useful approach chosen by many social work researchers. This article showcases a quality framework using social work examples as practical guidance for social work researchers. Combining methodological literature with practical social work examples, elements of a high-quality approach to mixed methods are showcased ...
The Handbook of Social Work Research Methods is a cutting-edge volume that covers all the major topics that are relevant for Social Work Research methods. Edited by Bruce Thyer and containing contributions by leading authorities, this Handbook covers both qualitative and quantitative approaches as well as a section that delves into more general ...
Research design in social work: ... Campbell AnneTaylor BrianMcGlade Anne, Research design in social work: Qualitative and quantitative methods. London: Sage Publications - Learning Matters, 2017; 160 pp. ISBN 9781446271247, £20.99 (pbk) ... Deborah K. Padgett, Qualitative Methods in Social Work Research, 2nd edn. Thousand Oaks, CA: SAGE ...
The book is a comprehensive resource for students and educators. It is packed with activities and examples from social work covering the basic concepts of quantitative research methods - including reliability, validity, probability, variables and hypothesis testing - and explores key areas of data collection, analysis and evaluation ...
Although the proportion of quantitative research is rather small in social work research, the review could not find evidence that it is of low sophistication. Finally, this study concludes that future research would benefit from making explicit why a certain methodology was chosen.
Introduction. Social work research means conducting an investigation in accordance with the scientific method. The aim of social work research is to build the social work knowledge base in order to solve practical problems in social work practice or social policy. Investigating phenomena in accordance with the scientific method requires maximal ...
Quantitative research methods are concerned with the planning, design, and implementation of strategies to collect and analyze data. Descartes, the seventeenth-century philosopher, suggested that how the results are achieved is often more important than the results themselves, as the journey taken along the research path is a journey of discovery. . High-quality quantitative research is ...
Mixed-methods research is a flexible approach, where the research design is determined by what we want to find out rather than by any predetermined epistemological position. In mixed-methods research, qualitative or quantitative components can predominate, or both can have equal status. 1.4. Units and variables.
Chapter 12 How to do quantitative research without collecting new data Chapter 13 How to combine qualitative and quantitative methods in social work research. Product details. Published: Sep 16 2017: Format: Ebook (PDF) Edition: 1st: Extent: 276: ISBN: 9781137400277: Imprint: Red Globe Press: Publisher: Bloomsbury Publishing: About the ...
solid foundation in quantitative research methods in the social sciences. Moreover, we believe that this new edition can be a guide for quantitative researchers in the social sciences, specifically those who seek to work with R or transition from other programs to R.
Revised on June 22, 2023. Quantitative research is the process of collecting and analyzing numerical data. It can be used to find patterns and averages, make predictions, test causal relationships, and generalize results to wider populations. Quantitative research is the opposite of qualitative research, which involves collecting and analyzing ...
The contrast between qualitative and quantitative conceptualization is instructive for understanding how quantitative methods (and positivist research in general) privilege the knowledge of the researcher over the knowledge of study participants and community members. ... The practice of research in social work (3rd. ed.). Thousand Oaks, CA: SAGE.
Quantitative research methods for social work: Making social work count. January 2017. Edition: 1st. Publisher: Palgrave. ISBN: 978-1-137-40026-. Authors: Barbra Teater. City University of New ...
Chapter 12 How to do quantitative research without collecting new data Chapter 13 How to combine qualitative and quantitative methods in social work research. Product details. Published: Jan 01 2017: Format: Paperback: Edition: 1st: Extent: 276: ISBN: 9781137400260: Imprint: Red Globe Press: Dimensions: Not specified: Publisher: ...
Finding Quantitative Studies. Add the term quantitative or the type of study to your keywords. "chronic pain" AND quantitative "chronic pain" AND "clinical trial*" Explore the advanced search options in the database you are using. Some databases (like PsycINFO, CINAHL, and PubMed) have limiters by study type or research design.
In this authoritative text, a collection of leading names in social work research and academia unpack the basic concepts of quantitative research methods - including reliability, validity, probability, variables and hypothesis testing - and explore key areas of data collection, analysis and evaluation, providing a detailed examination of ...
Graduate Research Methods in Social Work (DeCarlo, Cummings, and Agnelli) 10: Using quantitative methods - Quantitative sampling 10.2: Sampling approaches for quantitative research ... Sampling in quantitative research projects is done because it is not feasible to study the whole population, and researchers hope to take what we learn about a ...
The findings emphasize the need for culturally sensitive support, particularly for social workers, to facilitate reflexive self-differentiation among ethnic minority adolescents during family ethnic socialization. ... By combining qualitative and quantitative methods, the research endeavors to capture the multifaceted nature of parent-child ...