7 Websites with free scientific illustrations
Are you looking for nice illustrations for your scientific presentations ? Do you need some cool science art figures to better explain your work in the next poster ?
If that is the case, and you don’t want to spend time creating them, searching on Google images may seem the obvious thing to do. However, you may find yourself lost among a lot of uninteresting images, most of which probably won’t be free to use.
Don’t worry, there is an alternative. You can make your life easier by searching on repositories with professional illustrations to use free of charge in your figures, PowerPoint presentations and posters.
Below you will find a selection of 7 cool websites from which you can download for free science illustrations to use in your work.
Just remember to always check the terms and conditions for each illustration. Some repositories have different types of licenses depending on the illustration.
If your idea is to use some already made illustrations to create a figure for a publication, always check the journal’s policy on graphical abstracts and figures. Some journals may require all the work to be 100% original.

1. Pixabay
Pixabay is a huge repository of images, illustrations, and vector graphics in which you can even find videos and music.
By searching for vectors, you will find illustrations in SVG format , which can be edited later in Illustrator or PowerPoint, to better adapt them to your presentation or poster.

Pixabay is meant as a general resource, not specialized in science topics, so if you are looking for something very specific, you probably won’t find it here. However, it can be really useful to represent more generic elements , such as a microscope or other laboratory stuff.

2. Smart servier
In Smart servier you will find 3000 free medical images to use in publications and scientific presentations provided by Les Laboratoires Servier.
These illustrations can be downloaded individually as PNG, or you can download the entire set of illustrations from one specific category . In this case, you will obtain a PowerPoint presentation with all the drawings, which can be further edited later on.
Note that all the illustrations are licensed under a Creative Commons Attribution 3.0 Unported License . So, accordingly, you are free to use them, but you must give appropriate credit, provide a link to the license and indicate if changes were made.
3. Vecteezy
Vecteezy is a website from which you can download free vector art, stock photos and videos. In this website you will find a nice collection of science related illustrations .

The website allows you to use filters to optimize the search . For instance, you can select what colors you prefer the illustrations to be or their orientation. If you look for vectors, you will also be able to later edit the file on Illustrator or PowerPoint.
Vecteeze has images under different license types , so you can also choose to see only the ones under a free license. Remember to always check the license specifications, since in this case, free files have some usage limitations, and you must attribute Vecteezy in your work.
SciDraw is a free repository of scientific illustrations created by Federico Claudi and Alex Harston , where the drawings are made by and for scientists .
In this website, you can find drawings of different animal models and other scientific setups to use in your scientific presentations, posters, grant proposals, etc. You can also contribute to this repository by uploading your own creations.

All the illustrations are under the Creative Commons 4.0 license , so you are free to download, use, modify and distribute the images, even commercially, as long as proper credit is given.
Freepik is a website with lots of different assets such as vectors, illustrations, photos, and icons, similar to Pixabay or Vecteeze.
When searching for illustrations, remember to check for vector drawings under a free license. You can do so by selecting this options in the browser. Thus, you will be able to download EPS files that can be further edited later one in a design program such as Illustrator or PowerPoint.

In this case, the free license allows you to use the drawings for both personal and commercial work and to modify them, but you have to credit the author . Remember to check the license specifications for any illustrations, just to be sure you will use them properly.

6. Innovative Genomics glossary
In the glossary of the Innovative Genomics Institute , you will find different science concepts explained and illustrated. The great thing is that you can download all the illustrations in PNG and SVG format!
The drawings were created by Christine Liu and are licensed under a Creative Commons Attribution-NonCommercial-ShareAlike 4.0 International License.

Therefore, you can use and adapt the illustrations for non-commercial, educational purposes and must give appropriate credit. Remember to check all the license specifications before using the drawings!
Blush is a completely different repository of illustrations. No, in this website you won’t found lots of drawings of science related elements, but is an excellent place to find characters from all walks of life .
You can use these characters to represent patients affected by a specific disease or to illustrate the population that has participated in your study.
Another cool thing about Blush is that, once you have selected an illustration, you can customize different characteristics of the character , such as the hair, the skin tone or the stance.
Blush offers both a free plan and a pro plan that costs $12 per month. But don’t worry, you won’t need to pay to download the illustrations. With the free version, you can download them for free in a small PNG format with a transparent background, which can be more than enough for a scientific presentation.
According to Blush license , you can use, copy and modify the illustrations for free for commercial and non-commercial purposes, without permission from the illustrator or Blush. Remember to check the license for further details.
Hope you can find the perfect free illustration for your figure, scientific poster or presentation among these selected websites.
However, if you don’t want to waste time browsing these websites; or if you need to illustrate something very specific and want it to be unique, contact us!
We will be happy to help you with your scientific illustration! Have a look at our portfolio to see what we can do for you!
Make scientific figures in minutes
Create publication-quality figures with pre-made icons and templates, all from biorender's web-based software.

Make scientific figures for your lectures, publications, meetings, posters, and more

Looking for science content?
Browse 50K+ icons and templates that are peer-reviewed, easy to use, and free.
Get in touch
555-555-5555

Limited time offer: 20% off all templates ➞

Science Images and Templates
Download hundreds of vector graphics to quickly create professional scientific designs using fully customizable templates
Featured Templates
Downloads come in three high resolution image formats: SVG, PowerPoint, and Adobe Illustrator files. The vector art is fully customizable if you have editing software such as Adobe Illustrator, Affinity Designer, or Inkscape.

1_Biological Diagram Templates

1_Laboratory Tools and Equipment Drawings

Adobe Illustrator for Scientists Guide

Animal Cell Diagram

C. elegans / Nematode Drawings

Cancer Cell Drawings and Templates

Cell Biology Templates: Backgrounds and Vector Brushes

Cell Type Drawings

Chicken Embryo Development Stage Drawings

Color Palette and Figure Templates

DNA, RNA, Histone, CRISPR Drawings

Drosophila/Fruit Fly Drawings

Excel Graph and Table Templates

Free Graphical Abstract Templates for PowerPoint and Adobe Illustrator

Free Research Poster Templates

Human Brain Drawings

Laboratory Tools: Petri Dish, Syringe and Tube Drawings

Molecular Assay and Plasmid Drawings

Notch Molecular Signaling Pathway

Plant Cell Diagram

Plasmid Drawings

Rat and Mouse Drawings

Science PowerPoint Templates

Zebrafish Drawings
Image customization tutorials.
Videos that show you how to use and edit the image downloads with Adobe Illustrator and PowerPoint.
Interested in free design templates and training?
Explore scientific design templates and courses by creating a Simplified Science Publishing Log In. Whether you are new to data visualization design or have some experience, these resources will improve your ability to use both basic and advanced design tools.
Usage Rules
For all usage details,
visit the terms of use page .
Any use of content for profit must follow the secondary element rules .
- You are free to use and modify all downloaded designs for personal, academic, and publication projects without attribution. (Translation: You can do whatever you want with them on an individual basis, as long you don't re-sell the original images or add them to a shared database).
- You are not allowed to sub-license, resell or rent it; or include it in any online or offline image archive or database. (Translation: You are not allowed to sell, rent, or add the images to a shared image database).
- For projects that earn a profit, you will need to use the downloads as secondary elements in your artwork. Learn more here: How to Use Simplified Science Publishing Content
Online Courses
Stay up-to-date for new simplified science courses, subscribe to our newsletter.
Thank you for signing up!
You have been added to the emailing list and will only recieve updates when there are new courses or templates added to the website.
We use cookies on this site to enhance your user experience and we do not sell data. By using this website, you are giving your consent for us to set cookies: View Privacy Policy
Simplified Science Publishing, LLC
- Notifications
No notifications to show yet
You’ll see useful information here soon. Stay tuned!
- Animated icons
- Interface icons
Are you sure you want to delete this collection?
We’re sorry you canceled your Premium subscription
You can still enjoy Flaticon Collections with the following limits:
- You can choose only 3 collections to keep
- You can only add up to 100 icons per collection
- You can’t add Premium icons to your collection
The advantages of your collections have changed
Keep making the most of your icons and collections
20% OFF our Annual Premium Plan
Select 3 collections to continue:
You have 8 collections, but can only unlock 3 of them
Report download
Please indicate what problem has been found. Thanks!
Base 64 encoded image
Copy the base64 encoded data and insert it in your HTML or CSS document. Need help? Maybe this link can help you
CSS background
Using it for the web? Copy this link in your website:
How to attribute for other media?
Don’t you want to attribute the author?
Going Premium is easy and it also allows you to use more than 15,492,500 icons without attribution. Find out more information here
Select a color from the icon
Choose a new color
Custom palette
- Remove color
- Remove palette
- You have exceeded the number of color samples for this palette
Select a shape
Stroke width
You can only save 3 new edited icons per collection as a free user. Upgrade to save unlimited icons.
Your collection is locked. You can upgrade your account to get an unlimited collection.
You have reached the icons limit per collection (256 icons)
This feature is only available for registered users. Login or register
This icon has a gradient color and cannot be edited.
Group search results
You can group your results by author style, pack, or see all available icons on your screen.
Science Icons
- Delete filters
- Add to collection
- Copy to clipboard. Copying this asset counts as a download Copy to clipboard SVG PNG
Set your own limits
Gain access to over 15,492,500 icons in formats SVG, EPS, PSD & BASE64
Download what you want, cancel when you want
Related tags
Collection:
Over 15,492,500 icons for 8.25 USD /month
- No attribution required
- 15.5M icons & stickers in SVG, EPS, PSD & BASE64
- Unlimited downloads
- Browse ad-free
You must attribute the author
How to attribute for other media? How to attribute?
How likely are you to recommend Flaticon to a friend?
How about giving us a rating on Trustpilot
If you can spare a few minutes to leave us a review, we’d be super grateful 😃
Please visit:
Thank you for visiting nature.com. You are using a browser version with limited support for CSS. To obtain the best experience, we recommend you use a more up to date browser (or turn off compatibility mode in Internet Explorer). In the meantime, to ensure continued support, we are displaying the site without styles and JavaScript.
- View all journals
- Explore content
- About the journal
- Publish with us
- Sign up for alerts
- TECHNOLOGY FEATURE
- 08 May 2020
The software that powers scientific illustration
- Jeffrey M. Perkel
You can also search for this author in PubMed Google Scholar
Illustration by The Project Twins
Like many researchers, Rita Sattler is trained to conduct science, not to draw it. But papers still need writing — and illustrating. So, when the time came to document what her team had done for a journal article, Sattler did what her colleagues frequently do: she fired up PowerPoint.
Access options
Access Nature and 54 other Nature Portfolio journals
Get Nature+, our best-value online-access subscription
24,99 € / 30 days
cancel any time
Subscribe to this journal
Receive 51 print issues and online access
185,98 € per year
only 3,65 € per issue
Rent or buy this article
Prices vary by article type
Prices may be subject to local taxes which are calculated during checkout
Nature 582 , 137-138 (2020)
doi: https://doi.org/10.1038/d41586-020-01404-7
Related Articles

- Biological techniques
- Communication

World’s brightest X-rays: China first in Asia to build next-generation synchrotron
News 13 MAY 24

Powerful ‘nanopore’ DNA sequencing method tackles proteins too
Technology Feature 08 MAY 24

The intrinsic substrate specificity of the human tyrosine kinome
Article 08 MAY 24

US TikTok ban: how the looming restriction is affecting scientists on the app
News 09 MAY 24

‘Shrugging off failure is hard’: the $400-million grant setback that shaped the Smithsonian lead scientist’s career
Career Q&A 15 APR 24

How I harnessed media engagement to supercharge my research career
Career Column 09 APR 24

Explaining novel scientific concepts to people whose technical acumen does not extend to turning it off, then turning it on again
Futures 15 MAY 24

Tashni’s first tunnel
Futures 08 MAY 24

The AI tuner
Futures 01 MAY 24
Senior Research Assistant in Human Immunology (wet lab)
Senior Research Scientist in Human Immunology, high-dimensional (40+) cytometry, ICS and automated robotic platforms.
Boston, Massachusetts (US)
Boston University Atomic Lab
Postdoctoral Fellow in Systems Immunology (dry lab)
Postdoc in systems immunology with expertise in AI and data-driven approaches for deciphering human immune responses to vaccines and diseases.
Global Talent Recruitment of Xinjiang University in 2024
Recruitment involves disciplines that can contact the person in charge by phone.
Wulumuqi city, Ürümqi, Xinjiang Province, China
Xinjiang University
Tenure-Track Assistant Professor, Associate Professor, and Professor
Westlake Center for Genome Editing seeks exceptional scholars in the many areas.
Westlake Center for Genome Editing, Westlake University
Faculty Positions at SUSTech School of Medicine
SUSTech School of Medicine offers equal opportunities and welcome applicants from the world with all ethnic backgrounds.
Shenzhen, Guangdong, China
Southern University of Science and Technology, School of Medicine
Sign up for the Nature Briefing newsletter — what matters in science, free to your inbox daily.
Quick links
- Explore articles by subject
- Guide to authors
- Editorial policies
Science and Technology

Your presentations are going to be amazing! See Plans and Pricing

© 2009-2021 Eclipse Digital Imaging, Inc.
Quality PowerPoint Templates , Animations, videos, and 3D Clipart. PowerPoint® is a registered trademark of Microsoft Corporation.
Notification Title!
This is the message.
We’re sorry, but Freepik doesn’t work properly without JavaScript enabled. FAQ Contact
- Notifications
- Go back Remove
- No notifications to show yet You’ll see useful information here soon. Stay tuned!
- Downloads 0/60 What is this?
- My collections
- My subscription
Find out what’s new on Freepik and get notified about the latest content updates and feature releases.
- Science template
Science Presentation Vectors

- Add to collection
- Save to Pinterest
- science laboratory
- science lab

- science infographic
- science template

- scientific research

- science research

- science education

- instagram story stories

- website graphics
- web interface

- chemistry lab

- online discussion
- website landing page

- rose banner
- spring sale

- technology landing page

- theme design
- website theme

- landing page template
- website templates

- science banner
- channel art
- youtube banner

- science experiment

- laboratory microscope

- marketing landing page
- business landing
- business landing page

- lab equipment
- chemical reaction
- laboratory equipment

Got any suggestions?
We want to hear from you! Send us a message and help improve Slidesgo
Top searches
Trending searches

11 templates

8 templates

25 templates

9 templates

memorial day
12 templates

39 templates
Science Presentation templates
Download cool science powerpoint templates and google slides themes and use them for your projects and presentations. find creative and professional slide decks full of resources at your disposal for maximum customization., related collections.

41 templates

109 templates

Middle School
126 templates

High School
150 templates

215 templates

Science Fiction Film Pitch Deck
Download the Science Fiction Film Pitch Deck presentation for PowerPoint or Google Slides. Whether you're an entrepreneur looking for funding or a sales professional trying to close a deal, a great pitch deck can be the difference-maker that sets you apart from the competition. Let your talent shine out thanks...

Science Fair Newsletter
Creativity and innovation are also words closely tied to science, since people are always looking for new inventions and applications. Are you organizing a science fair and want to keep people up to date? How convenient—here’s our latest free template focused on this topic!

Premium template
Unlock this template and gain unlimited access
Computer Science College Major
If you are a guru of computers, most likely you've studied computer science in college. Would you like to show others what a major in this field has to offer and what it could contribute to their professional development? Customize this template and let them feel the future, at least...

Science Education Center
Albert Einstein believed that “the important thing is to never stop questioning.” When it comes to science and research, we need to investigate and to ask for answers. Teach your students about the value of questioning in your Science Education Center!

Biology Infographics
Download the "Biology Infographics" template for PowerPoint or Google Slides and discover this set of editable infographics for education presentations. These resources, from graphs to tables, can be combined with other presentations or used independently. The most important thing is what you will achieve: transmit information in an orderly and...

Science Subject for Elementary - 1st Grade: Inquiry
Turn your little first graders into real scientists by teaching them the basics of scientific inquiry! We have an hypothesis: if you prepare the lesson with this creative template full of illustrations, resources and fun icons, they will pay more attention to the lesson and retain all the vocabulary we...

Electromechanical Engineering Major for College
Download the Electromechanical Engineering Major for College presentation for PowerPoint or Google Slides. As university curricula increasingly incorporate digital tools and platforms, this template has been designed to integrate with presentation software, online learning management systems, or referencing software, enhancing the overall efficiency and effectiveness of student work. Edit this...

Scientific Investigation and Experimentation - Science - 2nd Grade
Science can be a daunting subject for young students, but introducing scientific investigation and experimentation in a simplified and engaging manner can spark their curiosity and love for the subject. With the help of a creative template specifically designed for 2nd graders, teaching age-appropriate activities and concepts related to scientific...

Anatomy & Physiology Lesson for Middle School
Download the Anatomy & Physiology Lesson for Middle School presentation for PowerPoint or Google Slides. If you’re looking for a way to motivate and engage students who are undergoing significant physical, social, and emotional development, then you can’t go wrong with an educational template designed for Middle School by Slidesgo!...

Science Subject for High School - 10th Grade: Atoms and the Periodic Table
(He)re’s a challenge! How many elements (Ca)n you find in this description? Remem(Be)r: There are elements, such as Hydrogen (H) or Potassium (K) whose symbol is just a letter… Well, maybe it’s a difficult game… Which is not going to be difficult for your high school students is learning the...

Powerful Predators
Download the "Powerful Predators" presentation for PowerPoint or Google Slides and teach with confidence. Sometimes, teachers need a little bit of help, and there's nothing wrong with that. We're glad to lend you a hand! Since Slidesgo is committed to making education better for everyone, we've joined hands with educators....

Basic Chemistry for Pre-K
Who says that pre-schoolers are not interested in chemistry? Don't they look fascinated whenever they see the rain? Let us give you this funny template full of stickers related to science, a colorful palette and a dynamic approach. Use these slides and the wonderful choice of fonts to teach them...

Science Subject for Elementary: Reproductive System
This presentation template is perfect for teaching elementary school students about the reproductive system. It includes engaging and informative illustrations to help reinforce understanding of the topic. Students will learn about the anatomy of reproduction, such as components like sperm and ovum, and they will understand how these components work...

Sense Organs
Download the Sense Organs presentation for PowerPoint or Google Slides. If you are planning your next workshop and looking for ways to make it memorable for your audience, don’t go anywhere. Because this creative template is just what you need! With its visually stunning design, you can provide your participants...

What Are the Properties of Matter?
Download the "What Are the Properties of Matter?" presentation for PowerPoint or Google Slides and teach with confidence. Sometimes, teachers need a little bit of help, and there's nothing wrong with that. We're glad to lend you a hand! Since Slidesgo is committed to making education better for everyone, we've...

Bee Theme for Pre-K
Download the Bee Theme for Pre-K presentation for PowerPoint or Google Slides and create big learning experiences for the littlest students! Dynamic and adorable, this template provides the visual stimuli that Pre-K students thrive on and makes your lessons more playful and exciting — after all, Pre-K education is all...

History of The Atom
Download the "History of The Atom" presentation for PowerPoint or Google Slides. The education sector constantly demands dynamic and effective ways to present information. This template is created with that very purpose in mind. Offering the best resources, it allows educators or students to efficiently manage their presentations and engage...

Science Subject for Middle School: Chemical Elements
Chemical elements are the building blocks of all matter. From the air we breathe to the food we eat, every substance around us is composed of one or more elements. These fundamental constituents of matter are organized into the periodic table. You're familiar with it, right? If not, don't worry,...
- Page 1 of 57
Great presentations, faster
Slidesgo for Google Slides :
The easy way to wow

Register for free and start editing online

Scientific Presentation
Your next presentation will be visually attractive with our venngage's scientific creative presentation template.
- Design style modern
- Colors vibrant
- Size Custom (1024 x 576 px)
- File type PNG, PDF, PowerPoint
- Plan premium
Do you need to lead a discussion or lecture on nutrition, computer science, or biology? This Scientific Creative Presentation is the perfect template for a discussion about any science topic. It can be entirely modified around your subject and there are several options to design a scientific slide show. The Scientific Creative Presentation template can be customized to feature statistic charts, tables, and graphs. You also have the option to edit the text, font, lists, and the layout. With the Scientific Creative Presentation template you can add icons, images, or upload photos to customize the design for a more visual approach. Put on the best science presentation with the Scientific Creative Presentation template from Venngage!
Explore more
Home Blog Education How to Prepare Your Scientific Presentation
How to Prepare Your Scientific Presentation
Since the dawn of time, humans were eager to find explanations for the world around them. At first, our scientific method was very simplistic and somewhat naive. We observed and reflected. But with the progressive evolution of research methods and thinking paradigms, we arrived into the modern era of enlightenment and science. So what represents the modern scientific method and how can you accurately share and present your research findings to others? These are the two fundamental questions we attempt to answer in this post.
What is the Scientific Method?
To better understand the concept, let’s start with this scientific method definition from the International Encyclopedia of Human Geography :
The scientific method is a way of conducting research, based on theory construction, the generation of testable hypotheses, their empirical testing, and the revision of theory if the hypothesis is rejected.
Essentially, a scientific method is a cumulative term, used to describe the process any scientist uses to objectively interpret the world (and specific phenomenon) around them.
The scientific method is the opposite of beliefs and cognitive biases — mostly irrational, often unconscious, interpretations of different occurrences that we lean on as a mental shortcut.
The scientific method in research, on the contrary, forces the thinker to holistically assess and test our approaches to interpreting data. So that they could gain consistent and non-arbitrary results.

The common scientific method examples are:
- Systematic observation
- Experimentation
- Inductive and deductive reasoning
- Formation and testing of hypotheses and theories
All of the above are used by both scientists and businesses to make better sense of the data and/or phenomenon at hand.
The Evolution of the Scientific Method
According to the Stanford Encyclopedia of Philosophy , ancient thinkers such as Plato and Aristotle are believed to be the forefathers of the scientific method. They were among the first to try to justify and refine their thought process using the scientific method experiments and deductive reasoning.
Both developed specific systems for knowledge acquisition and processing. For example, the Platonic way of knowledge emphasized reasoning as the main method for learning but downplayed the importance of observation. The Aristotelian corpus of knowledge, on the contrary, said that we must carefully observe the natural world to discover its fundamental principles.
In medieval times, thinkers such as Thomas Aquinas, Roger Bacon, and Andreas Vesalius among many others worked on further clarifying how we can obtain proven knowledge through observation and induction.
The 16th–18th centuries are believed to have given the greatest advances in terms of scientific method application. We, humans, learned to better interpret the world around us from mechanical, biological, economic, political, and medical perspectives. Thinkers such as Galileo Galilei, Francis Bacon, and their followers also increasingly switched to a tradition of explaining everything through mathematics, geometry, and numbers.
Up till today, mathematical and mechanical explanations remain the core parts of the scientific method.
Why is the Scientific Method Important Today?
Because our ancestors didn’t have as much data as we do. We now live in the era of paramount data accessibility and connectivity, where over 2.5 quintillions of data are produced each day. This has tremendously accelerated knowledge creation.
But, at the same time, such overwhelming exposure to data made us more prone to external influences, biases, and false beliefs. These can jeopardize the objectivity of any research you are conducting.
Scientific findings need to remain objective, verifiable, accurate, and consistent. Diligent usage of scientific methods in modern business and science helps ensure proper data interpretation, results replication, and undisputable validity.
6 Steps of the Scientific Method
Over the course of history, the scientific method underwent many interactions. Yet, it still carries some of the integral steps our ancestors used to analyze the world such as observation and inductive reasoning. However, the modern scientific method steps differ a bit.

1. Make an Observation
An observation serves as a baseline for your research. There are two important characteristics for a good research observation:
- It must be objective, not subjective.
- It must be verifiable, meaning others can say it’s true or false with this.
For example, This apple is red (objective/verifiable observation). This apple is delicious (subjective, harder-to-verify observation).
2. Develop a Hypothesis
Observations tell us about the present or past. But the goal of science is to glean in the future. A scientific hypothesis is based on prior knowledge and produced through reasoning as an attempt to descriptive a future event.
Here are characteristics of a good scientific hypothesis:
- General and tentative idea
- Agrees with all available observations
- Testable and potentially falsifiable
Remember: If we state our hypothesis to indicate there is no effect, our hypothesis is a cause-and-effect relationship . A hypothesis, which asserts no effect, is called a null hypothesis.
3. Make a Prediction
A hypothesis is a mental “launchpad” for predicting the existence of other phenomena or quantitative results of new observations.
Going back to an earlier example here’s how to turn it into a hypothesis and a potential prediction for proving it. For example: If this apple is red, other apples of this type should be red too.
Your goal is then to decide which variables can help you prove or disprove your hypothesis and prepare to test these.
4. Perform an Experiment
Collect all the information around variables that will help you prove or disprove your prediction. According to the scientific method, a hypothesis has to be discarded or modified if its predictions are clearly and repeatedly incompatible with experimental results.

Yes, you may come up with an elegant theory. However, if your hypothetical predictions cannot be backed by experimental results, you cannot use them as a valid explanation of the phenomenon.
5. Analyze the Results of the Experiment
To come up with proof for your hypothesis, use different statistical analysis methods to interpret the meaning behind your data.
Remember to stay objective and emotionally unattached to your results. If 95 apples turned red, but 5 were yellow, does it disprove your hypothesis? Not entirely. It may mean that you didn’t account for all variables and must adapt the parameters of your experiment.
Here are some common data analysis techniques, used as a part of a scientific method:
- Statistical analysis
- Cause and effect analysis (see cause and effect analysis slides )
- Regression analysis
- Factor analysis
- Cluster analysis
- Time series analysis
- Diagnostic analysis
- Root cause analysis (see root cause analysis slides )
6. Draw a Conclusion
Every experiment has two possible outcomes:
- The results correspond to the prediction
- The results disprove the prediction
If that’s the latter, as a scientist you must discard the prediction then and most likely also rework the hypothesis based on it.
How to Give a Scientific Presentation to Showcase Your Methods
Whether you are doing a poster session, conference talk, or follow-up presentation on a recently published journal article, most of your peers need to know how you’ve arrived at the presented conclusions.
In other words, they will probe your scientific method for gaps to ensure that your results are fair and possible to replicate. So that they could incorporate your theories in their research too. Thus your scientific presentation must be sharp, on-point, and focus clearly on your research approaches.
Below we propose a quick framework for creating a compelling scientific presentation in PowerPoint (+ some helpful templates!).
1. Open with a Research Question
Here’s how to start a scientific presentation with ease: share your research question. On the first slide, briefly recap how your thought process went. Briefly state what was the underlying aim of your research: Share your main hypothesis, mention if you could prove or disprove them.
It might be tempting to pack a lot of ideas into your first slide but don’t. Keep the opening of your presentation short to pique the audience’s initial interest and set the stage for the follow-up narrative.

2. Disclose Your Methods
Whether you are doing a science poster presentation or conference talk, many audience members would be curious to understand how you arrived at your results. Deliver this information at the beginning of your presentation to avoid any ambiguities.
Here’s how to organize your science methods on a presentation:
- Do not use bullet points or full sentences. Use diagrams and structured images to list the methods
- Use visuals and iconography to use metaphors where possible.
- Organize your methods by groups e.g. quantifiable and non-quantifiable
Finally, when you work on visuals for your presentation — charts, graphs, illustrations, etc. — think from the perspective of a subject novice. Does the image really convey the key information around the subject? Does it help break down complex ideas?

3. Spotlight the Results
Obviously, the research results will be your biggest bragging right. However, don’t over-pack your presentation with a long-winded discussion of your findings and how revolutionary these may be for the community.
Rather than writing a wall of text, do this instead:
- Use graphs with large axis values/numbers to showcase the findings in great detail
- Prioritize formats that are known to everybody (e.g. odds ratios, Kaplan Meier curves, etc.)
- Do not include more than 5 lines of plain text per slide
Overall, when you feel that the results slide gets too cramped, it’s best to move the data to a new one.
Also, as you work on organizing data on your scientific presentation PowerPoint template , think if there are obvious limitations and gaps. If yes, make sure you acknowledge them during your speech.
4. Mention Study Limitations
The scientific method mandates objectivity. That’s why every researcher must clearly state what was excluded from their study. Remember: no piece of scientific research is truly universal and has certain boundaries. However, when you fail to personally state those, others might struggle to draw the line themselves and replicate your results. Then, if they fail to do so, they’d question the viability of your research.
5. Conclude with a Memorable Takeaway Message
Every experienced speaker will tell you that the audience best retains the information they hear first and last. Most people will attend more than one scientific presentation during the day.
So if you want the audience to better remember your talk, brainstorm a take-home message for the last slide of your presentation. Think of your last slide texts as an elevator pitch — a short, concluding message, summarizing your research.
To Conclude
Today we have no shortage of research and scientific methods for testing and proving our hypothesis. However, unlike our ancestors, most scientists experience deeper scrutiny when it comes to presenting and explaining their findings to others. That’s why it’s important to ensure that your scientific presentation clearly relays the aim, vector, and thought process behind your research.

Like this article? Please share
Education, Presentation Ideas, Presentation Skills, Presentation Tips Filed under Education
Related Articles

Filed under Google Slides Tutorials • May 3rd, 2024
How to Work with Google Slides Version History
Go back to previous changes or check who edited your presentation. Learn how to work with Google Slides Version History here.

Filed under Design , Presentation Ideas • May 1st, 2024
The Power of Mind Map Note Taking for Presenters
Add a new tool to your repertoire of presentation skills by mastering the art of mind map note taking. An ideal process to facilitate content retention.

Filed under Google Slides Tutorials • April 29th, 2024
Best Google Slides Add-Ons
Optimize your Google Slides experience by installing the best Google Slides add-ons available in the market. Full list with photos.
Leave a Reply
Our PhD-trained science communicators and professional artists will UNLEASH YOUR IMPACT through our animation services and SciComm training programs.

ACADEMIA HAS A PROBLEM
14000 papers are published
every single day!
Many never get cited or even read.

Your research could
get lost too!
WE HAVE A SOLUTION
Our animations, infographics and training programs make your research stand out

...and obtain the visibility it deserves
WITH MANY BENEFITS
more citations and
higher impact metrics

For society:
engaging and understandable science out there
Services Science Animations and Graphics
Animate Your Science has helped 332+ researchers and institutions in 32 countries tell their stories by producing animations and graphics that generate impact.
Animated Video Abstracts
To tell the story of your paper in a short, fun and engaging animation
Ready in 3-4 weeks when you order today
Custom Science Explainer Animations
A tailored animation or graphic for your unique story
Ready in 4-6 weeks when you order today
Custom Scientific Graphics & Posters
Make a splash with an eye-catching scientific poster
Graphical Abstracts
To tell the story of your paper with an eye-grabbing infographic
Ready in 1-2 weeks when you order today

The Science Communication Training Academy
Join thousands of other researchers and learn the skills to captivate your audience and communicate your research in a compelling way. Animate Your Science has trained 4250+ researchers across 45 countries. Want to unleash your impact?
Online Courses
Learn at your own pace with
our pre-recorded courses.
Practical evidence-based science communication training.
In-person or online
Keynote Presentations
Captivating presentations tailored to your event.
This company was founded by a scientist for scientists: so we understand your needs.
Our PhD-trained science communicators work side by side with professional designers, following a process that ensures scientific rigour while taking little more than an hour of your time.
With us, you will get head-turning videos and graphics that truly engage your audience. Hands-off.
What sets us apart
The Animate Your Science approach is
Key Benefits
Videos and graphics draw more eyes to your research.

Articles published with a video abstract benefit from:
more citations
Source: Zong et al. 2019

Articles promoted on Twitter with a graphical abstract benefit from a:
boost in article views
Source: Ibrahim et al. 2017

On average, people spend:
more time on pages with video
Source: Wistia Internal Study

Journalists need video content they can use for free
Therefore, videos boost your chances of being picked up by the media
Testimonials
What Clients Think of Us
"The experience of getting a video abstract from Animate Your Science has been flawless.
All we had to do was to fill a short questionnaire and the rest was pretty much hands-off.
We are very happy with the final result and can definitely recommend this service.”
Dr. Federico Gaiti
Cornell University
"We are happy with the result and have had a dynamic, patient and responsive working process with AYS.
Other partners recommended us AYS, and they have lived up to their reputation as professional, competent and engaged."
Henrik Oksfeldt Enevoldsen
"Animate Your Science have done a wonderful job translating our work for a lay audience; exactly as requested and with a really quick turnaround.
Thanks Tullio and team!"
Dr. Clare Bradley
"The way AYS extracted the information needed for our video made the whole process very clear and very easy.
Our whole team was rapt with the end result and feedback from the public has been excellent. Highly recommended!"
Prof. Gretta Pecl
University of Tasmania
“A seamless, effective, visually-appealing, and fun way to get the message of our paper out to the general public.
It is so important to translate scientific findings so they can be utilised beyond our immediate scientific community, and this is a great way to do it!”
Prof. Jodie Rummer
James Cook University

Some of the world's most respected institutions trust us
Interested in our services or training, just click the button below, hear what they say about us.

Launchpad Meetup

Tomorrow Maker

Department for Innovation and Skills
Small Business Award

Our satisfied clients

We use an easy-to-use client portal to efficiently communicate with you and share our progress.
You'll be in full control the entire time, with opportunities to provide feedback at each key stage of the process: so there will be no surprises.

Watch our animation process explainer
A proven process that lets us work together at a distance
- What is a science animation? Science animation refers to the use of animation to portray, communicate, and explain scientific concepts. They are often used for the purposes of academic teaching, awareness campaigning, as well as for entertainment. We provide two science animation services: 1. Video abstracts Video abstracts are short animated summaries about the main findings of an academic paper. They are most effective at promoting a paper's public visibility through media releases and on social media. We offer video abstracts in three artistic formats: Whiteboard 2D motion graphic Hybrid whiteboard/motion graphic 2. Custom explainer videos The scope of an explainer video can branch out infinitely. Whether you need a video to explain your grant application ideas, or simply want an animation to introduce your research team, we'll be able to craft a customised video to suit your needs. Custom explainer videos are offered in the same artistic formats as with video abstracts. However, higher levels of motion and artistic detail can also be achieved in our custom explainer video service. You can learn more about our product tiers here. Examples of animations we have created include: Government project explainers Recruitment campaigns in science and health Animations for research team websites Protocols in a scientific industry Promotional explainers for books with a research context Have an idea for your custom animation? Contact us to find out how we can bring your story to life.
- What is the process? Your research is well on its way to more citations, a healthy boost in metrics, and maybe even onto newsstands around the world. And, believe it or not, it’s as easy as 1 - 2 - 3. Move 1 - Questionnaire Effortlessly tell us the story of your paper with our guided questionnaire. This speeds up the process and ensures that you remain in control over the way your research is portrayed. Move 2 - Concept & storyboard Our team breathes life into your research by writing a script and sketching out your video or graphical abstract for your approval. Move 3 - Illustration/video production Sit back and relax as we work our magic in turning your complex science into a beautiful visual that you’ll be proud to share with the world. Customers that choose our custom animations will start with a strategy session instead of the questionnaire.
- What license covers the graphical and video abstracts? Don’t worry, you’re covered. All of our products are licensed under Creative Commons – Attribution, No Derivatives by default. This means you and anyone else are free to share, copy, and redistribute your video or graphical abstract in any medium, as long as the following conditions are met: 1. Attribution is given to the paper (title, authors, journal, year, DOI), and to www.animateyour.science 2. The product is not modified in any way If you need a whitelabeled product that's ok too, a small fee applies in that case.
- What payment methods do you take? We accept payment by Credit Card, PayPal and Bank transfers. While we do accept purchase orders, we highly encourage instant payment (usingthe options above) for a more streamlined process and much faster turnaround time.
- Will you keep my work confidential? Absolutely! Your project remains top secret until the embargo is lifted. And you choose the date and time you want to release your animated research to the world.
- Who designs the artwork and animates the video? While the concepts are created by a science communicator, the illustrations and animations are created by our professional designers. You can see our beautiful faces on the about page.
- Do you promote the video/graphical abstracts? We do! We offer social sharing through our media channels so that your research is positioned to make a splash from the start. For no extra cost!
- Can I show graphs in the visual abstract? Yes and no. Here’s the thing — we advise against the use of graphs as they can be a turnoff to the layperson. With that said, if your target audience is exclusively scientists, we can include one simple graph in your animation.
Interested in our services?
Or email us at
Reference management. Clean and simple.
How to make a scientific presentation

Scientific presentation outlines
Questions to ask yourself before you write your talk, 1. how much time do you have, 2. who will you speak to, 3. what do you want the audience to learn from your talk, step 1: outline your presentation, step 2: plan your presentation slides, step 3: make the presentation slides, slide design, text elements, animations and transitions, step 4: practice your presentation, final thoughts, frequently asked questions about preparing scientific presentations, related articles.
A good scientific presentation achieves three things: you communicate the science clearly, your research leaves a lasting impression on your audience, and you enhance your reputation as a scientist.
But, what is the best way to prepare for a scientific presentation? How do you start writing a talk? What details do you include, and what do you leave out?
It’s tempting to launch into making lots of slides. But, starting with the slides can mean you neglect the narrative of your presentation, resulting in an overly detailed, boring talk.
The key to making an engaging scientific presentation is to prepare the narrative of your talk before beginning to construct your presentation slides. Planning your talk will ensure that you tell a clear, compelling scientific story that will engage the audience.
In this guide, you’ll find everything you need to know to make a good oral scientific presentation, including:
- The different types of oral scientific presentations and how they are delivered;
- How to outline a scientific presentation;
- How to make slides for a scientific presentation.
Our advice results from delving into the literature on writing scientific talks and from our own experiences as scientists in giving and listening to presentations. We provide tips and best practices for giving scientific talks in a separate post.
There are two main types of scientific talks:
- Your talk focuses on a single study . Typically, you tell the story of a single scientific paper. This format is common for short talks at contributed sessions in conferences.
- Your talk describes multiple studies. You tell the story of multiple scientific papers. It is crucial to have a theme that unites the studies, for example, an overarching question or problem statement, with each study representing specific but different variations of the same theme. Typically, PhD defenses, invited seminars, lectures, or talks for a prospective employer (i.e., “job talks”) fall into this category.
➡️ Learn how to prepare an excellent thesis defense
The length of time you are allotted for your talk will determine whether you will discuss a single study or multiple studies, and which details to include in your story.
The background and interests of your audience will determine the narrative direction of your talk, and what devices you will use to get their attention. Will you be speaking to people specializing in your field, or will the audience also contain people from disciplines other than your own? To reach non-specialists, you will need to discuss the broader implications of your study outside your field.
The needs of the audience will also determine what technical details you will include, and the language you will use. For example, an undergraduate audience will have different needs than an audience of seasoned academics. Students will require a more comprehensive overview of background information and explanations of jargon but will need less technical methodological details.
Your goal is to speak to the majority. But, make your talk accessible to the least knowledgeable person in the room.
This is called the thesis statement, or simply the “take-home message”. Having listened to your talk, what message do you want the audience to take away from your presentation? Describe the main idea in one or two sentences. You want this theme to be present throughout your presentation. Again, the thesis statement will depend on the audience and the type of talk you are giving.
Your thesis statement will drive the narrative for your talk. By deciding the take-home message you want to convince the audience of as a result of listening to your talk, you decide how the story of your talk will flow and how you will navigate its twists and turns. The thesis statement tells you the results you need to show, which subsequently tells you the methods or studies you need to describe, which decides the angle you take in your introduction.
➡️ Learn how to write a thesis statement
The goal of your talk is that the audience leaves afterward with a clear understanding of the key take-away message of your research. To achieve that goal, you need to tell a coherent, logical story that conveys your thesis statement throughout the presentation. You can tell your story through careful preparation of your talk.
Preparation of a scientific presentation involves three separate stages: outlining the scientific narrative, preparing slides, and practicing your delivery. Making the slides of your talk without first planning what you are going to say is inefficient.
Here, we provide a 4 step guide to writing your scientific presentation:
- Outline your presentation
- Plan your presentation slides
- Make the presentation slides
- Practice your presentation

Writing an outline helps you consider the key pieces of your talk and how they fit together from the beginning, preventing you from forgetting any important details. It also means you avoid changing the order of your slides multiple times, saving you time.
Plan your talk as discrete sections. In the table below, we describe the sections for a single study talk vs. a talk discussing multiple studies:
The following tips apply when writing the outline of a single study talk. You can easily adapt this framework if you are writing a talk discussing multiple studies.
Introduction: Writing the introduction can be the hardest part of writing a talk. And when giving it, it’s the point where you might be at your most nervous. But preparing a good, concise introduction will settle your nerves.
The introduction tells the audience the story of why you studied your topic. A good introduction succinctly achieves four things, in the following order.
- It gives a broad perspective on the problem or topic for people in the audience who may be outside your discipline (i.e., it explains the big-picture problem motivating your study).
- It describes why you did the study, and why the audience should care.
- It gives a brief indication of how your study addressed the problem and provides the necessary background information that the audience needs to understand your work.
- It indicates what the audience will learn from the talk, and prepares them for what will come next.
A good introduction not only gives the big picture and motivations behind your study but also concisely sets the stage for what the audience will learn from the talk (e.g., the questions your work answers, and/or the hypotheses that your work tests). The end of the introduction will lead to a natural transition to the methods.
Give a broad perspective on the problem. The easiest way to start with the big picture is to think of a hook for the first slide of your presentation. A hook is an opening that gets the audience’s attention and gets them interested in your story. In science, this might take the form of a why, or a how question, or it could be a statement about a major problem or open question in your field. Other examples of hooks include quotes, short anecdotes, or interesting statistics.
Why should the audience care? Next, decide on the angle you are going to take on your hook that links to the thesis of your talk. In other words, you need to set the context, i.e., explain why the audience should care. For example, you may introduce an observation from nature, a pattern in experimental data, or a theory that you want to test. The audience must understand your motivations for the study.
Supplementary details. Once you have established the hook and angle, you need to include supplementary details to support them. For example, you might state your hypothesis. Then go into previous work and the current state of knowledge. Include citations of these studies. If you need to introduce some technical methodological details, theory, or jargon, do it here.
Conclude your introduction. The motivation for the work and background information should set the stage for the conclusion of the introduction, where you describe the goals of your study, and any hypotheses or predictions. Let the audience know what they are going to learn.
Methods: The audience will use your description of the methods to assess the approach you took in your study and to decide whether your findings are credible. Tell the story of your methods in chronological order. Use visuals to describe your methods as much as possible. If you have equations, make sure to take the time to explain them. Decide what methods to include and how you will show them. You need enough detail so that your audience will understand what you did and therefore can evaluate your approach, but avoid including superfluous details that do not support your main idea. You want to avoid the common mistake of including too much data, as the audience can read the paper(s) later.
Results: This is the evidence you present for your thesis. The audience will use the results to evaluate the support for your main idea. Choose the most important and interesting results—those that support your thesis. You don’t need to present all the results from your study (indeed, you most likely won’t have time to present them all). Break down complex results into digestible pieces, e.g., comparisons over multiple slides (more tips in the next section).
Summary: Summarize your main findings. Displaying your main findings through visuals can be effective. Emphasize the new contributions to scientific knowledge that your work makes.
Conclusion: Complete the circle by relating your conclusions to the big picture topic in your introduction—and your hook, if possible. It’s important to describe any alternative explanations for your findings. You might also speculate on future directions arising from your research. The slides that comprise your conclusion do not need to state “conclusion”. Rather, the concluding slide title should be a declarative sentence linking back to the big picture problem and your main idea.
It’s important to end well by planning a strong closure to your talk, after which you will thank the audience. Your closing statement should relate to your thesis, perhaps by stating it differently or memorably. Avoid ending awkwardly by memorizing your closing sentence.
By now, you have an outline of the story of your talk, which you can use to plan your slides. Your slides should complement and enhance what you will say. Use the following steps to prepare your slides.
- Write the slide titles to match your talk outline. These should be clear and informative declarative sentences that succinctly give the main idea of the slide (e.g., don’t use “Methods” as a slide title). Have one major idea per slide. In a YouTube talk on designing effective slides , researcher Michael Alley shows examples of instructive slide titles.
- Decide how you will convey the main idea of the slide (e.g., what figures, photographs, equations, statistics, references, or other elements you will need). The body of the slide should support the slide’s main idea.
- Under each slide title, outline what you want to say, in bullet points.
In sum, for each slide, prepare a title that summarizes its major idea, a list of visual elements, and a summary of the points you will make. Ensure each slide connects to your thesis. If it doesn’t, then you don’t need the slide.
Slides for scientific presentations have three major components: text (including labels and legends), graphics, and equations. Here, we give tips on how to present each of these components.
- Have an informative title slide. Include the names of all coauthors and their affiliations. Include an attractive image relating to your study.
- Make the foreground content of your slides “pop” by using an appropriate background. Slides that have white backgrounds with black text work well for small rooms, whereas slides with black backgrounds and white text are suitable for large rooms.
- The layout of your slides should be simple. Pay attention to how and where you lay the visual and text elements on each slide. It’s tempting to cram information, but you need lots of empty space. Retain space at the sides and bottom of your slides.
- Use sans serif fonts with a font size of at least 20 for text, and up to 40 for slide titles. Citations can be in 14 font and should be included at the bottom of the slide.
- Use bold or italics to emphasize words, not underlines or caps. Keep these effects to a minimum.
- Use concise text . You don’t need full sentences. Convey the essence of your message in as few words as possible. Write down what you’d like to say, and then shorten it for the slide. Remove unnecessary filler words.
- Text blocks should be limited to two lines. This will prevent you from crowding too much information on the slide.
- Include names of technical terms in your talk slides, especially if they are not familiar to everyone in the audience.
- Proofread your slides. Typos and grammatical errors are distracting for your audience.
- Include citations for the hypotheses or observations of other scientists.
- Good figures and graphics are essential to sustain audience interest. Use graphics and photographs to show the experiment or study system in action and to explain abstract concepts.
- Don’t use figures straight from your paper as they may be too detailed for your talk, and details like axes may be too small. Make new versions if necessary. Make them large enough to be visible from the back of the room.
- Use graphs to show your results, not tables. Tables are difficult for your audience to digest! If you must present a table, keep it simple.
- Label the axes of graphs and indicate the units. Label important components of graphics and photographs and include captions. Include sources for graphics that are not your own.
- Explain all the elements of a graph. This includes the axes, what the colors and markers mean, and patterns in the data.
- Use colors in figures and text in a meaningful, not random, way. For example, contrasting colors can be effective for pointing out comparisons and/or differences. Don’t use neon colors or pastels.
- Use thick lines in figures, and use color to create contrasts in the figures you present. Don’t use red/green or red/blue combinations, as color-blind audience members can’t distinguish between them.
- Arrows or circles can be effective for drawing attention to key details in graphs and equations. Add some text annotations along with them.
- Write your summary and conclusion slides using graphics, rather than showing a slide with a list of bullet points. Showing some of your results again can be helpful to remind the audience of your message.
- If your talk has equations, take time to explain them. Include text boxes to explain variables and mathematical terms, and put them under each term in the equation.
- Combine equations with a graphic that shows the scientific principle, or include a diagram of the mathematical model.
- Use animations judiciously. They are helpful to reveal complex ideas gradually, for example, if you need to make a comparison or contrast or to build a complicated argument or figure. For lists, reveal one bullet point at a time. New ideas appearing sequentially will help your audience follow your logic.
- Slide transitions should be simple. Silly ones distract from your message.
- Decide how you will make the transition as you move from one section of your talk to the next. For example, if you spend time talking through details, provide a summary afterward, especially in a long talk. Another common tactic is to have a “home slide” that you return to multiple times during the talk that reinforces your main idea or message. In her YouTube talk on designing effective scientific presentations , Stanford biologist Susan McConnell suggests using the approach of home slides to build a cohesive narrative.
To deliver a polished presentation, it is essential to practice it. Here are some tips.
- For your first run-through, practice alone. Pay attention to your narrative. Does your story flow naturally? Do you know how you will start and end? Are there any awkward transitions? Do animations help you tell your story? Do your slides help to convey what you are saying or are they missing components?
- Next, practice in front of your advisor, and/or your peers (e.g., your lab group). Ask someone to time your talk. Take note of their feedback and the questions that they ask you (you might be asked similar questions during your real talk).
- Edit your talk, taking into account the feedback you’ve received. Eliminate superfluous slides that don’t contribute to your takeaway message.
- Practice as many times as needed to memorize the order of your slides and the key transition points of your talk. However, don’t try to learn your talk word for word. Instead, memorize opening and closing statements, and sentences at key junctures in the presentation. Your presentation should resemble a serious but spontaneous conversation with the audience.
- Practicing multiple times also helps you hone the delivery of your talk. While rehearsing, pay attention to your vocal intonations and speed. Make sure to take pauses while you speak, and make eye contact with your imaginary audience.
- Make sure your talk finishes within the allotted time, and remember to leave time for questions. Conferences are particularly strict on run time.
- Anticipate questions and challenges from the audience, and clarify ambiguities within your slides and/or speech in response.
- If you anticipate that you could be asked questions about details but you don’t have time to include them, or they detract from the main message of your talk, you can prepare slides that address these questions and place them after the final slide of your talk.
➡️ More tips for giving scientific presentations
An organized presentation with a clear narrative will help you communicate your ideas effectively, which is essential for engaging your audience and conveying the importance of your work. Taking time to plan and outline your scientific presentation before writing the slides will help you manage your nerves and feel more confident during the presentation, which will improve your overall performance.
A good scientific presentation has an engaging scientific narrative with a memorable take-home message. It has clear, informative slides that enhance what the speaker says. You need to practice your talk many times to ensure you deliver a polished presentation.
First, consider who will attend your presentation, and what you want the audience to learn about your research. Tailor your content to their level of knowledge and interests. Second, create an outline for your presentation, including the key points you want to make and the evidence you will use to support those points. Finally, practice your presentation several times to ensure that it flows smoothly and that you are comfortable with the material.
Prepare an opening that immediately gets the audience’s attention. A common device is a why or a how question, or a statement of a major open problem in your field, but you could also start with a quote, interesting statistic, or case study from your field.
Scientific presentations typically either focus on a single study (e.g., a 15-minute conference presentation) or tell the story of multiple studies (e.g., a PhD defense or 50-minute conference keynote talk). For a single study talk, the structure follows the scientific paper format: Introduction, Methods, Results, Summary, and Conclusion, whereas the format of a talk discussing multiple studies is more complex, but a theme unifies the studies.
Ensure you have one major idea per slide, and convey that idea clearly (through images, equations, statistics, citations, video, etc.). The slide should include a title that summarizes the major point of the slide, should not contain too much text or too many graphics, and color should be used meaningfully.

Search the site
- Get updates

Highlights and images for 9 May 2024
UN Headquarters, New York
- Negotiations
- UN Forum on Forests – UNFF
19th Session of the UNFF

Top officials discussed the importance of forests in combatting climate change, biodiversity loss, land degradation, and otherwise helping achieve the Sustainable Development Goals in an all-day High-Level Segment (HLS). Meanwhile negotiators continued to toil unsuccessfully behind closed doors to finalize texts of the High-Level Declaration in time for it to be endorsed by the top officials at the end of Thursday, and the omnibus resolution due to be adopted by the 19th session of the UN Forum on Forests (UNFF19) on Friday. The declaration is intended to signal high-level commitment to forests going forward, while the resolution would set the mandate for specific future actions by the UNFF and its stakeholders.
Want to dig deeper? Read the full Earth Negotiations Bulletin daily report.
UNFF19 Chair Zéphyrin Maniratanga tried to set the tone for the HLS with a call to action on behalf of forests, particularly to halt and turn back deforestation, stating that "deforestation is not just a crime against nature, it's a betrayal of our collective future." All of the speakers who provided opening remarks urged the HLS to adopt an action-oriented declaration that can guide future forest policy, with UN Under-Secretary-General Li Junhua and UN Economic and Social Council Vice President Ivan Šimonović both urging adoption of a declaration that provides inspiration for the ongoing negotiations on a “Pact for the Future” which is expected to be adopted at the UN’s Summit of the Future in September.

Qu Dongyu , Director-General of the Food and Agriculture Organization of the UN (FAO)
Qu Dongyu, Director-General of the UN FAO, in his role as Chair of the Collaborative Partnership on Forests (CPF), cautioned that while progress has been made since the UN Strategic Plan on Forests was adopted, only six years remain for the Plan to realize the ambitious goal of increasing forest cover by 3% by 2030. He called on UNFF to work together with CPF to produce tangible outcomes by 2030.

Dennis Francis , 78th President of the General Assembly

ECOSOC Vice President Ivan Šimonović

UNFF19 Vice-Chair Ismael Belen (Türkiye), and Ziad Mahmassani , United Nations Forum on Forests

Li Junhua , UN Under-Secretary-General for Economic and Social Affairs
After opening remarks, a high-level “roundtable” was held on the theme of “Forest-based solutions to the triple planetary crises: A focus on people, science, technology, and finance,” wherein Ministers and others in the room made brief statements in response to guiding questions posed by the moderators.

Zhimin Wu , Director, Forestry Division, Food and Agriculture Organization of the UN, and Aurélie Flora Koumba-Pambo , Gabon
In the afternoon a “dialogue” was held on the theme “Achieving globally agreed goals on forests, climate change, and biodiversity.” It featured brief statements by representatives of several CPF member organizations, as well as a Brazilian Supreme Court judge and representatives of Major Groups, the International Sustainable Forest Coalition, and the Asian Forest Cooperation Organization. Member States then made a series of brief interventions.

The informal group tackling the draft declaration met in the morning in parallel to the HLS and again in the afternoon after the HLS finished. The group was unable to finalize the text in time for adoption on Thursday. Some issues still in contention are the insufficiency of financial resources, the need for predictable resources, and whether technology transfer must be voluntary. Deliberations will continue on Friday morning.

UNFF 19 Vice-Chair Javad Momeni (Iran), and Ziad Mahmassani , UNFF Secretariat
For its part, the informal group working on the omnibus resolution met before the HLS in the early morning to try to break logjams on issues such as new and additional financial resources for forests, gender, resources for the UNFF Secretariat, linkages to other environmental agreements and the Sustainable Development Goals (SDGs), and the use of unilateral coercive measures. The group will meet again on Friday morning in hopes of finalizing the resolution for adoption by the Forum plenary on Friday afternoon.

High Level Segment

Barna Tánczos , Minister of Environment, Water, and Forests, Romania

Balarabe Abbas Lawal , Minister of Environment, Nigeria

Collin Croa l, Minister of Housing and Water, Guyana

Nik Nazmi Ahmad , Minister of Natural Resources, Environment and Climate Change, Malaysia

Asein Isaev , First Deputy Minister of Foreign Affairs, Kyrgyzstan

Alue Dohong , Deputy Minister of Environment and Forestry, Indonesia

Ève Bazaiba , Deputy Prime Minister and Minister for the Environment, Democratic Republic of the Congo

Vladimir Dmitriev , Federal Forestry Agency, Russian Federation

Carlos Faroppa , Director General Forestal, Uruguay

Khaled Alabdulkader , CEO, National Center for Vegetation Cover and Combating Desertification, Saudi Arabia
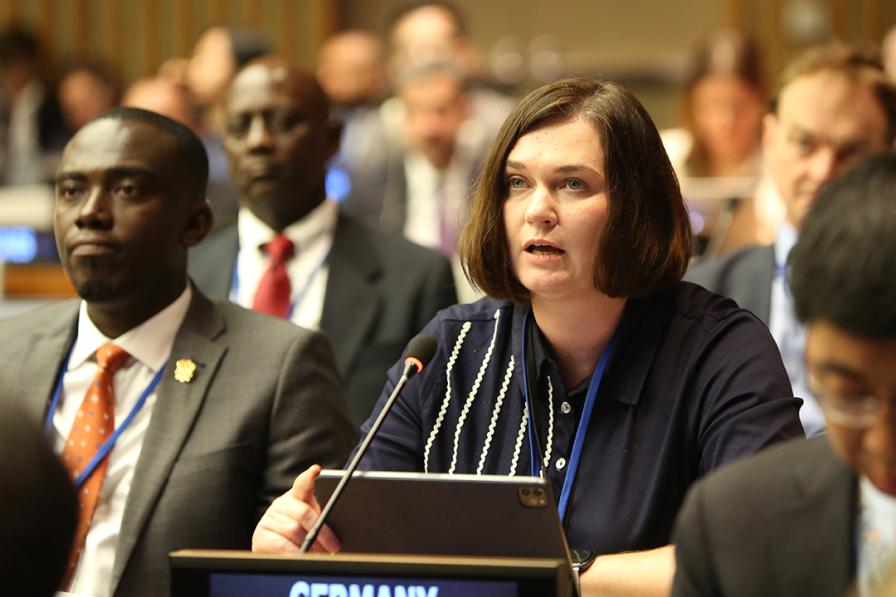
Claudia Müller , Parliamentary State Secretary, Federal Ministry of Food and Agriculture, Germany

Ibrahim Yüzer , Deputy Director, General Directorate of Forestry, Türkiye

Jorge Mario Rodríguez Zúñiga , Costa Rica
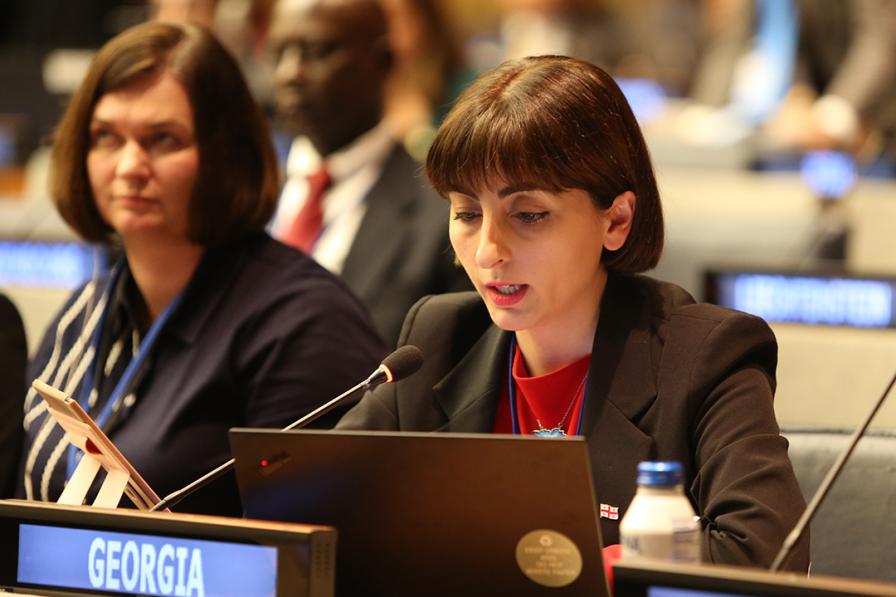
Liana Giorgadze , Georgia
Wenche Westberg , State Secretary, Norway

Maurice Ntossui Allogo , Minister of Water and Forests, Gabon

Nizomiddin Bakirov , Director of the Forestry Agency, Uzbekistan

UNFF19 Chair Zéphyrin Maniratanga (Burundi)
Dialogue with CPF Heads and UNFF partners

John Parrotta , President, International Union of Forest Research Organizations
Ivonne Higuero , Secretary General, Convention on International Trade in Endangered Species of Wild Fauna and Flora, and CPF Vice-Chair
Christian Peter , Global Manager for Environment and Forests, World Bank
Mia Crawford , Forest Director, EU and International Affairs, and Head of Delegation of the World Farmers Organisation to UNFF19

Robert Nasi , Director General, Center for International Forestry Research, and Chief Operating Officer, Center for International Forestry Research-World Agroforestry Centre

Zhimin Wu , Director, Forestry Division, Food and Agriculture Organization of the UN

Sunpil Jin , Vice Executive Director, Asian Forest Cooperation Organization (AFoCO)

David Brand , Convening Chair, International Sustainable Forest Coalition

Sheam Satkuru , ITTO Executive Director

Adriana Rivera-Brusatin , Colombia

Olivier Richard , France
Around the Venue

Related content
Iufro side event at unff19: presentation of report by iufro’s science-policy programme on international forest governance, 66th meeting of the gef council, 59th session of the international tropical timber council.
IMAGES
VIDEO
COMMENTS
1. Pixabay . Pixabay is a huge repository of images, illustrations, and vector graphics in which you can even find videos and music.. By searching for vectors, you will find illustrations in SVG format, which can be edited later in Illustrator or PowerPoint, to better adapt them to your presentation or poster.. On pixabay you can find vector illustrations in SVG format, so you can modify them.
BioRender has revolutionized the way we draw and communicate our science. Because of the large number of pre-drawn icons and color schemes to choose from, I can create beautiful images that accurately depict our scientific findings in no time. I don't know what I would do without BioRender. My 'circles and square figure' days in PowerPoint are ...
Science Presentation Images. Images 100k Collections 28. ADS. ADS. ADS. Page 1 of 100. Find & Download Free Graphic Resources for Science Presentation. 100,000+ Vectors, Stock Photos & PSD files. Free for commercial use High Quality Images.
Affinity 1.9 is here! Affinity Designer is a high-end vector graphics editing software developed by Serif available for MacOS, Windows as well as for iPads for that added portability. You can access Affinity Designer with a one-off payment of $80 AUD - no subscriptions or anything.
DRAG-AND-DROP. Browse over 50,000 icons and templates from 30+ fields of life science, curated by professional medical illustrators.
Learn more here: How to Use Simplified Science Publishing Content. Download hundreds of science images and templates for PowerPoint, Adobe illustrator, and other vector editing software. This is a specialized database designed for use in scientific illustrations, figures, posters, and graphical abstracts.
Science Clipart Images. Images 100k Collections 23. Exclusive content. Back to school inspiration. ADS. ADS. ADS. Page 1 of 100. Find & Download Free Graphic Resources for Science Clipart. 99,000+ Vectors, Stock Photos & PSD files. Free for commercial use High Quality Images.
Scientific Presentation Images. Images 100k Collections 3. ADS. ADS. ADS. Page 1 of 100. Find & Download Free Graphic Resources for Scientific Presentation. 99,000+ Vectors, Stock Photos & PSD files. Free for commercial use High Quality Images.
512+ Free Scientific Illustrations. Find a free illustration of scientific to use in your next project. Scientific illustration stock images for download. Download stunning royalty-free images about Scientific. Royalty-free No attribution required .
Premium Handwritten Fonts Bundle. View & Download. Available For: Browse 72,741 incredible Scientific vectors, icons, clipart graphics, and backgrounds for royalty-free download from the creative contributors at Vecteezy!
179,430 science icons. Vector icons in SVG, PSD, PNG, EPS and ICON FONT ... photos and PSD Wepik Online design tool Slidesgo Free templates for presentations Storyset Free editable illustrations Videvo Free videos and motion graphics. Tools. API API 14.7M+ icons to enhance your website, app, ...
The software that powers scientific illustration. The web-based tool BioRender has become a staple of biomedical research drawings. By. Jeffrey M. Perkel. Illustration by The Project Twins. Like ...
Find free graphics for the diversity of topics and seasonal occasions. Get big packs of slide clip art for presentations. Use the graphics offline with the desktop app. Choose the style of images, from serious to super playful. Recolor the clip art images in a couple of clicks. Apply the free vectors to any vector editing software.
648 templates. Create a blank Science Presentation. Natural Resources Earth Science Presentation in Brown Green Organic Style. Presentation by Carlee Guzman. Pastel Purple and Blue 3D Illustration STEM Science Education Presentation. Presentation by Letteringbynica.
Browse 160,500+ science clipart stock illustrations and vector graphics available royalty-free, or search for science fair clipart or math clip art to find more great stock images and vector art.
Get professionally designed science and technology clipart for your presentations, marketing, or social media. Quickly create unique clipart with your message. ... Presentation Clipart. Cyber Hacker Clipart: Dark Hooded Jacket & Sunglasses Presentation Clipart. 3D Teacher Turning A Custom Page Clipart - Customizable Mockup
Find & Download the most popular Science Presentation Vectors on Freepik Free for commercial use High Quality Images Made for Creative Projects. #freepik #vector
Download the Data Science Strategies for Marketing presentation for PowerPoint or Google Slides and take your marketing projects to the next level. This template is the perfect ally for your advertising strategies, launch campaigns or report presentations. Customize your content with ease, highlight your ideas and captivate your audience with ...
The Scientific Creative Presentation template can be customized to feature statistic charts, tables, and graphs. You also have the option to edit the text, font, lists, and the layout. With the Scientific Creative Presentation template you can add icons, images, or upload photos to customize the design for a more visual approach.
Below we propose a quick framework for creating a compelling scientific presentation in PowerPoint (+ some helpful templates!). 1. Open with a Research Question. Here's how to start a scientific presentation with ease: share your research question. On the first slide, briefly recap how your thought process went.
Science animation refers to the use of animation to portray, communicate, and explain scientific concepts. They are often used for the purposes of academic teaching, awareness campaigning, as well as for entertainment. We provide two science animation services: 1. Video abstracts Video abstracts are short animated summaries about the main ...
Related Articles. This guide provides a 4-step process for making a good scientific presentation: outlining the scientific narrative, preparing slide outlines, constructing slides, and practicing the talk. We give advice on how to make effective slides, including tips for text, graphics, and equations, and how to use rehearsals of your talk to ...
From folding tiny proteins to unfurling the giant James Webb Space Telescope, Science's graphics team depicts complex science, using techniques ranging from scientific illustration to data visualization to cartography. We accurately and beautifully tell stories in visually engaging ways, attracting audiences and aiding their understanding of scientific frontiers.
Highlights and images Highlights and images for 10 May 2024 en ... IUFRO Side Event at UNFF19: Presentation of Report by IUFRO's Science-Policy Programme on International Forest Governance. A side event organized by the International Union of Forest Research Organizations (IUFRO), held during the 19th session of the United Nations Forum on ...