- Privacy Policy
Buy Me a Coffee
Home » Quantitative Research – Methods, Types and Analysis

Quantitative Research – Methods, Types and Analysis
Table of Contents

Quantitative Research
Quantitative research is a type of research that collects and analyzes numerical data to test hypotheses and answer research questions . This research typically involves a large sample size and uses statistical analysis to make inferences about a population based on the data collected. It often involves the use of surveys, experiments, or other structured data collection methods to gather quantitative data.
Quantitative Research Methods

Quantitative Research Methods are as follows:
Descriptive Research Design
Descriptive research design is used to describe the characteristics of a population or phenomenon being studied. This research method is used to answer the questions of what, where, when, and how. Descriptive research designs use a variety of methods such as observation, case studies, and surveys to collect data. The data is then analyzed using statistical tools to identify patterns and relationships.
Correlational Research Design
Correlational research design is used to investigate the relationship between two or more variables. Researchers use correlational research to determine whether a relationship exists between variables and to what extent they are related. This research method involves collecting data from a sample and analyzing it using statistical tools such as correlation coefficients.
Quasi-experimental Research Design
Quasi-experimental research design is used to investigate cause-and-effect relationships between variables. This research method is similar to experimental research design, but it lacks full control over the independent variable. Researchers use quasi-experimental research designs when it is not feasible or ethical to manipulate the independent variable.
Experimental Research Design
Experimental research design is used to investigate cause-and-effect relationships between variables. This research method involves manipulating the independent variable and observing the effects on the dependent variable. Researchers use experimental research designs to test hypotheses and establish cause-and-effect relationships.
Survey Research
Survey research involves collecting data from a sample of individuals using a standardized questionnaire. This research method is used to gather information on attitudes, beliefs, and behaviors of individuals. Researchers use survey research to collect data quickly and efficiently from a large sample size. Survey research can be conducted through various methods such as online, phone, mail, or in-person interviews.
Quantitative Research Analysis Methods
Here are some commonly used quantitative research analysis methods:
Statistical Analysis
Statistical analysis is the most common quantitative research analysis method. It involves using statistical tools and techniques to analyze the numerical data collected during the research process. Statistical analysis can be used to identify patterns, trends, and relationships between variables, and to test hypotheses and theories.
Regression Analysis
Regression analysis is a statistical technique used to analyze the relationship between one dependent variable and one or more independent variables. Researchers use regression analysis to identify and quantify the impact of independent variables on the dependent variable.
Factor Analysis
Factor analysis is a statistical technique used to identify underlying factors that explain the correlations among a set of variables. Researchers use factor analysis to reduce a large number of variables to a smaller set of factors that capture the most important information.
Structural Equation Modeling
Structural equation modeling is a statistical technique used to test complex relationships between variables. It involves specifying a model that includes both observed and unobserved variables, and then using statistical methods to test the fit of the model to the data.
Time Series Analysis
Time series analysis is a statistical technique used to analyze data that is collected over time. It involves identifying patterns and trends in the data, as well as any seasonal or cyclical variations.
Multilevel Modeling
Multilevel modeling is a statistical technique used to analyze data that is nested within multiple levels. For example, researchers might use multilevel modeling to analyze data that is collected from individuals who are nested within groups, such as students nested within schools.
Applications of Quantitative Research
Quantitative research has many applications across a wide range of fields. Here are some common examples:
- Market Research : Quantitative research is used extensively in market research to understand consumer behavior, preferences, and trends. Researchers use surveys, experiments, and other quantitative methods to collect data that can inform marketing strategies, product development, and pricing decisions.
- Health Research: Quantitative research is used in health research to study the effectiveness of medical treatments, identify risk factors for diseases, and track health outcomes over time. Researchers use statistical methods to analyze data from clinical trials, surveys, and other sources to inform medical practice and policy.
- Social Science Research: Quantitative research is used in social science research to study human behavior, attitudes, and social structures. Researchers use surveys, experiments, and other quantitative methods to collect data that can inform social policies, educational programs, and community interventions.
- Education Research: Quantitative research is used in education research to study the effectiveness of teaching methods, assess student learning outcomes, and identify factors that influence student success. Researchers use experimental and quasi-experimental designs, as well as surveys and other quantitative methods, to collect and analyze data.
- Environmental Research: Quantitative research is used in environmental research to study the impact of human activities on the environment, assess the effectiveness of conservation strategies, and identify ways to reduce environmental risks. Researchers use statistical methods to analyze data from field studies, experiments, and other sources.
Characteristics of Quantitative Research
Here are some key characteristics of quantitative research:
- Numerical data : Quantitative research involves collecting numerical data through standardized methods such as surveys, experiments, and observational studies. This data is analyzed using statistical methods to identify patterns and relationships.
- Large sample size: Quantitative research often involves collecting data from a large sample of individuals or groups in order to increase the reliability and generalizability of the findings.
- Objective approach: Quantitative research aims to be objective and impartial in its approach, focusing on the collection and analysis of data rather than personal beliefs, opinions, or experiences.
- Control over variables: Quantitative research often involves manipulating variables to test hypotheses and establish cause-and-effect relationships. Researchers aim to control for extraneous variables that may impact the results.
- Replicable : Quantitative research aims to be replicable, meaning that other researchers should be able to conduct similar studies and obtain similar results using the same methods.
- Statistical analysis: Quantitative research involves using statistical tools and techniques to analyze the numerical data collected during the research process. Statistical analysis allows researchers to identify patterns, trends, and relationships between variables, and to test hypotheses and theories.
- Generalizability: Quantitative research aims to produce findings that can be generalized to larger populations beyond the specific sample studied. This is achieved through the use of random sampling methods and statistical inference.
Examples of Quantitative Research
Here are some examples of quantitative research in different fields:
- Market Research: A company conducts a survey of 1000 consumers to determine their brand awareness and preferences. The data is analyzed using statistical methods to identify trends and patterns that can inform marketing strategies.
- Health Research : A researcher conducts a randomized controlled trial to test the effectiveness of a new drug for treating a particular medical condition. The study involves collecting data from a large sample of patients and analyzing the results using statistical methods.
- Social Science Research : A sociologist conducts a survey of 500 people to study attitudes toward immigration in a particular country. The data is analyzed using statistical methods to identify factors that influence these attitudes.
- Education Research: A researcher conducts an experiment to compare the effectiveness of two different teaching methods for improving student learning outcomes. The study involves randomly assigning students to different groups and collecting data on their performance on standardized tests.
- Environmental Research : A team of researchers conduct a study to investigate the impact of climate change on the distribution and abundance of a particular species of plant or animal. The study involves collecting data on environmental factors and population sizes over time and analyzing the results using statistical methods.
- Psychology : A researcher conducts a survey of 500 college students to investigate the relationship between social media use and mental health. The data is analyzed using statistical methods to identify correlations and potential causal relationships.
- Political Science: A team of researchers conducts a study to investigate voter behavior during an election. They use survey methods to collect data on voting patterns, demographics, and political attitudes, and analyze the results using statistical methods.
How to Conduct Quantitative Research
Here is a general overview of how to conduct quantitative research:
- Develop a research question: The first step in conducting quantitative research is to develop a clear and specific research question. This question should be based on a gap in existing knowledge, and should be answerable using quantitative methods.
- Develop a research design: Once you have a research question, you will need to develop a research design. This involves deciding on the appropriate methods to collect data, such as surveys, experiments, or observational studies. You will also need to determine the appropriate sample size, data collection instruments, and data analysis techniques.
- Collect data: The next step is to collect data. This may involve administering surveys or questionnaires, conducting experiments, or gathering data from existing sources. It is important to use standardized methods to ensure that the data is reliable and valid.
- Analyze data : Once the data has been collected, it is time to analyze it. This involves using statistical methods to identify patterns, trends, and relationships between variables. Common statistical techniques include correlation analysis, regression analysis, and hypothesis testing.
- Interpret results: After analyzing the data, you will need to interpret the results. This involves identifying the key findings, determining their significance, and drawing conclusions based on the data.
- Communicate findings: Finally, you will need to communicate your findings. This may involve writing a research report, presenting at a conference, or publishing in a peer-reviewed journal. It is important to clearly communicate the research question, methods, results, and conclusions to ensure that others can understand and replicate your research.
When to use Quantitative Research
Here are some situations when quantitative research can be appropriate:
- To test a hypothesis: Quantitative research is often used to test a hypothesis or a theory. It involves collecting numerical data and using statistical analysis to determine if the data supports or refutes the hypothesis.
- To generalize findings: If you want to generalize the findings of your study to a larger population, quantitative research can be useful. This is because it allows you to collect numerical data from a representative sample of the population and use statistical analysis to make inferences about the population as a whole.
- To measure relationships between variables: If you want to measure the relationship between two or more variables, such as the relationship between age and income, or between education level and job satisfaction, quantitative research can be useful. It allows you to collect numerical data on both variables and use statistical analysis to determine the strength and direction of the relationship.
- To identify patterns or trends: Quantitative research can be useful for identifying patterns or trends in data. For example, you can use quantitative research to identify trends in consumer behavior or to identify patterns in stock market data.
- To quantify attitudes or opinions : If you want to measure attitudes or opinions on a particular topic, quantitative research can be useful. It allows you to collect numerical data using surveys or questionnaires and analyze the data using statistical methods to determine the prevalence of certain attitudes or opinions.
Purpose of Quantitative Research
The purpose of quantitative research is to systematically investigate and measure the relationships between variables or phenomena using numerical data and statistical analysis. The main objectives of quantitative research include:
- Description : To provide a detailed and accurate description of a particular phenomenon or population.
- Explanation : To explain the reasons for the occurrence of a particular phenomenon, such as identifying the factors that influence a behavior or attitude.
- Prediction : To predict future trends or behaviors based on past patterns and relationships between variables.
- Control : To identify the best strategies for controlling or influencing a particular outcome or behavior.
Quantitative research is used in many different fields, including social sciences, business, engineering, and health sciences. It can be used to investigate a wide range of phenomena, from human behavior and attitudes to physical and biological processes. The purpose of quantitative research is to provide reliable and valid data that can be used to inform decision-making and improve understanding of the world around us.
Advantages of Quantitative Research
There are several advantages of quantitative research, including:
- Objectivity : Quantitative research is based on objective data and statistical analysis, which reduces the potential for bias or subjectivity in the research process.
- Reproducibility : Because quantitative research involves standardized methods and measurements, it is more likely to be reproducible and reliable.
- Generalizability : Quantitative research allows for generalizations to be made about a population based on a representative sample, which can inform decision-making and policy development.
- Precision : Quantitative research allows for precise measurement and analysis of data, which can provide a more accurate understanding of phenomena and relationships between variables.
- Efficiency : Quantitative research can be conducted relatively quickly and efficiently, especially when compared to qualitative research, which may involve lengthy data collection and analysis.
- Large sample sizes : Quantitative research can accommodate large sample sizes, which can increase the representativeness and generalizability of the results.
Limitations of Quantitative Research
There are several limitations of quantitative research, including:
- Limited understanding of context: Quantitative research typically focuses on numerical data and statistical analysis, which may not provide a comprehensive understanding of the context or underlying factors that influence a phenomenon.
- Simplification of complex phenomena: Quantitative research often involves simplifying complex phenomena into measurable variables, which may not capture the full complexity of the phenomenon being studied.
- Potential for researcher bias: Although quantitative research aims to be objective, there is still the potential for researcher bias in areas such as sampling, data collection, and data analysis.
- Limited ability to explore new ideas: Quantitative research is often based on pre-determined research questions and hypotheses, which may limit the ability to explore new ideas or unexpected findings.
- Limited ability to capture subjective experiences : Quantitative research is typically focused on objective data and may not capture the subjective experiences of individuals or groups being studied.
- Ethical concerns : Quantitative research may raise ethical concerns, such as invasion of privacy or the potential for harm to participants.
About the author

Muhammad Hassan
Researcher, Academic Writer, Web developer
You may also like

Questionnaire – Definition, Types, and Examples

Case Study – Methods, Examples and Guide

Observational Research – Methods and Guide

Qualitative Research Methods

Explanatory Research – Types, Methods, Guide

Survey Research – Types, Methods, Examples
Have a language expert improve your writing
Run a free plagiarism check in 10 minutes, automatically generate references for free.
- Knowledge Base
- Methodology
- What Is Quantitative Research? | Definition & Methods
What Is Quantitative Research? | Definition & Methods
Published on 4 April 2022 by Pritha Bhandari . Revised on 10 October 2022.
Quantitative research is the process of collecting and analysing numerical data. It can be used to find patterns and averages, make predictions, test causal relationships, and generalise results to wider populations.
Quantitative research is the opposite of qualitative research , which involves collecting and analysing non-numerical data (e.g. text, video, or audio).
Quantitative research is widely used in the natural and social sciences: biology, chemistry, psychology, economics, sociology, marketing, etc.
- What is the demographic makeup of Singapore in 2020?
- How has the average temperature changed globally over the last century?
- Does environmental pollution affect the prevalence of honey bees?
- Does working from home increase productivity for people with long commutes?
Table of contents
Quantitative research methods, quantitative data analysis, advantages of quantitative research, disadvantages of quantitative research, frequently asked questions about quantitative research.
You can use quantitative research methods for descriptive, correlational or experimental research.
- In descriptive research , you simply seek an overall summary of your study variables.
- In correlational research , you investigate relationships between your study variables.
- In experimental research , you systematically examine whether there is a cause-and-effect relationship between variables.
Correlational and experimental research can both be used to formally test hypotheses , or predictions, using statistics. The results may be generalised to broader populations based on the sampling method used.
To collect quantitative data, you will often need to use operational definitions that translate abstract concepts (e.g., mood) into observable and quantifiable measures (e.g., self-ratings of feelings and energy levels).
Prevent plagiarism, run a free check.
Once data is collected, you may need to process it before it can be analysed. For example, survey and test data may need to be transformed from words to numbers. Then, you can use statistical analysis to answer your research questions .
Descriptive statistics will give you a summary of your data and include measures of averages and variability. You can also use graphs, scatter plots and frequency tables to visualise your data and check for any trends or outliers.
Using inferential statistics , you can make predictions or generalisations based on your data. You can test your hypothesis or use your sample data to estimate the population parameter .
You can also assess the reliability and validity of your data collection methods to indicate how consistently and accurately your methods actually measured what you wanted them to.
Quantitative research is often used to standardise data collection and generalise findings . Strengths of this approach include:
- Replication
Repeating the study is possible because of standardised data collection protocols and tangible definitions of abstract concepts.
- Direct comparisons of results
The study can be reproduced in other cultural settings, times or with different groups of participants. Results can be compared statistically.
- Large samples
Data from large samples can be processed and analysed using reliable and consistent procedures through quantitative data analysis.
- Hypothesis testing
Using formalised and established hypothesis testing procedures means that you have to carefully consider and report your research variables, predictions, data collection and testing methods before coming to a conclusion.
Despite the benefits of quantitative research, it is sometimes inadequate in explaining complex research topics. Its limitations include:
- Superficiality
Using precise and restrictive operational definitions may inadequately represent complex concepts. For example, the concept of mood may be represented with just a number in quantitative research, but explained with elaboration in qualitative research.
- Narrow focus
Predetermined variables and measurement procedures can mean that you ignore other relevant observations.
- Structural bias
Despite standardised procedures, structural biases can still affect quantitative research. Missing data , imprecise measurements or inappropriate sampling methods are biases that can lead to the wrong conclusions.
- Lack of context
Quantitative research often uses unnatural settings like laboratories or fails to consider historical and cultural contexts that may affect data collection and results.
Quantitative research deals with numbers and statistics, while qualitative research deals with words and meanings.
Quantitative methods allow you to test a hypothesis by systematically collecting and analysing data, while qualitative methods allow you to explore ideas and experiences in depth.
In mixed methods research , you use both qualitative and quantitative data collection and analysis methods to answer your research question .
Data collection is the systematic process by which observations or measurements are gathered in research. It is used in many different contexts by academics, governments, businesses, and other organisations.
Operationalisation means turning abstract conceptual ideas into measurable observations.
For example, the concept of social anxiety isn’t directly observable, but it can be operationally defined in terms of self-rating scores, behavioural avoidance of crowded places, or physical anxiety symptoms in social situations.
Before collecting data , it’s important to consider how you will operationalise the variables that you want to measure.
Reliability and validity are both about how well a method measures something:
- Reliability refers to the consistency of a measure (whether the results can be reproduced under the same conditions).
- Validity refers to the accuracy of a measure (whether the results really do represent what they are supposed to measure).
If you are doing experimental research , you also have to consider the internal and external validity of your experiment.
Hypothesis testing is a formal procedure for investigating our ideas about the world using statistics. It is used by scientists to test specific predictions, called hypotheses , by calculating how likely it is that a pattern or relationship between variables could have arisen by chance.
Cite this Scribbr article
If you want to cite this source, you can copy and paste the citation or click the ‘Cite this Scribbr article’ button to automatically add the citation to our free Reference Generator.
Bhandari, P. (2022, October 10). What Is Quantitative Research? | Definition & Methods. Scribbr. Retrieved 15 April 2024, from https://www.scribbr.co.uk/research-methods/introduction-to-quantitative-research/
Is this article helpful?

Pritha Bhandari
Quantitative Data Analysis 101
The lingo, methods and techniques, explained simply.
By: Derek Jansen (MBA) and Kerryn Warren (PhD) | December 2020
Quantitative data analysis is one of those things that often strikes fear in students. It’s totally understandable – quantitative analysis is a complex topic, full of daunting lingo , like medians, modes, correlation and regression. Suddenly we’re all wishing we’d paid a little more attention in math class…
The good news is that while quantitative data analysis is a mammoth topic, gaining a working understanding of the basics isn’t that hard , even for those of us who avoid numbers and math . In this post, we’ll break quantitative analysis down into simple , bite-sized chunks so you can approach your research with confidence.

Overview: Quantitative Data Analysis 101
- What (exactly) is quantitative data analysis?
- When to use quantitative analysis
- How quantitative analysis works
The two “branches” of quantitative analysis
- Descriptive statistics 101
- Inferential statistics 101
- How to choose the right quantitative methods
- Recap & summary
What is quantitative data analysis?
Despite being a mouthful, quantitative data analysis simply means analysing data that is numbers-based – or data that can be easily “converted” into numbers without losing any meaning.
For example, category-based variables like gender, ethnicity, or native language could all be “converted” into numbers without losing meaning – for example, English could equal 1, French 2, etc.
This contrasts against qualitative data analysis, where the focus is on words, phrases and expressions that can’t be reduced to numbers. If you’re interested in learning about qualitative analysis, check out our post and video here .
What is quantitative analysis used for?
Quantitative analysis is generally used for three purposes.
- Firstly, it’s used to measure differences between groups . For example, the popularity of different clothing colours or brands.
- Secondly, it’s used to assess relationships between variables . For example, the relationship between weather temperature and voter turnout.
- And third, it’s used to test hypotheses in a scientifically rigorous way. For example, a hypothesis about the impact of a certain vaccine.
Again, this contrasts with qualitative analysis , which can be used to analyse people’s perceptions and feelings about an event or situation. In other words, things that can’t be reduced to numbers.
How does quantitative analysis work?
Well, since quantitative data analysis is all about analysing numbers , it’s no surprise that it involves statistics . Statistical analysis methods form the engine that powers quantitative analysis, and these methods can vary from pretty basic calculations (for example, averages and medians) to more sophisticated analyses (for example, correlations and regressions).
Sounds like gibberish? Don’t worry. We’ll explain all of that in this post. Importantly, you don’t need to be a statistician or math wiz to pull off a good quantitative analysis. We’ll break down all the technical mumbo jumbo in this post.
Need a helping hand?
As I mentioned, quantitative analysis is powered by statistical analysis methods . There are two main “branches” of statistical methods that are used – descriptive statistics and inferential statistics . In your research, you might only use descriptive statistics, or you might use a mix of both , depending on what you’re trying to figure out. In other words, depending on your research questions, aims and objectives . I’ll explain how to choose your methods later.
So, what are descriptive and inferential statistics?
Well, before I can explain that, we need to take a quick detour to explain some lingo. To understand the difference between these two branches of statistics, you need to understand two important words. These words are population and sample .
First up, population . In statistics, the population is the entire group of people (or animals or organisations or whatever) that you’re interested in researching. For example, if you were interested in researching Tesla owners in the US, then the population would be all Tesla owners in the US.
However, it’s extremely unlikely that you’re going to be able to interview or survey every single Tesla owner in the US. Realistically, you’ll likely only get access to a few hundred, or maybe a few thousand owners using an online survey. This smaller group of accessible people whose data you actually collect is called your sample .
So, to recap – the population is the entire group of people you’re interested in, and the sample is the subset of the population that you can actually get access to. In other words, the population is the full chocolate cake , whereas the sample is a slice of that cake.
So, why is this sample-population thing important?
Well, descriptive statistics focus on describing the sample , while inferential statistics aim to make predictions about the population, based on the findings within the sample. In other words, we use one group of statistical methods – descriptive statistics – to investigate the slice of cake, and another group of methods – inferential statistics – to draw conclusions about the entire cake. There I go with the cake analogy again…
With that out the way, let’s take a closer look at each of these branches in more detail.

Branch 1: Descriptive Statistics
Descriptive statistics serve a simple but critically important role in your research – to describe your data set – hence the name. In other words, they help you understand the details of your sample . Unlike inferential statistics (which we’ll get to soon), descriptive statistics don’t aim to make inferences or predictions about the entire population – they’re purely interested in the details of your specific sample .
When you’re writing up your analysis, descriptive statistics are the first set of stats you’ll cover, before moving on to inferential statistics. But, that said, depending on your research objectives and research questions , they may be the only type of statistics you use. We’ll explore that a little later.
So, what kind of statistics are usually covered in this section?
Some common statistical tests used in this branch include the following:
- Mean – this is simply the mathematical average of a range of numbers.
- Median – this is the midpoint in a range of numbers when the numbers are arranged in numerical order. If the data set makes up an odd number, then the median is the number right in the middle of the set. If the data set makes up an even number, then the median is the midpoint between the two middle numbers.
- Mode – this is simply the most commonly occurring number in the data set.
- In cases where most of the numbers are quite close to the average, the standard deviation will be relatively low.
- Conversely, in cases where the numbers are scattered all over the place, the standard deviation will be relatively high.
- Skewness . As the name suggests, skewness indicates how symmetrical a range of numbers is. In other words, do they tend to cluster into a smooth bell curve shape in the middle of the graph, or do they skew to the left or right?
Feeling a bit confused? Let’s look at a practical example using a small data set.

On the left-hand side is the data set. This details the bodyweight of a sample of 10 people. On the right-hand side, we have the descriptive statistics. Let’s take a look at each of them.
First, we can see that the mean weight is 72.4 kilograms. In other words, the average weight across the sample is 72.4 kilograms. Straightforward.
Next, we can see that the median is very similar to the mean (the average). This suggests that this data set has a reasonably symmetrical distribution (in other words, a relatively smooth, centred distribution of weights, clustered towards the centre).
In terms of the mode , there is no mode in this data set. This is because each number is present only once and so there cannot be a “most common number”. If there were two people who were both 65 kilograms, for example, then the mode would be 65.
Next up is the standard deviation . 10.6 indicates that there’s quite a wide spread of numbers. We can see this quite easily by looking at the numbers themselves, which range from 55 to 90, which is quite a stretch from the mean of 72.4.
And lastly, the skewness of -0.2 tells us that the data is very slightly negatively skewed. This makes sense since the mean and the median are slightly different.
As you can see, these descriptive statistics give us some useful insight into the data set. Of course, this is a very small data set (only 10 records), so we can’t read into these statistics too much. Also, keep in mind that this is not a list of all possible descriptive statistics – just the most common ones.
But why do all of these numbers matter?
While these descriptive statistics are all fairly basic, they’re important for a few reasons:
- Firstly, they help you get both a macro and micro-level view of your data. In other words, they help you understand both the big picture and the finer details.
- Secondly, they help you spot potential errors in the data – for example, if an average is way higher than you’d expect, or responses to a question are highly varied, this can act as a warning sign that you need to double-check the data.
- And lastly, these descriptive statistics help inform which inferential statistical techniques you can use, as those techniques depend on the skewness (in other words, the symmetry and normality) of the data.
Simply put, descriptive statistics are really important , even though the statistical techniques used are fairly basic. All too often at Grad Coach, we see students skimming over the descriptives in their eagerness to get to the more exciting inferential methods, and then landing up with some very flawed results.
Don’t be a sucker – give your descriptive statistics the love and attention they deserve!

Branch 2: Inferential Statistics
As I mentioned, while descriptive statistics are all about the details of your specific data set – your sample – inferential statistics aim to make inferences about the population . In other words, you’ll use inferential statistics to make predictions about what you’d expect to find in the full population.
What kind of predictions, you ask? Well, there are two common types of predictions that researchers try to make using inferential stats:
- Firstly, predictions about differences between groups – for example, height differences between children grouped by their favourite meal or gender.
- And secondly, relationships between variables – for example, the relationship between body weight and the number of hours a week a person does yoga.
In other words, inferential statistics (when done correctly), allow you to connect the dots and make predictions about what you expect to see in the real world population, based on what you observe in your sample data. For this reason, inferential statistics are used for hypothesis testing – in other words, to test hypotheses that predict changes or differences.

Of course, when you’re working with inferential statistics, the composition of your sample is really important. In other words, if your sample doesn’t accurately represent the population you’re researching, then your findings won’t necessarily be very useful.
For example, if your population of interest is a mix of 50% male and 50% female , but your sample is 80% male , you can’t make inferences about the population based on your sample, since it’s not representative. This area of statistics is called sampling, but we won’t go down that rabbit hole here (it’s a deep one!) – we’ll save that for another post .
What statistics are usually used in this branch?
There are many, many different statistical analysis methods within the inferential branch and it’d be impossible for us to discuss them all here. So we’ll just take a look at some of the most common inferential statistical methods so that you have a solid starting point.
First up are T-Tests . T-tests compare the means (the averages) of two groups of data to assess whether they’re statistically significantly different. In other words, do they have significantly different means, standard deviations and skewness.
This type of testing is very useful for understanding just how similar or different two groups of data are. For example, you might want to compare the mean blood pressure between two groups of people – one that has taken a new medication and one that hasn’t – to assess whether they are significantly different.
Kicking things up a level, we have ANOVA, which stands for “analysis of variance”. This test is similar to a T-test in that it compares the means of various groups, but ANOVA allows you to analyse multiple groups , not just two groups So it’s basically a t-test on steroids…
Next, we have correlation analysis . This type of analysis assesses the relationship between two variables. In other words, if one variable increases, does the other variable also increase, decrease or stay the same. For example, if the average temperature goes up, do average ice creams sales increase too? We’d expect some sort of relationship between these two variables intuitively , but correlation analysis allows us to measure that relationship scientifically .
Lastly, we have regression analysis – this is quite similar to correlation in that it assesses the relationship between variables, but it goes a step further to understand cause and effect between variables, not just whether they move together. In other words, does the one variable actually cause the other one to move, or do they just happen to move together naturally thanks to another force? Just because two variables correlate doesn’t necessarily mean that one causes the other.
Stats overload…
I hear you. To make this all a little more tangible, let’s take a look at an example of a correlation in action.
Here’s a scatter plot demonstrating the correlation (relationship) between weight and height. Intuitively, we’d expect there to be some relationship between these two variables, which is what we see in this scatter plot. In other words, the results tend to cluster together in a diagonal line from bottom left to top right.

As I mentioned, these are are just a handful of inferential techniques – there are many, many more. Importantly, each statistical method has its own assumptions and limitations.
For example, some methods only work with normally distributed (parametric) data, while other methods are designed specifically for non-parametric data. And that’s exactly why descriptive statistics are so important – they’re the first step to knowing which inferential techniques you can and can’t use.

How to choose the right analysis method
To choose the right statistical methods, you need to think about two important factors :
- The type of quantitative data you have (specifically, level of measurement and the shape of the data). And,
- Your research questions and hypotheses
Let’s take a closer look at each of these.
Factor 1 – Data type
The first thing you need to consider is the type of data you’ve collected (or the type of data you will collect). By data types, I’m referring to the four levels of measurement – namely, nominal, ordinal, interval and ratio. If you’re not familiar with this lingo, check out the video below.
Why does this matter?
Well, because different statistical methods and techniques require different types of data. This is one of the “assumptions” I mentioned earlier – every method has its assumptions regarding the type of data.
For example, some techniques work with categorical data (for example, yes/no type questions, or gender or ethnicity), while others work with continuous numerical data (for example, age, weight or income) – and, of course, some work with multiple data types.
If you try to use a statistical method that doesn’t support the data type you have, your results will be largely meaningless . So, make sure that you have a clear understanding of what types of data you’ve collected (or will collect). Once you have this, you can then check which statistical methods would support your data types here .
If you haven’t collected your data yet, you can work in reverse and look at which statistical method would give you the most useful insights, and then design your data collection strategy to collect the correct data types.
Another important factor to consider is the shape of your data . Specifically, does it have a normal distribution (in other words, is it a bell-shaped curve, centred in the middle) or is it very skewed to the left or the right? Again, different statistical techniques work for different shapes of data – some are designed for symmetrical data while others are designed for skewed data.
This is another reminder of why descriptive statistics are so important – they tell you all about the shape of your data.
Factor 2: Your research questions
The next thing you need to consider is your specific research questions, as well as your hypotheses (if you have some). The nature of your research questions and research hypotheses will heavily influence which statistical methods and techniques you should use.
If you’re just interested in understanding the attributes of your sample (as opposed to the entire population), then descriptive statistics are probably all you need. For example, if you just want to assess the means (averages) and medians (centre points) of variables in a group of people.
On the other hand, if you aim to understand differences between groups or relationships between variables and to infer or predict outcomes in the population, then you’ll likely need both descriptive statistics and inferential statistics.
So, it’s really important to get very clear about your research aims and research questions, as well your hypotheses – before you start looking at which statistical techniques to use.
Never shoehorn a specific statistical technique into your research just because you like it or have some experience with it. Your choice of methods must align with all the factors we’ve covered here.
Time to recap…
You’re still with me? That’s impressive. We’ve covered a lot of ground here, so let’s recap on the key points:
- Quantitative data analysis is all about analysing number-based data (which includes categorical and numerical data) using various statistical techniques.
- The two main branches of statistics are descriptive statistics and inferential statistics . Descriptives describe your sample, whereas inferentials make predictions about what you’ll find in the population.
- Common descriptive statistical methods include mean (average), median , standard deviation and skewness .
- Common inferential statistical methods include t-tests , ANOVA , correlation and regression analysis.
- To choose the right statistical methods and techniques, you need to consider the type of data you’re working with , as well as your research questions and hypotheses.

Psst... there’s more!
This post was based on one of our popular Research Bootcamps . If you're working on a research project, you'll definitely want to check this out ...
You Might Also Like:
")
74 Comments

Hi, I have read your article. Such a brilliant post you have created.

Thank you for the feedback. Good luck with your quantitative analysis.

Thank you so much.

Thank you so much. I learnt much well. I love your summaries of the concepts. I had love you to explain how to input data using SPSS

Amazing and simple way of breaking down quantitative methods.

This is beautiful….especially for non-statisticians. I have skimmed through but I wish to read again. and please include me in other articles of the same nature when you do post. I am interested. I am sure, I could easily learn from you and get off the fear that I have had in the past. Thank you sincerely.

Send me every new information you might have.

i need every new information

Thank you for the blog. It is quite informative. Dr Peter Nemaenzhe PhD

It is wonderful. l’ve understood some of the concepts in a more compréhensive manner

Your article is so good! However, I am still a bit lost. I am doing a secondary research on Gun control in the US and increase in crime rates and I am not sure which analysis method I should use?

Based on the given learning points, this is inferential analysis, thus, use ‘t-tests, ANOVA, correlation and regression analysis’

Well explained notes. Am an MPH student and currently working on my thesis proposal, this has really helped me understand some of the things I didn’t know.

I like your page..helpful

wonderful i got my concept crystal clear. thankyou!!

This is really helpful , thank you

Thank you so much this helped

Wonderfully explained

thank u so much, it was so informative

THANKYOU, this was very informative and very helpful

This is great GRADACOACH I am not a statistician but I require more of this in my thesis
Include me in your posts.

This is so great and fully useful. I would like to thank you again and again.

Glad to read this article. I’ve read lot of articles but this article is clear on all concepts. Thanks for sharing.

Thank you so much. This is a very good foundation and intro into quantitative data analysis. Appreciate!

You have a very impressive, simple but concise explanation of data analysis for Quantitative Research here. This is a God-send link for me to appreciate research more. Thank you so much!

Avery good presentation followed by the write up. yes you simplified statistics to make sense even to a layman like me. Thank so much keep it up. The presenter did ell too. i would like more of this for Qualitative and exhaust more of the test example like the Anova.

This is a very helpful article, couldn’t have been clearer. Thank you.

Awesome and phenomenal information.Well done

The video with the accompanying article is super helpful to demystify this topic. Very well done. Thank you so much.

thank you so much, your presentation helped me a lot

I don’t know how should I express that ur article is saviour for me 🥺😍

It is well defined information and thanks for sharing. It helps me a lot in understanding the statistical data.

I gain a lot and thanks for sharing brilliant ideas, so wish to be linked on your email update.

Very helpful and clear .Thank you Gradcoach.

Thank for sharing this article, well organized and information presented are very clear.

VERY INTERESTING AND SUPPORTIVE TO NEW RESEARCHERS LIKE ME. AT LEAST SOME BASICS ABOUT QUANTITATIVE.

An outstanding, well explained and helpful article. This will help me so much with my data analysis for my research project. Thank you!

wow this has just simplified everything i was scared of how i am gonna analyse my data but thanks to you i will be able to do so

simple and constant direction to research. thanks

This is helpful

Great writing!! Comprehensive and very helpful.

Do you provide any assistance for other steps of research methodology like making research problem testing hypothesis report and thesis writing?

Thank you so much for such useful article!

Amazing article. So nicely explained. Wow

Very insightfull. Thanks

I am doing a quality improvement project to determine if the implementation of a protocol will change prescribing habits. Would this be a t-test?

The is a very helpful blog, however, I’m still not sure how to analyze my data collected. I’m doing a research on “Free Education at the University of Guyana”

tnx. fruitful blog!

So I am writing exams and would like to know how do establish which method of data analysis to use from the below research questions: I am a bit lost as to how I determine the data analysis method from the research questions.
Do female employees report higher job satisfaction than male employees with similar job descriptions across the South African telecommunications sector? – I though that maybe Chi Square could be used here. – Is there a gender difference in talented employees’ actual turnover decisions across the South African telecommunications sector? T-tests or Correlation in this one. – Is there a gender difference in the cost of actual turnover decisions across the South African telecommunications sector? T-tests or Correlation in this one. – What practical recommendations can be made to the management of South African telecommunications companies on leveraging gender to mitigate employee turnover decisions?
Your assistance will be appreciated if I could get a response as early as possible tomorrow

This was quite helpful. Thank you so much.

wow I got a lot from this article, thank you very much, keep it up

Thanks for yhe guidance. Can you send me this guidance on my email? To enable offline reading?

Thank you very much, this service is very helpful.

Every novice researcher needs to read this article as it puts things so clear and easy to follow. Its been very helpful.

Wonderful!!!! you explained everything in a way that anyone can learn. Thank you!!

I really enjoyed reading though this. Very easy to follow. Thank you

Many thanks for your useful lecture, I would be really appreciated if you could possibly share with me the PPT of presentation related to Data type?

Thank you very much for sharing, I got much from this article

This is a very informative write-up. Kindly include me in your latest posts.

Very interesting mostly for social scientists

Thank you so much, very helpfull
You’re welcome 🙂

woow, its great, its very informative and well understood because of your way of writing like teaching in front of me in simple languages.

I have been struggling to understand a lot of these concepts. Thank you for the informative piece which is written with outstanding clarity.

very informative article. Easy to understand

Beautiful read, much needed.

Always greet intro and summary. I learn so much from GradCoach

Quite informative. Simple and clear summary.

I thoroughly enjoyed reading your informative and inspiring piece. Your profound insights into this topic truly provide a better understanding of its complexity. I agree with the points you raised, especially when you delved into the specifics of the article. In my opinion, that aspect is often overlooked and deserves further attention.

Absolutely!!! Thank you

Thank you very much for this post. It made me to understand how to do my data analysis.
Submit a Comment Cancel reply
Your email address will not be published. Required fields are marked *
Save my name, email, and website in this browser for the next time I comment.
- Print Friendly

Handbook of Research Methods in Health Social Sciences pp 27–49 Cite as
Quantitative Research
- Leigh A. Wilson 2 , 3
- Reference work entry
- First Online: 13 January 2019
4184 Accesses
4 Citations
Quantitative research methods are concerned with the planning, design, and implementation of strategies to collect and analyze data. Descartes, the seventeenth-century philosopher, suggested that how the results are achieved is often more important than the results themselves, as the journey taken along the research path is a journey of discovery. High-quality quantitative research is characterized by the attention given to the methods and the reliability of the tools used to collect the data. The ability to critique research in a systematic way is an essential component of a health professional’s role in order to deliver high quality, evidence-based healthcare. This chapter is intended to provide a simple overview of the way new researchers and health practitioners can understand and employ quantitative methods. The chapter offers practical, realistic guidance in a learner-friendly way and uses a logical sequence to understand the process of hypothesis development, study design, data collection and handling, and finally data analysis and interpretation.
This is a preview of subscription content, log in via an institution .
Buying options
- Available as PDF
- Read on any device
- Instant download
- Own it forever
- Available as EPUB and PDF
- Durable hardcover edition
- Dispatched in 3 to 5 business days
- Free shipping worldwide - see info
Tax calculation will be finalised at checkout
Purchases are for personal use only
Babbie ER. The practice of social research. 14th ed. Belmont: Wadsworth Cengage; 2016.
Google Scholar
Descartes. Cited in Halverston, W. (1976). In: A concise introduction to philosophy, 3rd ed. New York: Random House; 1637.
Doll R, Hill AB. The mortality of doctors in relation to their smoking habits. BMJ. 1954;328(7455):1529–33. https://doi.org/10.1136/bmj.328.7455.1529 .
Article Google Scholar
Liamputtong P. Research methods in health: foundations for evidence-based practice. 3rd ed. Melbourne: Oxford University Press; 2017.
McNabb DE. Research methods in public administration and nonprofit management: quantitative and qualitative approaches. 2nd ed. New York: Armonk; 2007.
Merriam-Webster. Dictionary. http://www.merriam-webster.com . Accessed 20th December 2017.
Olesen Larsen P, von Ins M. The rate of growth in scientific publication and the decline in coverage provided by Science Citation Index. Scientometrics. 2010;84(3):575–603.
Pannucci CJ, Wilkins EG. Identifying and avoiding bias in research. Plast Reconstr Surg. 2010;126(2):619–25. https://doi.org/10.1097/PRS.0b013e3181de24bc .
Petrie A, Sabin C. Medical statistics at a glance. 2nd ed. London: Blackwell Publishing; 2005.
Portney LG, Watkins MP. Foundations of clinical research: applications to practice. 3rd ed. New Jersey: Pearson Publishing; 2009.
Sheehan J. Aspects of research methodology. Nurse Educ Today. 1986;6:193–203.
Wilson LA, Black DA. Health, science research and research methods. Sydney: McGraw Hill; 2013.
Download references
Author information
Authors and affiliations.
School of Science and Health, Western Sydney University, Penrith, NSW, Australia
Leigh A. Wilson
Faculty of Health Science, Discipline of Behavioural and Social Sciences in Health, University of Sydney, Lidcombe, NSW, Australia
You can also search for this author in PubMed Google Scholar
Corresponding author
Correspondence to Leigh A. Wilson .
Editor information
Editors and affiliations.
Pranee Liamputtong
Rights and permissions
Reprints and permissions
Copyright information
© 2019 Springer Nature Singapore Pte Ltd.
About this entry
Cite this entry.
Wilson, L.A. (2019). Quantitative Research. In: Liamputtong, P. (eds) Handbook of Research Methods in Health Social Sciences. Springer, Singapore. https://doi.org/10.1007/978-981-10-5251-4_54
Download citation
DOI : https://doi.org/10.1007/978-981-10-5251-4_54
Published : 13 January 2019
Publisher Name : Springer, Singapore
Print ISBN : 978-981-10-5250-7
Online ISBN : 978-981-10-5251-4
eBook Packages : Social Sciences Reference Module Humanities and Social Sciences Reference Module Business, Economics and Social Sciences
Share this entry
Anyone you share the following link with will be able to read this content:
Sorry, a shareable link is not currently available for this article.
Provided by the Springer Nature SharedIt content-sharing initiative
- Publish with us
Policies and ethics
- Find a journal
- Track your research
Quantitative Data Analysis: A Comprehensive Guide
By: Ofem Eteng | Published: May 18, 2022
A healthcare giant successfully introduces the most effective drug dosage through rigorous statistical modeling, saving countless lives. A marketing team predicts consumer trends with uncanny accuracy, tailoring campaigns for maximum impact.
Table of Contents
These trends and dosages are not just any numbers but are a result of meticulous quantitative data analysis. Quantitative data analysis offers a robust framework for understanding complex phenomena, evaluating hypotheses, and predicting future outcomes.
In this blog, we’ll walk through the concept of quantitative data analysis, the steps required, its advantages, and the methods and techniques that are used in this analysis. Read on!
What is Quantitative Data Analysis?
Quantitative data analysis is a systematic process of examining, interpreting, and drawing meaningful conclusions from numerical data. It involves the application of statistical methods, mathematical models, and computational techniques to understand patterns, relationships, and trends within datasets.
Quantitative data analysis methods typically work with algorithms, mathematical analysis tools, and software to gain insights from the data, answering questions such as how many, how often, and how much. Data for quantitative data analysis is usually collected from close-ended surveys, questionnaires, polls, etc. The data can also be obtained from sales figures, email click-through rates, number of website visitors, and percentage revenue increase.
Quantitative Data Analysis vs Qualitative Data Analysis
When we talk about data, we directly think about the pattern, the relationship, and the connection between the datasets – analyzing the data in short. Therefore when it comes to data analysis, there are broadly two types – Quantitative Data Analysis and Qualitative Data Analysis.
Quantitative data analysis revolves around numerical data and statistics, which are suitable for functions that can be counted or measured. In contrast, qualitative data analysis includes description and subjective information – for things that can be observed but not measured.
Let us differentiate between Quantitative Data Analysis and Quantitative Data Analysis for a better understanding.
Data Preparation Steps for Quantitative Data Analysis
Quantitative data has to be gathered and cleaned before proceeding to the stage of analyzing it. Below are the steps to prepare a data before quantitative research analysis:
- Step 1: Data Collection
Before beginning the analysis process, you need data. Data can be collected through rigorous quantitative research, which includes methods such as interviews, focus groups, surveys, and questionnaires.
- Step 2: Data Cleaning
Once the data is collected, begin the data cleaning process by scanning through the entire data for duplicates, errors, and omissions. Keep a close eye for outliers (data points that are significantly different from the majority of the dataset) because they can skew your analysis results if they are not removed.
This data-cleaning process ensures data accuracy, consistency and relevancy before analysis.
- Step 3: Data Analysis and Interpretation
Now that you have collected and cleaned your data, it is now time to carry out the quantitative analysis. There are two methods of quantitative data analysis, which we will discuss in the next section.
However, if you have data from multiple sources, collecting and cleaning it can be a cumbersome task. This is where Hevo Data steps in. With Hevo, extracting, transforming, and loading data from source to destination becomes a seamless task, eliminating the need for manual coding. This not only saves valuable time but also enhances the overall efficiency of data analysis and visualization, empowering users to derive insights quickly and with precision
Hevo is the only real-time ELT No-code Data Pipeline platform that cost-effectively automates data pipelines that are flexible to your needs. With integration with 150+ Data Sources (40+ free sources), we help you not only export data from sources & load data to the destinations but also transform & enrich your data, & make it analysis-ready.
Start for free now!
Now that you are familiar with what quantitative data analysis is and how to prepare your data for analysis, the focus will shift to the purpose of this article, which is to describe the methods and techniques of quantitative data analysis.
Methods and Techniques of Quantitative Data Analysis
Quantitative data analysis employs two techniques to extract meaningful insights from datasets, broadly. The first method is descriptive statistics, which summarizes and portrays essential features of a dataset, such as mean, median, and standard deviation.
Inferential statistics, the second method, extrapolates insights and predictions from a sample dataset to make broader inferences about an entire population, such as hypothesis testing and regression analysis.
An in-depth explanation of both the methods is provided below:
- Descriptive Statistics
- Inferential Statistics
1) Descriptive Statistics
Descriptive statistics as the name implies is used to describe a dataset. It helps understand the details of your data by summarizing it and finding patterns from the specific data sample. They provide absolute numbers obtained from a sample but do not necessarily explain the rationale behind the numbers and are mostly used for analyzing single variables. The methods used in descriptive statistics include:
- Mean: This calculates the numerical average of a set of values.
- Median: This is used to get the midpoint of a set of values when the numbers are arranged in numerical order.
- Mode: This is used to find the most commonly occurring value in a dataset.
- Percentage: This is used to express how a value or group of respondents within the data relates to a larger group of respondents.
- Frequency: This indicates the number of times a value is found.
- Range: This shows the highest and lowest values in a dataset.
- Standard Deviation: This is used to indicate how dispersed a range of numbers is, meaning, it shows how close all the numbers are to the mean.
- Skewness: It indicates how symmetrical a range of numbers is, showing if they cluster into a smooth bell curve shape in the middle of the graph or if they skew towards the left or right.
2) Inferential Statistics
In quantitative analysis, the expectation is to turn raw numbers into meaningful insight using numerical values, and descriptive statistics is all about explaining details of a specific dataset using numbers, but it does not explain the motives behind the numbers; hence, a need for further analysis using inferential statistics.
Inferential statistics aim to make predictions or highlight possible outcomes from the analyzed data obtained from descriptive statistics. They are used to generalize results and make predictions between groups, show relationships that exist between multiple variables, and are used for hypothesis testing that predicts changes or differences.
There are various statistical analysis methods used within inferential statistics; a few are discussed below.
- Cross Tabulations: Cross tabulation or crosstab is used to show the relationship that exists between two variables and is often used to compare results by demographic groups. It uses a basic tabular form to draw inferences between different data sets and contains data that is mutually exclusive or has some connection with each other. Crosstabs help understand the nuances of a dataset and factors that may influence a data point.
- Regression Analysis: Regression analysis estimates the relationship between a set of variables. It shows the correlation between a dependent variable (the variable or outcome you want to measure or predict) and any number of independent variables (factors that may impact the dependent variable). Therefore, the purpose of the regression analysis is to estimate how one or more variables might affect a dependent variable to identify trends and patterns to make predictions and forecast possible future trends. There are many types of regression analysis, and the model you choose will be determined by the type of data you have for the dependent variable. The types of regression analysis include linear regression, non-linear regression, binary logistic regression, etc.
- Monte Carlo Simulation: Monte Carlo simulation, also known as the Monte Carlo method, is a computerized technique of generating models of possible outcomes and showing their probability distributions. It considers a range of possible outcomes and then tries to calculate how likely each outcome will occur. Data analysts use it to perform advanced risk analyses to help forecast future events and make decisions accordingly.
- Analysis of Variance (ANOVA): This is used to test the extent to which two or more groups differ from each other. It compares the mean of various groups and allows the analysis of multiple groups.
- Factor Analysis: A large number of variables can be reduced into a smaller number of factors using the factor analysis technique. It works on the principle that multiple separate observable variables correlate with each other because they are all associated with an underlying construct. It helps in reducing large datasets into smaller, more manageable samples.
- Cohort Analysis: Cohort analysis can be defined as a subset of behavioral analytics that operates from data taken from a given dataset. Rather than looking at all users as one unit, cohort analysis breaks down data into related groups for analysis, where these groups or cohorts usually have common characteristics or similarities within a defined period.
- MaxDiff Analysis: This is a quantitative data analysis method that is used to gauge customers’ preferences for purchase and what parameters rank higher than the others in the process.
- Cluster Analysis: Cluster analysis is a technique used to identify structures within a dataset. Cluster analysis aims to be able to sort different data points into groups that are internally similar and externally different; that is, data points within a cluster will look like each other and different from data points in other clusters.
- Time Series Analysis: This is a statistical analytic technique used to identify trends and cycles over time. It is simply the measurement of the same variables at different times, like weekly and monthly email sign-ups, to uncover trends, seasonality, and cyclic patterns. By doing this, the data analyst can forecast how variables of interest may fluctuate in the future.
- SWOT analysis: This is a quantitative data analysis method that assigns numerical values to indicate strengths, weaknesses, opportunities, and threats of an organization, product, or service to show a clearer picture of competition to foster better business strategies
How to Choose the Right Method for your Analysis?
Choosing between Descriptive Statistics or Inferential Statistics can be often confusing. You should consider the following factors before choosing the right method for your quantitative data analysis:
1. Type of Data
The first consideration in data analysis is understanding the type of data you have. Different statistical methods have specific requirements based on these data types, and using the wrong method can render results meaningless. The choice of statistical method should align with the nature and distribution of your data to ensure meaningful and accurate analysis.
2. Your Research Questions
When deciding on statistical methods, it’s crucial to align them with your specific research questions and hypotheses. The nature of your questions will influence whether descriptive statistics alone, which reveal sample attributes, are sufficient or if you need both descriptive and inferential statistics to understand group differences or relationships between variables and make population inferences.
Pros and Cons of Quantitative Data Analysis
1. Objectivity and Generalizability:
- Quantitative data analysis offers objective, numerical measurements, minimizing bias and personal interpretation.
- Results can often be generalized to larger populations, making them applicable to broader contexts.
Example: A study using quantitative data analysis to measure student test scores can objectively compare performance across different schools and demographics, leading to generalizable insights about educational strategies.
2. Precision and Efficiency:
- Statistical methods provide precise numerical results, allowing for accurate comparisons and prediction.
- Large datasets can be analyzed efficiently with the help of computer software, saving time and resources.
Example: A marketing team can use quantitative data analysis to precisely track click-through rates and conversion rates on different ad campaigns, quickly identifying the most effective strategies for maximizing customer engagement.
3. Identification of Patterns and Relationships:
- Statistical techniques reveal hidden patterns and relationships between variables that might not be apparent through observation alone.
- This can lead to new insights and understanding of complex phenomena.
Example: A medical researcher can use quantitative analysis to pinpoint correlations between lifestyle factors and disease risk, aiding in the development of prevention strategies.
1. Limited Scope:
- Quantitative analysis focuses on quantifiable aspects of a phenomenon , potentially overlooking important qualitative nuances, such as emotions, motivations, or cultural contexts.
Example: A survey measuring customer satisfaction with numerical ratings might miss key insights about the underlying reasons for their satisfaction or dissatisfaction, which could be better captured through open-ended feedback.
2. Oversimplification:
- Reducing complex phenomena to numerical data can lead to oversimplification and a loss of richness in understanding.
Example: Analyzing employee productivity solely through quantitative metrics like hours worked or tasks completed might not account for factors like creativity, collaboration, or problem-solving skills, which are crucial for overall performance.
3. Potential for Misinterpretation:
- Statistical results can be misinterpreted if not analyzed carefully and with appropriate expertise.
- The choice of statistical methods and assumptions can significantly influence results.
This blog discusses the steps, methods, and techniques of quantitative data analysis. It also gives insights into the methods of data collection, the type of data one should work with, and the pros and cons of such analysis.
Gain a better understanding of data analysis with these essential reads:
- Data Analysis and Modeling: 4 Critical Differences
- Exploratory Data Analysis Simplified 101
- 25 Best Data Analysis Tools in 2024
Carrying out successful data analysis requires prepping the data and making it analysis-ready. That is where Hevo steps in.
Want to give Hevo a try? Sign Up for a 14-day free trial and experience the feature-rich Hevo suite first hand. You may also have a look at the amazing Hevo price , which will assist you in selecting the best plan for your requirements.
Share your experience of understanding Quantitative Data Analysis in the comment section below! We would love to hear your thoughts.

Ofem is a freelance writer specializing in data-related topics, who has expertise in translating complex concepts. With a focus on data science, analytics, and emerging technologies.
No-code Data Pipeline for your Data Warehouse
- Data Strategy
Get Started with Hevo
Related articles

Preetipadma Khandavilli
Data Mining and Data Analysis: 4 Key Differences

Nicholas Samuel
Data Quality Analysis Simplified: A Comprehensive Guide 101

Sharon Rithika
Data Analysis in Tableau: Unleash the Power of COUNTIF
I want to read this e-book.
What is Quantitative Research? Definition, Examples, Key Advantages, Methods and Best Practices
By Nick Jain
Published on: May 17, 2023

Table of Contents
What is Quantitative Research?
Quantitative research examples, quantitative research: key advantages, quantitative research methodology, 7 best practices to conduct quantitative research.
Quantitative research stands as a powerful research methodology dedicated to the systematic collection and analysis of measurable data. Through rigorous statistical and mathematical techniques, this method extracts insights from structured surveys, controlled experiments, or other defined data-gathering methods.
The primary objective of quantitative research is to measure and quantify variables, relationships, and patterns within the dataset. By testing hypotheses, making predictions, and drawing generalizable conclusions, it plays a crucial role in fields such as psychology, sociology, economics, and education. This approach often involves significant sample sizes, ensuring robust results.
Explore the depth of quantitative research with this comprehensive guide, offering practical examples and applications to demonstrate its real-world impact. Stay updated with the latest trends and developments in quantitative research as we continually refine our insights to provide you with the most relevant and cutting-edge information.
Quantitative Research: Key Characteristics
Below are the key characteristics of quantitative research:
- Objectivity: Quantitative research is grounded in the principles of objectivity and empiricism, which means that the research is focused on observable and measurable phenomena, rather than personal opinions or experiences.
- Structured approach: Quantitative research follows a structured and systematic approach to data collection and analysis, using clearly defined variables, hypotheses, and research questions.
- Numeric data: Quantitative research uses numerical data to describe and analyze the phenomena under study, such as statistical analysis, surveys, and experiments.
- Large sample size: Quantitative research often involves large sample sizes to ensure statistical significance and to generalize findings to a larger population.
- Standardized data collection: Quantitative research typically involves standardized data collection methods, such as surveys or experiments, to minimize potential sources of bias and increase reliability.
- Deductive reasoning: Quantitative research uses deductive reasoning, where the researcher tests a specific hypothesis based on prior knowledge and theory.
- Replication: Quantitative research emphasizes the importance of replication, where other researchers can reproduce the study’s methods and obtain similar results.
- Statistical analysis: Quantitative research involves statistical analysis to analyze the data and test the research hypotheses, often using software programs to assist with data analysis.
- Precision: Quantitative research aims to be precise in its measurement and analysis of data. It seeks to quantify and measure the specific aspects of a phenomenon being studied.
- Generalizability: Quantitative research aims to generalize findings from a sample to a larger population. It seeks to draw conclusions that apply to a broader group beyond the specific sample being studied.
Below are 3 examples of quantitative research:
Example 1: Boosting Employee Performance with Innovative Training Programs
In this quantitative study, we delve into the transformative impact of a cutting-edge training program on employee productivity within corporate environments. Employing a quasi-experimental framework, we meticulously analyze the outcomes of a cohort undergoing innovative training against a control group. Through advanced statistical methodologies, we unveil actionable insights into performance enhancements, arming organizations with data-driven strategies for workforce development and competitive advantage.
Example 2: Unveiling the Power of Physical Exercise on Mental Well-being
Unlocking the correlation between physical exercise and mental health, this quantitative inquiry stands at the forefront of holistic wellness research. Through meticulous data collection and rigorous statistical analyses, we dissect the nuanced relationship between exercise regimens and mental well-being indicators. Our findings not only underscore the profound impact of exercise on psychological resilience but also provide actionable insights for healthcare professionals and individuals striving for optimal mental health.
Example 3: Revolutionizing Education with Innovative Teaching Methodologies
In this groundbreaking study, we embark on a quantitative exploration of the transformative potential of innovative teaching methods on student learning outcomes. Utilizing a quasi-experimental design, we meticulously evaluate the efficacy of novel pedagogical approaches against conventional teaching methodologies. Through rigorous statistical analyses of pre-test and post-test data, we unearth compelling evidence of enhanced academic performance, paving the way for educational institutions to embrace innovation and elevate learning experiences.
Learn more: What is Quantitative Market Research?

The advantages of quantitative research make it a valuable research method in a variety of fields, particularly in fields that require precise measurement and testing of hypotheses.
- Precision: Quantitative research aims to be precise in its measurement and analysis of data. This can increase the accuracy of the results and enable researchers to make more precise predictions.
- Test hypotheses: Quantitative research is well-suited for testing specific hypotheses or research questions, allowing researchers to draw clear conclusions and make predictions based on the data.
- Quantify relationships: Quantitative research enables researchers to quantify and measure relationships between variables, allowing for more precise and quantitative comparisons.
- Efficiency: Quantitative research often involves the use of standardized procedures and data collection methods, which can make the research process more efficient and reduce the amount of time and resources required.
- Easy to compare: Quantitative research often involves the use of standardized measures and scales, which makes it easier to compare results across different studies or populations.
- Ability to detect small effects: Quantitative research is often able to detect small effects that may not be observable through qualitative research methods, due to the use of statistical analysis and large sample sizes.
Quantitative research is a type of research that focuses on collecting and analyzing numerical data to answer research questions. There are two main methods used to conduct quantitative research:
1. Primary Method
There are several methods of primary quantitative research, each with its own strengths and limitations.
Surveys: Surveys are a common method of quantitative research and involve collecting data from a sample of individuals using standardized questionnaires or interviews. Surveys can be conducted in various ways, such as online, by mail, by phone, or in person. Surveys can be used to study attitudes, behaviors, opinions, and demographics.
One of the main advantages of surveys is that they can be conducted on a large scale, making it possible to obtain representative data from a population. However, surveys can suffer from issues such as response bias, where participants may not provide accurate or truthful answers, and nonresponse bias, where certain groups may be less likely to participate in the survey.
Experiments: Experiments involve manipulating one or more variables to determine their effects on an outcome of interest. Experiments can be carried out in controlled laboratory settings or in real-world field environments. Experiments can be used to test causal relationships between variables and to establish cause-and-effect relationships.
One of the main advantages of experiments is that they provide a high level of control over the variables being studied, which can increase the internal validity of the study. However, experiments can suffer from issues such as artificiality, where the experimental setting may not accurately reflect real-world situations, and demand characteristics, where participants may change their behavior due to the experimental setting.
Observational studies: Observational studies involve observing and recording data without manipulating any variables. Observational studies can be conducted in various settings, such as naturalistic environments or controlled laboratory settings. Observational studies can be used to study behaviors, interactions, and phenomena that cannot be manipulated experimentally.
One of the main advantages of observational studies is that they can provide rich and detailed data about real-world phenomena. However, observational studies can suffer from issues such as observer bias, where the observer may interpret the data in a subjective manner, and reactivity, where the presence of the observer may change the behavior being observed.
Content analysis: Content analysis involves analyzing media or communication content, such as text, images, or videos, to identify patterns or trends. Content analysis can be used to study media representations of social issues or to identify patterns in social media data.
One of the main advantages of content analysis is that it can provide insights into the cultural and social values reflected in media content. However, content analysis can suffer from issues such as the subjectivity of the coding process and the potential for errors or bias in the data collection process.
Psychometrics: Psychometrics involves the development and validation of standardized tests or measures, such as personality tests or intelligence tests. Psychometrics can be used to study individual differences in psychological traits and to assess the validity and reliability of psychological measures.
One of the main advantages of psychometrics is that it can provide a standardized and objective way to measure psychological constructs. However, psychometrics can suffer from issues such as the cultural specificity of the measures and the potential for response bias in self-report measures.
2. Secondary Method
Secondary quantitative research methods involve analyzing existing data that was collected for other purposes. This can include data from government records, public opinion polls, or market research studies. Secondary research is often quicker and less expensive than primary research, but it may not provide data that is as specific to the research question.
One of the main advantages of secondary data analysis is that it can be a cost-effective way to obtain large amounts of data. However, secondary data analysis can suffer from issues such as the quality and relevance of the data, and the potential for missing or incomplete data.
Learn more: What is Quantitative Observation?

Here are the key best practices that should be followed when conducting quantitative research:
1. Clearly define the research question: The research question should be specific, measurable, and focused on a clear problem or issue.
2. Use a well-designed research design: The research design should be appropriate for the research question, and should include a clear sampling strategy, data collection methods, and statistical analysis plan.
3. Use validated and reliable instruments: The instruments used to collect data should be validated and reliable to ensure that the data collected is accurate and consistent.
4. Ensure informed consent: Participants should be fully informed about the purpose of the research, their rights, and how their data will be used. Informed consent should be obtained before data collection begins.
5. Minimize bias: Researchers should take steps to minimize bias in all stages of the research process, including study design, data collection, and data analysis.
6. Ensure data security and confidentiality: Data should be kept secure and confidential to protect the privacy of participants and prevent unauthorized access.
7. Use appropriate statistical analysis: Statistical analysis should be appropriate for the research question and the data collected. Accurate and clear reporting of results is imperative in quantitative research.
Learn more: What is Qualitative Research?
Enhance Your Research
Collect feedback and conduct research with IdeaScale’s award-winning software
Elevate Research And Feedback With Your IdeaScale Community!
IdeaScale is an innovation management solution that inspires people to take action on their ideas. Your community’s ideas can change lives, your business and the world. Connect to the ideas that matter and start co-creating the future.
Copyright © 2024 IdeaScale
Privacy Overview
Quantitative Research Methods
- Introduction
- Descriptive and Inferential Statistics
- Hypothesis Testing
- Regression and Correlation
- Time Series
- Meta-Analysis
- Mixed Methods
- Additional Resources
- Get Research Help
Welcome! This guide will help you to find resources about statistical methodologies often used across disciplines. It provides basic descriptions of each statistical methodology and features web content, videos, and books. Please contact a librarian if you need help with quantitative methodology.
Steps in the Quantitative Research Process
1. Become familiar with Research Data Management , which includes best practices for how to collect, store, analyze, preserve and share your data. You might want to consider creating a data management plan.
2. Collect your data . You might have to enter data into a spreadsheet or find data online . Understanding the level of measurement that you need, the variables, and the sample size can be key.
3. Clean your data by handling missing, incorrect, and duplicate values in appropriate ways.
4. Run descriptive statistics . No matter what statistical methodology you'll be employing in your analysis, it's important to run descriptive statistics.
5. Select an inferential statistical method based on your research question and the characteristics of your data. Make sure to keep the descriptive statistics of your data in mind when selecting an inferential method.
7. Run analysis in statistical software such as SAS, SPSS, or R.
8. Interpret your results.
9. If you'd like to share your data with others, possibly by posting it on a repository, please contact a librarian to help you through that process.
Glossary of Key Terms
- Glossary of Statistical Terms UC Berkeley guide.
- Research Methods Glossary Colorado State University guide.
- Next: Descriptive and Inferential Statistics >>
- Last Updated: Aug 18, 2023 11:55 AM
- URL: https://guides.library.duq.edu/quant-methods
Want to create or adapt books like this? Learn more about how Pressbooks supports open publishing practices.
3.6 Quantitative Data Analysis
Remember that quantitative research explains phenomena by collecting numerical data that are analysed using statistics. 1 Statistics is a scientific method of collecting, processing, analysing, presenting and interpreting data in numerical form. 44 This section discusses how quantitative data is analysed and the choice of test statistics based on the variables (data). First, it is important to understand the different types of variables before delving into the statistical tests.
Types of variables
A variable is an item (data) that can be quantified or measured. There are two main types of variables – numerical variables and categorical variables. 45 Numerical variables describe a measurable quantity and are subdivided into two groups – discrete and continuous data. Discrete variables are finite and are based on a set of whole values or numbers such as 0, 1, 2, 3,… (integer). These data cannot be broken into fractions or decimals. 45 Examples of discrete variables include the number of students in a class and the total number of states in Australia. Continuous variables can assume any value between a certain set of real numbers e.g. height and serum glucose levels. In other words, these are variables that are in between points (101.01 to 101.99 is between 101 and 102) and can be broken down into different parts, fractions and decimals. 45
On the other hand, categorical variables are qualitative and describe characteristics or properties of the data. This type of data may be represented by a name, symbol or number code. 46 There are two types- nominal and ordinal variables. Nominal data are variables having two or more categories without any intrinsic order to the categories. 46 For example, the colour of eyes (blue, brown, and black) and gender (male, female) have no specific order and are nominal categorical variables. Ordinal variables are similar to nominal variables with regard to describing characteristics or properties, but these variables have a clear, logical order or rank in the data. 46 The level of education (primary, secondary and tertiary) is an example of ordinal data.
Now that you understand the different types of variables, identify the variables in the scenario in the Padlet below.
Statistics can be broadly classified into descriptive and inferential statistics. Descriptive statistics explain how different variables in a sample or population relate to one another. 60 Inferential statistics draw conclusions or inferences about a whole population from a random sample of data. 45
Descriptive statistics
This is a summary description of measurements (variables) from a given data set, e.g., a group of study participants. It provides a meaningful interpretation of the data. It has two main measures – central tendency and dispersion measures. 45
The measures of central tendency describe the centre of data and provide a summary of data in the form of mean, median and mode. Mean is the average distribution, the median is the middle value (skewed distribution), and mode is the most frequently occurring variable. 4

- Descriptive statistics for continuous variables
An example is a study conducted among 145 students where their height and weight were obtained. The summary statistics (a measure of central tendency and dispersion) have been presented below in table 3.2.
Table 3.2 Descriptive statistics for continuous variables
- Descriptive statistics for categorical variables
Categorical variables are presented using frequencies and percentages or proportions. For example, a hypothetical scenario is a study on smoking history by gender in a population of 4609 people. Below is the summary statistic of the study (Table 3.3).
Table 3.3 Descriptive statistics for categorical variables
Normality of data
Before proceeding to inferential statistics, it is important to assess the normality of the data. A normality test evaluates whether or not a sample was selected from a normally distributed population. 47 It is typically used to determine if the data used in the study has a normal distribution. Many statistical techniques, notably parametric tests, such as correlation, regression, t-tests, and ANOVA, are predicated on normal data distribution. 47 There are several methods for assessing whether data are normally distributed. They include graphical or visual tests such as histograms and Q-Q probability plots and analytical tests such as the Shapiro-Wilk test and the Kolmogrorov-Smirnov test. 47 The most useful visual method is visualizing the normality distribution via a histogram, as shown in Figure 3.12. On the other hand, the analytical tests (Shapiro-Wilk test and the Kolmogrorov-Smirnov) determine if the data distribution deviates considerably from the normal distribution by using criteria such as the p-value. 47 If the p-value is < 0.05, the data is not normally distributed. 47 These analytical tests can be conducted using statistical software like SPSS and R. However, when the sample size is > 30, the violation of the normality test is not an issue and the sample is considered to be normally distributed. According to the central limit theorem, in large samples of > 30 or 40, the sampling distribution is normal regardless of the shape of the data. 47, 48 Normally distributed data are also known as parametric data, while non-normally distributed data are known as non-parametric data.
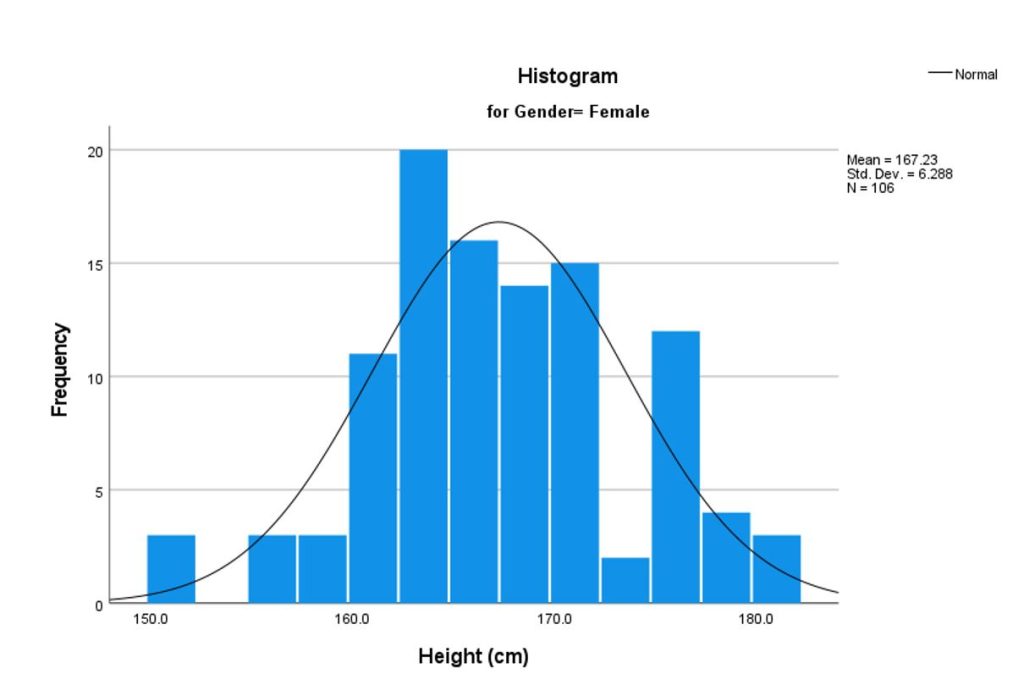
Table 3.4 Tests of normality for height by gender
Inferential statistics
This statistical analysis involves the analysis of data from a sample to make inferences about the target population. 45 The goal is to test hypotheses. Statistical techniques include parametric and non-parametric tests depending on the normality of the data. 45 Conducting a statistical analysis requires choosing the right test to answer the research question.
Steps in a statistical test
The choice of the statistical test is based on the research question to be answered and the data. There are steps to take before choosing a test and conducting an analysis. 49
- State the research question/aim
- State the null and alternative hypothesis
The null hypothesis states that there is no statistical difference exists between two variables or in a set of given observations. The alternative hypothesis contradicts the null and states that there is a statistical difference between the variables.
- Decide on a suitable statistical test based on the type of variables.
Is the data normally distributed? Are the variables continuous, discrete or categorical data? The identification of the data type will aid the appropriate selection of the right test.
- Specify the level of significance (α -for example, 0.05). The level of significance is the probability of rejecting the null hypothesis when the null is true. The hypothesis is tested by calculating the probability (P value) of observing a difference between the variables, and the value of p ranges from zero to one. The more common cut-off for statistical significance is 0.05. 50
- Conduct the statistical test analysis- calculate the p-value
- p<0.05 leads to rejection of the null hypothesis
- p>0.05 leads to retention of the null hypothesis
- Interpret the results
In the next section, we have provided an overview of the statistical tests. The step-by-step conduct of the test using statistical software is beyond the scope of this book. We have provided the theoretical basis for the test. Other books, like Pallant’s SPSS survival manual: A step-by-step guide to data analysis using IBM SPSS, is a good resource if you wish to learn how to run the different tests. 48
Types of Statistical tests
A distinction is always made based on the data type (categorical or numerical) and if the data is paired or unpaired. Paired data refers to data arising from the same individual at different time points, such as before and after or pre and post-test designs. In contrast, unpaired data are data from separate individuals. Inferential statistics can be grouped into the following categories:
Comparing two categorical variables
- o Two sample groups (one numerical variable and one categorical variable in two groups)
- o Three sample groups (one numerical variable and one categorical variable in three groups)
Comparing two numerical variables
Deciding on the choice of test with two categorical variables involves checking if the data is nominal or ordinal and paired versus unpaired. The figure below (Figure 3.13) shows a decision tree for categorical variables.
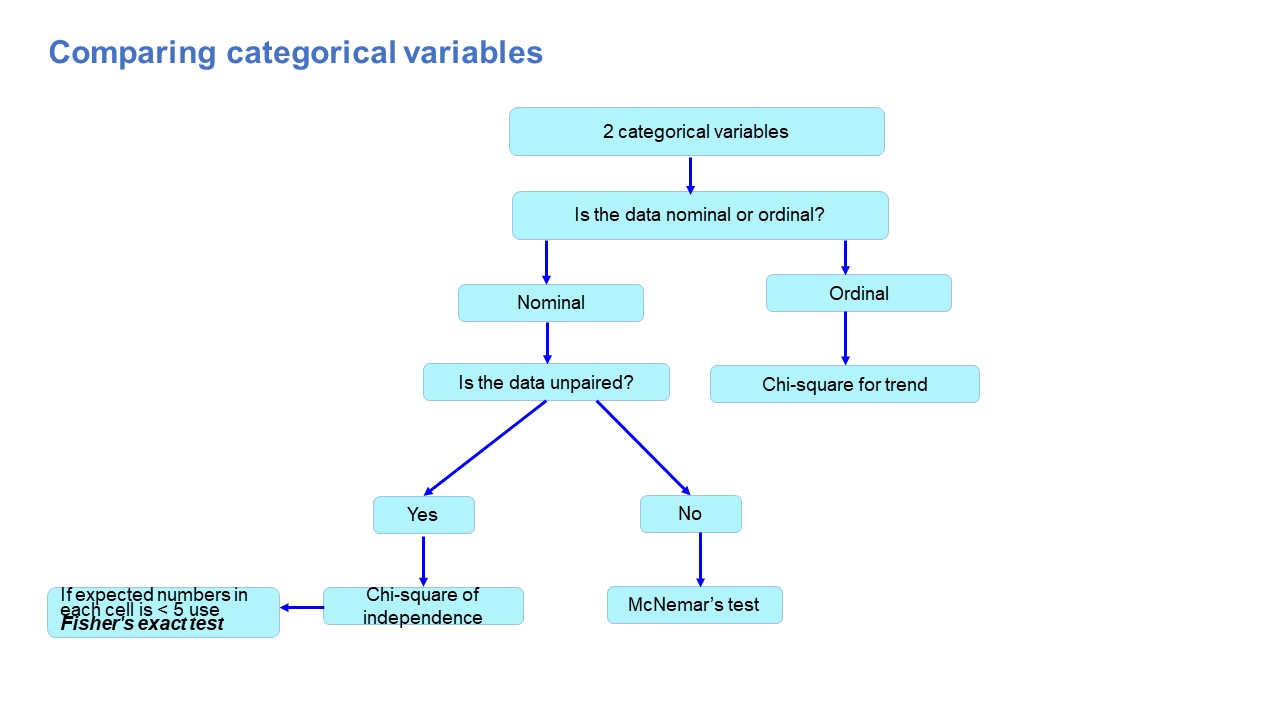
- Chi-square test of independence
The chi-square test of independence compares the distribution of two or more independent data sets. 44 The chi-square value increases when the distributions are found to be increasingly similar, indicating a stronger relationship between them. A value of χ2 = 0 means that there is no relationship between the variables. 44 There are preconditions for the Chi-square test, which include a sample size > 60, and the expected number in each field should not be less than 5. Fisher’s exact test is used if the conditions are not met.
- McNemar’s test
Unlike the Chi-square test, Mcnemar’s test is designed to assess if there is a difference between two related or paired groups (categorical variables). 51
- Chi-square for trend
The chi-square test for trend tests the relationship between one variable that is binary and the other is ordered categorical. 52 The test assesses whether the association between the variables follows a trend. For example, the association between the frequency of mouth rinse (once a week, twice a week and seven days a week) and the presence of dental gingivitis (yes vs no) can be assessed to observe a dose-response effect between mouth rinse usage and dental gingivitis. 52
Tests involving one numerical and one categorical variable
The variables involved in this group of tests are one numerical variable and one categorical variable. These tests have two broad groups – two sample groups and three or more sample groups, as shown in Figures 3.14 and 3.15.
Two sample groups
The parametric two-sample group of tests (independent samples t-test and paired t-test) compare the means of the two samples. On the other hand, the non-parametric tests (Mann-Whitney U test and Wilcoxon Signed Rank test) compare medians of the samples.
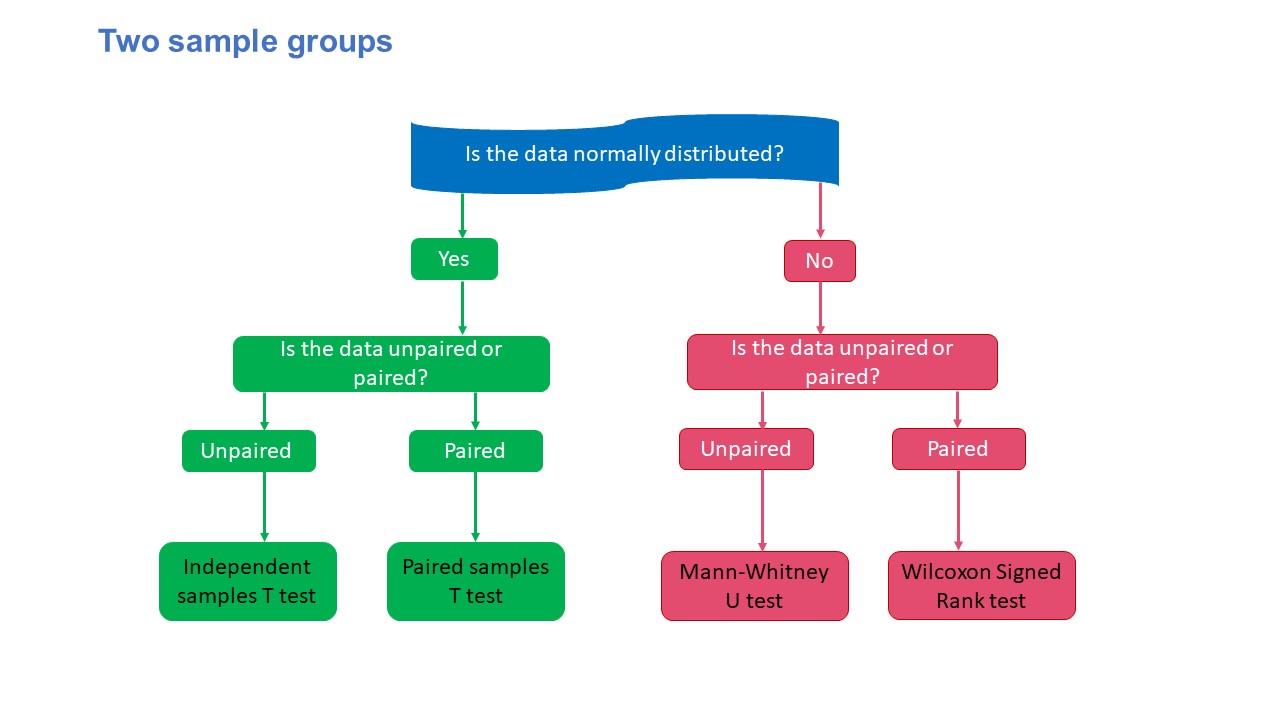
- Parametric: Independent samples T-test and Paired Samples t-test
The independent or unpaired t-test is used when the participants in both groups are independent of one another (those in the first group are distinct from those in the second group) and when the parameters are typically distributed and continuous. 44 On the other hand, the paired t-test is used to test two paired sets of normally distributed continuous data. A paired test involves measuring the same item twice on each subject. 44 For instance, you would wish to compare the differences in each subject’s heart rates before and after an exercise. The tests compare the mean values between the groups.
- Non-parametric: Mann-Whitney U test and Wilcoxon Signed Rank test
The nonparametric equivalents of the paired and independent sample t-tests are the Wilcoxon signed-rank test and the Mann-Whitney U test. 44 These tests examine if the two data sets’ medians are equal and whether the sample sets are representative of the same population. 44 They have less power than their parametric counterparts, as is the case with all nonparametric tests but can be applied to data that is not normally distributed or small samples. 44
Three samples group
The t-tests and their non-parametric counterparts cannot be used for comparing three or more groups. Thus, three or more sample groups of the test are used. The parametric three samples group of tests are one-way ANOVA (Analysis of variance) and repeated measures ANOVA. In contrast, the non-parametric tests are the Kruskal-Wallis test and the Friedman test.

- Parametric: One-way ANOVA and Repeated measures ANOVA
ANOVA is used to determine whether there are appreciable differences between the means of three or more groups. 45 Within-group and between-group variability are the two variances examined in a one-way ANOVA test. The repeated measures ANOVA examines whether the means of three or more groups are identical. 45 When all the variables in a sample are tested under various circumstances or at various times, a repeated measure ANOVA is utilized. 45 The dependent variable is measured repeatedly as the variables are determined from samples at various times. The data don’t conform to the ANOVA premise of independence; thus, using a typical ANOVA in this situation is inappropriate. 45
- Non-parametric: Kuskal Wallis test and Friedman test
The non-parametric test to analyse variance is the Kruskal-Wallis test. It examines if the median values of three or more independent samples differ in any way. 45 The test statistic is produced after the rank sums of the data values, which are ranked in ascending order. On the other hand, the Friedman test is the non-parametric test for comparing the differences between related samples. When the same parameter is assessed repeatedly or under different conditions on the same participants, the Friedman test can be used as an alternative to repeated measures ANOVA. 45
Pearson’s correlation and regression tests are used to compare two numerical variables.
- Pearson’s Correlation and Regression
Pearson’s correlation (r) indicates a relationship between two numerical variables assuming that the relationship is linear. 53 This implies that for every unit rise or reduction in one variable, the other increases or decreases by a constant amount. The values of the correlation coefficient vary from -1 to + 1. Negative correlation coefficient values suggest a rise in one variable will lead to a fall in the other variable and vice versa. 53 Positive correlation coefficient values indicate a propensity for one variable to rise or decrease in tandem with another. Pearson’s correlation also quantifies the strength of the relationship between the two variables. Correlation coefficient values close to zero suggest a weak linear relationship between two variables, whereas those close to -1 or +1 indicate a robust linear relationship between two variables. 53 It is important to note that correlation does not imply causation. The Spearman rank correlation coefficient test (rs) is the nonparametric equivalent of the Pearson coefficient. It is useful when the conditions for calculating a meaningful r value cannot be satisfied and numerical data is being analysed. 44
Regression measures the connection between two correlated variables. The variables are usually labelled as dependent or independent. An independent variable is a factor that influences a dependent variable (which can also be called an outcome). 54 Regression analyses describe, estimate, predict and control the effect of one or more independent variables while investigating the relationship between the independent and dependent variables. 54 There are three common types of regression analyses – linear, logistic and multiple regression. 54
- Linear regression examines the relationship between one continuous dependent and one continuous independent variable. For example, the effect of age on shoe size can be analysed using linear regression. 54
- Logistic regression estimates an event’s likelihood with binary outcomes (present or absent). It involves one categorical dependent variable and two or more continuous or categorical predictor (independent) variables. 54
- Multiple regression is an extension of simple linear regression and investigates one continuous dependent and two or more continuous independent variables. 54
An Introduction to Research Methods for Undergraduate Health Profession Students Copyright © 2023 by Faith Alele and Bunmi Malau-Aduli is licensed under a Creative Commons Attribution-NonCommercial 4.0 International License , except where otherwise noted.

An official website of the United States government
The .gov means it’s official. Federal government websites often end in .gov or .mil. Before sharing sensitive information, make sure you’re on a federal government site.
The site is secure. The https:// ensures that you are connecting to the official website and that any information you provide is encrypted and transmitted securely.
- Publications
- Account settings
Preview improvements coming to the PMC website in October 2024. Learn More or Try it out now .
- Advanced Search
- Journal List
- Indian J Anaesth
- v.60(9); 2016 Sep
Basic statistical tools in research and data analysis
Zulfiqar ali.
Department of Anaesthesiology, Division of Neuroanaesthesiology, Sheri Kashmir Institute of Medical Sciences, Soura, Srinagar, Jammu and Kashmir, India
S Bala Bhaskar
1 Department of Anaesthesiology and Critical Care, Vijayanagar Institute of Medical Sciences, Bellary, Karnataka, India
Statistical methods involved in carrying out a study include planning, designing, collecting data, analysing, drawing meaningful interpretation and reporting of the research findings. The statistical analysis gives meaning to the meaningless numbers, thereby breathing life into a lifeless data. The results and inferences are precise only if proper statistical tests are used. This article will try to acquaint the reader with the basic research tools that are utilised while conducting various studies. The article covers a brief outline of the variables, an understanding of quantitative and qualitative variables and the measures of central tendency. An idea of the sample size estimation, power analysis and the statistical errors is given. Finally, there is a summary of parametric and non-parametric tests used for data analysis.
INTRODUCTION
Statistics is a branch of science that deals with the collection, organisation, analysis of data and drawing of inferences from the samples to the whole population.[ 1 ] This requires a proper design of the study, an appropriate selection of the study sample and choice of a suitable statistical test. An adequate knowledge of statistics is necessary for proper designing of an epidemiological study or a clinical trial. Improper statistical methods may result in erroneous conclusions which may lead to unethical practice.[ 2 ]
Variable is a characteristic that varies from one individual member of population to another individual.[ 3 ] Variables such as height and weight are measured by some type of scale, convey quantitative information and are called as quantitative variables. Sex and eye colour give qualitative information and are called as qualitative variables[ 3 ] [ Figure 1 ].

Classification of variables
Quantitative variables
Quantitative or numerical data are subdivided into discrete and continuous measurements. Discrete numerical data are recorded as a whole number such as 0, 1, 2, 3,… (integer), whereas continuous data can assume any value. Observations that can be counted constitute the discrete data and observations that can be measured constitute the continuous data. Examples of discrete data are number of episodes of respiratory arrests or the number of re-intubations in an intensive care unit. Similarly, examples of continuous data are the serial serum glucose levels, partial pressure of oxygen in arterial blood and the oesophageal temperature.
A hierarchical scale of increasing precision can be used for observing and recording the data which is based on categorical, ordinal, interval and ratio scales [ Figure 1 ].
Categorical or nominal variables are unordered. The data are merely classified into categories and cannot be arranged in any particular order. If only two categories exist (as in gender male and female), it is called as a dichotomous (or binary) data. The various causes of re-intubation in an intensive care unit due to upper airway obstruction, impaired clearance of secretions, hypoxemia, hypercapnia, pulmonary oedema and neurological impairment are examples of categorical variables.
Ordinal variables have a clear ordering between the variables. However, the ordered data may not have equal intervals. Examples are the American Society of Anesthesiologists status or Richmond agitation-sedation scale.
Interval variables are similar to an ordinal variable, except that the intervals between the values of the interval variable are equally spaced. A good example of an interval scale is the Fahrenheit degree scale used to measure temperature. With the Fahrenheit scale, the difference between 70° and 75° is equal to the difference between 80° and 85°: The units of measurement are equal throughout the full range of the scale.
Ratio scales are similar to interval scales, in that equal differences between scale values have equal quantitative meaning. However, ratio scales also have a true zero point, which gives them an additional property. For example, the system of centimetres is an example of a ratio scale. There is a true zero point and the value of 0 cm means a complete absence of length. The thyromental distance of 6 cm in an adult may be twice that of a child in whom it may be 3 cm.
STATISTICS: DESCRIPTIVE AND INFERENTIAL STATISTICS
Descriptive statistics[ 4 ] try to describe the relationship between variables in a sample or population. Descriptive statistics provide a summary of data in the form of mean, median and mode. Inferential statistics[ 4 ] use a random sample of data taken from a population to describe and make inferences about the whole population. It is valuable when it is not possible to examine each member of an entire population. The examples if descriptive and inferential statistics are illustrated in Table 1 .
Example of descriptive and inferential statistics

Descriptive statistics
The extent to which the observations cluster around a central location is described by the central tendency and the spread towards the extremes is described by the degree of dispersion.
Measures of central tendency
The measures of central tendency are mean, median and mode.[ 6 ] Mean (or the arithmetic average) is the sum of all the scores divided by the number of scores. Mean may be influenced profoundly by the extreme variables. For example, the average stay of organophosphorus poisoning patients in ICU may be influenced by a single patient who stays in ICU for around 5 months because of septicaemia. The extreme values are called outliers. The formula for the mean is

where x = each observation and n = number of observations. Median[ 6 ] is defined as the middle of a distribution in a ranked data (with half of the variables in the sample above and half below the median value) while mode is the most frequently occurring variable in a distribution. Range defines the spread, or variability, of a sample.[ 7 ] It is described by the minimum and maximum values of the variables. If we rank the data and after ranking, group the observations into percentiles, we can get better information of the pattern of spread of the variables. In percentiles, we rank the observations into 100 equal parts. We can then describe 25%, 50%, 75% or any other percentile amount. The median is the 50 th percentile. The interquartile range will be the observations in the middle 50% of the observations about the median (25 th -75 th percentile). Variance[ 7 ] is a measure of how spread out is the distribution. It gives an indication of how close an individual observation clusters about the mean value. The variance of a population is defined by the following formula:

where σ 2 is the population variance, X is the population mean, X i is the i th element from the population and N is the number of elements in the population. The variance of a sample is defined by slightly different formula:

where s 2 is the sample variance, x is the sample mean, x i is the i th element from the sample and n is the number of elements in the sample. The formula for the variance of a population has the value ‘ n ’ as the denominator. The expression ‘ n −1’ is known as the degrees of freedom and is one less than the number of parameters. Each observation is free to vary, except the last one which must be a defined value. The variance is measured in squared units. To make the interpretation of the data simple and to retain the basic unit of observation, the square root of variance is used. The square root of the variance is the standard deviation (SD).[ 8 ] The SD of a population is defined by the following formula:

where σ is the population SD, X is the population mean, X i is the i th element from the population and N is the number of elements in the population. The SD of a sample is defined by slightly different formula:

where s is the sample SD, x is the sample mean, x i is the i th element from the sample and n is the number of elements in the sample. An example for calculation of variation and SD is illustrated in Table 2 .
Example of mean, variance, standard deviation

Normal distribution or Gaussian distribution
Most of the biological variables usually cluster around a central value, with symmetrical positive and negative deviations about this point.[ 1 ] The standard normal distribution curve is a symmetrical bell-shaped. In a normal distribution curve, about 68% of the scores are within 1 SD of the mean. Around 95% of the scores are within 2 SDs of the mean and 99% within 3 SDs of the mean [ Figure 2 ].

Normal distribution curve
Skewed distribution
It is a distribution with an asymmetry of the variables about its mean. In a negatively skewed distribution [ Figure 3 ], the mass of the distribution is concentrated on the right of Figure 1 . In a positively skewed distribution [ Figure 3 ], the mass of the distribution is concentrated on the left of the figure leading to a longer right tail.

Curves showing negatively skewed and positively skewed distribution
Inferential statistics
In inferential statistics, data are analysed from a sample to make inferences in the larger collection of the population. The purpose is to answer or test the hypotheses. A hypothesis (plural hypotheses) is a proposed explanation for a phenomenon. Hypothesis tests are thus procedures for making rational decisions about the reality of observed effects.
Probability is the measure of the likelihood that an event will occur. Probability is quantified as a number between 0 and 1 (where 0 indicates impossibility and 1 indicates certainty).
In inferential statistics, the term ‘null hypothesis’ ( H 0 ‘ H-naught ,’ ‘ H-null ’) denotes that there is no relationship (difference) between the population variables in question.[ 9 ]
Alternative hypothesis ( H 1 and H a ) denotes that a statement between the variables is expected to be true.[ 9 ]
The P value (or the calculated probability) is the probability of the event occurring by chance if the null hypothesis is true. The P value is a numerical between 0 and 1 and is interpreted by researchers in deciding whether to reject or retain the null hypothesis [ Table 3 ].
P values with interpretation

If P value is less than the arbitrarily chosen value (known as α or the significance level), the null hypothesis (H0) is rejected [ Table 4 ]. However, if null hypotheses (H0) is incorrectly rejected, this is known as a Type I error.[ 11 ] Further details regarding alpha error, beta error and sample size calculation and factors influencing them are dealt with in another section of this issue by Das S et al .[ 12 ]
Illustration for null hypothesis

PARAMETRIC AND NON-PARAMETRIC TESTS
Numerical data (quantitative variables) that are normally distributed are analysed with parametric tests.[ 13 ]
Two most basic prerequisites for parametric statistical analysis are:
- The assumption of normality which specifies that the means of the sample group are normally distributed
- The assumption of equal variance which specifies that the variances of the samples and of their corresponding population are equal.
However, if the distribution of the sample is skewed towards one side or the distribution is unknown due to the small sample size, non-parametric[ 14 ] statistical techniques are used. Non-parametric tests are used to analyse ordinal and categorical data.
Parametric tests
The parametric tests assume that the data are on a quantitative (numerical) scale, with a normal distribution of the underlying population. The samples have the same variance (homogeneity of variances). The samples are randomly drawn from the population, and the observations within a group are independent of each other. The commonly used parametric tests are the Student's t -test, analysis of variance (ANOVA) and repeated measures ANOVA.
Student's t -test
Student's t -test is used to test the null hypothesis that there is no difference between the means of the two groups. It is used in three circumstances:

where X = sample mean, u = population mean and SE = standard error of mean

where X 1 − X 2 is the difference between the means of the two groups and SE denotes the standard error of the difference.
- To test if the population means estimated by two dependent samples differ significantly (the paired t -test). A usual setting for paired t -test is when measurements are made on the same subjects before and after a treatment.
The formula for paired t -test is:

where d is the mean difference and SE denotes the standard error of this difference.
The group variances can be compared using the F -test. The F -test is the ratio of variances (var l/var 2). If F differs significantly from 1.0, then it is concluded that the group variances differ significantly.
Analysis of variance
The Student's t -test cannot be used for comparison of three or more groups. The purpose of ANOVA is to test if there is any significant difference between the means of two or more groups.
In ANOVA, we study two variances – (a) between-group variability and (b) within-group variability. The within-group variability (error variance) is the variation that cannot be accounted for in the study design. It is based on random differences present in our samples.
However, the between-group (or effect variance) is the result of our treatment. These two estimates of variances are compared using the F-test.
A simplified formula for the F statistic is:

where MS b is the mean squares between the groups and MS w is the mean squares within groups.
Repeated measures analysis of variance
As with ANOVA, repeated measures ANOVA analyses the equality of means of three or more groups. However, a repeated measure ANOVA is used when all variables of a sample are measured under different conditions or at different points in time.
As the variables are measured from a sample at different points of time, the measurement of the dependent variable is repeated. Using a standard ANOVA in this case is not appropriate because it fails to model the correlation between the repeated measures: The data violate the ANOVA assumption of independence. Hence, in the measurement of repeated dependent variables, repeated measures ANOVA should be used.
Non-parametric tests
When the assumptions of normality are not met, and the sample means are not normally, distributed parametric tests can lead to erroneous results. Non-parametric tests (distribution-free test) are used in such situation as they do not require the normality assumption.[ 15 ] Non-parametric tests may fail to detect a significant difference when compared with a parametric test. That is, they usually have less power.
As is done for the parametric tests, the test statistic is compared with known values for the sampling distribution of that statistic and the null hypothesis is accepted or rejected. The types of non-parametric analysis techniques and the corresponding parametric analysis techniques are delineated in Table 5 .
Analogue of parametric and non-parametric tests

Median test for one sample: The sign test and Wilcoxon's signed rank test
The sign test and Wilcoxon's signed rank test are used for median tests of one sample. These tests examine whether one instance of sample data is greater or smaller than the median reference value.
This test examines the hypothesis about the median θ0 of a population. It tests the null hypothesis H0 = θ0. When the observed value (Xi) is greater than the reference value (θ0), it is marked as+. If the observed value is smaller than the reference value, it is marked as − sign. If the observed value is equal to the reference value (θ0), it is eliminated from the sample.
If the null hypothesis is true, there will be an equal number of + signs and − signs.
The sign test ignores the actual values of the data and only uses + or − signs. Therefore, it is useful when it is difficult to measure the values.
Wilcoxon's signed rank test
There is a major limitation of sign test as we lose the quantitative information of the given data and merely use the + or – signs. Wilcoxon's signed rank test not only examines the observed values in comparison with θ0 but also takes into consideration the relative sizes, adding more statistical power to the test. As in the sign test, if there is an observed value that is equal to the reference value θ0, this observed value is eliminated from the sample.
Wilcoxon's rank sum test ranks all data points in order, calculates the rank sum of each sample and compares the difference in the rank sums.
Mann-Whitney test
It is used to test the null hypothesis that two samples have the same median or, alternatively, whether observations in one sample tend to be larger than observations in the other.
Mann–Whitney test compares all data (xi) belonging to the X group and all data (yi) belonging to the Y group and calculates the probability of xi being greater than yi: P (xi > yi). The null hypothesis states that P (xi > yi) = P (xi < yi) =1/2 while the alternative hypothesis states that P (xi > yi) ≠1/2.
Kolmogorov-Smirnov test
The two-sample Kolmogorov-Smirnov (KS) test was designed as a generic method to test whether two random samples are drawn from the same distribution. The null hypothesis of the KS test is that both distributions are identical. The statistic of the KS test is a distance between the two empirical distributions, computed as the maximum absolute difference between their cumulative curves.
Kruskal-Wallis test
The Kruskal–Wallis test is a non-parametric test to analyse the variance.[ 14 ] It analyses if there is any difference in the median values of three or more independent samples. The data values are ranked in an increasing order, and the rank sums calculated followed by calculation of the test statistic.
Jonckheere test
In contrast to Kruskal–Wallis test, in Jonckheere test, there is an a priori ordering that gives it a more statistical power than the Kruskal–Wallis test.[ 14 ]
Friedman test
The Friedman test is a non-parametric test for testing the difference between several related samples. The Friedman test is an alternative for repeated measures ANOVAs which is used when the same parameter has been measured under different conditions on the same subjects.[ 13 ]
Tests to analyse the categorical data
Chi-square test, Fischer's exact test and McNemar's test are used to analyse the categorical or nominal variables. The Chi-square test compares the frequencies and tests whether the observed data differ significantly from that of the expected data if there were no differences between groups (i.e., the null hypothesis). It is calculated by the sum of the squared difference between observed ( O ) and the expected ( E ) data (or the deviation, d ) divided by the expected data by the following formula:

A Yates correction factor is used when the sample size is small. Fischer's exact test is used to determine if there are non-random associations between two categorical variables. It does not assume random sampling, and instead of referring a calculated statistic to a sampling distribution, it calculates an exact probability. McNemar's test is used for paired nominal data. It is applied to 2 × 2 table with paired-dependent samples. It is used to determine whether the row and column frequencies are equal (that is, whether there is ‘marginal homogeneity’). The null hypothesis is that the paired proportions are equal. The Mantel-Haenszel Chi-square test is a multivariate test as it analyses multiple grouping variables. It stratifies according to the nominated confounding variables and identifies any that affects the primary outcome variable. If the outcome variable is dichotomous, then logistic regression is used.
SOFTWARES AVAILABLE FOR STATISTICS, SAMPLE SIZE CALCULATION AND POWER ANALYSIS
Numerous statistical software systems are available currently. The commonly used software systems are Statistical Package for the Social Sciences (SPSS – manufactured by IBM corporation), Statistical Analysis System ((SAS – developed by SAS Institute North Carolina, United States of America), R (designed by Ross Ihaka and Robert Gentleman from R core team), Minitab (developed by Minitab Inc), Stata (developed by StataCorp) and the MS Excel (developed by Microsoft).
There are a number of web resources which are related to statistical power analyses. A few are:
- StatPages.net – provides links to a number of online power calculators
- G-Power – provides a downloadable power analysis program that runs under DOS
- Power analysis for ANOVA designs an interactive site that calculates power or sample size needed to attain a given power for one effect in a factorial ANOVA design
- SPSS makes a program called SamplePower. It gives an output of a complete report on the computer screen which can be cut and paste into another document.
It is important that a researcher knows the concepts of the basic statistical methods used for conduct of a research study. This will help to conduct an appropriately well-designed study leading to valid and reliable results. Inappropriate use of statistical techniques may lead to faulty conclusions, inducing errors and undermining the significance of the article. Bad statistics may lead to bad research, and bad research may lead to unethical practice. Hence, an adequate knowledge of statistics and the appropriate use of statistical tests are important. An appropriate knowledge about the basic statistical methods will go a long way in improving the research designs and producing quality medical research which can be utilised for formulating the evidence-based guidelines.
Financial support and sponsorship
Conflicts of interest.
There are no conflicts of interest.
- Search Search Please fill out this field.
- Understanding QA
- Quantitative vs. Qualitative Analysis
Example of Quantitative Analysis in Finance
Drawbacks and limitations of quantitative analaysis, using quantitative finance outside of finance, the bottom line.
- Quantitative Analysis
Quantitative Analysis (QA): What It Is and How It's Used in Finance
:max_bytes(150000):strip_icc():format(webp)/wk_headshot_aug_2018_02__william_kenton-5bfc261446e0fb005118afc9.jpg "quantitative research variables analysis")
Ariel Courage is an experienced editor, researcher, and former fact-checker. She has performed editing and fact-checking work for several leading finance publications, including The Motley Fool and Passport to Wall Street.
:max_bytes(150000):strip_icc():format(webp)/ArielCourage-50e270c152b046738d83fb7355117d67.jpg "quantitative research variables analysis")
Investopedia / Hilary Allison
Quantitative analysis (QA) refers to methods used to understand the behavior of financial markets and make more informed investment or trading decisions. It involves the use of mathematical and statistical techniques to analyze financial data. For instance, by examining past stock prices, earnings reports, and other information, quantitative analysts, often called “ quants ,” aim to forecast where the market is headed.
Unlike fundamental analysis that might focus on a company's management team or industry conditions, quantitative analysis relies chiefly on crunching numbers and complex computations to derive actionable insights.
Quantitative analysis can be a powerful tool, especially in modern markets where data is abundant and computational tools are advanced, enabling a more precise examination of the financial landscape. However, many also believe that the raw numbers produced by quantitative analysis should be combined with the more in-depth understanding and nuance afforded by qualitative analysis .
Key Takeaways
- Quantitative analysis (QA) is a set of techniques that use mathematical and statistical modeling, measurement, and research to understand behavior.
- Quantitative analysis presents financial information in terms of a numerical value.
- It's used for the evaluation of financial instruments and for predicting real-world events such as changes in GDP.
- While powerful, quantitative analysis has some drawbacks that can be supplemented with qualitative analysis.
Understanding Quantitative Analysis
Quantitative analysis (QA) in finance refers to the use of mathematical and statistical techniques to analyze financial & economic data and make trading, investing, and risk management decisions.
QA starts with data collection, where quants gather a vast amount of financial data that might affect the market. This data can include anything from stock prices and company earnings to economic indicators like inflation or unemployment rates. They then use various mathematical models and statistical techniques to analyze this data, looking for trends, patterns, and potential investment opportunities. The outcome of this analysis can help investors decide where to allocate their resources to maximize returns or minimize risks.
Some key aspects of quantitative analysis in finance include:
- Statistical analysis - this aspect of quantitative analysis involves examining data to identify trends and relationships, build predictive models, and make forecasts. Techniques used can include regression analysis , which helps in understanding relationships between variables; time series analysis , which looks at data points collected or recorded at a specific time; and Monte Carlo simulations , a mathematical technique that allows you to account for uncertainty in your analyses and forecasts. Through statistical analysis, quants can uncover insights that may not be immediately apparent, helping investors and financial analysts make more informed decisions.
- Algorithmic trading - this entails using computer algorithms to automate the trading process. Algorithms can be programmed to carry out trades based on a variety of factors such as timing, price movements, liquidity changes, and other market signals. High-frequency trading (HFT), a type of algorithmic trading, involves making a large number of trades within fractions of a second to capitalize on small price movements. This automated approach to trading can lead to more efficient and often profitable trading strategies.
- Risk modeling - risk is an inherent part of financial markets. Risk modeling involves creating mathematical models to measure and quantify various risk exposures within a portfolio. Methods used in risk modeling include Value-at-Risk (VaR) models, scenario analysis , and stress testing . These tools help in understanding the potential downside and uncertainties associated with different investment scenarios, aiding in better risk management and mitigation strategies.
- Derivatives pricing - derivatives are financial contracts whose value is derived from other underlying assets like stocks or bonds. Derivatives pricing involves creating mathematical models to evaluate these contracts and determine their fair prices and risk profiles. A well-known model used in this domain is the Black-Scholes model , which helps in pricing options contracts . Accurate derivatives pricing is crucial for investors and traders to make sound financial decisions regarding buying, selling, or hedging with derivatives.
- Portfolio optimization - This is about constructing a portfolio in such a way that it yields the highest possible expected return for a given level of risk. Techniques like Modern Portfolio Theory (MPT) are employed to find the optimal allocation of assets within a portfolio. By analyzing various asset classes and their expected returns, risks, and correlations, quants can suggest the best mix of investments to achieve specific financial goals while minimizing risk.
The overall goal is to use data, math, statistics, and software to make more informed financial decisions, automate processes, and ultimately generate greater risk-adjusted returns.
Quantitative analysis is widely used in central banking, algorithmic trading, hedge fund management, and investment banking activities. Quantitative analysts, employ advanced skills in programming, statistics, calculus, linear algebra etc. to execute quantitative analysis.
Quantitative Analysis vs. Qualitative Analysis
Quantitative analysis relies heavily on numerical data and mathematical models to make decisions regarding investments and financial strategies. It focuses on the measurable, objective data that can be gathered about a company or a financial instrument.
But analysts also evaluate information that is not easily quantifiable or reduced to numeric values to get a better picture of a company's performance. This important qualitative data can include reputation, regulatory insights, or employee morale. Qualitative analysis thus focuses more on understanding the underlying qualities of a company or a financial instrument, which may not be immediately quantifiable.
Quantitative isn't the opposite of qualitative analysis. They're different and often complementary philosophies. They each provide useful information for informed decisions. When used together. better decisions can be made than using either one in isolation.
Some common uses of qualitative analysis include:
- Management Evaluation: Qualitative analysis is often better at evaluating a company's management team, their experience, and their ability to lead the company toward growth. While quantifiable metrics are useful, they often cannot capture the full picture of management's ability and potential. For example, the leadership skills, vision, and corporate culture instilled by management are intangible factors that can significantly impact a company's success, yet are difficult to measure with numbers alone.
- Industry Analysis: It also includes an analysis of the industry in which the company operates, the competition, and market conditions. For instance, it can explore how changes in technology or societal behaviors could impact the industry. Qualitative approaches can also better identify barriers to entry or exit, which can affect the level of competition and profitability within the industry.
- Brand Value and Company Reputation: The reputation of a company, its brand value, and customer loyalty are also significant factors considered in qualitative analysis. Understanding how consumers perceive the brand, their level of trust, and satisfaction can provide insights into customer loyalty and the potential for sustained revenue. This can be done through focus groups, surveys, or interviews.
- Regulatory Environment: The regulatory environment, potential legal issues, and other external factors that could impact a company are also analyzed qualitatively. Evaluating a company's compliance with relevant laws, regulations, and industry standards to ascertain its legal standing and the potential risk of legal issues. In addition, understanding a company's ethical practices and social responsibility initiatives, that can influence its relationship with stakeholders and the community at large.
Suppose you are interested in investing in a particular company, XYZ Inc. One way to evaluate its potential as an investment is by analyzing its past financial performance using quantitative analysis. Let's say, over the past five years, XYZ Inc. has been growing its revenue at an average rate of 8% per year. You decide to use regression analysis to forecast its future revenue growth. Regression analysis is a statistical method used to examine the relationship between variables.
After collecting the necessary data, you run a simple linear regression with the year as the independent variable and the revenue as the dependent variable. The output gives you a regression equation, let's say, R e v e n u e = 100 + 8 ( Y e a r ) Revenue=100+8(Year) R e v e n u e = 100 + 8 ( Y e a r ) . This equation suggests that for every year, the revenue of XYZ Inc. increases by $8 million, starting from a base of $100 million. This quantitative insight could be instrumental in helping you decide whether XYZ Inc. represents a good investment opportunity based on its historical revenue growth trend.
However, while you can quantify revenue growth for the firm and make predictions, the reasons for why may not be apparent from quantitative number crunching.
Augmenting with Qualitative Analysis
Qualitative analysis can provide a more nuanced understanding of XYZ Inc.'s potential. You decide to delve into the company's management and industry reputation. Through interviews, reviews, and industry reports, you find that the management team at XYZ Inc. is highly regarded with a track record of successful ventures. Moreover, the company has a strong brand value and a loyal customer base.
Additionally, you assess the industry in which XYZ Inc. operates and find it to be stable with a steady demand for the products that XYZ Inc. offers. The regulatory environment is also favorable, and the company has a good relationship with the local communities in which it operates.
By analyzing these qualitative factors, you obtain a more comprehensive understanding of the company's operational environment, the competence of its management team, and its reputation in the market. This qualitative insight complements the quantitative analysis, providing you with a well-rounded view of XYZ Inc.'s investment potential.
Combining both quantitative and qualitative analyses could therefore lead to a more informed investment decision regarding XYZ Inc.
Quantitative analysis, while powerful, comes with certain limitations:
- Data Dependency: Quantitative analysis is heavily dependent on the quality and availability of numerical data. If the data is inaccurate, outdated, or incomplete, the analysis and the subsequent conclusions drawn will be flawed. As they say, 'garbage-in, garbage-out'.
- Complexity: The methods and models used in quantitative analysis can be very complex, requiring a high level of expertise to develop, interpret, and act upon. This complexity can also make it difficult to communicate findings to individuals who lack a quantitative background.
- Lack of Subjectivity: Quantitative analysis often overlooks qualitative factors like management quality, brand reputation, and other subjective factors that can significantly affect a company's performance or a financial instrument's value. In other words, you may have the 'what' without the 'why' or 'how.' Qualitative analysis can augment this blind spot.
- Assumption-based Modeling: Many quantitative models are built on assumptions that may not hold true in real-world situations. For example, assumptions about normal distribution of returns or constant volatility may not reflect actual market conditions.
- Over-reliance on Historical Data: Quantitative analysis often relies heavily on historical data to make predictions about the future. However, past performance is not always indicative of future results, especially in rapidly changing markets or unforeseen situations like economic crises.
- Inability to Capture Human Emotion and Behavior: Markets are often influenced by human emotions and behaviors which can be erratic and hard to predict. Quantitative analysis, being number-driven, struggles to properly account for these human factors.
- Cost and Time Intensive: Developing accurate and reliable quantitative models can be time-consuming and expensive. It requires skilled personnel, sophisticated software tools, and often, extensive computational resources.
- Overfitting: There's a risk of overfitting , where a model might perform exceedingly well on past data but fails to predict future outcomes accurately because it's too tailored to past events.
- Lack of Flexibility: Quantitative models may lack the flexibility to adapt to new information or changing market conditions quickly, which can lead to outdated or incorrect analysis.
- Model Risk: There's inherent model risk involved where the model itself may have flaws or errors that can lead to incorrect analysis and potentially significant financial losses.
Understanding these drawbacks is crucial for analysts and decision-makers to interpret quantitative analysis results accurately and to balance them with qualitative insights for more holistic decision-making.
Quantitative analysis is a versatile tool that extends beyond the realm of finance into a variety of fields. In the domain of social sciences, for instance, it's used to analyze behavioral patterns, social trends, and the impact of policies on different demographics. Researchers employ statistical models to examine large datasets, enabling them to identify correlations, causations, and trends that can provide a deeper understanding of human behaviors and societal dynamics. Similarly, in the field of public policy, quantitative analysis plays a crucial role in evaluating the effectiveness of different policies, analyzing economic indicators, and forecasting the potential impacts of policy changes. By providing a method to measure and analyze data, it aids policymakers in making informed decisions based on empirical evidence.
In the arena of healthcare, quantitative analysis is employed for clinical trials, genetic research, and epidemiological studies to name a few areas. It assists in analyzing patient data, evaluating treatment outcomes, and understanding disease spread and its determinants. Meanwhile, in engineering and manufacturing, it's used to optimize processes, improve quality control, and enhance operational efficiency. By analyzing data related to production processes, material properties, and operational performance, engineers can identify bottlenecks, optimize workflows, and ensure the reliability and quality of products. Additionally, in the field of marketing, quantitative analysis is fundamental for market segmentation, advertising effectiveness, and consumer satisfaction studies. It helps marketers understand consumer preferences, the impact of advertising campaigns, and the market potential for new products. Through these diverse applications, quantitative analysis serves as a bedrock for data-driven decision-making, enabling professionals across different fields to derive actionable insights from complex data.
What Is Quantitative Analysis Used for in Finance?
Quantitative analysis is used by governments, investors, and businesses (in areas such as finance, project management, production planning, and marketing) to study a certain situation or event, measure it, predict outcomes, and thus help in decision-making. In finance, it's widely used for assessing investment opportunities and risks. For instance, before venturing into investments, analysts rely on quantitative analysis to understand the performance metrics of different financial instruments such as stocks, bonds, and derivatives. By delving into historical data and employing mathematical and statistical models, they can forecast potential future performance and evaluate the underlying risks. This practice isn't just confined to individual assets; it's also essential for portfolio management. By examining the relationships between different assets and assessing their risk and return profiles, investors can construct portfolios that are optimized for the highest possible returns for a given level of risk.
What Kind of Education Do You Need to Be a Quant?
Individuals pursuing a career in quantitative analysis usually have a strong educational background in quantitative fields like mathematics, statistics, computer science, finance, economics, or engineering. Advanced degrees (Master’s or Ph.D.) in quantitative disciplines are often preferred, and additional coursework or certifications in finance and programming can also be beneficial.
What Is the Difference Between Quantitative Analysis and Fundamental Analysis?
While both rely on the use of math and numbers, fundamental analysis takes a broader approach by examining the intrinsic value of a security. It dives into a company's financial statements, industry position, the competence of the management team, and the economic environment in which it operates. By evaluating factors like earnings, dividends, and the financial health of a company, fundamental analysts aim to ascertain the true value of a security and whether it is undervalued or overvalued in the market. This form of analysis is more holistic and requires a deep understanding of the company and the industry in which it operates.
How Does Artificial Intelligence (AI) Influence Quantitative Analysis?
Quantitative analysis often intersects with machine learning (ML) and other forms of artificial intelligence (AI). ML and AI can be employed to develop predictive models and algorithms based on the quantitative data. These technologies can automate the analysis process, handle large datasets, and uncover complex patterns or trends that might be difficult to detect through traditional quantitative methods.
Quantitative analysis is a mathematical approach that collects and evaluates measurable and verifiable data in order to evaluate performance, make better decisions, and predict trends. Unlike qualitative analysis, quantitative analysis uses numerical data to provide an explanation of "what" happened, but not "why" those events occurred.
DeFusco, R. A., McLeavey, D. W., Pinto, J. E., Runkle, D. E., & Anson, M. J. (2015). Quantitative investment analysis . John Wiley & Sons.
University of Sydney. " On Becoming a Quant ," Page 1
Linsmeier, Thomas J., and Neil D. Pearson. " Value at risk ." Financial analysts journal 56, no. 2 (2000): 47-67.
Fischer, Black, and Myron Scholes, " The Pricing of Options and Corporate Liabilities ." Journal of Political Economy, vol. 81, no. 3, 1974, pp. 637-654.
Francis, J. C., & Kim, D. (2013). Modern portfolio theory: Foundations, analysis, and new developments . John Wiley & Sons.
Kaczynski, D., Salmona, M., & Smith, T. (2014). " Qualitative research in finance ." Australian Journal of Management , 39 (1), 127-135.
:max_bytes(150000):strip_icc():format(webp)/Primary-Image-how-to-invest-in-commodities-7480946-604a7bbb3a9a4273af6b8db20586981a.jpg "quantitative research variables analysis")
- Terms of Service
- Editorial Policy
- Privacy Policy
- Your Privacy Choices
IMAGES
VIDEO
COMMENTS
Quantitative research methods. You can use quantitative research methods for descriptive, correlational or experimental research. In descriptive research, you simply seek an overall summary of your study variables.; In correlational research, you investigate relationships between your study variables.; In experimental research, you systematically examine whether there is a cause-and-effect ...
Objective approach: Quantitative research aims to be objective and impartial in its approach, focusing on the collection and analysis of data rather than personal beliefs, opinions, or experiences. Control over variables: Quantitative research often involves manipulating variables to test hypotheses and establish cause-and-effect relationships ...
A research question is what a study aims to answer after data analysis and interpretation. ... study.3 Research questions are also used more frequently in survey projects than hypotheses in experiments in quantitative research to compare variables and their relationships. Hypotheses are constructed based on the variables identified and as an if ...
Quantitative Research: Focus: Quantitative research focuses on numerical data, seeking to quantify variables and examine relationships between them. It aims to provide statistical evidence and generalize findings to a larger population. Measurement: Quantitative research involves standardized measurement instruments, such as surveys or questionnaires, to collect data.
Quantitative research methods. You can use quantitative research methods for descriptive, correlational or experimental research. In descriptive research, you simply seek an overall summary of your study variables.; In correlational research, you investigate relationships between your study variables.; In experimental research, you systematically examine whether there is a cause-and-effect ...
Quantitative research is a research strategy that focuses on quantifying the collection and analysis of data. It is formed from a deductive approach where emphasis is placed on the testing of theory, shaped by empiricist and positivist philosophies.. Associated with the natural, applied, formal, and social sciences this research strategy promotes the objective empirical investigation of ...
This entry aims to introduce the most common ways to use numbers and statistics to describe variables, establish relationships among variables, and build numerical understanding of a topic. ... Mertens W, Pugliese A, Recker J (2018) Quantitative data analysis, research methods: information, systems, and contexts: second edition. https://doi.org ...
Abstract. Quantitative data analysis serves as part of an essential process of evidence-making in health and social sciences. It is adopted for any types of research question and design whether it is descriptive, explanatory, or causal. However, compared with qualitative counterpart, quantitative data analysis has less flexibility.
What is quantitative data analysis? Despite being a mouthful, quantitative data analysis simply means analysing data that is numbers-based - or data that can be easily "converted" into numbers without losing any meaning.. For example, category-based variables like gender, ethnicity, or native language could all be "converted" into numbers without losing meaning - for example ...
Introduction. Statistical analysis is necessary for any research project seeking to make quantitative conclusions. The following is a primer for research-based statistical analysis. It is intended to be a high-level overview of appropriate statistical testing, while not diving too deep into any specific methodology.
Quantitative research is the process of collecting and analyzing numerical data to describe, predict, or control variables of interest. This type of research helps in testing the causal relationships between variables, making predictions, and generalizing results to wider populations. The purpose of quantitative research is to test a predefined ...
Quantitative research methods are concerned with the planning, design, and implementation of strategies to collect and analyze data. Descartes, the seventeenth-century philosopher, suggested that how the results are achieved is often more important than the results themselves, as the journey taken along the research path is a journey of discovery. . High-quality quantitative research is ...
Quantitative data has to be gathered and cleaned before proceeding to the stage of analyzing it. Below are the steps to prepare a data before quantitative research analysis: Step 1: Data Collection. Before beginning the analysis process, you need data. Data can be collected through rigorous quantitative research, which includes methods such as ...
Structured approach: Quantitative research follows a structured and systematic approach to data collection and analysis, using clearly defined variables, hypotheses, and research questions. Numeric data: Quantitative research uses numerical data to describe and analyze the phenomena under study, such as statistical analysis, surveys, and ...
Understanding the level of measurement that you need, the variables, and the sample size can be key. 3. Clean your data by handling missing, incorrect, and duplicate values in appropriate ways. 4. Run descriptive statistics. No matter what statistical methodology you'll be employing in your analysis, it's important to run descriptive statistics. 5.
3.6 Quantitative Data Analysis Remember that quantitative research explains phenomena by collecting numerical data that are analysed using statistics. 1 Statistics is a scientific method of collecting, processing, analysing, presenting and interpreting data in numerical form. 44 This section discusses how quantitative data is analysed and the choice of test statistics based on the variables ...
The article covers a brief outline of the variables, an understanding of quantitative and qualitative variables and the measures of central tendency. An idea of the sample size estimation, power analysis and the statistical errors is given. Finally, there is a summary of parametric and non-parametric tests used for data analysis.
Quantitative analysis refers to economic, business or financial analysis that aims to understand or predict behavior or events through the use of mathematical measurements and calculations ...
What Is Quantitative Research? Quantitative research involves the process of objectively collecting and analyzing numerical data to describe, predict, or control variables of interest. The goals of quantitative research are to test causal relationships between variables, make predictions, and generalize results to wider populations.
Categorical or qualitative variables are commonly found in research and dat a analysis due to. the lack of suitable quantitative measuri ng systems or simpl y as a result of the inherently ...