
A PhD timeline for finishing quickly [Free Gantt Download]
Navigating the labyrinthine journey of a PhD program is no small feat.
From the day you step into your graduate program as a bright-eyed doctoral student, you’re immediately thrust into a complex weave of coursework, research, and milestones.
By the second year, you’ve transitioned from coursework to research, laying the groundwork for your dissertation—a pivotal component in your scholarly endeavour.
Come the third year, you face the critical oral examination, a hurdle that could make or break years of hard work.
But how does one streamline this multifaceted journey? The answer lies in a well-planned PhD timeline.
This blog serves as an invaluable guide for any PhD student looking to complete their doctoral studies efficiently, walking you through each milestone from coursework to graduation.
How to Begin with the PhD Timeline Planning?
Planning your PhD timeline is an essential first step in your PhD program.
Success in any PhD program depends, to a large extent, on effective time management and keeping track of progress through a thoughtfully crafted PhD timeline.
Start with outlining all your major requirements:
- coursework,
- dissertation,
- and the expected time needed for each task.
I also highly recommend factoring in failure time – give yourself a little bit of wiggle room for when things, invariably – go wrong.
It’s crucial to remain realistic about the time you can commit daily or weekly while keeping long-term goals in mind.
Regular check-ins on your PhD timeline and supervisor will help you stay on track and allow you to adapt if necessary.
Adjustments may be needed as you progress through your PhD program, but having a timeline as a guide can make the journey less daunting and more achievable.
Elements to include in a 3-year PhD timeline
The initial stage in this timeline typically involves coursework, often lasting one year, where the student engrosses themselves in advanced study in their chosen field.
Once the coursework is done (USA PhDs), they focus on proposing, conducting, and presenting their initial research.
By the end of the second year, most students should have a clear direction for their dissertation, a core component of the PhD process.
In this third and final year of the PhD timeline, the student focuses primarily on completing their dissertation, which involves collecting data, analyzing results, and organizing their research into a substantial, original, and cohesive document that contributes to contemporary knowledge in their field.
Regular reviews and modifications of the PhD timeline may also be necessary to accommodate various unpredictable circumstances, thus making this timeline both a guide and a flexible workplan.
It is a significant tool in successfully navigating the maze of becoming a PhD holder.
Create Your PhD Timeline for a 3 year completion
Creating a timeline for a 3-year PhD program requires careful planning, as you’ll have multiple milestones and tasks to complete.
This timeline may vary depending on your specific field, institution, or country, but here is a general outline you can use as a starting point:
Free Gantt chart excel template
Here is a free template you can modify for your own research:
Example Gantt chart for a USA PhD
Here are some common steps involved in completing a PhD, which I’ll use to create the Gantt chart:

- Orientation and Coursework (Semester 1) : Familiarization with the university, department, and coursework.
- Coursework (Semester 2) : Continued coursework and possible teaching/research assistantships.
- Select Advisor and Research Topic : Usually done towards the end of the first year or the beginning of the second year.
- Preliminary Research : Initial research and literature review.
- Complete Coursework (Semester 3) : Wrap up any remaining required courses.
- Research Proposal : Develop a full research proposal including methodology.
- Qualifying Exams : Exams to transition from a Ph.D. student to a Ph.D. candidate.
- Begin Research : Start of actual research based on the approved proposal.
- Conduct Research : Data collection, experiments, and analysis.
- Intermediate Review : A review to assess the progress of the research.
- Write Papers : Start writing papers and possibly publishing in journals.
- Finalize Research : Final experiments and data analysis.
- Write Dissertation : Writing the actual Ph.D. dissertation.
- Dissertation Defense : Defending the dissertation before the committee.
- Graduation : Completing all requirements and graduating.
Example Gantt chart for a UK, European and Australian PhD
For Ph.D. programs outside the United States, especially in Europe and some other parts of the world, students often go straight into research without the need for coursework. Here are some common steps for such programs:

- Orientation : Familiarization with the university and department.
- Select Advisor and Research Topic : Usually done at the beginning of the program.
Wrapping up
The journey to earning a PhD is complex and demanding, filled with academic milestones from coursework to research to dissertation writing.
The key to a smooth and efficient doctoral journey lies in well-planned time management—a structured PhD timeline.
This blog serves as an invaluable guide, offering detailed tips for planning out each academic year in both U.S. and international PhD programs. It emphasizes the importance of starting with an outline of major requirements and factoring in “failure time” for unforeseen challenges.
For those looking to navigate their PhD journey in three years or beyond, having a flexible but comprehensive timeline can be the compass that guides them successfully through the academic labyrinth.
Whether you’re just starting out or already deep into your research, the principles and strategies outlined here can help streamline your path to that coveted doctoral hood.

Dr Andrew Stapleton has a Masters and PhD in Chemistry from the UK and Australia. He has many years of research experience and has worked as a Postdoctoral Fellow and Associate at a number of Universities. Although having secured funding for his own research, he left academia to help others with his YouTube channel all about the inner workings of academia and how to make it work for you.
Thank you for visiting Academia Insider.
We are here to help you navigate Academia as painlessly as possible. We are supported by our readers and by visiting you are helping us earn a small amount through ads and affiliate revenue - Thank you!
2024 © Academia Insider
How to Create and Use a Gantt Chart for PhD Studies

A Gantt chart is a common tool used in the project management field. It is used for schedule planning of a project and its tasks and activities. It shows the tasks, their start and end dates, and the duration needed to complete them.
A PhD is a project and may last from as few as three years to as long as six years depending on the university and department a student is enrolled in.
In order to successfully complete a PhD program, one needs to plan when each of the tasks will be completed from the word go. A Gantt chart is very useful in doing this.
A PhD student can create one comprehensive Gantt chart or several smaller Gantt charts for each of the major deliverables.
This article discusses a Gantt chart for a general PhD program that has both coursework and dissertation components.
Benefits of a Gantt chart for planning PhD studies
Steps involved in creating a gantt chart for phd studies, how to effectively use the phd gantt chart, final thoughts on the phd gantt chart.
Creating a Gantt chart at the beginning of PhD studies has the following benefits:
- It is easy to create. A student can use the traditional pen-and-paper method or existing digital tools or softwares to create a Gantt chart.
- It is easy to read. The visual presentation of the Gantt chart makes it easy for the student to read and know what is expected of him at any point in time.
- A Gantt chart makes it easy to monitor progress of PhD studies. The user can choose to use different colors for tasks that have already been completed, tasks that are close to completion, and tasks that require more time and effort to complete.
- It forms the basis for monthly, weekly, and daily planning of the PhD studies. Depending on how detailed a student wants to go in terms of planning, the Gantt chart comes in handy when writing out the monthly, weekly and even daily plans.
Step 1: List all the deliverables expected of your PhD program. In this example, the PhD program has the following requirements:
- Coursework, divided into 4 modules each lasting 2 weeks. All 4 modules need to be completed within the first year of study.
- A comprehensive written exam at the end of the fourth module.
- An oral exam once a student passes the written exam.
- Submission of a concept note.
- Submission of a research proposal once a student passes the oral exam.
- Writing a business management case study.
- Three journal papers.
- At least two conference papers.
- A dissertation.
Step 2: For each of the requirements listed above, note the start and end dates. For the above example, the PhD program lasts a minimum of 3 years and a maximum of 6 years. Assuming the minimum of 3 years (beginning January 2021), the activities’ start and end dates are as follows:
Step 3: Using the above information, create the Gantt chart using Microsoft Word, Powerpoint or Excel.
The following are useful resources for creating a Gantt chart using:
- Microsoft Powerpoint: https://www.youtube.com/watch?v=wp0vr6OkW8Y
- Microsoft Excel: https://www.youtube.com/watch?v=00s5efQWrgU&t=10s
- Microsoft Word: https://www.youtube.com/watch?v=F90RdA5X4G0
The Gantt chart created from the above data is shown below. The chart was created using Microsoft Powerpoint.

Step 4: Once the Gantt chart is complete, print it out and hang it on the wall of your study room/area. This serves as a constant reminder of the tasks that need to be done at any point in time, as well as of the progress that has been made so far.
The greatest strength in using the Gantt chart for PhD studies lies in its ability to help one plan ahead. Using the Gantt chart above as an example, the user can plan as follows:
- At the beginning of every month, look at what is required of you. For instance, the student above needs to complete module one of the coursework and at the same time start working on proposal writing.
The student can plan for module one in advance by going through the course structure and expected readings, and reading in advance before the start of the module so that he is able to follow and understand what is being taught. If there are pre- and post-module exams, the student can also prepare for them in advance.
Preliminary tasks for proposal writing can include: discussing your proposed topic with your supervisor, and searching for and quick review of literature to identify the gap that your topic will be addressing. All these can be done in the first month before the actual proposal writing starts.
- The Gantt chart can help you identify the skills that are required for the successful completion of your dissertation. For instance, the student above is expected to write a Business Management case study by June of year 2.
If the student does not have case study writing skills, he can start looking for courses that teach case study writing and complete them way before the deadline for the case study. Same case for skills such as preparing and writing a journal paper, writing a conference paper, data analysis using softwares such as Stata, SPSS, NVivo etc.
- The Gantt chart can help you plan for academic-related events such as conferences.
In the example provided above, the student is expected to attend two scientific conferences (in November of year 2 and March of year 3) and make presentations.
The student can start looking for conferences related to his field that are held during the proposed times and mark the key dates and requirements of the conferences (for instance, abstract submission deadlines, abstract submission guidelines, registration deadlines etc).
- The Gantt chart can help you create monthly and weekly plans for longer tasks such as proposal writing.
In the above sample Gantt chart, proposal writing and defense spans a period of 15 months. By March of the second year, the student is expected to defend his proposal. This may seem like such a long period of time but in reality it is not. This is because it is not the only task that the student will undertake during this period. As a result, it is easier to focus on the tasks at hand and forget about the tasks that seem to have adequate time.
Proposal writing is a daunting task and requires constant reading and updating. To ensure that the student submits his proposal in time, he can create monthly and weekly plans for the task. An example of monthly planning for the proposal writing is provided in the table below:
The monthly plan is based on assumptions, for instance, that the supervisor will review the document within the scheduled timeframe. This may or may not hold, depending on the supervisor.
It is therefore important to allow ample time for such factors that are out of your own control in order to ensure that the task is completed by the deadline.
The monthly plans can further be broken down into weekly (and even daily) plans, for instance:
- Number of papers to read per week (day).
- Number of words to write per week (day).
- How many citations and bibliographies to insert (update) every week (day).
- Number of additional articles to search and add to your library each week etc.
Each of these tasks contributes to the overall proposal writing and make the task completion easier and faster than waiting for the last few months to do it all at once.
A PhD is a medium- to long-term project depending on how long it takes to finish. It therefore requires effective and careful planning from the start of the program to ensure that each deliverable is completed within the stipulated time. The Gantt chart is an easy-to-create, and easy-to-use planning tool that can be used by all PhD students. Not only does it save the student time but it also gives him peace of mind knowing the progress of each and every task required.
Grace Njeri-Otieno
Grace Njeri-Otieno is a Kenyan, a wife, a mom, and currently a PhD student, among many other balls she juggles. She holds a Bachelors' and Masters' degrees in Economics and has more than 7 years' experience with an INGO. She was inspired to start this site so as to share the lessons learned throughout her PhD journey with other PhD students. Her vision for this site is "to become a go-to resource center for PhD students in all their spheres of learning."
Recent Content
SPSS Tutorial #12: Partial Correlation Analysis in SPSS
Partial correlation is almost similar to Pearson product-moment correlation only that it accounts for the influence of another variable, which is thought to be correlated with the two variables of...
SPSS Tutorial #11: Correlation Analysis in SPSS
In this post, I discuss what correlation is, the two most common types of correlation statistics used (Pearson and Spearman), and how to conduct correlation analysis in SPSS. What is correlation...
How to develop an awesome PhD timeline step-by-step

A successful PhD journey begins with a solid plan that includes a PhD timeline . A thought-through and well-designed PhD timeline requires some time but can be accomplished in a few simple steps.
Why a clear PhD research timeline matters
Step 1: decide what to include in your phd timeline, step 2: discuss your provisional phd timeline with your supervisor/s, step 3: design your phd timeline, step 4: regularly update your phd timeline.
Doing a PhD means committing to a challenging project that spans several years. Therefore, it is no surprise that doing a PhD can feel quite overwhelming. How do you even begin to tackle such a huge project?
A PhD timeline breaks down the daunting task of doing a PhD into an actionable plan with tasks and milestones along the way.
Even if not everything will go as planned (which is normal and no problem!), a PhD timeline can give PhD students peace of mind. A good plan, worked out in a PhD timeline, helps them to structure their time, communicate their goals and work toward specific targets.
Some PhD students are required to create a PhD timeline as part of their programme. Yet, even if PhD students are not required to do so, it is highly recommended to create a PhD timeline!
PhD timelines should be as diverse as PhD research projects: What you decide to include in your timeline should fit to your situation, goals and your programmes’ requirements.
Common elements included in a PhD timeline are the following:
- Data collection : How, when and where are you collecting your research data?
- Fieldwork : Is your data collection spread out or are you spending several weeks doing fieldwork? If so, when is this scheduled and how can you avoid overlaps with other requirements, such as coursework?
- Experiments : Are you running experiments for your PhD research? If so, when? And how long do you estimate this will take you?
- Data analysis : Once you have your data, be it quantitative or qualitative data, when and how do you analyse it? How much time do you block for this task?
- Writing plan : When are you writing down your results? How can you break down writing into different parts, for instance, writing goals per chapter or article?
- Publications : Publication requirements differ from PhD programme to programme. Even if you write your PhD as a monograph (instead of a selection of articles) , you should try to publish something during your PhD. When would you have an opportunity to do so, and how much time does it require?
- Conferences : Every PhD student should present at a conference during their PhD trajectory. Which conferences are you interested in? When do they take place, and when would you have findings to share at a conference?
- Coursework : What are your PhD programme’s coursework requirements? What courses are you interested in, and when are they offered?
- Other activities : Are there any other activities that are crucial for your PhD project? Think, for instance, about an extensive dissemination campaign, collaboration with external partners, internships, online activities etcetera.
Make a draft plan, including dates and times. Then move to Step 2: Discussing it with your supervisor/s!
Proactively creating your PhD timeline is a good step as a PhD student. However, you should share your thoughts and ideas with your PhD supervisor/s and get their input.
If possible, set up a meeting with your supervisor/s that is entirely dedicated to your PhD timeline. During this meeting, you can share what you created so far.
Then, you should discuss the following questions:
- Is there anything missing in the PhD timeline?
- Is the PhD timeline realistic?
- Should anything be removed from the PhD timeline to prioritise other tasks?
- Does the PhD timeline meet all the formal requirements to graduate within the designated amount of time?
- Is there institutional support and sufficient financial resources for activities such as fieldwork, conference attendance, etcetera?
Make sure to take notes during the meeting, as you will need the answers to these questions to edit your provisional PhD timeline.
Not only will this discussion help you to finalise your PhD timeline. It will also help you to get clarity on your supervisor/s’ expectations!
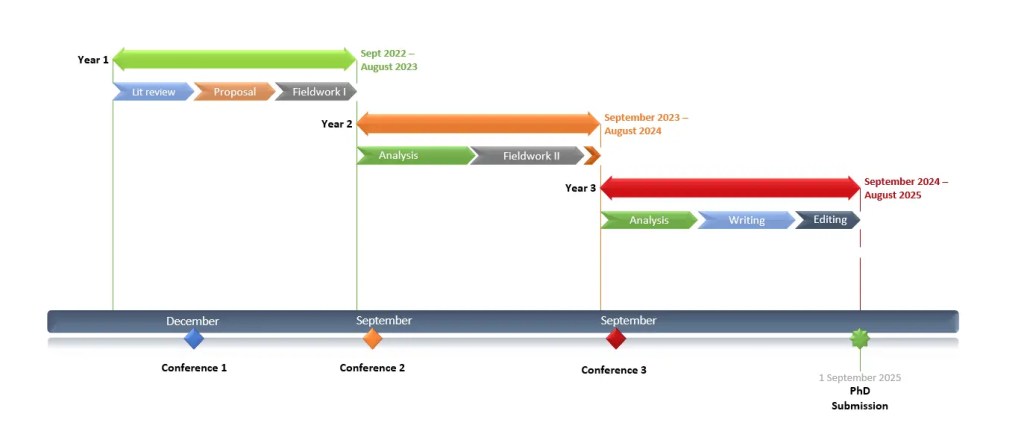
You may also like: Planning your PhD research: A 3-year PhD timeline example
Following the input of your supervisor/s, your PhD timeline will reach a more final stage. Now it is time to think about designing your PhD timeline:
A well-designed PhD timeline is not just pretty for the eyes, but it makes it much easier to have a good overview of all plans and milestones ahead.
Yet, it would be wrong to argue that there is a one-size-fits all solution to designing a perfect PhD timeline.
Maybe you are a very visual person and would prefer your timeline to illustrate a broad overview of the upcoming years. Maybe you are encouraged by checking things off your to-do list. In that case, a more detailed PhD timeline with many different tasks and milestones may be more suitable for you.
A common way to design PhD timelines is via Gantt charts. If you want to learn more about Gantt charts for your PhD timeline, check out my post on how to design Gantt charts in Microsoft Excel, Power Point and Word.
A PhD timeline is there to keep you on track and to showcase the milestones that you reached in your journey so far. However, while it is good to have a solid plan, the future is impossible to predict.
Your PhD timeline should be a living document or chart. Update it regularly!
For instance, a conference may be cancelled. You may have a period of sick leave. An experiment may not work out as planned. Or writing a paper takes longer than expected.
Successful PhD students remain flexible and don’t panic as soon as something does not work out as planned.
So, use your PhD timeline to regularly reflect on your progress and your current situation. Update your PhD timeline when needed, to prioritise tasks and set more concrete and achievable goals for the upcoming months.
Get new content delivered directly to your inbox!
Subscribe and receive Master Academia's quarterly newsletter.
Left your dissertation too late? Ways to take action now
The best email signatures for graduate students (with examples), related articles.

How to paraphrase a quote: 4 simple strategies

Revise and resubmit: Sample peer review comments and examples
13 great academic phrases to write your discussion (+ published examples)

Introduce yourself in a PhD interview (4 simple steps + examples)
Understanding and solving intractable resource governance problems.
- In the Press
- Conferences and Talks
- Exploring models of electronic wastes governance in the United States and Mexico: Recycling, risk and environmental justice
- The Collaborative Resource Governance Lab (CoReGovLab)
- Water Conflicts in Mexico: A Multi-Method Approach
- Past projects
- Publications and scholarly output
- Research Interests
- Higher education and academia
- Public administration, public policy and public management research
- Research-oriented blog posts
- Stuff about research methods
- Research trajectory
- Publications
- Developing a Writing Practice
- Outlining Papers
- Publishing strategies
- Writing a book manuscript
- Writing a research paper, book chapter or dissertation/thesis chapter
- Everything Notebook
- Literature Reviews
- Note-Taking Techniques
- Organization and Time Management
- Planning Methods and Approaches
- Qualitative Methods, Qualitative Research, Qualitative Analysis
- Reading Notes of Books
- Reading Strategies
- Teaching Public Policy, Public Administration and Public Management
- My Reading Notes of Books on How to Write a Doctoral Dissertation/How to Conduct PhD Research
- Writing a Thesis (Undergraduate or Masters) or a Dissertation (PhD)
- Reading strategies for undergraduates
- Social Media in Academia
- Resources for Job Seekers in the Academic Market
- Writing Groups and Retreats
- Regional Development (Fall 2015)
- State and Local Government (Fall 2015)
- Public Policy Analysis (Fall 2016)
- Regional Development (Fall 2016)
- Public Policy Analysis (Fall 2018)
- Public Policy Analysis (Fall 2019)
- Public Policy Analysis (Spring 2016)
- POLI 351 Environmental Policy and Politics (Summer Session 2011)
- POLI 352 Comparative Politics of Public Policy (Term 2)
- POLI 375A Global Environmental Politics (Term 2)
- POLI 350A Public Policy (Term 2)
- POLI 351 Environmental Policy and Politics (Term 1)
- POLI 332 Latin American Environmental Politics (Term 2, Spring 2012)
- POLI 350A Public Policy (Term 1, Sep-Dec 2011)
- POLI 375A Global Environmental Politics (Term 1, Sep-Dec 2011)
Planning the timeline and progress of your doctoral dissertation (or Masters/undergraduate thesis)
One of my PhD students lamented this week with me that she had a lot to juggle (taking children to and from schools and to and from activities, etc.) and that she needed a strategy to make her research move forward. I had been planning to write this blog post for a while, since this is the one question I get asked the most by doctoral students (“ how do I plan my unstructured time over the summer ” being the other one).
Do you have one like this but for dissertations? From how to pick your topic to how to plan your chapters or something similar? 🙂 — Mariana Miguélez (@Scherezadda) March 27, 2018
I had to rush to get this blog post done because my student is 2 years away from the deadline her university has imposed for her thesis defence, which is why I sat down with her last night to show her how I do things. I have two other PhD students at exactly the same stage (2 years to defense) so I figured I might as well finish this blog post.
While I’ve suggested that people read one (or more) of the books that I’ve digested myself (check my Writing a Doctoral Dissertation page), one of the main things I teach my students is how to apply backcasting techniques to develop a project plan . I was trained as a project manager, and I worked in that capacity for a number of years, so I understand exactly the kind of work that needs to be done to develop good project plans.
There are a few resources for students, which I mentioned on Twitter earlier today (October 5th, 2018), many of which are listed in the thread that will appear if you click anywhere on the tweet shown below. Thanks to everyone who responded to my query, though I think many of them were professors describing their own process, which is not the same as having a doctoral dissertation (ONE GOAL) to finish in X number of years. My students are doing theirs in the 3 papers’ model, which is a bit closer to the day-to-day life of a professor, but still, the trajectory is quite different. Anyhow, here are some recommendations (click on the tweet to expand the entire thread).
Everyone: one of my PhD students today asked me how to plan her day/week/month/time table. Can you tweet me your process before I tweet/thread mine? Thanks! (I'm off to dinner because I've already written 460 words). — Dr Raul Pacheco-Vega (@raulpacheco) October 3, 2018
The core planning strategy I would thus recommend doctoral, masters and undergraduate students is to engage in a combination of Gantt Chart Design and project backcasting techniques .
The Gantt chart is a technique I learned in graduate school when I took project management courses. This is a hypothetical Gantt chart for my doctoral student, covering about 15 months.

What I suggested to her was to use backcasting techniques to plan backwards from her goal (PhD thesis defense) to intermediate goals. This post explains how I backcast a project https://t.co/wAmyejeoa0 since her dissertation is a 3-papers one, I suggested she uses that model. — Dr Raul Pacheco-Vega (@raulpacheco) October 5, 2018
For Gantt Chart templates, you can see Dr. Emma Sheppard’s here.
Project planning for research students https://t.co/ku7shfB5uL excellent template by @DrESheppard which may be of interest to students from undergrad, Masters and PhD levels. pic.twitter.com/ujQVlYocH7 — Dr Raul Pacheco-Vega (@raulpacheco) September 3, 2018
Here is another resource that you can use to create Gantt Charts.
To do Gantt charts you can use Excel or Microsoft Project (which is how I learned to do them), or Visio (which has been bought by the evil company and is now Microsoft Visio). I liked this detailed approach that uses connectors between milestones and tasks https://t.co/xVjNmM1q7c — Dr Raul Pacheco-Vega (@raulpacheco) October 5, 2018
Hugh Kearns and Maria Gardiner have lots of resources on their site, and have published books on this as well.
I just realised @ithinkwell and @ithinkwellHugh have excellent FREE templates on their website https://t.co/Q859jNiM6Q for PhD students to plan their trajectories, etc. #PhDChat (thanks, Maria and Hugh!) — Dr Raul Pacheco-Vega (@raulpacheco) October 5, 2018
Dr. Patrick Dunleavy’s book “ Authoring a PhD ” is incredible and really does help students who are planning their PhD process. I recommend it to my own doctoral students.
And of course I would be remiss if I forgot to recommend Dr. Ellie Mackin Roberts (my coauthor for a forthcoming book on research planning) and her website. Ellie has A TON of downloadable printables for you to plan your own research. She is fantastic.
Both for doctoral students AND for post-PhD folks, my coauthor Dr. @EllieMackin has an entire website for research planning https://t.co/unXMqmaf2Z she offers FREE downloadable printable templates that you can use to plan your own research. — Dr Raul Pacheco-Vega (@raulpacheco) October 5, 2018
In the end, the process I recommended to my students and that I do myself is – set a target defense date and then work backwards and plan tasks, activities, and intermediate goals. For example, I have asked my students to plan submission dates for their 3 papers (to be sent to journals) and then schedule fieldwork and data analysis accordingly. This process has worked well, and I hope my description of the process will help my students and others!
In a subsequent blog post I’ll describe how to go from long-term goals (submit paper X by Y date) to daily tasks. That blog post will definitely apply to doctoral students and post-PhD folks.
If you liked this blog post, you may also be interested in my Resources for Graduate Students page, and on my reading notes of books I’ve read on how to do a doctoral degree.
You can share this blog post on the following social networks by clicking on their icon.
Posted in academia .
No comments
By Raul Pacheco-Vega – October 6, 2018
0 Responses
Stay in touch with the conversation, subscribe to the RSS feed for comments on this post .
Leave a Reply Cancel Some HTML is OK
Name (required)
Email (required, but never shared)
or, reply to this post via trackback .
About Raul Pacheco-Vega, PhD
Find me online.
My Research Output
- Google Scholar Profile
- Academia.Edu
- ResearchGate
My Social Networks
- Polycentricity Network
Recent Posts
- “State-Sponsored Activism: Bureaucrats and Social Movements in Brazil” – Jessica Rich – my reading notes
- Reading Like a Writer – Francine Prose – my reading notes
- Using the Pacheco-Vega workflows and frameworks to write and/or revise a scholarly book
- On framing, the value of narrative and storytelling in scholarly research, and the importance of asking the “what is this a story of” question
- The Abstract Decomposition Matrix Technique to find a gap in the literature
Recent Comments
- Hazera on On framing, the value of narrative and storytelling in scholarly research, and the importance of asking the “what is this a story of” question
- Kipi Fidelis on A sequential framework for teaching how to write good research questions
- Razib Paul on On framing, the value of narrative and storytelling in scholarly research, and the importance of asking the “what is this a story of” question
- Jonathan Wilcox on An improved version of the Drafts Review Matrix – responding to reviewers and editors’ comments
- Catherine Franz on What’s the difference between the Everything Notebook and the Commonplace Book?
Follow me on Twitter:
Proudly powered by WordPress and Carrington .
Carrington Theme by Crowd Favorite

- Jul 29, 2020
How I Made My PhD Completion Plan on Excel (With Template)
Updated: Dec 12, 2023
For the last few weeks, I've been working on my PhD completion plan. It's basically an excel spreadsheet that I'm using to track my progress and plan my time for the remainder of my PhD. My thesis is due August of next year (with a 6 month extension) so the clock is definitely ticking. But what started as a quick and basic gantt chart has quickly turned into a more complicated excel spreadsheet - and I love it so much I thought I'd share it with you all!
If you want to skip to accessing the excel template click the link below. But if you want to see how I made the document and how to use it, then keep on reading!
Basically, to make the Gantt charts I followed this Youtube tutorial:
I really wanted a Gantt chart that showed percentage progress as well as a general timeline, so I thought this tutorial was really useful for showing me how to do this!
If you start playing around with the Gantt charts in the template I've provided and run into any difficulties, particularly with things like changing the dates displayed on each chart, this is a good reference point as to how to fix problems that may arise. But of course, if you reach out to me for assistance with editing the spreadsheet, I'll do my best to help too!
The basic set up is that I have a colour coded table to the left of each Gantt chart within my file, that lists off each task with both my planned dates and my actual dates of start and completion for each task. Therefore, as I go along, if the dates that I actually do things don't correlate with my planned timeline, then I have a space to put the new dates down without losing my originally planned timeline. Basically, this set up allows me to have two options for what my Gantt chart looks like, I have the "Plan" view and the "Actual" view. I also have a column for % completion, so that on the "Actual" Gantt chart, it'll show me how far through I am with each task with a dark bar.

As I said, this all allows me to have two options for what my Gantt chart looks like, with both a planned and an actual dates option, I can control what I'm seeing on the chart using this nifty little drop down box:

By picking either actual or plan from the drop down box, it changes the display of the Gantt chart and what values come up in the second table entitled "Data Prep". You don't need to enter anything in the Data Prep table or do anything to it, it's all set up to get all the information it needs from the colour-coded table.
Then the sheet is set up to automatically create a Gantt chart like this one:

I've colour coded the chart based on three PhD Aims and general thesis writing. You'll notice that the dark bars indicate my percentage progress like I mentioned earlier, so if a bar is half way across, then the task is 50% complete. However, this will only show on the actual view, not the plan view.
If you change the dates for any of the planned or actual dates, it'll automatically update the Data Prep table and the corresponding Gantt chart.
Within the document, I have an overall Gantt chart to chart the whole PhD, but then I've also made tabs for each aim, where you can break each task down into smaller more actionable tasks and have a Gantt chart that displays those in detail. I've personally found this really useful so that I can both get an overall picture of my PhD, but also go into more detail for each aim or project when I need it.
I've also included a "Calendar View" option tab in the document. I don't think there's a way to automatically import dates of all your various tasks into the calendar, so you'll have to do it manually if this is a set up that would be beneficial for you. But personally, I liked being able to plan my day to day out on a calendar in order to know when I could put down tasks as planning to be performed on my Gantt charts. So I filled this calendar view out before I did any date planning on the charts. I obviously colour code these tasks for each aim and then general thesis writing in the same colours I've used to make the overall Gantt chart to make things easier to navigate and know what's going on at first glance.
I haven't included this in the template, but in my personal PhD completion plan document, I also have more tabs with experimental information like my immunohistochemistry antibody panels, so that I can quickly refer back to them while I'm looking at the timelines of completing my lab work for each project.
To access the most up-to-date version of this template, head to my new website at:
This excel sheet looks incredible and I cannot wait to use it: thanks for creating and sharing it with us!
Hello Lily,
My name is Hida and I am thankful for your kind sharing of this template. You have done a good deed and I also hope I can enjoy sharing my knowledge with others too. Thanks 😘
Love from Malaysia,
Hello, thank you so much for sharing this! very beneficial indeed. I need a little help, in extending the timeline beyond December 2021. Can you help me with it? Thanks a lot!
Hi Siti, the date axis are simply the dates on the gantt chart (top of the chart). If you click on those, the date axis will be selected
Hi, thanks for sharing and providing resources. Now that you are using notion how does this planning fit with that software? Or are you still using the gantt chart as your overall planning tool. Many thanks
How to Prepare Actionable PhD Research Plan Template
“Where PhD is highly uncertain, an actionable PhD research plan would give you calculative and tentative outcomes. And even more, the ready-to-use template makes things even better. Let’s take a close look at the research plan + template.”
Before moving forward, it’s important to understand the process and steps in research . Then only you can make an actionable plan for your PhD research. It’s literally like driving without breaks— that you don’t want.
In a broader sense, when you plan something, it shows two things: first, you are actually serious about the work you are planning and second, you are expecting some outcomes. And by a plan, you are heading towards it.
I know, plans may not work 100% all the time, but they may create a definite path to achieve at least 80% success in the work you are doing. This is also true for a PhD— in which you would constantly try to justify a single sentence– your research title.
So– Yes, the research process is undetermined and so the results too! but here is the catch and perhaps answer why you have to have a research plan. In this article, I will explain the importance of a research plan, an actionable research plan and a ready-to-use template for you.
How to prepare an actionable research plan?
Importance of phd research plan , wrapping up.
An actionable research plan is what you have to rely upon. So it should be perfect and approved. how can you prepare your own? Let’s see.
Understand the steps in the research and closely follow them.
Define the objectives and scope of your study.
Define each goal of your study– For example, sample collection, wet lab work, standardization, experimentation, data collection and interpretation, etc.
Enlist what types of problems you may face for each goal– For example, transportation for sample collection, Lack of facilities in wet lab work, etc.
Find a solution for each problem you have enlisted– For example, appoint an expert for sample collection and transport samples in a cold chain. If your lab doesn’t have some instruments or chemicals, priorly contact other labs and ask them for help.
Draw a rough road map for your work— the route using which you will achieve your research goals. Also, make a backup. What if the route or process you selected would not work? Check out this drawing to understand my point.

Now prepare a timeline— in how much time a particular goal should be achieved. For example, 6 Months for sampling (Including, ethical approval, approval from sampling authority, consent, preparation and arrangement for utilities).
Another is sample collection— 3 Months which isn’t covered in the 6 months of sampling objective, like this. Take a look at the drawing here.

Note: This timeline must match with your GANTT chart for PhD timeline because you are making an actionable plan.
Now your plan is reading. You are now aware of each objective, goal and problem. Some you probably solved, and some you can manage later. This you can print and stitch in your logbook or can save on your desktop.
Take a look at the advantages, and why it’s important to prepare an action plan.
Related article: How to Prepare a PhD Research Plan/Schedule?
Let’s start with two real-world examples first.
One of my friends, after sample collection and initiating the testing, found out that she also has to perform hormone assays for samples. The samples she collected are 3 months old— not possible to assess quantitative analysis.
Another colleague after sample collection– when he started working in the wet lab, came to know that one important instrument is not there in their lab. His guide is very serious about the goal that they have to do it anyhow.
He sent applications to various universities and research centers to work on that particular instrument. From approval to real testing, it tools all almost 8 months including, approval, training, transportation, etc.
Wasted much time!
- An actionable research plan saves your time— which is a crucial factor in PhD.
- It makes you aware of the pros and cons of your study.
- It makes you aware of the problems and limitations of the research you conduct.
- It gives you a broad roadmap to achieve your PhD in “some” tentative time.
- It gives you the flexibility to achieve goals and enjoy your time at the same time.
- You can make real-time monitoring of how your research is going and how much work is left.
- It makes you aware of what should be your next move and the preparations you required.
However, keep in mind that once you prepare a plan, review it from your guide, take their advice, enlist major objectives and techniques you would use for the study and stick to it.
Before preparing that, read the literature regarding your topic and understand the way in which your research should be headed.
Check out our fully customizable, ready-to-use and actionable research plan template.
Download a research plan template
These things look a bit old school but it works, really works well. Most students don’t do it and end up messing things and at last, came to know that they wasted their time. At least, the research plan will tell you where you are stuck (probably) and you can find a solution.
We know how hard it is to predict the future of PhD or how it would go. But let me tell you, with an actionable plan, many do well. And you can too. Take your doctorate seriously from day one. And do accordingly.
Remember your goal should be to complete your degree in time.

Dr. Tushar Chauhan is a Scientist, Blogger and Scientific-writer. He has completed PhD in Genetics. Dr. Chauhan is a PhD coach and tutor.
Share this:

- Share on Facebook
- Share on Twitter
- Share on Pinterest
- Share on Linkedin
- Share via Email
About The Author
Dr Tushar Chauhan
Related posts.

A Definite Research Process for PhD- What Students Should Know?

What are Research- Aim, Objectives, Tasks/Goals? [Our System]
Leave a comment cancel reply.
Your email address will not be published. Required fields are marked *
Save my name, email, and website in this browser for the next time I comment.
Notify me of follow-up comments by email.
Notify me of new posts by email.
- Undergraduate courses
- Postgraduate courses
- Foundation courses
- Apprenticeships
- Part-time and short courses
- Apply undergraduate
- Apply postgraduate
Search for a course
Search by course name, subject, and more
- Undergraduate
- Postgraduate
- (suspended) - Available in Clearing Not available in Clearing location-sign UCAS
Fees and funding
- Tuition fees
- Scholarships
- Funding your studies
- Student finance
- Cost of living support
Why study at Kent
Student life.
- Careers and employability
- Student support and wellbeing
- Our locations
- Placements and internships
- Year abroad
- Student stories
- Schools and colleges
- International
- International students
- Your country
- Applicant FAQs
- International scholarships
- University of Kent International College
- Campus Tours
- Applicant Events
- Postgraduate events
- Maps and directions
- Research strengths
- Research centres
- Research impact
Research institutes
- Durrell Institute of Conservation and Ecology
- Institute of Cyber Security for Society
- Institute of Cultural and Creative Industries
- Institute of Health, Social Care and Wellbeing
Research students
- Graduate and Researcher College
- Research degrees
- Find a supervisor
- How to apply
Popular searches
- Visits and Open Days
- Jobs and vacancies
- Accommodation
- Student guide
- Library and IT
- Partner with us
- Student Guide
- Student Help
- Health & wellbeing
- Student voice
- Living at Kent
- Careers & volunteering
- Diversity at Kent
- Finance & funding
- Life after graduation
Research projects & dissertations
Managing a research project.
The following guide has been created for you by the Student Learning Advisory Service . For more detailed guidance and to speak to one of our advisers, please book an appointment or join one of our workshops . Alternatively, have a look at our SkillBuilder skills videos.
The stages of a research project
The basic stages involved in undertaking a university research project are as follows:
1. Choose your research area
Usually, it is best choose an area that you have already studied or are studying within your academic field. Not only will this help you identify potential research, but you can be confident in finding a suitable supervisor and reliable sources within the university. Choosing an area that you also find particularly interesting will help sustain your engagement.
2. Conduct preliminary research (scope out the topic)
Survey current research surrounding your chosen subject area. Reflect on it carefully, and take advice from academic staff to establish what has already been written on your chosen subject area. This will enable you to identify what you can do that has not been done before.
3. Decide your research topic
Clearly define and delineate your research topic. The more clearly you do so the more confidence and clarity you will have in what you are trying to achieve, and the easier it will be for you to monitor your progress. If you’re uncertain what you’re trying to achieve, how will you know whether you’re on course or not?
At this stage you might also formulate a provisional research question – that is, the question your research will answer:
Research topic: Investigate ‘A’ and ‘B’ to see if/how they interrelate.
Research Question: ‘To what extent is A caused by B?’
4. Decide your methodology
As you are deciding your topic, you should be investigating and considering your research methodology – how you will conduct your research. Is it going to be experimental, observational, theoretical, textual, qualitative, quantitative? Will it involve human subjects? Are there ethical considerations – specific protocols, procedures or approaches to follow? Think about the research method you have chosen; what advantages does it give? What insights might it yield? What difficulties might it pose? How has it been used before in your field of study?
5. Submit/present your research proposal for approval
Most schools have a formal deadline for receiving research proposals/dissertation plans, and a formal approval process. In some cases this is an assessment stage – so make sure you know exactly what you need to submit, and when, in order to progress with your project. Your school will have given you guidance about what your proposal should include. Generally, the common elements are:
- Your main research question/problem/title
- Questions or concerns that will help you solve your main research problem
- A brief literature review or list of key texts/sources
- An overview of your methodology
- A timeline showing your main research project tasks
6. Finalise your topic and methodology
You may need to revise your research plan in the light of feedback you receive during the approval process. Many students are overambitious in their aims; academic staff have a much clearer idea of what is achievable and necessary in terms of a successful research project, so be guided by their advice. You may also need to modify your methodology in the light of your initial research, or a pilot study. It may be necessary, for example, to alter a questionnaire that isn’t generating the data you were expecting.
7. Conduct your research (fieldwork)
This might take place in a laboratory, in a library or archive, at a computer, on the streets or in a field. Whatever the location, this is the practical activity of collecting raw information or data. Be aware that what you think you are going to find out, and what you actually do find out, can often be very different, so be prepared to alter your research aims/question accordingly.
8. Analysis/data processing
Whatever your research topic, you will need to analyse and process the information you have collected in order to make sense of it. This might involve statistical analysis, generating graphs, charts or tables, organising information into categories, or critical appraisal of texts or events. As well as finding out something, you need to understand what it means within your academic field.
9. Writing up
This is the process of producing the written document – your dissertation or thesis – upon which your research project will be assessed. Allow enough time to improve and revise your work through a series of drafts, and to edit and proof-read the final document – including ensuring that any graphs/images referred to in the text are properly numbered and labelled, and that your referencing is error-free – before formatting and binding the finished document. Do not underestimate how long the writing up process will take.
10. Submission
All academic research projects are time constrained, so you will have a specific deadline for submitting your work. With longer research projects, you will also have intermediate deadlines (e.g. progress/upgrade boards). Consequently, you will need to time-manage each stage of your work to ensure that you complete the overall project on time.
Project managing your research
Any complex project involving multiple activities and deadlines requires some form of management. Using simple project management techniques will allow you to keep control of your research project – to schedule your work more effectively, to identify how much time you have to spend on each stage, to create intermediate milestones that will tell you if you’re on schedule or not (and allow you to respond accordingly) and give you a clear overview of your progress.
One simple but highly effective technique is to produce a Gantt chart. This provides you with a clear visual plan of your research project, based on scheduling the different stages involved against a time base. The example below (Figure 1) is based on the ten basic research project stages, scheduled against two (hypothetical) formal deadlines – submission of the proposal in week 10 and submission of the finished dissertation in week 24:
Figure 1: Simple research project Gantt chart
This example is typical of an undergraduate or taught Masters’ dissertation. Longer research projects (PhD, Masters by research, etc.) will generally have more activities spread over a longer timeframe (See below, Figure 2, for an example of a project plan for a humanities PhD).
Figure 2: Humanities PhD example Gantt chart
In project management, the scheduling of individual activities is always worked backwards from the deadline. Thus, the amount of time that you have to complete each task is a function of the overall project schedule. As shown above, some tasks have to be carried out consecutively (i.e., you can’t start the next task until you’ve completed the previous one), but other tasks can be carried out at the same time, or started before the previous task has been completed, (e.g. you might be able to start analysing your data whilst you’re still collecting it). What you also need to bear in mind with undergraduate dissertations is that your research project constitutes only one part (25%) of your academic activities, and that you’ll be working on other assignments, reading, exam revision, etc, at the same time. As such, it is important that you make full use of the available time period and balance your priorities accordingly.
Tip: With longer-term projects such as these, it can be difficult to stay focused and motivated. Try to dedicate some time to your project every day/week (depending on your other academic commitments) and break your tasks down into smaller chunks so that they are more manageable. The Pomodoro technique can also be helpful for generating small bursts of concentration. If you are struggling, maybe read an article on your topic to remind yourself of your interest in the area, or talk to fellow students or your supervisor(s).
Autonomous Agents Research Group
- Publications
- Reading Group
Handbook for PhD Students
This PhD Handbook serves a dual purpose: it describes the research methodology of our group and gives general advice to students, and it sets out the standards and processes that all students in the group are expected to strive for.
Creating a timeline (Gantt chart) of your activities is a useful tool to keep track of your PhD work. Examples of activities include:
- Coursework (state course acronyms)
- Teaching (state course acronyms)
- Research (this could be further broken down, e.g. reading, implementation, evaluation, etc)
- Paper writing for conference X
- Internship at company Y
- Interruption (state reason)
Keeping track of your activities helps you reflect on how you use your time, and whether you may want to adjust your work plans/habits to make more efficient use of your time. One software option is GanttProject , but many other apps exist. You can use the software to export an image that you can share with me and use in your annual PhD review meetings.
Return to PhD Handbook
How to write a Research Proposal: Creating a Gantt chart
- Components of a research proposal
- Useful videos
- Common mistakes to avoid
- Sage Research Methods LibGuide This link opens in a new window
- Managing sources
- Request a literature search
- Research proposal - examples
- Creating a Gantt chart
- Free Apps for Research
- Academic writing
What is a Gantt chart
Some University departments require students to create a Gantt chart to represent a schedule for the research project. The Gantt chart shows the timelines of the various steps of the project including their dependencies and any resources needed . In other words, the chart depicts when an event is supposed to take place in your project by providing an outline regarding the order in which the various tasks need to be performed .
An example of a Gantt chart.

Gantt chart on Moodle
How to create a Gantt chart - videos
- << Previous: Research proposal - examples
- Next: Free Apps for Research >>
- Last Updated: Dec 19, 2023 12:35 PM
- URL: https://libguides.unisa.ac.za/research_proposal
The Research Whisperer
Just like the thesis whisperer – but with more money, how to make a simple gantt chart.
In every grant application, I want to see a simple visual guide (a Gantt chart ) that shows what you are planning to do. It is the perfect time to plan your project clearly. It shows the assessors that you have thought about your research in detail and, if it is done well, it can serve as a great, convincing overview of the project.
Clearly, these charts are hard to do. If they were easy, more people would do them, right?
Here are five steps to create a simple guide to your research project.
1. List your activities
Make a list of everything that you plan to do in the project. Take your methodology and turn it into a step-by-step plan. Have you said that you will interview 50 people? Write it on your list. Are you performing statistical analysis on your sample? Write it down.

Check it against your budget. Everything listed in the budget should also be listed on your uber-list? Have you asked for a Thingatron? Note down that you will need to buy it, install it, commission it… What about travel? Write down each trip separately.
2. Estimate the time required
For each item on your list, estimate how long it will take you to do that thing. How long are you going to be in the field? How long will it take to employ a research assistant? Realistically, how many interviews can you do in a day? When will people be available?
Initial meeting: about 3 weeks to find a time. Desk audit: 4 months. Draft key elements: about 1 week each. Testing: about 1 week each, but can start organising as soon as first element is drafted. Write up: 2 months. Final report: no time, really – just need to find a time to meet.
Generally, I use weeks to estimate time. Anything that takes less than a week I round off to a week. Small tasks like that will generally disappear from the list when we consolidate (see Step 4). Then I group things together into months for the actual plan.
3. Put activities in order
What is the first thing that you are going to do? What will you do next? What will you do after that?
In the comments, Adrian Masters provided some great questions to help with this stage: What do I need to do by when? What do I need from others & when? How do I check that I am still on track?
One by one, put everything in order. Make a note of any dependencies; that is, situations where you can’t do one thing until another is started or finished. If the research assistant is going to do all the interviews, then the interviews can’t start until the research assistant is hired.
Where possible, you should eliminate as many as possible dependencies. For example, if you can’t find a decent research assistant, you will do the fieldwork yourself (but that might mean that work will be delayed until you finish teaching). It isn’t a necessary step to getting your time-line in order, but it is good project management practice.
In the comments, Amy Lamborg pointed out that you might want to work backwards . If you have a fixed end date, you might want to “…build back towards the project start date, then jiggle everything until it fits !” If you want an example of this, have a look at the post “ Work backwards “. It is about writing an application, but the principle of starting with the fixed end date and working backwards still applies.
4. Chunk it up
Now that you have an ordered list, and you know how long everything will take, you need to reduce the list without losing any specificity. At the same time, if you are combining tasks, you might want to add a bit of time as a contingency measure.
Meet with partners: 3 weeks. Review data protection regimes: 4 months. Draft three key elements: 3 months. Test three key elements: 3 months, with some overlap. Analyse test results and report: 3 months.
How you divide up your time depends on your project. If it is only one year long, you might list items by month. If your project is three years long, then you might list items by quarter. If you are planning over five years, you might break it down to six-month periods.
5. Draw me a picture
If you use project management software to manage your project, and you are comfortable with it, then use it to produce a summary of your project, too.
Most project management software (e.g. like Microsoft Project) will allow you to group activities into summary items. Chunk your tasks into major headings, then change the time interval to your months, quarters, half-years, or whatever you have chosen to use.
Or you can just draw it up with word-processing software (which is what I always do), spreadsheet software, or even hand-draw it.

Frankly, I don’t care – as long as it ends up in your application!
Also in the ‘simple grant’ series:
- How to write a simple research methods section .
- How to make a simple research budget .
Share this:
62 comments.
This is useful. I’m writing my first SERIOUS research proposal for my PhD. Obviously not something I’ve ever done before so all advice is greedily welcome.
My best advice – write something quickly and then get someone else to look at it. I’m a big fan of quick iterations to get started.
Your readers might be interested in Tom’s Planner ( http://www.tomsplanner.com ). It’s a very easy tool to help you create a schedule or project plan (and there is a free version). On our blog we have a bunch of guest blogs about planning your thesis or dissertation with a template and example to help you get started.
The free version is a farce you cannot print, export or do anything but view it online. So don’t waste time with this product it is not a real proof of concept.
Sometimes, when the chunks are too big, you end up failing to understand what’s in those chunks, then your estimate ends up WAY off when you realize the extra work you didn’t consider might go into a give task.
That looks like a useful technique for getting the right information together for a Gantt. I’d be interested in any techniques for step 5. It’s something I’ve done recently as part of my first year PhD report and I wrote about how I produced my Gantt chart here: http://phdtools.blogspot.com/2011/08/creating-gantt-charts.html
I can’t imagine many people use MS project to manage their entire PhD (I could be wrong?) therefore it seems a bit excessive to use it just for a Gantt chart. Equally I find Excel plots look a bit naff and it’s difficult to show linkages between items.
“I’m not looking for a tool to perform PERT or CPM or do resource levelling for me.”
Absolutely! I just want to plug in my info and get a simple image out. How hard is that?
I’m not a big fan of big-iron project management tools either. More time seems to go into managing the information than getting actual work done.
I do think that most group projects that are going to last twelve months or more could do with a simple project management tool, though. I’m a bit of a fan of Basecamp , even if it doesn’t draw Gantt charts.
Of course, everybody has to understand the tool and want to use it, which is a different matter.
Thanks for the post.
I’m currently trying my hand at project management software, but I seem to find it easier to simply write down stuff in a piece of paper before committing it to electronic format. Anybody else has the same issue?
Absolutely, Carlos. As someone who has managed a big project that included spending a lot of time wrangling MS Project, I’m a big fan of just scribbling it down on paper and then mocking it up in MS Word.
[…] How do you create a Gantt chart? The best advice we have seen is at the useful Research Whisperer blog, where they list 5 steps to creating your very own Gantt Chart in the post ‘How to make a simple Gantt chart’. […]
Excellent introduction to project planning. I’ve seen recent examples of project managers jumping into MS Project without this level of thinking, with predictable results.
Questions that should help (and which you would need to answer anyway when asked by seeking funding or approval) include: What do I need to do by when? What do I need from others & when? How do I check that I am still on track?
Build those answers into the simple paper approach above, and you’ll have covered the critical project basics (activities, resources, dependencies, scheduling, milestones and checkpoints)
Like Liked by 1 person
Thanks, Adrian.
I liked your questions so much, I added them into the original post. 🙂
An Excel bar chart is pretty much all you need to create a Gantt chart. Unless of course you intend to explore resourcing and costs.
Your info really helped me by doing my D.T ( Design Technology) homework. Thank You 🙂 Eirene Masri From Jordan, Amman
Thanks for your comment. It made me smile. 🙂
I haven’t been to Jordan for a very long time, but I had a great time when I was there.
[…] that you are going to do? What will you do next? What will you do after that? In the comments, Adrian Masters provided some great questions to help with this […]
Thanks for this particular piece of ‘whisper’… I was in a dire need of a ‘quickie’ method to make a simple Gantt Chart. 😀
Cheers, Yan London
No worries, Yan. Happy to help.
[…] Jonathan. “How to make a simple Gantt Chart” The Research Whisperer. 13 September […]
I have just gone through.Iam also planning to undertake a phd programme and would want to recieve guild as i make progress using gantt Chart
Reblogged this on Queer Fear: Alternative Gothic Literary and Visual Cultures and commented: Stumbled across this useful piece on the use of Gantt charts in research projects. I realise this may seem rather common knowledge to scientists but as a Arts and Humanities-based person I found it gave useful insights for new researchers.
Thanks, Hanoconnor.
I suspect that there are plenty of science people who don’t get any formal training in this, either.
good job. very helpful
[…] Read More At: https://theresearchwhisperer.wordpress.com/2011/09/13/gantt-chart/ […]
This is my first time using a Gantt chart in research paper.. hmm. thanks for the info. 🙂
Gantt charts are really useful. Thanks for posting this information about gantt charts. This is a very informative post and very helpful, too.
Thanks Jonathan. I have just completed my first Gantt chart for my Doctorate in Health. I was beginning to get a bit jumpy about some of the very involved instructions I had found previously so your ‘idiots guide’ was really helpful.
No worries, Ade.
Happy to help. Good luck with your doctorate.
I have been using a Gantt chart to plan and track my doctorate since I began last year. It’s just an Excel spreadsheet but suits my purposes, very simple. One thing I’ve found useful us to mark all the highlighted cells bright blue initially, for ‘future action’. Each week, I update that week’s column to green (completed) or red (overdue). This gives me good feedback not only about where I need to change the priorities on my current ‘to do’ list, but is a very satisfying display of how much I’ve already done.
I love Excel, postgradpanda. I reckon that seeing the blue change to green would be very satisfying.
Thanks for this.
[…] https://theresearchwhisperer.wordpress.com/2011/09/13/gantt-chart/ […]
Thanks for this. It helped me alot for doing our work schedule in research for short allotted time.
Ohh Thank God Jonathan for that!! you have no idea how much you saved my life.. I was having a real hard time planning my first ever research proposal Loved it alot.. Looking forward for much guidance along the path!!!
Sruti… (From a far far away land.. INDIA)!! 🙂
Thanks, Sruti
Happy to help.
Sruti was right. It’s very helpful to me as well. Saves me a lot of trouble. Keep it up Jonathan.
No worries, Paul
Are you a commercial representative for Ganttic, or did you link to them because you like them? Just wondering.
[…] published a short article about doing research in academia. Some of their articles are mundane (How to make a simple Gantt chart), whereas others are more esoteric (Hashing it over) and heartfelt (Academic […]
[…] out your timeline and your budget. Working up a Gantt chart for your project will force you to think about how long different phases of the project will take. This is important […]
list any six elements that go into the format of a research report?
Hi abukamara
I don’t have a set list. It depends who your audience is, and what sort of report you are writing.
I’m usually helping people to write grant applications, where the format is set by the funding agency. They make it pretty simple, really – they generally tell you exactly what they want.
[…] logframe analysis is well worth reading, while the Research Whisperer explains how to make a simple Gantt chart. And Mind Tools overviews a range of project scheduling tools as does this from MIT. Over at […]
[…] take you three or maybe three-and-a-half years. However, PhDs in my area rarely follow the sort of gantt chart anybody approving funding, ethics clearance or candidature milestones might approve. A tangent I […]
[…] How to make a simple Gantt chart – Jonathan O’Donnell. […]
Jonathan, i suppose that you should try more intuitive service) My experience in project management tells me there are a lot of comlicated tools such as MS Project. After years of searching and trying (Wrike, Liquid Planner, Smartsheet) i start using GanttPRO, especially because of its simplicity and high visibility. So try GanttPRO to facilitate workflow.
[…] O’Donnell, J 2011, How to make a simple Gantt chart, The Research Whisperer, weblog, 13 September, viewed 23 April 2017, < https://theresearchwhisperer.wordpress.com/2011/09/13/gantt-chart/> ;. […]
[…] research design is important. Following the steps outlined in O’Donnell’s (2011) blog How to make a simple Gantt Chart, I constructed this graph and a risk matrix to ensure that my time was used efficiently. […]
[…] Other tips on Gantt charts, including how to make one manually: https://theresearchwhisperer.wordpress.com/2011/09/13/gantt-chart […]
Thanks Jonathan! I am a grant writer, and your post is a great reminder that I should probably make a timeline visually appealing, like your hand-made Gantt. I’m going to do it!
I wanted to point out that for a grant funded project (which often has a specified end date by which the money must be spent), I often find myself making a timeline backwards. That is, I start creating the timeline from the specified end date, and then ask myself the questions that Adrian Masters posed: What do I need to do by when? What do I need from others & when? I build back towards the project start date, then jiggle everything until it fits!
BTW, did you know that in your text descriptions of the example timeline, the time is in weeks, but in your Gantt chart the time is in months? I have a feeling that you really meant for these to match….
Like Liked by 2 people
Thanks, Amy
This article has been viewed over 150,000 times, and you are the first person to point out the weeks / months issue. I’ve fixed it now (although it is a bit of a bodge).
I agree with the backwards process, so much so that I wrote a post about it: Work backwards . It is about the grant writing process, but the principle is the same.
This particular instance was one of those rare times when I truly didn’t have an end date, and could work out the actual time the project would take (surprise – it took longer).
I’ve added a bit into the post about working backwards. Thanks for that.
Proofreading touchdown? You just made my day! Thanks for this, and for Research Whisperer in general. I am probably not really your intended audience, but I get a lot of value from all the posts. You-all do good work!
[…] Research Whisperer. (2016). How to Make a Simple Gannt Chart.[online] Available at: https://theresearchwhisperer.wordpress.com/2011/09/13/gantt-chart/ [Accessed 14 Mar. […]
[…] O’Donnell, J 2011, ‘How to make a simple Gantt chart’, The Research Whisperer, 13 September, viewed 13 April 2018, < https://theresearchwhisperer.wordpress.com/2011/09/13/gantt-chart/> ;. […]
[…] you know how to make a simple Gantt […]
[…] How to make a simple Gantt chart: This article provides steps on making a Gantt chart (generally, not specific for PhD). […]
[…] “How to Make a Simple Gantt Chart,” by Jonathan O’Donnell on The Research Whisperer […]
[…] analysis of all their blog search terms. His analysis showed lots of people were looking for how to make a simple Gantt Chart. Jonathan’s excellent analysis left me wondering: what do readers think is ‘high value […]
If your university has the Microsoft suite of programs Viso (I think it is called) is easy to learn the basic functions to make a Gantt and the nice thing is that when you change a date the program moves the bars for you so fewer errors 🙂 winning.
Thanks, Wendy. Good advice.
[…] complex, messy, and not as linear as suggested by the timeline of activities we outline in project Gantt charts. During my doctorate, there were twists and turns as I made decisions around which literature to […]
[…] webinars should I register for? What about grants? Reading groups? Mentoring? How exactly does a research GANTT chart work (or does it)? How can I get research and writing done without sacrificing my entire summer on […]
[…] my various projects. This method was originally inspired by two academic Gantt chart enthusiasts (one, two). However, I found that the traditional way of setting up a gantt chart (with the projects on […]
Leave a comment Cancel reply
This site uses Akismet to reduce spam. Learn how your comment data is processed .

- Already have a WordPress.com account? Log in now.
- Subscribe Subscribed
- Copy shortlink
- Report this content
- View post in Reader
- Manage subscriptions
- Collapse this bar
- Activity Diagram (UML)
- Amazon Web Services
- Android Mockups
- Block Diagram
- Business Process Management
- Chemical Chart
- Cisco Network Diagram
- Class Diagram (UML)
- Collaboration Diagram (UML)
- Compare & Contrast Diagram
- Component Diagram (UML)
- Concept Diagram
- Cycle Diagram
- Data Flow Diagram
- Data Flow Diagrams (YC)
- Database Diagram
- Deployment Diagram (UML)
- Entity Relationship Diagram
- Family Tree
- Fishbone / Ishikawa Diagram
- Gantt Chart
- Infographics
- iOS Mockups
- Network Diagram
- Object Diagram (UML)
- Object Process Model
- Organizational Chart
- Sequence Diagram (UML)
- Spider Diagram
- State Chart Diagram (UML)
- Story Board
- SWOT Diagram
- TQM - Total Quality Management
- Use Case Diagram (UML)
- Value Stream Mapping
- Venn Diagram
- Web Mockups
- Work Breakdown Structure
3 year PhD timeline [classic]
You can easily edit this template using Creately. You can export it in multiple formats like JPEG, PNG and SVG and easily add it to Word documents, Powerpoint (PPT) presentations, Excel or any other documents. You can export it as a PDF for high-quality printouts.
- Flowchart Templates
- Org Chart Templates
- Concept Map Templates
- Mind Mapping Templates
- WBS Templates
- Family Tree Templates
- Network Diagram Templates
- SWOT Analysis Templates
- Genogram Templates
- Activity Diagram
- Class Diagram
- Collaboration Diagram
- Component Diagram
- Data Flow Diagrams(YC)
- Deployment Diagram
- Object Diagram
- Sequence Diagram
- State Chart Diagram
- Use Case Diagram
Related Templates
COMMENTS
Example Gantt chart for a UK, European and Australian PhD. For Ph.D. programs outside the United States, especially in Europe and some other parts of the world, students often go straight into research without the need for coursework. Here are some common steps for such programs:
Manually creating a PhD timeline Gantt chart in PowerPoint is a bit easier than in Excel. Therefore, I will explain the process here. First, you need to open a blank PowerPoint slide. Then click on Insert (1.), then Chart (2.). A popup will appear.
Example: Planning year 3 of a 3-year PhD; Example of a 3 year PhD Gantt chart timeline; Final reflection; Elements to include in a 3-year PhD timeline. Every successful PhD project begins with a proper plan. Even if there is a high chance that not everything will work out as planned. Having a well-established timeline will keep your work on track.
Steps involved in creating a Gantt chart for PhD studies. Step 1: List all the deliverables expected of your PhD program. In this example, the PhD program has the following requirements: Coursework, divided into 4 modules each lasting 2 weeks. All 4 modules need to be completed within the first year of study.
Example of a Gantt chart PhD timeline. Step 4: Regularly update your PhD timeline . A PhD timeline is there to keep you on track and to showcase the milestones that you reached in your journey so far. However, while it is good to have a solid plan, the future is impossible to predict.
The image of 36 months GANTT chart plan for a PhD. PhD GANTT chart for research . Research has been such a crucial parameter in PhD. Every research starts with sample collection and ends with data collection. The stepwise process of PhD research included many other important steps. One trait of research is 'uncertainty'.
The Gantt chart is a technique I learned in graduate school when I took project management courses. This is a hypothetical Gantt chart for my doctoral student, covering about 15 months. What I suggested to her was to use backcasting techniques to plan backwards from her goal (PhD thesis defense) to intermediate goals.
How to Propose/Report PhD Research progress with Gantt Charts! #GanttChart #PhDProductivity #PhDTips (long title)MANAGE PHD PROJECTS WITH GANTT CHARTS | In t...
Do you use a Gantt chart for your PhD studies? If not, watch this video to learn why you should create one and how to use it for effective management of your...
Hi! This is my first ever video and I talk about one of my favourite planning tools: The Gantt Chart! This is an introductory video and I made this as an aid...
Plan and monitor your PhD with a Gantt chart and include all of your activities in implementing Open Science practices to ensure efficiency and societal impact of your research work and efforts. This Gantt chart provides you with an example and template plan for your Ph.D. from thesis proposal writing to the thesis defense. Live spreadsheet ...
A screenshot of an ideal GANTT chart. You can prepare a month-wise planning, individual semester-wise planning and goal-wise planning etc. I will explain these things in upcoming articles on 5 different types of GANTT charts for PhD. Custom writing services: If you find difficulties in preparing a research plan, synopsis, proposal or GANTT chart.
Within the document, I have an overall Gantt chart to chart the whole PhD, but then I've also made tabs for each aim, where you can break each task down into smaller more actionable tasks and have a Gantt chart that displays those in detail. I've personally found this really useful so that I can both get an overall picture of my PhD, but also ...
Another is sample collection— 3 Months which isn't covered in the 6 months of sampling objective, like this. Take a look at the drawing here. Timeline for each research goal. Note: This timeline must match with your GANTT chart for PhD timeline because you are making an actionable plan. Now your plan is reading.
Decline. This simple yet dynamic excel template will help you to stay on top of your PhD commitments and be more effective when organising your projects! It can be used to map out your remaining PhD duration, predict your time commitments when applying for candidacy or plan out a large-scale research project. Also suitable for undergraduate ...
Take a look at this example dissertation plan which takes the format of a Gantt chart: Managing your time Example dissertation plan Gantt charts can be created in Excel but there are some online tools that make it even easier. When creating your own Gantt chart, bear in mind, each stage can take varying lengths of time. ...
Figure 1: Simple research project Gantt chart This example is typical of an undergraduate or taught Masters' dissertation. Longer research projects (PhD, Masters by research, etc.) will generally have more activities spread over a longer timeframe (See below, Figure 2, for an example of a project plan for a humanities PhD).
Open Science Communication and Research Project Management Training and Consulting. DOI: 10.21428/51e64700.e51360d0. Plan and monitor your PhD with a Gantt chart and include all of your activities ...
My 4 Year Plan for my PhD in a GANTT Chart - Computer Science PhD StudentHey Everyone! I am sharing with you how I have planned my entire PhD using a GANTT c...
This PhD Handbook serves a dual purpose: it describes the research methodology of our group and gives general advice to students, and it sets out the standards and processes that all students in the group are expected to strive for. Your PhD timeline direct link. Creating a timeline (Gantt chart) of your activities is a useful tool to keep ...
The Gantt chart shows the timelines of the various steps of the project including their dependencies and any resources needed. In other words, the chart depicts when an event is supposed to take place in your project by providing an outline regarding the order in which the various tasks need to be performed. An example of a Gantt chart.
Image 2 of 2. PhD Planning Gantt Chart Excel Template. $5.00. For the cost of a single coffee, gain access to my Gantt chart template, designed to help you to stay on top of your PhD commitments and be more effective when organising your projects! This simple yet dynamic excel template can be used to map out your remaining PhD duration, predict ...
Draft key elements: about 1 week each. Testing: about 1 week each, but can start organising as soon as first element is drafted. Write up: 2 months. Final report: no time, really - just need to find a time to meet. Generally, I use weeks to estimate time. Anything that takes less than a week I round off to a week.
Use Creately's easy online diagram editor to edit this diagram, collaborate with others and export results to multiple image formats. You can easily edit this template using Creately. You can export it in multiple formats like JPEG, PNG and SVG and easily add it to Word documents, Powerpoint (PPT) presentations, Excel or any other documents.