- Privacy Policy
Home » Quantitative Research – Methods, Types and Analysis

Quantitative Research – Methods, Types and Analysis
Table of Contents

Quantitative Research
Quantitative research is a type of research that collects and analyzes numerical data to test hypotheses and answer research questions . This research typically involves a large sample size and uses statistical analysis to make inferences about a population based on the data collected. It often involves the use of surveys, experiments, or other structured data collection methods to gather quantitative data.
Quantitative Research Methods

Quantitative Research Methods are as follows:
Descriptive Research Design
Descriptive research design is used to describe the characteristics of a population or phenomenon being studied. This research method is used to answer the questions of what, where, when, and how. Descriptive research designs use a variety of methods such as observation, case studies, and surveys to collect data. The data is then analyzed using statistical tools to identify patterns and relationships.
Correlational Research Design
Correlational research design is used to investigate the relationship between two or more variables. Researchers use correlational research to determine whether a relationship exists between variables and to what extent they are related. This research method involves collecting data from a sample and analyzing it using statistical tools such as correlation coefficients.
Quasi-experimental Research Design
Quasi-experimental research design is used to investigate cause-and-effect relationships between variables. This research method is similar to experimental research design, but it lacks full control over the independent variable. Researchers use quasi-experimental research designs when it is not feasible or ethical to manipulate the independent variable.
Experimental Research Design
Experimental research design is used to investigate cause-and-effect relationships between variables. This research method involves manipulating the independent variable and observing the effects on the dependent variable. Researchers use experimental research designs to test hypotheses and establish cause-and-effect relationships.
Survey Research
Survey research involves collecting data from a sample of individuals using a standardized questionnaire. This research method is used to gather information on attitudes, beliefs, and behaviors of individuals. Researchers use survey research to collect data quickly and efficiently from a large sample size. Survey research can be conducted through various methods such as online, phone, mail, or in-person interviews.
Quantitative Research Analysis Methods
Here are some commonly used quantitative research analysis methods:
Statistical Analysis
Statistical analysis is the most common quantitative research analysis method. It involves using statistical tools and techniques to analyze the numerical data collected during the research process. Statistical analysis can be used to identify patterns, trends, and relationships between variables, and to test hypotheses and theories.
Regression Analysis
Regression analysis is a statistical technique used to analyze the relationship between one dependent variable and one or more independent variables. Researchers use regression analysis to identify and quantify the impact of independent variables on the dependent variable.
Factor Analysis
Factor analysis is a statistical technique used to identify underlying factors that explain the correlations among a set of variables. Researchers use factor analysis to reduce a large number of variables to a smaller set of factors that capture the most important information.
Structural Equation Modeling
Structural equation modeling is a statistical technique used to test complex relationships between variables. It involves specifying a model that includes both observed and unobserved variables, and then using statistical methods to test the fit of the model to the data.
Time Series Analysis
Time series analysis is a statistical technique used to analyze data that is collected over time. It involves identifying patterns and trends in the data, as well as any seasonal or cyclical variations.
Multilevel Modeling
Multilevel modeling is a statistical technique used to analyze data that is nested within multiple levels. For example, researchers might use multilevel modeling to analyze data that is collected from individuals who are nested within groups, such as students nested within schools.
Applications of Quantitative Research
Quantitative research has many applications across a wide range of fields. Here are some common examples:
- Market Research : Quantitative research is used extensively in market research to understand consumer behavior, preferences, and trends. Researchers use surveys, experiments, and other quantitative methods to collect data that can inform marketing strategies, product development, and pricing decisions.
- Health Research: Quantitative research is used in health research to study the effectiveness of medical treatments, identify risk factors for diseases, and track health outcomes over time. Researchers use statistical methods to analyze data from clinical trials, surveys, and other sources to inform medical practice and policy.
- Social Science Research: Quantitative research is used in social science research to study human behavior, attitudes, and social structures. Researchers use surveys, experiments, and other quantitative methods to collect data that can inform social policies, educational programs, and community interventions.
- Education Research: Quantitative research is used in education research to study the effectiveness of teaching methods, assess student learning outcomes, and identify factors that influence student success. Researchers use experimental and quasi-experimental designs, as well as surveys and other quantitative methods, to collect and analyze data.
- Environmental Research: Quantitative research is used in environmental research to study the impact of human activities on the environment, assess the effectiveness of conservation strategies, and identify ways to reduce environmental risks. Researchers use statistical methods to analyze data from field studies, experiments, and other sources.
Characteristics of Quantitative Research
Here are some key characteristics of quantitative research:
- Numerical data : Quantitative research involves collecting numerical data through standardized methods such as surveys, experiments, and observational studies. This data is analyzed using statistical methods to identify patterns and relationships.
- Large sample size: Quantitative research often involves collecting data from a large sample of individuals or groups in order to increase the reliability and generalizability of the findings.
- Objective approach: Quantitative research aims to be objective and impartial in its approach, focusing on the collection and analysis of data rather than personal beliefs, opinions, or experiences.
- Control over variables: Quantitative research often involves manipulating variables to test hypotheses and establish cause-and-effect relationships. Researchers aim to control for extraneous variables that may impact the results.
- Replicable : Quantitative research aims to be replicable, meaning that other researchers should be able to conduct similar studies and obtain similar results using the same methods.
- Statistical analysis: Quantitative research involves using statistical tools and techniques to analyze the numerical data collected during the research process. Statistical analysis allows researchers to identify patterns, trends, and relationships between variables, and to test hypotheses and theories.
- Generalizability: Quantitative research aims to produce findings that can be generalized to larger populations beyond the specific sample studied. This is achieved through the use of random sampling methods and statistical inference.
Examples of Quantitative Research
Here are some examples of quantitative research in different fields:
- Market Research: A company conducts a survey of 1000 consumers to determine their brand awareness and preferences. The data is analyzed using statistical methods to identify trends and patterns that can inform marketing strategies.
- Health Research : A researcher conducts a randomized controlled trial to test the effectiveness of a new drug for treating a particular medical condition. The study involves collecting data from a large sample of patients and analyzing the results using statistical methods.
- Social Science Research : A sociologist conducts a survey of 500 people to study attitudes toward immigration in a particular country. The data is analyzed using statistical methods to identify factors that influence these attitudes.
- Education Research: A researcher conducts an experiment to compare the effectiveness of two different teaching methods for improving student learning outcomes. The study involves randomly assigning students to different groups and collecting data on their performance on standardized tests.
- Environmental Research : A team of researchers conduct a study to investigate the impact of climate change on the distribution and abundance of a particular species of plant or animal. The study involves collecting data on environmental factors and population sizes over time and analyzing the results using statistical methods.
- Psychology : A researcher conducts a survey of 500 college students to investigate the relationship between social media use and mental health. The data is analyzed using statistical methods to identify correlations and potential causal relationships.
- Political Science: A team of researchers conducts a study to investigate voter behavior during an election. They use survey methods to collect data on voting patterns, demographics, and political attitudes, and analyze the results using statistical methods.
How to Conduct Quantitative Research
Here is a general overview of how to conduct quantitative research:
- Develop a research question: The first step in conducting quantitative research is to develop a clear and specific research question. This question should be based on a gap in existing knowledge, and should be answerable using quantitative methods.
- Develop a research design: Once you have a research question, you will need to develop a research design. This involves deciding on the appropriate methods to collect data, such as surveys, experiments, or observational studies. You will also need to determine the appropriate sample size, data collection instruments, and data analysis techniques.
- Collect data: The next step is to collect data. This may involve administering surveys or questionnaires, conducting experiments, or gathering data from existing sources. It is important to use standardized methods to ensure that the data is reliable and valid.
- Analyze data : Once the data has been collected, it is time to analyze it. This involves using statistical methods to identify patterns, trends, and relationships between variables. Common statistical techniques include correlation analysis, regression analysis, and hypothesis testing.
- Interpret results: After analyzing the data, you will need to interpret the results. This involves identifying the key findings, determining their significance, and drawing conclusions based on the data.
- Communicate findings: Finally, you will need to communicate your findings. This may involve writing a research report, presenting at a conference, or publishing in a peer-reviewed journal. It is important to clearly communicate the research question, methods, results, and conclusions to ensure that others can understand and replicate your research.
When to use Quantitative Research
Here are some situations when quantitative research can be appropriate:
- To test a hypothesis: Quantitative research is often used to test a hypothesis or a theory. It involves collecting numerical data and using statistical analysis to determine if the data supports or refutes the hypothesis.
- To generalize findings: If you want to generalize the findings of your study to a larger population, quantitative research can be useful. This is because it allows you to collect numerical data from a representative sample of the population and use statistical analysis to make inferences about the population as a whole.
- To measure relationships between variables: If you want to measure the relationship between two or more variables, such as the relationship between age and income, or between education level and job satisfaction, quantitative research can be useful. It allows you to collect numerical data on both variables and use statistical analysis to determine the strength and direction of the relationship.
- To identify patterns or trends: Quantitative research can be useful for identifying patterns or trends in data. For example, you can use quantitative research to identify trends in consumer behavior or to identify patterns in stock market data.
- To quantify attitudes or opinions : If you want to measure attitudes or opinions on a particular topic, quantitative research can be useful. It allows you to collect numerical data using surveys or questionnaires and analyze the data using statistical methods to determine the prevalence of certain attitudes or opinions.
Purpose of Quantitative Research
The purpose of quantitative research is to systematically investigate and measure the relationships between variables or phenomena using numerical data and statistical analysis. The main objectives of quantitative research include:
- Description : To provide a detailed and accurate description of a particular phenomenon or population.
- Explanation : To explain the reasons for the occurrence of a particular phenomenon, such as identifying the factors that influence a behavior or attitude.
- Prediction : To predict future trends or behaviors based on past patterns and relationships between variables.
- Control : To identify the best strategies for controlling or influencing a particular outcome or behavior.
Quantitative research is used in many different fields, including social sciences, business, engineering, and health sciences. It can be used to investigate a wide range of phenomena, from human behavior and attitudes to physical and biological processes. The purpose of quantitative research is to provide reliable and valid data that can be used to inform decision-making and improve understanding of the world around us.
Advantages of Quantitative Research
There are several advantages of quantitative research, including:
- Objectivity : Quantitative research is based on objective data and statistical analysis, which reduces the potential for bias or subjectivity in the research process.
- Reproducibility : Because quantitative research involves standardized methods and measurements, it is more likely to be reproducible and reliable.
- Generalizability : Quantitative research allows for generalizations to be made about a population based on a representative sample, which can inform decision-making and policy development.
- Precision : Quantitative research allows for precise measurement and analysis of data, which can provide a more accurate understanding of phenomena and relationships between variables.
- Efficiency : Quantitative research can be conducted relatively quickly and efficiently, especially when compared to qualitative research, which may involve lengthy data collection and analysis.
- Large sample sizes : Quantitative research can accommodate large sample sizes, which can increase the representativeness and generalizability of the results.
Limitations of Quantitative Research
There are several limitations of quantitative research, including:
- Limited understanding of context: Quantitative research typically focuses on numerical data and statistical analysis, which may not provide a comprehensive understanding of the context or underlying factors that influence a phenomenon.
- Simplification of complex phenomena: Quantitative research often involves simplifying complex phenomena into measurable variables, which may not capture the full complexity of the phenomenon being studied.
- Potential for researcher bias: Although quantitative research aims to be objective, there is still the potential for researcher bias in areas such as sampling, data collection, and data analysis.
- Limited ability to explore new ideas: Quantitative research is often based on pre-determined research questions and hypotheses, which may limit the ability to explore new ideas or unexpected findings.
- Limited ability to capture subjective experiences : Quantitative research is typically focused on objective data and may not capture the subjective experiences of individuals or groups being studied.
- Ethical concerns : Quantitative research may raise ethical concerns, such as invasion of privacy or the potential for harm to participants.
About the author

Muhammad Hassan
Researcher, Academic Writer, Web developer
You may also like

Questionnaire – Definition, Types, and Examples

Case Study – Methods, Examples and Guide

Observational Research – Methods and Guide

Qualitative Research Methods

Explanatory Research – Types, Methods, Guide

Survey Research – Types, Methods, Examples

An official website of the United States government
The .gov means it’s official. Federal government websites often end in .gov or .mil. Before sharing sensitive information, make sure you’re on a federal government site.
The site is secure. The https:// ensures that you are connecting to the official website and that any information you provide is encrypted and transmitted securely.
- Publications
- Account settings
Preview improvements coming to the PMC website in October 2024. Learn More or Try it out now .
- Advanced Search
- Journal List
- J Korean Med Sci
- v.37(16); 2022 Apr 25
A Practical Guide to Writing Quantitative and Qualitative Research Questions and Hypotheses in Scholarly Articles
Edward barroga.
1 Department of General Education, Graduate School of Nursing Science, St. Luke’s International University, Tokyo, Japan.
Glafera Janet Matanguihan
2 Department of Biological Sciences, Messiah University, Mechanicsburg, PA, USA.
The development of research questions and the subsequent hypotheses are prerequisites to defining the main research purpose and specific objectives of a study. Consequently, these objectives determine the study design and research outcome. The development of research questions is a process based on knowledge of current trends, cutting-edge studies, and technological advances in the research field. Excellent research questions are focused and require a comprehensive literature search and in-depth understanding of the problem being investigated. Initially, research questions may be written as descriptive questions which could be developed into inferential questions. These questions must be specific and concise to provide a clear foundation for developing hypotheses. Hypotheses are more formal predictions about the research outcomes. These specify the possible results that may or may not be expected regarding the relationship between groups. Thus, research questions and hypotheses clarify the main purpose and specific objectives of the study, which in turn dictate the design of the study, its direction, and outcome. Studies developed from good research questions and hypotheses will have trustworthy outcomes with wide-ranging social and health implications.
INTRODUCTION
Scientific research is usually initiated by posing evidenced-based research questions which are then explicitly restated as hypotheses. 1 , 2 The hypotheses provide directions to guide the study, solutions, explanations, and expected results. 3 , 4 Both research questions and hypotheses are essentially formulated based on conventional theories and real-world processes, which allow the inception of novel studies and the ethical testing of ideas. 5 , 6
It is crucial to have knowledge of both quantitative and qualitative research 2 as both types of research involve writing research questions and hypotheses. 7 However, these crucial elements of research are sometimes overlooked; if not overlooked, then framed without the forethought and meticulous attention it needs. Planning and careful consideration are needed when developing quantitative or qualitative research, particularly when conceptualizing research questions and hypotheses. 4
There is a continuing need to support researchers in the creation of innovative research questions and hypotheses, as well as for journal articles that carefully review these elements. 1 When research questions and hypotheses are not carefully thought of, unethical studies and poor outcomes usually ensue. Carefully formulated research questions and hypotheses define well-founded objectives, which in turn determine the appropriate design, course, and outcome of the study. This article then aims to discuss in detail the various aspects of crafting research questions and hypotheses, with the goal of guiding researchers as they develop their own. Examples from the authors and peer-reviewed scientific articles in the healthcare field are provided to illustrate key points.
DEFINITIONS AND RELATIONSHIP OF RESEARCH QUESTIONS AND HYPOTHESES
A research question is what a study aims to answer after data analysis and interpretation. The answer is written in length in the discussion section of the paper. Thus, the research question gives a preview of the different parts and variables of the study meant to address the problem posed in the research question. 1 An excellent research question clarifies the research writing while facilitating understanding of the research topic, objective, scope, and limitations of the study. 5
On the other hand, a research hypothesis is an educated statement of an expected outcome. This statement is based on background research and current knowledge. 8 , 9 The research hypothesis makes a specific prediction about a new phenomenon 10 or a formal statement on the expected relationship between an independent variable and a dependent variable. 3 , 11 It provides a tentative answer to the research question to be tested or explored. 4
Hypotheses employ reasoning to predict a theory-based outcome. 10 These can also be developed from theories by focusing on components of theories that have not yet been observed. 10 The validity of hypotheses is often based on the testability of the prediction made in a reproducible experiment. 8
Conversely, hypotheses can also be rephrased as research questions. Several hypotheses based on existing theories and knowledge may be needed to answer a research question. Developing ethical research questions and hypotheses creates a research design that has logical relationships among variables. These relationships serve as a solid foundation for the conduct of the study. 4 , 11 Haphazardly constructed research questions can result in poorly formulated hypotheses and improper study designs, leading to unreliable results. Thus, the formulations of relevant research questions and verifiable hypotheses are crucial when beginning research. 12
CHARACTERISTICS OF GOOD RESEARCH QUESTIONS AND HYPOTHESES
Excellent research questions are specific and focused. These integrate collective data and observations to confirm or refute the subsequent hypotheses. Well-constructed hypotheses are based on previous reports and verify the research context. These are realistic, in-depth, sufficiently complex, and reproducible. More importantly, these hypotheses can be addressed and tested. 13
There are several characteristics of well-developed hypotheses. Good hypotheses are 1) empirically testable 7 , 10 , 11 , 13 ; 2) backed by preliminary evidence 9 ; 3) testable by ethical research 7 , 9 ; 4) based on original ideas 9 ; 5) have evidenced-based logical reasoning 10 ; and 6) can be predicted. 11 Good hypotheses can infer ethical and positive implications, indicating the presence of a relationship or effect relevant to the research theme. 7 , 11 These are initially developed from a general theory and branch into specific hypotheses by deductive reasoning. In the absence of a theory to base the hypotheses, inductive reasoning based on specific observations or findings form more general hypotheses. 10
TYPES OF RESEARCH QUESTIONS AND HYPOTHESES
Research questions and hypotheses are developed according to the type of research, which can be broadly classified into quantitative and qualitative research. We provide a summary of the types of research questions and hypotheses under quantitative and qualitative research categories in Table 1 .
Research questions in quantitative research
In quantitative research, research questions inquire about the relationships among variables being investigated and are usually framed at the start of the study. These are precise and typically linked to the subject population, dependent and independent variables, and research design. 1 Research questions may also attempt to describe the behavior of a population in relation to one or more variables, or describe the characteristics of variables to be measured ( descriptive research questions ). 1 , 5 , 14 These questions may also aim to discover differences between groups within the context of an outcome variable ( comparative research questions ), 1 , 5 , 14 or elucidate trends and interactions among variables ( relationship research questions ). 1 , 5 We provide examples of descriptive, comparative, and relationship research questions in quantitative research in Table 2 .
Hypotheses in quantitative research
In quantitative research, hypotheses predict the expected relationships among variables. 15 Relationships among variables that can be predicted include 1) between a single dependent variable and a single independent variable ( simple hypothesis ) or 2) between two or more independent and dependent variables ( complex hypothesis ). 4 , 11 Hypotheses may also specify the expected direction to be followed and imply an intellectual commitment to a particular outcome ( directional hypothesis ) 4 . On the other hand, hypotheses may not predict the exact direction and are used in the absence of a theory, or when findings contradict previous studies ( non-directional hypothesis ). 4 In addition, hypotheses can 1) define interdependency between variables ( associative hypothesis ), 4 2) propose an effect on the dependent variable from manipulation of the independent variable ( causal hypothesis ), 4 3) state a negative relationship between two variables ( null hypothesis ), 4 , 11 , 15 4) replace the working hypothesis if rejected ( alternative hypothesis ), 15 explain the relationship of phenomena to possibly generate a theory ( working hypothesis ), 11 5) involve quantifiable variables that can be tested statistically ( statistical hypothesis ), 11 6) or express a relationship whose interlinks can be verified logically ( logical hypothesis ). 11 We provide examples of simple, complex, directional, non-directional, associative, causal, null, alternative, working, statistical, and logical hypotheses in quantitative research, as well as the definition of quantitative hypothesis-testing research in Table 3 .
Research questions in qualitative research
Unlike research questions in quantitative research, research questions in qualitative research are usually continuously reviewed and reformulated. The central question and associated subquestions are stated more than the hypotheses. 15 The central question broadly explores a complex set of factors surrounding the central phenomenon, aiming to present the varied perspectives of participants. 15
There are varied goals for which qualitative research questions are developed. These questions can function in several ways, such as to 1) identify and describe existing conditions ( contextual research question s); 2) describe a phenomenon ( descriptive research questions ); 3) assess the effectiveness of existing methods, protocols, theories, or procedures ( evaluation research questions ); 4) examine a phenomenon or analyze the reasons or relationships between subjects or phenomena ( explanatory research questions ); or 5) focus on unknown aspects of a particular topic ( exploratory research questions ). 5 In addition, some qualitative research questions provide new ideas for the development of theories and actions ( generative research questions ) or advance specific ideologies of a position ( ideological research questions ). 1 Other qualitative research questions may build on a body of existing literature and become working guidelines ( ethnographic research questions ). Research questions may also be broadly stated without specific reference to the existing literature or a typology of questions ( phenomenological research questions ), may be directed towards generating a theory of some process ( grounded theory questions ), or may address a description of the case and the emerging themes ( qualitative case study questions ). 15 We provide examples of contextual, descriptive, evaluation, explanatory, exploratory, generative, ideological, ethnographic, phenomenological, grounded theory, and qualitative case study research questions in qualitative research in Table 4 , and the definition of qualitative hypothesis-generating research in Table 5 .
Qualitative studies usually pose at least one central research question and several subquestions starting with How or What . These research questions use exploratory verbs such as explore or describe . These also focus on one central phenomenon of interest, and may mention the participants and research site. 15
Hypotheses in qualitative research
Hypotheses in qualitative research are stated in the form of a clear statement concerning the problem to be investigated. Unlike in quantitative research where hypotheses are usually developed to be tested, qualitative research can lead to both hypothesis-testing and hypothesis-generating outcomes. 2 When studies require both quantitative and qualitative research questions, this suggests an integrative process between both research methods wherein a single mixed-methods research question can be developed. 1
FRAMEWORKS FOR DEVELOPING RESEARCH QUESTIONS AND HYPOTHESES
Research questions followed by hypotheses should be developed before the start of the study. 1 , 12 , 14 It is crucial to develop feasible research questions on a topic that is interesting to both the researcher and the scientific community. This can be achieved by a meticulous review of previous and current studies to establish a novel topic. Specific areas are subsequently focused on to generate ethical research questions. The relevance of the research questions is evaluated in terms of clarity of the resulting data, specificity of the methodology, objectivity of the outcome, depth of the research, and impact of the study. 1 , 5 These aspects constitute the FINER criteria (i.e., Feasible, Interesting, Novel, Ethical, and Relevant). 1 Clarity and effectiveness are achieved if research questions meet the FINER criteria. In addition to the FINER criteria, Ratan et al. described focus, complexity, novelty, feasibility, and measurability for evaluating the effectiveness of research questions. 14
The PICOT and PEO frameworks are also used when developing research questions. 1 The following elements are addressed in these frameworks, PICOT: P-population/patients/problem, I-intervention or indicator being studied, C-comparison group, O-outcome of interest, and T-timeframe of the study; PEO: P-population being studied, E-exposure to preexisting conditions, and O-outcome of interest. 1 Research questions are also considered good if these meet the “FINERMAPS” framework: Feasible, Interesting, Novel, Ethical, Relevant, Manageable, Appropriate, Potential value/publishable, and Systematic. 14
As we indicated earlier, research questions and hypotheses that are not carefully formulated result in unethical studies or poor outcomes. To illustrate this, we provide some examples of ambiguous research question and hypotheses that result in unclear and weak research objectives in quantitative research ( Table 6 ) 16 and qualitative research ( Table 7 ) 17 , and how to transform these ambiguous research question(s) and hypothesis(es) into clear and good statements.
a These statements were composed for comparison and illustrative purposes only.
b These statements are direct quotes from Higashihara and Horiuchi. 16
a This statement is a direct quote from Shimoda et al. 17
The other statements were composed for comparison and illustrative purposes only.
CONSTRUCTING RESEARCH QUESTIONS AND HYPOTHESES
To construct effective research questions and hypotheses, it is very important to 1) clarify the background and 2) identify the research problem at the outset of the research, within a specific timeframe. 9 Then, 3) review or conduct preliminary research to collect all available knowledge about the possible research questions by studying theories and previous studies. 18 Afterwards, 4) construct research questions to investigate the research problem. Identify variables to be accessed from the research questions 4 and make operational definitions of constructs from the research problem and questions. Thereafter, 5) construct specific deductive or inductive predictions in the form of hypotheses. 4 Finally, 6) state the study aims . This general flow for constructing effective research questions and hypotheses prior to conducting research is shown in Fig. 1 .

Research questions are used more frequently in qualitative research than objectives or hypotheses. 3 These questions seek to discover, understand, explore or describe experiences by asking “What” or “How.” The questions are open-ended to elicit a description rather than to relate variables or compare groups. The questions are continually reviewed, reformulated, and changed during the qualitative study. 3 Research questions are also used more frequently in survey projects than hypotheses in experiments in quantitative research to compare variables and their relationships.
Hypotheses are constructed based on the variables identified and as an if-then statement, following the template, ‘If a specific action is taken, then a certain outcome is expected.’ At this stage, some ideas regarding expectations from the research to be conducted must be drawn. 18 Then, the variables to be manipulated (independent) and influenced (dependent) are defined. 4 Thereafter, the hypothesis is stated and refined, and reproducible data tailored to the hypothesis are identified, collected, and analyzed. 4 The hypotheses must be testable and specific, 18 and should describe the variables and their relationships, the specific group being studied, and the predicted research outcome. 18 Hypotheses construction involves a testable proposition to be deduced from theory, and independent and dependent variables to be separated and measured separately. 3 Therefore, good hypotheses must be based on good research questions constructed at the start of a study or trial. 12
In summary, research questions are constructed after establishing the background of the study. Hypotheses are then developed based on the research questions. Thus, it is crucial to have excellent research questions to generate superior hypotheses. In turn, these would determine the research objectives and the design of the study, and ultimately, the outcome of the research. 12 Algorithms for building research questions and hypotheses are shown in Fig. 2 for quantitative research and in Fig. 3 for qualitative research.

EXAMPLES OF RESEARCH QUESTIONS FROM PUBLISHED ARTICLES
- EXAMPLE 1. Descriptive research question (quantitative research)
- - Presents research variables to be assessed (distinct phenotypes and subphenotypes)
- “BACKGROUND: Since COVID-19 was identified, its clinical and biological heterogeneity has been recognized. Identifying COVID-19 phenotypes might help guide basic, clinical, and translational research efforts.
- RESEARCH QUESTION: Does the clinical spectrum of patients with COVID-19 contain distinct phenotypes and subphenotypes? ” 19
- EXAMPLE 2. Relationship research question (quantitative research)
- - Shows interactions between dependent variable (static postural control) and independent variable (peripheral visual field loss)
- “Background: Integration of visual, vestibular, and proprioceptive sensations contributes to postural control. People with peripheral visual field loss have serious postural instability. However, the directional specificity of postural stability and sensory reweighting caused by gradual peripheral visual field loss remain unclear.
- Research question: What are the effects of peripheral visual field loss on static postural control ?” 20
- EXAMPLE 3. Comparative research question (quantitative research)
- - Clarifies the difference among groups with an outcome variable (patients enrolled in COMPERA with moderate PH or severe PH in COPD) and another group without the outcome variable (patients with idiopathic pulmonary arterial hypertension (IPAH))
- “BACKGROUND: Pulmonary hypertension (PH) in COPD is a poorly investigated clinical condition.
- RESEARCH QUESTION: Which factors determine the outcome of PH in COPD?
- STUDY DESIGN AND METHODS: We analyzed the characteristics and outcome of patients enrolled in the Comparative, Prospective Registry of Newly Initiated Therapies for Pulmonary Hypertension (COMPERA) with moderate or severe PH in COPD as defined during the 6th PH World Symposium who received medical therapy for PH and compared them with patients with idiopathic pulmonary arterial hypertension (IPAH) .” 21
- EXAMPLE 4. Exploratory research question (qualitative research)
- - Explores areas that have not been fully investigated (perspectives of families and children who receive care in clinic-based child obesity treatment) to have a deeper understanding of the research problem
- “Problem: Interventions for children with obesity lead to only modest improvements in BMI and long-term outcomes, and data are limited on the perspectives of families of children with obesity in clinic-based treatment. This scoping review seeks to answer the question: What is known about the perspectives of families and children who receive care in clinic-based child obesity treatment? This review aims to explore the scope of perspectives reported by families of children with obesity who have received individualized outpatient clinic-based obesity treatment.” 22
- EXAMPLE 5. Relationship research question (quantitative research)
- - Defines interactions between dependent variable (use of ankle strategies) and independent variable (changes in muscle tone)
- “Background: To maintain an upright standing posture against external disturbances, the human body mainly employs two types of postural control strategies: “ankle strategy” and “hip strategy.” While it has been reported that the magnitude of the disturbance alters the use of postural control strategies, it has not been elucidated how the level of muscle tone, one of the crucial parameters of bodily function, determines the use of each strategy. We have previously confirmed using forward dynamics simulations of human musculoskeletal models that an increased muscle tone promotes the use of ankle strategies. The objective of the present study was to experimentally evaluate a hypothesis: an increased muscle tone promotes the use of ankle strategies. Research question: Do changes in the muscle tone affect the use of ankle strategies ?” 23
EXAMPLES OF HYPOTHESES IN PUBLISHED ARTICLES
- EXAMPLE 1. Working hypothesis (quantitative research)
- - A hypothesis that is initially accepted for further research to produce a feasible theory
- “As fever may have benefit in shortening the duration of viral illness, it is plausible to hypothesize that the antipyretic efficacy of ibuprofen may be hindering the benefits of a fever response when taken during the early stages of COVID-19 illness .” 24
- “In conclusion, it is plausible to hypothesize that the antipyretic efficacy of ibuprofen may be hindering the benefits of a fever response . The difference in perceived safety of these agents in COVID-19 illness could be related to the more potent efficacy to reduce fever with ibuprofen compared to acetaminophen. Compelling data on the benefit of fever warrant further research and review to determine when to treat or withhold ibuprofen for early stage fever for COVID-19 and other related viral illnesses .” 24
- EXAMPLE 2. Exploratory hypothesis (qualitative research)
- - Explores particular areas deeper to clarify subjective experience and develop a formal hypothesis potentially testable in a future quantitative approach
- “We hypothesized that when thinking about a past experience of help-seeking, a self distancing prompt would cause increased help-seeking intentions and more favorable help-seeking outcome expectations .” 25
- “Conclusion
- Although a priori hypotheses were not supported, further research is warranted as results indicate the potential for using self-distancing approaches to increasing help-seeking among some people with depressive symptomatology.” 25
- EXAMPLE 3. Hypothesis-generating research to establish a framework for hypothesis testing (qualitative research)
- “We hypothesize that compassionate care is beneficial for patients (better outcomes), healthcare systems and payers (lower costs), and healthcare providers (lower burnout). ” 26
- Compassionomics is the branch of knowledge and scientific study of the effects of compassionate healthcare. Our main hypotheses are that compassionate healthcare is beneficial for (1) patients, by improving clinical outcomes, (2) healthcare systems and payers, by supporting financial sustainability, and (3) HCPs, by lowering burnout and promoting resilience and well-being. The purpose of this paper is to establish a scientific framework for testing the hypotheses above . If these hypotheses are confirmed through rigorous research, compassionomics will belong in the science of evidence-based medicine, with major implications for all healthcare domains.” 26
- EXAMPLE 4. Statistical hypothesis (quantitative research)
- - An assumption is made about the relationship among several population characteristics ( gender differences in sociodemographic and clinical characteristics of adults with ADHD ). Validity is tested by statistical experiment or analysis ( chi-square test, Students t-test, and logistic regression analysis)
- “Our research investigated gender differences in sociodemographic and clinical characteristics of adults with ADHD in a Japanese clinical sample. Due to unique Japanese cultural ideals and expectations of women's behavior that are in opposition to ADHD symptoms, we hypothesized that women with ADHD experience more difficulties and present more dysfunctions than men . We tested the following hypotheses: first, women with ADHD have more comorbidities than men with ADHD; second, women with ADHD experience more social hardships than men, such as having less full-time employment and being more likely to be divorced.” 27
- “Statistical Analysis
- ( text omitted ) Between-gender comparisons were made using the chi-squared test for categorical variables and Students t-test for continuous variables…( text omitted ). A logistic regression analysis was performed for employment status, marital status, and comorbidity to evaluate the independent effects of gender on these dependent variables.” 27
EXAMPLES OF HYPOTHESIS AS WRITTEN IN PUBLISHED ARTICLES IN RELATION TO OTHER PARTS
- EXAMPLE 1. Background, hypotheses, and aims are provided
- “Pregnant women need skilled care during pregnancy and childbirth, but that skilled care is often delayed in some countries …( text omitted ). The focused antenatal care (FANC) model of WHO recommends that nurses provide information or counseling to all pregnant women …( text omitted ). Job aids are visual support materials that provide the right kind of information using graphics and words in a simple and yet effective manner. When nurses are not highly trained or have many work details to attend to, these job aids can serve as a content reminder for the nurses and can be used for educating their patients (Jennings, Yebadokpo, Affo, & Agbogbe, 2010) ( text omitted ). Importantly, additional evidence is needed to confirm how job aids can further improve the quality of ANC counseling by health workers in maternal care …( text omitted )” 28
- “ This has led us to hypothesize that the quality of ANC counseling would be better if supported by job aids. Consequently, a better quality of ANC counseling is expected to produce higher levels of awareness concerning the danger signs of pregnancy and a more favorable impression of the caring behavior of nurses .” 28
- “This study aimed to examine the differences in the responses of pregnant women to a job aid-supported intervention during ANC visit in terms of 1) their understanding of the danger signs of pregnancy and 2) their impression of the caring behaviors of nurses to pregnant women in rural Tanzania.” 28
- EXAMPLE 2. Background, hypotheses, and aims are provided
- “We conducted a two-arm randomized controlled trial (RCT) to evaluate and compare changes in salivary cortisol and oxytocin levels of first-time pregnant women between experimental and control groups. The women in the experimental group touched and held an infant for 30 min (experimental intervention protocol), whereas those in the control group watched a DVD movie of an infant (control intervention protocol). The primary outcome was salivary cortisol level and the secondary outcome was salivary oxytocin level.” 29
- “ We hypothesize that at 30 min after touching and holding an infant, the salivary cortisol level will significantly decrease and the salivary oxytocin level will increase in the experimental group compared with the control group .” 29
- EXAMPLE 3. Background, aim, and hypothesis are provided
- “In countries where the maternal mortality ratio remains high, antenatal education to increase Birth Preparedness and Complication Readiness (BPCR) is considered one of the top priorities [1]. BPCR includes birth plans during the antenatal period, such as the birthplace, birth attendant, transportation, health facility for complications, expenses, and birth materials, as well as family coordination to achieve such birth plans. In Tanzania, although increasing, only about half of all pregnant women attend an antenatal clinic more than four times [4]. Moreover, the information provided during antenatal care (ANC) is insufficient. In the resource-poor settings, antenatal group education is a potential approach because of the limited time for individual counseling at antenatal clinics.” 30
- “This study aimed to evaluate an antenatal group education program among pregnant women and their families with respect to birth-preparedness and maternal and infant outcomes in rural villages of Tanzania.” 30
- “ The study hypothesis was if Tanzanian pregnant women and their families received a family-oriented antenatal group education, they would (1) have a higher level of BPCR, (2) attend antenatal clinic four or more times, (3) give birth in a health facility, (4) have less complications of women at birth, and (5) have less complications and deaths of infants than those who did not receive the education .” 30
Research questions and hypotheses are crucial components to any type of research, whether quantitative or qualitative. These questions should be developed at the very beginning of the study. Excellent research questions lead to superior hypotheses, which, like a compass, set the direction of research, and can often determine the successful conduct of the study. Many research studies have floundered because the development of research questions and subsequent hypotheses was not given the thought and meticulous attention needed. The development of research questions and hypotheses is an iterative process based on extensive knowledge of the literature and insightful grasp of the knowledge gap. Focused, concise, and specific research questions provide a strong foundation for constructing hypotheses which serve as formal predictions about the research outcomes. Research questions and hypotheses are crucial elements of research that should not be overlooked. They should be carefully thought of and constructed when planning research. This avoids unethical studies and poor outcomes by defining well-founded objectives that determine the design, course, and outcome of the study.
Disclosure: The authors have no potential conflicts of interest to disclose.
Author Contributions:
- Conceptualization: Barroga E, Matanguihan GJ.
- Methodology: Barroga E, Matanguihan GJ.
- Writing - original draft: Barroga E, Matanguihan GJ.
- Writing - review & editing: Barroga E, Matanguihan GJ.
- USC Libraries
- Research Guides
Organizing Your Social Sciences Research Paper
- Quantitative Methods
- Purpose of Guide
- Design Flaws to Avoid
- Independent and Dependent Variables
- Glossary of Research Terms
- Reading Research Effectively
- Narrowing a Topic Idea
- Broadening a Topic Idea
- Extending the Timeliness of a Topic Idea
- Academic Writing Style
- Applying Critical Thinking
- Choosing a Title
- Making an Outline
- Paragraph Development
- Research Process Video Series
- Executive Summary
- The C.A.R.S. Model
- Background Information
- The Research Problem/Question
- Theoretical Framework
- Citation Tracking
- Content Alert Services
- Evaluating Sources
- Primary Sources
- Secondary Sources
- Tiertiary Sources
- Scholarly vs. Popular Publications
- Qualitative Methods
- Insiderness
- Using Non-Textual Elements
- Limitations of the Study
- Common Grammar Mistakes
- Writing Concisely
- Avoiding Plagiarism
- Footnotes or Endnotes?
- Further Readings
- Generative AI and Writing
- USC Libraries Tutorials and Other Guides
- Bibliography
Quantitative methods emphasize objective measurements and the statistical, mathematical, or numerical analysis of data collected through polls, questionnaires, and surveys, or by manipulating pre-existing statistical data using computational techniques . Quantitative research focuses on gathering numerical data and generalizing it across groups of people or to explain a particular phenomenon.
Babbie, Earl R. The Practice of Social Research . 12th ed. Belmont, CA: Wadsworth Cengage, 2010; Muijs, Daniel. Doing Quantitative Research in Education with SPSS . 2nd edition. London: SAGE Publications, 2010.
Need Help Locating Statistics?
Resources for locating data and statistics can be found here:
Statistics & Data Research Guide
Characteristics of Quantitative Research
Your goal in conducting quantitative research study is to determine the relationship between one thing [an independent variable] and another [a dependent or outcome variable] within a population. Quantitative research designs are either descriptive [subjects usually measured once] or experimental [subjects measured before and after a treatment]. A descriptive study establishes only associations between variables; an experimental study establishes causality.
Quantitative research deals in numbers, logic, and an objective stance. Quantitative research focuses on numeric and unchanging data and detailed, convergent reasoning rather than divergent reasoning [i.e., the generation of a variety of ideas about a research problem in a spontaneous, free-flowing manner].
Its main characteristics are :
- The data is usually gathered using structured research instruments.
- The results are based on larger sample sizes that are representative of the population.
- The research study can usually be replicated or repeated, given its high reliability.
- Researcher has a clearly defined research question to which objective answers are sought.
- All aspects of the study are carefully designed before data is collected.
- Data are in the form of numbers and statistics, often arranged in tables, charts, figures, or other non-textual forms.
- Project can be used to generalize concepts more widely, predict future results, or investigate causal relationships.
- Researcher uses tools, such as questionnaires or computer software, to collect numerical data.
The overarching aim of a quantitative research study is to classify features, count them, and construct statistical models in an attempt to explain what is observed.
Things to keep in mind when reporting the results of a study using quantitative methods :
- Explain the data collected and their statistical treatment as well as all relevant results in relation to the research problem you are investigating. Interpretation of results is not appropriate in this section.
- Report unanticipated events that occurred during your data collection. Explain how the actual analysis differs from the planned analysis. Explain your handling of missing data and why any missing data does not undermine the validity of your analysis.
- Explain the techniques you used to "clean" your data set.
- Choose a minimally sufficient statistical procedure ; provide a rationale for its use and a reference for it. Specify any computer programs used.
- Describe the assumptions for each procedure and the steps you took to ensure that they were not violated.
- When using inferential statistics , provide the descriptive statistics, confidence intervals, and sample sizes for each variable as well as the value of the test statistic, its direction, the degrees of freedom, and the significance level [report the actual p value].
- Avoid inferring causality , particularly in nonrandomized designs or without further experimentation.
- Use tables to provide exact values ; use figures to convey global effects. Keep figures small in size; include graphic representations of confidence intervals whenever possible.
- Always tell the reader what to look for in tables and figures .
NOTE: When using pre-existing statistical data gathered and made available by anyone other than yourself [e.g., government agency], you still must report on the methods that were used to gather the data and describe any missing data that exists and, if there is any, provide a clear explanation why the missing data does not undermine the validity of your final analysis.
Babbie, Earl R. The Practice of Social Research . 12th ed. Belmont, CA: Wadsworth Cengage, 2010; Brians, Craig Leonard et al. Empirical Political Analysis: Quantitative and Qualitative Research Methods . 8th ed. Boston, MA: Longman, 2011; McNabb, David E. Research Methods in Public Administration and Nonprofit Management: Quantitative and Qualitative Approaches . 2nd ed. Armonk, NY: M.E. Sharpe, 2008; Quantitative Research Methods. Writing@CSU. Colorado State University; Singh, Kultar. Quantitative Social Research Methods . Los Angeles, CA: Sage, 2007.
Basic Research Design for Quantitative Studies
Before designing a quantitative research study, you must decide whether it will be descriptive or experimental because this will dictate how you gather, analyze, and interpret the results. A descriptive study is governed by the following rules: subjects are generally measured once; the intention is to only establish associations between variables; and, the study may include a sample population of hundreds or thousands of subjects to ensure that a valid estimate of a generalized relationship between variables has been obtained. An experimental design includes subjects measured before and after a particular treatment, the sample population may be very small and purposefully chosen, and it is intended to establish causality between variables. Introduction The introduction to a quantitative study is usually written in the present tense and from the third person point of view. It covers the following information:
- Identifies the research problem -- as with any academic study, you must state clearly and concisely the research problem being investigated.
- Reviews the literature -- review scholarship on the topic, synthesizing key themes and, if necessary, noting studies that have used similar methods of inquiry and analysis. Note where key gaps exist and how your study helps to fill these gaps or clarifies existing knowledge.
- Describes the theoretical framework -- provide an outline of the theory or hypothesis underpinning your study. If necessary, define unfamiliar or complex terms, concepts, or ideas and provide the appropriate background information to place the research problem in proper context [e.g., historical, cultural, economic, etc.].
Methodology The methods section of a quantitative study should describe how each objective of your study will be achieved. Be sure to provide enough detail to enable the reader can make an informed assessment of the methods being used to obtain results associated with the research problem. The methods section should be presented in the past tense.
- Study population and sampling -- where did the data come from; how robust is it; note where gaps exist or what was excluded. Note the procedures used for their selection;
- Data collection – describe the tools and methods used to collect information and identify the variables being measured; describe the methods used to obtain the data; and, note if the data was pre-existing [i.e., government data] or you gathered it yourself. If you gathered it yourself, describe what type of instrument you used and why. Note that no data set is perfect--describe any limitations in methods of gathering data.
- Data analysis -- describe the procedures for processing and analyzing the data. If appropriate, describe the specific instruments of analysis used to study each research objective, including mathematical techniques and the type of computer software used to manipulate the data.
Results The finding of your study should be written objectively and in a succinct and precise format. In quantitative studies, it is common to use graphs, tables, charts, and other non-textual elements to help the reader understand the data. Make sure that non-textual elements do not stand in isolation from the text but are being used to supplement the overall description of the results and to help clarify key points being made. Further information about how to effectively present data using charts and graphs can be found here .
- Statistical analysis -- how did you analyze the data? What were the key findings from the data? The findings should be present in a logical, sequential order. Describe but do not interpret these trends or negative results; save that for the discussion section. The results should be presented in the past tense.
Discussion Discussions should be analytic, logical, and comprehensive. The discussion should meld together your findings in relation to those identified in the literature review, and placed within the context of the theoretical framework underpinning the study. The discussion should be presented in the present tense.
- Interpretation of results -- reiterate the research problem being investigated and compare and contrast the findings with the research questions underlying the study. Did they affirm predicted outcomes or did the data refute it?
- Description of trends, comparison of groups, or relationships among variables -- describe any trends that emerged from your analysis and explain all unanticipated and statistical insignificant findings.
- Discussion of implications – what is the meaning of your results? Highlight key findings based on the overall results and note findings that you believe are important. How have the results helped fill gaps in understanding the research problem?
- Limitations -- describe any limitations or unavoidable bias in your study and, if necessary, note why these limitations did not inhibit effective interpretation of the results.
Conclusion End your study by to summarizing the topic and provide a final comment and assessment of the study.
- Summary of findings – synthesize the answers to your research questions. Do not report any statistical data here; just provide a narrative summary of the key findings and describe what was learned that you did not know before conducting the study.
- Recommendations – if appropriate to the aim of the assignment, tie key findings with policy recommendations or actions to be taken in practice.
- Future research – note the need for future research linked to your study’s limitations or to any remaining gaps in the literature that were not addressed in your study.
Black, Thomas R. Doing Quantitative Research in the Social Sciences: An Integrated Approach to Research Design, Measurement and Statistics . London: Sage, 1999; Gay,L. R. and Peter Airasain. Educational Research: Competencies for Analysis and Applications . 7th edition. Upper Saddle River, NJ: Merril Prentice Hall, 2003; Hector, Anestine. An Overview of Quantitative Research in Composition and TESOL . Department of English, Indiana University of Pennsylvania; Hopkins, Will G. “Quantitative Research Design.” Sportscience 4, 1 (2000); "A Strategy for Writing Up Research Results. The Structure, Format, Content, and Style of a Journal-Style Scientific Paper." Department of Biology. Bates College; Nenty, H. Johnson. "Writing a Quantitative Research Thesis." International Journal of Educational Science 1 (2009): 19-32; Ouyang, Ronghua (John). Basic Inquiry of Quantitative Research . Kennesaw State University.
Strengths of Using Quantitative Methods
Quantitative researchers try to recognize and isolate specific variables contained within the study framework, seek correlation, relationships and causality, and attempt to control the environment in which the data is collected to avoid the risk of variables, other than the one being studied, accounting for the relationships identified.
Among the specific strengths of using quantitative methods to study social science research problems:
- Allows for a broader study, involving a greater number of subjects, and enhancing the generalization of the results;
- Allows for greater objectivity and accuracy of results. Generally, quantitative methods are designed to provide summaries of data that support generalizations about the phenomenon under study. In order to accomplish this, quantitative research usually involves few variables and many cases, and employs prescribed procedures to ensure validity and reliability;
- Applying well established standards means that the research can be replicated, and then analyzed and compared with similar studies;
- You can summarize vast sources of information and make comparisons across categories and over time; and,
- Personal bias can be avoided by keeping a 'distance' from participating subjects and using accepted computational techniques .
Babbie, Earl R. The Practice of Social Research . 12th ed. Belmont, CA: Wadsworth Cengage, 2010; Brians, Craig Leonard et al. Empirical Political Analysis: Quantitative and Qualitative Research Methods . 8th ed. Boston, MA: Longman, 2011; McNabb, David E. Research Methods in Public Administration and Nonprofit Management: Quantitative and Qualitative Approaches . 2nd ed. Armonk, NY: M.E. Sharpe, 2008; Singh, Kultar. Quantitative Social Research Methods . Los Angeles, CA: Sage, 2007.
Limitations of Using Quantitative Methods
Quantitative methods presume to have an objective approach to studying research problems, where data is controlled and measured, to address the accumulation of facts, and to determine the causes of behavior. As a consequence, the results of quantitative research may be statistically significant but are often humanly insignificant.
Some specific limitations associated with using quantitative methods to study research problems in the social sciences include:
- Quantitative data is more efficient and able to test hypotheses, but may miss contextual detail;
- Uses a static and rigid approach and so employs an inflexible process of discovery;
- The development of standard questions by researchers can lead to "structural bias" and false representation, where the data actually reflects the view of the researcher instead of the participating subject;
- Results provide less detail on behavior, attitudes, and motivation;
- Researcher may collect a much narrower and sometimes superficial dataset;
- Results are limited as they provide numerical descriptions rather than detailed narrative and generally provide less elaborate accounts of human perception;
- The research is often carried out in an unnatural, artificial environment so that a level of control can be applied to the exercise. This level of control might not normally be in place in the real world thus yielding "laboratory results" as opposed to "real world results"; and,
- Preset answers will not necessarily reflect how people really feel about a subject and, in some cases, might just be the closest match to the preconceived hypothesis.
Research Tip
Finding Examples of How to Apply Different Types of Research Methods
SAGE publications is a major publisher of studies about how to design and conduct research in the social and behavioral sciences. Their SAGE Research Methods Online and Cases database includes contents from books, articles, encyclopedias, handbooks, and videos covering social science research design and methods including the complete Little Green Book Series of Quantitative Applications in the Social Sciences and the Little Blue Book Series of Qualitative Research techniques. The database also includes case studies outlining the research methods used in real research projects. This is an excellent source for finding definitions of key terms and descriptions of research design and practice, techniques of data gathering, analysis, and reporting, and information about theories of research [e.g., grounded theory]. The database covers both qualitative and quantitative research methods as well as mixed methods approaches to conducting research.
SAGE Research Methods Online and Cases
- << Previous: Qualitative Methods
- Next: Insiderness >>
- Last Updated: May 15, 2024 9:53 AM
- URL: https://libguides.usc.edu/writingguide
Have a language expert improve your writing
Run a free plagiarism check in 10 minutes, automatically generate references for free.
- Knowledge Base
- Methodology
- What Is Quantitative Research? | Definition & Methods
What Is Quantitative Research? | Definition & Methods
Published on 4 April 2022 by Pritha Bhandari . Revised on 10 October 2022.
Quantitative research is the process of collecting and analysing numerical data. It can be used to find patterns and averages, make predictions, test causal relationships, and generalise results to wider populations.
Quantitative research is the opposite of qualitative research , which involves collecting and analysing non-numerical data (e.g. text, video, or audio).
Quantitative research is widely used in the natural and social sciences: biology, chemistry, psychology, economics, sociology, marketing, etc.
- What is the demographic makeup of Singapore in 2020?
- How has the average temperature changed globally over the last century?
- Does environmental pollution affect the prevalence of honey bees?
- Does working from home increase productivity for people with long commutes?
Table of contents
Quantitative research methods, quantitative data analysis, advantages of quantitative research, disadvantages of quantitative research, frequently asked questions about quantitative research.
You can use quantitative research methods for descriptive, correlational or experimental research.
- In descriptive research , you simply seek an overall summary of your study variables.
- In correlational research , you investigate relationships between your study variables.
- In experimental research , you systematically examine whether there is a cause-and-effect relationship between variables.
Correlational and experimental research can both be used to formally test hypotheses , or predictions, using statistics. The results may be generalised to broader populations based on the sampling method used.
To collect quantitative data, you will often need to use operational definitions that translate abstract concepts (e.g., mood) into observable and quantifiable measures (e.g., self-ratings of feelings and energy levels).
Prevent plagiarism, run a free check.
Once data is collected, you may need to process it before it can be analysed. For example, survey and test data may need to be transformed from words to numbers. Then, you can use statistical analysis to answer your research questions .
Descriptive statistics will give you a summary of your data and include measures of averages and variability. You can also use graphs, scatter plots and frequency tables to visualise your data and check for any trends or outliers.
Using inferential statistics , you can make predictions or generalisations based on your data. You can test your hypothesis or use your sample data to estimate the population parameter .
You can also assess the reliability and validity of your data collection methods to indicate how consistently and accurately your methods actually measured what you wanted them to.
Quantitative research is often used to standardise data collection and generalise findings . Strengths of this approach include:
- Replication
Repeating the study is possible because of standardised data collection protocols and tangible definitions of abstract concepts.
- Direct comparisons of results
The study can be reproduced in other cultural settings, times or with different groups of participants. Results can be compared statistically.
- Large samples
Data from large samples can be processed and analysed using reliable and consistent procedures through quantitative data analysis.
- Hypothesis testing
Using formalised and established hypothesis testing procedures means that you have to carefully consider and report your research variables, predictions, data collection and testing methods before coming to a conclusion.
Despite the benefits of quantitative research, it is sometimes inadequate in explaining complex research topics. Its limitations include:
- Superficiality
Using precise and restrictive operational definitions may inadequately represent complex concepts. For example, the concept of mood may be represented with just a number in quantitative research, but explained with elaboration in qualitative research.
- Narrow focus
Predetermined variables and measurement procedures can mean that you ignore other relevant observations.
- Structural bias
Despite standardised procedures, structural biases can still affect quantitative research. Missing data , imprecise measurements or inappropriate sampling methods are biases that can lead to the wrong conclusions.
- Lack of context
Quantitative research often uses unnatural settings like laboratories or fails to consider historical and cultural contexts that may affect data collection and results.
Quantitative research deals with numbers and statistics, while qualitative research deals with words and meanings.
Quantitative methods allow you to test a hypothesis by systematically collecting and analysing data, while qualitative methods allow you to explore ideas and experiences in depth.
In mixed methods research , you use both qualitative and quantitative data collection and analysis methods to answer your research question .
Data collection is the systematic process by which observations or measurements are gathered in research. It is used in many different contexts by academics, governments, businesses, and other organisations.
Operationalisation means turning abstract conceptual ideas into measurable observations.
For example, the concept of social anxiety isn’t directly observable, but it can be operationally defined in terms of self-rating scores, behavioural avoidance of crowded places, or physical anxiety symptoms in social situations.
Before collecting data , it’s important to consider how you will operationalise the variables that you want to measure.
Reliability and validity are both about how well a method measures something:
- Reliability refers to the consistency of a measure (whether the results can be reproduced under the same conditions).
- Validity refers to the accuracy of a measure (whether the results really do represent what they are supposed to measure).
If you are doing experimental research , you also have to consider the internal and external validity of your experiment.
Hypothesis testing is a formal procedure for investigating our ideas about the world using statistics. It is used by scientists to test specific predictions, called hypotheses , by calculating how likely it is that a pattern or relationship between variables could have arisen by chance.
Cite this Scribbr article
If you want to cite this source, you can copy and paste the citation or click the ‘Cite this Scribbr article’ button to automatically add the citation to our free Reference Generator.
Bhandari, P. (2022, October 10). What Is Quantitative Research? | Definition & Methods. Scribbr. Retrieved 14 May 2024, from https://www.scribbr.co.uk/research-methods/introduction-to-quantitative-research/
Is this article helpful?

Pritha Bhandari
Quantitative Research
- Reference work entry
- First Online: 13 January 2019
- Cite this reference work entry

- Leigh A. Wilson 2 , 3
4350 Accesses
4 Citations
Quantitative research methods are concerned with the planning, design, and implementation of strategies to collect and analyze data. Descartes, the seventeenth-century philosopher, suggested that how the results are achieved is often more important than the results themselves, as the journey taken along the research path is a journey of discovery. High-quality quantitative research is characterized by the attention given to the methods and the reliability of the tools used to collect the data. The ability to critique research in a systematic way is an essential component of a health professional’s role in order to deliver high quality, evidence-based healthcare. This chapter is intended to provide a simple overview of the way new researchers and health practitioners can understand and employ quantitative methods. The chapter offers practical, realistic guidance in a learner-friendly way and uses a logical sequence to understand the process of hypothesis development, study design, data collection and handling, and finally data analysis and interpretation.
This is a preview of subscription content, log in via an institution to check access.
Access this chapter
- Available as PDF
- Read on any device
- Instant download
- Own it forever
- Available as EPUB and PDF
- Durable hardcover edition
- Dispatched in 3 to 5 business days
- Free shipping worldwide - see info
Tax calculation will be finalised at checkout
Purchases are for personal use only
Institutional subscriptions
Babbie ER. The practice of social research. 14th ed. Belmont: Wadsworth Cengage; 2016.
Google Scholar
Descartes. Cited in Halverston, W. (1976). In: A concise introduction to philosophy, 3rd ed. New York: Random House; 1637.
Doll R, Hill AB. The mortality of doctors in relation to their smoking habits. BMJ. 1954;328(7455):1529–33. https://doi.org/10.1136/bmj.328.7455.1529 .
Article Google Scholar
Liamputtong P. Research methods in health: foundations for evidence-based practice. 3rd ed. Melbourne: Oxford University Press; 2017.
McNabb DE. Research methods in public administration and nonprofit management: quantitative and qualitative approaches. 2nd ed. New York: Armonk; 2007.
Merriam-Webster. Dictionary. http://www.merriam-webster.com . Accessed 20th December 2017.
Olesen Larsen P, von Ins M. The rate of growth in scientific publication and the decline in coverage provided by Science Citation Index. Scientometrics. 2010;84(3):575–603.
Pannucci CJ, Wilkins EG. Identifying and avoiding bias in research. Plast Reconstr Surg. 2010;126(2):619–25. https://doi.org/10.1097/PRS.0b013e3181de24bc .
Petrie A, Sabin C. Medical statistics at a glance. 2nd ed. London: Blackwell Publishing; 2005.
Portney LG, Watkins MP. Foundations of clinical research: applications to practice. 3rd ed. New Jersey: Pearson Publishing; 2009.
Sheehan J. Aspects of research methodology. Nurse Educ Today. 1986;6:193–203.
Wilson LA, Black DA. Health, science research and research methods. Sydney: McGraw Hill; 2013.
Download references
Author information
Authors and affiliations.
School of Science and Health, Western Sydney University, Penrith, NSW, Australia
Leigh A. Wilson
Faculty of Health Science, Discipline of Behavioural and Social Sciences in Health, University of Sydney, Lidcombe, NSW, Australia
You can also search for this author in PubMed Google Scholar
Corresponding author
Correspondence to Leigh A. Wilson .
Editor information
Editors and affiliations.
Pranee Liamputtong
Rights and permissions
Reprints and permissions
Copyright information
© 2019 Springer Nature Singapore Pte Ltd.
About this entry
Cite this entry.
Wilson, L.A. (2019). Quantitative Research. In: Liamputtong, P. (eds) Handbook of Research Methods in Health Social Sciences. Springer, Singapore. https://doi.org/10.1007/978-981-10-5251-4_54
Download citation
DOI : https://doi.org/10.1007/978-981-10-5251-4_54
Published : 13 January 2019
Publisher Name : Springer, Singapore
Print ISBN : 978-981-10-5250-7
Online ISBN : 978-981-10-5251-4
eBook Packages : Social Sciences Reference Module Humanities and Social Sciences Reference Module Business, Economics and Social Sciences
Share this entry
Anyone you share the following link with will be able to read this content:
Sorry, a shareable link is not currently available for this article.
Provided by the Springer Nature SharedIt content-sharing initiative
- Publish with us
Policies and ethics
- Find a journal
- Track your research

Research Methodologies: Research Instruments
- Research Methodology Basics
- Research Instruments
- Types of Research Methodologies
Header Image

Types of Research Instruments
A research instrument is a tool you will use to help you collect, measure and analyze the data you use as part of your research. The choice of research instrument will usually be yours to make as the researcher and will be whichever best suits your methodology.
There are many different research instruments you can use in collecting data for your research:
- Interviews (either as a group or one-on-one). You can carry out interviews in many different ways. For example, your interview can be structured, semi-structured, or unstructured. The difference between them is how formal the set of questions is that is asked of the interviewee. In a group interview, you may choose to ask the interviewees to give you their opinions or perceptions on certain topics.
- Surveys (online or in-person). In survey research, you are posing questions in which you ask for a response from the person taking the survey. You may wish to have either free-answer questions such as essay style questions, or you may wish to use closed questions such as multiple choice. You may even wish to make the survey a mixture of both.
- Focus Groups. Similar to the group interview above, you may wish to ask a focus group to discuss a particular topic or opinion while you make a note of the answers given.
- Observations. This is a good research instrument to use if you are looking into human behaviors. Different ways of researching this include studying the spontaneous behavior of participants in their everyday life, or something more structured. A structured observation is research conducted at a set time and place where researchers observe behavior as planned and agreed upon with participants.
These are the most common ways of carrying out research, but it is really dependent on your needs as a researcher and what approach you think is best to take. It is also possible to combine a number of research instruments if this is necessary and appropriate in answering your research problem.
Data Collection
How to Collect Data for Your Research This article covers different ways of collecting data in preparation for writing a thesis.
- << Previous: Research Methodology Basics
- Next: Types of Research Methodologies >>
- Last Updated: Sep 27, 2022 12:28 PM
- URL: https://paperpile.libguides.com/research-methodologies
- Member Benefits
- Communities
- Grants and Scholarships
- Student Nurse Resources
- Member Directory
- Course Login
- Professional Development
- Institutions Hub
- ONS Course Catalog
- ONS Book Catalog
- ONS Oncology Nurse Orientation Program™
- Account Settings
- Help Center
- Print Membership Card
- Print NCPD Certificate
- Verify Cardholder or Certificate Status
- Trouble finding what you need?
- Check our search tips.
- Oncology Nursing Forum
- Number 4 / July 2014
Measurements in Quantitative Research: How to Select and Report on Research Instruments
Teresa L. Hagan
Measures exist to numerically represent degrees of attributes. Quantitative research is based on measurement and is conducted in a systematic, controlled manner. These measures enable researchers to perform statistical tests, analyze differences between groups, and determine the effectiveness of treatments. If something is not measurable, it cannot be tested.
Become a Member
Purchase this article.
has been added to your cart
Related Articles
Systematic reviews, case study research methodology in nursing research, preferred reporting items for systematic reviews and meta-analyses.
Root out friction in every digital experience, super-charge conversion rates, and optimize digital self-service
Uncover insights from any interaction, deliver AI-powered agent coaching, and reduce cost to serve
Increase revenue and loyalty with real-time insights and recommendations delivered to teams on the ground
Know how your people feel and empower managers to improve employee engagement, productivity, and retention
Take action in the moments that matter most along the employee journey and drive bottom line growth
Whatever they’re are saying, wherever they’re saying it, know exactly what’s going on with your people
Get faster, richer insights with qual and quant tools that make powerful market research available to everyone
Run concept tests, pricing studies, prototyping + more with fast, powerful studies designed by UX research experts
Track your brand performance 24/7 and act quickly to respond to opportunities and challenges in your market
Explore the platform powering Experience Management
- Free Account
- For Digital
- For Customer Care
- For Human Resources
- For Researchers
- Financial Services
- All Industries
Popular Use Cases
- Customer Experience
- Employee Experience
- Net Promoter Score
- Voice of Customer
- Customer Success Hub
- Product Documentation
- Training & Certification
- XM Institute
- Popular Resources
- Customer Stories
- Artificial Intelligence
Market Research
- Partnerships
- Marketplace
The annual gathering of the experience leaders at the world’s iconic brands building breakthrough business results, live in Salt Lake City.
- English/AU & NZ
- Español/Europa
- Español/América Latina
- Português Brasileiro
- REQUEST DEMO
- Experience Management
- Quantitative Research
Try Qualtrics for free
Your ultimate guide to quantitative research.
12 min read You may be already using quantitative research and want to check your understanding, or you may be starting from the beginning. Here’s an exploration of this research method and how you can best use it for maximum effect for your business.
You may be already using quantitative research and want to check your understanding, or you may be starting from the beginning. Here’s an exploration of this research method and how you can best use it for maximum effect for your business.
What is quantitative research?
Quantitative is the research method of collecting quantitative data – this is data that can be converted into numbers or numerical data, which can be easily quantified, compared, and analyzed.
Quantitative research deals with primary and secondary sources where data is represented in numerical form. This can include closed-question poll results, statistics, and census information or demographic data .
Quantitative data tends to be used when researchers are interested in understanding a particular moment in time and examining data sets over time to find trends and patterns.
To collect numerical data, surveys are often employed as one of the main research methods to source first-hand information in primary research . Quantitative research can also come from third-party research studies .
Quantitative research is widely used in the realms of social sciences, such as biology, chemistry, psychology, economics, sociology, and marketing .
Research teams collect data that is significant to proving or disproving a hypothesis research question – known as the research objective. When they collect quantitative data, researchers will aim to use a sample size that is representative of the total population of the target market they’re interested in.
Then the data collected will be manually or automatically stored and compared for insights.
Free eBook: The ultimate guide to conducting market research
Quantitative vs qualitative research
While the quantitative research definition focuses on numerical data, qualitative research is defined as data that supplies non-numerical information.
Quantitative research focuses on the thoughts, feelings, and values of a participant , to understand why people act in the way they do . They result in data types like quotes, symbols, images, and written testimonials.
These data types tell researchers subjective information, which can help us assign people into categories, such as a participant’s religion, gender , social class, political alignment, likely favored products to buy, or their preferred training learning style.
For this reason, qualitative research is often used in social research, as this gives a window into the behavior and actions of people.
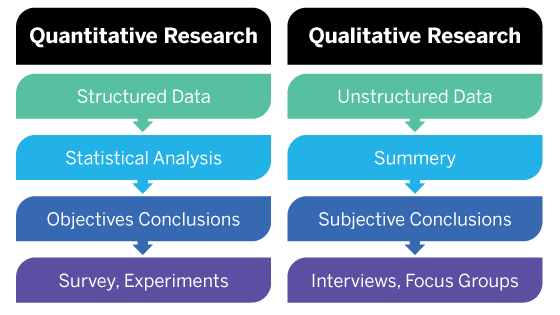
In general, if you’re interested in measuring something or testing a hypothesis, use quantitative methods. If you want to explore ideas, thoughts, and meanings, use qualitative methods.
However, quantitative and qualitative research methods are both recommended when you’re looking to understand a point in time, while also finding out the reason behind the facts.
Quantitative research data collection methods
Quantitative research methods can use structured research instruments like:
- Surveys : A survey is a simple-to-create and easy-to-distribute research method , which helps gather information from large groups of participants quickly. Traditionally, paper-based surveys can now be made online, so costs can stay quite low.
Quantitative questions tend to be closed questions that ask for a numerical result, based on a range of options, or a yes/no answer that can be tallied quickly.
- Face-to-face or phone interviews: Interviews are a great way to connect with participants , though they require time from the research team to set up and conduct.
Researchers may also have issues connecting with participants in different geographical regions . The researcher uses a set of predefined close-ended questions, which ask for yes/no or numerical values.
- Polls: Polls can be a shorter version of surveys , used to get a ‘flavor’ of what the current situation is with participants. Online polls can be shared easily, though polls are best used with simple questions that request a range or a yes/no answer.
Quantitative data is the opposite of qualitative research, another dominant framework for research in the social sciences, explored further below.
Quantitative data types
Quantitative research methods often deliver the following data types:
- Test Scores
- Percent of training course completed
- Performance score out of 100
- Number of support calls active
- Customer Net Promoter Score (NPS)
When gathering numerical data, the emphasis is on how specific the data is, and whether they can provide an indication of what ‘is’ at the time of collection. Pre-existing statistical data can tell us what ‘was’ for the date and time range that it represented
Quantitative research design methods (with examples)
Quantitative research has a number of quantitative research designs you can choose from:
Descriptive
This design type describes the state of a data type is telling researchers, in its native environment. There won’t normally be a clearly defined research question to start with. Instead, data analysis will suggest a conclusion , which can become the hypothesis to investigate further.
Examples of descriptive quantitative design include:
- A description of child’s Christmas gifts they received that year
- A description of what businesses sell the most of during Black Friday
- A description of a product issue being experienced by a customer
Correlational
This design type looks at two or more data types, the relationship between them, and the extent that they differ or align. This does not look at the causal links deeper – instead statistical analysis looks at the variables in a natural environment.
Examples of correlational quantitative design include:
- The relationship between a child’s Christmas gifts and their perceived happiness level
- The relationship between a business’ sales during Black Friday and the total revenue generated over the year
- The relationship between a customer’s product issue and the reputation of the product
Causal-Comparative/Quasi-Experimental
This design type looks at two or more data types and tries to explain any relationship and differences between them, using a cause-effect analysis. The research is carried out in a near-natural environment, where information is gathered from two groups – a naturally occurring group that matches the original natural environment, and one that is not naturally present.
This allows for causal links to be made, though they might not be correct, as other variables may have an impact on results.
Examples of causal-comparative/quasi-experimental quantitative design include:
- The effect of children’s Christmas gifts on happiness
- The effect of Black Friday sales figures on the productivity of company yearly sales
- The effect of product issues on the public perception of a product
Experimental Research
This design type looks to make a controlled environment in which two or more variables are observed to understand the exact cause and effect they have. This becomes a quantitative research study, where data types are manipulated to assess the effect they have. The participants are not naturally occurring groups, as the setting is no longer natural. A quantitative research study can help pinpoint the exact conditions in which variables impact one another.
Examples of experimental quantitative design include:
- The effect of children’s Christmas gifts on a child’s dopamine (happiness) levels
- The effect of Black Friday sales on the success of the company
- The effect of product issues on the perceived reliability of the product
Quantitative research methods need to be carefully considered, as your data collection of a data type can be used to different effects. For example, statistics can be descriptive or correlational (or inferential). Descriptive statistics help us to summarize our data, while inferential statistics help infer conclusions about significant differences.
Advantages of quantitative research
- Easy to do : Doing quantitative research is more straightforward, as the results come in numerical format, which can be more easily interpreted.
- Less interpretation : Due to the factual nature of the results, you will be able to accept or reject your hypothesis based on the numerical data collected.
- Less bias : There are higher levels of control that can be applied to the research, so bias can be reduced , making your data more reliable and precise.
Disadvantages of quantitative research
- Can’t understand reasons: Quantitative research doesn’t always tell you the full story, meaning you won’t understand the context – or the why, of the data you see, why do you see the results you have uncovered?
- Useful for simpler situations: Quantitative research on its own is not great when dealing with complex issues. In these cases, quantitative research may not be enough.
How to use quantitative research to your business’s advantage
Quantitative research methods may help in areas such as:
- Identifying which advert or landing page performs better
- Identifying how satisfied your customers are
- How many customers are likely to recommend you
- Tracking how your brand ranks in awareness and customer purchase intent
- Learn what consumers are likely to buy from your brand.
6 steps to conducting good quantitative research
Businesses can benefit from quantitative research by using it to evaluate the impact of data types. There are several steps to this:
- Define your problem or interest area : What do you observe is happening and is it frequent? Identify the data type/s you’re observing.
- Create a hypothesis : Ask yourself what could be the causes for the situation with those data types.
- Plan your quantitative research : Use structured research instruments like surveys or polls to ask questions that test your hypothesis.
- Data Collection : Collect quantitative data and understand what your data types are telling you. Using data collected on different types over long time periods can give you information on patterns.
- Data analysis : Does your information support your hypothesis? (You may need to redo the research with other variables to see if the results improve)
- Effectively present data : Communicate the results in a clear and concise way to help other people understand the findings.
How Qualtrics products can enhance & simplify the quantitative research process
The Qualtrics XM system gives you an all-in-one, integrated solution to help you all the way through conducting quantitative research. From survey creation and data collection to statistical analysis and data reporting, it can help all your internal teams gain insights from your numerical data.
Quantitative methods are catered to your business through templates or advanced survey designs. While you can manually collect data and conduct data analysis in a spreadsheet program, this solution helps you automate the process of quantitative research, saving you time and administration work.
Using computational techniques helps you to avoid human errors, and participant results come in are already incorporated into the analysis in real-time.
Our key tools, Stats IQ™ and Driver IQ™ make analyzing numerical data easy and simple. Choose to highlight key findings based on variables or highlight statistically insignificant findings. The choice is yours.

Some examples of your workspace in action, using drag and drop to create fast data visualizations quickly:

Related resources
Market intelligence 10 min read, marketing insights 11 min read, ethnographic research 11 min read, qualitative vs quantitative research 13 min read, qualitative research questions 11 min read, qualitative research design 12 min read, primary vs secondary research 14 min read, request demo.
Ready to learn more about Qualtrics?
- Request new password
- Create a new account
Research Methodology
Student resources, checkpoint: quantitative research instruments.

Visit this website: What are some examples of quantitative research instruments, and how do they differ from qualitative instruments?

Visit this website: How do you choose a quantitative research instrument that is well-suited to your research?
IMAGES
VIDEO
COMMENTS
15. Write the research paper 16. Publish data The following list is an example of the steps to complete a research project. Choosing a Research Instrument is done after conceptualization and the units of analysis have been chosen, and before operationalizing concepts construct instruments:
Revised on June 22, 2023. Quantitative research is the process of collecting and analyzing numerical data. It can be used to find patterns and averages, make predictions, test causal relationships, and generalize results to wider populations. Quantitative research is the opposite of qualitative research, which involves collecting and analyzing ...
Advisor Consultation Checklist Use the checklist below to ensure that you consulted with your advisor during the key steps in the process of selecting and describing your research instruments. 1. _____ Read this checklist. 2. _____ Made an appointment for our first meeting to discuss the instrument selection. 3.
The choice of research instrument depends on the research question, the nature of the phenomenon being studied, and the available resources (Bryman, 2016; Creswell, 2014; Dörnyei, 2007; Hair et ...
Here are some key characteristics of quantitative research: Numerical data: Quantitative research involves collecting numerical data through standardized methods such as surveys, experiments, and observational studies. This data is analyzed using statistical methods to identify patterns and relationships.
Quantitative Research: Focus: Quantitative research focuses on numerical data, seeking to quantify variables and examine relationships between them. It aims to provide statistical evidence and generalize findings to a larger population. Measurement: Quantitative research involves standardized measurement instruments, such as surveys or questionnaires, to collect data.
INTRODUCTION. Scientific research is usually initiated by posing evidenced-based research questions which are then explicitly restated as hypotheses.1,2 The hypotheses provide directions to guide the study, solutions, explanations, and expected results.3,4 Both research questions and hypotheses are essentially formulated based on conventional theories and real-world processes, which allow the ...
Quantitative research focuses on numeric and unchanging data and detailed, convergent reasoning rather than divergent reasoning [i.e., the generation of a variety of ideas about a research problem in a spontaneous, free-flowing manner]. Its main characteristics are: The data is usually gathered using structured research instruments.
instrument. Furthermore, using reliable and valid quantitative research instruments can boost the credibility of research findings and aid in developing new research questions and hypotheses. From a practical perspective, understanding quantitative research instrumentation can improve the quality of research practice.
Revised on 10 October 2022. Quantitative research is the process of collecting and analysing numerical data. It can be used to find patterns and averages, make predictions, test causal relationships, and generalise results to wider populations. Quantitative research is the opposite of qualitative research, which involves collecting and ...
Quantitative research methods are concerned with the planning, design, and implementation of strategies to collect and analyze data. Descartes, the seventeenth-century philosopher, suggested that how the results are achieved is often more important than the results themselves, as the journey taken along the research path is a journey of discovery. . High-quality quantitative research is ...
Mixed-methods research is a flexible approach, where the research design is determined by what we want to find out rather than by any predetermined epistemological position. In mixed-methods research, qualitative or quantitative components can predominate, or both can have equal status. 1.4. Units and variables.
A research instrument is a tool you will use to help you collect, measure and analyze the data you use as part of your research. The choice of research instrument will usually be yours to make as the researcher and will be whichever best suits your methodology. There are many different research instruments you can use in collecting data for your research:
In quantitative research design, a research instrument refers to the tool or method used to collect data from participants or subjects in a systematic and standardized manner (Hagan, 2014). The ...
Quantitative Research Excellence: Study Design and Reliable and Valid Measurement of Variables
Quantitative research is the process of collecting and analyzing numerical data to describe, predict, or control variables of interest. This type of research helps in testing the causal relationships between variables, making predictions, and generalizing results to wider populations. The purpose of quantitative research is to test a predefined ...
Measurements in Quantitative Research: How to Select and Report on Research Instruments. ONF 2014, 41 (4), 431-433. DOI: 10.1188/14.ONF.431-433. Measures exist to numerically represent degrees of attributes. Quantitative research is based on measurement and is conducted in a systematic, controlled manner. These measures enable researchers to ...
Quantitative research methods can use structured research instruments like: Surveys: A survey is a simple-to-create and easy-to-distribute research method, which helps gather information from large groups of participants quickly. Traditionally, paper-based surveys can now be made online, so costs can stay quite low.
Research instrument structure - One of the biggest differences between quantitative and qualitative research is the instrument you'll use to conduct your research.
When collecting and analyzing data, quantitative research deals with numbers and statistics, while qualitative research deals with words and meanings. Both are important for gaining different kinds of knowledge. Quantitative research. Quantitative research is expressed in numbers and graphs. It is used to test or confirm theories and assumptions.
Step of the Research Process Resources. Step 1: Formulating a Research Problem; Step 2: Conceptualising a Research Design; Step 3: Constructing an Instrument for Data Collection; Step 4: Selecting a Sample; Step 5: Writing a Research Proposal; Step 6: Collecting Data; Step 7: Processing and Displaying Data; Step 8: Writing a Research Report
Quantitative research tools consist of different types of questionnaires, surveys, struct ured. interviews, and behavioural observation which are based upon explicit coding and categorization ...
The research examined the influence of institutional, economic, ecological, and socio-cultural sustainability on the respondents' satisfaction. The quantitative methodology in this research included a questionnaire as a survey instrument for respondents. A total of 547 residents were surveyed.
research instruments: a questionnaire and an interview guide used to investigate the implementation of higher education objectives and the attainment of cameroon's vision 2035 June 2021 DOI: 10. ...