Curriculum / Math / 9th Grade / Unit 1: Functions, Graphs and Features / Lesson 9

Functions, Graphs and Features
Lesson 9 of 11
Criteria for Success
Tips for teachers, anchor problems, problem set, target task, additional practice.
Sketch an exponential function that represents a situation. Identify key features of the graph and relate to context.
Common Core Standards
Core standards.
The core standards covered in this lesson
Creating Equations
A.CED.A.2 — Create equations in two or more variables to represent relationships between quantities; graph equations on coordinate axes with labels and scales.
Interpreting Functions
F.IF.B.5 — Relate the domain of a function to its graph and, where applicable, to the quantitative relationship it describes. For example, if the function h(n) gives the number of person-hours it takes to assemble n engines in a factory, then the positive integers would be an appropriate domain for the function. Modeling is best interpreted not as a collection of isolated topics but in relation to other standards. Making mathematical models is a Standard for Mathematical Practice, and specific modeling standards appear throughout the high school standards indicated by a star symbol (★). The star symbol sometimes appears on the heading for a group of standards; in that case, it should be understood to apply to all standards in that group.
F.IF.C.7.E — Graph exponential and logarithmic functions, showing intercepts and end behavior, and trigonometric functions, showing period, midline, and amplitude.
Linear, Quadratic, and Exponential Models
F.LE.A.3 — Observe using graphs and tables that a quantity increasing exponentially eventually exceeds a quantity increasing linearly, quadratically, or (more generally) as a polynomial function.
Foundational Standards
The foundational standards covered in this lesson
8.F.B.5 — Describe qualitatively the functional relationship between two quantities by analyzing a graph (e.g., where the function is increasing or decreasing, linear or nonlinear). Sketch a graph that exhibits the qualitative features of a function that has been described verbally.
The essential concepts students need to demonstrate or understand to achieve the lesson objective
- Describe the shape that is used to model exponential functions.
- Describe the rate of change over intervals of an exponential function. Compare the rate of change to a linear function and to a quadratic function.
- Identify contexts that could be represented by an exponential function, such as interest, population growth, car depreciation, and bacteria growth.
- Describe the domain and range of exponential functions, as well as features of the exponential functions represented graphically.
Suggestions for teachers to help them teach this lesson
This lesson introduces the idea of an exponential function within the analysis that students have been doing on other functions in this unit. Students will need to be able to recognize the shape and describe the general features but will not need to go in-depth. This work will be done in Unit 6.
Unlock features to optimize your prep time, plan engaging lessons, and monitor student progress.
Problems designed to teach key points of the lesson and guiding questions to help draw out student understanding
The table below gives the number of bacteria over time, shown in this video . Plot the points in the table on a graph and draw the curve that goes through the points.

Based on the pattern you see in the table of values, extend the graph to 4 seconds.
Guiding Questions
Below is a graph of an amount of money invested tripling each year. This is modeled by an exponential function.

Describe the features of the function in terms of intervals where the function is increasing/decreasing, intervals where the rate of change is constant/increasing/decreasing, and intercepts. Describe what each of these features means in the context of the problem.
A set of suggested resources or problem types that teachers can turn into a problem set
Give your students more opportunities to practice the skills in this lesson with a downloadable problem set aligned to the daily objective.
A task that represents the peak thinking of the lesson - mastery will indicate whether or not objective was achieved
Assume that a bacteria population doubles every hour. Which of the following three tables of data, with x representing time in hours and y the count of bacteria, could represent the bacteria population with respect to time? For the chosen table of data, plot the graph of data. Label the axes appropriately with units.

Algebra I > Module 1 > Topic A > Lesson 3 of the New York State Common Core Mathematics Curriculum from EngageNY and Great Minds . © 2015 Great Minds. Licensed by EngageNY of the New York State Education Department under the CC BY-NC-SA 3.0 US license. Accessed Dec. 2, 2016, 5:15 p.m..
The following resources include problems and activities aligned to the objective of the lesson that can be used for additional practice or to create your own problem set.
- Include problems where students need to identify whether something is always, sometimes, or never true. Use domain, range, intercepts, and rate of change. For example, is the statement shown always, sometimes, or never true? Explain your reasoning. “The rate of change of an exponential function is constant.”
- Yummy Math Harlem Shake
- EngageNY Mathematics Algebra I > Module 1 > Topic A > Lesson 3 — Problem Set
- EngageNY Mathematics Algebra I > Module 1 > Topic A > Lesson 4 — General function analysis (not tied to particular parent functions)
Topic A: Features of Functions
Model a contextual situation graphically using appropriate scales and features.
F.IF.B.4 F.IF.B.6 N.Q.A.1 N.Q.A.2 N.Q.A.3
Define functions and evaluate points in tables, graphs, and contextual situations using function notation.
F.IF.A.1 F.IF.A.2
Identify features of functions, including x-intercept and y-intercept, in context. Evaluate function notation in context.
F.IF.A.2 F.IF.C.9
Identify the domain and range through contextual situations, and explore domain and range on a graph. Represent domain and range with inequalities.
F.IF.A.1 F.IF.B.5
Calculate and interpret the rate of change from two points on a graph, in a situation, or in function notation.
F.IF.A.2 F.IF.B.4 F.IF.B.6
Describe and sketch functions using the features of domain and range, intercepts, function behavior, and the value of the function.
Analyze the key features of a contextual situation and model these graphically.
F.IF.B.4 F.IF.B.5 F.IF.B.6 N.Q.A.2
Create a free account to access thousands of lesson plans.
Already have an account? Sign In
Topic B: Nonlinear Functions
Draw quadratic functions represented contextually. Identify key features of the graph and relate to context.
A.CED.A.2 F.IF.B.5 F.IF.C.7.A F.LE.A.3
A.CED.A.2 F.IF.B.5 F.IF.C.7.E F.LE.A.3
Draw a graph to represent a system of functions. Identify the solution to a system represented graphically and in context.
A.REI.D.11 F.IF.A.2 F.IF.B.5
Analyze functions and identify parent functions of graphs. Identify variables of a situation and the scale of the associated graph. Represent a situation in a graph, table, and description.
Request a Demo
See all of the features of Fishtank in action and begin the conversation about adoption.
Learn more about Fishtank Learning School Adoption.
Contact Information
School information, what courses are you interested in, are you interested in onboarding professional learning for your teachers and instructional leaders, any other information you would like to provide about your school.

Effective Instruction Made Easy
Access rigorous, relevant, and adaptable math lesson plans for free

- Subscribe |
- Newsletter Index |
- Daily Dose |
- Site Map
- Home |
- SAT/ACT |
- Common Core |
- Online Practice |
- Printables |
- Grade Level Help |
- Links PreK-12 |
- Tech |
- Assessment
8th Grade - Qualitative Graph
advertisement
Interpret a qualitative graph representing a contextual situation. SPI 0806.1.2 Links verified on 7/23/2014 Qualitative Graphs - from Learning Math: Patterns, Functions, and Algebra presented by Annenberg Media Rate of Change: Connecting Slope to Real Life - a lesson on using slope to find the rate of change accompanied by graphs and explanations Rate of Change Practice Problems - nine practice problems (including a graph to interpret) followed by an answer key Using the X and Y Intercept to Graph Linear Equations - This follow up to the lesson on rate of change deals with linear equations written in standard form rather than slope intercept form Finding the X Intercept and Y Intercept to Graph Standard Form Equations - five practice problems to practice using what was learned in the lesson above, followed by an answer key Review Quiz - the first problem asks students to match graphs with statements describing some situation
Search Internet4Classrooms
Internet4classrooms is a collaborative effort by Susan Brooks and Bill Byles.
- Technology Skills |
- Site Map |
- About Us |
- Teacher Training |
- Make Internet4Classrooms.com your home page. |
- Copyright © 2000-2024 Internet4Classrooms, LLC All rights reserved.
Use of this Web site constitutes acceptance of our Terms of Service and Privacy Policy .
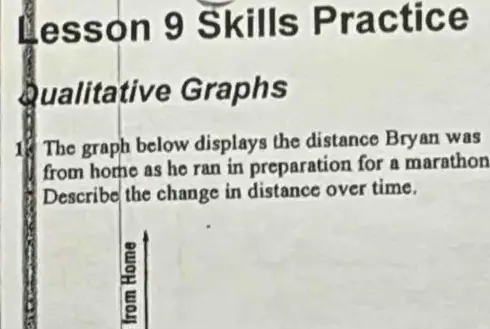
Lesson 9 Skills Practice Qualitative Graphs 13 The graph below displays the distance Bryan was from home as he ran in preparation for a marathon Describe the change in distance over time. =
Gauth ai solution.
Lesson 9 Homework Practice Qualitative Graphs
lesson 9 homework practice qualitative graphs lesson 9 homework practice qualitative graphs answer Functions Course 3 Answer Key . 10-1 Linear and Nonlinear Functions Glencoe. In Lesson 9-3, you learned that linear functions have graphs that are Determine whether .. . Los Angeles Unified School District INSTRUCTIONAL PACING GUIDE . Extra Practice 9. . Lesson 9: Qualitative Graphs, .. Teaching notes for 6. Practice creating a qualitative model of a function (FP) created by Stacey Sisler Description. Lesson objective: Graph a function given a .. Lesson 9 Homework Practice Qualitative Graphs 5. EXERCISE Ryan monitored his heart rate while exercising. .. Sketch a graph that exhibits the qualitative features of a function that . Common Core Math Grade 8 - Functions: Standards . Lesson transcripts; Practice quizzes .. . Math 8 Due Date - Homework . * Lesson 9 Qualitative Graphs * Test Review #1 11-29/11 .. qualitative graph to represent the balance of the amount owed over time. Time 4. .. Explaining Graphs Step-by-Step Lesson- This is a great activity for students to understand what real graph lines actually . Homework Sheets . . Practice Worksheets .. Selected Answers Go online for Step-by-Step . The graph representing area of a square is nonlinear . Pages 8586 Lesson 1-9 Independent Practice 1. 5 3.. Lesson: Qualitative Graphs Homework: pg. 351 #1-4all, 10-14all, 17; GIWS #3.2 due Thursday .. Thinking algebraically helps us to develop different ways of representing real-world situations. You may have chosen to use a table to represent the situation with .. Lesson 9 Problem-Solving Practice Estimate Roots 1.. MidwayUSA is a privately held American retailer of various hunting and outdoor-related products.. Lesson 4 Homework Practice Slope-Intercept Form State the slope and the y-intercept for the graph of each equation. .. Lesson 9- sketch and describe qualitative graphs. . Practice/Notes Homework/Independent . 14 2/5 Lesson 9- Qualitative Graphs Got It/Guided Practice P. 351 #1 .. Lesson 4.1 Interpreting Graphs . read each day for 9 days. The graph on the left is . The example in your book gives you practice using function notation and .. Textbook detail Glencoe Math Course 3 Title: Glencoe Math Course .. Lesson 9.2 COMMON CORE STANDARD5.G.A.1 Graph points on the . 0 2 31 4 5 7 8 9 10 . x-axis y-axis Personal Math Trainer FOR MORE PRACTICE GO TO THE 544 Lesson .. This homework or practice activity requires students to analyze qualitative graphs as well as create their own for given situations.. Lesson Worksheet. Homework: Worksheet #1-12 Geometry Assignment 1 Lesson 4 - Rates, Ratios & Proportionality. Key Terms & Practice Worksheet. Homework: .. . 0-07-660251-6 Math Connects to the Common Core, Course 3 . Contents / Lessons / Homework Practice . Lesson 9 Qualitative Graphs 38 Geometry Lesson 10 .. 9y=-3;-3 12 Graph each equation using the sope and the y . Lesson 5 Ski!s Pa . esson 6 Homework PI'ali .. chapter 9 lesson 4 independent practice John Smoke. . Lesson 9.1 Line Plots - Duration: . chapter 9 lesson 2 independent practice - Duration: .. 12/6 W Qualitative Graphs . 12/12 T Systems Review HO # lesson 8 skills practice .. Columbus County Schools Common Core State Standards Curriculum . Nonlinear Function, Quadratic Function, Qualitative Graphs, .. Quiz & Worksheet - Graphing a Function's Qualitative Features Quiz; . A premium account gives you access to all lesson, practice exams, . How to graph qualitative .. Graphing online video tutorials. Watch and learn at your own pace.. Homework Practice Handout Lesson 10-1 Science: Directed Reading Handout Wednesday 01/06/16 .. A Week of Theoretical and Experimental Probability . charts, tables, graphs, symbols, equations, or objects . 9 Homework: Have the students .. Chapter 4 Lesson 9 Qualitative Graphs Mr Lewis. Loading. . Lesson 9 - Top Bracing Overview - Duration: 4:23. OBrienGuitars 12,647 views. 4:23.. and lesson, with one Skills Practice worksheet for every lesson in . Along with your textbook, daily homework, and class . Graph each equation using the slope .. Post in Discussion Forums if you need help with Practice Homework 3 . Lesson: Chapter 3 Section 1 . A bar graph is a histogram for qualitative (non-numerical) data. cd4164fbe1
Report Page
quantitative and qualitative graphs
All Formats
Resource types, all resource types.
- Rating Count
- Price (Ascending)
- Price (Descending)
- Most Recent
Quantitative and qualitative graphs

Qualitative and Quantitative Data Graphing Project Collecting Data Rubric

Grade 4 Ontario Data Management Unit Collecting Data Reading Graphs Infographic

- Google Apps™
Creating Graphs Grade 3 2020 Ontario Math- DIGITAL Google Slides :Strand D Data

Data Management Unit Collecting Data Reading & Analyzing Graphs Grade 7 Ontario
BC - Math - Grade 6 - Graphing and Probability Strand - GOOGLE AND PDF

Scientific Method Activity Practice Data Analysis Qualitative and Quantitative

- Easel Activity


Experimental Design - Understanding, recording, and graphing data (virtual)

- Google Drive™ folder
Quantitative vs Qualitative Graphs (Data Management) | Easel, Google Slide & PDF

- Internet Activities

Scientific Method, Variables and Graphing Digital Task Cards- Boom Cards

Grade 2/3 Data Literacy and Graphing Activity - New 2020 Ontario Math Curriculum

Graphs and Charts Full Unit

- Google Slides™

Quantitative & Qualitative Data Management BUNDLE | Easel, Google Slide & PDF
SMATH Unit 2:1 Qualitative & Quantitative Data (Single Grade Resource 4)

Graphing Linear Motion Activity

Qualitative and Quantitative Data Informational Text and Worksheet Questions
Analyzing Scientific Data - Types, Graphs , and More!

BACK TO SCHOOL Experiments & Data Task Cards (Scientific Data/ Graphs )

Physics Critical Skill Task Cards - Position vs. Time Graphs

Quantitative and Qualitative Data Lab

Scientific Method Unit and Scientific Method Activity

Experimental Design & Parts of an Experiment Worksheet with Reading and Review

Scientific Practices Word Wall and Poster Set (SOL 4.1)

Scientific Inquiry and Scientific Method Word Wall

Scientific Method and Graphing Notes and PowerPoints - Guided Notes + PPT

- We're hiring
- Help & FAQ
- Privacy policy
- Student privacy
- Terms of service
- Tell us what you think
Chapter 9, Lesson 1: Graphing Quadratic Functions
- Extra Examples
- Personal Tutor
- Self-Check Quizzes
The resource you requested requires you to enter a username and password below:
Please read our Terms of Use and Privacy Notice before you explore our Web site. To report a technical problem with this Web site, please contact the site producer .

- Get started
- Pre-Algebra
A quicker path to better grades
We have gathered all your curriculum-based courses, assignments, hints, tests, and solutions in one easy-to-use place

- Integrated I
- Integrated II
- Integrated III
Can't find your textbook?
More math. less studying.
A personal private tutor for each student. Free from preassure and study anxiety.
Exercise 2 Page 350
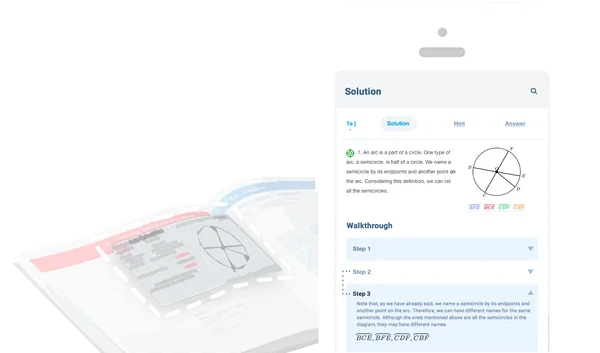
Qualitative graphs are graphs used to represent situations that may not have numerical values or graphs in which numerical values are not included.
Check the answer
Example Solution:
Practice exercises
Asses your skill.
Jamaal purchased the same number of action figures daily for one week, and then he sold most of them on the Internet. We want to sketch a qualitative graph to represent the situation. Let's remember the definition of this type of graph.
Notice that we do not know the initial number of the figures, or how many figures Jamaal purchased each day — the numerical values are not included. We only know how the total number of action figures changed over time.
- At first, Jamaal purchased the same number of action figures daily for one week. This means that the total number was growing daily by the same amount.
- Then he sold most of them on the Internet. As a result, the total number of figures decreased by a significant amount.
We can model this situation using a qualitative graph that very closely resembles a bar graph . There will not be any numbers on either of the axes because we are not given any numerical values.
Note that this is just one of many ways to represent the situation.

IMAGES
VIDEO
COMMENTS
Lesson 9 Homework Practice Qualitative Graphs Solve. 1. ROLLER COASTERS The graph below shows the speed of a roller coaster during the first 30 seconds. Describe the change in speed over time. 3. HIKING The graph below shows the altitude of a hiker during a hike. Describe the change in altitude over time. 2. MONEY The graph below shows the ...
Grade 8: Chapter 4, Lesson 9: pgs. 347-354 Qualitative Graphs Part 1: Analyze Qualitative Graphs Qualitative graphs are graphs used to represent situations that may not have numerical values or graphs in which numerical values are not included. **There are no numbers** a) The graph below displays the water level in a bathtub.
Lesson 9 Extra Practice Qualitative Graphs. 1. The graph below displays the amount of money in Jared's account. Describe the change in the amount over time. Sample answer: Jared has an initial amount of money in his account. For a small amount of time, he steadily deposits money. Then he does not deposit any money or withdraw any money.
8.F.B.5 — Describe qualitatively the functional relationship between two quantities by analyzing a graph (e.g., where the function is increasing or decreasing, linear or nonlinear). Sketch a graph that exhibits the qualitative features of a function that has been described verbally.
The graph in Problem C1 is particularly interesting because height is not on the vertical axis. This is intentional so that, once again, we have to focus on the representation and its meaning rather than on a graph that is merely a literal picture of the situation. Consider creating another graph for Problem C2, one with the axes reversed.
Qualitative Graphs - from Learning Math: Patterns, Functions, and Algebra presented by Annenberg Media. Rate of Change: Connecting Slope to Real Life - a lesson on using slope to find the rate of change accompanied by graphs and explanations. Rate of Change Practice Problems - nine practice problems (including a graph to interpret) followed by ...
About Press Copyright Contact us Creators Advertise Developers Terms Privacy Policy & Safety How YouTube works Test new features Press Copyright Contact us Creators ...
These are the Doodle Notes for Chapter 4 Lesson 9 Qualitative Graphs for Ravenclaw Math 8.
Qualitative graphs can also have curved lines to indicate that the slope, or rate of change, is not constant. The graph to the right shows the number of students who are in the ... Practice. Write complete sentences. Use a separate sheet of paper if necessary. 1. The graph shows daily sales of frozen yogurt at a new store during a six -month
word problem. Question. Lesson 9 Skills Practice Qualitative Graphs 13 The graph below displays the distance Bryan was from home as he ran in preparation for a marathon Describe the change in distance over time. = 7. Solution. Answer: Bryan's distance from home increases, then decreases as he returns home, showing a round trip pattern. ...
Exercise 8 Page 352 - Standardized Test Practice - 9. Qualitative Graphs - We are given a graph which represents the height of a rocket being launched. ... 9. Qualitative Graphs. Guided Practice p. 350 arrow_drop_down. 1 p. 350. 2 p. 350. 3 p. 350. ... Test your problem-solving skills with the Relations and Functions test arrow_right.
2. The graph below displays the population of bacteria in a dish. Describe the change in population over time. 4. A well is being dug on a piece of land. The team digs at a constant rate, takes a break for lunch, then continues digger at a slower constant rate. Sketch a qualitative graph that shows the dept h of the well over time.
Lesson 9 Problem-Solving Practice Qualitative Graphs 1. The graph below displays the attendance at the state far over tune. Describe the change in attendance over time. Time 3. Charles received a loan and is paymg it offin monthly Sketch a qualitative graph to represent the balance of the amount owed over time. 72 2. The graph below displays ...
Perfect for introducing new concepts, reviewing previously learned skills, or using in your interactive notebook. These step-by-step guided notes will simplify every lesson and. 5. Products. $7.50 $10.00 Save $2.50. View Bundle. Description. Standards.
Lesson 9 Homework Practice Qualitative Graphs. Lesson 9 Homework Practice Qualitative Graphs chavir April 01, ... Lesson 9 Problem-Solving Practice Estimate Roots 1.. MidwayUSA is a privately held American retailer of various hunting and outdoor-related products.. ... Glencoe Math Course .. Lesson 9.2 COMMON CORE STANDARD5.G.A.1 Graph points on ...
5_MNLESE342392_C09O.indd. Name. Line Graphs. Use the table for 1-5. Practice and Homework. Lesson 9.4. COMMON CORE STANDARD—5.G.A.2. Graph points on the coordinate plane to solve real-world and mathematical problems. Hourly Temperature.
About Press Copyright Contact us Creators Advertise Developers Terms Privacy Policy & Safety How YouTube works Test new features NFL Sunday Ticket Press Copyright ...
5. Graph 2. Sample answer: The car eases into traffic and has to stop. After a while, it starts up fast and then stops. 6. 7. 20 mi Practice and Problem Solving: C 1. Graph C 2. Graph A 3. Graph B; Sample answer: Drives around and to the gas station. Fills his gasoline tank. Drives around some more. enough to buy a gym membership. Then I 4.
9. Qualitative Graphs p. 350-354 arrow_right. Chapter Review p. 358-360 arrow_right. arrow_back Go back. 9. Qualitative Graphs ... Find more exercises to practice for Relations and Functions arrow_right. Asses your skill. Test your problem-solving skills with the Relations and Functions test arrow_right. forum Ask a question autorenew track ...
This item is made using Google Slides & Google Forms for an interactive digital experience. It is fully updated to align with the Ontario 2020 Math Curriculum for Grade 3Data: Creating Graphs (Pictograph & Bar Graphs) Strand D: D1.2: Collect data through observations, experiments, and interviews to answer questions of interest that focus on qualitative and quantitative data, and organize the ...
Problem Solving Handbook Cross-Curricular Projects ... Custom Chapter Resources Chapter Readiness Quiz Chapter Test Concepts in Motion Real-World Careers Standardized Test Practice Vocabulary Review Lesson Resources Extra Examples ... Mathematics. Home > Chapter 9 > Lesson 1. Algebra 1. Chapter 9, Lesson 1: Graphing Quadratic Functions. Extra ...
9. Qualitative Graphs - Pages 350-354 - 4. Functions - Glencoe Math: Course 3, Volume 1 (9780076615308) - Pre-Algebra - What You
How can you use the graph for Exercise 2 to find how many cups are in 9 quarts? Possible answer: Extend the line on the graph. Locate 9 on the x-axis and draw a vertical line up to the line plotted on the graph. From that point, draw a horizontal line to the y-axis. The number on the y-axis is the number of cups that are equal to 9 quarts. 36 4.