

The Scientific Method
Similar to the method by which a police detective investigates a crime, nutritional scientists discover the health effects of food and nutrients by first making an observation and posing a question that they’d like to answer. Then they formulate a hypothesis, test their hypothesis through experiments, and finally interpret the results. After analyzing additional evidence from multiple sources, they may form a conclusion on whether the food suspect fits the claim. This organized process of inquiry used in forensic science, nutritional science, and every other science is called the scientific method .
The basis of what we know about nutrition is derived from research, and the scientific method underlies how research is conducted. The steps of the scientific method include:
1. Observation/Question: The researcher first makes an observation and comes up with a research question to investigate.
2. Hypothesis: The researcher formulates a hypothesis, or educated guess, that would explain the observation or question and that can be tested through scientific experiments.
3. Experiment: The researcher designs and conducts an experiment. A good design takes into account what has been done previously. Thus, before beginning a new study, the researcher undertakes a thorough review of published research in order to ensure that their work advances the field.
4. Analysis: The researcher collects and analyzes data that will either support or refute the hypothesis. If the hypothesis is not supported, researchers create a new hypothesis and conduct a new experiment. If the hypothesis is supported, researchers will design additional experiments to try to replicate the findings or to test them in different ways.
5. Conclusion: After multiple experiments consistently support a hypothesis, researchers can offer a conclusion or theory.

Figure 2.1. The scientific method is a cyclical process, because it always leads to new observations and questions.
Through the scientific method, our knowledge of science builds continuously over time. No one study is enough to fully explain any one phenomenon, particularly in an area as complex as nutrition. Even experiments that go exactly as expected lead us to new questions to investigate. Science is also filled with surprises, both big and small. Experiments may not yield the results that we expect, but that can lead to new and important questions. And because scientists are human, they can make mistakes along the way or fail to acknowledge or test an important variable, which is why it’s important that experiments be repeated and evaluated by other researchers along the way.
The history of nutrition is full of fascinating examples of the scientific method at work, such as the discovery that iodine is a nutrient. This story of scientific discovery began in 1811, when French chemist Bernard Courtois was isolating a substance called saltpeter, an ingredient needed to make gunpowder to be used by Napoleon’s army. Part of his isolation procedure involved burning seaweed. When he did this, he observed the release of an intense violet vapor, which crystallized when he exposed it to a cold surface. He sent the violet crystals to an expert on gases, Joseph Gay-Lussac, who identified the crystal as a new element. It was named iodine, the Greek word for violet. The following scientific record is some of what took place in order to conclude that iodine is a nutrient. 1,2
Observation: Eating seaweed is a cure for goiter, an enlargement of the thyroid gland in the neck.

Figure 2.2. Large goiter in a woman from Bern, Switzerland.
Hypothesis: In 1813, Swiss physician Jean-Francois Coindet hypothesized that seaweed contained iodine and that he could use iodine instead of seaweed to treat his patients.
Experimental test: Coindet administered iodine tincture orally to his patients with goiter.
Interpret results: Coindet’s iodine treatment was successful in treating patients with goiter.
Gathering more evidence: Many other physicians contributed to the research on iodine deficiency and goiter.
Hypothesis: In 1851, French chemist Chatin proposed that the low iodine content in food and water of certain areas far away from the ocean were the primary cause of goiter and renounced the theory that goiter was the result of poor hygiene. (Physicians at the time also blamed drunkenness, dampness, and contaminated water as causes of goiter.)
Experimental test: In the late 1860s, authorities in several French villages began giving out iodine tablets and salt in an effort to treat goiter.
Interpret results: The program was effective, and 80 percent of goitrous children were cured. However, adults did not always respond well to the treatment, and because men with goiter were exempted from service in the French military, some people were opposed to treating it. Some scientists also insisted that goiter was caused by infectious disease, so iodine wasn’t yet accepted as a means of preventing it.
Hypothesis: In 1918, Swiss doctor Bayard proposed iodizing salt as a good way to treat areas endemic with goiter.
Experimental test: Iodized salt was transported by mules to a small village at the base of the Matterhorn, where more than 75 percent of school children were goitrous. It was given to families to use for six months.
Results: The iodized salt was beneficial in treating goiter in this remote population.
Experimental test: Physician David Marine conducted the first U.S. experiment of treating goiter with iodized salt in Akron, Ohio.
Results: This study conducted on over 4,000 school children found that iodized salt prevented goiter.
Conclusions: Seven other studies similar to Marine’s were conducted in Italy and Switzerland that also demonstrated the effectiveness of iodized salt in treating goiter. In 1924, U.S. public health officials initiated the program of iodizing salt and started eliminating the scourge of goiterism. Today, more than 70 percent of American households use iodized salt, and many other countries have followed the same public health strategy to reduce the health consequences of iodine deficiency.
It took more than one hundred years from iodine’s discovery as an effective treatment for goiter until public health programs recognized it as such. Although a lengthy process, the scientific method is a productive way to define essential nutrients and determine their ability to promote health and prevent disease.
Reporting Scientific Work
As we saw with the story of iodine research, scientists must share their findings in order for other researchers to expand and build upon their discoveries. Collaboration with other scientists when planning and conducting studies and analyzing results is important for scientific research. For this reason, communicating with peers and disseminating study results are important aspects of a scientist’s work. Scientists can share results by presenting them at a scientific meeting or conference, but this approach can reach only the select few who are present. Instead, most scientists present their results in peer-reviewed manuscripts that are published in scientific journals .
Peer-reviewed manuscripts are scientific papers that are reviewed by a scientist’s colleagues, or peers. These colleagues are qualified individuals, often experts in the same research area, who judge whether or not the scientist’s work is suitable for publication. The process of peer review is a quality control step; its goal is to ensure that the research described in a scientific paper is original, significant, logical, and thorough. It’s important to note that peer review doesn’t mean a study is perfect or even good. Sometimes bad studies slip through peer review, but because they’re published and other scientists read them, these are usually caught later and often retracted. Science is often messy and imperfect, but peer-review and publication of results are essential to its progress and ability to self-correct when people make mistakes.
VIDEO: “ Peer R eview in 3 Minutes ” by libncsu, YouTube (May 1, 2014), 3:14 minutes.
Self-Check:
Attributions:
- “The Scientific Method” section 1.13 from Lindshield, B. L. Kansas State University Human Nutrition (FNDH 400) Flexbook. goo.gl/vOAnR , CC BY-NC-SA 4.0
- “ The Broad Role of Nutritional Science ,” section 1.3 from the book An Introduction to Nutrition (v. 1.0), CC BY-NC-SA 3.0
- “ Reporting Scientific Work ” section 5 from Jones, T.G. The Science of Biology, CC BY-NC-SA 4.0
References:
- 1 Carpenter, K. J. (2005). David Marine and the Problem of Goiter. The Journal of Nutrition , 135 (4), 675–680. https://doi.org/10.1093/jn/135.4.675
- 2 Zimmermann, M. B. (2008). Research on Iodine Deficiency and Goiter in the 19th and Early 20th Centuries. The Journal of Nutrition , 138 (11), 2060–2063. https://doi.org/10.1093/jn/138.11.2060
- Figure 2.1. “ The Scientific Method ” by Thebiologyprimer is in the Public Domain
- Figure 2.2. “ Large Goiter in Woman ” by E. Theodor Kocher is in the Public Domain
An organized process of inquiry used in nutritional science, and every other science; made up of a cyclical process of steps including observation/question, hypothesis, experiment, analysis, and conclusion.
Scientific papers that are reviewed by other experts in the field, who were not directly involved in the research, before publication.
Nutrition: Science and Everyday Application, v. 1.0 Copyright © 2020 by Alice Callahan, PhD; Heather Leonard, MEd, RDN; and Tamberly Powell, MS, RDN is licensed under a Creative Commons Attribution-NonCommercial 4.0 International License , except where otherwise noted.
Share This Book

Want to create or adapt books like this? Learn more about how Pressbooks supports open publishing practices.
Research and the Scientific Method
University of Hawai‘i at Mānoa Food Science and Human Nutrition Program and Human Nutrition Program
Nutritional scientists discover the health effects of food and its nutrients by first making an observation. Once observations are made, they come up with a hypothesis, test their hypothesis, and then interpret the results. After this, they gather additional evidence from multiple sources and finally come up with a conclusion. This organized process of inquiry used in science is called the scientific method .
Figure 1.2 Scientific Method Steps
In 1811, French chemist Bernard Courtois was isolating saltpeter for producing gunpowder to be used by Napoleon’s army. To carry out this isolation, he burned some seaweed and in the process, observed an intense violet vapor that crystallized when he exposed it to a cold surface. He sent the violet crystals to an expert on gases, Joseph Gay-Lussac, who identified the crystal as a new element. It was named iodine, the Greek word for violet. The following scientific record is some of what took place in order to conclude that iodine is a nutrient .
Observation. Eating seaweed is a cure for goiter , a gross enlargement of the thyroid gland in the neck.
Hypothesis. In 1813, Swiss physician Jean-Francois Coindet hypothesized that the seaweed contained iodine, and that iodine could be used instead of seaweed to treat his patients [1] .
Experimental test. Coindet administered iodine tincture orally to his patients with goiter.
Interpret results. Coindet’s iodine treatment was successful.
Hypothesis. French chemist Chatin proposed that the low iodine content in food and water in certain areas far away from the ocean was the primary cause of goiter, and renounced the theory that goiter was the result of poor hygiene.
Experimental test. In the late 1860s the program, “The stamping-out of goiter,” started with people in several villages in France being given iodine tablets.
Results. The program was effective and 80 percent of goitrous children were cured.
Hypothesis. In 1918, Swiss doctor Bayard proposed iodizing salt as a good way to treat areas endemic with goiter.
Experimental test. Iodized salt was transported by mules to a small village at the base of the Matterhorn where more than 75 percent of school children were goitrous. It was given to families to use for six months.
Results. The iodized salt was beneficial in treating goiter in this remote population.
Experimental test. Physician David Marine conducted the first experiment of treating goiter with iodized salt in America in Akron, Ohio. [2]
Results. This study was conducted on over four-thousand school children, and found that iodized salt prevented goiter.
Conclusions. Seven other studies similar to Marine’s were conducted in Italy and Switzerland, which also demonstrated the effectiveness of iodized salt in treating goiter. In 1924, US public health officials initiated the program of iodizing salt and started eliminating the scourge of goiter. Today, more than 70% of American households use iodized salt and many other countries have followed the same public health strategy to reduce the health consequences of iodine deficiency.
Career Connection
What are some of the ways in which you think like a scientist, and use the scientific method in your everyday life? Any decision-making process uses some aspect of the scientific method. Think about some of the major decisions you have made in your life and the research you conducted that supported your decision. For example, what brand of computer do you own? Where is your money invested? What college do you attend?
Evidence-Based Approach to Nutrition
It took more than one hundred years from iodine’s discovery as an effective treatment for goiter until public health programs recognized it as such. Although a lengthy process, the scientific method is a productive way to define essential nutrients and determine their ability to promote health and prevent disease. The scientific method is part of the overall evidence-based approach to designing nutritional guidelines [3] . An evidence-based approach to nutrition includes [4] :
- Defining the problem or uncertainty (e.g., the incidence of goiter is lower in people who consume seaweed)
- Formulating it as a question (e.g., Does eating seaweed decrease the risk of goiter?)
- Setting criteria for quality evidence
- Evaluating the body of evidence
- Summarizing the body of evidence and making decisions
- Specifying the strength of the supporting evidence required to make decisions
- Disseminating the findings
The Food and Nutrition Board of the Institute of Medicine, a nonprofit, non-governmental organization, constructs its nutrient recommendations (i.e., Dietary Reference Intakes, or DRI) using an evidence-based approach to nutrition. The entire procedure for setting the DRI is documented and made available to the public. The same approach is used by the USDA and HHS, which are departments of the US federal government. The USDA and HHS websites are great tools for discovering ways to optimize health; however, it is important to gather nutrition information from multiple resources, as there are often differences in opinion among various scientists and public health organizations. Full text versions of the DRI publications are available in pdf format at https://www.nap.edu/ , along with many other free publications.
Learning Activities
Technology Note : The second edition of the Human Nutrition Open Educational Resource (OER) textbook features interactive learning activities. These activities are available in the web-based textbook and not available in the downloadable versions (EPUB, Digital PDF, Print_PDF, or Open Document).
Learning activities may be used across various mobile devices, however, for the best user experience it is strongly recommended that users complete these activities using a desktop or laptop computer and in Google Chrome .
- Zimmerman, M.B. (2008). Research on Iodine Deficiency and Goiter in the 19th and Early 20th Centuries. Journal of Nutrition, 138 (11), 2060–63. http://jn.nutrition.org/content/138/11/2060.full ↵
- Carpenter, K.J. (2005). David Marine and the Problem of Goiter. Journal of Nutrition, 135 (4), 675–80. http://jn.nutrition.org/content/135/4/675.full?sid=d06fdd35-566f -42a2-a3fd- efbe0736b7ba ↵
- Myers E. (2003). Systems for Evaluating Nutrition Research for Nutrition Care Guidelines: Do They Apply to Population Dietary Guidelines? Journal of the American Dietetic Association, 12 (2), 34–41. http://jandonline.org/article/S0002-8223(03)01378-6/abstract ↵
- Briss PA, Zara S, et al. (2000). Developing an Evidence-Based Guide to Community Preventive Services—Methods. Am J Prev Med, 18 (1S), 35–43. https://www.ncbi.nlm.nih.gov/pubmed/10806978 ↵
The general method of procedure of science that is used to explain observations about the world around us.
A substance in food that can provide energy, contribute to body structure, and/or regulate body processes.
An enlarged thyroid gland caused by a deficiency in iodine.
A gland located in the neck that produces both thyroid hormone and calcitonin.
The universal chemical solvent in which most of the processes of life occur.
A small amount of sodium iodide or potassium iodide that is added to table salt in order to supplement the iodine content of the diet.
The sum of all processes involved in how organisms obtain nutrients, metabolize them, and use them to support all of life’s processes.
Research and the Scientific Method Copyright © 2020 by University of Hawai‘i at Mānoa Food Science and Human Nutrition Program and Human Nutrition Program is licensed under a Creative Commons Attribution-NonCommercial-ShareAlike 4.0 International License , except where otherwise noted.
Share This Book
The levels of evidence in nutrition research
Nutrition and health are inextricably linked. Nutrition researchers try to unravel these connections in order to arrive at reliable nutritional advice. However, not all types of research can be used to draw equally firm conclusions. Understanding the different types of study designs is important for distinguishing between reliable and less robust findings. This article explores the various study designs commonly used in nutrition research, their purpose, how strong their evidence is and discusses the strengths and limitations of each design.
Systematic reviews and meta-analysis
A single study is not enough to make a general statement with certainty about a certain link between nutrition and health. That is where systematic reviews and meta-analysis come in: in this type of research, researchers gather all relevant studies on a particular topic and analyse these collectively. As a result, the risk between a certain exposure/factor (e.g., overweight) and outcome/disease (e.g., cancer) can be estimated reasonably well. 1
In a meta-analysis, results of multiple studies are pooled, following a rigorous protocol to find all the original research studies done on a question, and weighted with statistical methods into a single summary estimate. Large and well-conducted studies with high-quality evidence are given more ‘weight’ than small or poorly conducted studies with low quality data. A meta-analysis can only be carried out if the studies look at the same research question and use similar methods to measure relevant variables.
Systematic reviews are similar to meta-analysis, but without the use of a statistical analysis. Although systematic reviews and meta-analysis can reduce bias by pooling data from all relevant studies investigating a particular topic, they are only as good as the studies they include. It is important to check whether data from flawed studies are included or if there are data from studies that use different methods to measure variables – resulting in a comparison of ‘apples and oranges.’ To reduce the risk of bias and improve reporting and transparency, using a set of guidelines called the Preferred Reporting Items for Systematic Reviews and Meta-analyses (PRISMA) is endorsed by most of the high-quality scientific journals. 2
Randomised controlled trials (RCTs)
A randomised controlled trial (RCT) is a type of intervention study where the researcher actively intervenes to change any aspect of nutrition to see what the effect this has on a certain health outcome.
In an RCT, a group of human subjects with same condition are identified and then randomly allocated to either receive the treatment (e.g., an omega-3 fatty acid supplement) or to a control group that does not receive the treatment (e.g., a ‘placebo’ supplement that looks identical to the original supplement but does not contain the substance being studied). After a defined time period, the effects in both groups are measured and compared to each other. As only one factor is deliberately changed between the groups (and other possible factors that influence the relationship are kept the same or as similar as possible), this type of research can allow us to identify cause-and-effect relationships. 1 These types of study are also used in medical research, for example to test the effects of new drugs or vaccines.

Preferably, RCTs are performed as a double-blind study: both the researcher and the participants are unaware who is in which group. This is important because a participant’s response or a researcher’s measurement of the outcome could be impacted by knowing who is being treated. For example, the placebo effect is a well-known phenomenon where a person observes an improvement in symptoms or effects in themselves after taking a fake or non-active ‘treatment’ (e.g., pills that don’t contain any active ingredient). On top of that, true randomisation is important. If one group were in some way more ill (or less healthy) than the other group at the start, this might make this group appear to have worse outcomes, even if the administered treatment really had no effect.
RCTs also have limitations. They may not be suitable for answering certain research questions, such the effect of whole diets (e.g., ketogenic, vegan) on the prevention of chronic diseases like cancer or cardiovascular disease. It would be impossible to control compliance (e.g., how strictly the study participants stick to the prescribed diet), a huge number of subjects would be required to show a significant difference in outcome, and it would cost a huge amount of money and time. Furthermore, interventions which deliberately expose participants to something thought to be harmful (e.g., alcohol, smoking, contaminants) or withholding participants from treatment thought to improve health (e.g., certain antibiotics or chemotherapeutic agents) in order to definitely prove a cause-and-effect relationship raise ethical concerns. Time is also an important factor. The more robust and reliable studies are those lasting longer.
It is also important not to generalise results of RCTs too quickly. RCTs often have strict criteria of whom to include and exclude. If a study was only carried out on a specific group of people (e.g., middle-aged women with diabetes), the study may not be applicable to the wider population. Lastly, RCTs may often run for short time periods since they are expensive to carry out. So, they may not be able to tell us about the long-term effects of dietary patterns and changes.
Observational research
Observational research involves simply observing the habits or behaviours in large groups of people to investigate the relationship between lifestyle factors and health outcomes. The researcher does not intervene in any way but compares the health outcomes of people who make different diet or lifestyle choices. These studies are used to identify correlations and develop hypotheses for further testing. 1
For example, researchers observe that people who drink alcohol are more likely to develop lung cancer than those who don’t. However, it may also be that people who drink alcohol also tend to smoke more often and that researchers fail to include this factor into their analysis (e.g., it was not measured or not thought to influence the relationship). Here, smoking is a so-called confounding factor: a factor associated with both the exposure (drinking alcohol) as well as the outcome (lung cancer) and therefore could distort the data. In an RCTs these confounding factors are evenly distributed across the study groups (assuming randomisation is done correctly), but this is unlikely to be the case in observational research. Because of the presence of confounding factors, observational research cannot prove cause-and-effect. The interest of observational studies lies in revealing these relationships in order to address future research.
The next sections describe three common observational study designs: prospective cohort studies, case-control studies, and cross-sectional studies.
Prospective cohort studies
A prospective cohort study is a study that follows a group of people over time. At the start of the study, researchers ask participants to complete a questionnaire (e.g., about their dietary habits, physical activity levels, etc.) and may also take measurements of weight, height, blood pressure, blood profile or other biological factors. Years later, the researchers look whether the participants have developed disease and study whether exposure from the questionnaire or biological measurements are associated with the disease. 1
One of the main advantages of this design is that researchers observe participants’ natural exposures and behaviours without intervention, providing insights into real-life scenarios. It also allows researchers to examine the long-term effects of nutrition or other lifestyle-related exposures on real diseases. Since chronic diseases, such as heart disease and osteoporosis, often take many decades to develop, a cohort may be more suitable compared to a RCT where often intermediate markers for these diseases are measured (e.g., narrowing of the arteries or bone density). These markers don’t always develop into the disease.
One of the main limitations of cohort studies is that they cannot establish causation definitively due to potential confounding factors. It is also important to consider how participants’ food intake is measured. Cohorts often use what’s called a Food Frequency Questionnaires (FFQs) which measures a person’s average dietary intake over time. While FFQs are one of the best methods available to assess dietary intake, it can be hard to accurately estimate typical intake, portion size, and preparation methods. As data is self-reported, it may include subjective interpretations (e.g., participants may underreport, overreport or simply forgot their past habits: a problem called recall bias). FFQs also don’t represent lifetime behaviour patterns: people may have changed their behaviour over the intervening years (e.g., smokers may quit smoking or meat eaters may become vegetarian), resulting in misclassification of participants and potential bias. When a validated FFQ is used, generally a part of bias is limited.
In a cohort study it is also important that participants are followed up for a long time to accumulate enough data to give robust results. This means they can generally only be used to study diseases that are relatively common. Another concern in cohort studies is selection bias: those selected to be in the study differ from those not selected in some systematic way. Recruitment of participants may be done, for example, through newspapers, phone dialling, the workplace or volunteering, impacting who takes part in the study and how generalisable the results are (i.e., newspapers are often only read by older populations, phone dialling excludes those without phones, volunteering recruits more health-conscious participants, etc.). Another concern occurs if many participants are ‘lost to follow-up’ (i.e., drop out of the study) in one exposure group than another, particularly if loss is also related to the outcome being studied.
Case-control studies
In a case-control study researchers look to the past of people with a disease (called the ‘cases’) and compare it to people without the disease (the ‘controls’). These studies are most often used to study the link between an exposure and a rare outcome. 1 They usually have a smaller sample size than cohort studies and do not require follow-up.

As in cohort studies, recall bias is a problem in case-control studies. This is to even larger extent as people already have the disease of interest when the exposure information is collected or measured and so they might recall their exposure differently from people without disease. Selection bias (cases and/or controls may not be representative for the general population), confounding, and reverse causation can be limitations. Reverse causation occurs when it is challenging to identify if the outcome or exposure came first. For example, if an association was found between the consumption of non-sugar sweeteners and obesity, is this truly because of the higher consumption of non-sugar sweeteners or is it that people with obesity more frequently consumed products containing non-sugar sweeteners to help manage their weight? The choice of an appropriate control group is also one of the main difficulties of this type of study. Control groups should be carefully selected to be similar to the cases (those with the condition of interest) in all aspects except the exposure being studied (e.g., diet). This ensures that any observed difference in outcomes can be attributed to the exposure rather than confounding factors.
Cross-sectional studies
A cross-sectional study is a survey or cross-section of a random sample of the population where information about potential exposures and outcomes is collected at the same time. For example, researchers measure blood pressure and ask questions about, for example, the amount of processed meat each person eats per day. This lets them find out whether there is a link between blood pressure and the amount of processed meat consumed per day. 1
With cross-sectional studies reverse causality is again a problem: you cannot be sure whether eating processed meat affects blood pressure or vice versa, because the information was obtained at the same time. Like cohort studies, they can also be prone to selection and recall bias. Recall bias may be a particular problem, since participant’s knowledge of their health status may influence their reporting of dietary habits (e.g., a person with type 2 diabetes may recall they ate more sweets and sodas than a person without the disease).
Instead, this simple study design can be useful to investigate the possible causes of ill-health at an early stage, examine exposure that do not change over time (e.g., sex, genetic factors) or that occurred many years previously, or estimate the prevalence of dietary habits and health outcomes in a population at a specific time point. They can provide a starting point for further investigation about associations between dietary factors and health outcomes in, for example, a cohort study or RCT.

Animal and cell studies
Animal and cell (or sometimes called in vitro) studies may provide an indication of the likely effect, however, they cannot be directly applied to humans. Research with animals is an important tool in determining how humans may react when exposed to particular substances. However, because of differences in physiology and the fact that animals are routinely exposed to far higher levels of compounds than typical dietary intakes, for example, results cannot be directly applied to humans. 3 Similarly, isolated cells in a laboratory behave differently than cells in our body. For example, if a test tube shows that substance X causes a cell to burn fat faster, that does not mean that substance X will help to lose weight in humans. The human body is much more complex than can be imitated in a test tube.
For research into toxic substances, this type of research is the norm. Testing harmful or possibly toxic compounds on humans is dangerous and unethical. Animal testing is therefore used to establish safety guidelines for chemical compounds such as pesticides and environmental contaminants. Because results cannot be extended to humans and people also differ from each other, wide safety margins are used. However, the use of laboratory animals is being substantially reduced following international protocols such as those by the Organization for Economic Cooperation and Development (OECD). 4
Animal and cell research can complement evidence from observational and experimental research: they can show if there is a mechanism that explains these results. For example, observational research shows that smoking is associated with cancer, while cell studies highlight the specific harmful substances present in tobacco that contributes to the development of cancer. The certainty that a result is accurate increases when there is such a logical explanation.
Anecdotes and case studies
Anecdotes, case reports (on 1 patient) and case series (on several patients) describe a detailed report of individual patient(s) with a specific outcome and/or exposure. 5 They are important for the early identification of health problems and can generate hypotheses about potential causes. However, since they involve a limited number of people, they cannot be generalised to broader populations. A single person’s experience or opinion does not provide an objective picture. Therefore, anecdotes and case studies are regarded as low-quality evidence.
What is considered the ‘best’ evidence?
Generally, the different types of research are organised from single person’s experiences and anecdotes having the weakest certainty of evidence to systematic reviews and meta-analysis having the strongest level of evidence. These levels of evidence can be used as a guideline to judge what can be concluded from a particular study. However, they do not substitute for critical appraisal. 6 For example, a strong cohort study may be more useful than a flawed systematic review. Besides, which type of research scientists choose to conduct depends on, among other things, the research question, the amount of time available and the amount of money. Therefore, evidence may be better sorted by its usefulness for investigating a specific research question than by type of study design.
Different types of study designs should be viewed as complementary. For example, observational research can still be meaningful and illuminating when numerous studies consistently show patterns on a large scale.

RCTs are often regarded as the ‘gold standard’ for conducting research and their findings are believed to be more accurate compared to observational research as they can establish cause-and-effect relationships. However, this assumption is not always valid because the intervention/exposure being studied in RCTs may differ from those in observational studies.6 For example, dietary intakes in observational studies are not interchangeable to some exposures used in RCTs (e.g., intake of omega-3 fatty acids by eating fish is different to omega-3 fatty acids consumed in isolated supplemental form). As a result, it is not surprising that sometimes contradictory results are found between observational and experimental research. 7 When testing findings from observational research further in RCTs, it is therefore important to carefully consider the population being studied, the way the intervention (dietary change) is applied, the comparison group, and the outcome(s) measured. Even small differences in how the study is conducted can lead to varying results.
Nutrition research is expensive and complex to develop. It is therefore difficult to reach to reliable results that support evidence. A single approach is not sufficient. There are a variety of study designs used in nutrition research which are used to study a variety of different exposures and outcomes. How all these studies can lead to a conclusion depends on the certainty of evidence. A link between an exposure and outcome is more certain if: 8
- A large number of prospective cohort studies consistently show an association between exposure to A (cause) and the risk of B (effect);
- The examinations are of good methodological quality, size and duration;
- There are few studies that find the opposite;
- If feasible, experimental studies have also been carried out;
- The link found can be explained biologically.
In contrast, there is insufficient evidence if:
- There are only a small number of studies suggesting that there is a link between exposure to A (cause) and the risk of B (effect);
- The link found is weak;
- No or insufficient experimental and observational studies have been done and therefore more research is needed.

- Webb P, Bain C & Page A (2017) Essential epidemiology: an introduction for students and health professionals. Cambridge University Press.
- PRISMA. (2023). Transparent reporting of systematic reviews and meta-analyses. Retrieved from http://www.prisma-statement.org/?AspxAutoDetectCookieSupport=1 (Accessed 05/09/2023)
- Van der Worp HB et al. (2010) Can animal models of disease reliably inform human studies? PLoS Medicine, 7(3):e1000245.
- OECD. (2023). Animal Welfare. Retrieved from https://www.oecd.org/chemicalsafety/testing/animal-welfare.htm (Accessed 05/09/2023)
- Mathes T & Pieper D (2017) Clarifying the distinction between case series and cohort studies in systematic reviews of comparative studies: potential impact on body of evidence and workload. BMC medical research methodology, 17:1-6.
- Flanagan A et al. (2023). Need for a nutrition-specific scientific paradigm for research quality improvement. BMJ Nutrition, Prevention & Health e000650
- Schwingshackl L et al. (2021) Evaluating agreement between bodies of evidence from randomised controlled trials and cohort studies in nutrition research: meta-epidemiological study. British Medical Journal 374:n1864.
- World Health Organization. (2014). WHO Handbook for Guideline Development. 2nd edition. Retrieved from https://www.who.int/publications/i/item/9789241548960 (Accessed 02/08/2023)
You may also like…
Most recent.
Whole grain (Q&A)
Shaping the gut microbiome through personalised nutrition
What are non-communicable diseases and how can we reduce our risk?
What is processed food?

- school Campus Bookshelves
- menu_book Bookshelves
- perm_media Learning Objects
- login Login
- how_to_reg Request Instructor Account
- hub Instructor Commons
- Download Page (PDF)
- Download Full Book (PDF)
- Periodic Table
- Physics Constants
- Scientific Calculator
- Reference & Cite
- Tools expand_more
- Readability
selected template will load here
This action is not available.
1.5: The Broad Role of Nutritional Science
- Last updated
- Save as PDF
- Page ID 1819
Learning Objective
- Provide an example of how the scientific method works to promote health and prevent disease.
How to Determine the Health Effects of Food and Nutrients
Similar to the method by which a police detective finally charges a criminal with a crime, nutritional scientists discover the health effects of food and its nutrients by following a process known as scientific method. The scientific method involves five steps: 1) ask a question or make an observation; 2) investigate the current and past literature to determine what is known about that observation or question; 3) construct a hypothesis; 4) test that hypothesis using experimental procedure; and 5) analyze the results and draw conclusions.
Below is an illustration of the scientific method at work—in this case to prove that iodine is a nutrient. Zimmerman, M.B. “Research on Iodine Deficiency and Goiter in the 19th and Early 20th Centuries.” J Nutr 138, no. 11 (November 2008): 2060–63 . Carpenter, K.J. “David Marine and the Problem of Goiter.” J Nutr 135, no.4 (April 2005): 675–80 . I n 1811, French chemist Bernard Courtois was isolating saltpeter for producing gunpowder to be used by Napoleon’s army. To carry out this isolation he burned some seaweed and in the process observed an intense violet vapor that crystallized when he exposed it to a cold surface. He sent the violet crystals to an expert on gases, Joseph Gay-Lussac, who identified the crystal as a new element. It was named iodine, the Greek word for violet. The following scientific record is some of what took place in order to conclude that iodine is a nutrient.
Observation. Eating seaweed is a cure for goiter, a gross enlargement of the thyroid gland in the neck.
- Hypothesis. In 1813, Swiss physician Jean-Francois Coindet hypothesized that the seaweed contained iodine and he could use just iodine instead of seaweed to treat his patients.
- Experimental test. Coindet administered iodine tincture orally to his patients with goiter.
- Interpret results. Coindet’s iodine treatment was successful.
- Gathering more evidence. Many other physicians contributed to the research on iodine deficiency and goiter.
Hypothesis. French chemist Chatin proposed that the low iodine content in food and water of certain areas far away from the ocean were the primary cause of goiter and renounced the theory that goiter was the result of poor hygiene.
- Experimental test. In the late 1860s the program, “The stamping-out of goiter,” started with people in several villages in France being given iodine tablets.
- Results. The program was effective and 80 percent of goitrous children were cured.
Hypothesis. In 1918, Swiss doctor Bayard proposed iodizing salt as a good way to treat areas endemic with goiter.
- Experimental test. Iodized salt was transported by mules to a small village at the base of the Matterhorn where more than 75 percent of school children were goitrous. It was given to families to use for six months.
- Results. The iodized salt was beneficial in treating goiter in this remote population.
- Experimental test. Physician David Marine conducted the first experiment of treating goiter with iodized salt in America in Akron, Ohio.
- Results. This study conducted on over four-thousand school children found that iodized salt prevented goiter.
Conclusions. Seven other studies similar to Marine’s were conducted in Italy and Switzerland that also demonstrated the effectiveness of iodized salt in treating goiter. In 1924, US public health officials initiated the program of iodizing salt and started eliminating the scourge of goiterism. Today more than 70 percent of American households use iodized salt and many other countries have followed the same public health strategy to reduce the health consequences of iodine deficiency.
Evidence-Based Approach to Nutrition
It took more than one hundred years from iodine’s discovery as an effective treatment for goiter until public health programs recognized it as such. Although a lengthy process, the scientific method is a productive way to define essential nutrients and determine their ability to promote health and prevent disease. The scientific method is part of the overall evidence-based approach to designing nutritional guidelines. An evidence-based approach to nutrition includes: Briss, P.A., et al. “Developing an Evidence-Based Guide to Community Preventive Services—Methods.” Am J Prev Med 18, no. 1S (2000): 35–43. , Myers, E. “Systems for Evaluating Nutrition Research for Nutrition Care Guidelines: Do They Apply to Population Dietary Guidelines?” J Am Diet Assoc 103, no. 12, supplement 2 (December 2003): 34–41.
- Defining the problem or uncertainty (e.g., the rate of colon cancer is higher in people who eat red meat)
- Formulating it as a question (e.g., Does eating red meat contribute to colon cancer?)
- Setting criteria for quality evidence
- Evaluating the body of evidence
- Summarizing the body of evidence and making decisions
- Specifying the strength of the supporting evidence required to make decisions
- Disseminating the findings
The Food and Nutrition Board of the Institute of Medicine, a nonprofit, nongovernmental organization, constructs its nutrient recommendations (i.e., Dietary Reference Intakes, or DRI) using an evidence-based approach to nutrition. The entire procedure for setting the DRI is documented and made available to the public. The same approach is used by the USDA and HHS, which are departments of the US federal government. The USDA and HHS websites are great tools for discovering ways to optimize health; however, it is important to gather nutrition information from multiple resources as there are often differences in opinion among various scientists and public health organizations. While the new Dietary Guidelines , published in 2015, have been well-received by some, there are nongovernmental public health organizations that are convinced that some pieces of the guidelines may be influenced by lobbying groups and/or the food industry. For example, the Harvard School of Public Health (HSPH) feels the government falls short by being “too lax on refined grains.” The Harvard School of Public Health. “New US Dietary Guidelines: Progress, Not Perfection.” © 2012 The President and Fellows of Harvard College. The guidelines recommend getting at least half of grains from whole grains—according to the HSPH this still leaves too much consumption of refined grains.
For a list of reliable sources that advocate good nutrition to promote health and prevent disease using evidence-based science see Table 1.05.1. In this Chapter, we will further discuss distinguishing criteria that will enable you to wade through misleading nutrition information and instead gather your information from reputable, credible websites and organizations.
Types of Scientific Studies
There are many types of scientific studies that can be used to provide supporting evidence for a particular hypothesis. The various types of studies include epidemiological studies, interventional clinical trials, and randomized clinical interventional trials.
Epidemiological studies are observational studies that look for health patterns and are often the front-line studies for public health. The CDC defines epidemiological studies as scientific investigations that define frequency, distribution, and patterns of health events in a population. Thus, these studies describe the occurrence and patterns of health events over time. The goal of an epidemiological study is to find factors associated with an increased risk for a health event, though these sometimes remain elusive. An example of an epidemiological study is the Framingham Heart Study, a project of the National Heart, Lung and Blood Institute and Boston University that has been ongoing since 1948. This study first examined the physical health and lifestyles of 5,209 men and women from the city of Framingham, Massachusetts and has now incorporated data from the children and grandchildren of the original participants. One of the seminal findings of this ambitious study was that higher cholesterol levels in the blood are a risk factor for heart disease. The Framingham Heart Study, a project of the National Heart, Lung, and Blood Institute and Boston University. “History of the Framingham Heart Study.” Epidemiological studies are a cornerstone for examining and evaluating public health and some of their advantages are that they can lead to the discovery of disease patterns and risk factors for diseases, and they can be used to predict future healthcare needs and provide information for the design of disease prevention strategies for entire populations. Some shortcomings of epidemiological studies are that investigators cannot control environments and lifestyles, a specific group of people studied may not be an accurate depiction of an entire population, and these types of scientific studies cannot directly determine if one variable causes another. Scientists regard epidemiological studies as a starting place for ideas about what types of lifestyle choice MAY contribute to a disease. They can show a correlation between two things happening but not whether one factor CAUSED the other. My favorite example of this is a thought experiment where a make-believe scientist observes (through epidemiological studies) that gray hair often goes along with Alzheimer's Disease. Wouldn't it be silly for that scientist to predict that gray hair CAUSES Alzheimer's Disease? Could that scientist easily test that silly prediction? Suppose that scientist dyed a group of people's hair gray to see if the color gray truly increased their risk of Alzheimer's Disease. The whole thing is silly but I think you get the point. Epidemiological studies may give us ideas but those ideas need clinical trials to figure out what the patterns mean.
There are many different types of study designs including r andomized controlled trials, cohort study (prospective observational study), case-control study, cross-sectional study, and case reports. Each has its strengths and weaknesses and the selection of the study type depends on the hypothesis being tested and the resources available.
A cohort study (prospective observational study) is a clinical study in which a group of people with a particular condition or treatment, for example, lung cancer or patients taking an antihypertensive, is followed over time. In addition, a second cohort of people that do not have that condition or treatment is followed and compared to the first group with the condition. Here is an example of a cohort study: Zacche MM, Giarenis I, Thiagamoorthy G, Robinson D, Cardozo L. Is there an association between aspects of the metabolic syndrome and overactive bladder? A prospective cohort study in women with lower urinary tract symptoms . Eur J Obstet Gynecol Reprod Biol. 2017 Aug 2;217:1-5. https://www.ncbi.nlm.nih.gov/pubmed/28826038
A case-control study does not follow people over time and pre-selects individuals with a particular result (the cases), for example, people with osteoporosis (outcome), and then interviews that group or checks their records to determine what specific experience they had. From this information, an odds ratio is calculated to determine the odds of having an experience with the outcome of having the experience without the outcome. Here is an example of a cohort study: Alvarado-Esquivel C, Maldonado-Soto E, Sanchez-Anguiano LF, Hernandez-Tinoco J, Ramos-Nevarez A, Cerrillo-Soto SM, Sandoval-Carrilo AA, Salas-Pacheco JM, Antuna-Salcido EI, Estrada-Martinez S, Guido-Arreola CA. Lack of Serological and Molecular Association between Toxoplasma Gondii Exposure and Obesity: A Case-Control Study. Int J Biomed Sci. 2017 Jun;13(2):74-78.
Cross-sectional studies look at a single point in time or time interval in a particular population. Exposure and outcome are determined simultaneously. Here is an example of a cohort study: Nygaard L, Skallerup A, Olesen SS, Køhler M, Vinter-Jensen L, Kruse C, Vestergaard P, Rasmussen HH. Osteoporosis in patients with intestinal insufficiency and intestinal failure: Prevalence and clinical risk factors. Clin Nutr. 2017 Aug 5. pii: S0261-5614(17)30259-5. doi:10.1016/j.clnu.2017.07.018. [Epub ahead of print]
Case reports involve cases with a particular outcome. No control group is involved. The report may include one subject or several subjects. Here is an example of a cohort study: Meade RD, D'Souza AW, Krishen L, Kenny GP. The physiological strain incurred during electrical utilities work over consecutive work shifts in hot environments: A case report. J Occup Environ Hyg. 2017 Aug 21:0. doi: 10.1080/15459624.2017.1365151. [Epub ahead of print]
Some studies may involve the use of a placebo which is a harmless medicine, procedure or task that has no therapeutic effect. Instead, it may have a powerful psychological benefit.
Interventional clinical trial studies are scientific investigations in which a variable is changed between groups of people. When well done, this type of study allows one to determine causal relationships. An example of an interventional clinical trial study is the Dietary Approaches to Stop Hypertension (DASH) trial published in the April 1997 issue of The New England Journal of Medicine . Appel, L. J., et al. “A Clinical Trial of the Effects of Dietary Patterns on Blood Pressure.,” N Engl J Med 336 (April 1997): 1117–24 . In this study, 459 people were randomly assigned to three different groups; one was put on an average American control diet, a second was put on a diet rich in fruits and vegetables, and the third was put on a combination diet rich in fruits, vegetables, and low-fat dairy products with reduced saturated and total fat intake. The groups remained on the diets for eight weeks. Blood pressures were measured before starting the diets and after eight weeks. Results of the study showed that the group on the combination diet had significantly lower blood pressure at the end of eight weeks than those who consumed the control diet. The authors concluded that the combination diet is an effective nutritional approach to treat high blood pressure. The attributes of high-quality clinical interventional trial studies are:
- those that include a control group, which does not receive the intervention, to which you can compare the people who receive the intervention being tested;
- those in which the subjects are randomized into the group or intervention group, meaning a given subject has an equal chance of ending up in either the control group or the intervention group. This is done to ensure that any possible confounding variables are likely to be evenly distributed between the control and the intervention groups;
- those studies that include a sufficient number of participants.
What are confounding variables? These are factors other than the one being tested that could influence the results of the study. For instance, in the study, we just considered, if one group of adults did less physical activity than the other, then it could be the amount of physical activity rather than the diet being tested that caused the differences in blood pressures among the groups.
The limitations of these types of scientific studies are that they are difficult to carry on for long periods of time, are costly, and require that participants remain compliant with the intervention. Furthermore, it is unethical to study certain interventions. (An example of an unethical intervention would be to advise one group of pregnant mothers to drink alcohol to determine the effects of alcohol intake on pregnancy outcome because we know that alcohol consumption during pregnancy damages the developing fetus.)
Randomized clinical interventional trial studies are powerful tools to provide supporting evidence for a particular relationship and are considered the “gold standard” of scientific studies. A randomized clinical interventional trial is a study in which participants are assigned by chance to separate groups that compare different treatments. Neither the researchers nor the participants can choose which group a participant is assigned. However, from their limitations, it is clear that epidemiological studies complement interventional clinical trial studies and both are necessary to construct strong foundations of scientific evidence for health promotion and disease prevention.
Other scientific studies used to provide supporting evidence for a hypothesis include laboratory studies conducted on animals or cells. An advantage of this type of study is that they typically do not cost as much as human studies and they require less time to conduct. Other advantages are that researchers have more control over the environment and a number of confounding variables can be significantly reduced. Moreover, animal and cell studies provide a way to study relationships at the molecular level and are also helpful in determining the exact mechanism by which a specific nutrient causes a change in health. An animal model can closely mimic the exact disease in humans. The disadvantage of these types of studies is that researchers are not working with whole humans and thus the results may not be relevant. Nevertheless, well-conducted animal and cell studies that can be repeated by multiple researchers and obtain the same conclusion are definitely helpful in building the evidence to support a scientific hypothesis.
Evolving Science
Science is always moving forward, albeit sometimes slowly. One study is not enough to make a guideline or a recommendation or cure a disease. Science is a stepwise process that builds on past evidence and finally culminates into a well-accepted conclusion. Unfortunately, not all scientific conclusions are developed in the interest of human health and it is important to know where a scientific study was conducted and who provided the money. Indeed, just as an air quality study paid for by a tobacco company diminishes its value in the minds of readers, so does one on red meat performed at a laboratory funded by a national beef association.
Science can also be contentious even amongst experts that don’t have any conflicting financial interests. To see scientists debating over the nutritional guidelines, watch Video 1.5.1. Contentious science is actually a good thing as it forces researchers to be of high integrity, well-educated, well-trained, and dedicated. It also instigates public health policy makers to seek out multiple sources of evidence in order to support a new policy. An agreement involving many experts across multiple scientific disciplines is necessary for recommending dietary changes to improve health and prevent disease. Although a somewhat slow process, it is better for our health to allow the evidence to accumulate before incorporating some change in our diet.
http://www.youtube.com/embed/KBryEJXSaLk
Video 1.5.1: Debate" This webcast from March 29, 2011, demonstrates how science is always evolving and how debate among nutrition science experts influences policy decisions.Source: Harvard School of Public Health, in collaboration with Reuters.
Nutritional Science Evolution
One of the newest areas in the realm of nutritional science is the scientific discipline of nutritional genetics, also called nutrigenomics. Genes are part of DNA and contain the genetic information that makes up all our traits. Genes are codes for proteins and when they are turned “on” or “off,” they change how the body works. While we know that health is defined as more than just the absence of disease, there are currently very few accurate genetic markers of good health. Rather, there are many more genetic markers for disease. However, science is evolving and nutritional genetics aims to identify what nutrients to eat to “turn on” healthy genes and “turn off” genes that cause disease. Eventually, this field will progress so that a person’s diet can be tailored to their genetics. Thus, your DNA will determine your optimal diet.
www.youtube.com/v/-K7w59tHFMI
Video 1.5.2: Nutrigenomics: A dietitian describes the new scientific discipline of nutrigenomics and its potential impact on diet and health.
Using Science and Technology to Change the Future
As science evolves, so does technology. Both can be used to create a healthy diet, optimize health, and prevent disease. Picture yourself not too far into the future: you are wearing a small “dietary watch” that painlessly samples your blood, and downloads the information to your cell phone, which has an app that evaluates the nutrient profile of your blood and then recommends a snack or dinner menu to assure you maintain adequate nutrient levels. What else is not far off? How about another app that provides a shopping list that adheres to all dietary guidelines and is emailed to the central server at your local grocer who then delivers the food to your home? The food is then stored in your smart fridge which documents your daily diet at home and delivers your weekly dietary assessment to your home computer. At your computer, you can compare your diet with other diets aimed at weight loss, optimal strength training, reduction in risk for specific diseases or any other health goals you may have. You may also delve into the field of nutritional genetics and download your gene expression profiles to a database that analyzes yours against millions of others.

Figure 1.5.1: The “Smart Fridge". Source: http://www.yankodesign.com/2010/05/28/smart-fridge-is-your-new-recipe-card/ .
Key Takeaways
- The scientific method is an organized process of inquiry used in nutritional science to determine if the food suspect fits the claim.
- The scientific method is part of the overall evidence-based approach to designing nutritional guidelines that are based on facts.
- There are different types of scientific studies—epidemiological studies, randomized clinical interventional trial studies, and laboratory animal and cell studies—which all provide different, complementary lines of evidence.
- It takes time to build scientific evidence that culminates as a commonly accepted conclusion.
- Agreement of experts across multiple scientific disciplines is a necessity for recommending dietary changes to improve health and help to prevent disease.
- Science is always evolving as more and more information is collected.
Discussion Starters
- What are some of the ways in which you think like a scientist and use the scientific method in your everyday life? Any decision-making process uses at least pieces of the scientific method. Think about some of the major decisions you have made in your life and the research you conducted that supported your decision. For example, what computer brand do you own? Where is your money invested? What college do you attend?
- Do you use technology, appliances, and/or apps that help you to optimize your health?
Mathews Journal of Nutrition & Dietetics
Information links.
- Previous Issues
- Volume 2, Issue 1 - 2017
Previous Issues Volume 2, Issue 1 - 2017
Dietary tradition, nutritional theories and science.
Tim H. Tanaka
Director of the Pacific Wellness Institute, Toronto, Canada.
Corresponding Author: Tim H. Tanaka, Director of the Pacific Wellness Institute, Toronto, Canada, Tel: +1 416-929-6958; E-Mail: [email protected]
Received Date: 20 Dec 2016 Accepted Date: 02 Jan 2017 Published Date: 06 Jan 2017
Copyright © 2017 Tanaka HT
Citation: Tanaka HT. (2017). Dietary Tradition, Nutritional Theories and Science. Mathews J Nutr Diet. 2(1): 011.
INTRODUCTION
Since the inception of life, nutrition has dictated the growth and survival of our species. Almost all of the body processes, from meager to vital, have a strong dependence on the diet. The nutritional status serves as an outlook on the past, present, and future of one,s health. The presence of health does not only mean the absence of disease or infirmity, rather, it is a quality of life emphasizing physical, mental and social well-being [1]. In other words, nutrition, both in terms of amount and the kind, serves to act as the cornerstone of optimum health and the cutting edge for disease prevention [2].
How the Theory of Nutrition Has Evolved Over Time Since ancient times, philosophers and researchers have deemed nutrition as one of the fundamental components of life. Therefore, it is no surprise that all the universal medical science concepts included nutrition as one of their integral components. The ancient theory of nutrition dates back to the time of Aristotle and Galen. They considered nutrition as a vital part of health, disease, performance, and healing. The power in each part of the body is believed to be dependent on the blood flowing to that part. The blood is formed by the nutrients absorbed from the consumed foods [3, 4]. This nutrition and human physiology theory in ancient Europe is mirrored by the concepts described in an ancient Chinese medicine text, Huangdi Neijing (Yellow Emperor,s Classic of Medicine) - a Chinese counterpart of the Hippocratic Corpus [5]. According to the Greek, Roman, and Chinese classical literature, the diet should consist largely of cereal grains, legumes, fruits, honey, fish, and milk. Foods like meat, wine, and confectionary should be consumed in moderation [6-8]. It is intriguing how those ancient doctors and philosophers were able to predict a gross dietary map without having a clear understanding of how the human body works. The modern theory of nutrition has taken one step ahead. Starting with a series of discoveries of vitamins and minerals between 1910 and 1930, nutritional science has evolved alongside modern food production methods [9]. Although serious malnourishment problems still exist in parts of the world such as Africa and South East Asia, food distribution improved following WWII in many countries [10, 11]. Prior to the 1940s, nutrition-related diseases resulted primarily from undernourishment i.e., lack of variety, inadequate calories or a combination of both. Increasingly, nutrition and lifestyle related conditions such as obesity, heart disease, diabetes, and metabolic syndrome have become prevalent in many modern cities and countries. Now, foods are not just considered a source of energy for survival, instead it is an experience for instant pleasure and gratification. According to researchers, the modern food industry has learned the weaknesses in our fundamental biology. For instance, the human body has a natural liking for sweetness and fatty foods [12-15]. This weakness has been exploited by the mass production of sweetened beverages and excessively processed food items. Similarly, the human fatty food preference has been fueled by the easy accessibility to fast foods on every block. This convenience for instant gratification has fostered changes in our body composition, an increase of obesity, and deterioration of overall health [16, 17]. Obesity is growing into a global pandemic and is considered one of the most urgent health care issues today [18, 19].
The Way Forward: The Role of Research in Advancement of Nutrition Science
As nutrition is becoming increasingly recognized for its importance as a major modifying factor in human development, disease prevention and disease management, many modern dietary theories and healthy eating guidelines have been proposed. For instance, such diets as high-protein diets, lowcarbohydrate diets, or combined high-protein and low-carbohydrate diets are highly popularized. Based on the diets, or the so called "Atkins diet", the mantra of 'a calorie is a calorie no matter the sources may no longer be applicable [20]. The human body may process different sources of calories differently, so the sources of nutrition matter as well. Some experts also suggest that a diet would be considered optimal if it provided an ideal balance of macro and micro nutrients needed to maintain ideal health [21]. Nutrition research spans the interface between genetics and environmental influences on health. It helps inform medical professionals in setting standards for medical care for specific diseases and stages of life. Laboratory and clinical research is vital for identifying the role of nutrition in the pathogenesis of many of the major 21st century chronic diseases including cardiovascular disease and cancer, as well as neurodegenerative diseases such as Alzheimer's and Parkinson's disease. In future nutrition research, more emphasis is expected to be made on the investigation of the influence of food components on the whole body physiology and health status at the molecular and cellular levels [22]. With the concepts of nutrigenomics, the genome-wide influence of nutrition and the subsequent time-dependent response in transcriptomics, proteomics, and metabolomics are addressed to describe the phenotype of a biological system [23, 24]. On a global level, nutrition research influences public health policy and food production. The emerging nutrition research substantiates the economic sustainability and benefits of traditional dietary practices. Over the past few decades, there has been a significant advancement in the field of nutrition science. While I hope we have a much better understanding of "healthy" and "unhealthy" diets, there are many unequivocal research outcomes and widespread unproven dietary theories. Further studies are needed for more evidence based dietary guidelines and recommendations. Better understanding of the science of nutrition would not only benefit individual health status, but also has the potential for preventing disease and fostering well-being for future generations.
- WHO definition of Health. (1946). In: International Health Conference. New York: World Health Organization.
- Krehl WA. (1983).The role of nutrition in maintaining health and preventing disease. Health values. 7(2): 9-13.
- Boylan M. (2007). Galen: on blood, the pulse, and the arteries. Journal of the history of biology. 40(2): 207-230.
- Guggenheim K. (1981). Nutrition and nutritional diseases. The evolution of concepts. Lexington, Mass: D.C. Heath & Co.
- Needham J and Lu G. (1980). Celestial lancets: a history and rationale of acupuncture and moxa. Cambridge: Cambridge University Press.
- Chen JD and Xu H. (1996). Historical development of Chinese dietary patterns and nutrition from the ancient to the modern society. World review of nutrition and dietetics. 79: 133-153.
- Kleisiaris CF, Sfakianakis C and Papathanasiou IV. (2014). Health care practices in ancient Greece: The Hippocratic ideal. Journal of medical ethics and history of medicine. 7: 6.
- Skiadas PK and Lascaratos JG. (2001). Dietetics in ancient Greek philosophy: Plato's concepts of healthy diet. European journal of clinical nutrition. 55(7): 532-537.
- Rosenfeld L. (1997). Vitamine-vitamin. The early years of discovery. Clinical Chemistry. 43(4): 680-685.
- Semba RD. (2012). The Historical Evolution of Thought Regarding Multiple Micronutrient Nutrition. Journal of Nutrition. 142(1): 143S-156S.
- Muller O and Krawinkel M. (2005). Malnutrition and health in developing countries. CMAJ: Canadian Medical Association journal = journal de l'Association medicale canadienne. 173(3): 279-286.
- Monteiro CA, Gomes FS and Cannon G. (2010). The snack attack. American journal of public health. 100(6): 975-981.
- Drewnowski A, Krahn DD, Demitrack MA, Nairn K, et al. (1992). Taste responses and preferences for sweet high-fat foods: evidence for opioid involvement. Physiology & behaviour. 51(2): 371-379.
- Bellisle F, Drewnowski A, Anderson GH, Westerterp-Plantenga M, et al. (2012). Sweetness, satiation, and satiety. The Journal of nutrition. 142(6): 1149S-1154S.
- Drewnowski A, Mennella JA, Johnson SL and Bellisle F. (2012). Sweetness and food preference. The Journal of nutrition. 142(6): 1142S-1148S.
- Drewnowski A. (2007). The real contribution of added sugars and fats to obesity. Epidemiologic reviews. 29: 160-171.
- Drewnowski A, Aggarwal A, Hurvitz PM, Monsivais P, et al. (2012). Obesity and supermarket access: proximity or price?. American journal of public health. 102(8): e74-80.
- Naser KA, Gruber A, and Thomson GA. (2006). The emerging pandemic of obesity and diabetes: are we doing enough to prevent a disaster. International journal of clinical practice. 60(9): 1093-1097.
- Swinburn BA, Sacks G, Hall KD, McPherson K, et al. (2011). The global obesity pandemic: shaped by global drivers and local environments. Lancet. 378(9793): 804-814.
- Buchholz A and Schoeller D. (2004). Is a calorie a calorie?. American Journal of Clinical Nutrition. 79(5): 8995-9065.
- Anderson A and Bryngelsson S. (2007). Towards a healthy diet: from nutrition recommendations to dietary advice. Scand J Food Nutr. 51(1): 31-40.
- Norheim F, Gjelstad IM, Hjorth M, Vinknes KJ, et al. (2012). Molecular nutrition research: the modern way of performing nutritional science. Nutrients. 4(12): 1898-1944.
- Afman L and Muller M. (2006). Nutrigenomics: from molecular nutrition to prevention of disease. Journal of the American Dietetic Association. 106(4): 569-576.
- Muller M and Kersten S. (2003). Nutrigenomics: goals and strategies. Nature reviews Genetics. 4(4): 315-322.
- Article In Press
- Current Issue
- Editorial Board
- Submit Manuscript
© 2015 Mathews Open Access Journals. All Rights Reserved.
Open Access by Mathews Open Access Journals is licensed under a Creative Commons Attribution 4.0 International License. Based On a Work at Mathewsopenaccess.com
- Open access
- Published: 25 May 2018
Hypothesis and data-driven dietary patterns and colorectal Cancer survival: findings from Newfoundland and Labrador colorectal Cancer cohort
- Ishor Sharma ORCID: orcid.org/0000-0003-3602-0284 1 ,
- Barbara Roebothan 1 ,
- Yun Zhu 1 ,
- Jennifer Woodrow 1 ,
- Patrick S. Parfrey 2 ,
- John R. Mclaughlin 3 &
- Peter Peizhong Wang 1
Nutrition Journal volume 17 , Article number: 55 ( 2018 ) Cite this article
6648 Accesses
18 Citations
Metrics details
Dietary patterns are commonly used in epidemiological research, yet there have been few studies assessing if and how research results may vary across dietary patterns. This study aimed to estimate the risk of mortality/recurrence/metastasis using different dietary patterns and comparison amongst the patterns.
Dietary patterns were identified by Cluster Analysis (CA), Principal Component Analysis (PCA), Alternate Mediterranean Diet score (altMED), Recommended Food Score (RFS) and Dietary Inflammatory Index (DII) scores using a 169-item food frequency questionnaire.
Five hundred thirty-two colorectal cancer patients diagnosed between 1999 and 2003 in Newfoundland were followed-up until 2010. Overall Mortality (OM) and combined Mortality, Recurrence or Metastasis (cMRM) were identified. Comparisons were made with adjusted Cox proportional Hazards Ratios (HRs), correlation coefficients and the distributions of individuals in defined clusters by quartiles of factor and index scores.
One hundred and seventy cases died from all causes and 29 had a cancer recurrence/metastasis during follow-up. Processed meats as classified by PCA (HR 1.82; 95% confidence interval (CI) 1.07–3.09), clusters characterized by meat and dairy products (HR 2.19; 95% CI 1.03–4.67) and total grains, sugar, soft drinks (HR 1.95; 95% CI 1.13–3.37) were associated with a higher risk of cMRM. Poor adherence to AltMED increased the risk of all-cause OM (HR 1.62; 95% CI 1.04–2.56). Prudent vegetable, high sugar pattern, RFS and DII had no significant association with both OM and cMRM.
Estimation of OM and cMRM varied across dietary patterns which is attributed to the differences in the foundation of each pattern.
Peer Review reports
Diet and behavioural factors have crucial roles in the risk and progression of several chronic diseases including colorectal cancer (CRC) [ 1 ]. Epidemiological studies on the role of a single nutrient or food items on disease outcome are often inconclusive, which may be in part due to dietary interactions, multi-collinearity [ 2 , 3 ] and/or inability to detect small effects [ 4 ]. Dietary patterns are advantageous in nutritional epidemiology to explore the combined effects of total diet on health and to some extent, overcome these limitations [ 5 ]. Dietary patterns not only represent total diet or key factors of diet [ 6 ] and the frequency by which foods are habitually consumed, but also reflect an individual’s food preferences modulated by the combination of genetic, cultural, social, health, environmental, behavioural and economic determinants [ 7 ].
Data-driven and hypothesis-driven are two major approaches to identify dietary patterns [ 8 ]. Cluster and factor analysis are outcome independent empirical data-driven techniques used to determine dietary behaviour in the study population, while index/score-based are hypothesis-driven based on adherence to prior recommendations or guidelines [ 9 ].
Briefly, cluster analysis (CA) divides individuals into mutually exclusive, non-overlapping groups based on mean dietary intakes (gm) [ 10 ]. Food intake common to all contributes less to cluster formation. Optimal clusters are formed by the maximum ratio of variance across the cluster to within the cluster. No gradient is formed hence comparison is done with the reference cluster. Factorial analysis, specifically Principal Component Analysis (PCA), an exploratory approach, reduces a large set of correlated variables to smaller sets of non-correlated variables, which captures the majority of dietary variations within the study population. Linear combinations are created and each individual receives a score called factors [ 11 ]. A higher score represents higher adherence to the particular dietary pattern.
Recommended food score (RFS) [ 12 ] and alternate Mediterranean diet score (altMED) [ 13 ] are commonly used index-based dietary patterns for which scoring is based on the adherence to the US dietary guidelines and the Mediterranean diet, respectively. Dietary Inflammatory Index (DII) differs to other index-based scales as it doesn’t directly measure the adherence to the established dietary guidelines; instead, it categorizes an individual’s diet into pro- and anti-inflammatory diet based on their dietary response to six inflammatory biomarkers [ 14 ]. For such indexes, patterns are derived from gradients, which are then compared to reference quartiles.
Dietary patterns are commonly used in epidemiological research. Studies on how outcome estimation may vary across these different patterns are limited and comparing across the patterns are recommended to better understand disease diet association [ 15 ]; however, such studies are limited. This study aimed to use different approaches to identify pre-diagnostic dietary patterns and evaluate and compare their association with the CRC outcome (Overall Mortality (OM) and combined Mortality, Metastasis or Recurrence (cMRM)) using the Newfoundland and Labrador Familial Colorectal Cancer cohort.
Study population
This study used data from the Newfoundland Familial Colorectal Cancer Registry (NFCCR). Five hundred and thirty-two pathologically confirmed (ICD-9 codes: 153.0–153.9, 154.0–154.3, and 154.8 or ICD-10 codes: 18.0–18.9, 19.9, and 20.9) CRC patients diagnosed between 1999 and 2003 and residents of Newfoundland and Labrador, aged 20–75 years, were included in the study. A detailed description of the study population is published elsewhere [ 16 ]. Briefly, CRC cases were followed from the date of diagnosis until April 30th, 2010. Overall Mortality (OM; the time between the dates of diagnosis to end of follow-up, or the date of death from all causes until the end of follow-up) and combined Mortality, Metastasis or Recurrence (cMRM; the time between the dates of diagnosis to the end of follow-up, or date of death, recurrence, or metastasis, whichever came first) were calculated.
Individuals who were lost to follow up, still alive or who did not have a recurrence or metastasis by the end of the follow-up period were censored at the time of the last contact. We conducted follow-up questionnaires with participants and linked records to death certificates, pathology reports, autopsy records, physicians’ notes, and surgical reports. Additional data were obtained from the Dr. H. Bliss Murphy Cancer Care Foundation [ 17 ]; many of the results can be mutually verified.
Data collection tools
Participants completing the consent were asked to complete validated food frequency questionnaire (FFQ) [ 18 ], personal history questionnaire (PHQ) and some further questions pertaining to family history and medical history. Briefly, the PHQ consisted of 74 questions including the history of bowel screening, medical conditions, use of medications, physical activity, intake of alcohol, tobacco use, socio-demographic information, and reproductive factors for females. Similarly, dietary intake data were collected using a 169-item FFQ retrospectively a year before the diagnosis. For each food item, subjects were asked the frequency of food consumption (daily, weekly, monthly and never scales). Nutrient content was calculated using the Canadian Nutrient File, 2005.
MSI (Microsatellite instability) and BRAF have been associated with cancer prognosis and survival [ 19 , 20 ]. P V600E BRAF mutation and MSI for the tumour DNA have been determined in a previous study using standard protocol [ 21 ]. MSI status was defined as MS high if 30% or more of marker were unstable and MS-stable/MS-low if less than 30% showed instability [ 22 ].
Identifying dietary patterns
For CA, 169 food items were classified into 39 different food groups depending on the ways they are taken and nutrient profile. Food groupings are attached in the Additional file 1 : Table S1. Clusters were identified by using K-means non-hierarchical method, an iterative technique which groups data into k clusters in such a way as to maximize the R2 (R2 = 1 − W/T), where W is the sum of squared Euclidean distances between each data point and its within-cluster mean, and T is the sum of squared distances between each data point and the overall mean. FASTCLUS procedure in SAS was applied. Clusters with less than five participants were temporarily removed while forming the stable cluster. A detailed description of cluster formation can be found elsewhere [ 23 ]. Overall, four stable clusters were identified. Characteristics of clusters are given in Additional file 1 : Table S2.
Three patterns were identified using the PCA correlation matrix as the variables were on different scales. Briefly, exploratory principal component factor analysis was conducted using the same 39 predefined food groups. A varimax rotation (orthogonal) was applied to identify uncorrelated food groups. Factor Eigen-value greater than 1.15, the scree plot and proportion of variance explained were used to identify the number of factors. Patterns were labelled based on factor loading ≥0.5. The factor score of each participant was obtained by summing the intake of each food group multiplied by optimal weights and divided into quartiles. A higher factor score represents greater adherence to that particular dietary pattern. Factor loading and explained variances for three major dietary patterns are shown in Additional file 1 : Table S3.
The RFS method developed by Kent, et al. [ 12 ] is based on fruits, vegetables, whole grains, lean meats or meat alternatives, and low-fat dairy products. Each individual is given 1 point for each recommended food consumed at least weekly. Based on the FFQ, the maximum score is 47. Total RFS score varies with the number of food items in the FFQ [ 24 ]. A higher score represents better adherence to RFS. Details are attached in Additional file 1 : Table S4.
The altMED score is based on the Mediterranean diet scale [ 25 ]; scoring is based on 9 food groups. If the intake (servings/day) of a particular food group is greater than the median, then it is scored one (versus zero). For red and processed meat, reverse scoring is done. For alcohol, if intake is between 5 and 25 g/d, then it is scored as 1 (versus zero). The maximum altMED score is 9 with a higher score representing better adherence to the altMED diet. Details of the food groups are attached in Additional file 1 : Table S5.
Detailed descriptions of the DII score are provided elsewhere [ 14 , 26 ]. Briefly, a total of 29 nutrient parameters were scored based on their inflammatory response to six inflammatory biomarkers; IL-1β, IL-4, IL-6, IL-10, CRP and tumour necrosis factor (TNF-α). These included carbohydrate, protein, total fat, alcohol, onion, tea, tea (Herbal), pepper, β-carotene, Vitamin B-6, Vitamin B-12, caffeine, cholesterol, energy, fibre, folic acid, iron, Monounsaturated Fatty Acid (MUFA), Polyunsaturated Fatty Acid (PUFA), niacin, magnesium, riboflavin, saturated fatty acid, selenium, thiamine, Vitamin-E, Vitamin-D, vitamin C and zinc. Total DII score obtained is divided into quartiles; higher quartiles represents individuals having diets that are more inflammatory.
Statistical analysis
Adjusted hazards ratios were estimated using Cox proportional hazard analysis using SAS version 9.4 (SAS Institute, Inc. Cary). Comparisons across patterns were made with adjusted HRs, correlation coefficients and distributions of individuals in clusters by quartile of factor and index scores. Potential confounding factors include age; sex; body mass index (BMI) (classified as < 25, 25–29.99, ≥30 kg/m2); physical activity as measured by the Global Physical Activity Questionnaire (GPAQ) [ 27 ]; Metabolic equivalent hours/week (METs/Week, calculated and classified as < 10, 10–50, ≥50); and medical history including cholesterol level; triglycerides; family history of CRC; polyps; diabetes; history of screening; smoking (classified: Yes and No; Yes means smoke at least 1 cigarette/day for 3 months or more); alcohol drinking (classified: standard drink/week; not at all, < 15 and ≥ 15); and regular medication including non-steroidal anti-inflammatory drugs (NSAID), stage and grade of cancer, and reported hormone replacement therapy (HRT, females only). Energy adjustment was completed using the residual method wherever applicable.
The basis for assessing potential confounding factors included: existing evidence, biological plausibility, whether the regression coefficient of the primary variable of interest changed by 10% or more after addition of the potentially confounding variable for every covariate entered in the model at P < 0.10. Potential confounders were first selected based on the previous studies as well as a literature search. Initially, potential confounders were screened by the univariate test. Those variables that were statistically non-significant in the univariate test but have an important role in the etiology were included in the model selection step as default; those variables included marital status, the location of a tumor, smoking status, physical activity and reported chemotherapy. As there were too many variables, a stepwise procedure was employed in order to include potential confounding variables that have a detectable effect on the association of interest while retaining the above-mentioned variables in the model.
Characteristics of the study population
Mean age of participants and mean age at diagnosis was 62.53 ± 9.06 years and 60.42 ± 9.02 years, respectively. A total of 170 cases died from all causes and 29 had a cancer recurrence or metastasis at the end of the follow-up. Mean time between the date of diagnosis to the end of follow up or date of death from all causes (OM) was 6.27±1.98 years and mean time between the date of diagnosis to the end of follow up or the date of death, recurrence, or metastasis (CMRM) (whichever came first) was 5.70±2.38 years). Almost 68% of the participants were censored for OM and 62.6% for cMRM during analysis.
Table 1 presents the characteristics of the study population with the log-rank test. In the univariate test, there is the significant difference in the OM across the age groups, gender, diagnosis stage and microsatellite instability status. The family history of CRC, reported screening status, history of co-morbidity including diabetes, higher blood cholesterol level, a location of a tumour, smoking status, physical activity and reported chemotherapy had no significant association with the survival.
Dietary patterns and survival outcome estimation
Table 2 shows the estimated adjusted hazards ratio corresponding to different dietary patterns with 95% confidence interval. Risk of mortality, recurrence and metastasises varied with the dietary pattern. Four different clusters were identified. When compared with the reference cluster characterized by higher intake of fruits, vegetables, whole grains and wine (Cluster I), the cluster characterized by high intake of meat and dairy products (Cluster II) had a higher risk of cMRM (HR 2.19, 95% 1.03–4.67). The cluster characterized by higher intake of refined grains, sugar/soft drinks (Cluster III) had a higher risk of both cMRM (HR 1.95, 95% 1.13–3.37) and OM (HR 2.05, 95% 1.18–3.57) outcomes. The cluster characterized by the many food groups (Cluster IV) had no significant relation with both OM and cMRM; this cluster was based on many foods as no specific distinguishing or dominating food item could be identified.
Three dietary patterns were identified using PCA: processed meat pattern, prudent vegetable pattern and high sugar pattern. Though the overall trend was not significant ( p = 0.09), the highest quartile of processed meat pattern significantly increases the risk of cMRM (HR 1.82, 95% CI 1.07–3.09), however, there was no significant association with OM. Neither the prudent vegetable pattern nor the high sugar pattern showed a significant association with both cMRM and OM.
While using index-based patterns, DII and RFS showed no significant association with either OM or cMRM outcomes. The lowest quartile of the altMED score was significantly associated with the higher risk of OM (HR 1.62, 95% 1.04–2.56) but had no significant association with the cMRM.
Comparison amongst the dietary patterns
Spearman’s correlation coefficients amongst the index-based scores are described in Table 3 . Correlations were high and significant because of the similarity in the food items in scoring. A significant positive correlation was observed between RFS and the altMED score (0.60; p = 0.001). Significant negative correlations were found between the DII score and the altMED (− 0.601; p = 0.001) and RFS (− 0.602; p = 0.001) scores.
Table 4 examines the percentage of individuals in the highest quartile of factor and index score in different clusters describing some level of similarity in the foundation of scale. Almost 92% of individuals from the processed meat pattern were in Cluster II characterized by meat and dairy products. Approximately 59% of individuals from the highest quartile of the prudent vegetable pattern were in Cluster I characterized by fruits and vegetables, whole grain, fish and wine. Around 35% of individuals in the highest quartile of high sugar pattern were in the many foods group. In all three index-based patterns, the lowest quartile of DII and highest quartile of altMED and RFS showed the higher proportion of individuals from Cluster I characterized by fruits and vegetables, whole grain, fish and wine (64.97, 36.31 and 57.32% respectively).
This study is a prospective analysis of mortality among CRC patients diagnosed between 1999 and 2003 from a Canadian population. Both data-driven and hypothesis-driven dietary patterns were determined and relation with CRC patient’s mortality, recurrence and metastasises was estimated. The hypothesis-driven pattern showed how study population is adherent to dietary recommendation while data-driven pattern explains how whole population dietary practice can be classified into different categories. As each dietary pattern was designed to answer the different question, the discrepancy in the outcome estimation was expected despite some level of similarity in the foundation of dietary patterns.
In the current study as identified by CA, the meat and dairy product cluster was associated with increased risk of cMRM while the refined grains, sugar, soft drinks cluster was associated with increased risk of both cMRM and OM. A processed meat pattern as identified by PCA was associated with an increased risk of cMRM. Low adherence to the Mediterranean diet was associated with increased OM. RFS and DII had no significant association with the survival outcomes. The magnitude of estimated HR also varied accordingly.
Epidemiological studies reveal inconsistent results while assessing the relation between dietary patterns and disease outcome in the same population, which is in line with the current study. The study by Reedy J; et al. [ 15 ] showed that among male dietary patterns and clusters characterized by fruits, vegetables, lower fats foods, adherence to RFS and MED diet were associated with reduced risk of CRC. Among females, results were inconsistent: meat and potatoes pattern was associated with increased risk and neither MED nor RFS had a significant association.
In the Nurse’s Health study [ 28 ] index-based score, AHEI (Alternate Healthy Eating Index) was associated with the lower levels of free oestradiol while no association was found with the patterns identified by factor analysis. In the Health Professionals Follow-up Study cohort, the risk of incident fatal or nonfatal myocardial infarction and stroke (CVD) in the highest quintile of the HEI, alternate HEI, and RFS, respectively, were 28, 39, and 23% lower [ 29 ] than the reference quartile, while the highest quintile of a prudent diet score from factor analysis was 30% [ 30 ]. While estimating the survival outcome using different dietary pattern, a prospective Danish observational study [ 31 ] showed that a prudent diet pattern obtained by PCA was associated with reduced mortality but index-based patterns had no significant association. In the SENECA study, the index based scales including Mediterranean Diet Score (MDS), the Mediterranean Adequacy Index (MDI) and the Healthy Diet Indicator (HDI) showed an inverse association with all-cause mortality [ 32 ].
The current study suggested good evidence of comparability between PCA and CA in identifying the dietary pattern as seen in other studies [ 33 , 34 ] despite their different approach. Almost two-thirds of individuals in the fruit and vegetable cluster (Cluster I) were from the highest quartile of the prudent vegetable pattern identified by PCA having highest loading (> 0.50) for fruits, vegetables, greens, tomatoes and minimal loadings (< 0.15) for processed meat, red meat and refined foods. More than 90% of individuals in Cluster II, characterized by meat and dairy products, were from the highest quartile of the processed meat pattern identified by PCA having higher loading (> 0.5) for red meat, cured processed meat. Similar was the case with other clusters. Despite good evidence of comparability, they are not defined by the same foods, which is likely to be the reason for differential disease outcome estimates.
The hypothesis-driven dietary patterns give higher weight for fruits and vegetables, which is evident by having the majority of individuals in the lowest quartile of DII and the highest quartile of altMED and RFS in Cluster I, characterized by fruits and vegetables. Correlations between index scores were relatively strong and statistically significant as scores were based on similar food recommendations. An increasing score of altMED, RFS and a decrease in DII score are characterized by the higher amount of plant-based food [ 35 ].
Indexing systems vary in the definition of optimal diet quality and in their scoring which leads difference in their sensitivity to estimate the disease outcome. Differential classification of food leads to differential exposure. RFS accounts for intake of vegetables, fruits, healthy protein sources, grains and dairy products but does not differentiate between different types of fatty acids or penalize for consumption of foods that are not recommended. Alcohol, energy dense food items and meat products are associated with survival outcomes as seen from empirical approaches but are not considered in scoring. Hence, RFS is likely to underestimate the true association. Further, in the RFS approach, energy cannot be adjusted so the effect of body size, physical activity and higher basal metabolic rate cannot be taken into account for the analysis [ 36 ]. Energy adjustment may also help to reduce measurement error [ 37 ]. AltMED scoring is based on high consumption of fruits, vegetables, non-refined bread and cereals, legumes and nuts, and moderate consumption of fish, poultry and alcohol. High intake of red and processed meat and saturated fat is penalized during scoring [ 25 ]. DII score is based on the inflammatory potential of nutrient/food items in response to the six inflammatory biomarkers. DII is relevant among those diseases associated with chronic inflammation [ 14 ]. DII is not only limited to micro and macronutrients but also incorporates commonly used bioactive compounds including flavonoids, spices and tea. Since the current study was based on pre-diagnostic dietary pattern, dietary-induced inflammation may not have a significant role in the risk of mortality.
Multiple reasons could be suggested for the inconsistent results. First, several studies have suggested dietary guidelines have been more strongly related to coronary heart disease than to cancer mortality, even though guidelines are directed toward lowering cancer risk [ 38 ]. More extensive studies are done on diet-cardiovascular disease than cancer, and the role of dietary components in cancer causation is still unclear in many instances [ 29 ]. Second, dietary guidelines are more effective for cancer incidence than the survival (and therefore mortality) due to the other clinic-pathological factors in determining the cancer survival [ 38 ]. Third, the inconsistency might also be due to missing some important components, and some components in the scales may not have a significant association with the cancer risk and survival [ 29 ]. Also, our approximation of the three scales varied slightly than the original scale. Original RFS had 23 items and was developed for the all-cause mortality rather than cancer-specific mortality [ 12 ]. Likewise, altMED score was developed to assess the variations in the biomarkers level [ 39 ] and DII index was based on 45 different food parameters whilst the current study had only 28 parameters [ 14 ].
Each method has its own strengths and limitations [ 6 ]. Empirical methods are an initial approach and identify dietary patterns as they exist in the population [ 40 ] and form the basis for index-based patterns, but suffer certain limitations: (a) They are based on eating behaviour rather than the biological plausibility hence the diet pattern may not exactly reflect disease causation theory [ 40 ]; (b) Even though an association is detected, it may not represent beneficial or detrimental eating patterns [ 41 ]; (c) Lacks limited reproducibility across the studies [ 4 ]; and (d) Includes several arbitrary decisions including consolidation of food items into food groups, number of factors/clusters, method of rotations and labelling of the patterns/clusters [ 42 ]. Index-based patterns are based on adherence to the recommendation or guidelines and the foundation of each scale varies. Index-based patterns are generally considered better at estimating the disease outcome as compared to empirical patterns due to their inclusion of relevant and evidence-based components [ 43 ]. Results tend to be reproducible across studies. They are limited, however, in that they do not capture a full range of diets in scoring [ 40 ] and are difficult to use when scores do not vary considerably within the population [ 6 ] and results vary with the cut-offs defined.
Strengths and limitations of study
This is a prospective follow-up study. Detailed data for the variables (age; sex; marital status; Body Mass Index; screening history; use of medications; co-morbidity status; history of CRC; smoking; physical activity; dietary patterns; alcohol intake; stage and location of tumor; chemotherapy status; etc.) are available including the genetic data on MSI status. Multiple dietary patterns are used for comparison.
This study has a number of limitations. First, the sample is relatively small, which may not offer desirable statistical power and precision in multivariate analysis. Further, cases were followed until 2010 only. Recall error and possible bias are likely to exist as the cases were asked to remember their dietary patterns a year prior to their diagnosis. However, we believe the recall bias, if any, could be non-differential, which is likely to attenuate the observed association. Although bias may exist and sample size is less, it may have little impact on cross-comparison, which is the primary focus of the study. Some cases might have changed their dietary patterns, lifestyle and behaviour after diagnosis or even in the disease induction/latent period; this may lead to possible reverse causation bias, which should be explored in future studies.
Conclusions
The present study showed that the estimation of OM and cMRM amongst the CRC patients varied with the type of diet pattern used. Hazards ratios for cMRM varied from 1.82; 95% (CI- 1.07-3.09) for processed meat pattern identified by PCA to HR 2.19; 95% CI 1.03–4.67 for cluster characterized by meat and dairy products and HR 1.95; 95% CI 1.13–3.37 for cluster characterized by refined grains, sugar, soft drinks. Only cluster characterized by refined grains, sugar, soft drinks had higher risk of OM (HR 2.05; 95% CI 1.18–3.57). All the diet indices showed similar null associations with both cMRM and OM except Poor adherence to altMED increased the risk of all-cause OM (HR 1.62; 95% CI 1.04–2.56). On the average estimates were higher for data driven methods than hypothesis driven. The variations in the estimated hazards ratios is attributed to the foundation of each dietary pattern identified by various approaches.
Abbreviations
Alternative Mediterranean diet
Body mass index
- Cluster analysis
Confidence interval
Combined mortality, recurrence and metastasis
Colorectal cancer
Dietary inflammatory index
Food frequency questionnaire
Family history questionnaire
Hormone replacement therapy
Monounsaturated fatty acid
Newfoundland familial colorectal cancer registry
Newfoundland and Labrador
Non-steroidal anti-inflammatory drug
Overall mortality
Odds ratios
Principal Component analysis
Personal history questionnaire
Polyunsaturated fatty acid
Recommended food score
World Cancer Research Fund/American Institute for Cancer Research: Chapter 7. Cancers. In food, nutrition, physical activity and the prevention of Cancer: a global perspective. Washington DC: AICR; 2007.
Google Scholar
Shivappa N, Zucchetto A, Montella M, Serraino D, Steck SE, La Vecchia C, Hébert JR. Inflammatory potential of diet and risk of colorectal cancer: a case–control study from Italy. Br J Nutr. 2015;114(01):152–8.
Article PubMed CAS Google Scholar
Galas A, Kulig J. Low-grade dietary-related inflammation and survival after colorectal cancer surgery. J Cancer Res Clin Oncol. 2014;140(9):1517–25.
Article PubMed PubMed Central CAS Google Scholar
Miller PE, Lazarus P, Lesko SM, Muscat JE, Harper G, Cross AJ, Sinha R, Ryczak K, Escobar G, Mauger DT. Diet index-based and empirically derived dietary patterns are associated with colorectal cancer risk. J Nutr. 2010;140(7):1267–73.
Committee DGA. Report of the dietary guidelines advisory committee on the dietary guidelines for Americans, 2010, to the secretary of agriculture and the secretary of health and human services. Agric Res Serv. 2010;
Moeller SM, Reedy J, Millen AE, Dixon LB, Newby P, Tucker KL, Krebs-Smith SM, Guenther PM. Dietary patterns: challenges and opportunities in dietary patterns research: an experimental biology workshop, April 1, 2006. J Am Diet Assoc. 2007;107(7):1233–9.
Article PubMed Google Scholar
van den Bree MB, Eaves LJ, Dwyer JT. Genetic and environmental influences on eating patterns of twins aged≥ 50 y. Am J Clin Nutr. 1999;70(4):456–65.
Previdelli ÁN, de Andrade SC, Fisberg RM, Marchioni DM. Using two different approaches to assess dietary patterns: hypothesis-driven and data-driven analysis. Nutrients. 2016;8(10):593.
Article PubMed Central Google Scholar
Nettleton JA, Schulze MB, Jiang R, Jenny NS, Burke GL, Jacobs DR. A priori–defined dietary patterns and markers of cardiovascular disease risk in the multi-ethnic study of atherosclerosis (MESA). Am J Clin Nutr. 2008;88(1):185–94.
Quatromoni P, Copenhafer D, Demissie S, D'agostino R, O'horo C, Nam B, Millen B. The internal validity of a dietary pattern analysis. The Framingham nutrition studies. J Epidemiol Community Health. 2002;56(5):381–8.
Kleinbaum D, Kupper L, Muller K. Variable reduction and factor analysis. Applied regression analysis and other multivariable methods. 1988;24:605.
Kant AK, Schatzkin A, Graubard BI, Schairer C. A prospective study of diet quality and mortality in women. JAMA. 2000;283(16):2109–15.
Trichopoulou A, Costacou T, Bamia C, Trichopoulos D. Adherence to a Mediterranean diet and survival in a Greek population. N Engl J Med. 2003;348(26):2599–608.
Shivappa N, Steck SE, Hurley TG, Hussey JR, Hébert JR. Designing and developing a literature-derived, population-based dietary inflammatory index. Public Health Nutr. 2014;17(08):1689–96.
Reedy J, Wirfält E, Flood A, Mitrou PN, Krebs-Smith SM, Kipnis V, Midthune D, Leitzmann M, Hollenbeck A, Schatzkin A. Comparing 3 dietary pattern methods—cluster analysis, factor analysis, and index analysis—with colorectal cancer risk the NIH–AARP diet and health study. Am J Epidemiol. 2010;171(4):479–87.
Sun Z, Liu L, Wang PP, Roebothan B, Zhao J, Dicks E, Cotterchio M, Buehler S, Campbell PT, Mclaughlin JR. Association of total energy intake and macronutrient consumption with colorectal cancer risk: results from a large population-based case-control study in Newfoundland and Labrador and Ontario, Canada. Nutr J. 2012;11(1):18.
Lee H, Song M, Shin N, Shin CH, Min BS, Kim HS, Yoo JS, Kim H. Diagnostic significance of serum HMGB1 in colorectal carcinomas. PLoS One. 2012;7(4):e34318.
Liu L, Wang PP, Roebothan B, Ryan A, Tucker CS, Colbourne J, Baker N, Cotterchio M, Yi Y, Sun G. Assessing the validity of a self-administered food-frequency questionnaire (FFQ) in the adult population of Newfoundland and Labrador, Canada. Nutr J. 2013;12(1):49.
Guastadisegni C, Colafranceschi M, Ottini L, Dogliotti E. Microsatellite instability as a marker of prognosis and response to therapy: a meta-analysis of colorectal cancer survival data. Eur J Cancer. 2010;46(15):2788–98.
Shaukat A, Arain M, Thaygarajan B, Bond JH, Sawhney M. Is BRAF mutation associated with interval colorectal cancers? Dig Dis Sci. 2010;55(8):2352–6.
Raptis S, Mrkonjic M, Green RC, Pethe VV, Monga N, Chan YM, Daftary D, Dicks E, Younghusband BH, Parfrey PS. MLH1–93G> a promoter polymorphism and the risk of microsatellite-unstable colorectal cancer. J Natl Cancer Inst. 2007;99(6):463–74.
Phipps AI, Baron J, Newcomb PA. Prediagnostic smoking history, alcohol consumption, and colorectal cancer survival. Cancer. 2011;117(21):4948–57.
Article PubMed PubMed Central Google Scholar
SAS Institute Inc. SAS/STAT® 93 User’s Guide. Cary: SAS Institute Inc.; 2011. pp. 2241–2266.
Reedy J, Mitrou P, Krebs-Smith S, Wirfalt E, Flood A, Kipnis V, Leitzmann M, Mouw T, Hollenbeck A, Schatzkin A, Subar AF. Index-based dietary patterns and risk of colorectal cancer: the NIH-AARP Diet and Health Study. Am J Epidemiol. 2008;168:38–48.
Trichopoulou A, Kouris-Blazos A, Wahlqvist ML, Gnardellis C, Lagiou P, Polychronopoulos E, Vassilakou T, Lipworth L, Trichopoulos D. Diet and overall survival in elderly people. BMJ. 1995;311(7018):1457–60.
Sharma I, Wang PP, Zhu Y, Woodrow JR, Mulay S, Parfrey PS, Mclaughlin JR, Hebert JR, Shivappa N, Li Y. Inflammatory diet and risk of colorectal cancer: a population based case-control study in Newfoundland, Canada. Nutrition. 2017;42:69–74.
Craig CL, Marshall AL, Sjorstrom M, Bauman AE, Booth ML, Ainsworth BE, Pratt M, Ekelund U, Yngve A, Sallis JF. International physical activity questionnaire: 12-country reliability and validity. Med Sci Sports Exerc. 2003;35(8):1381–95.
Fung TT, Willett WC, Stampfer MJ, Manson JE, Hu FB. Dietary patterns and the risk of coronary heart disease in women. Arch Intern Med. 2001;161(15):1857–62.
McCullough ML, Feskanich D, Rimm EB, Giovannucci EL, Ascherio A, Variyam JN, Spiegelman D, Stampfer MJ, Willett WC. Adherence to the dietary guidelines for Americans and risk of major chronic disease in men. Am J Clin Nutr. 2000;72(5):1223–31.
Menotti A, Kromhout D, Blackburn H, Fidanza F, Buzina R, Nissinen A. Food intake patterns and 25-year mortality from coronary heart disease: cross-cultural correlations in the seven countries study. Eur J Epidemiol. 1999;15(6):507–15.
Osler M, Heitmann BL, Gerdes LU, Jørgensen LM, Schroll M. Dietary patterns and mortality in Danish men and women: a prospective observational study. Br J Nutr. 2001;85(02):219–25.
Knoops K, Fidanza F, Alberti-Fidanza A, Kromhout D, Van Staveren W. Comparison of three different dietary scores in relation to 10-year mortality in elderly European subjects: the HALE project. Eur J Clin Nutr. 2006;60(6):746–55.
Hearty ÁP, Gibney MJ. Comparison of cluster and principal component analysis techniques to derive dietary patterns in Irish adults. Br J Nutr. 2008;101(4):598–608.
PubMed Google Scholar
Smith AD, Emmett P, Newby P, Northstone K. A comparison of dietary patterns derived by cluster and principal components analysis in a UK cohort of children. Eur J Clin Nutr. 2011;65(10):1102–9.
Steck SE, Guinter M, Zheng J, Thomson CA. Index-based dietary patterns and colorectal cancer risk: a systematic review. Adv Nutr: An Int Rev J. 2015;6(6):763–73.
Article CAS Google Scholar
Willett W, Stampfer MJ. Total energy intake: implications for epidemiologic analyses. Am J Epidemiol. 1986;124(1):17–27.
Kipnis V, Subar AF, Midthune D, Freedman LS, Ballard-Barbash R, Troiano RP, Bingham S, Schoeller DA, Schatzkin A, Carroll RJ. Structure of dietary measurement error: results of the OPEN biomarker study. Am J Epidemiol. 2003;158(1):14–21.
Cerhan J, Potter J, Gilmore J, Janney C, Kushi L, Lazovich D, Anderson K, Sellers T, Folsom A. Adherence to AICR cancer prevention guidelines and subsequent morbidity and mortality in the Iowa women's health study cohort. In: CANCER EPIDEMIOLOGY BIOMARKERS & PREVENTION: 2001: AMER ASSOC cancer research PO box 11806, BIRMINGHAM, al 35202 USA; 2001. p. 158.
Fung TT, McCullough ML, Newby P, Manson JE, Meigs JB, Rifai N, Willett WC, Hu FB. Diet-quality scores and plasma concentrations of markers of inflammation and endothelial dysfunction. Am J Clin Nutr. 2005;82(1):163–73.
Hu FB. Dietary pattern analysis: a new direction in nutritional epidemiology. Curr Opin Lipidol. 2002;13(1):3–9.
Fung TT, Brown LS. Dietary patterns and the risk of colorectal cancer. Curr Nutr Rep. 2013;2(1):48–55.
Martinez ME, Marshall JR, Sechrest L. The arbitrary nature of the factor analytical process. Am J Epidemiol. 1998;148(1):17–9.
Schulze MB, Hoffmann K, Kroke A, Boeing H. Risk of hypertension among women in the EPIC-Potsdam study: comparison of relative risk estimates for exploratory and hypothesis-oriented dietary patterns. Am J Epidemiol. 2003;158(4):365–73.
Download references
Acknowledgments
We are thankful to Dr. Meera Jain and all those who contributed to data collection and management for the Newfoundland and Labrador Familial Colorectal Cancer Study.
Financial support
The initial phase of data collection and management was supported by the Canadian Institutes of Health Research Team Grant [CIHR-CPT79845] and Canadian Institutes of Health Research Team in Interdisciplinary Research on Colorectal Cancer Studentship [205835]. Ishor Sharma was awarded by the Newfoundland and Labrador Healthy Aging Research Program (NL-HARP) and Translational and Personalized Medicine Initiative (TPMI, NL SUPPORT).
Author information
Authors and affiliations.
Division of Community Health and Humanities, Faculty of Medicine, Memorial University of Newfoundland, St. John’s, NF, Canada
Ishor Sharma, Barbara Roebothan, Yun Zhu, Jennifer Woodrow & Peter Peizhong Wang
Clinical Epidemiology Unit, Faculty of Medicine, Memorial University of Newfoundland, St. John’s, NF, Canada
Patrick S. Parfrey
Public Health Ontario, Toronto, ON, Canada
John R. Mclaughlin
You can also search for this author in PubMed Google Scholar
Contributions
PPW and IS conceived and designed this study. IS analysed the data and drafted the manuscript. PPW, BR, YZ, JW, PSP and JRM revised the manuscript. All authors read and approved the final manuscript.
Corresponding author
Correspondence to Peter Peizhong Wang .
Ethics declarations
Ethics approval and consent to participate.
This study is a part of the larger project approved by the HREB (Health Ethics Review Board) of Memorial University of Newfoundland, Canada. All patients included in this study signed informed consent forms, and data collection followed Declaration of Helsinki guidelines.
Competing interests
The authors declare that they have no competing interests.
Publisher’s Note
Springer Nature remains neutral with regard to jurisdictional claims in published maps and institutional affiliations.
Additional file
Additional file 1:.
Table S1. Food groupings. Table S2. Characteristics of Cluster. Table S3. . Factor loading and explained variances (VAR) for the three major dietary patterns identified from food frequency questionnaire at baseline using the principal component factor analysis, Newfoundland. Table S4. Recommended food Score. Table S5. Alternate Mediterranean Diet Score. (DOCX 23 kb)
Rights and permissions
Open Access This article is distributed under the terms of the Creative Commons Attribution 4.0 International License ( http://creativecommons.org/licenses/by/4.0/ ), which permits unrestricted use, distribution, and reproduction in any medium, provided you give appropriate credit to the original author(s) and the source, provide a link to the Creative Commons license, and indicate if changes were made. The Creative Commons Public Domain Dedication waiver ( http://creativecommons.org/publicdomain/zero/1.0/ ) applies to the data made available in this article, unless otherwise stated.
Reprints and permissions
About this article
Cite this article.
Sharma, I., Roebothan, B., Zhu, Y. et al. Hypothesis and data-driven dietary patterns and colorectal Cancer survival: findings from Newfoundland and Labrador colorectal Cancer cohort. Nutr J 17 , 55 (2018). https://doi.org/10.1186/s12937-018-0362-x
Download citation
Received : 27 November 2017
Accepted : 08 May 2018
Published : 25 May 2018
DOI : https://doi.org/10.1186/s12937-018-0362-x
Share this article
Anyone you share the following link with will be able to read this content:
Sorry, a shareable link is not currently available for this article.
Provided by the Springer Nature SharedIt content-sharing initiative
- Colorectal Cancer
- Dietary patterns
- Factor analysis
- Index analysis
Nutrition Journal
ISSN: 1475-2891
- General enquiries: [email protected]

An official website of the United States government
The .gov means it’s official. Federal government websites often end in .gov or .mil. Before sharing sensitive information, make sure you’re on a federal government site.
The site is secure. The https:// ensures that you are connecting to the official website and that any information you provide is encrypted and transmitted securely.
- Publications
- Account settings
Preview improvements coming to the PMC website in October 2024. Learn More or Try it out now .
- Advanced Search
- Journal List
- Environ Health Perspect
- v.117(12); 2009 Dec
Hypothesis: a Unifying Mechanism for Nutrition and Chemicals as Lifelong Modulators of DNA Hypomethylation
Duk-hee lee.
1 Department of Preventive Medicine and Health Promotion Research Center, School of Medicine, Kyungpook National University, Daegu, Korea
David R. Jacobs, Jr.
2 Division of Epidemiology, School of Public Health, University of Minnesota, Minneapolis, Minnesota, USA
3 Department of Nutrition, University of Oslo, Oslo, Norway
Miquel Porta
4 Institut Municipal d’Investigació Mèdica, and School of Medicine, Universitat Autònoma de Barcelona, Barcelona, Spain
Although both nutrition and chemicals are important environmental factors modulating epigenetic changes, they are commonly studied separately by researchers in different fields. However, these two environmental factors cannot be separated from each other in the real world because a number of chemical agents contaminate food chains.
We propose a unifying mechanism that can link epigenetic alterations in relation to DNA hypomethylation due to chemical agents and to nutrient deficiency or imbalance, emphasizing the importance of an integrative approach in the field of environmental epidemiology.
Methyl groups from S -adenosylmethionine (SAM) are needed for DNA methylation. Diets low in sources of methyl groups can lead to global DNA hypomethylation by impairing synthesis of SAM. However, even without nutritional deficiency, enhanced need to synthesize glutathi-one (GSH) can impair synthesis of SAM and perturb DNA methylation, because the methylation cycle and the GSH synthesis pathways are biochemically linked. Exposure to environmental chemicals is a common situation in which the need for GSH synthesis is enhanced, because GSH is consumed to conjugate diverse chemicals. Given that GSH conjugation happens at any chemical dose, this hypothesis is relevant even at exposures below the high doses that cause toxicologic responses.
At present, general populations are exposed to a large number of chemicals, each at a very low dose. Thus, DNA hypomethylation due to chemical exposure may be common in modern societies and can synergistically interact with nutrition-induced DNA hypomethylation.
Epigenetics is the study of meiotically and mitotically induced heritable changes in gene expression through DNA methylation, histone modifications, or microRNA change without actual modification in the genomic DNA sequence ( Feinberg 2007 ; Ozanne and Constancia 2007 ). Because gene expression is influenced by various environmental factors, epigenetics can serve as an interface between the inherited static genome and the dynamic environment ( Feinberg 2007 ; Ozanne and Constancia 2007 ), presenting immense challenges to environmental epidemiology ( Porta 2008 ).
Whereas epigenetic dysregulation is increasingly implicated in cancer, the role of epigenetics in other complex chronic diseases, such as cardiovascular disease, type 2 diabetes, and obesity, remains largely uncharacterized. So far, research efforts on causes of epigenetic changes have focused on nutrition during pregnancy as primary influences of epigenetic patterns in childhood and adulthood ( Mathers 2007 ). In particular, applying the theory of the fetal origin of adult diseases, low birth weight due to undernutrition is hypothesized to explain in part the currently ongoing epidemics of metabolic syndrome and type 2 diabetes—for example, in developing countries as India or China ( Yajnik 2004 ). Preconceptional exposure to famine during the Dutch Hunger Winter of 1944–1945 was recently shown to be associated with hypomethylation of the insulin-like growth factor 2 (IGF2) gene six decades later ( Heijmans et al. 2008 ). Because IGF2 plays a key role in mammalian growth, influencing cell division and differentiation and possibly metabolic regulation ( O’Dell and Day 1998 ), the study provided empirical support for the hypothesis that undernutrition during pregnancy increases risk of adult-onset diseases through epigenetic modulation of gene expression ( Gluckman et al. 2008 ).
On the other hand, evidence is also emerging that various common environmental chemical agents, including some endocrine disruptors, can affect normal developmental epigenetic processes and hence contribute to increase the risk of chronic disease in adults ( Edwards and Myers 2007 ). Unfortunately, epigenetic changes due to these two important types of environmental factors—nutrition and chemicals—tend to be studied separately by researchers in different fields.
Because numerous chemical agents contaminate food chains, however, these two environmental factors cannot be separated from each other in the real world. Furthermore, these factors can synergistically cause epigenetic changes through a common pathway, as we hypothesize below. Environmental epidemiology is a unique study area that observes freely living human populations and tries to both disentangle and integrate complex etiopathogenic processes that involve very diverse risk factors. It is hence critical for scientific progress to better understand how nutrition and synthetic chemicals can be related.
DNA Hypomethylation through a Unifying Mechanism
Global hypomethylation of the genome largely affects the intergenic and intronic regions of the DNA, particularly repeat sequences and transposable elements, and is believed to result in chromosomal instability and increased mutation events ( Wilson et al. 2007 ). Regardless of tissue type, human cancers have in common both global genomic hypomethylation and focal CpG island hypo- and hypermethylation ( Franco et al. 2007 ). In addition, global hypomethylation is also associated with other diseases such as atherosclerosis ( Zaina et al. 2005 ). Here, we propose a unifying mechanism that can link epigenetic alterations in relation to global or focal DNA hypomethylation due to chemical agents and to nutrient deficiency or imbalance that has little been considered among epidemiologists and other researchers. We do not think that our hypothetical mechanism can explain all epigenetic mechanisms, including focal DNA hypermethylation in specific genes, although chemical exposures and nutrition deficiency or imbalance likely lead to other epigenetic changes through unknown mechanisms.
SAM ( S -adenosylmethionine) is a critical methyl donor for most methyltransferases that modify DNA, RNA, histones, and other proteins ( Loenen 2006 ). Folate, methionine, betaine, choline, and vitamin B 12 are involved in one-carbon metabolism, which includes SAM-substrated methylation ( Mason 2003 ). Thus, diets lacking in substrates or cofactors in one-carbon metabolism can contribute to DNA hypomethylation by impairing synthesis of SAM ( Davis and Uthus 2004 ; Selhub 2002 ). This methylation cycle ( Figure 1 , top) is very well known and frequently cited to explain relations between diet and epigenetic changes. However, even without nutritional deficiency of methyl groups, impaired synthesis of SAM and perturbed DNA methylation can happen when the need for glutathione (GSH) synthesis increases ( Figure 1 , bottom).

A hypothetical unifying mechanism linking DNA hypomethylation due to chemicals and nutrient deficiency or imbalance. Vit, vitamin. DNA methylation pattern can be disturbed because of depletion of GSH when it is chronically consumed for conjugation of chemicals and their metabolites. Under usual circumstances, metabolism of homocysteine contributes to both the methionine and GSH synthesis pathways. In the presence of chemicals such as persistent organic pollutants that deplete GSH, contribution to the methionine pathway may be diminished because of greater need to synthesize GSH (numbered boxes on the right).
Exposure to chemical compounds may be a common situation in which humans need more GSH ( Jones et al. 1995 ). GSH and GSH transferases have evolved as a major chemical protection against reactive xenobiotics and reactive compounds produced during the metabolism of endogenous and exogenous compounds ( Ketterer et al. 1983 ). GSH transferases have broad and overlapping substrate specificities, which allow them to participate in the detoxification of a chemically diverse group of compounds. The most common reactions involve nucleophilic attack by GSH on electrophiles, usually epoxides of aromatic and aliphatic organic compounds ( Coles and Ketterer 1990 ). These substrates have in common a degree of hydrophobicity and possess electrophilic centers ( Coles and Ketterer 1990 ).
Experimental studies have reported that exposure to chemicals increased GSH content by enhancing the uptake of amino acid substrates and the activity of biosynthetic enzymes ( Franco et al. 2007 ; Shi et al. 1994 ) as an adaptive mechanism against short-term exposure to chemicals. Increased need for GSH reduces the availability of homocysteine, which stands at the crossroads between the methylation cycle and the transsulfuration pathway, for use in the methylation cycle. Eventually, by shunting homocysteine into the GSH synthesis pathway, the levels of methionine and SAM would decrease ( Figure 1 ).
If the exposure to chemicals is transient, all these disturbances can quickly return to normal without progression to the levels of GSH depletion. However, when there is prolonged exposure to chemicals, it can eventually progress to the depletion of intracellular GSH through GSH consumption by conjugation ( Franco et al. 2007 ). Many field studies on aquatic organisms living in polluted areas have reported decreased GSH content compared with those of unpolluted areas ( Cossu et al. 1997 ; Otto and Moon 1996 ). Unlike in vitro or animal experiments in which exposure patterns to chemicals are not similar to that of free-living humans in terms of exposure duration or number of chemicals, naturalistic field studies can give information relevant to physiologic response to background exposure to mixed xenobiotic substances.
There is direct experimental evidence that depleting GSH decreases the level of SAM in cells and leads to genomewide DNA hypomethylation ( Lertratanangkoon et al. 1997 ). In experimental studies, the depletion of GSH is commonly induced by direct inhibition of GSH synthesis enzymes or in knockout models ( Akai et al. 2007 ; Wu and Cederbaum 2004 ). However, in general populations living in chemical-contaminated societies, a more common mechanism for GSH depletion may be GSH consumption through conjugation with chemicals or their metabolites.
Once GSH depletion occurs, a vicious cycle may start. As a crucial molecule in anti-oxidant defense of the cell, the depletion of intracellular GSH causes a cascade of events that entails oxidative stress, including production of reactive oxygen/nitrogen species ( Higuchi 2004 ). Oxidative stress can directly suppress the methylation cycle by limiting activity of folate-dependent methionine syn-thase and cobalamine ( Deth et al. 2008 ). In addition, GSH is further consumed to conjugate reactive oxygen/nitrogen species that are generated because of oxidative stress, leading to enhanced GSH depletion.
Background Exposure to Mixtures of Chemicals
Importantly, the theoretical soundness of our hypothesis does not require individual high-dose chemical exposure that is usually required to cause a classic toxicologic response. In fact, in many countries across the world, groups in the general population are exposed to very low doses of each chemical, often below limits currently deemed safe ( Paustenbach and Galbraith 2006 ; Porta et al. 2008 ). However, GSH conjugation may happen at any dose because it is a physiologic response to excrete “foreign bodies.” For a person exposed to a single chemical at a low concentration, GSH consumption is trivial. However, if the exposure is to a large number of chemicals for a long time, GSH use is relevant and depletion can happen because of GSH conjugation.
In our modern societies, hundreds of chemicals are detected in significant subsets of the population, with concentrations of the compounds being highly correlated ( Paustenbach and Galbraith 2006 ). Most such exposure occurs during usual daily life, implying a chronic, lifetime exposure. Thus, alterations in methylation patterns due to background exposure to mixtures of chemical agents are plausible. They may be more serious when nutritional deficiency or imbalance involved in the methylation cycle coexists.
Another important consideration is that global DNA hypomethylation accumulates progressively during aging ( Fraga et al. 2007 ). At present, it is unclear why aging is related to global DNA hypomethylation. However, the GSH depletion could be involved in this association because GSH levels decline in a number of tissues during aging through perturbation of the catalytic efficiency of glutamate-cysteine ligase, the rate-limiting enzyme in GSH synthesis ( Liu et al. 2004 ). At the same time as this perturbation in catalytic efficiency is occurring, the body burden of chemicals with long half-lives tends to increase with aging. Moreover, deficiencies of vitamin B 12 and folate are common in elderly people ( Koehler et al. 1997 ). Thus, chemical exposure, nutrition, and aging can interact with each other synergistically, finally leading to global hypomethylation.
Chemical-induced epigenetic changes can be heritable across generations ( Anway et al. 2005 , 2006 ), raising the possibility that some familial aggregation of chronic diseases may be partly related to chemical exposures in earlier generations. If confirmed in the next few years, such evidence will be a relevant example of a scientific and public health challenge to which environmental epidemiology may contribute by enabling research that effectively integrates reasoning, methods, and evidence from life course, environmental, molecular, and epigenetic epidemiology ( Porta 2008 ).
Persistent Organic Pollutants and Epigenetic Changes
Among chemicals putatively relevant in environmental epigenomics, persistent organic pollutants (POPs) are of particular concern because they bioaccumulate in adipose tissue throughout life ( Abelsohn et al. 2002 ). Humans are typically exposed to a variety of POP mixtures starting in utero , essentially because these chemicals bioaccumulate in food chains and transfer from the mother’s dietary intake through the placenta ( Abelsohn et al. 2002 ).
Another important feature of POPs can also lead to GSH depletion. Lipophilic xenobiotics such as POPs are secreted into the bile from the liver and are reabsorbed from the intestinal lumen into the blood circulation and back to the liver, thus undergoing entero-hepatic circulation ( Jandacek and Tso 2001 ). This feature of POPs is one of main reasons for long half-lives of POPs in the human body ( Jandacek and Tso 2001 ). POPs are secreted into the bile conjugated with molecules such as GSH ( Bakke et al. 1990 ). Thus, the continuous recycling of POPs through enterohepatic circulation can lead to chronic depletion of liver GSH. Also, because there are strong correlations between serum concentrations of POPs and age in the general population ( Lee et al. 2006 ), POPs provide examples of chemicals that can synergistically increase the risk of global hypomethylation with aging.
Global DNA hypomethylation was recently associated with high serum concentrations of POPs in apparently healthy Greenlandic Inuit ( Rusiecki et al. 2008 ). The degree of DNA methylation decreased with increasing concentrations of p , p ′-DDT (dichlorodiphenyltrichloroethane), p , p ′-DDE (dichlorodiphenyldichloroethylene), β-hexachlorocyclohexane, oxychlordane, α-chlordane, mirex, the sum of several poly-chlorinated biphenyl congeners, and the sum of all POPs studied. Even though their concentrations of POPs were much higher than those in other general populations, the global DNA hypomethylation mechanism may be involved in associations between background exposure to POPs and various chronic diseases, including type 2 diabetes, metabolic syndrome, and coronary heart disease ( Ha et al. 2007 ; Lee et al. 2006 , 2007 ).
It is worthwhile to note that some organo-chlorine (OC) pesticides and polychlorinated biphenyls (PCBs) are still used in developing countries such as India or China and that they persist in the food supplies of all countries. In addition, large amounts of municipal wastes are dumped daily in open dumping sites in the suburbs of major cities without proper management. A recent study reported that the surrounding environment showed extremely high levels of POPs compared with those in the control sites ( Minh et al. 2006 ). In fact, in utero exposure to various chemical contaminants such as dioxins, PCBs, or OC pesticides may cause adverse pregnancy outcomes such as low birth weight, preterm delivery, or intrauterine growth retardation ( Wigle et al. 2008 ; Windham and Fenster 2008 ), which are commonly attributed to under-nutrition and a future high risk of metabolic syndrome and type 2 diabetes in developing countries ( Yajnik 2004 ). Epigenetic changes due to POPs may likely play a role in the current epidemics of metabolic syndrome and type 2 diabetes in developing countries, along with westernization of life style. However, our hypothesis may be relevant to any population with background exposure to various chemicals that are conjugated with GSH.
Conclusions
At present, there is a paucity of integrative human studies that consider both chemicals and nutrition. Therefore, future human studies will be needed to consider the influences of chemical exposures on DNA hypomethylation, accounting for dietary factors.
Especially in times of generally adequate diet, studies of epigenetic change may miss a factor of considerable importance if they do not consider chemical agents. Because epigenetic changes are reversible, developing drugs that control epigenetic regulation now attract substantial research investment, including the development of functional foods or supplements. However, because lifelong exposure to some chemical agents is likely to play an important role in epigenetic changes of etiopathogenic relevance for some adult diseases, it would also be reasonable and efficient to strengthen public and private policies that decrease exposure to such chemicals.
This study was supported by a grant from the Korean Healthcare Technology R&D Project, Ministry of Health, Welfare & Family Affairs, Republic of Korea (A084046).
- Abelsohn A, Gibson BL, Sanborn MD, Weir E. Identifying and managing adverse environmental health effects: 5. Persistent organic pollutants. CMAJ. 2002; 166 (12):1549–1554. [ PMC free article ] [ PubMed ] [ Google Scholar ]
- Akai S, Hosomi H, Minami K, Tsuneyama K, Katoh M, Nakajima M, et al. Knock down of gamma-glutamyl-cysteine synthetase in rat causes acetaminophen-induced hepatotoxicity. J Biol Chem. 2007; 282 (33):23996–24003. [ PubMed ] [ Google Scholar ]
- Anway MD, Cupp AS, Uzumcu M, Skinner MK. Epigenetic transgenerational actions of endocrine disruptors and male fertility. Science. 2005; 308 (5727):1466–1469. [ PubMed ] [ Google Scholar ]
- Anway MD, Leathers C, Skinner MK. Endocrine disruptor vinclozolin induced epigenetic transgenerational adult-onset disease. Endocrinology. 2006; 147 (12):5515–5523. [ PMC free article ] [ PubMed ] [ Google Scholar ]
- Bakke JE, Feil VJ, Mulford DJ. Biliary excretion and intestinal metabolism in the intermediary metabolism of pentachlorothioanisole. Xenobiotica. 1990; 20 (6):601–605. [ PubMed ] [ Google Scholar ]
- Coles B, Ketterer B. The role of glutathione and glutathione transferases in chemical carcinogenesis. Crit Rev Biochem Mol Biol. 1990; 25 (1):47–70. [ PubMed ] [ Google Scholar ]
- Cossu C, Doyotte A, Jacquin MC, Babut M, Exinger A, Vasseur P. Glutathione reductase, selenium-dependent glutathione peroxidase, glutathione levels, and lipid peroxidation in freshwater bivalves, Unio tumidus , as biomarkers of aquatic contamination in field studies. Ecotoxicol Environ Saf. 1997; 38 (2):122–131. [ PubMed ] [ Google Scholar ]
- Davis CD, Uthus EO. DNA methylation, cancer susceptibility, and nutrient interactions. Exp Biol Med (Maywood) 2004; 229 (10):988–995. [ PubMed ] [ Google Scholar ]
- Deth R, Muratore C, Benzecry J, Power-Charnitsky VA, Waly M. How environmental and genetic factors combine to cause autism: a redox/methylation hypothesis. Neurotoxicology. 2008; 29 (1):190–201. [ PubMed ] [ Google Scholar ]
- Edwards TM, Myers JP. Environmental exposures and gene regulation in disease etiology. Environ Health Perspect. 2007; 115 :1264–1270. [ PMC free article ] [ PubMed ] [ Google Scholar ]
- Feinberg AP. Phenotypic plasticity and the epigenetics of human disease. Nature. 2007; 447 (7143):433–440. [ PubMed ] [ Google Scholar ]
- Fraga MF, Agrelo R, Esteller M. Cross-talk between aging and cancer: the epigenetic language. Ann NY Acad Sci. 2007; 1100 :60–74. [ PubMed ] [ Google Scholar ]
- Franco R, Schoneveld OJ, Pappa A, Panayiotidis MI. The central role of glutathione in the pathophysiology of human diseases. Arch Physiol Biochem. 2007; 113 (4–5):234–258. [ PubMed ] [ Google Scholar ]
- Gluckman PD, Hanson MA, Cooper C, Thornburg KL. Effect of in utero and early-life conditions on adult health and disease. N Engl J Med. 2008; 359 (1):61–73. [ PMC free article ] [ PubMed ] [ Google Scholar ]
- Ha MH, Lee DH, Jacobs DR. Association between serum concentrations of persistent organic pollutants and self-reported cardiovascular disease prevalence: results from the National Health and Nutrition Examination Survey, 1999–2002. Environ Health Perspect. 2007; 115 :1204–1209. [ PMC free article ] [ PubMed ] [ Google Scholar ]
- Heijmans BT, Tobi EW, Stein AD, Putter H, Blauw GJ, Susser ES, et al. Persistent epigenetic differences associated with prenatal exposure to famine in humans. Proc Natl Acad Sci USA. 2008; 105 (44):17046–17049. [ PMC free article ] [ PubMed ] [ Google Scholar ]
- Higuchi Y. Glutathione depletion-induced chromosomal DNA fragmentation associated with apoptosis and necrosis. J Cell Mol Med. 2004; 8 (4):455–464. [ PMC free article ] [ PubMed ] [ Google Scholar ]
- Jandacek RJ, Tso P. Factors affecting the storage and excretion of toxic lipophilic xenobiotics. Lipids. 2001; 36 (12):1289–1305. [ PubMed ] [ Google Scholar ]
- Jones DP, Brown LA, Sternberg P. Variability in glutathione-dependent detoxication in vivo and its relevance to detoxication of chemical mixtures. Toxicology. 1995; 105 (2–3):267–274. [ PubMed ] [ Google Scholar ]
- Ketterer B, Coles B, Meyer DJ. The role of glutathione in detoxication. Environ Health Perspect. 1983; 49 :59–69. [ PMC free article ] [ PubMed ] [ Google Scholar ]
- Koehler KM, Pareo-Tubbeh SL, Romero LJ, Baumgartner RN, Garry PJ. Folate nutrition and older adults: challenges and opportunities. J Am Diet Assoc. 1997; 97 (2):167–173. [ PubMed ] [ Google Scholar ]
- Lee DH, Lee IK, Porta M, Steffes M, Jacobs DR., Jr Relationship between serum concentrations of persistent organic pollutants and the prevalence of metabolic syndrome among non-diabetic adults: results from the National Health and Nutrition Examination Survey 1999–2002. Diabetologia. 2007; 50 (9):1841–1851. [ PubMed ] [ Google Scholar ]
- Lee DH, Lee IK, Song K, Steffes M, Toscano W, Baker BA, et al. A strong dose-response relation between serum concentrations of persistent organic pollutants and diabetes: results from the National Health and Examination Survey 1999–2002. Diabetes Care. 2006; 29 (7):1638–1644. [ PubMed ] [ Google Scholar ]
- Lertratanangkoon K, Wu CJ, Savaraj N, Thomas ML. Alterations of DNA methylation by glutathione depletion. Cancer Lett. 1997; 120 (2):149–156. [ PubMed ] [ Google Scholar ]
- Liu H, Wang H, Shenvi S, Hagen TM, Liu RM. Glutathione metabolism during aging and in Alzheimer disease. Ann NY Acad Sci. 2004; 1019 :346–349. [ PubMed ] [ Google Scholar ]
- Loenen WA. S -Adenosylmethionine: jack of all trades and master of everything? Biochem Soc Trans. 2006; 34 (Pt pt 2):330–333. [ PubMed ] [ Google Scholar ]
- Mason JB. Biomarkers of nutrient exposure and status in one-carbon (methyl) metabolism. J Nutr. 2003; 133 (suppl 3):941S–947S. [ PubMed ] [ Google Scholar ]
- Mathers JC. Early nutrition: impact on epigenetics. Forum Nutr. 2007; 60 :42–48. [ PubMed ] [ Google Scholar ]
- Minh NH, Minh TB, Kajiwara N, Kunisue T, Subramanian A, Iwata H, et al. Contamination by persistent organic pollutants in dumping sites of Asian developing countries: implication of emerging pollution sources. Arch Environ Contam Toxicol. 2006; 50 (4):474–481. [ PubMed ] [ Google Scholar ]
- O’Dell SD, Day IN. Insulin-like growth factor II (IGF-II) Int J Biochem Cell Biol. 1998; 30 (7):767–771. [ PubMed ] [ Google Scholar ]
- Otto DM, Moon TW. Phase I and II enzymes and anti-oxidant responses in different tissues of brown bullheads from relatively polluted and non-polluted systems. Arch Environ Contam Toxicol. 1996; 31 (1):141–147. [ PubMed ] [ Google Scholar ]
- Ozanne SE, Constancia M. Mechanisms of disease: the developmental origins of disease and the role of the epigenotype. Nat Clin Pract Endocrinol Metab. 2007; 3 (7):539–546. [ PubMed ] [ Google Scholar ]
- Paustenbach D, Galbraith D. Biomonitoring and biomarkers: exposure assessment will never be the same. Environ Health Perspect. 2006; 114 :1143–1149. [ PMC free article ] [ PubMed ] [ Google Scholar ]
- Porta M. A Dictionary of Epidemiology. New York: Oxford University Press; 2008. [ Google Scholar ]
- Porta M, Puigdomenech E, Ballester F, Selva J, Ribas-Fito N, Llop S, et al. Monitoring concentrations of persistent organic pollutants in the general population: the international experience. Environ Int. 2008; 34 (4):546–561. [ PubMed ] [ Google Scholar ]
- Rusiecki JA, Baccarelli A, Bollati V, Tarantini L, Moore LE, Bonefeld-Jorgensen EC. Global DNA hypomethylation is associated with high serum-persistent organic pollutants in Greenlandic Inuit. Environ Health Perspect. 2008; 116 :1547–1552. [ PMC free article ] [ PubMed ] [ Google Scholar ]
- Selhub J. Folate, vitamin B 12 and vitamin B 6 and one carbon metabolism. J Nutr Health Aging. 2002; 6 (1):39–42. [ PubMed ] [ Google Scholar ]
- Shi MM, Iwamoto T, Forman HJ. gamma-Glutamylcysteine synthetase and GSH increase in quinone-induced oxidative stress in BPAEC. Am J Physiol. 1994; 267 (4 Pt 1):L414–L421. [ PubMed ] [ Google Scholar ]
- Wigle DT, Arbuckle TE, Turner MC, Berube A, Yang Q, Liu S, et al. Epidemiologic evidence of relationships between reproductive and child health outcomes and environmental chemical contaminants. J Toxicol Environ Health B Crit Rev. 2008; 11 (5–6):373–517. [ PubMed ] [ Google Scholar ]
- Wilson AS, Power BE, Molloy PL. DNA hypomethylation and human diseases. Biochim Biophys Acta. 2007; 1775 (1):138–162. [ PubMed ] [ Google Scholar ]
- Windham G, Fenster L. Environmental contaminants and pregnancy outcomes. Fertil Steril. 2008; 89 (2 suppl):e111–e116. [ PubMed ] [ Google Scholar ]
- Wu D, Cederbaum A. Glutathione depletion in CYP2E1-expressing liver cells induces toxicity due to the activation of p38 mitogen-activated protein kinase and reduction of nuclear factor-kappaB DNA binding activity. Mol Pharmacol. 2004; 66 (3):749–760. [ PubMed ] [ Google Scholar ]
- Yajnik CS. Early life origins of insulin resistance and type 2 diabetes in India and other Asian countries. J Nutr. 2004; 134 (1):205–210. [ PubMed ] [ Google Scholar ]
- Zaina S, Lindholm MW, Lund G. Nutrition and aberrant DNA methylation patterns in atherosclerosis: more than just hyperhomocysteinemia? J Nutr. 2005; 135 (1):5–8. [ PubMed ] [ Google Scholar ]
Statistical Inferences in Nutrition: P-Values, Point Estimates, and Confidence Intervals
- December 30, 2021
- Research Skills
Founder and Writer at My Nutrition Science
When we read a science paper to progress our understanding of a topic, it is imperative to know how to interpret the results section—you know, that section we have all casted a blind eye to before heading to the discussion!
The inability to interpret research findings appropriately is part of the reason for so much debate within the nutritional field. Or science, generally, to be honest. It is common for two people (including experts) to read the same study and reach conflicting conclusions. I have lost count of the number of times people have sent me ‘supporting evidence’ for a claim when the results indicate otherwise upon inspection. Why? Numerous factors. More often than not, however, it is because one party does not have a basic understanding of statistics.
For this reason, this article provides a basic overview of inferential statistics—that is, the collection of tools and techniques to make inferences from data. Specifically, I want to touch on three statistical results that everyone needs to be mindful of when analysing the results section of any study: p -values, point estimates, and confidence intervals.

Let’s start with p -values—this is probably the statistical measure that you are most familiar with. It is commonplace to read a study and head straight for that p -value.
Was the result statistically significant ( p ≤ 0.05) or was it not ( p > 0.05)? Many people think they have found something interesting if the result is the former; if not, it is nothing to care about. Dare I say this interpretation was as much as my (lack of) statistical brain would comprehend throughout my university years. My attention-deficit disorder brain wanted the study to just tell me the result, it’s importance, and be on its merry way. Rarely, if ever, would it question the p-value or try to comprehend its influence on my interpretation of the results, or the broader research area. This was my own wrongdoing, though, as it turns out the p -value is the most frequently misinterpreted statistical measure. By far.

To better understand the p -value, let’s clarify why it was implemented in scientific research. What was its purpose? I’m sure statisticians could enter into a long rant here, but I’ll try to keep it brief.
The p -value was introduced to complement the Theory of Probability, stating that “variation must be taken as random until there is positive evidence to the contrary”. In other words, if you find an association within a data set, you assume it is random until a statistical test measures the compatibility with this assumption.
Introducing the p -value. A simple way to think about the p -value is that it summarises the compatibility between data and a pre-defined hypothesis (also called a ‘test hypothesis’). The test hypothesis is always specific to the study you are reading, but most often it is a ‘null’ hypothesis. This postulates the absence of an effect; even if there is an association, the null hypothesis assumes it is random.
What do I mean by the term ‘compatibility’? Well, the definition of a p -value revolves around probabilities . A little bit more detail is required, though. To quote the American Statistical Association (ASA) 2016 statement [1] , “…a p-value is the probability under a specified statistical model that a statistical summary of the data (e.g., the sample mean difference between groups) would be equal to or more extreme than its observed value”. Yes, quite a mouthful. Confusing, too.
The “would be” part is particularly confusing—would be if what? . Let’s reframe this for clarity. Another way to state the definition of a p-value is… given repeated sampling in the same population, the p -value is the probability that chance alone would lead to a difference between groups as large as observed in the study. I know that even my rejigged definition still requires a few reads to grasp. Still, I hope that it at least clarifies the p -value is comparing what was observed to what we expect to observe when there is no true effect.
And because we are discussing probabilities here, we should know that the p -value is measured on a scale between 0 to 1. This scale is what summarises the compatibility of the data with the null hypothesis:
- 1 on the scale ( p = 1.00) means that the data is fully compatible with the null hypothesis.
- 0 on the scale ( p = 0.00) means that the data is fully incompatible with the null hypothesis.
However, certainty and impossibility are incomprehensible extremes of probability and, in reality, no study will ever find that p = 0 or p = 1. Rather, the p -value will always sit somewhere between these two extremes. The lower the p -value (closer to p = 0.00), the less compatible the data is with the null hypothesis; the higher the p -value (closer to 1.00), the more compatible the data is with the null hypothesis. In turn, despite the fact that no p-value inherently reveals the plausibility or truth of an association or effect, lower p -values may be used as contributing evidence against the null hypothesis of no association or difference or effect. This “contributing evidence” is not because small p -values are rarely observed given the null hypothesis is true (a common misinterpretation), but actually because they are relatively less likely to be observed when the null hypothesis is true compared to an alternative hypothesis.
Understanding the prior is key to knowing why many people’s interpretation of a p -value is faulty. Typically—and I was not an exception—people think that p ≤ 0.05 is a demonstration of a “true effect” and p > 0.05 is a demonstration of “no effect”. Clearly, we have already established why this is fundamentally incorrect by knowing what the p -value actually measures. It does not measure an effect; it measures the statistical compatibility with no effect. This begs the question, then, why is the cut off for what is known as “statistical significance” set at p ≤ 0.05? (at least in health sciences). I pondered this question for a while, but it turned out that there was no logical answer. The 0.05 cutoff for statistical significance, known as the ‘alpha level’ of the test, is used because researchers in the field largely agree upon it and apply it consistently to help reach conclusions. There is nothing special about this specific number, though. The fact remains that no p -value inherently reveals the plausibility or truth of an association or effect and therefore and, as per the probability continuum, statistically nonsignificant p -values ( p > 0.05) do not necessarily contradict statistically significant p -values ( p ≤ 0.05) just because they lie on opposite sides of a statistical fence. The same 2016 ASA statement that I cited earlier clarified that statistical significance testing and p -values never substitute for scientific reasoning [1] . The p -value simply is what it is; to be interpreted as a continuous variable and not in a dichotomous way.
This being said, the nature of the test’s alpha level, and statistical significance in general, should not imply that they have no utility. Tunc et al. [2] argue that “the function of dichotomous claims in science is not primarily a statistical one, but an epistemological and pragmatic one. From a philosophical perspective rooted in methodological falsificationism, dichotomous claims are the outcome of methodological decision procedures that allow scientists to arrive at empirical statements that connect data to phenomena.” At the end of the day, there has to be some kind of distinguishing element between evidence that is used for or against a real-world decision; we require some framework for epistemological consistency. This does not mean that we should leave our hands tied based on this probability alone, but p -values and statistical significance testing can be part of a holistic approach to study interpretation and decision-making. We can use p -values to infer what the data indicate about the effect and interval estimates concerning the null hypothesis. Thus, we should always use our wider knowledge of research design and other statistical measures to reach overall conclusions about what the data infer about a specific research question. This same narrative is highlighted superbly in a recent paper titled ‘There is life beyond the statistical significant’, where Ciapponi et al. [2] state that, “…rather than adopting rigid rules for presenting and interpreting continuous P-values, we need a case by case thoughtful interpretation considering other factors such as certainty of the evidence, plausibility of mechanism, study design, data quality, and costs-benefits that determine what effects are clinically or scientifically important”.
So there we have it, p -values. Pretty complex, right? I hope to have highlighted some correct interpretations that maybe you were unaware of. Maybe you were already well aware and this is a nice reminder. In any case, I leave this section with five more correct interpretations of a p-value that I believe are not currently well-appreciated in nutrition science discussions:
- If two groups are “not significantly different”, this does not mean “not different from”. Commentary on “no differences” between groups based on statistical nonsignificance is erroneous and misleading. It only takes a brief look at data to see differences (even if simply explained by randomness) that contributed to a p- value below 1.
- The p- value is not the probability that chance produced an association, i.e. if p = 0.25, this does not mean there is a 25% probability that chance produced the association. A couple of reasons explain why this is wrong. First, the statistical significance test already assumes that chance is operating alone. Second, the p- value refers not only to what we observed but also to observations more extreme than what we observed.
- A statistical significance test is not “null” if p > 0.05. A p- value should never be used to affirm the null. The null hypothesis is assumed to be true in the calculation of the p- value.
- A large p- value is not necessarily evidence favouring the null hypothesis’ truthfulness. A large p- value might indicate that the null hypothesis is greatly compatible with the data, but by definition, any p- value below 1 implies that the null hypothesis is not the most compatible hypothesis with the data.
- The p -value itself is simply an estimation and one that is computed from its own assumptions. Not only do we have to assume that the statistical model used to compute the p -value is correct, but also that there is no form of bias (confounding, information, and selection bias) distorting the data in relation to the null hypothesis. The latter, in particular, is often a very strong assumption.
Point Estimate and Effect Size
To balance out the complexities of the p -value, we will now move to effect sizes which are relatively easier to comprehend yet still contain valuable information. In statistical inference, an effect size is the magnitude of the outcome difference between study groups . This statistical measure belongs within the category of what are known as ‘point estimates’ — these terms tend to be used interchangeably without issue.
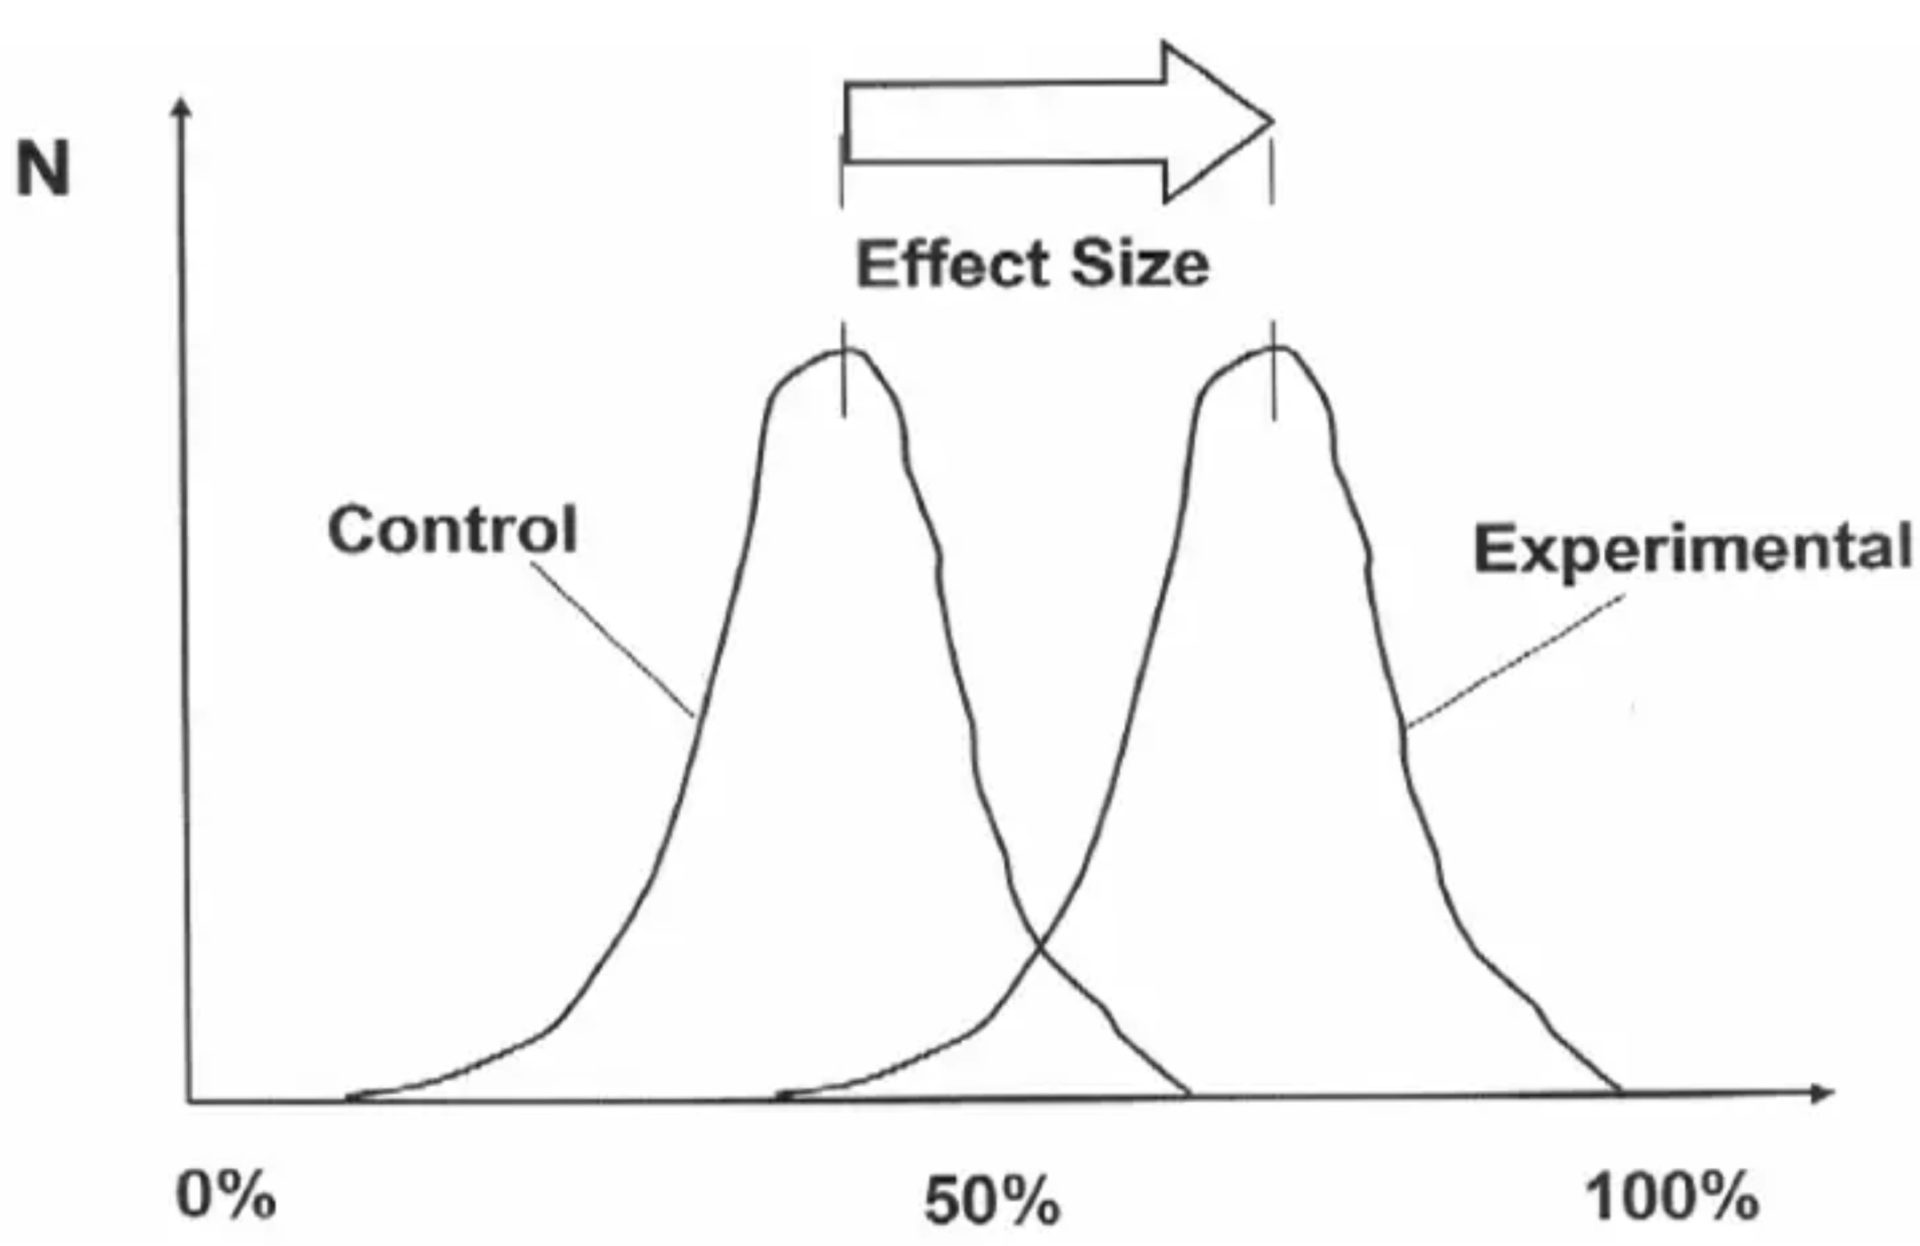
The “effect” is then attributed to some difference in exposure between study groups, such as the difference in the consumption of a certain food or nutrient. If we take a nutrition-specific example, an effect size of interest could be the difference in cardiovascular events between two groups with varying exposure to saturated fat consumption. Usually, this difference will be reported in relative terms such as a decimal or percentage difference of one group compared to another — check the methods section of a study to know the specifics! But whatever the effect size is reported as, the reader is always being given some sort of information about the magnitude of a statistical difference. Quite important! In the study results section, you will often see the effect size written as-is below (taken from Hooper et al. [3] ).

In this example, the effect size is reported as a “21% reduction in cardiovascular events in people who had reduced SFA compared with those on higher SFA”. So in this sentence alone, the researchers are telling you the magnitude of difference (a 21% reduction) between specific groups (exposed to different intakes of saturated fat) with respect to a specific outcome (cardiovascular events). You will usually see the group difference reported in both decimal and percentage terms — but remember that a 21% effect size is not reported as 0.21; it is reported as 0.79, which is a 0.21 difference from 1.00 (with 1.00 always representing the control or comparison group). And although I said point estimate and effect size tend to be used interchangeably, know that people usually refer to the point estimate in reference to decimal terms (0.79) and the effect size in percentage terms (21%).
The effect size is just how it sounds, then. Effect sizes estimate the ‘size’ of an ‘effect’ with some measure of magnitude. No surprises. But why is this additional information about effect size important? Can you not just use the p-value? Well, no. The p -value covered previously does not reveal the size of an effect, only the compatibility of the data with no effect, and there are many benefits to knowing the effect size. The obvious benefit is the effect sizes practical value for nutrition practitioners. As a nutrition practitioner myself, I might use the effect size to manage client expectations about how much difference is expected from a certain dietary intervention. For example, should we tell clients that increasing their protein intake by 50% might result in dramatic muscle mass changes or only small changes? Is the magnitude of benefit worth it? The estimated effect sizes from research can guide us here.

However, a less obvious benefit to knowing the effect size is actually when trying to decipher whether a true effect exists at all. Because although there is no reason to suspect large true effects are more prevalent than small true effects, we must acknowledge that we can only infer true effects via the scientific method, and there are many research biases (confounding, information, and selection bias) that interfere with making reliable estimations. Therefore, we might say that all else held equal, we are more confident inferring true effects from larger estimated effects; there is less chance that some known or unknown biases are fully responsible for the estimated effect if it is larger. For example, all else held equal, we will probably be more confident in an effect when a dietary exposure hypothetically increases the prevalence of a disease by 1000% compared to 1%. Arguing otherwise would appear to indicate ignorance of scientific uncertainties. I would suggest reading an interesting paper by Michael Hofler [3] for more thoughts on this, as he also states that “…the benefit of the consideration on strength was that strong associations could not be solely due to small biases, whether through modest confounding or other sources of bias.” Keep in mind, though, that the “all else held equal” part of my statement is critical for it to remain in the appropriate context. I am not saying that we should necessarily put more faith in larger effects than smaller effects without considering other factors such as research design, p-values, and confidence intervals. Effect sizes are only one part of the puzzle. I’m sure that we will all agree that if a meta-analysis of randomised controlled trials finds a small difference between groups with narrow confidence intervals, we will be more confident this indicates a true effect than a cross-sectional study that finds a large difference between groups with wide confidence intervals. Our confidence in a true effect is based on many factors other than its estimated size.
Perhaps more importantly than these other factors, though, is acknowledging that effect sizes are inversely correlated to baseline prevalence rates. Although it can be argued that nutrition generally deals with small effect sizes (especially compared to medicine), one of the reasons for this is because dietary relationships are often focused on outcomes with high baseline prevalences (e.g., cardiovascular disease) and, as a result, there is limited scope for large effects to exist regardless of the truthfulness of the dietary relationship. So despite many strange outcries to scrap nutrition science as being able to infer causal effects because the estimated effect sizes are generally small, I don’t see why this should be the case. Differences in effect sizes do not necessarily translate to differences in importance. A dietary exposure that increases the relative risk of cardiovascular mortality by 10% can relate to the same number of deaths as another exposure that increases lung cancer mortality by 200% – should we only believe in the lung cancer risk simply because the baseline prevalence rate is lower? This would be an unwise and dangerous position to take, in my opinion. Not only could it lead to millions of unnecessary deaths, but it would mean taking a stand against discussions of causality simply due to certain study population characteristics and/or prevalences of other causes. How can this be reasonably justified? It cannot. The alternative would be to emphasise the need for nutrition researchers to appreciate the intricate complexities of research methodology and other statistical measures, hence why I am writing this article. This way, we avoid being intellectually lazy and trying to use small effect sizes as an excuse to dismiss important causal relationships as mere associations or chance findings.
Confidence Intervals
Now that we have covered p -values and effect sizes, let’s move to another extremely important result from statistical tests: confidence intervals (abbreviated as ‘CI’). If you look at a results section, the CI figure follows a calculated point estimate (the effect size in decimal terms). In fact, the point estimate will always lie within the CI—usually right in the middle if a normal distribution is assumed. For example, using the previous Hooper et al. example, we see a point estimate of ‘0.79’ (representing a 21% increase in relative risk) followed by a CI stated as ‘95% CI 0.66 to 0.93’. But what does this mean?

Unfortunately, the CI is a little complicated to understand at first, but please bear with me. The CI results from a statistical procedure that, over infinite repeated sampling and in the absence of bias, provides us with intervals containing the true value a fixed proportion of the time. And unless you are a statistical whizz already, this definition should not make much sense until we dig a bit deeper, so let’s now look at what the ‘95% CI’ part means. If we go back to p -values and remember that the alpha level of the test is almost always 0.05, we can instantly see where the ‘95% CI’ comes from. In simple math, 1 minus the alpha level (0.05) gives you 0.95 in decimal terms, and thus the ‘95% CI’ in percentage terms. This percentage is known as the ‘confidence level’ of the statistical model, which relates directly to our CI definition’s “fixed proportion of the time” aspect. Actually, if we replace this part of the CI definition with the confidence level, we get this… over infinite repeated sampling and in the absence of bias, a CI will contain the true value with a frequency of the confidence level (95%). This might make a bit more sense? I hope so. If not, let’s go further and discuss the intervals themselves. As with any interval, we must have a lower and upper bound defining the interval—in the Hooper et al. example, the lower bound is 0.66 and the upper bound is 0.93. Thus, we can say that… over infinite repeated sampling and in the absence of bias, the estimated lower and upper bounds would contain the true value with a frequency of the confidence level (95%). We could, in theory, have a 100% confidence interval; however, in reality, it would not be beneficial for capturing a confined range of numbers as the lower and upper bounds would go from negative infinity to positive infinity.

Also, keep in mind that for any single study, we cannot know if the estimated 95% CI is even among the 95% that includes the true value, or among the 5% that do not. Therefore, we cannot claim to be “95% confident” that the true value lies within the interval for any given study. This is a common misinterpretation that I hear in nutrition science discussions. Granted, this may be perceived as an extremely picky and meaningless criticism—as with most statistical debates—but we should acknowledge that the interval itself is only an estimate and one that again relies on a correct statistical model and the often strong assumption of no bias. So while the point estimate is a single number that indicates the best estimate , interval estimates provide more information about the true value we are interested in by providing us with an estimated range of values. This makes the CI a more useful statistic measure than point estimates alone. In fact, looking solely at the point estimate alone can be deceiving. For example, if a point estimate was 1.2 (let’s say indicating a 20% increase in relative risk) yet the 95% CI was 0.2 – 2.2, we probably should not make strong claims about our confidence in the estimated effect size given the wide CI’s. In this example, the confidence interval includes as much as 20% association in one direction to a 220% association in another direction. Quite a difference!

Additionally, given the direct relationship between the confidence level and the alpha level (used in statistical significance testing), it is not surprising to know that the CI directly relates to statistical significance, too. Specifically, if the CI does not contain the expected point estimate given the null hypothesis (1.00; no effect) then we have a “statistically significant” finding ( p ≤ 0.05); if the confidence interval does contain the expected point estimate given the null hypothesis (1.00; no effect) then we have a “statistically nonsignificant” finding ( p > 0.05). This is not all. From what we know about CI’s, we know they go beyond telling us whether the data is statistically compatible with the null hypothesis; interval estimation tells us the compatibility of the data with an alternate hypothesis. For example, if we have a 95% CI of 0.99 – 9.54, although the data is statistically compatible with the null hypothesis and “statistically nonsignificant” (the interval includes 1.00), the CI’s indicate the data is even more compatible with an association related to an alternate hypothesis. Thus, CI’s can include potentially important benefits or harms of an association not indicated by the p -value alone. In fact, if we take two p -values assessing the same relationship, one statistically significant and another statistically nonsignificant, we should not be quick to run to the conclusion that the results oppose each other. CI’s help us to understand that statistically nonsignificant results of one study do not necessarily contradict statistically significant results—I have included a forest plot below to illustrate this better. Appreciating these statistical intricacies greatly helps counter people who say that “there is research to support both sides of the argument and therefore we cannot be sure of anything.” Possibly true in some instances, but even just a quick look at CI’s can unveil a whole other truth (or estimation of the truth anyway!).
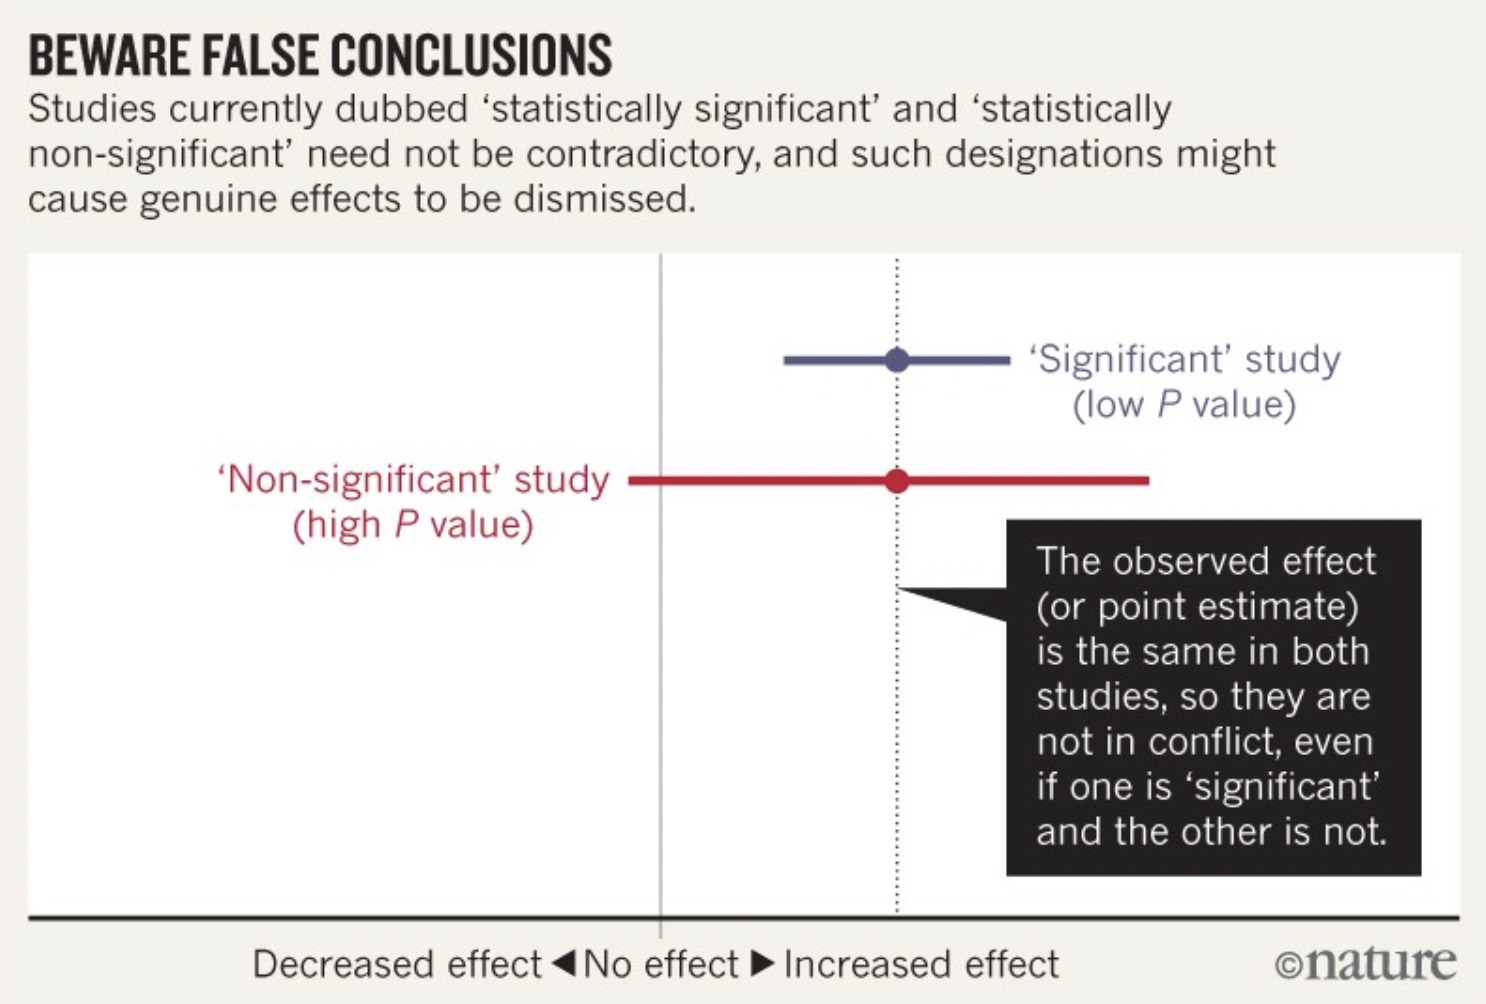
Final Thoughts
I hope to have highlighted some of the unique features of each statistical measure and why each of them is important when interpreting study results. First, we had the p -value indicating the degree to which the data is compatible with the null hypothesis that no relationship is present; however, we know that p -values alone provide limited information about data, are often misinterpreted, and do not provide information about hypotheses other than the null. Second, we had the effect size indicating the strength of an association; however, we know this is only the best estimate of the truth and is subject to variability from measurement error, various biases, and random error. Then, thirdly, we had the CI, which estimates the degree of precision characterising the point estimate and to what degree it is subject to variability . If we understand all three statistical measures together, we are putting ourselves in good stead to interpret research appropriately.
If you have enjoyed this article and want to support My Nutrition Science, please consider donating to us via this link and subscribing to our email list below.
SUBSCRIBE TO EMAIL LIST
Related deep dives.

- January 17, 2022
Nutrition Misinformation: How to Spot a Quack

- November 27, 2021
Merging Reductionism and Holism in Nutrition

LENARD I. LESSER, MD, MSHS, MARY CAROL MAZZA, PhD, AM, AND SEAN C. LUCAN, MD, MPH, MS
Am Fam Physician. 2015;91(9):634-638
Related letter : Foods Containing Saturated Fat: Dietary Limits Are Still Essential
Author disclosure: No relevant financial affiliations.
Healthy dietary intake is important for the maintenance of general health and wellness, the prevention of chronic illness, the optimization of life expectancy, and the clinical management of virtually all disease states. Dietary myths (i.e., concepts about nutrition that are poorly supported or contradicted by scientific evidence) may stand in the way of healthy dietary intake. Dietary myths exist about micronutrients, macronutrients, non-nutrients, and food energy. Representative myths of each type include that patients need to focus on consuming enough calcium to ensure bone health, dietary fat leads to obesity and is detrimental to vascular health, all fiber (whether naturally occurring or artificially added) is beneficial, and food calories translate to pounds of body weight through a linear relationship and simple arithmetic. A common theme for dietary myths is a reductionist view of diet that emphasizes selected food constituents as opposed to whole foods. Healthy dietary advice takes a more holistic view; consistent evidence supports recommendations to limit the consumption of ultraprocessed foods and to eat whole or minimally processed foods, generally in a form that is as close to what occurs in nature as possible. Family physicians can help dispel myths for patients and give sound nutritional advice by focusing on actual foods and broader dietary patterns.
What an individual eats is important for the maintenance of general health and wellness and the management of virtually all disease states. Healthy diets are associated with reductions in morbidity and premature mortality. 1 However, much of the dietary information presented as fact is actually myth (i.e., concepts poorly supported or contradicted by the scientific evidence). There are dietary myths about micronutrients (vitamins and minerals), macronutrients (carbohydrates, proteins, and fats), non-nutrients (components of food not currently recognized as essential for growth or maintenance), and food energy (the stored capacity to do work that is often measured in calories). This article will discuss selected common myths in each of these areas.
Dietary Myths
Patients need to focus on consuming enough calcium for bone health.
Encouraging calcium consumption for optimal bone health and osteoporosis prevention is a routine part of many clinical visits, especially for female patients. Nonetheless, the role of calcium in strengthening bones is unclear. Americans have among the highest calcium intake in the world, but also one of the highest rates of osteoporosis. 2
A Cochrane review found that trials of calcium supplementation in children had minimal, if any, effect on bone mineral density. 3 Another Cochrane review including postmenopausal women and older men found that calcium supplements, even with concomitant vitamin D supplementation, had only small effects on fracture prevention; the number needed to treat (NNT) to prevent one hip fracture was approximately 1,000 for those living in the community and about 111 for nursing home residents. 4 Although the U.S. Preventive Services Task Force does not make a stand-alone recommendation on calcium, it concludes that the evidence is insufficient to recommend vitamin D supplementation, with or without calcium, to prevent fractures in noninstitutionalized women or men. 5
The small chance of benefit with supplemental calcium may be outweighed by the increased risks of adverse effects, particularly kidney stones and cardiovascular events, even in dosages as low as 500 mg daily. 6 , 7 Whereas a meta-analysis including older persons showed that the NNT with calcium supplementation to prevent one fracture was 302, the number needed to harm (number needed to cause one major cardiovascular event) was 178. 8
Other meta-analyses did not find a statistically significant increase in cardiovascular risk with calcium supplementation, 9 but suggested that it may actually increase the risk of hip fracture. 10
Patients should be informed about the lack of evidence to support calcium supplements for bone health and the possibility of harm with supplementation (e.g., through pills or unnaturally fortified foods).
Calcium is also found in whole foods, such as dairy. Although consuming dairy foods does not have clear benefits for bone health, 3 , 11 , 12 it does not seem to pose risks for kidney stones or cardiovascular events as with artificial forms of calcium supplementation. 6 , 8
DIETARY FAT LEADS TO OBESITY AND IS DETRIMENTAL TO VASCULAR HEALTH
Macronutrients are the components of food that supply energy. Because fat is the macronutrient with the highest number of calories per gram, there are concerns that consuming fat will lead to higher calorie intake and obesity. Dietary guidelines have recommended reducing fat intake, 13 , 14 and physicians often recommend a low-fat diet. However, some high-fat foods may have beneficial effects, such as greater satiety subsequently leading to lower food intake overall. 15 , 16 Studies have demonstrated that consuming higher-calorie fatty foods and higher-fat diets may produce and sustain as much or more weight loss than lower-fat diets. 17 – 20
Some dietary guidelines specifically recommend replacing saturated fats with unsaturated fats to improve vascular health. The rationale is that consuming saturated fats raises levels of total and low-density lipoprotein cholesterol, whereas consuming unsaturated fats generally lowers these levels. 21 Regardless of potential changes in disease-oriented lipid parameters, evidence is mounting that saturated fats may not be a primary driver of cardiometabolic disease or mortality. 22 – 28 A Cochrane review found no effects on cardiovascular or all-cause mortality with reduction of saturated fat or with substituting other fats for saturated fat. Although there was the suggestion of a small reduction in cardiovascular events in trials with dietary fat modification (maintaining total fat intake but with higher proportions of polyunsaturated and monounsaturated fats), effects became statistically nonsignificant when the review authors excluded biased studies (i.e., those having systematic differences between intervention and control groups, other than dietary-fat differences). 29
It is important to note that patients do not eat isolated types of fat; they eat foods that contain mixes of fats, as well as other components such as proteins, carbohydrates, micronutrients, and fiber. Some foods containing saturated fats may be harmful, whereas others may be benign or even beneficial. For instance, consuming ultraprocessed foods high in saturated fats (e.g., preserved meats) has been associated with significant increases in cardiovascular and all-cause mortality, 26 whereas consuming whole foods high in saturated fats (e.g., dairy products) has been inversely associated with incident cardiovascular disease 27 and cardiometabolic risk factors such as type 2 diabetes mellitus and obesity. 22 , 28 Reducing saturated fat in the diet may not lead to lower cardiovascular risk, especially if what replaces this fat is ultraprocessed (refined) carbohydrates. 30
ALL TYPES OF FIBER ARE BENEFICIAL
Fiber, a nondigestible food constituent, is not known to be essential for body growth and maintenance, but may be important for general health. The Institute of Medicine recommends a daily fiber intake of 25 g for adult women and 38 g for adult men. 31 Not all kinds of fiber are equally beneficial, however.
Dietary fibers are a natural part of whole plant foods (e.g., fruits, vegetables, nuts, grains, seeds). Dietary fibers have soluble and insoluble forms, both of which may be beneficial. Increased intake of dietary fiber may help prevent cardiovascular disease, diabetes, constipation, and gastrointestinal and breast cancers. 32 – 37
By contrast, functional fibers are components of ultra-processed foods. Functional fibers include polydextrose, insulin, resistant starch, chitosan, and indigestible dextrins. These substances are isolated or created in laboratories and then injected into ultraprocessed food items to increase their fiber content. 31 The U.S. Food and Drug Administration defines any edible product with 2.5 g of fiber per serving as a “good” fiber source 38 ; it does not distinguish natural dietary fibers from added functional fibers.
In an effort to meet dietary fiber goals, persons often consume functional fibers in the form of high-fiber ultra-processed foods. Although evidence is lacking to show that functional fibers are beneficial, 31 there is evidence that consuming functional fibers can lead to gastrointestinal distress and malabsorption of other nutrients. 31 Physicians should steer patients toward whole foods that are naturally high in dietary fiber (e.g., fruits, vegetables, whole grains, nuts), for which there is good evidence of health benefits, 39 – 41 and away from ultraprocessed products with added functional fibers. 31
3,500 CALORIES TRANSLATES TO 1 LB OF BODY WEIGHT
Patients who want to lose weight may ask their physicians how many fewer calories they need to eat or how many more they need to burn to lose weight. The prevailing belief is that a net deficit of 3,500 calories (i.e., 3,500 calories burned in excess of calories ingested) will yield a body weight reduction of 1 lb (0.45 kg). This “3,500 calorie rule” is oversimplified and does not take into account the dynamic, nonlinear response of body weight to sustained changes in calorie balance. 42 When individuals lose weight, compensatory mechanisms work to prevent further weight loss and promote regain. 43 , 44
The 3,500 calorie rule would predict that an individual underconsuming 100 net calories per day would lose more than 50 lb (22.7 kg) over five years. More accurate weight loss estimates, which take into account dynamic and compensatory changes, would predict a decrease of only about 10 lb. 43 Therefore, relying on the 3,500 calorie assumption may create false expectations for patients and set them up for failure and disappointment.
A better rule of thumb for adults is that a maintained deficit of 100 calories per day without any other changes will lead to an eventual weight loss of about 10 lb; it will take about one year to achieve 50% and about three years to achieve 95% of the total weight loss. 45 Physicians who want to help patients predict weight loss can use the National Institutes of Health's body weight simulator, which is available at http://www.niddk.nih.gov/research-funding/at-niddk/labs-branches/LBM/integrative-physiology-section/body-weight-simulator/Pages/body-weight-simulator.aspx . Recommendations to avoid processed foods and consume whole foods might help patients meet their overall caloric goals.
Healthy Dietary Advice
The selected myths described in this article are characterized by dietary reductionism, which emphasizes food constituents instead of foods in their entirety. Although much nutritional science is based on evaluating the benefits or harms of food constituents such as micronutrients, macronutrients, non-nutrients, and energy, patients eat foods, not food constituents. 46 If patients consume ultraprocessed foods that are altered, for instance, to add calcium and fiber and to remove saturated fat and calories, they will not necessarily be healthier, as the myths discussed in this article suggest.
There have been no long-term head-to-head studies to guide clinicians in recommending specific whole foods over others to patients. However, various diets (e.g., low-carbohydrate, low-fat, low-glycemic, Mediterranean, mixed/balanced, Paleolithic) have been shown to improve weight; surrogate end points; or chronic disease incidence, prevalence, or severity in various trials and cohort studies. 1 , 47 , 48 None of these diet plans have been shown to be superior to the others, and they all share common features and a consistent theme: limit ultraprocessed foods and eat whole foods (or minimally processed foods), generally in a form that is as close to what occurs in nature as possible. 1 Within this theme for healthy eating, there is room for variation, such as the inclusion or exclusion of meats, other animal products, or certain grains.
Although many believe that whole or minimally processed foods are expensive, studies have shown that healthy whole foods can be cheaper than ultraprocessed foods. 49 – 51 Table 1 provides examples of ultraprocessed foods and whole food alternatives. Family physicians can help their patients achieve healthy dietary changes using the simple advice to eat more whole foods and avoid ultraprocessed foods, advice highly consistent with the 2015 Dietary Guidelines Advisory Committee recommendations. 52
Data Sources : We searched Dynamed, the Cochrane database, Essential Evidence Plus, and the U.S. Preventive Services Task Force website using various search terms including calcium, fiber, dietary prevention, obesity, and weight loss. We searched PubMed using Clinical Queries and the search terms milk, dairy, calcium, osteoporosis, dietary fat, obesity, saturated fats, cardiovascular disease, fiber, and functional fiber. Searches prioritized systematic reviews. We also searched PubMed using the same terms outside of Clinical Queries, but using filters to focus on only meta-analyses and reviews. Search date: August 28, 2014.
Katz DL, Meller S. Can we say what diet is best for health?. Annu Rev Public Health. 2014;35:83-103.
Hegsted DM. Calcium and osteoporosis. J Nutr. 1986;116(11):2316-2319.
Winzenberg TM, Shaw K, Fryer J, Jones G. Calcium supplementation for improving bone mineral density in children. Cochrane Database Syst Rev. 2006;2:CD005119.
Avenell A, Mak JC, O'Connell D. Vitamin D and vitamin D analogues for preventing fractures in post-menopausal women and older men. Cochrane Database Syst Rev. 2014;4:CD000227.
Moyer VA. Vitamin D and calcium supplementation to prevent fractures in adults: U.S. Preventive Services Task Force recommendation statement. Ann Intern Med. 2013;158(9):691-696.
Curhan GC, Willett WC, Speizer FE, et al. Comparison of dietary calcium with supplemental calcium and other nutrients as factors affecting the risk for kidney stones in women. Ann Intern Med. 1997;126(7):497-504.
Bolland MJ, Avenell A, Baron JA, et al. Effect of calcium supplements on risk of myocardial infarction and cardiovascular events: meta-analysis. BMJ. 2010;341:c3691.
Bolland MJ, Grey A, Avenell A, et al. Calcium supplements with or without vitamin D and risk of cardiovascular events. BMJ. 2011;342:d2040.
Mao PJ, Zhang C, Tang L, et al. Effect of calcium or vitamin D supplementation on vascular outcomes. Int J Cardiol. 2013;169(2):106-111.
Bischoff-Ferrari HA, Dawson-Hughes B, Baron JA, et al. Calcium intake and hip fracture risk in men and women: a meta-analysis of prospective cohort studies and randomized controlled trials. Am J Clin Nutr. 2007;86(6):1780-1790.
Weinsier RL, Krumdieck CL. Dairy foods and bone health: examination of the evidence. Am J Clin Nutr. 2000;72(3):681-689.
Feskanich D, Bischoff-Ferrari HA, Frazier AL, Willett WC. Milk consumption during teenage years and risk of hip fractures in older adults. JAMA Pediatr. 2014;168(1):54-60.
Hite AH, Feinman RD, Guzman GE, Satin M, Schoenfeld PA, Wood RJ. In the face of contradictory evidence: report of the Dietary Guidelines for Americans Committee. Nutrition. 2010;26(10):915-924.
Buse JB, Ginsberg HN, Bakris GL, et al. Primary prevention of cardiovascular diseases in people with diabetes mellitus: a scientific statement from the American Heart Association and the American Diabetes Association. Circulation. 2007;115(1):114-126.
Tan SY, Mattes RD. Appetitive, dietary and health effects of almonds consumed with meals or as snacks. Eur J Clin Nutr. 2013;67(11):1205-1214.
Tan SY, Dhillon J, Mattes RD. A review of the effects of nuts on appetite, food intake, metabolism, and body weight. Am J Clin Nutr. 2014;100(suppl 1):412S-422S.
Hession M, Rolland C, Kulkarni U, Wise A, Broom J. Systematic review of randomized controlled trials of low-carbohydrate vs. low-fat/low-calorie diets in the management of obesity and its comorbidities. Obes Rev. 2009;10(1):36-50.
Hu T, Mills KT, Yao L, et al. Effects of low-carbohydrate diets versus low-fat diets on metabolic risk factors: a meta-analysis of randomized controlled clinical trials. Am J Epidemiol. 2012;176(suppl 7):S44-S54.
Dutton GR, Laitner MH, Perri MG. Lifestyle interventions for cardiovascular disease risk reduction. Curr Atheroscler Rep. 2014;16(10):442.
Johnston BC, Kanters S, Bandayrel K, et al. Comparison of weight loss among named diet programs in overweight and obese adults: a meta-analysis. JAMA. 2014;312(9):923-933.
Chait A, Brunzell JD, Denke MA, et al.; Report of the Nutrition Committee. Rationale of the diet-heart statement of the American Heart Association. Circulation. 1993;88(6):3008-3029.
Kratz M, Baars T, Guyenet S. The relationship between high-fat dairy consumption and obesity, cardiovascular, and metabolic disease. Eur J Nutr. 2013;52(1):1-24.
Siri-Tarino PW, Sun Q, Hu FB, Krauss RM. Meta-analysis of prospective cohort studies evaluating the association of saturated fat with cardiovascular disease. Am J Clin Nutr. 2010;91(3):535-546.
Chowdhury R, Warnakula S, Kunutsor S, et al. Association of dietary, circulating, and supplement fatty acids with coronary risk: a systematic review and meta-analysis. Ann Intern Med. 2014;160(6):398-406.
Rice BH, Quann EE, Miller GD. Meeting and exceeding dairy recommendations: effects of dairy consumption on nutrient intakes and risk of chronic disease. Nutr Rev. 2013;71(4):209-223.
O'Sullivan TA, Hafekost K, Mitrou F, Lawrence D. Food sources of saturated fat and the association with mortality: a meta-analysis. Am J Public Health. 2013;103(9):e31-e42.
de Oliveira Otto MC, Mozaffarian D, Kromhout D, et al. Dietary intake of saturated fat by food source and incident cardiovascular disease. Am J Clin Nutr. 2012;96(2):397-404.
Aune D, Norat T, Romundstad P, Vatten LJ. Dairy products and the risk of type 2 diabetes. Am J Clin Nutr. 2013;98(4):1066-1083.
Hooper L, Summerbell CD, Thompson R, et al. Reduced or modified dietary fat for preventing cardiovascular disease. Cochrane Database Syst Rev. 2012;5:CD002137.
Siri-Tarino PW, Sun Q, Hu FB, Krauss RM. Saturated fatty acids and risk of coronary heart disease: modulation by replacement nutrients. Curr Atheroscler Rep. 2010;12(6):384-390.
Institute of Medicine. Dietary Reference Intakes for Energy, Carbohydrate, Fiber, Fat, Fatty Acids, Cholesterol, Protein and Amino Acids . Washington, DC: National Academies Press; 2005.
Threapleton DE, Greenwood DC, Evans CE, et al. Dietary fibre intake and risk of cardiovascular disease: systematic review and meta-analysis. BMJ. 2013;347:f6879.
Yao B, Fang H, Xu W, et al. Dietary fiber intake and risk of type 2 diabetes. Eur J Epidemiol. 2014;29(2):79-88.
Coleman HG, Murray LJ, Hicks B, et al. Dietary fiber and the risk of precancerous lesions and cancer of the esophagus: a systematic review and meta-analysis. Nutr Rev. 2013;71(7):474-482.
Yang J, Wang HP, Zhou L, Xu CF. Effect of dietary fiber on constipation: a meta analysis. World J Gastroenterol. 2012;18(48):7378-7383.
Aune D, Chan DS, Greenwood DC, et al. Dietary fiber and breast cancer risk. Ann Oncol. 2012;23(6):1394-1402.
Dahm CC, Keogh RH, Spencer EA, et al. Dietary fiber and colorectal cancer risk. J Natl Cancer Inst. 2010;102(9):614-626.
Hiza H, Fungwe T, Bente L. Trends in Dietary Fiber in the U.S. Food Supply . Alexandria, Va.: U.S. Dept. of Agriculture; 2007.
Bellavia A, Larsson SC, Bottai M, Wolk A, Orsini N. Fruit and vegetable consumption and all-cause mortality. Am J Clin Nutr. 2013;98(2):454-459.
Jacobs DR, Pereira MA, Meyer KA, Kushi LH. Fiber from whole grains, but not refined grains, is inversely associated with all-cause mortality in older women: the Iowa Women's Health Study. J Am Coll Nutr. 2000;19(suppl 3):326S-330S.
Bao Y, Han J, Hu FB, et al. Association of nut consumption with total and cause-specific mortality. N Engl J Med. 2013;369(21):2001-2011.
Thomas DM, Martin CK, Lettieri S, et al. Can a weight loss of one pound a week be achieved with a 3500-kcal deficit? Commentary on a commonly accepted rule. Int J Obes (Lond). 2013;37(12):1611-1613.
Leibel RL, Rosenbaum M, Hirsch J. Changes in energy expenditure resulting from altered body weight. N Engl J Med. 1995;332(10):621-628.
Hall KD, Hammond RA, Rahmandad H. Dynamic interplay among homeostatic, hedonic, and cognitive feedback circuits regulating body weight. Am J Public Health. 2014;104(7):1169-1175.
Hall KD, Sacks G, Chandramohan D, et al. Quantification of the effect of energy imbalance on bodyweight. Lancet. 2011;378(9793):826-837.
Lucan SC. Patients eat food, not food categories or constituents. Am Fam Physician. 2011;83(2):107-108.
Fung TT, Chiuve SE, McCullough ML, Rexrode KM, Logroscino G, Hu FB. Adherence to a DASH-style diet and risk of coronary heart disease and stroke in women [published correction appears in Arch Intern Med . 2008;168(12):1276]. Arch Intern Med. 2008;168(7):713-720.
Shai I, Schwarzfuchs D, Henkin Y, et al.; Dietary Intervention Randomized Controlled Trial (DIRECT) Group. Weight loss with a low-carbohydrate, Mediterranean, or low-fat diet [published correction appears in N Engl J Med . 2009;361(27):2681]. N Engl J Med. 2008;359(3):229-241.
Reed J. How Much Do Americans Pay for Fruits and Vegetables? Washington, DC: USDA Economic Research Serv.; 2004.
Katz DL, Doughty K, Njike V, et al. A cost comparison of more and less nutritious food choices in US supermarkets. Public Health Nutr. 2011;14(9):1693-1699.
McDermott AJ, Stephens MB. Cost of eating: whole foods versus convenience foods in a low-income model. Fam Med. 2010;42(4):280-284.
Scientific report of the 2015 Dietary Guidelines Advisory Committee. Office of Disease Prevention and Health Promotion. http://health.gov/dietaryguidelines/2015-scientific-report/ . Accessed March 9, 2015.
Continue Reading

More in AFP
More in pubmed.
Copyright © 2015 by the American Academy of Family Physicians.
This content is owned by the AAFP. A person viewing it online may make one printout of the material and may use that printout only for his or her personal, non-commercial reference. This material may not otherwise be downloaded, copied, printed, stored, transmitted or reproduced in any medium, whether now known or later invented, except as authorized in writing by the AAFP. See permissions for copyright questions and/or permission requests.
Copyright © 2024 American Academy of Family Physicians. All Rights Reserved.
Find your term of interest with our live search
The 24-hour recall is a structured interview. It collects a list of all foods and drinks consumed during the previous day or the preceding 24 hours. Although computer-based 24-hour-recalls are available, they are typically face-to-face interviews. The interviewer must be trained to remain neutral and not ask leading questions. Read more
Added sugar
The term added sugars refers to sugars and syrups added to foods and drinks during processing and preparation (World Cancer Research Fund, 2015). Read more
Adequate Intake
The Adequate Intake (AI) is the average observed or experimentally determined approximation or estimate of nutrient intake of a population group (or groups) of apparently healthy people that is assumed to be adequate. Adequate intake is the value estimated when a Population Reference Intake (PRI) cannot be established because an Average Requirement (AR) cannot be determined (EFSA, 2017). Read more
A peptide derived from the amyloid precursor protein, commonly found in the central nervous system. Abnormal levels of amyloid-𝛽 can aggregate between neurons, disrupting their function. Amyloid-𝛽 plaques are among the earliest pathological signs of Alzheimer’s disease.
Android Obesity (Central Obesity)
More fat accumulation around the torso, with accompanying visceral fat. Less subcutaneous fat and limb fat. Colloquially described as 'apple-shaped'.
A risk gene associated with an increased likelihood of developing Alzheimer’s disease. The presence of more APOE4 copies elevates the risk and may lead to an earlier onset of the disease. However, it's important to note that having APOE4 does not guarantee the development of Alzheimer’s disease.
Arteriolosclerosis
Thickening of the blood vessel walls. Often occurs in the blood vessels of the brain independent of plaque buildup.
Arteriosclerosis
Hardening of the arteries caused by atherosclerosis.
Association
Association is a very general relationship. One variable provides information about another. But it doesn't prove causation. Read more
Atherosclerosis
The process of hardening and thickening of artery walls by the accumulation of fatty plaque.
Autoimmune Condition
A malfunction of the immune system whereby an inflammatory response mistakes the body’s own tissues for a foreign invader and attacks them. Read more
Average Requirement (AR)
The Average Requirement (AR) is the level of (nutrient) intake estimated to satisfy the physiological requirement or metabolic demand, as defined by the specified criterion for adequacy of that nutrient, for half of the people in a population group, given a normal distribution of requirement (EFSA, 2017). Read more
Baroreceptor
Baroreceptors are rapid pressure receptors within vessels that send signals to the brain which modifies cardiac output and vascular tone. They are located in the aortic arch and carotid sinus. They are sensitive to pressure and stretching. Read more
Bias is a systematic error that distorts the true association between different variables. Systematic errors are consistent and reproducible. It blurs the actual value of what’s being measured. There are many types of biases. Read more
Big Food refers to multinational food and beverage companies with vast and concentrated market power. Read more
Body Mass Index (BMI)
Population measure of fatness. BMI = weight (kg) ÷ height (m2).
Bottom-up approach
A bottom-up approach equals a reductionist approach. It studies the effects of isolated elements in food. See also the reductionist approach. Read more
Calorie density
The number of calories in a given weight of food. Low calorie density foods have fewer calories per kilogram than high calorie density foods.
Cardiac output (CO)
The amount of blood that is pumped through the body in 1 minute. Cardiac output = Stroke volume x Heart rate (CO = SV x HR).
Causation means that a change in one variable causes a change in another variable. There’s a cause-effect relationship between the two variables. In other words, the variables change together due to a direct or indirect causal link. Read more
Circadian rhythm
Circadian rhythms are 24-hour cycles that exist in all types of organisms. The term circadian comes from the Latin circa, meaning “around”, and diem, meaning “day.” Almost every cell contains one of these 24-hour clocks called circadian clocks. These clocks optimize biological functions. Every function in the body has a specific time because the body can’t do all it needs to at once. They interact with the timing of light and food. Read more
Comorbidities
Comorbidity occurs when a person has more than one disease or condition at the same time. Conditions described as comorbidities are often chronic or long-term conditions. Other names to describe comorbid conditions are coexisting or co-occurring conditions and sometimes “multimorbidity” or “multiple chronic conditions.” Comorbidities are often non-communicable diseases.
Confirmation bias
Confirmation bias is an error in thinking. Our brains tend to pick information that supports our pre-existing beliefs. As a result, we tend to ignore any information that contradicts those beliefs. This leads to faster decision-making. Read more
Confounders
A confounding variable influences a potential cause-effect relationship. It’s an unmeasured factor. It is independently associated with the exposure and outcome. Left unchecked, confounding variables can introduce many research biases. It causes you to misinterpret your results. Read more
Contrast in exposure
It’s the comparison between the defined high vs low doses and exposures. Two servings per week of red meat vs none, for example. Read more
Corporate sponsorship
It’s a form of marketing. A company could support a person or an organisation by giving them money. The sponsor gets recognition in exchange for funding the project or program. Read more
Correlation
Correlations are more specific than associations. They refer to a statistical and linear association between two random variables. For a positive correlation, the two variables increase at the same time and similarly. For a negative correlation, it’s vice versa. Read more
DALY (Disability Adjusted Life Years)
One DALY (Disability Adjusted Life Years) represents the loss of the equivalent of one year of full health. DALYs for a disease or health condition are the sum of the years of life lost due to premature mortality (YLLs) and the years lived with a disability (YLDs) due to prevalent cases of the disease or health condition in a population. Read more
The DASH Diet (Dietary Approach to Stop Hypertension) focuses on vegetables, fruits and whole grains. It includes fat-free or low-fat dairy products, fish, poultry, beans and nuts. The diet limits foods that are high in salt, also called sodium. It also limits added sugar and saturated fat, such as in fatty meats and full-fat dairy products (Mayo Clinic). Read more
Determinants of health
The range of personal, social, economic and environmental factors that determine the healthy life expectancy of individuals and populations. Read more
The phase of the heartbeat when the heart muscle relaxes and allows the chambers to fill with blood.
Dietary assessment
A dietary assessment gathers information on what a patient eats and drinks in a given period. The data is then usually converted using food databases to calculate intakes of energy, nutrients, and other dietary components. Read more
Dietary pattern
A dietary pattern represents the quantity, variety, and combination of foods and drinks. It also captures how often they are usually eaten. Read more
Dietary Reference Intakes (DRIs)
The term Dietary Reference Intakes (DRIs) are used in the US. At PAN we refer to the European Food Safety Authority (EFSA), which uses the term Dietary References Values (DRVs).
Dietary Reference Values (DRVs)
Dietary Reference Values (DRVs) are an umbrella term for a set of nutrient reference values that includes the Average Requirement (AR), the Population Reference Intake (PRI), the Adequate Intake (AI), the Reference Intake range for macronutrients (RI), and the Tolerable Upper Intake Level (UL), which indicate the amount of an individual nutrient that people need for good health depending on their age and gender (EFSA, 2017). Read more
Digestible Indispensable Amino Acid Score (DIAAS)
The Digestibile Indispensible Amino Acid Score is used to assess the quality of a protein source. DIAAS takes into account the digestibility of amino acids more accurately than the previous Protein Digestibility Corrected Amino Acid Score (PDCAAS) (FAO, 2011). Read more
Disease-modifying antirheumatic drugs (DMARD)
DMARDs are Disease-modifying antirheumatic drugs. These include anti-TNF𝛼 and immunosuppressive agents. Read more
Double-blinding
Double-blinding means that the subject and the researcher performing the experiment are blinded. They both don’t know the subject’s group assignment. Double-blinding can reduce the risk of bias. Read more
The loss of harmony and balance within the gut microbiome caused by an imbalance between beneficial and harmful bacteria.
Dyslipidaemia
Blood levels of circulating cholesterol and triglycerides above the normal range.
Ectopic fat
Fat accumulation in non-adipose tissues such as muscle and organ tissue.
Effect size
Effect size tells you how meaningful the relationship between variables is. Or it measures the difference between treatment groups. The larger the effect size, the more significant the treatment effect. A significant effect size means that a research finding has practical significance. In contrast, a small effect size indicates limited practical applications. Read more
Empowerment
In health promotion, empowerment is a process through which people gain greater control over decisions and actions affecting their health. Read more
Essential nutrients
Essential nutrients are compounds, which are required for growth, reproduction and good health. The human organism is not able to synthesize these compounds, therefore, an adequate intake of those nutrients is required from external sources, such as diet. Read more
Evidence-based practice (EBP)
Evidence-based practice (EBP) is using the best available evidence for decision-making. It’s a process used to review, analyse, and translate the latest scientific evidence. It’s about providing efficient and effective care for patients on a scientific basis. Read more
External validity
External validity is the extent to which you can apply the study results to other contexts. See also validity. Read more
Fibre (fibre in US spelling) can be specified as complex carbohydrate polymers (3-10 polymers) and lignin, which are resistant to digestion by endogenous enzymes and thus are not absorbed in the small intestine of humans (FAO/WHO, 2009). Read more
The accumulation of extracellular matrix proteins (e.g. collagen, elastin, fibrin, fibronectin, and proteoglycans) causing thickening and scarring of tissue. This can occur in organs and blood vessels.
Food balance sheet
Food balance sheets (FBS) portray a country’s food supply and use pattern over time. They are essential for measuring global food security. They are helpful for international comparison and analysis of trends over time; as they are standardized and updated. Read more
Food Frequency Questionnaire (FFQ)
Food Frequency Questionnaires (FFQs) include food items and ask about the intake frequencies. How often do you drink coffee or tea per week or month? And what’s the average serving per day? FFQs may include more questions on cooking methods or adding salt, oils, herbs, and spices. Depending on how an FFQ is designed, it can consist of 50 to 150 food items. Read more
Food record / Food diary
Food diaries can be divided into weighed and estimated diaries. Weighed food diaries are the gold standard in clinical nutrition studies. Every serving size, including any leftovers, is weighed. In an estimated food diary, yet, the serving sizes are estimated using household utensils or food photos. Read more
Food synergy
Aristotle said, “The whole is greater than the sum of its parts”. It’s the synergy’s essential meaning. Likewise, isolated nutrients are less effective in protecting us against various diseases than whole foods containing those nutrients. Foods are complex mixtures of thousands of complementing nutrients. So, the food they come from, or the food combinations, impact our health and well-being. Read more
Free sugars
Free sugars refer both to added sugars, like sucrose or table sugar, and sugars naturally present in honey, syrups, fruit juices and fruit concentrates. Most free sugars consumed are added to foods and drinks. Free sugars do not include sugar that is naturally built into the structure of foods or to sugars naturally present in milk and milk products (World Cancer Research Fund, 2015). Read more
Various brain cells that provide support, nourish, and protect neurons. Common types include astrocytes, microglia, and oligodendrocytes. Read more
Glucose Homeostasis
The balanced actions of glucagon and insulin to maintain blood glucose levels within normal range.
GLUT4 Transporter
Is the most abundant glucose transporter (GLUT) isoform in skeletal muscle and adipose tissue. It is responsible for insulin stimulated glucose uptake (Chadt and Al-Hasani, 2020). Read more
Glycaemic index (GI)
The glycaemic index assigns a score to a food, based on its ability to raise blood sugar levels. Foods ranked on a scale from 0 to 100. However, using glycaemic index as indicator for carbohydrate quality has its limitations. (FAO/WHO, 2007). Read more
Glycaemic load
The glycaemic load assigns a score to a food, based on its ability to raise blood sugar levels, but takes into consideration how much glucose per serving the particular food can deliver. The glycaemic load also has its limitations when assessing carbohydrate quality (FAO/WHO, 2007). Read more
Grey matter
Brain tissue composed of neuronal cell bodies and dendrites. Grey matter is crucial for signal processing in the brain.
Gynoid Obesity
More subcutaneous and limb fat, with less visceral and torso fat. Colloquially described as 'pear-shaped'.
Hard clinical endpoints
A hard endpoint is an endpoint that is well-defined and can be measured objectively. Hard endpoints in hypertension trials include death, stroke, and myocardial infarction. Read more
Haemoglobin A1c is also known as glycated haemoglobin. Red blood cells have a lifespan of approximately 120 days. Thus, HbA1c reflects blood glucose levels over the preceding 3 months. Diabetes is defined as having a HbA1c ≥ 6.5% and pre-diabetes between 5.7-6.4%. Normal HbA1c is ≤ 5.6%. Read more
A state of complete physical, social and mental well-being, and not merely the absence of disease or infirmity (WHO,2021).
Health Claims
A health claim is any statement on labels, advertising, or other marketing products. It states consuming given food can result in health benefits. For instance, consuming certain food can enhance learning ability. Read more
Healthy diet
- At least 400 g (i.e. five portions) of fruits and vegetables per day
- Legumes (e.g. lentils and beans), nuts and whole grains (e.g. unprocessed maize, millet, oats, wheat and brown rice)
- Less than 10%, preferably <5% of total energy intake from free sugars
- Less than 30% of total energy intake from fats, less than 1% of total energy intake from trans fats
- Less than 5 g of salt
Heart rate (HR)
The number of times the heart muscle contracts and relaxes in 1 minute. Also called the pulse.
Hyperplasia
The enlargement of an organ or tissue caused by an increasing number of cells. In the case of obesity, hyperplasia relates to an increase in the number of fat cells.
Hypertension
Blood pressure over 130 mmHg (systolic) and 80 mmHg (diastolic) in the USA. Blood pressure over 140 mmHg (systolic) and 90 mmHg (diastolic ) in Europe. Read more
Hypertrophy
Cell growth. In blood vessels, vascular hypertrophy results in the thickening of the arterial tunica media. In adipose tissue, hypertrophy results in abnormally large fat cells. Hypertrophy also occurs in skeletal and cardiac muscles.
Incidence is a rate. It refers to the number of new cases that develop during a specified time interval, like a month or year. Cases are study participants who have developed any outcome of interest, like high blood pressure (compare with Prevalence as they are often confused). Read more
Information bias
Information bias occurs during data collection. It relates to systematic errors in how a variable is measured. For example, if a diagnostic test classifies exposed subjects as non-exposed. Read more
Internal validity
Internal validity describes how reliable and trustworthy the established cause-and-effect relationship is. See also validity. Read more
Interviewer bias
Interviewer bias is the tendency of the interviewer to get preconceived answers. They may ask leading questions systematically influence the interviewee’s response. Read more
Ketogenic diet
A ketogenic diet primarily consists of high fats, moderate proteins, and very low carbohydrates. The dietary macronutrients are divided into approximately 55% to 60% fat, 30% to 35% protein, and 5% to 10% carbohydrates. Read more
Lifestyle medicine
Lifestyle Medicine is the use of evidence-based lifestyle therapeutic intervention—including a whole-food, plant-predominant eating pattern, regular physical activity, restorative sleep, stress management, avoidance of risky substances and positive social connection—as a primary modality, delivered by clinicians trained and certified in this speciality, to prevent, treat and often reverse chronic disease. Read more
Macronutrients
Macronutrients provide energy and are required in large amounts to maintain body functions and essential processes. Macronutrients include carbohydrates, fat, protein and water (WHO). Read more
Macrophages
Macrophages are specialised cells involved in the detection, phagocytosis and destruction of bacteria and other harmful organisms. In addition, they can also present antigens to T cells and initiate inflammation by releasing molecules (known as cytokines) that activate other cells. Read more
Malnutrition
- undernutrition, which includes wasting (low weight-for-height), stunting (low height-for-age) and underweight (low weight-for-age)
- micronutrient-related malnutrition, which includes micronutrient deficiencies (a lack of important vitamins and minerals) or micronutrient excess
- overweight, obesity and diet-related noncommunicable diseases (WHO, 2021)
Matching is a way to control for confounders at the study design stage. It’s only used in case-control studies. Each subject in the treatment group has one counterpart in the control group. The matched subjects have the same values on any potential confounder. For example, they both match in age or smoking status. Read more
Mediterranean diet
A traditional Mediterranean diet is predominantly vegetarian. It’s high in diverse whole plant foods, including fruits, vegetables, whole grains, legumes, nuts, and seeds. Read more
Metabolic healthy obesity
Obesity lacking metabolic abnormalities or evidence of cardiovascular or lifestyle disease progression.
Micronutrients
Micronutrients are consumed in small quantities but are essential to body processes. Micronutrients include vitamins (water and fat soluble) and minerals (bulk and trace elements) (WHO). Read more
Misreporting
Misreporting means giving an incorrect report of dietary intake. One differentiates between intentional and unintentional misreporting. For example, unintentional misreporting happens when snacks or calorie-containing beverages are forgotten. Intentional misreporting relates to how we perceive foods. We tend to over-report perceived good foods like fruits and vegetables. But tend to underreport perceived bad foods, like things high in fat or sugar. Read more
A protective layer of fat that insulates axons, gives white matter its colour, and accelerates signal transmission in the brain.
Necrosis is the medical term for the death of body tissue. Necrosis can occur because of illness, infection, injury, disease or lack of blood flow to your tissues.
Nitric oxide
Signalling molecule that regulates blood flow (via vasodilation), and tissue oxygenation.
Non- to minimally processed foods
Unprocessed (or natural) foods are the edible parts of plants (such as fruit, leaves, stems, seeds, roots) or from animals (such as muscle, offal, eggs, milk), and also fungi, algae and water, after separation from nature. Minimally processed foods are natural foods altered by methods that include removal of inedible or unwanted parts, and also processes that include drying, crushing, grinding, powdering, fractioning, filtering, roasting, boiling, non-alcoholic fermentation, pasteurization, chilling, freezing, placing in containers, and vacuum packaging. The distinction between unprocessed and minimally processed foods is not especially significant (FAO, 2019). Read more
Noncommunicable diseases
Noncommunicable diseases (NCDs), also known as chronic diseases, are a set of diseases that are the result of a combination of genetic, physiological, environmental and behavioural factors. NCDs are cardiovascular diseases (e.g. heart attacks and stroke), cancers, chronic respiratory diseases (e.g. asthma) and diabetes (WHO, 2021). Read more
Nutrient deficiency
Nutrient deficiency is also known as micronutrient deficiency, which describes the inadequate intake of a certain vitamin or mineral (e.g. vitamin A, iron) (WHO, 2021). Read more
Odds ratio (OR)
The odds ratio (OR) measures the association between an exposure and an outcome. It’s the odds that an outcome will occur in the exposed group divided by the odds of it happening in the non-exposed group. When there is no association between exposure and outcome, the OR is 1.0. Read more
A person who eats animal products, seafood, dairy and plant foods.
A low-carbohydrate, nutrient-dense whole fresh food diet. It includes fresh lean meats, fish, eggs, nuts, seeds, fruits and most vegetables. It excludes dairy, grains, sugars and most processed foods in general. Read more
Phytochemicals
Phytochemicals is an umbrella term, for a collection of compounds present in plants, including sulfur-containing compounds, nitrogen-containing compounds, carotenoids, polyphenols and tannins among others (Frank et al., 2020). Read more
Planetary health
Planetary health describes the achievement of the highest attainable standard of health, well-being and equity worldwide through judicious attention to the human systems (political, economic and social) that shape the future of humanity, and the Earth’s natural systems that define the safe environmental limits within which humanity can flourish (WHO, 2021). Read more
Plant-based diet
A plant-based diet consists of a diverse range of dietary patterns that emphasize foods derived from plant sources coupled with lower consumption or exclusion of animal products. Vegetarian diets form a subset of plant-based diets, which may exclude the consumption of some or all forms of animal foods. (WHO, 2021). See also Whole food, plant-based. Read more
Population Reference Intake (PRI)
The Population Reference Intake (PRI) describes the level of nutrient intake that is adequate for virtually all people in a population group (EFSA, 2017). Read more
Prevalence is the total number of disease cases in a population at a specific time. It’s usually expressed as a percentage of the population. It is not defined by a time interval, so it’s not a rate (compare with Incidence as they are often confused). Read more
Processed foods
Processed foods are defined according to NOVA classification. They include canned or bottled vegetables or legumes (pulses) preserved in brine; whole fruit preserved in syrup; tinned fish preserved in oil; some types of processed animal foods such as ham, bacon, pastrami, and smoked fish; most freshly baked breads; and simple cheeses to which salt is added (FAO, 2019). Read more
Processed meat
Processed meat is transformed through salting, curing, fermentation or smoking. These processes enhance flavour or improve preservation. Examples include hot dogs, ham, sausages, and canned meat and meat-based preparations. Read more
Prostaglandins
A group of lipids with hormone-like actions that the body makes at sites of tissue damage or infection. There are several different types of prostaglandins. In the blood vessels, they exhibit vasodilatory effects.
Protein Digestibility Corrected Amino Acid Score (PDCAAS)
The Protein Digestibility Corrected Amino Acid Score (PDCAAS) is a method for evaluating protein quality. The PDCAAS has its limitations which is why FAO recommends to use the Digestible Indispensable Amino Acid Score (DIAAS) (FAO, 2013). Read more
Publication bias
Publication bias occurs when unfavourable information or negative results are withheld. It’s when the published studies don’t represent all studies undertaken in a given field. It’s a distortion in favour of the investigator. Read more
Randomization
Randomization allows you to control for all potential confounders. Subjects are randomly allocated to the treatment and control groups. Read more
Reactive Oxygen Species (ROS)
Compounds formed by the reduction of oxygen by the addition of electrons. ROS are damaging to cells and an imbalance toward the pro-oxidative state is often referred to as oxidative stress.
Reactivity / Observer effect
Werner Heisenberg postulated that each observation changes the observed reality. In other words, observing means intervention, also when observing oneself. Reactivity happens if someone alters their eating behaviour while reporting, for example. They may want to simplify the reporting process. They may want to avoid criticism from the observer, or they become more mindful when preparing and eating food. Read more
Recall bias
Recall bias results from a vague memory of past exposures. For example, 24-hour diet recalls rely on the interviewee’s memory. Can they recall precisely what they ate during the last 24 hours? Read more
Reductionist approach
Reductionism focuses on single nutrients rather than whole food or food patterns. It has been and continues today as the dominant approach in nutrition research. Yet, foods are more than the sum of their single nutrients. Thus, to understand diet-disease relationships, a more holistic approach is needed. Read more
Relative risks
Relative risk measures the association between exposure and outcome. It compares the risk of developing an outcome if exposed to the risk if unexposed. When there is no association between exposure and outcome, the RR is 1.0. Read more
Research agenda
The research agenda is the initial step in conducting research. It includes framing the research question and defining the study’s purpose. Read more
Response bias
Response bias refers to inaccurate or false answers to a question. Respondents desire to conform to perceived social norms. They want to finish survey questions quickly. Or they wish to perform in line with the research objectives. They might have guessed the aims of the study. Read more
Restriction
In restriction, you only include certain subjects. The study sample has the same values of potential confounding variables. It’s a way to control for confounders at the study design stage. Read more
Scientific hypothesis
The formulation and testing of a hypothesis are part of the scientific method. A scientific hypothesis proposes a tentative explanation of natural phenomena. It must be not only testable by direct experiments, but also falsifiable. So, it must be able to be proved wrong by conducting further experiments. Read more
Scientific method
It is the technique used to construct and test a scientific hypothesis. It involves observing, asking questions, and seeking answers through tests and experiments. It is not unique to any one field of science. Furthermore, it is applied across many areas. Read more
Selection bias
Selection bias comes from any error in selecting the study sample. It can be introduced either during the recruitment of subjects or while ensuring that they remain in the study. Sources of selection bias can be poorly defined inclusion and exclusion criteria. Or if some subjects are more likely to take part or be selected than others. In general, selection bias occurs in any non-random sample of the target population. Read more
Short Chain Fatty Acids (SCFAs)
SCFAs are Short Chain Fatty Acids. Gut microbes ferment or transform certain types of dietary fibre into SCFAs. There are three main types of SCFAs: acetate, propionate, and butyrate. SCFAs are vital for gut health: they repair a leaky gut, correct dysbiosis, regulate glucose homeostasis, and appetite, and reduce inflammation. Read more
Social desirability bias
A type of response bias. It occurs when people respond in a way they think will make them look good, instead of telling the truth. They wish to convey a desirable image or to seek approval. It affects interviews and surveys. For example, when asked about their eating habits, some people might conceal that they eat unhealthy foods. They downplay sugary drinks or fried foods while exaggerating fruits and vegetables. Read more
Stratification
Stratification is a statistical test to minimise the effect of confounding. The subjects are divided into different subgroups of the confounding variable, e.g. sex or age. Then the strength of the association is measured within each subgroup (called stratum). If the stratum-specific rates are uniform, they may be pooled to give a summary estimate. Read more
Stroke volume (SV)
The amount of blood that is pumped in one heartbeat. Stroke volume is a function of cardiac output.
Surrogate endpoints
In clinical trials, an indicator, or sign, is used in place of another to tell if a treatment works. In cancer trials, surrogate endpoints include a shrinking tumour or lower biomarker levels. They may be used instead of more robust indicators, such as more prolonged survival. Surrogate endpoints can be measured sooner. But they are not always accurate indicators of how well a treatment works. Read more
Pressure exerted on the arteries during ventricular contraction.
Tau tangles
Twisted protein tangles that form when tau inside neurons becomes hyperphosphorylated. These tangles cause neuronal damage and are closely linked to cognitive decline.
End points of DNA strands in chromosomes. These shorten as we age, and shorter telomeres than expected indicate more aged cells.
Tolerable Upper Intake Levels (UL)
The Tolerable Upper Intake Levels (UL) represent the maximum average daily intake level of nutrients considered to be unlikely to pose a risk of adverse health effects (EFSA, 2017). Read more
Top-down approach
A top-down approach equals a holistic approach. It’s from the general to the more specific. It studies the effects of dietary patterns rather than single foods or nutrients. Furthermore, it looks at what people usually eat. Read more
Trimethylamine N-oxide (TMAO)
MAO stands for Trimethylamine N-oxide. It’s a small organic compound produced in the gut. Microbes ferment or transform trimethylammonium-containing nutrients like L-carnitine (found in red meat) or certain choline (found in egg yolk and dairy products) into TMAO. TMAO is atherogenic and inflammatory. Read more
Ultra-processed foods
Ultra-processed foods are formulations of ingredients, mostly of exclusive industrial use, typically created by series of industrial techniques and processes (hence ‘ultra-processed’). Some common ultra-processed products are carbonated soft drinks; sweet, fatty or salty packaged snacks; candies (confectionery); mass produced packaged breads and buns, cookies (biscuits), pastries, cakes and cake mixes; margarine and other spreads; sweetened breakfast ‘cereals’ and fruit yoghurt and ‘energy’ drinks; pre-prepared meat, cheese, pasta and pizza dishes; poultry and fish ‘nuggets’ and ‘sticks’; sausages, burgers, hot dogs and other reconstituted meat products; powdered and packaged ‘instant’ soups, noodles and desserts; baby formula; and many other types of product. Ultra-processed foods are defined according to NOVA classification (FAO, 2019). Read more
Validity evaluates the quality of a study. It measures how well the results match established theories and other measures of the same concept. It assesses the extent to which the results measure what they are supposed to measure. The validity of a study is primarily determined by the experimental design. Internal and external validity are two ways of testing cause-and-effect relationships. Read more
Vasoconstriction
Purposeful narrowing of blood vessels to increase blood pressure and reduce flow.
Vasodilation
Purposeful widening of blood vessels to increase flow and lower vascular pressure.
A vegan diet omits all animal products, including meat, dairy, fish, eggs and (usually) honey (WHO, 2021). See also Plant-based diet. Read more
Vegetarian diet
- Lacto-vegetarian diets exclude meat, fish, poultry and eggs, but include dairy products such as milk, cheese, yoghurt and butter.
- Lacto-ovo vegetarian diets include eggs and dairy, but not meat or fish.
- Ovo-vegetarian diets exclude meat, poultry, seafood and dairy products, but allow eggs.
- Pesco-vegetarian (or pescatarian) diets include fish, dairy and eggs, but not meat.
- Semi-vegetarian (or flexitarian) diets are primarily vegetarian but include meat, dairy, eggs, poultry and fish on occasion, or in small quantities (WHO, 2021).
Visceral fat
Central fat accumulation within and around organs.
Waist to height ratio
Predictor of obesity-related cardiovascular disease risk. WtHR = waist circumference ÷ height. A WtHR >0.5 increases the risk. Read more
Well-being is a positive state experienced by individuals and societies. Similar to health, it is a resource for daily life and is determined by social, economic and environmental conditions (WHO, 2021). Read more
Western diet
The Western diet is characterised by preserved and processed foods. It’s high in refined carbohydrates (e.g. white bread, biscuits, added sugars), saturated fats (e.g. meat and dairy) and salt. Read more
White matter
Brain tissue composed of myelinated axons. White matter is crucial for fast and efficient signal transmission in the brain.
Whole food, plant-based (WFPB)
Whole food, plant-based (WFPB) nutrition is an eating pattern emphasising plant foods in their whole form: vegetables, fruits, whole grains, legumes, nuts and seeds. Additives, added sugar and added salt are generally replaced with herbs and spices. For maximal health benefits, this diet excludes or limits animal products and food processing.
Privacy Overview

- school Campus Bookshelves
- menu_book Bookshelves
- perm_media Learning Objects
- login Login
- how_to_reg Request Instructor Account
- hub Instructor Commons
- Download Page (PDF)
- Download Full Book (PDF)
- Periodic Table
- Physics Constants
- Scientific Calculator
- Reference & Cite
- Tools expand_more
- Readability
selected template will load here
This action is not available.
1.2: Preparing for the Experiment
- Last updated
- Save as PDF
- Page ID 33189

- Maria Morrow
- College of the Redwoods via ASCCC Open Educational Resources Initiative
In this experiment, you will be investigating the effects of different nutrient deficiencies. To do this, you will first need to do some background research on the role of different essential nutrients within the plant. Use your background research to develop a question about plant nutrition.
Examples of questions
What is the effect of nutrient deficiency on vertical growth?
What effect did nutrient deficiency have on the biomass?
How does nutrient deficiency differentially affect roots vs. shoots?
Feel free to be creative with your questions!
Next, you’ll need to form a hypothesis about how plants grown in the absence of a particular nutrient will respond. A hypothesis should be a statement that predicts some influence of the independent variable on the dependent variable. Because it includes the dependent variable, your hypothesis should include measurable terms. For example, “plant health” is not measurable, but plant height and biomass are.
Your statement or prediction concerning nutrient deficiency in Brassica rapa is based on what you know about plants, on your observations, from literature we have in lab, or from information you can glean from the internet, books, nursery fertilizer boxes, etc. If the data you collect does not support your hypothesis, it is okay. In fact, that is often the case in science. We are using science to test your hypothesis, not to prove it right. Here is a brief checklist I like to use when making a hypothesis:
Hypothesis checklist :
- It is a statement, not a question
- It does NOT use the phrase "I think..."
- It makes a prediction
- It is falsifiable (it is possible to collect data that proves it incorrect)
- It includes terms that I can measure
- It is specific enough that someone else could read it and know the parameters of the experiment
Next, you will need to decide what data (evidence) you will need to collect to test your hypothesis. Review the description of the experimental design on the following page to get some ideas.
Data collection
During each lab meeting your group will measure/observe at least 5 plant characteristics and record them. These data will then be included in your final written report. Be sure that your data collecting is consistent. Terms like small or large mean very little. However, smaller or larger compared with the control (complete fertilizer) may tell us something about the treatments you are using. Below are some examples of variables you might choose to measure, but do not feel restricted to this list.
Some characteristics that can be observed in comparison with the control and without the use of measuring instruments are basically qualitative :
- Leaf size – use terms like smaller, larger, same size, thicker, thinner
- Leaf appearance – terms might include darker, lighter, rougher, smoother, more hairy
- Leaf number – more, fewer, similar
- Height – taller, shorter
- Form – bushier, more elongated, more squat
- Speed of maturity – faster, slower, similar
- Disease Symptoms/Abnormalities – chlorate (yellowing), pale, spotted, blotched, wilted, curling, rotting, crinkled
Some characteristics that require measuring are basically quantitative :
- Plant Height
- Leaf length
- Amount of fertilizer added/used
- Number of leaves
- Number of flowers
- Final biomass
You can take pictures to aid in cataloguing your results.
Analysis of results
We will discuss in class a few ways to analyze your results. Often obtaining averages for collected data and comparing to the control is an effective method.
If you have any questions, bring them up in class—you are probably not the only one! We will spend some time during each of the following labs making observations and discussing what we see.
Contributors and Attributions
Maria Morrow ( College of the Redwoods )
HYPOTHESIS AND THEORY article
Buffet hypothesis for microbial nutrition at the rhizosphere.

- Centro de Ciencias Genómicas, Universidad Nacional Autónoma de México, Cuernavaca, Mexico
An emphasis is made on the diversity of nutrients that rhizosphere bacteria may encounter derived from roots, soil, decaying organic matter, seeds, or the microbial community. This nutrient diversity may be considered analogous to a buffet and is contrasting to the hypothesis of oligotrophy at the rhizosphere. Different rhizosphere bacteria may have preferences for some substrates and this would allow a complex community to be established at the rhizosphere. To profit from diverse nutrients, root-associated bacteria should have large degrading capabilities and many transporters (seemingly inducible) that may be encoded in a significant proportion of the large genomes that root-associated bacteria have. Rhizosphere microbes may have a tendency to evolve toward generalists. We propose that many genes with unknown function may encode enzymes that participate in degrading diverse rhizosphere substrates. Knowledge of bacterial genes required for nutrition at the rhizosphere will help to make better use of bacteria as plant-growth promoters in agriculture.
Introduction
Ecophysiology of root systems cannot be understood without the microbiota that colonize outside and inside roots. Bacteria and fungi may impact root physiology, produce hormones, stimulate root growth or alter its morphology. Microbes provide protection against pathogens, tolerance to abiotic stresses, resistance to insect or herbivore attack; even allelopathy may be due to root-associated microorganisms. An extensive review on the ecophysiological contributions of microorganisms to plants has been published ( Friesen et al., 2011 ) and reviews on rhizospheric bacteria also highlight their effects on plants ( van Loon et al., 1998 ; Bais et al., 2006 ; de Bruijn, 2013 ). Microbial endophytes (meaning residing inside the roots) may contribute to nutrient assimilation and other plant traits, however, they are normally in lower numbers than rhizospheric bacteria ( Rosenblueth and Martínez-Romero, 2006 ; Hirsch and Mauchline, 2012 ) and we will focus only on the latter. Over the years, studies on root microbiota have addressed several questions such as: How are microbes selected or maintained in roots? What are the sources and resources for root microbes? How do bacteria or fungi affect root physiology? Are there key species that have a larger impact on plants? Is nutrient competition driving bacterial evolution? There are still questions without answer.
The term rhizosphere was proposed by Hiltner (1904) and refers to 1–7 mm of soil from the root surface. The rhizosphere effect is the enrichment of microbial populations at the root–soil interface. Outside roots there is a heavy colonization of bacteria (for example, 10 9 Rhizobium phaseoli cells per gram of fresh maize root; Gutiérrez-Zamora and Martínez-Romero, 2001 ) mainly stimulated by root-derived nutrients. The microbial community itself may modify root nutrients and may contribute with resources by transforming soil material ( Baelum et al., 2008 ), by fixing nitrogen ( Fischer et al., 2012 ) or producing vitamins ( Phillips et al., 1999 ; Ramírez-Puebla et al., 2013 ). Rhizosphere nutrients may be very variable depending on the plant ( Brown et al., 2008 ; Haichar et al., 2008 ; Badri et al., 2013 ) and the soil biotic and abiotic conditions. There are bacterial species commonly encountered as rhizosphere colonizers but each plant species may harbor particular microbes at the rhizosphere ( Lundberg et al., 2012 ). A complex rhizosphere community may be structured in relation to the microbial specialization for different nutrients. The diversity of nutrients available at the rhizosphere may be equated to a buffet, and distinct microbes may have preferences for some of them. Furthermore, we propose that a large proportion of products from genes highly expressed by bacteria at the rhizosphere are involved in the transport and catabolism of the various buffet entries.
Plant-Derived Nutrients at the Rhizosphere
Plants may be considered as a growth media for their microbiota ( Brown et al., 2008 ). Root exudates determine bacterial community structure ( Haichar et al., 2008 ) and rhizodeposits ( Dennis et al., 2010 ) may do the same as well. Root exudates contain a large diversity of molecules (reviewed in Walker et al., 2003 ; Bais et al., 2006 ; Dennis et al., 2010 ; Ramírez-Puebla et al., 2013 ) and around 10,000 types of flavonoids are known from plants ( Ferrer et al., 2008 ). Additionally, arabinogalactan-proteins (AGPs) that have a large proportion of carbohydrates covalently bound to polypeptides are found abundantly in exudates ( Fincher et al., 1983 ). AGPs are considered the most structurally complex molecules in nature ( Majewska-Sawka and Nothnagel, 2000 ).
Exudates and other plant substances may act to select microorganisms ( Walker et al., 2003 ; Shaw et al., 2006 ; Badri and Vivanco, 2009 ; Dennis et al., 2010 ; Berendsen et al., 2012 ) as prebiotics do ( Ramírez-Puebla et al., 2013 ); additionally, just adhesion to plant lignocellulose acts to select bacteria from the soil ( Bulgarelli et al., 2012 ). From root extracts, the phenolic fraction was found to have an important role in conditioning bacterial communities ( Badri et al., 2013 ). Roots have a remarkable ability to synthesize diverse secondary metabolites ( Flores et al., 1999 ) and many complex carbon molecules ( Dennis et al., 2010 ; Mathesius and Watt, 2011 ). Seeds are also a source of nutrients for plant-associated bacteria and some contain large amounts of phytate ( Lott et al., 2000 ). Germinated seedlings provide enough sulfur in root exudates for bacterial growth ( Snoeck et al., 2003 ).
Plants may control bacterial growth with antimicrobials such as phytoalexins ( González-Pasayo and Martínez-Romero, 2000 ; Shaw et al., 2006 ), bacterial-quorum plant-produced mimics ( Bauer and Robinson, 2002 ), or other substances yet unknown. Additionally, plant-derived substances may control bacterial metabolism ( Shaw et al., 2006 ; Hassan and Mathesius, 2012 ), perhaps to the plant own benefit. On roots, bacteria exhibit a differential gene expression that varies depending on the plant ( Ramachandran et al., 2011 ; López-Guerrero et al., 2012 ). The analysis of known bacterial genes expressed in the root or rhizosphere may help us deduce conditions therein. Based on the large numbers of transporters expressed by rhizospheric bacteria ( Ramachandran et al., 2011 ; López-Guerrero et al., 2012 ), we propose that each bacterial species can use a wide range of the nutrients that plants provide from roots.
Root-derived nutrients may be modified by the associated microbiota directly by transforming them to new substances ( Shaw et al., 2006 ) or by inducing changes in plant production of exudates from the interaction with the plant. Symbiosis with microbes and fungi can alter the composition of exudates ( Bais et al., 2006 ; Scheffknecht et al., 2006 ).
Soil-Derived Nutrients
Besides root-derived nutrients, microbes at the rhizosphere may profit from soil-derived substrates. Many soils are substrate rich especially those having high content of organic matter, not even considering man-derived soil contaminants. Soil has perhaps the highest microbial diversity of all habitats. This may be explained by soil structure, diverse soil physical characteristics, differences in pH, minerals, metals, plethora of soil microhabitats but also by an unknown large diversity of natural substances found in soil. Humic acids in soils are very complex and their diverse chemical structure has just started to be determined ( Nebbioso and Piccolo, 2001 ). In the rhizosphere different Amadori compounds ( N -glycosylamines) may be found that form spontaneously from decomposing plant material or by Agrobacterium spp. ( Baek et al., 2003 ).
Soil is not only the depositary of plant and animal decay matter but it is also the residence of fungi, nematodes, protozoa, insects and their products, as well as human-derived recalcitrant substances, all of them constitute an enormous array of potential food for most diverse microbes. Their use would benefit not only microbes but also their plant hosts when making nutrients available. Soil bacteria have major roles in nutrient cycles. Phosphorus solubilizing rhizospheric bacteria promote plant growth ( Rodríguez and Fraga, 1999 ) and microorganisms participate in plant mineral acquisition ( Hinsinger, 1998 ).
Life at the Rhizosphere from a Nutritional Perspective
Different rhizosphere bacteria may have preferences for distinct substrates ( Shaw et al., 2006 ) and this would allow a complex community to be established at the rhizosphere. Different parts of the roots are colonized by different microbes and exudation and rhizodeposition varies qualitatively in different parts of the roots ( Badri and Vivanco, 2009 ; Dennis et al., 2010 ). Some plants may exude more than others ( Dennis et al., 2010 ) and maintain larger microbial populations. Results from a proteomic-based analysis suggested that bacteria may adapt to a new range of nutrients from exudates ( Cordeiro et al., 2013 ).
We documented simultaneous assimilation of different substrates in Rhizobium ( Romanov and Martínez-Romero, 1994 ; Romanov et al., 1994 ). This type of metabolism would be advantageous at the rhizosphere and it has been observed in rhizoremediation ( González-Paredes et al., 2013 ). To nourish on several plant exudated substances at the same time as well as from diverse soil substances could be a characteristic of successful rhizospheric bacteria. Genes encoding enzymes for the utilization of some Amadori compounds that may be found in the rhizosphere are patchily distributed in rhizobia ( Baek et al., 2005 ) indicating that not all bacteria have the same degrading capacities. We have compared rhizospheric bacteria to gut bacteria in the process of digesting and converting food to host usable products ( Ramírez-Puebla et al., 2013 ).
Pseudomonas , Burkholderia , Streptomyces , and rhizobia have high degrading capabilities ( Kontchou and Blondeau, 1992 ; Juhasz et al., 1996 , 2003 ). All may be found associated to roots and their high degrading capacities may be advantageous in rhizospheres. They have also characteristic large genomes (for examples, Bentley et al., 2002 ; Kaneko et al., 2002 ; Paulsen et al., 2005 ; Yan et al., 2008 ; Ormeño-Orrillo et al., 2012 ) that may be in relation to their high degrading capabilities. We suggested that many rhizobial genes of unknown function participate in the catabolism of root, rhizospheric, and soil substances ( Ormeño-Orrillo and Martínez-Romero, 2013 ) and this could apply to other soil and rhizospheric bacteria as well.
Interestingly mutants in single genes involved in nutrient usage at the rhizosphere ( Rosenblueth et al., 1998 ; Ramachandran et al., 2011 ) normally do not have clear phenotypes indicating that there are other substrates available that may be used by bacteria at the rhizosphere.
In modern times, rhizospheric microorganisms are exposed as well to anthropogenic contaminants ( González-Paredes et al., 2013 ). Rhizoremediation takes advantage of the degrading capabilities of rhizospheric microorganisms. Organic matter in soil strongly influences the fate of contaminants ( Li et al., 2011 ).
Concluding Remarks
After considering the large diversity of potential nutrients (from rhizodeposits, root exudates, seeds, decaying organic matter, soil, and the rhizosphere community itself) for microbes at the rhizosphere we propose a hypothesis for bacterial nutrition at the rhizosphere: a buffet hypothesis where commensals choose their food from a diversity of options. This is in contrast to the proposal of oligotrophy at the rhizosphere ( Ramachandran et al., 2011 ). Copiotrophic rhizobia are very successful rhizosphere colonizers ( Gutiérrez-Zamora and Martínez-Romero, 2001 ). Microbial respiration is not carbon limited in the rhizosphere ( Cheng et al., 1996 ). Rhizosphere is a complex environment with substitutable resources. In experimental evolution in complex environments with substitutable resources, Pseudomonas lineages evolved as imperfect generalists that differentiate to assimilate a certain range of substrates but not all ( Barrett et al., 2005 ), this seems to happen with microbes at the rhizosphere.
Conflict of Interest Statement
The authors declare that the research was conducted in the absence of any commercial or financial relationships that could be construed as a potential conflict of interest.
Acknowledgments
To PAPIIT IN205412 from UNAM. To M. Dunn for reading the manuscript. Martha G. López-Guerrero was a PhD student at the Programa de Doctorado en Ciencias Biomédicas, UNAM and had a fellowship from CONACyT, México. We apologize to authors who have contributed to the area and were not referred due to space limitations.
Badri, D. V., Chaparro, J. M., Zhang, R., Shen, Q., and Vivanco, J. M. (2013). Application of natural blends of phytochemicals derived from the root exudates of Arabidopsis to the soil reveal that phenolic-related compounds predominantly modulate the soil microbiome. J. Biol. Chem. 288, 4502–4512. doi: 10.1074/jbc.M112.433300
Pubmed Abstract | Pubmed Full Text | CrossRef Full Text
Badri, D. V., and Vivanco, J. M. (2009). Regulation and function of root exudates. Plant Cell Environ. 32, 666–681. doi: 10.1111/j.1365-3040.2009.01926.x
Baek, C. H., Farrand, S. K., Lee, K. E., Park, D. K., Lee, J. K., and Kim, K. S. (2003). Convergent evolution of Amadori opine catabolic systems in plasmids of Agrobacterium tumefaciens . J. Bacteriol. 185, 513–524. doi: 10.1128/JB.185.2.513-524.2003
Baek, C. H., Farrand, S. K., Park, D. K., Lee, K. E., Hwang, W., and Kim, K. S. (2005). Genes for utilization of deoxyfructosyl glutamine (DFG), an amadori compound, are widely dispersed in the family Rhizobiaceae. FEMS Microbiol. Ecol. 53, 221–233. doi: 10.1016/j.femsec.2004.12.008
Baelum, J., Nicolaisen, M. H., Holben, W. E., Strobel, B. W., Sørensen, J., and Jacobsen, C. S. (2008). Direct analysis of tfdA gene expression by indigenous bacteria in phenoxy acid amended agricultural soil. ISME J. 2, 677–687. doi: 10.1038/ismej.2008.21
Bais, H. P., Weir, T. L., Perry, L. G., Gilroy, S., and Vivanco, J. M. (2006). The role of root exudates in rhizosphere interactions with plants and other organisms. Annu. Rev. Plant Biol. 57, 233–266. doi: 10.1146/annurev.arplant.57.032905.105159
Barrett, R. D., MacLean, R. C., and Bell, G. (2005). Experimental evolution of Pseudomonas fluorescens in simple and complex environments. Am. Nat. 166, 470–480. doi: 10.1086/444440
Bauer, W. D., and Robinson, J. B. (2002). Disruption of bacterial quorum sensing by other organisms. Curr. Opin. Biotechnol. 13, 234–237. doi: 10.1016/S0958-1669(02)00310-5
Bentley, S. D., Chater, K. F., Cerdeño-Tárraga, A. M., Challis, G. L., Thomson, N. R., James, K. D., et al. (2002). Complete genome sequence of the model actinomycete Streptomyces coelicolor A3(2). Nature 417, 141–147. doi: 10.1038/417141a
Berendsen, R. L., Pieterse, C. M., and Bakker, P. A. (2012). The rhizosphere microbiome and plant health. Trends Plant Sci. 17, 478–486. doi: 10.1016/j.tplants.2012.04.001
Brown, S. A., Palmer, K. L., and Whiteley, M. (2008). Revisiting the host as a growth medium. Nat. Rev. Microbiol. 6, 657–666. doi: 10.1038/nrmicro1955
Bulgarelli, D., Rott, M., Schlaeppi, K., Ver Loren van Themaat, E., Ahmadinejad, N., Assenza, F., et al. (2012). Revealing structure and assembly cues for Arabidopsis root-inhabiting bacterial microbiota. Nature 488, 91–95. doi: 10.1038/nature11336
Cheng, W., Zhang, Q., Coleman, D. C., Carroll, C. R., and Hoffman, C. A. (1996). Is available carbon limiting microbial respiration in the rhizosphere? Soil Biol. Biochem. 28, 1283–1288. doi: 10.1016/S0038-0717(96)00138-1
CrossRef Full Text
Cordeiro, F. A., Tadra-Sfeir, M. Z., Huergo, L. F., de Oliveira Pedrosa, F., Monteiro, R. A., and de Souza, E. M. (2013). Proteomic analysis of Herbaspirillum seropedicae cultivated in the presence of sugar cane extract. J. Proteome Res. 12, 1142–1150. doi: 10.1021/pr300746j
de Bruijn, F. J. (eds). (2013). Molecular Microbial Ecology of The Rhizosphere . Hoboken, NJ: Wiley-Blackwell Publishers.
Dennis, P. G., Miller, A. J., and Hirsch, P. R. (2010). Are root exudates more important than other sources of rhizodeposits in structuring rhizosphere bacterial communities? FEMS Microbiol. Ecol. 72, 313–327. doi: 10.1111/j.1574-6941.2010.00860.x
Ferrer, J. L., Austin, M. B., and Stewart, C. Jr., Noel, J. P. (2008). Structure and function of enzymes involved in the biosynthesis of phenylpropanoids. Plant Physiol. Biochem. 46, 356–370. doi: 10.1016/j.plaphy.2007.12.009
Fincher, G. B., Stone, B. A., and Clarke, A. E. (1983). Arabinogalactan-proteins: structure, biosynthesis and function. Annu. Rev. Plant Physiol. 34, 47–70. doi: 10.1146/annurev.pp.34.060183.000403
Fischer, D., Pfitzner, B., Schmid, M., Simões-Araújo, J. L., Reis, V. M., Pereira, W., et al. (2012). Molecular characterisation of the diazotrophic bacterial community in uninoculated and inoculated field-grown sugarcane ( Saccharum sp.) . Plant Soil 356, 83–99. doi: 10.1007/s11104-011-0812-0
Flores, H. E., Vivanco, J. M., and Loyola-Vargas, V. M. (1999). ‘Radicle’ biochemistry: the biology of root-specific metabolism. Trends Plant Sci. 4, 220–226. doi: 10.1016/S1360-1385(99)01411-9
Friesen, M. L., Porter, S. S., Stark, S. C., von Wettberg, E. J., Sachs, J. L., and Martinez-Romero, E. (2011). Microbially mediated plant functional traits. Annu. Rev. Ecol. Evol. Syst. 42, 23–46. doi: 10.1146/annurev-ecolsys-102710-145039
González-Paredes, Y., Alarcón, A., Ferrera-Cerrato, R., Almaraz, J. J., Martínez-Romero, E., Cruz-Sánchez, J. S., et al. (2013). Tolerance, growth and degradation of phenanthrene and benzo[a]pyrene by Rhizobium tropici CIAT 899 in liquid culture medium. Appl. Soil Ecol. 63, 105–111. doi: 10.1016/j.apsoil.2012.09.010
González-Pasayo, R., and Martínez-Romero, E. (2000). Multiresistance genes of Rhizobium etli CFN42. Mol. Plant Microbe Interact. 13, 572–577. doi: 10.1094/MPMI.2000.13.5.572
Gutiérrez-Zamora, M. L., and Martínez-Romero, E. (2001). Natural endophytic association between Rhizobium etli and maize ( Zea mays L.) . J. Biotechnol. 91, 117–126. doi: 10.1016/S0168-1656(01)00332-7
Haichar, F. Z., Marol, C., Berge, O., Rangel-Castro, J. I., Prosser, J. I., Balesdent, J., et al. (2008). Plant host habitat and root exudates shape soil bacterial community structure. ISME J. 2, 1221–1230. doi: 10.1038/ismej.2008.80
Hassan, S., and Mathesius, U. (2012). The role of flavonoids in root-rhizosphere signalling: opportunities and challenges for improving plant–microbe interactions. J. Exp. Bot. 63, 3429–3444. doi: 10.1093/jxb/err430
Hiltner, L. (1904). Über neuere Erfahrungen und Probleme auf dem Gebiete der Bodenbakteriologie unter besonderer Berücksichtigung der Gründüngung und Brache. Arb. Dtsch. Landwirtsch. Gesellschaft 98, 59–78.
Hinsinger, P. (1998). How do plant roots acquire mineral nutrients? Chemical processes involved in the rhizosphere. Adv. Agron. 64, 225–265. doi: 10.1016/S0065-2113(08)60506-4
Hirsch, P. R., and Mauchline, T. H. (2012). Who’s who in the plant root microbiome? Nat. Biotechnol. 30, 961–962. doi: 10.1038/nbt.2387
Juhasz, A. L., Britz, M. L., and Stanley, G. A. (1996). Degradation of high molecular weight polycyclic aromatic hydrocarbons by Pseudomonas cepacia . Biotechnol. Lett. 18, 577–582. doi: 10.1007/BF00140206
Juhasz, A. L., Britz, M. L., and Stanley, G. A. (2003). Degradation of fluoranthene, pyrene, benz[a]anthracene and dibenz[a,h]anthracene by Burkholderia cepacia . J. Appl. Microbiol. 83, 189–198. doi: 10.1046/j.1365-2672.1997.00220.x
Kaneko, T., Nakamura, Y., Sato, S., Minamisawa, K., Uchiumi, T., Sasamoto, S., et al. (2002). Complete genomic sequence of nitrogen-fixing symbiotic bacterium Bradyrhizobium japonicum USDA110. DNA Res. 9, 189–197. doi: 10.1093/dnares/9.6.189
Kontchou, C. Y., and Blondeau, R. (1992). Biodegradation of soil humic acids by Streptomyces viridosporus . Can. J. Microbiol. 38, 203–208. doi: 10.1139/m92-034
Li, C., Berns, A. E., Schäffer, A., Séquaris, J. M., Vereecken, H., Ji, R., et al. (2011). Effect of structural composition of humic acids on the sorption of a branched nonylphenol isomer. Chemosphere 84, 409–414. doi: 10.1016/j.chemosphere.2011.03.057
López-Guerrero, M. G., Ormeño-Orrillo, E., Acosta, J. L., Mendoza-Vargas, A., Rogel, M. A., Ramírez, M. A., et al. (2012). Rhizobial extrachromosomal replicon variability, stability and expression in natural niches. Plasmid 68, 149–158. doi: 10.1016/j.plasmid.2012.07.002
Lott, J. N. A., Ockenden, I., Raboy, V., and Batten, G. D. (2000). Phytic acid and phosphorus in crop seeds and fruits: a global estimate. Seed Sci. Res. 10, 11–33.
Lundberg, D. S., Lebeis, S. L., Paredes, S. H., Yourstone, S., Gehring, J., Malfatti, S., et al. (2012). Defining the core Arabidopsis thaliana root microbiome. Nature 488, 86–90. doi: 10.1038/nature11237
Majewska-Sawka, A., and Nothnagel, E. A. (2000). The multiple roles of arabinogalactan proteins in plant development. Plant Physiol. 122, 3–10. doi: 10.1104/pp.122.1.3
Mathesius, U., and Watt, M. (2011). “Rhizosphere signals for plant–microbe interactions: implications for field-grown plants,” in Progress in Botany , Vol. 72, eds U. Lüttge, W. Beyschlag, B. Büdel, and D. Francis (Berlin: Springer-Verlag), 125–161.
Nebbioso, A., and Piccolo, A. (2001). Basis of a humeomics science: chemical fractionation and molecular characterization of humic biosuprastructures. Biomacromolecules 12, 1187–1199. doi: 10.1021/bm101488e
Ormeño-Orrillo, E., and Martínez-Romero, E. (2013). Phenotypic tests in Rhizobium species description: an opinion and (a sympatric speciation) hypothesis. Syst. Appl. Microbiol. 36, 145–147. doi: 10.1016/j.syapm.2012.11.009.
Ormeño-Orrillo, E., Rogel, M. A., Chueire, L. M., Tiedje, J. M., Martínez-Romero, E., and Hungria, M. (2012). Genome sequences of Burkholderia sp. strains CCGE1002 and H160, isolated from legume nodules in Mexico and Brazil. J. Bacteriol. 194, 6927. doi: 10.1128/JB.01756-12
Paulsen, I. T., Press, C. M., Ravel, J., Kobayashi, D. Y., Myers, G. S., Mavrodi, D. V., et al. (2005). Complete genome sequence of the plant commensal Pseudomonas fluorescens Pf-5. Nat. Biotechnol. 23, 873–878. doi: 10.1038/nbt1110
Phillips, D. A., Joseph, C. M., Yang, G. P., Martinez-Romero, E., Sanborn, J. R., and Volpin, H. (1999). Identification of lumichrome as a Sinorhizobium enhancer of alfalfa root respiration and shoot growth. Proc. Natl. Acad. Sci. U.S.A. 96, 12275–12280. doi: 10.1073/pnas.96.22.12275
Ramachandran, V. K., East, A. K., Karunakaran, R., Downie, J. A., and Poole, P. S. (2011). Adaptation of Rhizobium leguminosarum to pea, alfalfa and sugar beet rhizospheres investigated by comparative transcriptomics. Genome Biol. 12, R106. doi: 10.1186/gb-2011-12-10-r106
Ramírez-Puebla, S. T., Servín-Garcidueñas, L. E., Jiménez-Marín, B., Bolaños, L. M., Rosenblueth, M., Martínez, J., et al. (2013). Gut and root microbiota commonalities. Appl. Environ. Microbiol. 79, 2–9. doi: 10.1128/AEM.02553-12
Rodríguez, H., and Fraga, R. (1999). Phosphate solubilizing bacteria and their role in plant growth promotion. Biotechnol. Adv. 17, 319–339. doi: 10.1016/S0734-9750(99)00014-2
Romanov, V. I., Hernández-Lucas, I., and Martínez-Romero, E. (1994). Carbon metabolism enzymes of Rhizobium tropici cultures and bacteroids. Appl. Environ. Microbiol. 60, 2339–2342. doi: 10.1007/s11104-007-9481-4
Romanov, V. I., and Martínez-Romero, E. (1994). Sucrose transport and hydrolysis in Rhizobium tropici . Plant Soil 161, 91–96. doi: 10.1007/BF02183088
Rosenblueth, M., Hynes, M. F., and Martínez-Romero, E. (1998). Rhizobium tropici teu genes involved in specific uptake of Phaseolus vulgaris bean-exudate compounds. Mol. Gen. Genet. 258, 587–598. doi: 10.1007/s004380050772
Rosenblueth, M., and Martínez-Romero, E. (2006). Bacterial endophytes and their interactions with hosts. Mol. Plant Microbe Interact. 19, 827–837. doi: 10.1094/MPMI-19-0827
Scheffknecht, S., Mammerler, R., Steinkellner, S., and Vierheilig, H. (2006). Root exudates of mycorrhizal tomato plants exhibit a different effect on microconidia germination of Fusarium oxysporum f. sp. lycopersici than root exudates from non-mycorrhizal tomato plants. Mycorrhiza 16, 365–370. doi: 10.1007/s00572-006-0048-7
Shaw, L. J., Morris, P., and Hooker, J. E. (2006). Perception and modification of plant flavonoid signals by rhizosphere microorganisms. Environ. Microbiol. 8, 1867–1880. doi: 10.1111/j.1462-2920.2006.01141.x
Snoeck, C., Verreth, C., Hernández-Lucas, I., Martínez-Romero, E., and Vanderleyden, J. (2003). Identification of a third sulfate activation system in Sinorhizobium sp. strain BR816: the CysDN sulfate activation complex. Appl. Environ. Microbiol. 69, 2006–2014. doi: 10.1128/AEM.69.4.2006-2014.2003
van Loon, L. C., Bakker, P. A., and Pieterse, C. M. (1998). Systemic resistance induced by rhizosphere bacteria. Annu. Rev. Phytopathol. 36, 453–483. doi: 10.1146/annurev.phyto.36.1.453
Walker, T. S., Bais, H. P., Grotewold, E., and Vivanco, J. M. (2003). Root exudation and rhizosphere biology. Plant Physiol. 132, 44–51. doi: 10.1104/pp.102.019661
Yan, Y., Yang, J., Dou, Y., Chen, M., Ping, S., Peng, J., et al. (2008). Nitrogen fixation island and rhizosphere competence traits in the genome of root-associated Pseudomonas stutzeri A1501. Proc. Natl. Acad. Sci. U.S.A. 105, 7564–7569. doi: 10.1073/pnas.0801093105
Keywords : rhizosphere, speciation, root exudates, soil microbiology, bacterial genomes
Citation: López-Guerrero MG, Ormeño-Orrillo E, Rosenblueth M, Martinez-Romero J and Martínez-Romero E (2013) Buffet hypothesis for microbial nutrition at the rhizosphere. Front. Plant Sci. 4 :188. doi: 10.3389/fpls.2013.00188
Received: 13 March 2013; Accepted: 23 May 2013; Published online: 14 June 2013.
Reviewed by:
Copyright: © 2013 López-Guerrero, Ormeño-Orrillo, Rosenblueth, Martinez-Romero and Martínez-Romero. This is an open-access article distributed under the terms of the Creative Commons Attribution License , which permits use, distribution and reproduction in other forums, provided the original authors and source are credited and subject to any copyright notices concerning any third-party graphics etc.
*Correspondence: Esperanza Martínez-Romero, Centro de Ciencias Genómicas, Universidad Nacional Autónoma de México, Avenida Universidad SN, Cuernavaca, Morelos CP 62210, Mexico e-mail: [email protected], [email protected]
Disclaimer: All claims expressed in this article are solely those of the authors and do not necessarily represent those of their affiliated organizations, or those of the publisher, the editors and the reviewers. Any product that may be evaluated in this article or claim that may be made by its manufacturer is not guaranteed or endorsed by the publisher.
- thesis help
- topics to stay away from
- developing a strong topic
- education thesis prompts
- marketing problems to explore
- writing on anaesthesia
- health & psychology
- learning & development
- nursing education problems
- sports history topics
- risk management problems
- writing about wildlife
- good topics on nutrition
- writing on emotional intelligence
- good topics in astrophysics
- great topic suggestions
- dissertation topics in law
- computer engineering topics
- thesis topic solutions in finance
- IR dissertation titles
- Art dissertation topic ideas
- Environmental law thesis title
- Picking topics on interior design
- Business topic ideas to explore
- Chemical engineering topics
- Graphic design thesis titles
- 15 topics on pediatric nursing
- Ideas about network security
- Topics on structural engineering
- Economics dissertation topics
- Selection of topics in finance
- Financial markets topic ideas
- Women's studies thesis topics
- deciding on a title
- the secrets of good writing
- writing a thesis in 5 steps
- structuring your paper
- medical paper samples
- Master's paper samples
- writing a purpose statement
- writing a literature review
- PhD thesis methodology
- Doctoral thesis formatting
- tips for undergraduates
- creating a law dissertation
- writing a medical college thesis
- drafting the conclusion
- PhD thesis paper writing hints
- MBA dissertation writing tips
- A thesis on Martin Luther King
- A thesis paper in criminal justice
- Getting a custom dissertation
- Writing a proposal in history
- How to format a cover page
- Finding a finance thesis sample
- APA format bibliography section
- How to make in-text citations
- Marketing thesis writing guide
- Preparing a defense presentation
- Getting a biology thesis sample
- Marketing dissertation proposal
- Purchasing a thesis on the web
- Writing on evaluation of training
- APA thesis acknowledgements
- Using a dissertation database
- Order a dissertation safely
- writing services

The Top 20 Good Thesis Topics On Nutrition
Nutrition is the bedrock of a healthy state of body and mind. It works as an armour that protects the body from being in a fragile condition. Several nutritionists and researchers are always on the look out to make the world aware of what nutrition is all about. And this brings us to the top twenty thesis topics:
- How well do we understand Nutrition - This topic is all about identifying with the common fads about nutrition and making oneself aware of the essentials.
- Common digestive problems and its causes-Heartburn or Gastro Esophageal Reflux Disease (GERD), diarrhea, hemorrhoids, gastritis, constipation Irritable Bowel Disease (IBS) and gallstones are the common disorders, other than these there are Crohns disease, ulcerative disorders etc.
- The health quotient of starch and fibres- One can concentrate on the types of starch which are healthy and that intake of fibres triggers digestion.
- Health benefits of lipids- How Lipids reserve energy and help in the formation of cell membranes? What prevents the functions of lipids?
- Vegetarian diet: Dealing with the efficiency and deficiency of it.
- How do body responds to binge eating and fasting?
- Diseases associated with increasing fat in the body
- Being underweight is not a boon but a curse- Through this one could address the diseases caused by being underweight.
- The role of antioxidants in preventing diseases
- Calcium and how it prevents osteoporosis
- Benefits of phytochemicals and functional foods- Through this research topic one can throw light on how phytochemicals, which ideally help plant, help humans? And which food items are termed functional foods?
- Foetal alcohol syndrome- FAS is very commonly seen in case of babies whose mothers were alcoholic during pregnancy. The topic could deal with questions like how fast alcohol permeates the womb. What type of cognitive and mental disorder affect the foetus?
- The connect between Childhood obesity and chronic diseases
- Nutritional genomics- This multidisciplinary field of science has raised several questions like how food affects our genes. And how these genetic differences in individuals respond to food nutrients?
- Nutrition develops immunity system- This topic promises a lot of scope. There is an interdependence between Immunity system and nutrition and this provides a thriving ground for research topics.
- Enteral nutrition and inborn errors of metabolism
- Nutrition: A treatment of multiple organ failure- Recent research has focussed on the breakdown of protein in case of multiple organ failure.
- Allergy and Nutrition- Nutrition is making up for the paucity of certain minerals and vitamins that a certain body is rejecting.
- Cardiometabolic syndrome-This is directly linked to nutrition as there are certain components in food which induces this syndrome.
- Nutrition helps people with feeding disabilities- Nutritious food help prevent gastroesophageal reflux, this is where nutritional therapies come into play.
Could Eating Less Help You Live Longer?
Calorie restriction and intermittent fasting both increase longevity in animals, aging experts say. Here’s what that means for you.

By Dana G. Smith
If you put a lab mouse on a diet, cutting the animal’s caloric intake by 30 to 40 percent, it will live, on average, about 30 percent longer. The calorie restriction, as the intervention is technically called, can’t be so extreme that the animal is malnourished, but it should be aggressive enough to trigger some key biological changes.
Scientists first discovered this phenomenon in the 1930s, and over the past 90 years it has been replicated in species ranging from worms to monkeys. The subsequent studies also found that many of the calorie-restricted animals were less likely to develop cancer and other chronic diseases related to aging.
But despite all the research on animals, there remain a lot of unknowns. Experts are still debating how it works, and whether it’s the number of calories consumed or the window of time in which they are eaten (also known as intermittent fasting) that matters more.
And it’s still frustratingly uncertain whether eating less can help people live longer, as well. Aging experts are notorious for experimenting on themselves with different diet regimens, but actual longevity studies are scant and difficult to pull off because they take, well, a long time.
Here’s a look at what scientists have learned so far, mostly through seminal animal studies, and what they think it might mean for humans.
Why would cutting calories increase longevity?
Scientists don’t exactly know why eating less would cause an animal or person to live longer, but many hypotheses have an evolutionary bent. In the wild, animals experience periods of feast and famine, as did our human ancestors. Therefore, their (and conceivably our) biology evolved to survive and thrive not only during seasons of abundance, but also seasons of deprivation.
One theory is that, on a cellular level, calorie restriction makes animals more resilient to physical stressors. For example, calorie-restricted mice have greater resistance to toxins and recover faster from injury, said James Nelson, a professor of cellular and integrative physiology at the University of Texas Health Science Center at San Antonio.
Another explanation involves the fact that, in both humans and animals , eating fewer calories slows down metabolism. It’s possible that “the less you have to get your body to metabolize, the longer it can live,” said Dr. Kim Huffman, an associate professor of medicine at Duke University School of Medicine who has studied calorie restriction in people. “You know, just slow the wheels down and the tires will last longer.”
Calorie restriction also forces the body to rely on fuel sources other than glucose, which aging experts think is beneficial for metabolic health and, ultimately, longevity. Several researchers pointed to a process known as autophagy , where the body eats up malfunctioning parts of cells and uses them for energy. This helps cells function better and lowers the risk of several age-related diseases.
In fact, scientists think that one of the main reasons calorie-restricted diets make mice live longer is because the animals don’t get sick as early, if at all, said Dr. Richard Miller, a professor of pathology at the University of Michigan.
There are a few notable exceptions to the findings around longevity and calorie restriction. Most striking was a study Dr. Nelson published in 2010 on mice that were genetically diverse. He found that some of the mice lived longer when they ate less, but a larger percentage actually had a shorter life span.
“That was kind of really unheard of,” Dr. Nelson said, noting that most papers on calorie restriction start out by saying: “‘Food restriction is the most robust, almost universal means of extending life span in species across the animal kingdom’ and blah, blah, blah.”
Other researchers have disputed the significance of Dr. Nelson’s findings. “People cite this study as though it were general evidence that caloric restriction only works a tiny portion, or some portion of the time,” Dr. Miller said. “But you can reach that conclusion only if you ignore 50 years of strong published evidence saying that it works almost all the time.”
Dr. Nelson’s study wasn’t the only one that didn’t find a universal longevity benefit with calorie restriction, though. For example, two studies conducted in monkeys for over 20 years, published in 2009 and 2012 , reported conflicting findings. Animals in both experiments showed some health benefits tied to caloric restriction, but only one group lived longer and had lower rates of age-related diseases, like cardiovascular disease and diabetes.
What does intermittent fasting have to do with it?
In the face of these mixed results, some researchers wonder if there may be another variable at play that is just as, or even more, important than the number of calories an animal eats: the window of time in which they eat them.
A key difference between the two monkey trials was that in the 2009 study, conducted at the University of Wisconsin, the calorie-restricted animals only received one meal a day and the researchers took away any leftover food in the late afternoon, so the animals were forced to fast for about 16 hours. In the 2012 study, run by the National Institute on Aging, the animals were fed twice a day and the food was left out overnight. The Wisconsin monkeys were the ones that lived longer.
A more recent study conducted in mice explicitly tested the effects of calorie restriction with and without intermittent fasting. Scientists gave the animals the same low-calorie diet, but some had access to the food for just two hours, others for 12 hours and another group for 24. Compared to a control group of mice that could graze on a full-calorie diet at any time, the low-calorie mice with 24-hour access lived 10 percent longer, while the low-calorie mice that ate within specific time windows had up to a 35 percent increase in life span.
Based on this collection of findings, Rafael de Cabo, a senior investigator at the N.I.A. who helped lead the monkey study there, now thinks that while calorie restriction is important for longevity, the amount of time spent eating — and not eating — every day is just as critical. And that might be the case not only for animals, but also for humans.
What does this mean for me?
It’s difficult to definitively answer whether intermittent fasting, calorie restriction or a combination of the two could cause people to live longer.
“I don’t think we have any evidence that it extends life span in humans,” Dr. Nelson said. That doesn’t mean it can’t work, he added, just that the evidence is “very hard to come by because it takes a lifetime to get that data.”
One clinical trial — named the Calerie study — attempted to answer this question by examining how cutting calories by 25 percent for two years affected a range of measurements related to aging. More than 100 healthy adults were advised on meal planning and given regular counseling sessions to help them reach their diet goals. But because it’s so difficult to reduce calories, participants were ultimately only able to reduce their intake by about 11 percent.
Compared to control participants, the dieters improved several aspects of their cardio-metabolic health, including blood pressure and insulin sensitivity, and they had lower levels of a few markers of inflammation.
The study also included three measures of “ biological age ,” comparing blood tests taken at the beginning and end of the two years. Two of the tests didn’t find an improvement in either group, but the third, which purports to measure how fast people age, did show a difference in the dieters. Calorie restriction “didn’t make people younger, but it made the rate at which they age slower,” said Dr. Huffman, who worked on the trial.
To Dr. Miller, the most significant conclusion from this study is that the 25 to 40 percent calorie restriction shown to be beneficial in animals is just not realistic in people. “Everything that could be accomplished to try to help them” cut calories was done for the participants, he said, and they still fell short of the goal of 25 percent.
Dr. de Cabo had a different take: “With only 11 percent calorie restriction that was achieved by the participants, they still show benefits,” he said.
Other research has focused on the short-term effects of intermittent fasting in people with a range of body mass indexes. Some studies , testing a variety of fasting schedules, showed improved metabolic health and reduced inflammation. But a trial of 116 people whose B.M.I. classified them as overweight or obese found no benefit among those who ate within an eight-hour window but didn’t reduce their calories, compared to a control group.
And to add a final twist, there is a notable body of evidence that appears to directly contradict the idea that calorie restriction or fasting, which typically leads to weight loss, extends human life span. Research consistently finds that people who are classified as overweight have a lower risk of death than those who are normal or underweight. One hypothesis is that people with the lowest B.M.I.s may be thin because they are older or have a chronic illness. Another is that people with higher B.M.I.s have more muscle, which weighs more than fat. But it’s also conceivable that, especially later in life, having greater body mass is actually protective, Dr. Huffman said.
Despite nearly a century of research, there’s still a ways to go before experts can say for certain whether the longevity benefits seen in animals will translate to humans. Some studies provide reason to believe that calorie restriction and intermittent fasting will help you live longer, and there are likely shorter-term benefits, particularly when it comes to heart and metabolic health. But it’s also possible that eating less might not do much more than leave you hungry.
Dana G. Smith is a Times reporter covering personal health, particularly aging and brain health. More about Dana G. Smith
A Guide to Better Nutrition
A viral TikTok trend touts “Oatzempic,” a half cup of rolled oats with a cup of water and the juice of half a lime, as a weight-loss hack. We asked the experts if there’s anything to it .
How much salt is too much? Should I cut back? We asked experts these and other questions about sodium .
Patients were told for years that cutting calories would ease the symptoms of polycystic ovary syndrome. But research suggests dieting may not help at all .
We asked a nutrition expert how she keeps up healthy habits without stressing about food. Here are seven tips she shared for maintaining that balance.
There are many people who want to lose a few pounds for whom weight loss drugs are not the right choice. Is old-fashioned dieting a good option ?
Read these books to shift into a healthier way of thinking about food .
Thank you for visiting nature.com. You are using a browser version with limited support for CSS. To obtain the best experience, we recommend you use a more up to date browser (or turn off compatibility mode in Internet Explorer). In the meantime, to ensure continued support, we are displaying the site without styles and JavaScript.
- View all journals
- Explore content
- About the journal
- Publish with us
- Sign up for alerts
- NATURE INDEX
- 17 April 2024
Researchers want a ‘nutrition label’ for academic-paper facts
- Dalmeet Singh Chawla 0
Dalmeet Singh Chawla is a freelance science journalist based in London.
You can also search for this author in PubMed Google Scholar
Researchers hope to apply insights from the initiative to display nutrition-facts labels on food packaging to academic publishing. Credit: Spauln/Getty
Inspired by the nutrition-facts labels that have been displayed on US food packaging since the 1990s, John Willinsky wants to see academic publishing take a similar approach to help to inform readers on how strictly a paper meets scholarly standards.
A team at the Public Knowledge Project, a non-profit organization run by Willinsky and his colleagues at Simon Fraser University in Burnaby, Canada, has been investigating how such a label might be standardized in academic publishing 1 .
Willinsky spoke to Nature Index about what he hopes to achieve with the initiative.
Why should academic papers have publication-facts labels?
I, like many others, have grown concerned about research integrity . Through transparency, we want to show how closely journals and authors are adhering to the scholarly standards of publishing. We want to help readers, including researchers, the media and the public, to decide whether an article is worth reporting on or citing.
The facts that we have selected for the label include publisher and funder names, the journal’s acceptance rate and the number of peer reviewers. The label also shows whether the paper includes a competing-interests statement and an editor list, where the journal is indexed and whether the data have been made publicly available. Averages for other participating journals are listed, for comparison.
It’s important that such information is readily available. When we conducted an exercise with secondary-school students, asking them to find these facts for a single academic article online, many of them took 30 minutes to do so. Some couldn’t find the information. This finding justifies the need for the label: it shouldn’t take half an hour to establish that a journal adheres to scholarly standards.
How did you create the label?
The US nutrition-facts label has been proved to change people’s behaviour, specifically their food-purchasing habits 2 . Given that so much work went into the label’s development, I thought it would be wise to build on its design.
On the basis of our early consultations with researchers, editors, science journalists, primary-school teachers and others, we created a prototype with eight elements that reflect scholarly publishing standards. We’re now gathering feedback, and might decide to change some of the facts, or to add others. Some people, for example, suggested that we include the number of days that the peer-review process took to complete.

The current version of the publication-facts label. Credit: J. Willinsky & D. Pimentel /Learned Publishing ( CC BY 4.0 DEED)
We’ve built in ways to automatically generate the label, to ensure that the format is standardized across journals and articles and to make the label available in several languages. We have created a third-party verification system, too, to ensure that authors’ identities are not revealed to peer reviewers and vice versa. This relies on authors, reviewers and editors using ORCID, the service that provides unique indicators with which to identify researchers.
The label will be displayed on the article landing page of the journal website and will be included in the article PDF.
How are you trialling the label’s use?
We’ve completed work with ten focus groups involving journal editors and authors in the United States and Latin America. We also interviewed 15 science journalists about what kinds of fact they’d want to see at a glance.
We built the label specifically for journals using the scholarly publishing workflow system Open Journal System (OJS), run by the Public Knowledge Project. By the middle of the year, we hope to launch a pilot programme involving more than 100 journals using the OJS. The goal is to explore the prospects of industry-wide implementation of the label by next year.
How could journals be compelled to display such a label?
Unlike the nutrition-facts label, which was mandated by the US government, the publication-facts label is the result of voluntary concern about research integrity in the publishing industry.
Although many groups, such as the International Association of Scientific, Technical and Medical Publishers and the Committee on Publication Ethics, manage concerns about research integrity by releasing guidelines on best practices and accumulating tools to flag suspicious activity, we feel that they have not addressed the fact that open access is public access . We need to adapt our practices to cater to the needs of different audiences, not just those in academia.
Although we’re initially building the label for OJS journals, it is an open-source plug-in that other publishing platforms will easily be able to adapt. The software is currently listed as being ‘under development’ on GitHub and will be shared there on release.
We want to show the publishing industry that we’ve piloted this in our own environment and that it is readily adaptable. We want to show that, although you could build your own label, for the sake of comprehensibility, it’s better to have a common format.
doi: https://doi.org/10.1038/d41586-024-01135-z
This interview has been edited for length and clarity.
Willinsky, J. & Pimentel, D. Learn. Publ. 37 , 139–146 (2024).
Article Google Scholar
Kessler, D. A., Mande, J. R., Scarbrough, F. E., Schapiro, R. & Feiden, K. Harv. Health Policy Rev. 4 , 13–24 (2003).
Google Scholar
Download references
Related Articles

- Research data
- Research management

Rwanda 30 years on: understanding the horror of genocide
Editorial 09 APR 24

Three ways ChatGPT helps me in my academic writing
Career Column 08 APR 24

‘Without these tools, I’d be lost’: how generative AI aids in accessibility
Technology Feature 08 APR 24

Londoners see what a scientist looks like up close in 50 photographs
Career News 18 APR 24

Structure peer review to make it more robust
World View 16 APR 24

US COVID-origins hearing puts scientific journals in the hot seat
News 16 APR 24
Adopt universal standards for study adaptation to boost health, education and social-science research
Correspondence 02 APR 24

How AI is being used to accelerate clinical trials
Nature Index 13 MAR 24

A guide to the Nature Index
Postdoctoral Fellow
The Dubal Laboratory of Neuroscience and Aging at the University of California, San Francisco (UCSF) seeks postdoctoral fellows to investigate the ...
San Francisco, California
University of California, San Francsico
Postdoctoral Associate
Houston, Texas (US)
Baylor College of Medicine (BCM)
Postdoctoral Research Fellow
Description Applications are invited for a postdoctoral fellow position at the Lunenfeld-Tanenbaum Research Institute, Sinai Health, to participate...
Toronto (City), Ontario (CA)
Sinai Health
Postdoctoral Research Associate - Surgery
Memphis, Tennessee
St. Jude Children's Research Hospital (St. Jude)
Open Rank Faculty Position in Biochemistry and Molecular Genetics
The Department of Biochemistry & Molecular Genetics (www.virginia.edu/bmg) and the University of Virginia Cancer Center
Charlottesville, Virginia
Biochemistry & Molecular Genetics
Sign up for the Nature Briefing newsletter — what matters in science, free to your inbox daily.
Quick links
- Explore articles by subject
- Guide to authors
- Editorial policies

Barbara Intermill, On Nutrition: Questions…
Share this:.
- Click to share on Facebook (Opens in new window)
- Click to share on Twitter (Opens in new window)
- Click to print (Opens in new window)
- Special Sections
Opinion Columnists
Barbara intermill, on nutrition: questions about blood type diet and peanuts.

A college student in Illinois writes, “I’ve always been interested in nutrition and one of the things I see popping up all the time is something called the ‘Blood Type Diet.’ I know that losing weight has nothing to do with your blood type and you can lose weight with any diet. But there’s another part of this diet regarding lectins that I’ve always wondered about.
“The author (of this book) claims if we eat foods that are wrong for our blood type, these lectins cause clumping of red blood cells. This supposedly leads to disease and illness later in life. Numerous foods are claimed to be healthy for people with certain blood types and bad for other blood types.
“Some of my favorite foods are supposedly bad for me because I am blood type A. I love tomatoes, cashews, avocados, mangos, coconut and yogurt. But according to the blood type diet, they are all bad for me, and can cause agglutination which leads to possible disease and illness.
“Maybe you can debunk this or point me in the right direction to somebody who can explain this.” — Grant L.
I appreciate your confusion, Grant. This diet was popularized back in 1996 with a book called “Eat Right 4 Your Type” by neuropathic physician Peter D’Adamo. Dr. D’Adamo states that if you eat lectins that are not compatible with your blood type, you can experience serious health effects.
Trouble is, there have been no valid studies to prove this hypothesis. One study in 2013 searched all the available evidence and found no particular benefit of this type of diet. Another study in 2014 reported that any health effects seen with these diets was not related to blood type. In other words, eating healthier food is good for us no matter what our blood type.
Lectins are real, however. And some can be toxic such as those found in raw legumes such as beans, lentils, peas, soybeans and peanuts. But who wants to eat raw beans anyway? Boiling them in water deactivates these proteins.
Here’s another twist. Some lectins are actually being studied for their ability to kill off dangerous viruses and fight disease. My advice to you: Unless you have another reason to avoid the healthful foods you love, I wouldn’t base my choices on blood type.
John M. in Lynchburg, Virgina asks, “A recent column mentioned the benefits of many foods including nuts. My question concerns peanuts. I understand peanuts are not from a tree, but grow underground. We normally have them in our house. Do these provide any of the benefits of tree nuts? Or were they called peanuts to eliminate the rather backwoods sound of Goober Peas?”
You’re right, John. Despite their name, peanuts are legumes, not nuts. They are higher in protein than tree nuts and do provide similar health benefits. And according to the Peanut Institute, 98-100% of lectins are destroyed by boiling or roasting. I’ll save goober peas for another column.
Barbara Intermill is a registered dietitian nutritionist and syndicated columnist. She is the author of “Quinn-Essential Nutrition: The Uncomplicated Science of Eating.” Email her at [email protected].
More in Opinion
Subscriber only, barry dolowich, tax tips: social security benefits, liza horvath, senior advocate: does my trustee need to post bond.

Beth Peerless, Where it’s at: Back in the swing of things
Steven merrell, financial planning: bond buyer basics.
Ohio State nav bar
The Ohio State University
- BuckeyeLink
- Find People
- Search Ohio State
A Bullish April Cattle on Feed Report
– Dr. Kenny Burdine, Extension Professor, Livestock Marketing, University of Kentucky
Cattle on feed reports have not been especially kind to the cattle complex in recent months. Despite fewer cows and a smaller calf crop, on-feed inventories have been running above year-ago levels. Over the last several months, feeder cattle placements have been higher than most analysts would have expected. Weather and high prices likely encouraged some early placements in some regions going back to fall. At the same time, marketings have seemed to be relatively slow. I suspect this has been partly due to expensive feeder cattle and cheaper feed. This combination tends to encourage adding more weight to current feedlot inventory and rising harvest weights seem to be supporting this hypothesis.
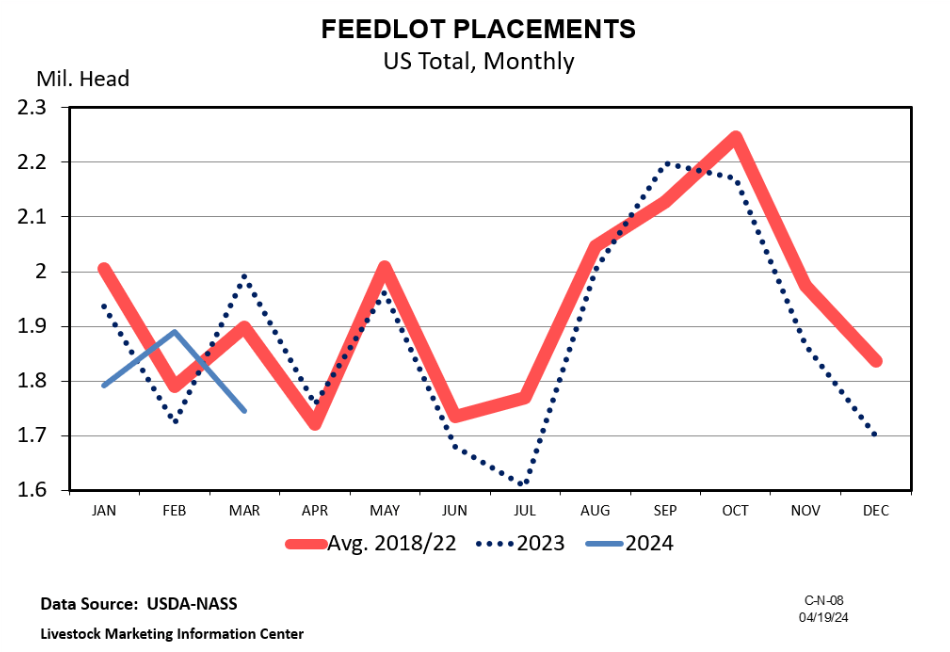
The April report is also one of the quarterly reports where an estimate is made of the on-feed breakdown between steers and heifers. This can provide some indication of heifer retention for breeding purposes and will be especially important this year as we may not have the July Cattle Inventory report. As of April 1, heifers and heifer calves accounted for 38.5% of on-feed inventory. Heifers accounted for 40% of on-feed inventory in October of last year and 39.7% in January of this year. The fact that the share of heifers on feed is decreasing does bear watching in the coming months, but still does not point to significant heifer retention. If one goes back and examines the last expansionary period, the heifer percentage was below 35% for ten straight quarters – from the first quarter of 2015 to the second quarter of 2017.
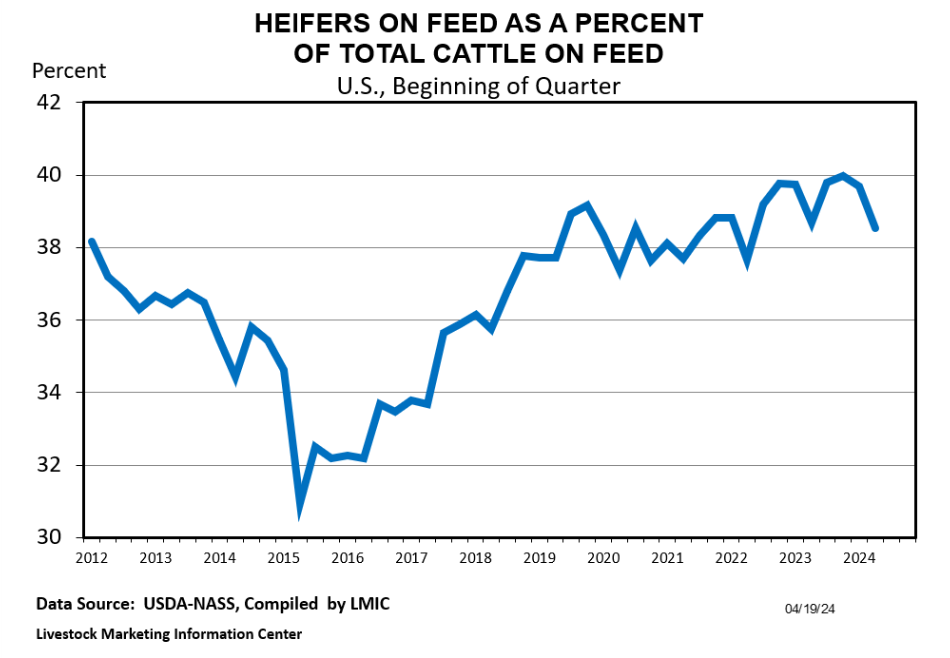
IMAGES
VIDEO
COMMENTS
The steps of the scientific method include: 1. Observation/Question: The researcher first makes an observation and comes up with a research question to investigate. 2. Hypothesis: The researcher formulates a hypothesis, or educated guess, that would explain the observation or question and that can be tested through scientific experiments. 3.
Figure 2.3. The hierarchy of evidence shows types of research studies relative to their strength of evidence and relevance to real-life nutrition decisions, with the strongest studies at the top and the weakest at the bottom. The pyramid also represents a few other general ideas. There tend to be more studies published using the methods at the ...
Research and the Scientific Method. University of Hawai'i at Mānoa Food Science and Human Nutrition Program and Human Nutrition Program. Nutritional scientists discover the health effects of food and its nutrients by first making an observation. Once observations are made, they come up with a hypothesis, test their hypothesis, and then ...
In nutrition epidemiology, the sparsity hypothesis holds if some foods are consumed independently of the foods included in the dietary patterns, or there is no variation in the population . In the first layer of the cluster tree, the method identifies the two variables with the highest correlation among all the food groups and performs a PCA to ...
A single approach is not sufficient. There are a variety of study designs used in nutrition research which are used to study a variety of different exposures and outcomes. How all these studies can lead to a conclusion depends on the certainty of evidence. A link between an exposure and outcome is more certain if: 8.
2. Components of a Healthy Diet and Their Benefits. A healthy diet is one in which macronutrients are consumed in appropriate proportions to support energetic and physiologic needs without excess intake while also providing sufficient micronutrients and hydration to meet the physiologic needs of the body [].Macronutrients (i.e., carbohydrates, proteins, and fats) provide the energy necessary ...
The scientific method is an organized process of inquiry used in nutritional science to determine if the food suspect fits the claim. The scientific method is part of the overall evidence-based approach to designing nutritional guidelines that are based on facts. There are different types of scientific studies—epidemiological studies ...
Dietary Tradition, Nutritional Theories and Science. Director of the Pacific Wellness Institute, Toronto, Canada. Corresponding Author: Tim H. Tanaka, Director of the Pacific Wellness Institute, Toronto, Canada, Tel: +1 416-929-6958; E-Mail: [email protected]. Received Date: 20 Dec 2016 Accepted Date: 02 Jan 2017 Published Date: 06 Jan ...
Data-driven and hypothesis-driven are two major approaches to identify dietary patterns . Cluster and factor analysis are outcome independent empirical data-driven techniques used to determine dietary behaviour in the study population, while index/score-based are hypothesis-driven based on adherence to prior recommendations or guidelines .
Abstract. This chapter discusses contemporary theoretical basis for dietary interventions for disease prevention and management and their applications in practice. This chapter (1) introduces key concepts related to the application of theory in understanding and improving diet and eating-related behaviors, (2) reviews behavioral issues related ...
1. INTRODUCTION. Research provides the evidence base that guides clinical practice. It informs decision making and ensures the delivery of optimal nutrition care to individuals and the broader community. 1, 2 In the context of nutrition, organisations such as the International Confederation of Dietetic Associations recognise the importance of research in International Competency Standards for ...
Hypothesis: a Unifying Mechanism for Nutrition and Chemicals as Lifelong Modulators of DNA Hypomethylation. Duk-Hee Lee, 1 David R. Jacobs, Jr., 2, 3 and Miquel Porta 4 ... However, even without nutritional deficiency, enhanced need to synthesize glutathi-one (GSH) can impair synthesis of SAM and perturb DNA methylation, because the methylation ...
A simple way to think about the p-value is that it summarises the compatibility between data and a pre-defined hypothesis (also called a 'test hypothesis'). The test hypothesis is always specific to the study you are reading, but most often it is a 'null' hypothesis. ... If we take a nutrition-specific example, an effect size of ...
An overview of the "food environment hypothesis" first described the overall conceptualization of neighborhood food environments and how they can influence food intake, risk factors, and disease profiles. An important distinction exists between the "community nutrition environment" (location and types of stores) and the "consumer food ...
A common theme for dietary myths is a reductionist view of diet that emphasizes selected food constituents as opposed to whole foods. Healthy dietary advice takes a more holistic view; consistent ...
Scientific hypothesis. The formulation and testing of a hypothesis are part of the scientific method. A scientific hypothesis proposes a tentative explanation of natural phenomena. ... (WFPB) nutrition is an eating pattern emphasising plant foods in their whole form: vegetables, fruits, whole grains, legumes, nuts and seeds. Additives, added ...
Analysis of results. Contributors and Attributions. In this experiment, you will be investigating the effects of different nutrient deficiencies. To do this, you will first need to do some background research on the role of different essential nutrients within the plant. Use your background research to develop a question about plant nutrition.
Hypothesis. Integrative Food, Nutrition and Metabolism. Integr Food Nutr Metab, 2016 doi: 10.15761/IFNM.1000170 Volume 4 (1): 1-5. ISSN: 2056-8339. to change my diet to increase the amount of B ...
Buffet hypothesis for microbial nutrition at the rhizosphere. An emphasis is made on the diversity of nutrients that rhizosphere bacteria may encounter derived from roots, soil, decaying organic matter, seeds, or the microbial community. This nutrient diversity may be considered analogous to a buffet and is contrasting to the hypothesis of ...
Nutrition develops immunity system- This topic promises a lot of scope. There is an interdependence between Immunity system and nutrition and this provides a thriving ground for research topics. Enteral nutrition and inborn errors of metabolism. Nutrition: A treatment of multiple organ failure- Recent research has focussed on the breakdown of ...
Middle School, Explore Nutrition Science Projects. (7 results) Through kitchen chemistry, discover for yourself nutritional content in your food. Design a method to extract and measure substances in a food or drink. Or do a hands-on experiment to test how a nutrient works. Electrolyte Challenge: Orange Juice Vs. Sports Drink.
Which hypothesis and patient-centered outcome would be the most appropriate related to nutrition for the patient? O: Impaired Self-Feeding resulting in low body weight. Patient will identify factors related to nutritional consumption by the next clinic appointment O: Impaired Swallowing resulting in low body weight.
Likelihood is that which is most likely to occur; for example, the likelihood for Impaired Nutritional Status is higher in the older adult and long-term care resident. 4. If resolved would affect other hypotheses: Address the issue that if resolved would eliminate other issues.
April 24, 2024, 5:01 a.m. ET. If you put a lab mouse on a diet, cutting the animal's caloric intake by 30 to 40 percent, it will live, on average, about 30 percent longer. The calorie ...
The US nutrition-facts label has been proved to change people's behaviour, specifically their food-purchasing habits 2. Given that so much work went into the label's development, I thought it ...
Barbara Intermill is a registered dietitian nutritionist and syndicated columnist. She is the author of "Quinn-Essential Nutrition: The Uncomplicated Science of Eating.". Email her at barbara ...
April 24 2024. - Dr. Kenny Burdine, Extension Professor, Livestock Marketing, University of Kentucky. Cattle on feed reports have not been especially kind to the cattle complex in recent months. Despite fewer cows and a smaller calf crop, on-feed inventories have been running above year-ago levels. Over the last several months, feeder cattle ...