- Affiliate Program

- UNITED STATES
- 台灣 (TAIWAN)
- TÜRKIYE (TURKEY)
- Academic Editing Services
- - Research Paper
- - Journal Manuscript
- - Dissertation
- - College & University Assignments
- Admissions Editing Services
- - Application Essay
- - Personal Statement
- - Recommendation Letter
- - Cover Letter
- - CV/Resume
- Business Editing Services
- - Business Documents
- - Report & Brochure
- - Website & Blog
- Writer Editing Services
- - Script & Screenplay
- Our Editors
- Client Reviews
- Editing & Proofreading Prices
- Wordvice Points
- Partner Discount
- Plagiarism Checker
- APA Citation Generator
- MLA Citation Generator
- Chicago Citation Generator
- Vancouver Citation Generator
- - APA Style
- - MLA Style
- - Chicago Style
- - Vancouver Style
- Writing & Editing Guide
- Academic Resources
- Admissions Resources

How to Write the Results/Findings Section in Research
What is the research paper Results section and what does it do?
The Results section of a scientific research paper represents the core findings of a study derived from the methods applied to gather and analyze information. It presents these findings in a logical sequence without bias or interpretation from the author, setting up the reader for later interpretation and evaluation in the Discussion section. A major purpose of the Results section is to break down the data into sentences that show its significance to the research question(s).
The Results section appears third in the section sequence in most scientific papers. It follows the presentation of the Methods and Materials and is presented before the Discussion section —although the Results and Discussion are presented together in many journals. This section answers the basic question “What did you find in your research?”
What is included in the Results section?
The Results section should include the findings of your study and ONLY the findings of your study. The findings include:
- Data presented in tables, charts, graphs, and other figures (may be placed into the text or on separate pages at the end of the manuscript)
- A contextual analysis of this data explaining its meaning in sentence form
- All data that corresponds to the central research question(s)
- All secondary findings (secondary outcomes, subgroup analyses, etc.)
If the scope of the study is broad, or if you studied a variety of variables, or if the methodology used yields a wide range of different results, the author should present only those results that are most relevant to the research question stated in the Introduction section .
As a general rule, any information that does not present the direct findings or outcome of the study should be left out of this section. Unless the journal requests that authors combine the Results and Discussion sections, explanations and interpretations should be omitted from the Results.
How are the results organized?
The best way to organize your Results section is “logically.” One logical and clear method of organizing research results is to provide them alongside the research questions—within each research question, present the type of data that addresses that research question.
Let’s look at an example. Your research question is based on a survey among patients who were treated at a hospital and received postoperative care. Let’s say your first research question is:

“What do hospital patients over age 55 think about postoperative care?”
This can actually be represented as a heading within your Results section, though it might be presented as a statement rather than a question:
Attitudes towards postoperative care in patients over the age of 55
Now present the results that address this specific research question first. In this case, perhaps a table illustrating data from a survey. Likert items can be included in this example. Tables can also present standard deviations, probabilities, correlation matrices, etc.
Following this, present a content analysis, in words, of one end of the spectrum of the survey or data table. In our example case, start with the POSITIVE survey responses regarding postoperative care, using descriptive phrases. For example:
“Sixty-five percent of patients over 55 responded positively to the question “ Are you satisfied with your hospital’s postoperative care ?” (Fig. 2)
Include other results such as subcategory analyses. The amount of textual description used will depend on how much interpretation of tables and figures is necessary and how many examples the reader needs in order to understand the significance of your research findings.
Next, present a content analysis of another part of the spectrum of the same research question, perhaps the NEGATIVE or NEUTRAL responses to the survey. For instance:
“As Figure 1 shows, 15 out of 60 patients in Group A responded negatively to Question 2.”
After you have assessed the data in one figure and explained it sufficiently, move on to your next research question. For example:
“How does patient satisfaction correspond to in-hospital improvements made to postoperative care?”

This kind of data may be presented through a figure or set of figures (for instance, a paired T-test table).
Explain the data you present, here in a table, with a concise content analysis:
“The p-value for the comparison between the before and after groups of patients was .03% (Fig. 2), indicating that the greater the dissatisfaction among patients, the more frequent the improvements that were made to postoperative care.”
Let’s examine another example of a Results section from a study on plant tolerance to heavy metal stress . In the Introduction section, the aims of the study are presented as “determining the physiological and morphological responses of Allium cepa L. towards increased cadmium toxicity” and “evaluating its potential to accumulate the metal and its associated environmental consequences.” The Results section presents data showing how these aims are achieved in tables alongside a content analysis, beginning with an overview of the findings:
“Cadmium caused inhibition of root and leave elongation, with increasing effects at higher exposure doses (Fig. 1a-c).”
The figure containing this data is cited in parentheses. Note that this author has combined three graphs into one single figure. Separating the data into separate graphs focusing on specific aspects makes it easier for the reader to assess the findings, and consolidating this information into one figure saves space and makes it easy to locate the most relevant results.

Following this overall summary, the relevant data in the tables is broken down into greater detail in text form in the Results section.
- “Results on the bio-accumulation of cadmium were found to be the highest (17.5 mg kgG1) in the bulb, when the concentration of cadmium in the solution was 1×10G2 M and lowest (0.11 mg kgG1) in the leaves when the concentration was 1×10G3 M.”
Captioning and Referencing Tables and Figures
Tables and figures are central components of your Results section and you need to carefully think about the most effective way to use graphs and tables to present your findings . Therefore, it is crucial to know how to write strong figure captions and to refer to them within the text of the Results section.
The most important advice one can give here as well as throughout the paper is to check the requirements and standards of the journal to which you are submitting your work. Every journal has its own design and layout standards, which you can find in the author instructions on the target journal’s website. Perusing a journal’s published articles will also give you an idea of the proper number, size, and complexity of your figures.
Regardless of which format you use, the figures should be placed in the order they are referenced in the Results section and be as clear and easy to understand as possible. If there are multiple variables being considered (within one or more research questions), it can be a good idea to split these up into separate figures. Subsequently, these can be referenced and analyzed under separate headings and paragraphs in the text.
To create a caption, consider the research question being asked and change it into a phrase. For instance, if one question is “Which color did participants choose?”, the caption might be “Color choice by participant group.” Or in our last research paper example, where the question was “What is the concentration of cadmium in different parts of the onion after 14 days?” the caption reads:
“Fig. 1(a-c): Mean concentration of Cd determined in (a) bulbs, (b) leaves, and (c) roots of onions after a 14-day period.”
Steps for Composing the Results Section
Because each study is unique, there is no one-size-fits-all approach when it comes to designing a strategy for structuring and writing the section of a research paper where findings are presented. The content and layout of this section will be determined by the specific area of research, the design of the study and its particular methodologies, and the guidelines of the target journal and its editors. However, the following steps can be used to compose the results of most scientific research studies and are essential for researchers who are new to preparing a manuscript for publication or who need a reminder of how to construct the Results section.
Step 1 : Consult the guidelines or instructions that the target journal or publisher provides authors and read research papers it has published, especially those with similar topics, methods, or results to your study.
- The guidelines will generally outline specific requirements for the results or findings section, and the published articles will provide sound examples of successful approaches.
- Note length limitations on restrictions on content. For instance, while many journals require the Results and Discussion sections to be separate, others do not—qualitative research papers often include results and interpretations in the same section (“Results and Discussion”).
- Reading the aims and scope in the journal’s “ guide for authors ” section and understanding the interests of its readers will be invaluable in preparing to write the Results section.
Step 2 : Consider your research results in relation to the journal’s requirements and catalogue your results.
- Focus on experimental results and other findings that are especially relevant to your research questions and objectives and include them even if they are unexpected or do not support your ideas and hypotheses.
- Catalogue your findings—use subheadings to streamline and clarify your report. This will help you avoid excessive and peripheral details as you write and also help your reader understand and remember your findings. Create appendices that might interest specialists but prove too long or distracting for other readers.
- Decide how you will structure of your results. You might match the order of the research questions and hypotheses to your results, or you could arrange them according to the order presented in the Methods section. A chronological order or even a hierarchy of importance or meaningful grouping of main themes or categories might prove effective. Consider your audience, evidence, and most importantly, the objectives of your research when choosing a structure for presenting your findings.
Step 3 : Design figures and tables to present and illustrate your data.
- Tables and figures should be numbered according to the order in which they are mentioned in the main text of the paper.
- Information in figures should be relatively self-explanatory (with the aid of captions), and their design should include all definitions and other information necessary for readers to understand the findings without reading all of the text.
- Use tables and figures as a focal point to tell a clear and informative story about your research and avoid repeating information. But remember that while figures clarify and enhance the text, they cannot replace it.
Step 4 : Draft your Results section using the findings and figures you have organized.
- The goal is to communicate this complex information as clearly and precisely as possible; precise and compact phrases and sentences are most effective.
- In the opening paragraph of this section, restate your research questions or aims to focus the reader’s attention to what the results are trying to show. It is also a good idea to summarize key findings at the end of this section to create a logical transition to the interpretation and discussion that follows.
- Try to write in the past tense and the active voice to relay the findings since the research has already been done and the agent is usually clear. This will ensure that your explanations are also clear and logical.
- Make sure that any specialized terminology or abbreviation you have used here has been defined and clarified in the Introduction section .
Step 5 : Review your draft; edit and revise until it reports results exactly as you would like to have them reported to your readers.
- Double-check the accuracy and consistency of all the data, as well as all of the visual elements included.
- Read your draft aloud to catch language errors (grammar, spelling, and mechanics), awkward phrases, and missing transitions.
- Ensure that your results are presented in the best order to focus on objectives and prepare readers for interpretations, valuations, and recommendations in the Discussion section . Look back over the paper’s Introduction and background while anticipating the Discussion and Conclusion sections to ensure that the presentation of your results is consistent and effective.
- Consider seeking additional guidance on your paper. Find additional readers to look over your Results section and see if it can be improved in any way. Peers, professors, or qualified experts can provide valuable insights.
One excellent option is to use a professional English proofreading and editing service such as Wordvice, including our paper editing service . With hundreds of qualified editors from dozens of scientific fields, Wordvice has helped thousands of authors revise their manuscripts and get accepted into their target journals. Read more about the proofreading and editing process before proceeding with getting academic editing services and manuscript editing services for your manuscript.
As the representation of your study’s data output, the Results section presents the core information in your research paper. By writing with clarity and conciseness and by highlighting and explaining the crucial findings of their study, authors increase the impact and effectiveness of their research manuscripts.
For more articles and videos on writing your research manuscript, visit Wordvice’s Resources page.
Wordvice Resources
- How to Write a Research Paper Introduction
- Which Verb Tenses to Use in a Research Paper
- How to Write an Abstract for a Research Paper
- How to Write a Research Paper Title
- Useful Phrases for Academic Writing
- Common Transition Terms in Academic Papers
- Active and Passive Voice in Research Papers
- 100+ Verbs That Will Make Your Research Writing Amazing
- Tips for Paraphrasing in Research Papers
- USC Libraries
- Research Guides
Organizing Your Social Sciences Research Paper
- 7. The Results
- Purpose of Guide
- Design Flaws to Avoid
- Independent and Dependent Variables
- Glossary of Research Terms
- Reading Research Effectively
- Narrowing a Topic Idea
- Broadening a Topic Idea
- Extending the Timeliness of a Topic Idea
- Academic Writing Style
- Applying Critical Thinking
- Choosing a Title
- Making an Outline
- Paragraph Development
- Research Process Video Series
- Executive Summary
- The C.A.R.S. Model
- Background Information
- The Research Problem/Question
- Theoretical Framework
- Citation Tracking
- Content Alert Services
- Evaluating Sources
- Primary Sources
- Secondary Sources
- Tiertiary Sources
- Scholarly vs. Popular Publications
- Qualitative Methods
- Quantitative Methods
- Insiderness
- Using Non-Textual Elements
- Limitations of the Study
- Common Grammar Mistakes
- Writing Concisely
- Avoiding Plagiarism
- Footnotes or Endnotes?
- Further Readings
- Generative AI and Writing
- USC Libraries Tutorials and Other Guides
- Bibliography
The results section is where you report the findings of your study based upon the methodology [or methodologies] you applied to gather information. The results section should state the findings of the research arranged in a logical sequence without bias or interpretation. A section describing results should be particularly detailed if your paper includes data generated from your own research.
Annesley, Thomas M. "Show Your Cards: The Results Section and the Poker Game." Clinical Chemistry 56 (July 2010): 1066-1070.
Importance of a Good Results Section
When formulating the results section, it's important to remember that the results of a study do not prove anything . Findings can only confirm or reject the hypothesis underpinning your study. However, the act of articulating the results helps you to understand the problem from within, to break it into pieces, and to view the research problem from various perspectives.
The page length of this section is set by the amount and types of data to be reported . Be concise. Use non-textual elements appropriately, such as figures and tables, to present findings more effectively. In deciding what data to describe in your results section, you must clearly distinguish information that would normally be included in a research paper from any raw data or other content that could be included as an appendix. In general, raw data that has not been summarized should not be included in the main text of your paper unless requested to do so by your professor.
Avoid providing data that is not critical to answering the research question . The background information you described in the introduction section should provide the reader with any additional context or explanation needed to understand the results. A good strategy is to always re-read the background section of your paper after you have written up your results to ensure that the reader has enough context to understand the results [and, later, how you interpreted the results in the discussion section of your paper that follows].
Bavdekar, Sandeep B. and Sneha Chandak. "Results: Unraveling the Findings." Journal of the Association of Physicians of India 63 (September 2015): 44-46; Brett, Paul. "A Genre Analysis of the Results Section of Sociology Articles." English for Specific Speakers 13 (1994): 47-59; Go to English for Specific Purposes on ScienceDirect;Burton, Neil et al. Doing Your Education Research Project . Los Angeles, CA: SAGE, 2008; Results. The Structure, Format, Content, and Style of a Journal-Style Scientific Paper. Department of Biology. Bates College; Kretchmer, Paul. Twelve Steps to Writing an Effective Results Section. San Francisco Edit; "Reporting Findings." In Making Sense of Social Research Malcolm Williams, editor. (London;: SAGE Publications, 2003) pp. 188-207.
Structure and Writing Style
I. Organization and Approach
For most research papers in the social and behavioral sciences, there are two possible ways of organizing the results . Both approaches are appropriate in how you report your findings, but use only one approach.
- Present a synopsis of the results followed by an explanation of key findings . This approach can be used to highlight important findings. For example, you may have noticed an unusual correlation between two variables during the analysis of your findings. It is appropriate to highlight this finding in the results section. However, speculating as to why this correlation exists and offering a hypothesis about what may be happening belongs in the discussion section of your paper.
- Present a result and then explain it, before presenting the next result then explaining it, and so on, then end with an overall synopsis . This is the preferred approach if you have multiple results of equal significance. It is more common in longer papers because it helps the reader to better understand each finding. In this model, it is helpful to provide a brief conclusion that ties each of the findings together and provides a narrative bridge to the discussion section of the your paper.
NOTE : Just as the literature review should be arranged under conceptual categories rather than systematically describing each source, you should also organize your findings under key themes related to addressing the research problem. This can be done under either format noted above [i.e., a thorough explanation of the key results or a sequential, thematic description and explanation of each finding].
II. Content
In general, the content of your results section should include the following:
- Introductory context for understanding the results by restating the research problem underpinning your study . This is useful in re-orientating the reader's focus back to the research problem after having read a review of the literature and your explanation of the methods used for gathering and analyzing information.
- Inclusion of non-textual elements, such as, figures, charts, photos, maps, tables, etc. to further illustrate key findings, if appropriate . Rather than relying entirely on descriptive text, consider how your findings can be presented visually. This is a helpful way of condensing a lot of data into one place that can then be referred to in the text. Consider referring to appendices if there is a lot of non-textual elements.
- A systematic description of your results, highlighting for the reader observations that are most relevant to the topic under investigation . Not all results that emerge from the methodology used to gather information may be related to answering the " So What? " question. Do not confuse observations with interpretations; observations in this context refers to highlighting important findings you discovered through a process of reviewing prior literature and gathering data.
- The page length of your results section is guided by the amount and types of data to be reported . However, focus on findings that are important and related to addressing the research problem. It is not uncommon to have unanticipated results that are not relevant to answering the research question. This is not to say that you don't acknowledge tangential findings and, in fact, can be referred to as areas for further research in the conclusion of your paper. However, spending time in the results section describing tangential findings clutters your overall results section and distracts the reader.
- A short paragraph that concludes the results section by synthesizing the key findings of the study . Highlight the most important findings you want readers to remember as they transition into the discussion section. This is particularly important if, for example, there are many results to report, the findings are complicated or unanticipated, or they are impactful or actionable in some way [i.e., able to be pursued in a feasible way applied to practice].
NOTE: Always use the past tense when referring to your study's findings. Reference to findings should always be described as having already happened because the method used to gather the information has been completed.
III. Problems to Avoid
When writing the results section, avoid doing the following :
- Discussing or interpreting your results . Save this for the discussion section of your paper, although where appropriate, you should compare or contrast specific results to those found in other studies [e.g., "Similar to the work of Smith [1990], one of the findings of this study is the strong correlation between motivation and academic achievement...."].
- Reporting background information or attempting to explain your findings. This should have been done in your introduction section, but don't panic! Often the results of a study point to the need for additional background information or to explain the topic further, so don't think you did something wrong. Writing up research is rarely a linear process. Always revise your introduction as needed.
- Ignoring negative results . A negative result generally refers to a finding that does not support the underlying assumptions of your study. Do not ignore them. Document these findings and then state in your discussion section why you believe a negative result emerged from your study. Note that negative results, and how you handle them, can give you an opportunity to write a more engaging discussion section, therefore, don't be hesitant to highlight them.
- Including raw data or intermediate calculations . Ask your professor if you need to include any raw data generated by your study, such as transcripts from interviews or data files. If raw data is to be included, place it in an appendix or set of appendices that are referred to in the text.
- Be as factual and concise as possible in reporting your findings . Do not use phrases that are vague or non-specific, such as, "appeared to be greater than other variables..." or "demonstrates promising trends that...." Subjective modifiers should be explained in the discussion section of the paper [i.e., why did one variable appear greater? Or, how does the finding demonstrate a promising trend?].
- Presenting the same data or repeating the same information more than once . If you want to highlight a particular finding, it is appropriate to do so in the results section. However, you should emphasize its significance in relation to addressing the research problem in the discussion section. Do not repeat it in your results section because you can do that in the conclusion of your paper.
- Confusing figures with tables . Be sure to properly label any non-textual elements in your paper. Don't call a chart an illustration or a figure a table. If you are not sure, go here .
Annesley, Thomas M. "Show Your Cards: The Results Section and the Poker Game." Clinical Chemistry 56 (July 2010): 1066-1070; Bavdekar, Sandeep B. and Sneha Chandak. "Results: Unraveling the Findings." Journal of the Association of Physicians of India 63 (September 2015): 44-46; Burton, Neil et al. Doing Your Education Research Project . Los Angeles, CA: SAGE, 2008; Caprette, David R. Writing Research Papers. Experimental Biosciences Resources. Rice University; Hancock, Dawson R. and Bob Algozzine. Doing Case Study Research: A Practical Guide for Beginning Researchers . 2nd ed. New York: Teachers College Press, 2011; Introduction to Nursing Research: Reporting Research Findings. Nursing Research: Open Access Nursing Research and Review Articles. (January 4, 2012); Kretchmer, Paul. Twelve Steps to Writing an Effective Results Section. San Francisco Edit ; Ng, K. H. and W. C. Peh. "Writing the Results." Singapore Medical Journal 49 (2008): 967-968; Reporting Research Findings. Wilder Research, in partnership with the Minnesota Department of Human Services. (February 2009); Results. The Structure, Format, Content, and Style of a Journal-Style Scientific Paper. Department of Biology. Bates College; Schafer, Mickey S. Writing the Results. Thesis Writing in the Sciences. Course Syllabus. University of Florida.
Writing Tip
Why Don't I Just Combine the Results Section with the Discussion Section?
It's not unusual to find articles in scholarly social science journals where the author(s) have combined a description of the findings with a discussion about their significance and implications. You could do this. However, if you are inexperienced writing research papers, consider creating two distinct sections for each section in your paper as a way to better organize your thoughts and, by extension, your paper. Think of the results section as the place where you report what your study found; think of the discussion section as the place where you interpret the information and answer the "So What?" question. As you become more skilled writing research papers, you can consider melding the results of your study with a discussion of its implications.
Driscoll, Dana Lynn and Aleksandra Kasztalska. Writing the Experimental Report: Methods, Results, and Discussion. The Writing Lab and The OWL. Purdue University.
- << Previous: Insiderness
- Next: Using Non-Textual Elements >>
- Last Updated: Apr 11, 2024 1:27 PM
- URL: https://libguides.usc.edu/writingguide
- Bipolar Disorder
- Therapy Center
- When To See a Therapist
- Types of Therapy
- Best Online Therapy
- Best Couples Therapy
- Best Family Therapy
- Managing Stress
- Sleep and Dreaming
- Understanding Emotions
- Self-Improvement
- Healthy Relationships
- Student Resources
- Personality Types
- Guided Meditations
- Verywell Mind Insights
- 2023 Verywell Mind 25
- Mental Health in the Classroom
- Editorial Process
- Meet Our Review Board
- Crisis Support
How to Write an APA Results Section
Kendra Cherry, MS, is a psychosocial rehabilitation specialist, psychology educator, and author of the "Everything Psychology Book."
:max_bytes(150000):strip_icc():format(webp)/IMG_9791-89504ab694d54b66bbd72cb84ffb860e.jpg "research a results")
Emily is a board-certified science editor who has worked with top digital publishing brands like Voices for Biodiversity, Study.com, GoodTherapy, Vox, and Verywell.
:max_bytes(150000):strip_icc():format(webp)/Emily-Swaim-1000-0f3197de18f74329aeffb690a177160c.jpg "research a results")
Verywell / Nusha Ashjaee
What to Include in an APA Results Section
- Justify Claims
- Summarize Results
Report All Relevant Results
- Report Statistical Findings
Include Tables and Figures
What not to include in an apa results section.
Psychology papers generally follow a specific structure. One important section of a paper is known as the results section. An APA results section of a psychology paper summarizes the data that was collected and the statistical analyses that were performed. The goal of this section is to report the results of your study or experiment without any type of subjective interpretation.
At a Glance
The results section is a vital part of an APA paper that summarizes a study's findings and statistical analysis. This section often includes descriptive text, tables, and figures to help summarize the findings. The focus is purely on summarizing and presenting the findings and should not include any interpretation, since you'll cover that in the subsequent discussion section.
This article covers how to write an APA results section, including what to include and what to avoid.
The results section is the third section of a psychology paper. It will appear after the introduction and methods sections and before the discussion section.
The results section should include:
- A summary of the research findings.
- Information about participant flow, recruitment, retention, and attrition. If some participants started the study and later left or failed to complete the study, then this should be described.
- Information about any reasons why some data might have been excluded from the study.
- Statistical information including samples sizes and statistical tests that were used. It should report standard deviations, p-values, and other measures of interest.
Results Should Justify Your Claims
Report data in order to sufficiently justify your conclusions. Since you'll be talking about your own interpretation of the results in the discussion section, you need to be sure that the information reported in the results section justifies your claims.
When you start writing your discussion section, you can then look back on your results to ensure that all the data you need are there to fully support your conclusions. Be sure not to make claims in your discussion section that are not supported by the findings described in your results section.
Summarize Your Results
Remember, you are summarizing the results of your psychological study, not reporting them in full detail. The results section should be a relatively brief overview of your findings, not a complete presentation of every single number and calculation.
If you choose, you can create a supplemental online archive where other researchers can access the raw data if they choose.
How long should a results section be?
The length of your results section will vary depending on the nature of your paper and the complexity of your research. In most cases, this will be the shortest section of your paper.
Just as the results section of your psychology paper should sufficiently justify your claims, it should also provide an accurate look at what you found in your study. Be sure to mention all relevant information.
Don't omit findings simply because they failed to support your predictions.
Your hypothesis may have expected more statistically significant results or your study didn't support your hypothesis , but that doesn't mean that the conclusions you reach are not useful. Provide data about what you found in your results section, then save your interpretation for what the results might mean in the discussion section.
While your study might not have supported your original predictions, your finding can provide important inspiration for future explorations into a topic.
How is the results section different from the discussion section?
The results section provides the results of your study or experiment. The goal of the section is to report what happened and the statistical analyses you performed. The discussion section is where you will examine what these results mean and whether they support or fail to support your hypothesis.
Report Your Statistical Findings
Always assume that your readers have a solid understanding of statistical concepts. There's no need to explain what a t-test is or how a one-way ANOVA works. Your responsibility is to report the results of your study, not to teach your readers how to analyze or interpret statistics.
Include Effect Sizes
The Publication Manual of the American Psychological Association recommends including effect sizes in your results section so that readers can appreciate the importance of your study's findings.
Your results section should include both text and illustrations. Presenting data in this way makes it easier for readers to quickly look at your results.
Structure your results section around tables or figures that summarize the results of your statistical analysis. In many cases, the easiest way to accomplish this is to first create your tables and figures and then organize them in a logical way. Next, write the summary text to support your illustrative materials.
Only include tables and figures if you are going to talk about them in the body text of your results section.
In addition to knowing what you should include in the results section of your psychology paper, it's also important to be aware of things that you should avoid putting in this section:
Cause-and-Effect Conclusions
Don't draw cause-effect conclusions. Avoid making any claims suggesting that your result "proves" that something is true.
Interpretations
Present the data without editorializing it. Save your comments and interpretations for the discussion section of your paper.
Statistics Without Context
Don't include statistics without narration. The results section should not be a numbers dump. Instead, you should sequentially narrate what these numbers mean.
Don't include the raw data in the results section. The results section should be a concise presentation of the results. If there is raw data that would be useful, include it in the appendix .
Don't only rely on descriptive text. Use tables and figures to present these findings when appropriate. This makes the results section easier to read and can convey a great deal of information quickly.
Repeated Data
Don't present the same data twice in your illustrative materials. If you have already presented some data in a table, don't present it again in a figure. If you have presented data in a figure, don't present it again in a table.
All of Your Findings
Don't feel like you have to include everything. If data is irrelevant to the research question, don't include it in the results section.
But Don't Skip Relevant Data
Don't leave out results because they don't support your claims. Even if your data does not support your hypothesis, including it in your findings is essential if it's relevant.
More Tips for Writing a Results Section
If you are struggling, there are a few things to remember that might help:
- Use the past tense . The results section should be written in the past tense.
- Be concise and objective . You will have the opportunity to give your own interpretations of the results in the discussion section.
- Use APA format . As you are writing your results section, keep a style guide on hand. The Publication Manual of the American Psychological Association is the official source for APA style.
- Visit your library . Read some journal articles that are on your topic. Pay attention to how the authors present the results of their research.
- Get a second opinion . If possible, take your paper to your school's writing lab for additional assistance.
What This Means For You
Remember, the results section of your paper is all about providing the data from your study. This section is often the shortest part of your paper, and in most cases, the most clinical.
Be sure not to include any subjective interpretation of the results. Simply relay the data in the most objective and straightforward way possible. You can then provide your own analysis of what these results mean in the discussion section of your paper.
Bavdekar SB, Chandak S. Results: Unraveling the findings . J Assoc Physicians India . 2015 Sep;63(9):44-6. PMID:27608866.
Snyder N, Foltz C, Lendner M, Vaccaro AR. How to write an effective results section . Clin Spine Surg . 2019;32(7):295-296. doi:10.1097/BSD.0000000000000845
American Psychological Association. Publication Manual of the American Psychological Association (7th ed.). Washington DC: The American Psychological Association; 2019.
Purdue Online Writing Lab. APA sample paper: Experimental psychology .
Berkeley University. Reviewing test results .
Tuncel A, Atan A. How to clearly articulate results and construct tables and figures in a scientific paper ? Turk J Urol . 2013;39(Suppl 1):16-19. doi:10.5152/tud.2013.048
By Kendra Cherry, MSEd Kendra Cherry, MS, is a psychosocial rehabilitation specialist, psychology educator, and author of the "Everything Psychology Book."

An official website of the United States government
The .gov means it’s official. Federal government websites often end in .gov or .mil. Before sharing sensitive information, make sure you’re on a federal government site.
The site is secure. The https:// ensures that you are connecting to the official website and that any information you provide is encrypted and transmitted securely.
- Publications
- Account settings
Preview improvements coming to the PMC website in October 2024. Learn More or Try it out now .
- Advanced Search
- Journal List
- Int J Endocrinol Metab
- v.17(2); 2019 Apr
The Principles of Biomedical Scientific Writing: Results
Zahra bahadoran.
1 Nutrition and Endocrine Research Center, Research Institute for Endocrine Sciences, Shahid Beheshti University of Medical Sciences, Tehran, Iran
Parvin Mirmiran
2 Department of Clinical Nutrition and Diet Therapy, Faculty of Nutrition Sciences and Food Technology, National Nutrition and Food Technology Research Institute, Shahid Beheshti University of Medical Sciences, Tehran, Iran
Azita Zadeh-Vakili
3 Cellular and Molecular Endocrine Research Center, Research Institute for Endocrine Sciences, Shahid Beheshti University of Medical Sciences, Tehran, Iran
Farhad Hosseinpanah
4 Obesity Research Center, Research Institute for Endocrine Sciences, Shahid Beheshti University of Medical Sciences, Tehran, Iran
Asghar Ghasemi
5 Endocrine Physiology Research Center, Research Institute for Endocrine Sciences, Shahid Beheshti University of Medical Sciences, Tehran, Iran
The “results section” of a scientific paper provides the results related to all measurements and outcomes that have been posted earlier in the materials and methods section. This section consists of text, figures, and tables presenting detailed data and facts without interpretation and discussion. Results may be presented in chronological order, general to specific order, most to least important order, or may be organized according to the topic/study groups or experiment/measured parameters. The primary content of this section includes the most relevant results that correspond to the central question stated in the introduction section, whether they support the hypothesis or not. Findings related to secondary outcomes and subgroup analyses may be reported in this section. All results should be presented in a clear, concise, and sensible manner. In this review, we discuss the function, content, and organization of the “results section,” as well as the principles and the most common tips for the writing of this section.
The “results section” is the heart of the paper, around which the other sections are organized ( 1 ). Research is about results and the reader comes to the paper to discover the results ( 2 ). In this section, authors contribute to the development of scientific literature by providing novel, hitherto unknown knowledge ( 3 ). In addition to the results, this section contains data and statistical information for supporting or refuting the hypothesis proposed in the introduction ( 4 ).
“Results section” should provide an objective description of the main findings, clearly and concisely, without interpretation ( 5 , 6 ). The authors need to use an interesting combination of text, tables, and figures to answer the study questions and to tell the story without diversions ( 7 ). The systemic assessment of published articles highlights the fact that the literature frequently suffers from selective reporting of results only for certain assessed outcomes, selective reporting of statistical analyses, and confused, ambiguous, incomplete, or misleading presentation of data ( 8 , 9 ).
In this section of our series on the principles of biomedical scientific writing ( 10 , 11 ), we describe the function, content, and organization of the “results section” in a scientific paper (mostly for hypothesis-testing papers) and provide common recommendations that can help authors to write this section more effectively.
2. The Function of the Results Section
The function of the “results section” is to present the main results of experiments described in the materials and methods section ( 12 , 13 ) and to present the supporting data in the form of text, tables, and figures ( 13 ). This section should answer the basic question: “What did the authors find in research?” By providing the results, authors try to elucidate the research data, making it to the point and meaningful ( 13 ).
3. Content of the Results Section
The “results section” includes both results and data that are presented in text, tables, and figures. Results are presented in the text; data (the most important) are presented in figures and tables, with a limited amount presented in the text ( 13 ). Statistically relevant parameters including sample size, P values, and the type of statistics used are also presented in this section ( 13 ).
3.1. Difference Between Data and Results
Data and results are not the same ( 14 ); providing results but no data vs. data but no results should be avoided ( 14 , 15 ). Results are general statements in the main text that summarize or explain what the data (facts and numbers) show ( 13 , 14 ); in other words, results are text descriptions of what is important about data ( 16 ) and give meaning to the data ( 15 ). When reporting data or results, make sure that they are logical ( 2 ). See Box 1 for more differences between results and data.
a The text presented in square brackets is data and the remainder is a result.
3.2. The Appropriate Format for Presenting Data/Results
Depending on how the data best support the findings of the study, the “results section” is structured as text, tables, and figures ( 12 ) and should consist of a dynamic interplay between text and figures/tables; the most important data are usually presented in both formats ( 17 ). The reader should select the mode of presentation in a way that optimizes comprehension of the data; however, as a general rule, if you want to present three or fewer numbers, you should use a sentence; otherwise, you consider a table or a graph ( 18 ).
Selecting the best format for presenting results/data depends on the level of details (exact values or patterns) to present ( 19 ). Tables are useful to present specific information or exact values ( 19 ), and function as reference tools for readers ( 20 ) whereas figures are useful to show comparisons and patterns ( 19 ), functioning as analytic tools ( 20 ).
Tables are meant to summarize large amounts of data, to organize and display data more clearly than words, to compare groups of data, to simplify found information, and to facilitate calculations ( 19 ). A table typically has three or more interrelated columns and three or more interrelated rows; otherwise, presenting the information in the text may be more appropriate ( 19 ).
The functions of figures include: (1) showing the underlying patterns of data that are not presentable in text or tables, (2) displaying data more clearly than they can be done in text or tables, (3) more summarizing a large amount of data than they can be done in text or tables, and (4) improving the understanding and locating the specific information easily and rapidly ( 21 ).
3.3. Results
The primary content of this section includes the most relevant (but not all) results corresponding to the central question posed in the introduction section, whether they support the hypothesis or not ( 12 , 13 ). The secondary findings, e.g., results related to secondary outcomes and subgroup analyses, may also be reported in this section ( 22 ). Results must be presented for both experimental and control groups ( 13 ). Results of each item mentioned in the materials and methods should be given in the results section ( 12 , 15 ).
The text of the “results section” should state and summarize the main results and explain the data presented within tables and/or figures ( 23 ); reiteration of all numbers presented in tables and figures is not recommended ( 22 ); however, readers must be given the main messages derived from a table or figure without having to interpret the data themselves ( 7 ). It means that if there is a large amount of data in a table or figure, restating a key piece of data in the text is acceptable and helps the reader zero in on important data ( 14 ).
3.3.1. Reporting Negative Findings
Authors are highly recommended excluding irrelevant results but not ignoring valid anomalous results that contradict the research hypothesis or do not support the current scientific literature ( 22 ). The Feynman, says “if you are doing an experiment, you should report everything that you think might make it invalid-not only what you think is right about it” ( 24 ). Although reporting null or negative findings is not as straightforward as positive findings, it may lead to reexamining current scientific thinking, and guide scientists towards unabridged science ( 25 ). Reporting negative findings can also prevent the replication of the study and prevent the waste of time and resources ( 25 ). The ignorance of null or negative findings also leads to an overestimation of an effect size or treatment effect in available data ( 9 ).
3.3.2. Referring to Unpublished Results
Referring to unpublished results is not recommend unless there is a strong argument supporting their inclusion ( 14 ); therefore, authors are advised to avoid using the term “data not shown” ( 4 ).
3.3.3. Methods or Interpretation in the Results Section
Generally, the “results section” is not the place for presenting methods and experimental details or interpreting data ( 14 ). When experiments are described in this section, if a result leads to additional experiments, it is better to report the new experimental details in the “results section” ( 14 ). Sometimes authors want to refer to a specific experiment or method in results; in these cases, they should not repeat experimental details, but preferably use a transition phrase to link methods with results ( 14 ). To justify the rationale behind the experiment, using topic sentences/phrases (e.g. in order to determine whether…) provides an overview before giving details ( 12 ); however, in this case, the method statement should not be used as a topic sentence and the main verbs should describe results, not methods (e.g., “ when propranolol was administered during normal ventilation, phospholipids decreased ”; here “ method ” is subordinated in a transition clause and result is the main clause) ( 13 ). Two patterns of sentence structure are recommended for including methods in a result statement: making the method the subject of the sentence or stating the method using a transition phrase or clause and the result in the main clause ( 13 ).
The traditional view of writing the “results section” is just to report data and results without any interpretation; accordingly, the result is not expected to contain statements that need to be referenced (comparisons of findings) ( 13 , 26 ). In another view, some interpretation or brief comparisons that do not fit into the discussion may be included ( 13 , 27 ).
Data are facts and numbers, mostly presented as non-textual elements (usually in tables and figures) where they are easy to read ( 13 , 14 , 28 ). A limited amount of data may also be presented in the text, following a result statement ( 13 ) although too much data in the text make it too long ( Box 1 ) ( 28 ). Data may be in the form of raw data, summarized data, or transformed data ( 13 ); however, it is suggested that raw data (i.e. patients’ records, individual observations) not be presented in results ( 12 ). Note that numerical data are absolute while some data, e.g. microscopic data, are subjective ( 2 ).
3.4.1. Non-Textual Elements
Providing study findings visually, rather than entire textualizing, enables authors to summarize a great deal of data compactly within the text with an appropriate reference; some images convey more than words ( 29 ). The primary purpose of non-textual elements, i.e. tables, graphs, figures, and maps, is to present data such that they can be easily and quickly grasped ( 23 ) while being more informative than when appearing in the text ( 6 ). Tables and figures should be complete/comprehensible, being able to stand alone without the text ( 5 , 12 ).
Non-textual elements should be referred to in the text at the appropriate point ( 5 , 6 , 12 ). Location statements, i.e. statements referring to non-textual elements, may be presented in different patterns (e.g., A. X is shown in table/figure; B. table/figure shows; C. see table/figure; D. as shown in table/figure); pattern B is more and pattern C is less common ( 27 ).

Some general tips about using non-textual elements in the “results section” are reviewed in Box 2 . The most common rules in organizing tables and figures are given in the following. For more information about designing different types of tables/figures/graphs, please refer to additional references ( 7 , 19 , 20 , 30 , 31 ).
3.4.1.1. Tables
The use of tables is an effective way to summarize demographic information and descriptive statistics ( 23 ). Note that tables must have a purpose and be integrated into the text ( 21 ). Tables are most useful to present counts, proportions, and percentages ( 8 ), and are appropriate also for presenting details especially when exact values matter ( 32 ), being are more informative than graphs ( 29 ). However, limited information should be presented in tables; otherwise, most readers find them difficult to read and thus, may ignore them ( 5 , 23 ). Data in tables can be arranged horizontally or vertically; whenever possible, primary comparisons are preferably presented horizontally from left to right ( 19 ).
3.4.1.1.1. Basic Elements of Tables
Tables usually have at least six elements: (1) table number, (2) table title, (3) row headings (stubs), and (4) column headings (boxes), identifying information in rows and columns, (5) data in data field, and (6) horizontal lines (rules). Most also have footnotes, row subheadings, spanner headings (identifying subgroups in column headings), and expanded forms of abbreviations in the table ( 19 , 21 , 31 , 33 ).
The table title should clearly state what appears in it and provide sufficient information on the study, i.e. provide a context helping readers interpret the table information ( 19 ). Some specific details may also be provided including the type and number of subjects or the period of study ( 30 ). For developing the title of a table, one can describe the main cell entries, followed by qualification or more description ( 32 ). The table’s title is presented as a phrase not a full sentence ( 19 ). Authors need to refer to the journal’s style for rules on which words in titles are capitalized.
As a rule, comparing two (or even three) numbers should be side-by-side rather than above and below ( 30 ). Column and row headings help readers find information and they should be included group sizes and measurement units ( 19 ). Tables should be in borderless grids of rows and columns ( 5 , 32 ) with no vertical rule and limited horizontal rules ( 32 ). The first column of a table includes usually a list of variables that are presented in the table; although the first column usually does not need a header, sometimes a simple description of what appears in each row may be provided as the heading of the first column. Units for variables may be placed in parentheses immediately below the row descriptions ( 30 ).
Headings for other columns should also be informative without vague labels, e.g. group A, group B, group C, etc.; instead, a brief description summarizing group characteristics is used ( 30 ). The last column may show P values for comparison between study groups ( 34 ), except for randomized clinical trials, where P values are not needed to compare baseline characteristics of participants ( 7 ). The first letters of lines and column headings in tables should be capitalized.
The fields of tables are points at which columns and rows intersect ( 19 ). Cells of a table are the data field of the table, other than those containing row and column headings ( 21 ). Cells contain information as numerals, text, or symbols ( 19 ). Every cell must contain information; if no information is available, one can use NA in the cell and define it in the footnote as not available or not applicable; alternatively, a dash mark may be inserted ( 19 ). The content of columns need to be aligned ( 19 ); words are usually left aligned, numerals are aligned at decimals, parenthesis, and factors of 10 ( 19 , 21 ).
Table footnotes should be brief, and define abbreviations, provide statistical results, and explain discrepancies in data, e.g., “percentages do not total 100 because of rounding” ( 19 , 30 ). In addition to asterisks usually used to show statistical significance ( 33 ), the following symbols are used, in sequence, for further notes: †, ‡, §, ¶, #, ††, ‡‡ ( 30 ).
3.4.1.1.2. Different Types of Tables
Table of lists, table of baseline or clinical characteristics of subjects, table of comparisons, and table of multivariable results are various types of tables that may be used ( 30 ). The table’s format should be selected according to the purpose of the table ( 30 ). A table of lists just presents a list of items including diagnostic criteria or causes of a disease; it is critical to arrange such tables based on their contents by order (e.g., alphabetical order) or their importance (most to least) ( 30 ). Tables of study participants’ characteristics usually provide a general overview of the essential characteristics of subjects, such as age, sex, race, disease stage, and selected risk factors ( 30 ). The table of comparisons (≥ two groups) provides details for each group and differences between the groups. Tables of multivariable results elaborate results of statistical analyses assessing relationships between predictor (independent) and outcome (dependent) variables, and usually include regression coefficients, standard errors, slopes, partial correlation coefficients, and P values or odds ratio, hazard ratios, and 95% confidence intervals for regression models ( 30 ).
3.4.1.2. Figures
Graphical elements convey the important messages of research ( 20 ). A figure is “any graphical display to present information or data” ( 20 ), and it effectively presents complicated patterns ( 32 ), best used for presenting an important point at a glance or indicating trends or relationships ( 20 ). Like tables, figures should have a purpose and be integrated with the rest of the text ( 21 ).
3.4.1.2.1. Basic Elements of Figures
Most figures that present quantitative information (charts and graphs) have at least seven elements, including figure number, figure caption/legend, data field, vertical scale, horizontal scale, labels, and data (plotting symbols, lines, and so on) ( 21 ). Some figures also have reference lines in the data field to help orient readers and keys that identify data ( 21 ).
Figure caption/legend, usually given below the figure, describes the figure and must reflect the figure entirely, independent of the main text ( 21 , 31 ). For the figure to stand alone, a figure legend needs to be included four parts (a brief title, experimental or statistical information/details, definitions of symbols, line, or bar patterns, and abbreviations) ( 31 ).
Data field is a space in the figure in which data are presented; it is usually bordered on the left by the X-axis (abscissa) and on the bottom by the Y-axis (ordinate) ( 20 , 21 ). Labels identify the variables graphed and the units of measurement ( 21 ). Figure lines should be broad and the labeling text should be large enough to be legible after reduction to a single- or two-column size ( 32 ). Appropriate font size should be used to maintain legibility after fitting figures to publication size ( 31 ).
Scales on each axis should match the data range and be slightly above the highest value ( 20 ). Symbols should be uniform across the figures ( 20 ). The data point symbols should be easily distinguishable; using black and white circles (● - ∘) is the easiest way when two are needed ( 31 ); if more are needed, using up-pointing triangles (▲ - Δ) and squares (■ - □) is suggested ( 31 ). Using symbols, line types, and colors is also effective in differentiating important strata in figures ( 8 ).
3.4.1.2.2. Emphasizing Important Data on Figures
To make figures visually efficient, the subordination of all non-data elements vs. data elements is advised (gridlines should be used as thin as possible and very faint). Directly labeling objects, instead of legends, may keep readers’ attention on the most important parts of the figure ( 8 ). Using different line weights may also be helpful to emphasize the important information/data in figures ( 31 ). The use of color, shading, or 3D perspectives is not suggested unless they serve a specific explanatory function in figure ( 8 ).
3.4.1.2.3. Different Types of Figures
Two major categories of figures are statistical figures (graphs) and non-statistical figures (clinical images, photographs, diagrams, illustrations, and textual figures) ( 20 ). Graphs are suitable for presenting relationships whereas non-statistical figures are used to confirm findings or provide explanatory information ( 20 ).
In statistical figures, selecting a graphical format (bar graph, line graph, dot plot, and scatterplot) is done according to the type of relationship that authors wish to communicate ( 20 ); for example, line graphs are appropriate for showing trends and bar graphs for magnitudes ( 20 ). Using a graphing format that is easy to interpret is preferred ( 20 ); pie graphs are sparingly used because comparing different angles is complicated with them ( 20 ). Graphs should accurately represent findings; when possible, scales should start at zero, and figure axes should not be altered in order to make data more meaningful ( 20 ).
Non-statistical figures are those that visually present information that does not contain data ( 20 ). Clinical images and photographs [ultrasonograms, computed tomographic scans (CT scans), magnetic resonance images (MRI), images of patients, tissue samples, microscopic findings, and so on] provide absolute proof of findings ( 20 ). Illustrations are used for explaining structures (parts of a cell), mechanisms, and relationships ( 20 ). Diagrams (flowcharts, algorithms, pedigrees, and maps) are useful for displaying complex relations ( 20 ). Textual figures, containing only text, are mostly used for describing steps of a procedure or summarizing guidelines ( 20 ). For photographs, patient information or identifiers should be removed ( 20 ).
3.5. Statistics in the Results Section
Statistics in the “results section” must report data in a way that enables readers to assess the degree of experimental variation and to estimate the variability or precision of the findings ( 22 ). For more details, one can see SAMPL (Statistical Analysis and methods in the Published Literature) guidelines ( 35 ). To report normally distributed data, the mean and estimated variation from mean should be stated ( 13 ). Variability should be reported using standard deviation (SD), which is a descriptive statistic ( 36 ) and reflects the dispersion of individual sample observation of the sample mean ( 37 ). The standard error (SE), an inferential statistic ( 36 ) reflecting the theoretical dispersion of sample means about some population means, characterizes uncertainty about true values of population means ( 37 ). It is useful for assessing the precision of an estimator ( 36 ) and is not an appropriate estimate of the variability in observations ( 37 ). Using “mean (SD or SE)” is preferred to “mean ± SD or SE” because the “±” sign can cause confusion ( 22 ). Increasing sample size decreases SE but not SD ( 36 ). To report data with a skewed distribution, the median and the interquartile range (between 25th and 75th percentiles) should be provided ( 22 ).
To report risk, rates, and ratios, one should use a type of rate (incidence rate, survival rate), ratio (odds ratio, hazards ratio), or risk (absolute risk, relative risk, relative risk reduction) ( 35 ). The measure of precision (95% CI) for estimated risks, rates, and ratios should also be provided ( 35 ). For correlation analysis, the exact values of the correlation coefficient and 95% CI should be reported. Describing correlation using qualitative words (low, moderate, high) without providing a clear definition is not acceptable ( 35 ). Results of regression analysis should include regression coefficients (β) of each explanatory variable, corresponding 95% CI and/or P value and a measure of the “goodness-of-fit” of the model ( 35 ).
3.5.1. Significance Levels
A P value is the probability of consistency between data and the hypothesis being tested ( 38 ). Reporting the exact P values ( P = 0.34 or P = 0.02) rather than the conventional P ( P < 0.05) is recommended for all primary analyses ( 12 , 37 ) as it conveys more information ( 37 ). The use of the term “partially significant” or “marginally significant”, where the P value is almost significant (e.g. P = 0.057) is not acceptable if the significance level is defined as P = 0.05 ( 39 ). Some, however, argue that it is not always necessary to stick to P = 0.05 for the interpretation of results and it is better to report the exact P value and confidence interval for the estimator ( 40 ).
The use of the 95% confidence interval (95% CI) can provide further information compared to P values per se, and prefigures the direction of the effect size (negative or positive), its magnitude, and the degree of precision ( 17 ). A confidence interval characterizes uncertainty about the true value of population parameters ( 37 ). It is essential to provide the sample size (n) and probability values for tests of statistical significance ( 13 ).
Statements about significance must be qualified numerically ( 41 ). In the text, it is suggested that P values be reported as equalities rather than as inequalities in relation to the alpha criterion ( 41 ). In tables and figures, inequalities may be useful for groups of data ( 41 ) where asterisks *, **, and *** are usually used to show statistical significance at 0.05, 0.01, and 0.001 probability levels, respectively ( 33 ).
Although not consistent, P values < 0.001 are reported as P < 0.001; for 0.001 ≤ P values < 0.01, a three-significant digit is recommended, e.g. P = 0.003; for 0.01 ≤ P values < 0.1, a two-significant digit is sufficient (e.g. P = 0.05); for 0.1 ≤ P values ≤ 0.9, a one-significant digit is sufficient (e.g. P = 0.4); and P values > 0.9 are reported as P > 0.9 ( 42 ). For genome-wide association studies, the power of 10 is used for reporting P values, e.g. 6 × 10 -9 ( 42 ). It is generally suggested that zero be used before a decimal point when the value is below one, e.g. 0.37 ( 43 ). According to the American Psychological Association, zero before a decimal point is used for numbers that are below one, but it can also be used for values that may exceed one (e.g. 0.23 cm). Therefore, when statistics cannot be greater than one (e.g. correlations, proportions, and P values), do not use a zero before decimal fraction, e.g. P = .028 not P = 0.028 ( 18 ); this recommendation, however, is not always adopted by everyone. The international standard is P (large italic) although both ‘p’ and ‘P’ are allowed ( 40 ).
4. Organization of the Results Section
There are different ways for organizing the “results section” including ( 1 , 12 , 14 , 22 , 44 ): (1) chronological order, (2) general to specific, (3) most to least important, and (4) grouping results by topic/study groups or experiment/measured parameters. Authors decide which format is more appropriate for the presentation of their data ( 12 ); anyway, results should be presented in a logical manner ( 4 ).
4.1. Different Ways of Organizing the Results Section
4.1.1. chronological order.
The best order for organizing “results section” may be the chronological order ( 22 ). It is considered as the most straightforward approach using subheadings that parallel methods ( 14 ). This order facilitates referring to a method associated with a given result ( 14 ) such that results are presented in the same order as methods ( 15 ).
4.1.2. General to Specific
This format is mostly used in clinical studies involving multiple groups of individuals receiving different treatments ( 14 ). The “results section” usually proceeds from general to more specific findings ( 1 ). Characteristics of the overall study population (sex and age distribution and dropouts) are first given ( 14 ), followed by data and results for each group starting with the control group or the group receiving the standard treatment ( 14 ); finally, the disease group or group receiving the experimental treatment are addressed ( 14 ). As a general rule, secondary results should be given after presenting more important (primary) results, followed by any supporting information ( 22 ). A common order is stating recruitment/response, characteristics of the sample/study participants, findings from the primary analyses, findings from secondary analyses, and any additional or unexpected findings ( 17 ). In other words, the “results section” should be initiated by univariate statistics, followed by bivariate analyses to describe associations between explanatory and outcome variables; finally, it gets through by any multivariate analyses ( 7 ).
4.1.3. Most to Least Important
This format is used in case that the order of presenting results is not critical to their being comprehendible and allows the author to immediately highlight important findings ( 14 ). Results that answer the main question are presented at the beginning of the “results section,” followed by other results in next paragraphs ( 13 ).
4.1.4. Grouping by Topic or Experiment
Comparison of the diagnostic and analytical performance of a number of assays for analytes is an example of using this format ( 14 ).
4.2. Paragraphing of the Results Section
The “results section” may be initiated by two approaches: (1) by giving a general (not detailed) overview of the experiment and (2) by going directly to the results by referring to tables or figures ( 44 ). The first paragraph of this section, along with table 1, describes the characteristics of the study population (number, sex, age, and symptoms) ( 23 ). These data show the comparability of the study groups at baseline and the distribution of potential confounders between groups, as a source of bias that can affect the study findings ( 7 ). It allows the reader to decide whether or not the case and control groups are similar and represent the patient population in their private practice ( 23 ).
For clinical trials, the number of patients completing the protocol in each treatment/study group, the number of patients lost to follow-up, and the number and reasons for excluded/withdrawn subjects should be given. Commenting on whether baseline characteristics of study groups are statistically similar or different is also important ( 1 ). For further information, authors can consult reporting guidelines for the main study types available at http://www.equator-network.org.
The number of the middle paragraphs depends on the number of research questions/hypotheses and the types of statistical analyses; each hypothesis or specific analysis typically devotes at least a paragraph to itself ( 1 ). Figure legends, description of the methods and results for control groups should not be given at the beginning of paragraphs, as they do not narrate the story ( 28 ). However, sometimes, it is needed that results of the control group are presented first (e.g. for establishing the stability of baseline) ( 13 ).
5. Emphasizing Important Results
Since not all results are equally important, the reader must be able to distinguish important results and authors have to emphasize important information and de-emphasize less important information ( 13 ). There are various techniques for emphasizing important information, including condensing or omitting less important information, subordinating less important information, placing important results at the power position, and labeling, stating, and repeating important information ( 13 ).
For condensing or omitting less important information, you should be careful not to duplicate/repeat data in tables and figures or repeat them in the text ( 4 , 6 , 12 ); one or two values from tables/figures can be repeated in the text for emphasis ( 13 ).
For subordinating less important information, one should not use table titles, figure legends or methods statement as a topic sentence in the text ( 13 , 22 ). Instead, after stating the first result relevant to the table/figure, you can cite it in parenthesis ( 13 ). Since a result states a message and creates an expectation, it is a more powerful topic sentence than a figure legend or table title ( 13 ). Sometimes, control results can be subordinated by incorporating them into experimental results ( 13 ).
To highlight more important results (those that help answer questions), authors can put these results at the beginning of paragraphs, the strongest power position ( 12 , 22 , 28 ), followed by supporting details and control results ( 28 ).
Moreover, key findings may receive more attention by using a signal (e.g. we found or we observed) at the beginning of the sentence ( 13 ).
6. Other Considerations
6.1. length and paragraphing.
To see the forest for the tree, the “results section” should be as brief and uncluttered as possible ( 13 ), which can be accomplished by having a well-organized “materials and methods” section ( 3 ) and avoiding unnecessary repetition ( 13 ); for example, similar results for several variables can be reported together. The “results section” of an original manuscript usually includes 2 - 3 pages (~1000 words) with a 1.5 line spacing, font size 11 (including tables and figures) ( 45 ), and 4 - 9 paragraphs (each 130 words) on average ( 45 ); a paragraph should be devoted to one or more closely related figures ( 4 ).
Presenting additional results/data as supplementary materials is a suggestion for keeping the “results section” brief ( 17 ). In addition to save the text space, supplementary materials improve the presentation and facilitate communications among scientists ( 46 , 47 ). According to Springer, supplementary materials can be used for presenting data that are not needed to support the major conclusions but are still interesting. However, keep in mind that the unregulated use of supplementary materials is harmful to science ( 47 ). Supplementary materials should be referred to at the appropriate points in the main text.
For referring to results obtained in hypothesis testing studies, using past tenses is recommended ( 4 , 12 - 14 ); non-textual elements should be referred using present tenses, e.g. “as seen in table 1 …” or “table 1 shows …” in descriptive studies, results are reported in the present tense ( 13 ).
6.3. Word Choice
Although adverbs/adjectives are commonly used to highlight the importance of results, it is recommended altogether avoiding the use of such qualitative/emotive words in the “results section” ( 7 , 13 ). Some believe that qualitative words should not be used because they may imply an interpretation of findings ( 17 ). In biomedical publications, the terms ‘significant, significance, and significantly’ (followed by P values) are used to show statistical relationships and should not be used for other purposes for which, other terms such as substantial, considerable, or noteworthy can be used ( 14 ). See Box 3 for appropriate word choice for the “results section.”
In the “results section,” to make a comparison between the results, i.e. stating the similarity/equivalence or difference/non-equivalence, using appropriate signals is recommended ( 27 ). To show a similarity, a signal to the reader may be used such as “like”, “alike”, “similar to”, and “the same as”; to show differences, the following signals can be used: “but”, “while”, “however”, “in contrast”, “more likely than”, and “less likely than” ( 27 ).
6.4. Reporting Numbers
Numbers play an important role in scientific communication and there are some golden rules for reporting numbers in a scientific paper ( 43 , 48 ). Significant figures (significant digits) should reflect the degree of precision of the original measurement ( 12 ). The number of digits reported for a quantity should be consistent with scientific relevance ( 37 ); for example, a resolution to 0.001 units is necessary for pH but a resolution of < 1 mm Hg is unimportant for blood pressure ( 37 ). Avoid using “about” or “approximately” to qualify a measurement or calculation ( 12 ). The use of percentage for sample sizes of < 20 and decimal for sample sizes of < 100 is not recommended ( 43 ).
The numbers should be spelled out at the beginning of a sentence or when they are less than 10, e.g., twelve students improved… ( 43 ). In a sentence, the authors should be consistent where they use numbers as numerals or spelled-out ( 43 ). Before a unit of a measure, time, dates, and points, numbers should be used as numerals, e.g. 12 cm; 1 h 34 min; at 12:30 A.M., and on a 7-point scale ( 18 ).
A space between the numeral and the unit should be considered, except in the case of %. Because the terms “billion,” “trillion,” and “quadrillion” imply different numbers in Europe and the USA, they should not be used ( 48 ). To express ranges in text, the terms “to” or “through” are preferred to dashes; in tables, the use of dashes or hyphens is recommended ( 48 ).
7. Conclusions
The “results section” of a biomedical manuscript should clearly present findings of the study using an effective combination of results and data. Some dos and don’ts of writing the “results section” are provided in Box 4 . Authors should try to find the best format using a dynamic interplay between text and figures/tables. Results can be organized in different ways including chronological order or most to least important; however, results should be presented in a manner that makes sense.
Acknowledgments
The authors wish to acknowledge Ms. Niloofar Shiva for critical editing of English grammar and syntax of the manuscript.
Conflict of Interests: It is not declared by the authors.
Funding/Support: Research Institute for Endocrine Sciences supported the study.

- Langson Library
- Science Library
- Grunigen Medical Library
- Law Library
- Connect From Off-Campus
- Accessibility
- Gateway Study Center
Email this link
Writing a scientific paper.
- Writing a lab report
- INTRODUCTION
Writing a "good" results section
Figures and Captions in Lab Reports
"Results Checklist" from: How to Write a Good Scientific Paper. Chris A. Mack. SPIE. 2018.
Additional tips for results sections.
- LITERATURE CITED
- Bibliography of guides to scientific writing and presenting
- Peer Review
- Presentations
- Lab Report Writing Guides on the Web
This is the core of the paper. Don't start the results sections with methods you left out of the Materials and Methods section. You need to give an overall description of the experiments and present the data you found.
- Factual statements supported by evidence. Short and sweet without excess words
- Present representative data rather than endlessly repetitive data
- Discuss variables only if they had an effect (positive or negative)
- Use meaningful statistics
- Avoid redundancy. If it is in the tables or captions you may not need to repeat it
A short article by Dr. Brett Couch and Dr. Deena Wassenberg, Biology Program, University of Minnesota
- Present the results of the paper, in logical order, using tables and graphs as necessary.
- Explain the results and show how they help to answer the research questions posed in the Introduction. Evidence does not explain itself; the results must be presented and then explained.
- Avoid: presenting results that are never discussed; presenting results in chronological order rather than logical order; ignoring results that do not support the conclusions;
- Number tables and figures separately beginning with 1 (i.e. Table 1, Table 2, Figure 1, etc.).
- Do not attempt to evaluate the results in this section. Report only what you found; hold all discussion of the significance of the results for the Discussion section.
- It is not necessary to describe every step of your statistical analyses. Scientists understand all about null hypotheses, rejection rules, and so forth and do not need to be reminded of them. Just say something like, "Honeybees did not use the flowers in proportion to their availability (X2 = 7.9, p<0.05, d.f.= 4, chi-square test)." Likewise, cite tables and figures without describing in detail how the data were manipulated. Explanations of this sort should appear in a legend or caption written on the same page as the figure or table.
- You must refer in the text to each figure or table you include in your paper.
- Tables generally should report summary-level data, such as means ± standard deviations, rather than all your raw data. A long list of all your individual observations will mean much less than a few concise, easy-to-read tables or figures that bring out the main findings of your study.
- Only use a figure (graph) when the data lend themselves to a good visual representation. Avoid using figures that show too many variables or trends at once, because they can be hard to understand.
From: https://writingcenter.gmu.edu/guides/imrad-results-discussion
- << Previous: METHODS
- Next: DISCUSSION >>
- Last Updated: Aug 4, 2023 9:33 AM
- URL: https://guides.lib.uci.edu/scientificwriting
Off-campus? Please use the Software VPN and choose the group UCIFull to access licensed content. For more information, please Click here
Software VPN is not available for guests, so they may not have access to some content when connecting from off-campus.

- Manuscript Preparation
How to write the results section of a research paper
- 3 minute read
- 56.6K views
Table of Contents
At its core, a research paper aims to fill a gap in the research on a given topic. As a result, the results section of the paper, which describes the key findings of the study, is often considered the core of the paper. This is the section that gets the most attention from reviewers, peers, students, and any news organization reporting on your findings. Writing a clear, concise, and logical results section is, therefore, one of the most important parts of preparing your manuscript.
Difference between results and discussion
Before delving into how to write the results section, it is important to first understand the difference between the results and discussion sections. The results section needs to detail the findings of the study. The aim of this section is not to draw connections between the different findings or to compare it to previous findings in literature—that is the purview of the discussion section. Unlike the discussion section, which can touch upon the hypothetical, the results section needs to focus on the purely factual. In some cases, it may even be preferable to club these two sections together into a single section. For example, while writing a review article, it can be worthwhile to club these two sections together, as the main results in this case are the conclusions that can be drawn from the literature.
Structure of the results section
Although the main purpose of the results section in a research paper is to report the findings, it is necessary to present an introduction and repeat the research question. This establishes a connection to the previous section of the paper and creates a smooth flow of information.
Next, the results section needs to communicate the findings of your research in a systematic manner. The section needs to be organized such that the primary research question is addressed first, then the secondary research questions. If the research addresses multiple questions, the results section must individually connect with each of the questions. This ensures clarity and minimizes confusion while reading.
Consider representing your results visually. For example, graphs, tables, and other figures can help illustrate the findings of your paper, especially if there is a large amount of data in the results.
Remember, an appealing results section can help peer reviewers better understand the merits of your research, thereby increasing your chances of publication.
Practical guidance for writing an effective results section for a research paper
- Always use simple and clear language. Avoid the use of uncertain or out-of-focus expressions.
- The findings of the study must be expressed in an objective and unbiased manner. While it is acceptable to correlate certain findings in the discussion section, it is best to avoid overinterpreting the results.
- If the research addresses more than one hypothesis, use sub-sections to describe the results. This prevents confusion and promotes understanding.
- Ensure that negative results are included in this section, even if they do not support the research hypothesis.
- Wherever possible, use illustrations like tables, figures, charts, or other visual representations to showcase the results of your research paper. Mention these illustrations in the text, but do not repeat the information that they convey.
- For statistical data, it is adequate to highlight the tests and explain their results. The initial or raw data should not be mentioned in the results section of a research paper.
The results section of a research paper is usually the most impactful section because it draws the greatest attention. Regardless of the subject of your research paper, a well-written results section is capable of generating interest in your research.
For detailed information and assistance on writing the results of a research paper, refer to Elsevier Author Services.

- Research Process
Writing a good review article

Why is data validation important in research?
You may also like.

Make Hook, Line, and Sinker: The Art of Crafting Engaging Introductions

Can Describing Study Limitations Improve the Quality of Your Paper?

A Guide to Crafting Shorter, Impactful Sentences in Academic Writing

6 Steps to Write an Excellent Discussion in Your Manuscript

How to Write Clear and Crisp Civil Engineering Papers? Here are 5 Key Tips to Consider

The Clear Path to An Impactful Paper: ②

The Essentials of Writing to Communicate Research in Medicine

Changing Lines: Sentence Patterns in Academic Writing
Input your search keywords and press Enter.
Organizing Academic Research Papers: 7. The Results
- Purpose of Guide
- Design Flaws to Avoid
- Glossary of Research Terms
- Narrowing a Topic Idea
- Broadening a Topic Idea
- Extending the Timeliness of a Topic Idea
- Academic Writing Style
- Choosing a Title
- Making an Outline
- Paragraph Development
- Executive Summary
- Background Information
- The Research Problem/Question
- Theoretical Framework
- Citation Tracking
- Content Alert Services
- Evaluating Sources
- Primary Sources
- Secondary Sources
- Tertiary Sources
- What Is Scholarly vs. Popular?
- Qualitative Methods
- Quantitative Methods
- Using Non-Textual Elements
- Limitations of the Study
- Common Grammar Mistakes
- Avoiding Plagiarism
- Footnotes or Endnotes?
- Further Readings
- Annotated Bibliography
- Dealing with Nervousness
- Using Visual Aids
- Grading Someone Else's Paper
- How to Manage Group Projects
- Multiple Book Review Essay
- Reviewing Collected Essays
- About Informed Consent
- Writing Field Notes
- Writing a Policy Memo
- Writing a Research Proposal
- Acknowledgements
The results section of the research paper is where you report the findings of your study based upon the information gathered as a result of the methodology [or methodologies] you applied. The results section should simply state the findings, without bias or interpretation, and arranged in a logical sequence. The results section should always be written in the past tense. A section describing results [a.k.a., "findings"] is particularly necessary if your paper includes data generated from your own research.
Importance of a Good Results Section
When formulating the results section, it's important to remember that the results of a study do not prove anything . Research results can only confirm or reject the research problem underpinning your study. However, the act of articulating the results helps you to understand the problem from within, to break it into pieces, and to view the research problem from various perspectives.
The page length of this section is set by the amount and types of data to be reported . Be concise, using non-textual elements, such as figures and tables, if appropriate, to present results more effectively. In deciding what data to describe in your results section, you must clearly distinguish material that would normally be included in a research paper from any raw data or other material that could be included as an appendix. In general, raw data should not be included in the main text of your paper unless requested to do so by your professor.
Avoid providing data that is not critical to answering the research question . The background information you described in the introduction section should provide the reader with any additional context or explanation needed to understand the results. A good rule is to always re-read the background section of your paper after you have written up your results to ensure that the reader has enough context to understand the results [and, later, how you interpreted the results in the discussion section of your paper].
Bates College; Burton, Neil et al. Doing Your Education Research Project . Los Angeles, CA: SAGE, 2008; Results . The Structure, Format, Content, and Style of a Journal-Style Scientific Paper. Department of Biology. Bates College.
Structure and Writing Style
I. Structure and Approach
For most research paper formats, there are two ways of presenting and organizing the results .
- Present the results followed by a short explanation of the findings . For example, you may have noticed an unusual correlation between two variables during the analysis of your findings. It is correct to point this out in the results section. However, speculating as to why this correlation exists, and offering a hypothesis about what may be happening, belongs in the discussion section of your paper.
- Present a section and then discuss it, before presenting the next section then discussing it, and so on . This is more common in longer papers because it helps the reader to better understand each finding. In this model, it can be helpful to provide a brief conclusion in the results section that ties each of the findings together and links to the discussion.
NOTE: The discussion section should generally follow the same format chosen in presenting and organizing the results.
II. Content
In general, the content of your results section should include the following elements:
- An introductory context for understanding the results by restating the research problem that underpins the purpose of your study.
- A summary of your key findings arranged in a logical sequence that generally follows your methodology section.
- Inclusion of non-textual elements, such as, figures, charts, photos, maps, tables, etc. to further illustrate the findings, if appropriate.
- In the text, a systematic description of your results, highlighting for the reader observations that are most relevant to the topic under investigation [remember that not all results that emerge from the methodology that you used to gather the data may be relevant].
- Use of the past tense when refering to your results.
- The page length of your results section is guided by the amount and types of data to be reported. However, focus only on findings that are important and related to addressing the research problem.
Using Non-textual Elements
- Either place figures, tables, charts, etc. within the text of the result, or include them in the back of the report--do one or the other but never do both.
- In the text, refer to each non-textual element in numbered order [e.g., Table 1, Table 2; Chart 1, Chart 2; Map 1, Map 2].
- If you place non-textual elements at the end of the report, make sure they are clearly distinguished from any attached appendix materials, such as raw data.
- Regardless of placement, each non-textual element must be numbered consecutively and complete with caption [caption goes under the figure, table, chart, etc.]
- Each non-textual element must be titled, numbered consecutively, and complete with a heading [title with description goes above the figure, table, chart, etc.].
- In proofreading your results section, be sure that each non-textual element is sufficiently complete so that it could stand on its own, separate from the text.
III. Problems to Avoid
When writing the results section, avoid doing the following :
- Discussing or interpreting your results . Save all this for the next section of your paper, although where appropriate, you should compare or contrast specific results to those found in other studies [e.g., "Similar to Smith [1990], one of the findings of this study is the strong correlation between motivation and academic achievement...."].
- Reporting background information or attempting to explain your findings ; this should have been done in your Introduction section, but don't panic! Often the results of a study point to the need to provide additional background information or to explain the topic further, so don't think you did something wrong. Revise your introduction as needed.
- Ignoring negative results . If some of your results fail to support your hypothesis, do not ignore them. Document them, then state in your discussion section why you believe a negative result emerged from your study. Note that negative results, and how you handle them, often provides you with the opportunity to write a more engaging discussion section, therefore, don't be afraid to highlight them.
- Including raw data or intermediate calculations . Ask your professor if you need to include any raw data generated by your study, such as transcripts from interviews or data files. If raw data is to be included, place it in an appendix or set of appendices that are referred to in the text.
- Be as factual and concise as possible in reporting your findings . Do not use phrases that are vague or non-specific, such as, "appeared to be greater or lesser than..." or "demonstrates promising trends that...."
- Presenting the same data or repeating the same information more than once . If you feel the need to highlight something, you will have a chance to do that in the discussion section.
- Confusing figures with tables . Be sure to properly label any non-textual elements in your paper. If you are not sure, look up the term in a dictionary.
Burton, Neil et al. Doing Your Education Research Project . Los Angeles, CA: SAGE, 2008; Caprette, David R. Writing Research Papers . Experimental Biosciences Resources. Rice University; Hancock, Dawson R. and Bob Algozzine. Doing Case Study Research: A Practical Guide for Beginning Researchers . 2nd ed. New York: Teachers College Press, 2011; Introduction to Nursing Research: Reporting Research Findings. Nursing Research: Open Access Nursing Research and Review Articles. (January 4, 2012); Reporting Research Findings. Wilder Research, in partnership with the Minnesota Department of Human Services. (February 2009); Results . The Structure, Format, Content, and Style of a Journal-Style Scientific Paper. Department of Biology. Bates College; Schafer, Mickey S. Writing the Results . Thesis Writing in the Sciences. Course Syllabus. University of Florida.
Writing Tip
Why Don't I Just Combine the Results Section with the Discussion Section?
It's not unusual to find articles in social science journals where the author(s) have combined a description of the findings from the study with a discussion about their implications. You could do this. However, if you are inexperienced writing research papers, consider creating two sections for each element in your paper as a way to better organize your thoughts and, by extension, your paper. Think of the results section as the place where you report what your study found; think of the discussion section as the place where you interpret your data and answer the "so what?" question. As you become more skilled writing research papers, you may want to meld the results of your study with a discussion of its implications.
- << Previous: Quantitative Methods
- Next: Using Non-Textual Elements >>
- Last Updated: Jul 18, 2023 11:58 AM
- URL: https://library.sacredheart.edu/c.php?g=29803
- QuickSearch
- Library Catalog
- Databases A-Z
- Publication Finder
- Course Reserves
- Citation Linker
- Digital Commons
- Our Website
Research Support
- Ask a Librarian
- Appointments
- Interlibrary Loan (ILL)
- Research Guides
- Databases by Subject
- Citation Help
Using the Library
- Reserve a Group Study Room
- Renew Books
- Honors Study Rooms
- Off-Campus Access
- Library Policies
- Library Technology
User Information
- Grad Students
- Online Students
- COVID-19 Updates
- Staff Directory
- News & Announcements
- Library Newsletter
My Accounts
- Interlibrary Loan
- Staff Site Login
FIND US ON
How to Write an Effective Results Section
Affiliation.
- 1 Rothman Orthopaedics Institute, Philadelphia, PA.
- PMID: 31145152
- DOI: 10.1097/BSD.0000000000000845
Developing a well-written research paper is an important step in completing a scientific study. This paper is where the principle investigator and co-authors report the purpose, methods, findings, and conclusions of the study. A key element of writing a research paper is to clearly and objectively report the study's findings in the Results section. The Results section is where the authors inform the readers about the findings from the statistical analysis of the data collected to operationalize the study hypothesis, optimally adding novel information to the collective knowledge on the subject matter. By utilizing clear, concise, and well-organized writing techniques and visual aids in the reporting of the data, the author is able to construct a case for the research question at hand even without interpreting the data.
- Data Analysis
- Peer Review, Research*
- Publishing*
- Sample Size

The Quintessence of Basic and Clinical Research and Scientific Publishing pp 717–731 Cite as
How to Present Results in a Research Paper
- Aparna Mukherjee 4 ,
- Gunjan Kumar 4 &
- Rakesh Lodha 5
- First Online: 01 October 2023
626 Accesses
The results section is the core of a research manuscript where the study data and analyses are presented in an organized, uncluttered manner such that the reader can easily understand and interpret the findings. This section is completely factual; there is no place for opinions or explanations from the authors. The results should correspond to the objectives of the study in an orderly manner. Self-explanatory tables and figures add value to this section and make data presentation more convenient and appealing. The results presented in this section should have a link with both the preceding methods section and the following discussion section. A well-written, articulate results section lends clarity and credibility to the research paper and the study as a whole. This chapter provides an overview and important pointers to effective drafting of the results section in a research manuscript and also in theses.
This is a preview of subscription content, log in via an institution .
Buying options
- Available as PDF
- Read on any device
- Instant download
- Own it forever
- Available as EPUB and PDF
- Durable hardcover edition
- Dispatched in 3 to 5 business days
- Free shipping worldwide - see info
Tax calculation will be finalised at checkout
Purchases are for personal use only
Kallestinova ED (2011) How to write your first research paper. Yale J Biol Med 84(3):181–190
PubMed PubMed Central Google Scholar
STROBE. STROBE. [cited 2022 Nov 10]. https://www.strobe-statement.org/
Consort—Welcome to the CONSORT Website. http://www.consort-statement.org/ . Accessed 10 Nov 2022
Korevaar DA, Cohen JF, Reitsma JB, Bruns DE, Gatsonis CA, Glasziou PP et al (2016) Updating standards for reporting diagnostic accuracy: the development of STARD 2015. Res Integr Peer Rev 1(1):7
Article PubMed PubMed Central Google Scholar
Page MJ, McKenzie JE, Bossuyt PM, Boutron I, Hoffmann TC, Mulrow CD et al (2021) The PRISMA 2020 statement: an updated guideline for reporting systematic reviews. BMJ 372:n71
Page MJ, Moher D, Bossuyt PM, Boutron I, Hoffmann TC, Mulrow CD et al (2021) PRISMA 2020 explanation and elaboration: updated guidance and exemplars for reporting systematic reviews. BMJ 372:n160
Consolidated criteria for reporting qualitative research (COREQ): a 32-item checklist for interviews and focus groups | EQUATOR Network. https://www.equator-network.org/reporting-guidelines/coreq/ . Accessed 10 Nov 2022
Aggarwal R, Sahni P (2015) The results section. In: Aggarwal R, Sahni P (eds) Reporting and publishing research in the biomedical sciences, 1st edn. National Medical Journal of India, Delhi, pp 24–44
Google Scholar
Mukherjee A, Lodha R (2016) Writing the results. Indian Pediatr 53(5):409–415
Article PubMed Google Scholar
Lodha R, Randev S, Kabra SK (2016) Oral antibiotics for community acquired pneumonia with chest indrawing in children aged below five years: a systematic review. Indian Pediatr 53(6):489–495
Anderson C (2010) Presenting and evaluating qualitative research. Am J Pharm Educ 74(8):141
Roberts C, Kumar K, Finn G (2020) Navigating the qualitative manuscript writing process: some tips for authors and reviewers. BMC Med Educ 20:439
Bigby C (2015) Preparing manuscripts that report qualitative research: avoiding common pitfalls and illegitimate questions. Aust Soc Work 68(3):384–391
Article Google Scholar
Vincent BP, Kumar G, Parameswaran S, Kar SS (2019) Barriers and suggestions towards deceased organ donation in a government tertiary care teaching hospital: qualitative study using socio-ecological model framework. Indian J Transplant 13(3):194
McCormick JB, Hopkins MA (2021) Exploring public concerns for sharing and governance of personal health information: a focus group study. JAMIA Open 4(4):ooab098
Groenland -emeritus professor E. Employing the matrix method as a tool for the analysis of qualitative research data in the business domain. Rochester, NY; 2014. https://papers.ssrn.com/abstract=2495330 . Accessed 10 Nov 2022
Download references
Acknowledgments
The book chapter is derived in part from our article “Mukherjee A, Lodha R. Writing the Results. Indian Pediatr. 2016 May 8;53(5):409-15.” We thank the Editor-in-Chief of the journal “Indian Pediatrics” for the permission for the same.
Author information
Authors and affiliations.
Clinical Studies, Trials and Projection Unit, Indian Council of Medical Research, New Delhi, India
Aparna Mukherjee & Gunjan Kumar
Department of Pediatrics, All India Institute of Medical Sciences, New Delhi, India
Rakesh Lodha
You can also search for this author in PubMed Google Scholar
Corresponding author
Correspondence to Rakesh Lodha .
Editor information
Editors and affiliations.
Retired Senior Expert Pharmacologist at the Office of Cardiology, Hematology, Endocrinology, and Nephrology, Center for Drug Evaluation and Research, US Food and Drug Administration, Silver Spring, MD, USA
Gowraganahalli Jagadeesh
Professor & Director, Research Training and Publications, The Office of Research and Development, Periyar Maniammai Institute of Science & Technology (Deemed to be University), Vallam, Tamil Nadu, India
Pitchai Balakumar
Division Cardiology & Nephrology, Office of Cardiology, Hematology, Endocrinology and Nephrology, Center for Drug Evaluation and Research, US Food and Drug Administration, Silver Spring, MD, USA
Fortunato Senatore
Ethics declarations
Rights and permissions.
Reprints and permissions
Copyright information
© 2023 The Author(s), under exclusive license to Springer Nature Singapore Pte Ltd.
About this chapter
Cite this chapter.
Mukherjee, A., Kumar, G., Lodha, R. (2023). How to Present Results in a Research Paper. In: Jagadeesh, G., Balakumar, P., Senatore, F. (eds) The Quintessence of Basic and Clinical Research and Scientific Publishing. Springer, Singapore. https://doi.org/10.1007/978-981-99-1284-1_44
Download citation
DOI : https://doi.org/10.1007/978-981-99-1284-1_44
Published : 01 October 2023
Publisher Name : Springer, Singapore
Print ISBN : 978-981-99-1283-4
Online ISBN : 978-981-99-1284-1
eBook Packages : Biomedical and Life Sciences Biomedical and Life Sciences (R0)
Share this chapter
Anyone you share the following link with will be able to read this content:
Sorry, a shareable link is not currently available for this article.
Provided by the Springer Nature SharedIt content-sharing initiative
- Publish with us
Policies and ethics
- Find a journal
- Track your research
- Privacy Policy
Buy Me a Coffee
Home » Research Report – Example, Writing Guide and Types
Research Report – Example, Writing Guide and Types
Table of Contents

Research Report
Definition:
Research Report is a written document that presents the results of a research project or study, including the research question, methodology, results, and conclusions, in a clear and objective manner.
The purpose of a research report is to communicate the findings of the research to the intended audience, which could be other researchers, stakeholders, or the general public.
Components of Research Report
Components of Research Report are as follows:
Introduction
The introduction sets the stage for the research report and provides a brief overview of the research question or problem being investigated. It should include a clear statement of the purpose of the study and its significance or relevance to the field of research. It may also provide background information or a literature review to help contextualize the research.
Literature Review
The literature review provides a critical analysis and synthesis of the existing research and scholarship relevant to the research question or problem. It should identify the gaps, inconsistencies, and contradictions in the literature and show how the current study addresses these issues. The literature review also establishes the theoretical framework or conceptual model that guides the research.
Methodology
The methodology section describes the research design, methods, and procedures used to collect and analyze data. It should include information on the sample or participants, data collection instruments, data collection procedures, and data analysis techniques. The methodology should be clear and detailed enough to allow other researchers to replicate the study.
The results section presents the findings of the study in a clear and objective manner. It should provide a detailed description of the data and statistics used to answer the research question or test the hypothesis. Tables, graphs, and figures may be included to help visualize the data and illustrate the key findings.
The discussion section interprets the results of the study and explains their significance or relevance to the research question or problem. It should also compare the current findings with those of previous studies and identify the implications for future research or practice. The discussion should be based on the results presented in the previous section and should avoid speculation or unfounded conclusions.
The conclusion summarizes the key findings of the study and restates the main argument or thesis presented in the introduction. It should also provide a brief overview of the contributions of the study to the field of research and the implications for practice or policy.
The references section lists all the sources cited in the research report, following a specific citation style, such as APA or MLA.
The appendices section includes any additional material, such as data tables, figures, or instruments used in the study, that could not be included in the main text due to space limitations.
Types of Research Report
Types of Research Report are as follows:
Thesis is a type of research report. A thesis is a long-form research document that presents the findings and conclusions of an original research study conducted by a student as part of a graduate or postgraduate program. It is typically written by a student pursuing a higher degree, such as a Master’s or Doctoral degree, although it can also be written by researchers or scholars in other fields.
Research Paper
Research paper is a type of research report. A research paper is a document that presents the results of a research study or investigation. Research papers can be written in a variety of fields, including science, social science, humanities, and business. They typically follow a standard format that includes an introduction, literature review, methodology, results, discussion, and conclusion sections.
Technical Report
A technical report is a detailed report that provides information about a specific technical or scientific problem or project. Technical reports are often used in engineering, science, and other technical fields to document research and development work.
Progress Report
A progress report provides an update on the progress of a research project or program over a specific period of time. Progress reports are typically used to communicate the status of a project to stakeholders, funders, or project managers.
Feasibility Report
A feasibility report assesses the feasibility of a proposed project or plan, providing an analysis of the potential risks, benefits, and costs associated with the project. Feasibility reports are often used in business, engineering, and other fields to determine the viability of a project before it is undertaken.
Field Report
A field report documents observations and findings from fieldwork, which is research conducted in the natural environment or setting. Field reports are often used in anthropology, ecology, and other social and natural sciences.
Experimental Report
An experimental report documents the results of a scientific experiment, including the hypothesis, methods, results, and conclusions. Experimental reports are often used in biology, chemistry, and other sciences to communicate the results of laboratory experiments.
Case Study Report
A case study report provides an in-depth analysis of a specific case or situation, often used in psychology, social work, and other fields to document and understand complex cases or phenomena.
Literature Review Report
A literature review report synthesizes and summarizes existing research on a specific topic, providing an overview of the current state of knowledge on the subject. Literature review reports are often used in social sciences, education, and other fields to identify gaps in the literature and guide future research.
Research Report Example
Following is a Research Report Example sample for Students:
Title: The Impact of Social Media on Academic Performance among High School Students
This study aims to investigate the relationship between social media use and academic performance among high school students. The study utilized a quantitative research design, which involved a survey questionnaire administered to a sample of 200 high school students. The findings indicate that there is a negative correlation between social media use and academic performance, suggesting that excessive social media use can lead to poor academic performance among high school students. The results of this study have important implications for educators, parents, and policymakers, as they highlight the need for strategies that can help students balance their social media use and academic responsibilities.
Introduction:
Social media has become an integral part of the lives of high school students. With the widespread use of social media platforms such as Facebook, Twitter, Instagram, and Snapchat, students can connect with friends, share photos and videos, and engage in discussions on a range of topics. While social media offers many benefits, concerns have been raised about its impact on academic performance. Many studies have found a negative correlation between social media use and academic performance among high school students (Kirschner & Karpinski, 2010; Paul, Baker, & Cochran, 2012).
Given the growing importance of social media in the lives of high school students, it is important to investigate its impact on academic performance. This study aims to address this gap by examining the relationship between social media use and academic performance among high school students.
Methodology:
The study utilized a quantitative research design, which involved a survey questionnaire administered to a sample of 200 high school students. The questionnaire was developed based on previous studies and was designed to measure the frequency and duration of social media use, as well as academic performance.
The participants were selected using a convenience sampling technique, and the survey questionnaire was distributed in the classroom during regular school hours. The data collected were analyzed using descriptive statistics and correlation analysis.
The findings indicate that the majority of high school students use social media platforms on a daily basis, with Facebook being the most popular platform. The results also show a negative correlation between social media use and academic performance, suggesting that excessive social media use can lead to poor academic performance among high school students.
Discussion:
The results of this study have important implications for educators, parents, and policymakers. The negative correlation between social media use and academic performance suggests that strategies should be put in place to help students balance their social media use and academic responsibilities. For example, educators could incorporate social media into their teaching strategies to engage students and enhance learning. Parents could limit their children’s social media use and encourage them to prioritize their academic responsibilities. Policymakers could develop guidelines and policies to regulate social media use among high school students.
Conclusion:
In conclusion, this study provides evidence of the negative impact of social media on academic performance among high school students. The findings highlight the need for strategies that can help students balance their social media use and academic responsibilities. Further research is needed to explore the specific mechanisms by which social media use affects academic performance and to develop effective strategies for addressing this issue.
Limitations:
One limitation of this study is the use of convenience sampling, which limits the generalizability of the findings to other populations. Future studies should use random sampling techniques to increase the representativeness of the sample. Another limitation is the use of self-reported measures, which may be subject to social desirability bias. Future studies could use objective measures of social media use and academic performance, such as tracking software and school records.
Implications:
The findings of this study have important implications for educators, parents, and policymakers. Educators could incorporate social media into their teaching strategies to engage students and enhance learning. For example, teachers could use social media platforms to share relevant educational resources and facilitate online discussions. Parents could limit their children’s social media use and encourage them to prioritize their academic responsibilities. They could also engage in open communication with their children to understand their social media use and its impact on their academic performance. Policymakers could develop guidelines and policies to regulate social media use among high school students. For example, schools could implement social media policies that restrict access during class time and encourage responsible use.
References:
- Kirschner, P. A., & Karpinski, A. C. (2010). Facebook® and academic performance. Computers in Human Behavior, 26(6), 1237-1245.
- Paul, J. A., Baker, H. M., & Cochran, J. D. (2012). Effect of online social networking on student academic performance. Journal of the Research Center for Educational Technology, 8(1), 1-19.
- Pantic, I. (2014). Online social networking and mental health. Cyberpsychology, Behavior, and Social Networking, 17(10), 652-657.
- Rosen, L. D., Carrier, L. M., & Cheever, N. A. (2013). Facebook and texting made me do it: Media-induced task-switching while studying. Computers in Human Behavior, 29(3), 948-958.
Note*: Above mention, Example is just a sample for the students’ guide. Do not directly copy and paste as your College or University assignment. Kindly do some research and Write your own.
Applications of Research Report
Research reports have many applications, including:
- Communicating research findings: The primary application of a research report is to communicate the results of a study to other researchers, stakeholders, or the general public. The report serves as a way to share new knowledge, insights, and discoveries with others in the field.
- Informing policy and practice : Research reports can inform policy and practice by providing evidence-based recommendations for decision-makers. For example, a research report on the effectiveness of a new drug could inform regulatory agencies in their decision-making process.
- Supporting further research: Research reports can provide a foundation for further research in a particular area. Other researchers may use the findings and methodology of a report to develop new research questions or to build on existing research.
- Evaluating programs and interventions : Research reports can be used to evaluate the effectiveness of programs and interventions in achieving their intended outcomes. For example, a research report on a new educational program could provide evidence of its impact on student performance.
- Demonstrating impact : Research reports can be used to demonstrate the impact of research funding or to evaluate the success of research projects. By presenting the findings and outcomes of a study, research reports can show the value of research to funders and stakeholders.
- Enhancing professional development : Research reports can be used to enhance professional development by providing a source of information and learning for researchers and practitioners in a particular field. For example, a research report on a new teaching methodology could provide insights and ideas for educators to incorporate into their own practice.
How to write Research Report
Here are some steps you can follow to write a research report:
- Identify the research question: The first step in writing a research report is to identify your research question. This will help you focus your research and organize your findings.
- Conduct research : Once you have identified your research question, you will need to conduct research to gather relevant data and information. This can involve conducting experiments, reviewing literature, or analyzing data.
- Organize your findings: Once you have gathered all of your data, you will need to organize your findings in a way that is clear and understandable. This can involve creating tables, graphs, or charts to illustrate your results.
- Write the report: Once you have organized your findings, you can begin writing the report. Start with an introduction that provides background information and explains the purpose of your research. Next, provide a detailed description of your research methods and findings. Finally, summarize your results and draw conclusions based on your findings.
- Proofread and edit: After you have written your report, be sure to proofread and edit it carefully. Check for grammar and spelling errors, and make sure that your report is well-organized and easy to read.
- Include a reference list: Be sure to include a list of references that you used in your research. This will give credit to your sources and allow readers to further explore the topic if they choose.
- Format your report: Finally, format your report according to the guidelines provided by your instructor or organization. This may include formatting requirements for headings, margins, fonts, and spacing.
Purpose of Research Report
The purpose of a research report is to communicate the results of a research study to a specific audience, such as peers in the same field, stakeholders, or the general public. The report provides a detailed description of the research methods, findings, and conclusions.
Some common purposes of a research report include:
- Sharing knowledge: A research report allows researchers to share their findings and knowledge with others in their field. This helps to advance the field and improve the understanding of a particular topic.
- Identifying trends: A research report can identify trends and patterns in data, which can help guide future research and inform decision-making.
- Addressing problems: A research report can provide insights into problems or issues and suggest solutions or recommendations for addressing them.
- Evaluating programs or interventions : A research report can evaluate the effectiveness of programs or interventions, which can inform decision-making about whether to continue, modify, or discontinue them.
- Meeting regulatory requirements: In some fields, research reports are required to meet regulatory requirements, such as in the case of drug trials or environmental impact studies.
When to Write Research Report
A research report should be written after completing the research study. This includes collecting data, analyzing the results, and drawing conclusions based on the findings. Once the research is complete, the report should be written in a timely manner while the information is still fresh in the researcher’s mind.
In academic settings, research reports are often required as part of coursework or as part of a thesis or dissertation. In this case, the report should be written according to the guidelines provided by the instructor or institution.
In other settings, such as in industry or government, research reports may be required to inform decision-making or to comply with regulatory requirements. In these cases, the report should be written as soon as possible after the research is completed in order to inform decision-making in a timely manner.
Overall, the timing of when to write a research report depends on the purpose of the research, the expectations of the audience, and any regulatory requirements that need to be met. However, it is important to complete the report in a timely manner while the information is still fresh in the researcher’s mind.
Characteristics of Research Report
There are several characteristics of a research report that distinguish it from other types of writing. These characteristics include:
- Objective: A research report should be written in an objective and unbiased manner. It should present the facts and findings of the research study without any personal opinions or biases.
- Systematic: A research report should be written in a systematic manner. It should follow a clear and logical structure, and the information should be presented in a way that is easy to understand and follow.
- Detailed: A research report should be detailed and comprehensive. It should provide a thorough description of the research methods, results, and conclusions.
- Accurate : A research report should be accurate and based on sound research methods. The findings and conclusions should be supported by data and evidence.
- Organized: A research report should be well-organized. It should include headings and subheadings to help the reader navigate the report and understand the main points.
- Clear and concise: A research report should be written in clear and concise language. The information should be presented in a way that is easy to understand, and unnecessary jargon should be avoided.
- Citations and references: A research report should include citations and references to support the findings and conclusions. This helps to give credit to other researchers and to provide readers with the opportunity to further explore the topic.
Advantages of Research Report
Research reports have several advantages, including:
- Communicating research findings: Research reports allow researchers to communicate their findings to a wider audience, including other researchers, stakeholders, and the general public. This helps to disseminate knowledge and advance the understanding of a particular topic.
- Providing evidence for decision-making : Research reports can provide evidence to inform decision-making, such as in the case of policy-making, program planning, or product development. The findings and conclusions can help guide decisions and improve outcomes.
- Supporting further research: Research reports can provide a foundation for further research on a particular topic. Other researchers can build on the findings and conclusions of the report, which can lead to further discoveries and advancements in the field.
- Demonstrating expertise: Research reports can demonstrate the expertise of the researchers and their ability to conduct rigorous and high-quality research. This can be important for securing funding, promotions, and other professional opportunities.
- Meeting regulatory requirements: In some fields, research reports are required to meet regulatory requirements, such as in the case of drug trials or environmental impact studies. Producing a high-quality research report can help ensure compliance with these requirements.
Limitations of Research Report
Despite their advantages, research reports also have some limitations, including:
- Time-consuming: Conducting research and writing a report can be a time-consuming process, particularly for large-scale studies. This can limit the frequency and speed of producing research reports.
- Expensive: Conducting research and producing a report can be expensive, particularly for studies that require specialized equipment, personnel, or data. This can limit the scope and feasibility of some research studies.
- Limited generalizability: Research studies often focus on a specific population or context, which can limit the generalizability of the findings to other populations or contexts.
- Potential bias : Researchers may have biases or conflicts of interest that can influence the findings and conclusions of the research study. Additionally, participants may also have biases or may not be representative of the larger population, which can limit the validity and reliability of the findings.
- Accessibility: Research reports may be written in technical or academic language, which can limit their accessibility to a wider audience. Additionally, some research may be behind paywalls or require specialized access, which can limit the ability of others to read and use the findings.
About the author

Muhammad Hassan
Researcher, Academic Writer, Web developer
You may also like

Data Collection – Methods Types and Examples

Delimitations in Research – Types, Examples and...

Research Process – Steps, Examples and Tips

Research Design – Types, Methods and Examples

Institutional Review Board – Application Sample...

Evaluating Research – Process, Examples and...
How to Write a Results Section: Tips, Examples, and Guide
9 December 2023
last updated
When students organize their scholarly works, they need valid guidelines on how to write a results section of a research paper. In this case, the article offers critical insights, including all the parts of a research paper and how a results section differs from the others, the information that should be included, and how to organize it correctly. The guideline also teaches students the differences between qualitative and quantitative research results sections, including samples and templates indicating how to present the findings. In turn, it provides 8 dos and 8 don’ts of writing a results section and 20 tips that students should follow.
How to Write an Outstanding Results Section & Examples
Students should read scholarly texts habitually to equip themselves with knowledge of the requirements of high-standard papers. While these requirements are not similar for different types of papers , they have similar unique features. For example, it is standard for writers of various types of essays to create a clear thesis statement that provides direction on the content and a well-organized essay outline that follows a correct essay structure and allows one to organize ideas logically. In turn, the guideline on how to write a results section provides insights into the details students must address when writing this part, including all the other components of a research paper , the information essential to include, and its organization. Moreover, readers should view this article as an educational tool that empowers them to start writing a high-standard results section of a scientific research paper .

6 Main Sections of a Research Paper and Its Structure
A research paper is unique because it has sections with varying details about a specific study topic. For example, these sections include an introduction , literature review , research methodology, results, discussion, and conclusion . In this respect, a research paper is a comprehensive document that requires students’ total focus and dedication. Writers should use each section to provide information for readers to understand the essence and significance of research papers. Therefore, to write a quality results section, one must know how it differs from other scientific works and the information they must provide for readers. In turn, students should focus on the uniqueness of each section because it underscores its relevance in a research paper.
1️⃣ Introduction
The introduction is the first section of a research paper. As the title suggests, it aims to introduce the reader to the study problem under analysis. In this respect, there are critical details writers must provide in this section, including the research problem, the background of the investigation, the significance of the study, and the research question or hypothesis . Typically, research paper topics indicate study problems that students may use for writing their scholarly works. In turn, the background information addresses existing research and some gaps that writers intend to explore using bridge sentences in their current work. Moreover, the significance of the study must explain why the current scientific work is essential, and research question(s) or hypothesis(es) address what writers intend to prove through their work, either answering questions or validating null and alternative hypotheses . Thus, the introduction section of a research paper gives readers basic information about the writer’s scientific work. In turn, before the introduction, students can include an abstract or executive summary part, which means the overall summary of a research paper, but it is optional.
2️⃣ Review of the Existing Literature
A literature review is the second section of a research paper that examines existing evidence relating to a particular research paper problem. Depending on the topic, this section is robust because one must demonstrate an in-depth understanding of the research issue under review. More importantly, students must convince readers that they have investigated the evidence and found a gap by reviewing credible sources that justify their studies. The most significant detail that students should focus on when writing this section is to examine numerous reliable sources , including books, peer-reviewed academic articles , and reports by government agencies, to cite information and statistics relevant to the scientific problem or theoretical framework . Such information is essential in revealing the knowledge gap that justifies the current research work.
3️⃣ Research Methodology
Research methodology is the third section of a research paper and focuses on the methods that students use to conduct their research work. For example, scholars should understand that research work takes many forms or designs that determine the approach to take to execute their task. The two main designs are qualitative and quantitative studies, while research methods include descriptive, experimental, case study , and observation. Therefore, when writing this section, students must know they intend to give readers a roadmap for conducting their scientific work. Essential details include the study participants, how to identify them and their total number, how to collect data, and the data analysis procedure(s). The research design is the most important detail to consider because it determines all the other components of the research methodology section. Besides, this section tends to be long than the introduction.
4️⃣ Results Section
A results section is the fourth part of a research paper and is where students outline the findings of their scientific work. Typically, this section is short than the previous one because its purpose is to provide readers with the outcomes of a research paper. As the title suggests, the details in this section should point to the findings only. Therefore, the issue that makes this results section unique is that writers do not provide details that contextualize their work but only those that indicate its outcomes. The information in this section underscores the purpose of the research work, including its ultimate objective.
5️⃣ Discussion
The fifth section of a research paper is a discussion part, where authors link the results of the study with the literature review. Ideally, the information in the section acts as a summary of a research paper that requires one to confirm that the findings are relevant to addressing the knowledge gap that writers expressed in the introduction and literature review. Typically, people show this linkage by indicating whether the results have answered the study question(s) or validated the hypothesis(es). Other essential details are the limitations of a research paper.
6️⃣ Conclusion
A conclusion is the last section of a research paper, and it reiterates the research question, how the findings impact the practice, such as nursing or psychology, and the need for conducting further studies to address unresolved questions. This last section, including conclusion examples , summarizes a research paper and affects the reader’s perspective on the study problem.
Join our satisfied customers who have received perfect papers from Wr1ter Team.
Providing the Right Information When Writing a Results Section
A results section is about the findings of the research work only. As such, students should not address anything that does not relate to the study question(s) or hypothesis(es). Typically, the details in this section include data that writers present in tables, charts, graphs, or other visual figures as part of the text or separately on pages at the end of the document, such as acknowledgments or appendices. Another detail is a contextual analysis of the data to give readers a better understanding of how it relates to the research question(s) or hypothesis(es), expanding on the meaning of the information presented. Further essential details in the section are data corresponding to the research question(s) or hypothesis(es) and secondary findings, including secondary outcomes and subgroup analyses. All these details make a results section unique because it is where readers need to understand the essence of the scientific work.
🔸 How to Organize a Results Section
While the results section’s primary purpose is to communicate the findings of a research paper, students should know that they cannot copy-paste raw information without a good explanation. For example, the information in a results section must have a pattern demonstrating a logical organization of the study findings. The best way to organize such findings is to use headings following a logical order of the study questions or hypotheses and integrate data through charts, graphs, visuals, or tables thematically. In this respect, when writing a results section, writers must refer to the introduction to ensure the information aligns with what they said. An important detail to note is that the graphical presentation of the results’ data is not sufficient. However, students must mention the data through statements that allow readers to understand how the results answer the research question(s) or validate or invalidate hypothesis (es).
🔸 How to Organize Figures, Charts, or Other Visuals
A logical presentation of data requires students to organize all data figures by numbering them and citing the number in the paragraph to link the findings to a research question or hypothesis. The numbering format should follow the order in which the writer mentions the data in the text. One should also explain the methodology that led to each figure. For example, students should capture the following details:
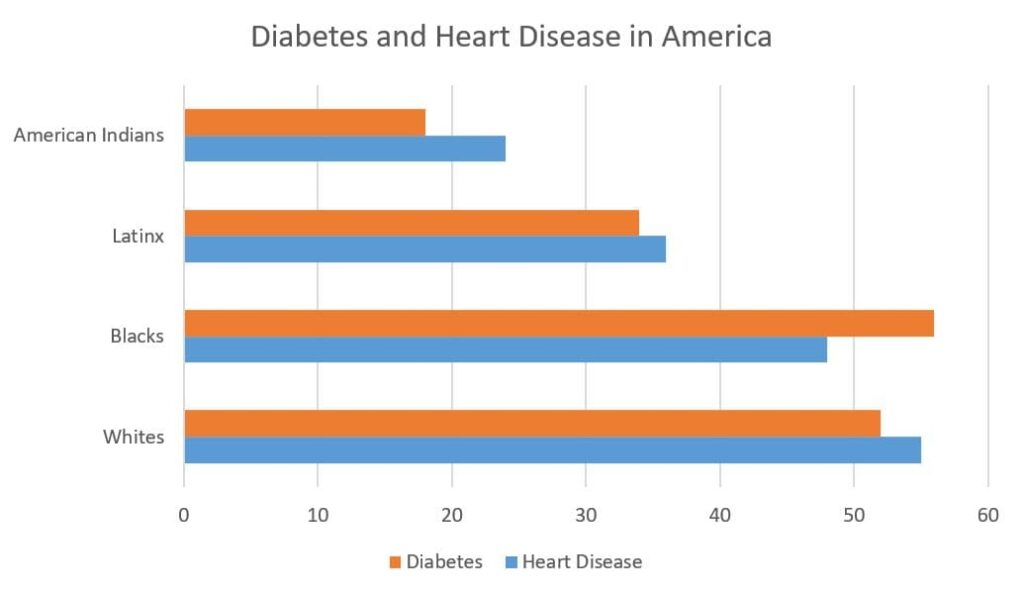
Figure 1: Racial/ethnic representation of health problems in the United States.
- Integrate the data into the text by mentioning the percentage of Whites, Blacks, Latinx, and American Indians with diabetes and heart disease.
- Mention Figure 1 but not necessarily the title. For example, one can write: “Figure 1 shows the proportion of Whites and Blacks with heart disease is 55 percent and 48 percent, respectively.” With that statement, readers can look at the chart and read its title to make sense of the sentence.
- Depending on the type of figure, writers can indicate the figure legend at the top. In the above example, it reads, “Diabetes and Heart Disease in America.”
- At the bottom of the figure (footnote), one should indicate the figure number followed by a caption that briefly describes the figure. In the above example, the caption reads, “Racial/ethnic representation of health problems in the United States.”
- Writers must use labels to identify specific elements or features in the graph. In the above example, the horizontal axis uses percentages as labels indicating the proportion of Whites, Blacks, Latinx, and American Indians with diabetes and heart disease.
🔸 How to Organize Tables
Like figures, tables capture data reflecting a results section of a research paper. However, they differ from charts in how they reflect the data. For example, their unique features include columns and rows, each with a subheading. The following example shows how students should use tables in a results section:
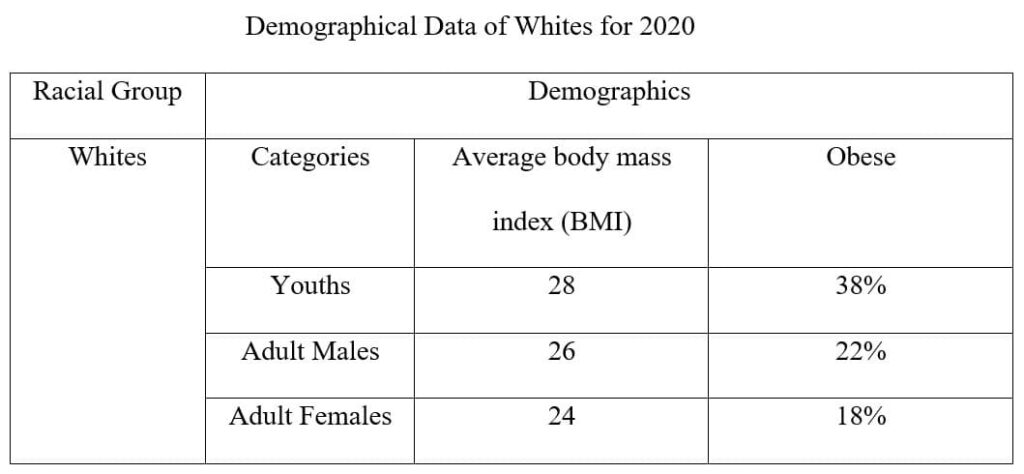
Table 1. Demographics of Whites in the United States for 2020 showing how obesity affects this population in the country. Young individuals are the most affected, with 38 percent presenting as obese, followed by adult females at 22 percent and then adult males at 18 percent. However, on average, the BMI index for all groups is below the obese level of 30.
- Writers should identify the data in the table above by mentioning “Table 1” in the text about the demographics of Whites for 2020.
- Typically, most research papers use a footnote rather than a table title. While a title is necessary to enhance readers’ understanding, footnotes are more detailed because they offer some analysis. In the above example, the footnote that follows the caption below the table analyzes the data for the reader’s benefit.
- Typically, the row headings capture groups, and column headings indicate demographical data. In the example above, the row heading captures Whites as a racial group, while the column heading indicates the group’s demographics. Writers should understand that each row and each column should reflect one group and one demographical data, respectively.
- Sometimes, writers may have row subheadings to indicate group categories and column subheadings to capture variables. In the above example, the row subheadings are youths, adult males, and adult females as the group categories, while the column subheadings indicate average BMI and obesity as demographic categories.
- Tables provide self-explanatory data to readers, and footnotes only attempt to make sense of it superficially. By looking at the table, people should comprehend the results without reading all the text.
Therefore, students should use figures and tables as focal points to communicate a clear and informative narrative about the findings of a research paper. In this respect, writers should repeat every detail in the text, although they must reference all data in a results section or other body paragraphs by pointing readers to “Table 1.”
How to Write a Good Results Section With 8 Dos and 8 Don’ts
When writing a great results section, students should know what to talk about or do and what not to talk about or not do. The things to do to demonstrate a high-standard results section and those not to do can affect the section’s quality. From this perspective, students must habitually read research papers to familiarize themselves with 8 dos and 8 don’ts of writing a results section.
What One Should Do When Writing a Results Section: 8 Dos
- Write in the past tense only . All study findings are what the author has established after conducting the actual study. The language that reflects this aspect is past tense. Common terminologies include ‘found,’ ‘established,’ and ‘confirmed.’ Using this language tells readers that the research has already happened and the outcomes are clear, as the text indicates through visuals, charts, graphs, figures, and tables.
- Write concisely. Findings require interpretation from statistical data to statistical analyses. Typically, this exercise involves complex language that may need to be clarified for readers. As such, students should write a results section clearly and concisely to avoid sending the wrong message to other scholars. For example, one must be clear about which finding relates to which study question or hypothesis.
- Referencing the study question(s) or hypothesis(es). A results section aims to answer the research question(s) or validate or invalidate the hypothesis(es). As such, students must refer to them (as applicable) when writing a results section. As stated, the best approach is to refer to them according to the order they appear in the introduction section for logical consistency.
- Begin with broad results. Typically, the findings of a research paper vary in how they answer the study question(s) or validate or invalidate the hypothesis(es). Some results are broad, requiring some comprehensive analysis, and others narrow, covering a brief mention. Students should begin with the general results because they affect the scientific question(s) or hypothesis(es) more than the narrow findings. However, they should mention the narrow findings later in the text because they are precise to the study question or hypothesis.
- Write the most critical findings from figures or tables. The purpose of figures and tables is to provide a broad picture of the results. However, only some details capture the most critical finding. For example, in the table above, the most critical finding is the rate of obesity in the White community, specifically youths, adult males, and adult females. When referring to Table 1, a student should mention the percentages of obesity prevalence in these groups as the most critical finding despite the chart indicating other details, such as the BMI, which are central to this crucial result.
- Avoid background information and explanation of findings. Students should avoid explaining the results or providing any background information. At this part of a research paper, readers already understand the background of the study because they have read the introduction and literature review sections. Consequently, they expect an in-depth explanation of the results in the later discussion section.
- Do not capture raw data or intermediate calculations. The findings in a results section should make sense to all readers. As such, students should not provide raw data or indicate its intermediate calculations. The data analysis section that falls in the research methodology offers the opportunity for these exercises. Therefore, students should understand that a results section should provide an answer to readers about the study question(s) or hypothesis(es), not leaving them with the task of analyzing the data to make the connection.
- Never ignore negative results. Authors of research papers probably have a biased interpretation of the results because they already have a preferred outcome. In such cases, most students may be tempted to ignore negative results if they do not conform to their expectations or preferences. However, they must understand that a results section should reflect the findings of a research paper regardless of whether they are positive or negative in their eyes. This capture of the results makes any research paper scholarly and valid.
What to Avoid: 8 Don’ts
- Do not capture all data generated in a research paper. Writers need to understand that the purpose of writing a results section is to answer the research question(s) or validate or invalidate the hypothesis(es). Doing so does not require all the data, but what is relevant for this task. Moreover, research papers have limited length, and one cannot have room in a results section to indicate all the data from the study experiment.
- Do not use text to describe everything. The purpose of charts, figures, visuals, and tables is to capture and present data in a short summary. As such, they help writers to avoid explaining every data and related detail because it may be complex and confusing to readers. Therefore, one should only describe or explain some things but use figures, visuals, and tables to present broad data.
- Do not repeat the data in figures and tables. When referring to figures, visuals, and tables in the text, students should avoid repeating every piece of data but instead interpret it for readers. What is important is the most critical data because it provides a clear and concise message about a research question or hypothesis. Therefore, students should interpret the data instead of repeating the same information as it is in the chart, visual, figure, or table. In the example of the table above, one should not repeat all the information but summarize it by stating the group most affected by obesity and how.
- Do not jump around the data to discuss the findings. The logical presentation of data requires students to provide information that answers the research questions or hypotheses as they appear in the introduction. As such, one should avoid mentioning data relevant to one question when answering a different question. The same case should apply to hypotheses.
- Do not give long explanations. A results section should be short but clear and concise. In this respect, students should refrain from long explanations because they reduce the space for the most essential information: critical findings. The best approach to avoid long descriptions is to use figures, visuals, charts, and tables.
- Do not use meaningless numbers. While a results section aims to show data mostly in numbers for a quantitative study, students should avoid using every number they have if it is not meaningful to a research question or hypothesis. Therefore, after data analysis, one should decide on the most relevant and meaningful numbers to include in a results section.
- Do not cite other research works. Since the purpose of a results section is to provide the findings of a research paper, one should avoid irrelevant details, including comparing the results to those of other research works. Students must understand that the discussion section gives them room to do so.
- Do not use the results of other authors. Any academic work is designed for a specific purpose. In this case, students must do their own research papers and present unique findings section, including negative or positive ones. The findings of other authors can be used only for a comparison of the results.
Examples of Results Sections for Qualitative and Quantitative Research Studies
The two primary research paper designs that scholars use for their scientific works are qualitative and quantitative studies. Each design has a unique way of capturing the findings of a research paper. The two examples below show how students should write a results section in qualitative and quantitative research papers. However, students must note the language and details, such as statistical data.
Example of a Qualitative Results Section
[Introductory context] A total of 98 respondents from different countries gave essential data by answering the survey questionnaire. The representation was as follows: 30 respondents were from the U.S. (30.6% of the total), 26 from China (26.5%), 22 from Russia (22.4%), and 20 from the United Kingdom (20.4%). […] [Important finding] According to the results, the most important cultural identifiers are language (w=0.3402), followed by ethnicity (w=0.2930) and religion (w=0.2279). Most respondents viewed gender as the most insignificant compared to the other three (w=0,1388) (Table 1). […] [Interesting Finding] An interesting finding is that the U.S. and the U.K. respondents considered sexual orientation as a determinant of a country’s cultural vibrancy, while those from China and Russia viewed it as an indicator of negative liberalism. All the respondents had a uniform consistency ratio (C.R.) of less than 0.08 (8%). [Another important finding] According to all the respondents, the three critical drivers of cultural vibrancy are technology (mean value of 4.88), education (4.60), contact with other cultures (4.40), and the media (4.30). Conversely, the factors that influence cultural assimilation the least, according to all the respondents, are cultural artifacts (2.88) and friendships (2.66) (Figure 1). […] [Summary of Key Findings] The findings indicate differences of opinion regarding some cultural topics and convergence of thought in others between countries from the respondents’ perspective. On differences, respondents from the U.S. and U.K. hold more liberal views than their Chinese and Russian counterparts. The point of convergence for all the respondents is the belief that culture is the most instrumental factor for interrogating the attitudes and behaviors of people .
[Introductory Context] The student data system for 2010 through 2020 was the source of the demographic data for the sample. The descriptive statistics include age, gender, grades, and course selection. Table 1 describes the cross-tabulation frequencies of the study sample. The mean age was 28.42 years, with a standard deviation of 8.22 years. The age range of the sample was from 18 to 50 years. [Relevant Finding] Overall, more students selected online than physical courses, with a uniform enrollment rate in online courses in both males and females; however, the proportion of males was high (62.7%) for online instruction than that of females (58.8%) as shown in Figures 1 and 2. […] [Significant Finding (including a significant test result)] A statistically significant difference in grades is reported between students enrolled in online classes and their counterparts in the traditional classroom setting. The mean and standard deviation for grades calculated by delivery type showed no significant difference between online and physical instruction. In contrast, those calculated by the instructor showed no significant difference in the mean grade. […] [Reference to Visual Data] Table 6 shows the impact of the delivery method and the instructor on students’ grades. […] The delivery method did not influence significant grade differences (F = 0.078, p = 0.780, df = 1, 811). The same case was reported for the instructor (F = 0.002, p = .967, df = 1, 811). The two factors had no significant interaction (F = 0.449, p = 0.503, df = 1, 811). [Relevant Finding] There is a statistically significant difference in student course retention between those taking online courses and their counterparts in physical classrooms (Supplementary Appendix Figure 1). Data were included for testing if a final grade was reported for a participant (Supplementary Appendix Figure 2). [Context to a Research Question or Hypothesis] The analysis of the contingency data was essential in confirming the hypothesis. Data organization indicates the row variable as course selection (online or physical classroom) and the column variable as retention in the course. [Explanation of a study Test] The chi-square testing (X2 = 2.524, p = .112, df = 1, 884) indicated no statistically significant difference between retention in online and physical classroom courses. [Significant Findings] The study includes a statistically significant difference in student retention between those who begin the program online and those who begin in the physical classroom. […] [Summary of Key Findings] Results from testing of H1 showed no significant difference between course grades for students enrolled in online courses and their counterparts in physical classroom courses. Chi-square testing of H2 indicated no significant difference in course retention between students taking online courses and those taking courses in the physical classroom environment. Chi-square testing of H3 indicated no significant difference in program retention between students who began the course online and those who began it in the physical classroom.
Enhance your academic performance with our top-notch, plagiarism-free papers.
Templates for Qualitative and Quantitative Results Sections
I. qualitative results template:.
- [Introductory Context]
- [Finding 1 – Important]
- [Finding 2 – Interesting]
- [Another Important Finding 3 that refers to a chart, figure, visual, or table]
- [Summary of key findings]
II. Quantitative Results Template:
- [Finding 1 – Relevant]
- [Finding 2 – Significant – with reference to a test result]
- [Reference to a chart, figure, visual, or table]
- [Finding 3 – Relevant]
- [Context to a Research Question or Hypothesis]
- [Explanation of a Study Test]
- [Finding 3 – Significant]
Looking at the two templates, it is evident that crucial details appear in all but some only in quantitative research. In both templates, students should introduce the section by stating some facts, such as the study sample, and enumerate the results, using charts, figures, visuals, or tables as necessary. However, only in a quantitative study, one should mention tests and their outcomes.
Comparing and Contrasting Qualitative and Quantitative Results Sections
There are areas of similarity and difference between the results sections of qualitative and quantitative research studies. The main similarities are that both results sections capture statistical data or reports and do not interpret the meanings of data with long explanations. However, there are many differences in presenting the content. Firstly, a qualitative results section emphasizes non-numerical, descriptive data, focusing on themes and ideas. In contrast, a quantitative results section highlights measurable (or quantifiable) numerical data relevant to interpreting trends, making predictions, running experiments, or testing hypotheses. Another difference is that a qualitative results section adopts descriptive and interpretive approaches to make sense of the collected data. On the other hand, a quantitative results section adopts numbers-based strategies, including statistics, calculations, and data measurements, to make sense of the collected data.
Research Questions and Hypotheses
When writing a results section, students must focus on the research question(s) or hypothesis(es) they stated in the introduction because they underscore the paper’s importance or purpose. Regarding research questions, the data presented in a results section must refer to the questions as they appear in the introduction, giving outcomes that reflect answers to these queries. Concerning hypotheses, students should ensure that a results section confirms or rejects them. In other words, a good results section should help readers to understand the scientific problem by answering the study question(s) or validating or invalidating the hypothesis(es). Therefore, when writing a results section, students should know that they are answering a specific research question or confirming a study hypothesis. This determination is crucial because it must reflect in the language, concepts, and terms used in the text.
20 Tips for Writing a Well-Organized Results Section
Based on the preceding sections, writing a high-standard results section of a research paper is a technical undertaking that requires students to grasp helpful insight. Some of the useful tips include always using simple and clear language, avoiding irrelevant expressions, discussing the findings objectively without overinterpretation, using sub-sections if there are more research questions or hypotheses, including negative results even if they do not support the study hypothesis, providing visuals charts, figures, visuals, and tables to document the results, and mentioning the tests and their outcomes for a quantitative study.
10 things to do when writing a results section include:
- briefly and precisely summarizing the results at the beginning of the section;
- using visual illustrations, like charts, figures, and tables;
- arranging the results logically;
- linking the data to the research question(s) or hypothesis(es);
- following clear, simple, and concise language;
- being objective;
- avoiding long explanations;
- including statistical analyses to make the data sensible to readers;
- providing the correct information for the right study question or hypothesis;
- presenting paragraphs that respond to different scientific questions or hypotheses.
10 things not to do when writing a results section include:
- using raw data;
- duplicating similar information by repeating the data in the visual illustrations within the text;
- including repetitive background information;
- constantly referring to the research methods;
- overlooking negative findings that do not support biases or invalid claims ;
- providing charts, figures, visuals, or tables excessively;
- explaining the results comprehensively;
- presenting a findings section of other research papers as writers’ study results;
- failing to give graphs, figures, and tables a number;
- not mentioning a specific chart, figure, visual, or table number within the text.
Summing Up on How to Write a Perfect Results Section
- Start writing a results section by restating the purpose of a research paper.
- Use the past tense to describe the findings.
- Avoid vague language.
- Provide a clear, coherent, and logical explanation of all results without bias.
- Include the data that answers the research question(s) or validates or invalidates the hypothesis(es).
- Use useful and quality visual illustrations, like charts, figures, and tables.
- Present details about data analysis and interpretation and mention any statistical tests and their results.
- Report statistically insignificant findings to give a research paper credibility.
- Conclude with a short paragraph that summarizes the key findings.
- Proofread, revise, and edit a results section to eliminate any mistakes.
To Learn More, Read Relevant Articles
Understanding the environmental impact of electric vehicles, delving into the enigma of alternate universes: a hypothetical journey.
- Foundations
- Write Paper
Search form
- Experiments
- Anthropology
- Self-Esteem
- Social Anxiety
- Research Paper >
Writing a Results Section
The next stage of any research paper: writing the results section, announcing your findings to the world.
This article is a part of the guide:
- Outline Examples
- Example of a Paper
- Write a Hypothesis
- Introduction
Browse Full Outline
- 1 Write a Research Paper
- 2 Writing a Paper
- 3.1 Write an Outline
- 3.2 Outline Examples
- 4.1 Thesis Statement
- 4.2 Write a Hypothesis
- 5.2 Abstract
- 5.3 Introduction
- 5.4 Methods
- 5.5 Results
- 5.6 Discussion
- 5.7 Conclusion
- 5.8 Bibliography
- 6.1 Table of Contents
- 6.2 Acknowledgements
- 6.3 Appendix
- 7.1 In Text Citations
- 7.2 Footnotes
- 7.3.1 Floating Blocks
- 7.4 Example of a Paper
- 7.5 Example of a Paper 2
- 7.6.1 Citations
- 7.7.1 Writing Style
- 7.7.2 Citations
- 8.1.1 Sham Peer Review
- 8.1.2 Advantages
- 8.1.3 Disadvantages
- 8.2 Publication Bias
- 8.3.1 Journal Rejection
- 9.1 Article Writing
- 9.2 Ideas for Topics
In theory, this is the easiest part to write, because it is a straightforward commentary of exactly what you observed and found. In reality, it can be a little tricky, because it is very easy to include too much information and bury the important findings.

Too Much Information?
The results section is not for interpreting the results in any way; that belongs strictly in the discussion section. You should aim to narrate your findings without trying to interpret or evaluate them, other than to provide a link to the discussion section.
For example, you may have noticed an unusual correlation between two variables during the analysis of your results. It is correct to point this out in the results section.
Speculating why this correlation is happening, and postulating about what may be happening, belongs in the discussion section .
It is very easy to put too much information into the results section and obscure your findings underneath reams of irrelevance.
If you make a table of your findings, you do not need to insert a graph highlighting the same data. If you have a table of results, refer to it in the text, but do not repeat the figures - duplicate information will be penalized.
One common way of getting around this is to be less specific in the text. For example, if the result in table one shows 23.9%, you could write….
Table One shows that almost a quarter of…..

Tips for Writing a Results Section
Perhaps the best way to use the results section is to show the most relevant information in the graphs, figures and tables.
The text, conversely, is used to direct the reader to those, also clarifying any unclear points. The text should also act as a link to the discussion section, highlighting any correlations and findings and leaving plenty of open questions.
For most research paper formats , there are two ways of presenting and organizing the results. The first method is to present the results and add a short discussion explaining them at the end, before leading into the discussion proper.
This is very common where the research paper is straightforward, and provides continuity. The other way is to present a section and then discuss it, before presenting the next section with a short discussion. This is common in longer papers, and your discussion part of the paper will generally follow the same structure.
Be sure to include negative results - writing a results section without them not only invalidate the paper, but it is extremely bad science. The negative results, and how you handle them, often gives you the makings of a great discussion section, so do not be afraid to highlight them.
Using an Appendix to Streamline Writing the Results Section
If you condense your raw data down, there is no need to include the initial findings in the results, because this will simply confuse the reader.
If you are in doubt about how much to include, you can always insert your raw data into the appendix section, allowing others to follow your calculations from the start. This is especially useful if you have used many statistical manipulations, so that people can check your calculations and ensure that you have not made any mistakes.
In the age of spreadsheets, where the computer program prepares all of the calculations for you, this is becoming less common, although you should specify the program that you used and the version. On that note, it is unnecessary show your working - assume that the reader understands what a Chi Squared test, or a Students t-test is, and can perform it themselves.
Once you have a streamlined and informative results section, you can move onto the discussion section, where you begin to elaborate your findings.
- Psychology 101
- Flags and Countries
- Capitals and Countries
Martyn Shuttleworth (Mar 2, 2009). Writing a Results Section. Retrieved Apr 13, 2024 from Explorable.com: https://explorable.com/writing-a-results-section
You Are Allowed To Copy The Text
The text in this article is licensed under the Creative Commons-License Attribution 4.0 International (CC BY 4.0) .
This means you're free to copy, share and adapt any parts (or all) of the text in the article, as long as you give appropriate credit and provide a link/reference to this page.
That is it. You don't need our permission to copy the article; just include a link/reference back to this page. You can use it freely (with some kind of link), and we're also okay with people reprinting in publications like books, blogs, newsletters, course-material, papers, wikipedia and presentations (with clear attribution).
Want to stay up to date? Follow us!
Check out the official book.
Learn how to construct, style and format an Academic paper and take your skills to the next level.
(also available as ebook )
Save this course for later
Don't have time for it all now? No problem, save it as a course and come back to it later.
Footer bottom
- Privacy Policy

- Subscribe to our RSS Feed
- Like us on Facebook
- Follow us on Twitter
Generate accurate APA citations for free
- Knowledge Base
- APA Style 7th edition
- Reporting Statistics in APA Style | Guidelines & Examples
Reporting Statistics in APA Style | Guidelines & Examples
Published on April 1, 2021 by Pritha Bhandari . Revised on January 17, 2024.
The APA Publication Manual is commonly used for reporting research results in the social and natural sciences. This article walks you through APA Style standards for reporting statistics in academic writing.
Statistical analysis involves gathering and testing quantitative data to make inferences about the world. A statistic is any number that describes a sample : it can be a proportion, a range , or a measurement, among other things.
When reporting statistics, use these formatting rules and suggestions from APA where relevant.
Instantly correct all language mistakes in your text
Upload your document to correct all your mistakes in minutes

Table of contents
Numbers and measurements, decimal places and leading zeros, formatting mathematical formulas, formatting statistical terms, reporting means and standard deviations, reporting chi-square tests, reporting z tests and t tests, reporting analysis of variance (anovas), reporting correlations, reporting regressions, reporting confidence intervals, other interesting articles, frequently asked questions about apa style statistics.
In general, APA advises using words for numbers under 10 and numerals for 10 and greater . However, always spell out a number that appears at the start of a sentence (or rephrase).
You should always use numerals for:
- Exact numbers before units of measurement or time
- Mathematical equations
- Percentages and percentiles
- Ratios, decimals, and uncommon fractions
- Scores and points on scales (e.g., 7-point scale)
- Exact amounts of money
Units of measurement and time
Report exact measurements using numerals, and use symbols or abbreviations for common units of measurement when they accompany exact measurements. Include a space between the number and the abbreviation.
When stating approximate figures, use words to express numbers under 10, and spell out the names of units of measurement.
- The ball weighed 7 kg.
- The ball weighed approximately seven kilograms.
Measurements should be reported in metric units. If you recorded measurements in non-metric units, include metric equivalents in your report as well as the original units.
Percentages
Use numerals for percentages along with the percent symbol (%). Don’t insert a space between the number and the symbol.
Words for “percent” or “percentage” should only be used in text when numbers aren’t used, or when a percentage appears at the start of a sentence.
- Of these respondents, 15% agreed with the statement.
- Fifteen percent of respondents agreed with the statement.
- The percentage was higher in 2020.
Prevent plagiarism. Run a free check.
The number of decimal places to report depends on what you’re reporting. Generally, you should aim to round numbers while retaining precision. It’s best to present fewer decimal digits to aid easy understanding.
The following guidelines are usually applicable.
Use two or three decimal places and report exact values for all p values greater than .001. For p values smaller than .001, report them as p < .001.
Leading zeros
A leading zero is zero before the decimal point for numbers less than one. In APA Style, it’s only used in some cases.
Use a leading zero only when the statistic you’re describing can be greater than one. If it can never exceed one, omit the leading zero.
- Consumers reported high satisfaction with the services ( M = 4.1, SD = 0.8).
- The correlation was medium-sized ( r = .35).
- Although significant results were obtained, the effect was relatively small ( p = .015, d = 0.11).
Provide formulas only when you use new or uncommon equations. For short equations, present them within one line in the main text whenever possible.
Make the order of operations as clear as possible by using parentheses (round brackets) for the first step, brackets [square brackets] for the second step, and braces {curly brackets} for the third step, where necessary.
More complex equations, or equations that take more than one line, should be displayed on their own lines. Equations should be displayed and numbered if you will reference them later on, regardless of their complexity. Number equations by placing the numbers in parentheses near the right edge of the page.
![\begin{equation*}\sqrt[3]{x}-3ac\,\,\,\,\,\,\,\,\,\,\,\,\,\,\,\,\,\,\,\,\,\,\,\,\,\,\,\,\,\,\,\,\,\,\,\,\,\,\,\,\,\,\,\,\,\,\,\,\,\,\,\,\,\,\,\,\,\,\,\,\,\,\,\,\,\,\,\,\,\,\,\,\,\,\,\,\,\,\,\,\,\,\,\,\,\,\,\,\,\,\,\,\,\,\,\,\,\,\,\,\,\,\,\,\,\,\,\,\,\,\,\,\,\,\,\,\,\,\,\,\,\,\,\,\,\,\,\,\,\,\,\,\,\,\,\,\,\,\,\,\,\,\,\,\,\,\,\,\,\,\,\,(1)\end{equation*}](https://www.scribbr.com/wp-content/ql-cache/quicklatex.com-cee92bd73c0e2b85fc5f90e088a957b5_l3.png "Rendered by QuickLaTeX.com")
When reporting statistical results , present information in easily understandable ways. You can use a mix of text, tables, and figures to present data effectively when you have a lot of numbers to report.
In your main text, use helpful words like “respectively” or “in order” to aid understanding when listing several statistics in a sequence.
The APA manual provides guidelines for dealing with statistical terms, symbols and abbreviations.
Symbols and abbreviations
Population parameters are often represented with Greek letters, while sample statistics are often represented with italicized Latin letters.
Use the population symbol ( N ) for the total number of elements in a sample, and use the sample symbol ( n ) for the number of elements in each subgroup of the full sample.
In general, abbreviations should be defined on first use, but this isn’t always the case for common statistical abbreviations.
Capitalization, italicization and hyphenation
Statistical terms such as t test, z test, and p value always begin with a lowercase, italicized letter. Never begin a sentence with lowercase statistical abbreviations.
These statistical terms should only be hyphenated when they modify a subsequent word (e.g., “ z -test results” versus results of “ z tests”).
You can form plurals of statistical symbols (e.g., M or p ) by adding a non-italicized “s” to the end with no apostrophe (e.g., M s or p s).
In general, the following guidelines apply.
Parentheses vs. brackets
Always aim to avoid nested parentheses and brackets when reporting statistics. Instead, you should use commas to separate related statistics.
- Scores improved between the pretest and posttest ( p < .001).
- Significant differences in test scores were recorded, F (1, 30) = 4.67, p = .003.
- (A previous meta-analysis highlighted low effect sizes [ d = 0.1] in the field).
Report descriptive statistics to summarize your data. Quantitative data is often reported using means and standard deviations, while categorical data (e.g., demographic variables) is reported using proportions.
Means and standard deviations can be presented in the main text and/or in parentheses. You don’t need to repeat the units of measurement (e.g., centimeters) for statistics relating to the same data.
- Average sample height was 136.4 cm ( SD = 15.1).
- The height of the initial sample was relatively low ( M = 125.9 cm, SD = 16.6).
- Height significantly varied between children aged 5–7, 8–10, and 11–13. The means were 115.3, 133.5, and 149.1 cm, respectively.
To report the results of a chi-square test , include the following:
- the degrees of freedom ( df ) in parentheses
- the chi-square (Χ 2 ) value (also referred to as the chi-square test statistic)
- the p value
- A chi-square test of independence revealed a significant association between gender and product preference, Χ 2 (8) = 19.7, p = .012.
- Based on a chi-square test of goodness of fit , Χ 2 (4) = 11.34, p = .023, the sample’s distribution of religious affiliations matched that of the population’s.
For z tests
To report the results of a z test, include the following:
- the z value (also referred to as the z statistic or z score)
- The participants’ scores were higher than the population average, z = 2.48, p = .013.
- Higher scores were obtained on the new 20-item scale compared to the previous 40-item scale, z = 2.67, p = .007.
For t tests
To report the results of a t test , include the following:
- the t value (also referred to as the t statistic)
- Older adults experienced significantly more loneliness than younger adults, t (32) = 2.94, p = .006.
- Reaction times were significantly faster for mice in the experimental condition, t (53) = 5.94, p < .001.
To report the results of an ANOVA , include the following:
- the degrees of freedom (between groups, within groups) in parentheses
- the F value (also referred to as the F statistic)
- A one-way ANOVA demonstrated that the effect of leadership style was significant for employee engagement, F (2, 78) = 4.58, p = .013.
- We found a statistically significant main effect of age group on social media use, F (3, 117) = 3.19, p = .026.
To report the results of a correlation, include the following:
- the degrees of freedom in parentheses
- the r value (the correlation coefficient)
- We found a strong correlation between average temperature and new daily cases of COVID-19, r (357) = .42, p < .001.
Results of regression analyses are often displayed in a table because the output includes many numbers.
To report the results of a regression analysis in the text, include the following:
- the R 2 value (the coefficient of determination)
The format is usually:
- SAT scores predicted college GPA, R 2 = .34, F (1, 416) = 6.71, p = .009.
You should report confidence intervals of effect sizes (e.g., Cohen’s d ) or point estimates where relevant.
To report a confidence interval, state the confidence level and use brackets to enclose the lower and upper limits of the confidence interval, separated by a comma.
- Older adults experienced significantly more loneliness than younger adults, t (32) = 2.94, p = .006, d = 0.81, 95% CI [0.6, 1.02].
- On average, the treatment resulted in a 30% reduction in migraine frequency, 99% CI [26.5, 33.5].
When presenting multiple confidence intervals with the same confidence levels in a sequence, don’t repeat the confidence level or the word “CI.”
If you want to know more about statistics , methodology , or research bias , make sure to check out some of our other articles with explanations and examples.
- Chi square test of independence
- Statistical power
- Descriptive statistics
- Degrees of freedom
- Pearson correlation
- Null hypothesis
Methodology
- Double-blind study
- Case-control study
- Research ethics
- Data collection
- Hypothesis testing
- Structured interviews
Research bias
- Hawthorne effect
- Unconscious bias
- Recall bias
- Halo effect
- Self-serving bias
- Information bias
According to the APA guidelines, you should report enough detail on inferential statistics so that your readers understand your analyses.
Report the following for each hypothesis test:
- the test statistic value
- the degrees of freedom
- the exact p value (unless it is less than 0.001)
- the magnitude and direction of the effect
You should also present confidence intervals and estimates of effect sizes where relevant.
Use one decimal place for:
- Standard deviations
- Descriptive statistics based on discrete data
Use two decimal places for:
- Correlation coefficients
- Proportions
- Inferential test statistics such as t values, F values, and chi-squares.
In APA style, statistics can be presented in the main text or as tables or figures . To decide how to present numbers, you can follow APA guidelines:
- To present three or fewer numbers, try a sentence,
- To present between 4 and 20 numbers, try a table,
- To present more than 20 numbers, try a figure.
Since these are general guidelines, use your own judgment and feedback from others for effective presentation of numbers.
Cite this Scribbr article
If you want to cite this source, you can copy and paste the citation or click the “Cite this Scribbr article” button to automatically add the citation to our free Citation Generator.
Bhandari, P. (2024, January 17). Reporting Statistics in APA Style | Guidelines & Examples. Scribbr. Retrieved April 9, 2024, from https://www.scribbr.com/apa-style/numbers-and-statistics/
Is this article helpful?

Pritha Bhandari
Other students also liked, how to write an apa results section, how to write an apa methods section, apa format for academic papers and essays, scribbr apa citation checker.
An innovative new tool that checks your APA citations with AI software. Say goodbye to inaccurate citations!

Research Voyage
Research Tips and Infromation
How to write Results Section of your Research Paper

Introduction
How to summarize the data preprocessing steps in the results section, how to summarize the research findings in the results section, common phrasal verbs used in results section, what are common mistakes observed in the results section, how long should a results section be of a research paper, should the results of a research paper be given in the introduction or in another section.
- What is the difference between the "discussion" and the "results" section of a research paper?
Does the summary be part of the result section in the research article?
Why do some scientific papers not include a ‘methods and results’ section, how do you introduce a results section, why do researchers need to avoid making speculations in the results section of a research paper.
The result section is the third major part of the research paper and it’s probably the most important part because it contains actual outcomes about your experiment. The other sections contain a plan, hope and interpretations but the result section is the actual truth of your study.
In the result section, one should aim to narrate his/her finding without trying to interpret or evaluate them. Basically, the result section explains any issues you faced during your data collection, the main results of the experiment and any other interesting trends in the data.
With the results, we want to convey our data in the most accessible way, so we usually use visual elements like graphs and tables to make it easier to understand. The facts, figures, and findings are to be presented in a logical manner leading to the hypothesis and following the sequence of the method section. Mention must be made for the negative results as it would substantiate the discussion section later on. Interpretation of the meaning of the results section is done in the discussion section .
How Results Section is Structured?
When structuring the results section, it is important that your information is presented in a logical order.
Now, when it comes to the organization of the result section, as a generic rule
- Always start with textual content, not a Table or Figure
- Make sure you show the Tables and Figures after they are mentioned in the text
- Explain any missing data or problems you had while collecting the data.
The results section gives you the opportunity to:
- Summarize the Data Preprocessing Steps
2. Report on the Findings
3. Summarize the Research Findings
At the beginning of the result section, you can discuss how you have collected, transformed and analyzed your data. This step is usually known as data preprocessing.
The data collection step may involve collecting data from various hardware, software or internet sources.
If your research requires data cleaning, then explain the steps and procedures used for data cleaning. Here, the researchers can describe how they transformed data to facilitate analysis (e.g. converting data from one format to another format). If there was missing data, explain how you have substituted missing values and with what techniques you have substituted your data.
You can mention what software or statistical procedures you have used to analyze and interpret the data. Demonstrate with the help of charts or tables the cleansed data ready to be used for getting results. In a few research papers, you may find these steps appearing at the end of the method section.
How to Present your Research Findings in Research Section?
Second, present your findings in a structured way (such as thematically or chronologically), bringing the readers’ attention to any important, interesting, or significant findings.
Be sure to include a combination of text and visuals. Data illustrations should not be used to substitute or replace text, but to enhance the narrative of your findings.
Resultant data are to be presented either through text, figures, graphs or tables or in a combination of all of the best suited for leading to the hypothesis. Care should be taken to prevent any duplication of the text, figures, graphs, and tables. If any result is presented in figures or graphs, it need not be explained through text. Similarly, any data presented through the graph should not be repeated in the table.
Each table and graph should be clearly labelled and titled. Each different finding should be made in a separate sub-section under the proper sub-heading following the sequence adopted in Method Section.
If you are not comfortable with data analysis then you can take professional services for research data analysis .
Figures
Identify and list the figures which are relevant to your results. For example, if you are working on the problem statement of ” Identifying the pathological issues with pomegranate fruits”, then you can add the figures of pomegranate fruits with good quality and bad quality along with their stage of infection. If you are working on pomegranate cultivar-related issues, put the figures of pomegranate fruits belonging to different cultivars.
The key takeaway here is not to add any figures which may not directly contribute to results. These diagrams may include generic block diagrams, and images conveying generic information like farm fields, plantations etc.
While putting the figures, as much as possible use grayscale images as many users take the photocopies in black and white mode. In certain scenarios you are
In the case of figures, the captions should come below, called Fig. 1, Fig. 2 and so on.
You can visit my article on The Power of Images in Research Papers: How They Enhance the Quality of Your Paper? . This article will help you how images or figures enhances the possibility of selection of your paper to top quality journals and conferences.
Tables are good for showing the exact values or showing much different information in one place. Graphs are good for showing overall trends and are much easier to understand quickly. It also depends on your data.
Tables are labelled at the top as Table 1, Table 2 and so on. Every table must have a caption. It’s good if one can put independent variable conditions on the left side vertically, and the things you have measured horizontally so one can easily compare the measurements across the categories. But you need to decide for each table you make, what is easiest to understand, and what fits on the paper.
Visit article on Best Practices for Designing and Formatting Tables in Research Papers for further details on proper representation of tables at proper places.
You can use various types of graphs in your results like a line graph, bar graph, scatter plot, a line graph with colours, a box with whiskers plot and a histogram.
In general, continuous variables like temperature, growth, age, and time can be better displayed in a line graph on a scatter plot or maybe on histograms.
If you have comparative data that you would like to represent through a chart then a bar chart would be the best option. This type of chart is one of the more familiar options as it is easy to interpret.
These charts are useful for displaying data that is classified into nominal or ordinal categories. In any case, you need to decide which is the best option for each particular example you have, but never put a graph and a table with the same data in your paper.
In the case of graphs, the captions should come below, called Fig. 1, Fig. 2 and so on.
A limited number of professional tools provide you the chance to add some life to your graphs, charts, and figures and present your data in a way that will astound your audience as much as your astounding results.
My article on Maximizing the Impact of Your Research Paper with Graphs and Charts will help you in drawing eye catching and informative graphs and charts for your research paper.
The results section should include a closing paragraph that clearly summarizes the key findings of the study. This paves the way for the discussion section of the research paper, wherein the results are interpreted and put in conversation with existing literature.
Any unusual correlation observed between variables should be noted in the result section. But any speculation about the reason for such an unusual correlation should be avoided. Such speculations are the domains of the discussion section.
Comparisons between samples or controls are to be clearly defined by specifically mentioning the common quality and the degree of difference between the comparable samples or controls. Results should always be presented in the past tense.
Common academic phrases that can be used in the results section of a paper or research article. I have included a table with examples to illustrate how these phrases might be used:

Let’s look at some of the common mistakes which can be observed in the result section.
- One should not include raw data which are not directly related to your objectives. Readers will not be able to interpret your intentions and may unnecessarily collect unwanted data while replicating your experiments.
- Do not just tell the readers to look at the Table and Figure and figure it out by themselves, e.g “The results are shown in the following Tables and Graphs”.
- Do not give too much explanation about Figures and Tables.
“An Optimized Fuzzy Based Short Term Object Motion Prediction for Real-Life Robot Navigation Environment” ( Paper Link )
Object motions with different motion patterns are generated by a simulator in different directions to generate the initial rule base. The rules generated are clustered based on the direction of the motion pattern into the directional space clusters. Table 1 shows the number of rules that remained in each directional space after removing inconsistencies and redundancies.
Our predictor algorithm is tested for a real-life benchmark dataset (EC Funded CAVIAR project/IST 2001 37540) to check for relative error. The data set consists of different human motion patterns observed at INRIA Lab at Grenoble, France and Shop Centre. These motion patterns consist of frames captured at 25 frames/second. A typical scenario of the INRIA Lab and the Shop Centre is shown in the Figure below.

Fig.1: A typical scenario of the INRIA Lab and the Shop Centre
For each test case, the average response time is calculated to find its suitability for a real-life environment. The prediction algorithm is tested by processing the frame data of moving human patterns stored in the database at intervals of 50 frames (02 Seconds).
The navigation environment is presented in the form of a Prediction graph where the x-axis represents the Range parameter and the y-axis represents the Angle parameter. The predicted Angle and Range values are compared with actual values obtained from the real-life environment.

The performance of the predictor is tested when more than one object is sensed by the sensor. The tests are carried out assuming at most 6-8 objects can be visible and can affect the decisions to be made regarding robot traversal.
The results section is an essential component of any research paper, as it provides readers with a detailed understanding of the study’s findings. In this blog post, we discussed three important steps for writing a results section: summarizing the data preprocessing steps, reporting on the findings, and summarizing the research findings.
Firstly, summarizing the data preprocessing steps is crucial in the results section, as it provides readers with an understanding of how the raw data was processed and transformed. This step includes data cleaning, data transformation, and data reduction techniques. By summarizing the data preprocessing steps, readers can understand how the data was prepared for analysis, which is critical for interpreting the study’s findings accurately.
Secondly, reporting on the findings is an important step in the results section. It involves presenting the study’s results in a clear and concise manner, using tables, graphs, and statistical analyses where necessary. This step should be focused on answering the research question or hypothesis and should present the findings in a way that is easily understood by the reader. Reporting on the findings can also include providing detailed interpretations of the results, as well as any potential limitations of the study.
Finally, summarizing the research findings is crucial in the results section, as it provides readers with a concise summary of the study’s main results and conclusions. This step should be written in a clear and straightforward manner, highlighting the most important findings and explaining their significance. Additionally, it should relate the study’s findings to the research question or hypothesis and provide a conclusion that is well-supported by the results.
Overall, the results section of a research paper is a critical component that requires careful attention to detail. By following the guidelines discussed in this blog post, researchers can present their findings in a clear and concise manner, helping readers to understand the research process and the resulting conclusions.
Frequently Asked Questions
An IMRaD paper format suggests around 35% of the text should be dedicated to the results and discussion section. For a research paper of length 10 pages, the results and discussion section should occupy 3-4 pages.
The results of a research paper should be given in a separate section. However, the highlights of the results can be discussed in the introduction section.
What is the difference between the “discussion” and the “results” section of a research paper?
The results section only depicts the results obtained by implementing the methodology used. The results will be in the form of figures, tables, charts or graphs. The discussion section elaborates the analysis of the results obtained in the results section.
The summary can be part of the results section of a research paper. However, the results obtained can be summarized in the form of a table in results section of a research paper.
Survey papers and papers which are focussed on theoretical proofs do not involve separate methods and results sections.
The results section is introduced by the data collection steps and the setting up of equipment in different scenarios for obtaining the results.
Making speculations in the results section may lead to wrong interpretations by the researcher who is planning to replicate the methodology used for obtaining the results. This may further lead to wrong comparative analysis.
Upcoming Events
- Visit the Upcoming International Conferences at Exotic Travel Destinations with Travel Plan
- Visit for Research Internships Worldwide

Leave a Reply Cancel reply
You must be logged in to post a comment.
Recent Posts
- 04 Reasons for Outsourcing Academic Conference Management
- How to Put Research Grants on Your CV ?
- How to Request for Journal Publishing Charge (APC) Discount or Waiver?
- Do Review Papers Count for the Award of a PhD Degree?
- Vinay Kabadi, University of Melbourne, Interview on Award-Winning Research
- All Blog Posts
- Research Career
- Research Conference
- Research Internship
- Research Journal
- Research Tools
- Uncategorized
- Research Conferences
- Research Journals
- Research Grants
- Internships
- Research Internships
- Email Templates
- Conferences
- Blog Partners
- Privacy Policy
Copyright © 2024 Research Voyage
Design by ThemesDNA.com

- Dissertation & Thesis Guides
- Basics of Dissertation & Thesis Writing
- How to Write a Results Section for a Dissertation or Research Paper: Guide & Examples
- Speech Topics
- Basics of Essay Writing
- Essay Topics
- Other Essays
- Main Academic Essays
- Research Paper Topics
- Basics of Research Paper Writing
- Miscellaneous
- Chicago/ Turabian
- Data & Statistics
- Methodology
- Admission Writing Tips
- Admission Advice
- Other Guides
- Student Life
- Studying Tips
- Understanding Plagiarism
- Academic Writing Tips
- Essay Guides
- Research Paper Guides
- Formatting Guides
- Basics of Research Process
- Admission Guides
How to Write a Results Section for a Dissertation or Research Paper: Guide & Examples

Table of contents
Use our free Readability checker
A results section is a crucial part of a research paper or dissertation, where you analyze your major findings. This section goes beyond simply presenting study outcomes. You should also include a comprehensive statistical analysis and interpret the collected data in detail.
Without dissertation research results, it is impossible to imagine a scientific work. Your task here is to present your study findings. What are qualitative or quantitative indicators? How to use tables and diagrams? How to describe data? Our article answers all these questions and many more. So, read further to discover how to analyze and describe your research indexes or contact or professionals for dissertation help from StudyCrumb.
What Is a Results Section of Dissertation?
The results section of a dissertation is a data statement from your research. Here you should present the main findings of your study to your readers. This section aims to show information objectively, systematically, concisely. It is allowed using text supplemented with illustrations. In general, this section's length is not limited but should include all necessary data. Interpretations or conclusions should not be included in this section. Therefore, in theory, this is one of your shortest sections. But it can also be one of the most challenging sections. The introduction presents a research topic and answers the question "why?". The Methods section explains the data collection process and answers "how?". Meanwhile, the result section shows actual data gained from experiments and tells "what?" Thus, this part plays a critical role in highlighting study's relevance. This chapter gives reader study relevance with novelty. So, you should figure out how to write it correctly. Here are main tasks that you should keep in mind while writing:
- Results answer the question "What was found in your research?"
- Results contain only your study's outcome. They do not include comments or interpretations.
- Results must always be presented accurately & objectively.
- Tables & figures are used to draw readers' attention. But the same data should never be presented in the form of a table and a figure. Don't repeat anything from a table also in text.
Dissertation: Results vs Discussion vs Conclusion
Results and discussion sections of a dissertation are often confused among researchers. Sometimes both these parts are mixed up with a conclusion for thesis . Figured out what is covered in each of these important chapters. Your readers should see that you notice how different they are. A clear understanding of differences will help you write your dissertation more effectively. 5 differences between Results VS Discussion VS Conclusion:
Wanna figure out the actual difference between discussion vs conclusion? Check out our helpful articles about Dissertation Discussion or Dissertation Conclusion.
Present Your Findings When Writing Results Section of Dissertation
Now it's time to understand how to arrange the results section of the dissertation. First, present most general findings, then narrow it down to a more specific one. Describe both qualitative & quantitative results. For example, imagine you are comparing the behavior of hamsters and mice. First, say a few words about the behavioral type of mammals that you studied. Then, mention rodents in general. At end, describe specific species of animals you carried out an experiment on.
Qualitative Results Section in Dissertation
In your dissertation results section, qualitative data may not be directly related to specific sub-questions or hypotheses. You can structure this chapter around main issues that arise when analyzing data. For each question, make a general observation of what data show. For example, you may recall recurring agreements or differences, patterns, trends. Personal answers are the basis of your research. Clarify and support these views with direct quotes. Add more information to the thesis appendix if it's needed.
Quantitative Results Section in a Dissertation
The easiest way to write a quantitative dissertation results section is to build it around a sub-question or hypothesis of your research. For each subquery, provide relevant results and include statistical analysis . Then briefly evaluate importance & reliability. Notice how each result relates to the problem or whether it supports the hypothesis. Focus on key trends, differences, and relationships between data. But don't speculate about their meaning or consequences. This should be put in the discussion vs conclusion section. Suppose your results are not directly related to answering your questions. Maybe there is additional information that helps readers understand how you collect data. In that case, you can include them in the appendix. It is often helpful to include visual elements such as graphs, charts, and tables. But only if they accurately support your results and add value.
Tables and Figures in Results Section in Dissertation
We recommend you use tables or figures in the dissertation results section correctly. Such interpretation can effectively present complex data concisely and visually. It allows readers to quickly gain a statistical overview. On the contrary, poorly designed graphs can confuse readers. That will reduce the effectiveness of your article. Here are our recommendations that help you understand how to use tables and figures:
- Make sure tables and figures are self-explanatory. Sometimes, your readers may look at tables and figures before reading the entire text. So they should make sense as separate elements.
- Do not repeat the content of tables and figures in text. Text can be used to highlight key points from tables and figures. But do not repeat every element.
- Make sure that values or information in tables and text are consistent. Make sure that abbreviations, group names, interpretations are the same as in text.
- Use clear, informative titles for tables and figures. Do not leave any table or figure without a title or legend. Otherwise, readers will not be able to understand data's meaning. Also, make sure column names, labels, figures are understandable.
- Check accuracy of data presented in tables and figures. Always double-check tables and figures to make sure numbers converge.
- Tables should not contain redundant information. Make sure tables in the article are not too crowded. If you need to provide extensive data, use Appendixes.
- Make sure images are clear. Make sure images and all parts of drawings are precise. Lettering should be in a standard font and legible against the background of the picture.
- Ask for permission to use illustrations. If you use illustrations, be sure to ask copyright holders and indicate them.
Tips on How to Write a Results Section
We have prepared several tips on how to write the results section of the dissertation! Present data collected during study objectively, logically, and concisely. Highlight most important results and organize them into specific sections. It is an excellent way to show that you have covered all the descriptive information you need. Correct usage of visual elements effectively helps your readers with understanding. So, follow main 3 rules for writing this part:
- State only actual results. Leave explanations and comments for Discussion.
- Use text, tables, and pictures to orderly highlight key results.
- Make sure that contents of tables and figures are not repeated in text.
In case you have questions about a conceptual framework in research , you will find a blog dedicated to this issue in our database.
What to Avoid When Writing the Results Section of a Dissertation
Here we will discuss how NOT to write the results section of a dissertation. Or simply, what points to avoid:
- Do not make your research too complicated. Your paper, tables, and graphs should be clearly marked and follow order. So that they can exist independently without further explanation.
- Do not include raw data. Remember, you are summarizing relevant results, not reporting them in detail. This chapter should briefly summarize your findings. Avoid complete introduction to each number and calculation.
- Do not contradict errors or false results. Explain these errors and contradictions in conclusions. This often happens when different research methods have been used.
- Do not write a conclusion or discussion. Instead, this part should contain summaries of findings.
- Do not tend to include explanations and inferences from results. Such an approach can make this chapter subjective, unclear, and confusing to the reader.
- Do not forget about novelty. Its lack is one of the main reasons for the paper's rejection.
Dissertation Results Section Example
Let's take a look at some good results section of dissertation examples. Remember that this part shows fundamental research you've done in detail. So, it has to be clear and concise, as you can see in the sample.
Final Thoughts on Writing Results Section of Dissertation
When writing a results section of a dissertation, highlight your achievements by data. The main chapter's task is to convince the reader of conclusions' validity of your research. You should not overload text with too detailed information. Never use words whose meanings you do not understand. Also, oversimplification may seem unconvincing for readers. But on the other hand, writing this part can even be fun. You can directly see your study results, which you'll interpret later. So keep going, and we wish you courage!

Writing any academic paper is long and thorough work. But StudyCrumb got you back! Our professional writers will deliver any type of work quickly and excellently!

Joe Eckel is an expert on Dissertations writing. He makes sure that each student gets precious insights on composing A-grade academic writing.

- University of Memphis Libraries
- Research Guides
Empirical Research: Defining, Identifying, & Finding
- Defining Empirical Research
- Introduction
The Results Section
- Database Tools
- Search Terms
- Image Descriptions
The Results section provides the outcomes of the research process detailed in the Methods section.
What Criteria to Look For
The Results section is where the authors talk about the primary data that has been collected and analyzed. Most articles will not have the complete, unanalyzed primary data, but instead have data that has already gone through some analysis for patterns, trends, and cause and effect.
Finding the Criteria
The section is by far most-commonly called "Results," though there are a few variations such as "Findings." There may be some differences in what to look for between quantitative and qualitative research.
Quantitative Research
- You will be looking for data that is primarily numerical.
- There are likely tables and figures sharing and summarizing the data. These may also be included in appendixes at the end of the article or online.
Qualitative Research
- You will be looking for data that is likely textual or visual.
- Tables and figures may be included but are less common.
- Some qualitative articles do not have a single Results section but provide multiple headings for the results organized by theme.
In some research disciplines, there is a growing movement towards open data where the authors will share their complete primary data in an online repository for other researchers to access and evaluate. In this case, the article will include where to find that open data. This is still is not standard for a lot of research, and for research on human behavior, especially qualitative research, there may be confidentiality and privacy issues that prevent sharing the primary data.
- Single "3. Results" heading that begins on page 91.
- Quantitative research that includes a lot of statistical analysis.
- Includes two figures (Figure 2 & 3 on page 92) and one table (Table 3 on page 93), as well as additional tables and figures in online appendixes.
- Single "Results" section that begins on page 574. It is organized into subheadings.
- Includes 2 figures (Figure 1 & Figure 2 on page 576) and 2 tables (Table 1 on page 574 & Table 2 on page 575)
- The Results section is thematically labeled "LGBTQ College Students and Hookup Culture" and starts on page 1006. There are then three subheadings organized by the themes discussed.
- Qualitative research where the data consists of text from interview transcripts.
- << Previous: Methods
- Next: Discussion >>
- Last Updated: Apr 2, 2024 11:25 AM
- URL: https://libguides.memphis.edu/empirical-research
- UB Directory
- Research and Economic Development >
- Need to Know and Events >
- Need to Know >
- Research Roundtable: ClinicalTrials.gov FAQ — Results Reporting (Part 1)
Research Roundtable: ClinicalTrials.gov FAQ — Results Reporting (Part 1)

Published April 10, 2024
In the first part of a two-part series, “Research Roundtable” highlights elements of the “Results Reporting” FAQ section from ClinicalTrials.gov.
ClinicalTrials.gov is a publicly available registry and results database of federally and privately supported clinical trials conducted in the United States and internationally. It has an extensive FAQ section ranging from general to investigation-specific. Many of these questions frequently arise at the University at Buffalo, primarily regarding either study registration or results posting. This edition of “Research Roundtable” is part one of a two-part series that highlights a selected FAQ, “Results Reporting.”
Which types of studies are required to have results reported?
1. Applicable Clinical Trials (ACT) per Food and Drug Administration Amendments Act of 2007 (FDAAA), including:
- Trials of drug/biological products: Controlled, clinical investigations of a product subject to FDA regulations
- Trials of devices: Prospective controlled trials with health outcomes comparing a device against a control
Note that an ACT requirement must also meet one of the following:
- Trial has one site in the U.S.
- Trial is conducted under FDA Investigational New Drug (IND) or Investigational Device Exemption (IDE)
- Trial involves a drug, biologic, or device that is manufactured in the U.S. and is exported for research
Excluded from this requirement per FDAAA are:
- Phase 1 drug trials
- Small clinical trials to determine the feasibility of a device
- Trials that do not include drugs, biologics, or devices (e.g., behavioral interventions)
- Non-interventional (observational) clinical research
2. All NIH-Funded Clinical Trials including studies with human subjects prospectively assigned to one or more interventions to evaluate the effects of interventions on health-related biomedical or behavioral outcomes.
Excluded from this requirement per NIH are studies intended solely to refine measures and studies that involve secondary research with biological specimens or health information.
When are results required to be entered into the study record?
The timeline for the FDAAA and the NIH Policy for submitting results information is no later than one year after the trial’s Primary Completion Date , which is the date that the final subject was examined, or received an intervention, for the purposes of final collection of data for the primary outcome .
Is there guidance for entering study results?
Step-by-step instructions for submitting Results information into the ClinicalTrials.gov Protocol Registration and Results System (PRS) is provided in PRS Guided Tutorials .
Are there consequences for not submitting results?
FDA noncompliance with ClinicalTrials.gov registration and results reporting may result in fines, currently more than $14,000 per study/per day, for PIs and their institutions. Pre-notices may be issued for potential violations. For an NIH-funded study for which a grantee is the responsible party, failure to submit required results information could result in NIH not releasing remaining funding for a grant or funding for a future grant.
Can the timeline for entering results be extended?
A request can be made to delay the submission of results information by submitting a “good cause extension” via the PRS prior to the date that results information would be due.
What happens to the study record if the study is prematurely terminated/withdrawn?
Records that have a National Clinical Trial (NCT) number cannot be deleted. If no participants were ever enrolled in the trial, the “Overall Recruitment Status” can be set to “Withdrawn” and no results information will need to be submitted. ACTs and NIH-funded trials that terminate prematurely but have enrolled participants and collected data must report results on ClinicalTrials.gov.
When does my obligation to update clinical trial information end?
For ACTs, NIH-funded trials, and voluntary trial submissions that are required to be registered, the responsible party's obligation to submit updates ends when all required clinical trial results information has been submitted and the responsible party has made all corrections and/or addressed all concerns in response to any notice received from PRS.
How can I get ClinicalTrials.gov help at UB?
For UB assistance with ClinicalTrials.gov registration and reporting requirements, contact the UB ClinicalTrials.gov team ( [email protected] ) or ClinicalTrials.gov PRS Administrators Lynn Jagodzinski ( [email protected] ), CTSI Clinical Research Regulatory Administrator, and Urmo “Mo” Jaanimägi ( [email protected] ), CTSI Quality Assurance Specialist.
Watch for part two of “ClinicalTrials.gov FAQ — Results Reporting” in an upcoming edition of “Research Roundtable.”
“Research Roundtable” is a section in the University at Buffalo Clinical and Translational Science Institute (CTSI) Translational Spotlight newsletter. Add your email to the newsletter mailing list here .

UB partners with Roswell / U of Rochester for Empire Discovery Institute (EDI)
The new institute will streamline efforts to turn groundbreaking drug research into viable treatments and medicines, bringing new companies and new jobs.
- SUGGESTED TOPICS
- The Magazine
- Newsletters
- Managing Yourself
- Managing Teams
- Work-life Balance
- The Big Idea
- Data & Visuals
- Reading Lists
- Case Selections
- HBR Learning
- Topic Feeds
- Account Settings
- Email Preferences
Transformations That Work
- Michael Mankins
- Patrick Litre

More than a third of large organizations have some type of transformation program underway at any given time, and many launch one major change initiative after another. Though they kick off with a lot of fanfare, most of these efforts fail to deliver. Only 12% produce lasting results, and that figure hasn’t budged in the past two decades, despite everything we’ve learned over the years about how to lead change.
Clearly, businesses need a new model for transformation. In this article the authors present one based on research with dozens of leading companies that have defied the odds, such as Ford, Dell, Amgen, T-Mobile, Adobe, and Virgin Australia. The successful programs, the authors found, employed six critical practices: treating transformation as a continuous process; building it into the company’s operating rhythm; explicitly managing organizational energy; using aspirations, not benchmarks, to set goals; driving change from the middle of the organization out; and tapping significant external capital to fund the effort from the start.
Lessons from companies that are defying the odds
Idea in Brief
The problem.
Although companies frequently engage in transformation initiatives, few are actually transformative. Research indicates that only 12% of major change programs produce lasting results.
Why It Happens
Leaders are increasingly content with incremental improvements. As a result, they experience fewer outright failures but equally fewer real transformations.
The Solution
To deliver, change programs must treat transformation as a continuous process, build it into the company’s operating rhythm, explicitly manage organizational energy, state aspirations rather than set targets, drive change from the middle out, and be funded by serious capital investments.
Nearly every major corporation has embarked on some sort of transformation in recent years. By our estimates, at any given time more than a third of large organizations have a transformation program underway. When asked, roughly 50% of CEOs we’ve interviewed report that their company has undertaken two or more major change efforts within the past five years, with nearly 20% reporting three or more.
- Michael Mankins is a leader in Bain’s Organization and Strategy practices and is a partner based in Austin, Texas. He is a coauthor of Time, Talent, Energy: Overcome Organizational Drag and Unleash Your Team’s Productive Power (Harvard Business Review Press, 2017).
- PL Patrick Litre leads Bain’s Global Transformation and Change practice and is a partner based in Atlanta.
Partner Center
Purdue’s I-EaT Research Lab examining swallowing and speech in children with cerebral palsy

Georgia Malandraki
Written by: Tim Brouk, [email protected]
Understanding the role head and neck muscles play in eating and talking for children with cerebral palsy (CP) is a research effort led by Georgia Malandraki , professor in the Purdue University Department of Speech, Language, and Hearing Sciences , and her I-EaT Lab . The work was funded by the National Institutes of Health, the American Academy for Cerebral Palsy and Developmental Medicine, and the Purdue College of Health and Human Sciences .
“More than 50% of children and adults with cerebral palsy may have speech, feeding and swallowing difficulties,” Malandraki said. “Although there has been a lot of research on the gross motor and hand functions of this population and how to best rehabilitate them, there has been much less work on the underlying mechanisms that cause feeding, swallowing and speech difficulties. This has limited our treatment options for these children and was a gap that we wanted to address.”
Speech difficulties can result in children and adults with CP not being understood; feeling isolated; and having reduced academic, social and employment fulfillment. Swallowing difficulties can also lead to serious consequences, such as being undernourished, dehydrated or in severe cases, developing respiratory infections (pneumonia) from foods and liquids not being safely swallowed. These types of difficulties — swallowing and speech — may also co-occur.
Most of the available treatments for swallowing and speech difficulties in CP are compensatory in nature and mostly address the symptoms, according to Malandraki. For example, simple changes in the child’s head and neck position during meals can aid in swallowing, and specialized, padded eating utensils could be an easy investment for families if a child with CP is having feeding issues. Malandraki added that making meals with softer, easier-to-swallow food, such as a fruit smoothie instead of fruit that needs to be chewed, is another simple strategy when children have difficulty chewing. Speaking slower or using exaggerated mouth movements are some common speech strategies as well.
“To be able to effectively improve the speech and swallowing functions of children and adults with CP, it is first imperative to understand how their muscles and brains work so we can use that information as we develop new treatments that will not just focus on the symptoms,” Malandraki stated.
Understanding underlying mechanisms

A child wears small muscle activity readers on their face to study how muscles activate during eating and speech tasks.
Through electromyography (small muscle activity readers), Malandraki and her team measured the head and neck muscle activity in 16 children with CP ages 7-12 and 16 children without the condition but the same ages.
The children with CP were tested at two sites, Malandraki’s lab and Nationwide Children’s Hospital in Columbus, Ohio. All had unilateral CP, a form of the condition where one side of the body is weaker than the other due to brain lesions affecting primarily one side of the brain. These children are usually more physically functional than children with more severe types of CP, such as quadriplegic CP, where both sides of the body are affected.
The children were able to feed themselves, and they were given a variety of food and liquids to swallow and were also asked to complete simple speech tasks. Through sensors attached around the mouth and under the chin, the researchers first found children with CP use these muscles much more than children without CP for both swallowing and speaking. This over-activation means these children were spending more energy to eat and speak than the typically developing control group.
“They show increased amplitude of muscle activity, indicating a lot of muscle effort,” Malandraki said. “So, they’re expending a lot of energy on both sides — the affected and unaffected — of the head and neck to be able to do simple tasks, such as eat, swallow and speak.”
For swallowing testing, the children were given sips of water to drink and pudding and pretzels to eat. Repetition of simple sounds and words was also requested. While used differently, the same muscles — perilabial (around the lips) and submental (under the chin) — are in play for both tasks.
Along with how much the muscles are fired, the researchers looked at timing — how quickly do the muscles react, and how long are they being contracted during a task? Swallowing and speech both require very delicate muscular coordination and timing. This biomechanic dance is easy for most but for children with CP, the steps can be arduous.
“What we saw was that in addition to using more muscle activity, they also used the muscles with less coordination between left and right sides compared to the typically developing group,” Malandraki said. “Our findings show that there may be a muscle coordination issue in some of these children. They can contract the muscles but have a hard time isolating the specific muscles that they need for a specific task.”
Recently published in the Journal of Neurophysiology , the work can inform evaluation processes and improve treatments for the children as they grow and develop.
“We want to better understand what the underlying mechanisms of the speech, feeding and swallowing difficulties that we see in these children are and also what are the interactions between speech and swallowing,” Malandraki said. “We are interested in finding more about a potential cross-system interaction between these two vital functions that both share many of the same mechanisms and muscles in the head and neck but use these muscles a little bit differently — or they’re supposed to use them a little bit differently for each function.”
Brain analysis results next
The study also collected magnetic resonance imaging (MRI) scans of the brains of children with CP and their typically developing peers. Since CP is typically caused by lesions on the brain formed during infancy or even while in the fetal state, this arm of the work is being analyzed now and will reveal neurological understanding of how children with varying levels of CP swallow and speak.
Tackling potentially life-threatening issues for children with CP is a difficult task because no child with the condition is like another. In her work, Malandraki said the severity of CP and of the speech and feeding profiles within the 16 children tested for the recent work ranged widely. Studying data gathered from muscle and brain MRI scans will help understand how some of these children can develop better swallowing and speech skills than others, and give us insights into how children and their families can adapt as the children grow into teenagers and young adults.
“Hopefully we can use these findings to develop treatments that will target these mechanisms,” Malandraki explained. “Most current treatments are not improving their speech and swallowing to the level that hopefully they could if they were based on their underlying mechanisms. Our work is trying to change that.”
Malandraki is currently expanding this work to other neurological populations to guide physiology-based treatment development for debilitating swallowing and speech disorders across the life span.
- See us on facebook
- See us on twitter
- See us on youtube
- See us on linkedin
- See us on instagram
Two key brain systems are central to psychosis, Stanford Medicine-led study finds
When the brain has trouble filtering incoming information and predicting what’s likely to happen, psychosis can result, Stanford Medicine-led research shows.
April 11, 2024 - By Erin Digitale

People with psychosis have trouble filtering relevant information (mesh funnel) and predicting rewarding events (broken crystal ball), creating a complex inner world. Emily Moskal
Inside the brains of people with psychosis, two key systems are malfunctioning: a “filter” that directs attention toward important external events and internal thoughts, and a “predictor” composed of pathways that anticipate rewards.
Dysfunction of these systems makes it difficult to know what’s real, manifesting as hallucinations and delusions.
The findings come from a Stanford Medicine-led study , published April 11 in Molecular Psychiatry , that used brain scan data from children, teens and young adults with psychosis. The results confirm an existing theory of how breaks with reality occur.
“This work provides a good model for understanding the development and progression of schizophrenia, which is a challenging problem,” said lead author Kaustubh Supekar , PhD, clinical associate professor of psychiatry and behavioral sciences.
The findings, observed in individuals with a rare genetic disease called 22q11.2 deletion syndrome who experience psychosis as well as in those with psychosis of unknown origin, advance scientists’ understanding of the underlying brain mechanisms and theoretical frameworks related to psychosis.
During psychosis, patients experience hallucinations, such as hearing voices, and hold delusional beliefs, such as thinking that people who are not real exist. Psychosis can occur on its own and isa hallmark of certain serious mental illnesses, including bipolar disorder and schizophrenia. Schizophrenia is also characterized by social withdrawal, disorganized thinking and speech, and a reduction in energy and motivation.
It is challenging to study how schizophrenia begins in the brain. The condition usually emerges in teens or young adults, most of whom soon begin taking antipsychotic medications to ease their symptoms. When researchers analyze brain scans from people with established schizophrenia, they cannot distinguish the effects of the disease from the effects of the medications. They also do not know how schizophrenia changes the brain as the disease progresses.
To get an early view of the disease process, the Stanford Medicine team studied young people aged 6 to 39 with 22q11.2 deletion syndrome, a genetic condition with a 30% risk for psychosis, schizophrenia or both.

Kaustubh Supekar
Brain function in 22q11.2 patients who have psychosis is similar to that in people with psychosis of unknown origin, they found. And these brain patterns matched what the researchers had previously theorized was generating psychosis symptoms.
“The brain patterns we identified support our theoretical models of how cognitive control systems malfunction in psychosis,” said senior study author Vinod Menon , PhD, the Rachael L. and Walter F. Nichols, MD, Professor; a professor of psychiatry and behavioral sciences; and director of the Stanford Cognitive and Systems Neuroscience Laboratory .
Thoughts that are not linked to reality can capture the brain’s cognitive control networks, he said. “This process derails the normal functioning of cognitive control, allowing intrusive thoughts to dominate, culminating in symptoms we recognize as psychosis.”
Cerebral sorting
Normally, the brain’s cognitive filtering system — aka the salience network — works behind the scenes to selectively direct our attention to important internal thoughts and external events. With its help, we can dismiss irrational thoughts and unimportant events and focus on what’s real and meaningful to us, such as paying attention to traffic so we avoid a collision.
The ventral striatum, a small brain region, and associated brain pathways driven by dopamine, play an important role in predicting what will be rewarding or important.
For the study, the researchers assembled as much functional MRI brain-scan data as possible from young people with 22q11.2 deletion syndrome, totaling 101 individuals scanned at three different universities. (The study also included brain scans from several comparison groups without 22q11.2 deletion syndrome: 120 people with early idiopathic psychosis, 101 people with autism, 123 with attention deficit/hyperactivity disorder and 411 healthy controls.)
The genetic condition, characterized by deletion of part of the 22nd chromosome, affects 1 in every 2,000 to 4,000 people. In addition to the 30% risk of schizophrenia or psychosis, people with the syndrome can also have autism or attention deficit hyperactivity disorder, which is why these conditions were included in the comparison groups.
The researchers used a type of machine learning algorithm called a spatiotemporal deep neural network to characterize patterns of brain function in all patients with 22q11.2 deletion syndrome compared with healthy subjects. With a cohort of patients whose brains were scanned at the University of California, Los Angeles, they developed an algorithmic model that distinguished brain scans from people with 22q11.2 deletion syndrome versus those without it. The model predicted the syndrome with greater than 94% accuracy. They validated the model in additional groups of people with or without the genetic syndrome who had received brain scans at UC Davis and Pontificia Universidad Católica de Chile, showing that in these independent groups, the model sorted brain scans with 84% to 90% accuracy.
The researchers then used the model to investigate which brain features play the biggest role in psychosis. Prior studies of psychosis had not given consistent results, likely because their sample sizes were too small.

Vinod Menon
Comparing brain scans from 22q11.2 deletion syndrome patients who had and did not have psychosis, the researchers showed that the brain areas contributing most to psychosis are the anterior insula (a key part of the salience network or “filter”) and the ventral striatum (the “reward predictor”); this was true for different cohorts of patients.
In comparing the brain features of people with 22q11.2 deletion syndrome and psychosis against people with psychosis of unknown origin, the model found significant overlap, indicating that these brain features are characteristic of psychosis in general.
A second mathematical model, trained to distinguish all subjects with 22q11.2 deletion syndrome and psychosis from those who have the genetic syndrome but without psychosis, selected brain scans from people with idiopathic psychosis with 77.5% accuracy, again supporting the idea that the brain’s filtering and predicting centers are key to psychosis.
Furthermore, this model was specific to psychosis: It could not classify people with idiopathic autism or ADHD.
“It was quite exciting to trace our steps back to our initial question — ‘What are the dysfunctional brain systems in schizophrenia?’ — and to discover similar patterns in this context,” Menon said. “At the neural level, the characteristics differentiating individuals with psychosis in 22q11.2 deletion syndrome are mirroring the pathways we’ve pinpointed in schizophrenia. This parallel reinforces our understanding of psychosis as a condition with identifiable and consistent brain signatures.” However, these brain signatures were not seen in people with the genetic syndrome but no psychosis, holding clues to future directions for research, he added.
Applications for treatment or prevention
In addition to supporting the scientists’ theory about how psychosis occurs, the findings have implications for understanding the condition — and possibly preventing it.
“One of my goals is to prevent or delay development of schizophrenia,” Supekar said. The fact that the new findings are consistent with the team’s prior research on which brain centers contribute most to schizophrenia in adults suggests there may be a way to prevent it, he said. “In schizophrenia, by the time of diagnosis, a lot of damage has already occurred in the brain, and it can be very difficult to change the course of the disease.”
“What we saw is that, early on, functional interactions among brain regions within the same brain systems are abnormal,” he added. “The abnormalities do not start when you are in your 20s; they are evident even when you are 7 or 8.”
Our discoveries underscore the importance of approaching people with psychosis with compassion.
The researchers plan to use existing treatments, such as transcranial magnetic stimulation or focused ultrasound, targeted at these brain centers in young people at risk of psychosis, such as those with 22q11.2 deletion syndrome or with two parents who have schizophrenia, to see if they prevent or delay the onset of the condition or lessen symptoms once they appear.
The results also suggest that using functional MRI to monitor brain activity at the key centers could help scientists investigate how existing antipsychotic medications are working.
Although it’s still puzzling why someone becomes untethered from reality — given how risky it seems for one’s well-being — the “how” is now understandable, Supekar said. “From a mechanistic point of view, it makes sense,” he said.
“Our discoveries underscore the importance of approaching people with psychosis with compassion,” Menon said, adding that his team hopes their work not only advances scientific understanding but also inspires a cultural shift toward empathy and support for those experiencing psychosis.
“I recently had the privilege of engaging with individuals from our department’s early psychosis treatment group,” he said. “Their message was a clear and powerful: ‘We share more similarities than differences. Like anyone, we experience our own highs and lows.’ Their words were a heartfelt appeal for greater empathy and understanding toward those living with this condition. It was a call to view psychosis through a lens of empathy and solidarity.”
Researchers contributed to the study from UCLA, Clinica Alemana Universidad del Desarrollo, Pontificia Universidad Católica de Chile, the University of Oxford and UC Davis.
The study was funded by the Stanford Maternal and Child Health Research Institute’s Uytengsu-Hamilton 22q11 Neuropsychiatry Research Program, FONDEYCT (the National Fund for Scientific and Technological Development of the government of Chile), ANID-Chile (the Chilean National Agency for Research and Development) and the U.S. National Institutes of Health (grants AG072114, MH121069, MH085953 and MH101779).

About Stanford Medicine
Stanford Medicine is an integrated academic health system comprising the Stanford School of Medicine and adult and pediatric health care delivery systems. Together, they harness the full potential of biomedicine through collaborative research, education and clinical care for patients. For more information, please visit med.stanford.edu .
Artificial intelligence
Exploring ways AI is applied to health care


An official website of the United States government
Here’s how you know
Official websites use .gov A .gov website belongs to an official government organization in the United States.
Secure .gov websites use HTTPS A lock ( Lock A locked padlock ) or https:// means you’ve safely connected to the .gov website. Share sensitive information only on official, secure websites.
JavaScript appears to be disabled on this computer. Please click here to see any active alerts .
Air Quality Information: Making Sense of Air Pollution Data to Inform Decisions in Underserved Communities Overburdened by Air Pollution Exposures Funding Opportunity
Overview information, u.s. environmental protection agency office of science advisor, policy and engagement office of research and development science to achieve results (star) program, air quality information: making sense of air pollution data to inform decisions in underserved communities overburdened by air pollution exposures.
This is the initial announcement of this funding opportunity
Funding Opportunity Number: EPA-G2024-STAR-D1
Assistance Listing Number 66.509
Solicitation Opening Date: April 8, 2024 Solicitation Closing Date: June 26, 2024: 11:59:59 pm Eastern Time
Informational Webinar: April 22, 2024, at 2:00 p.m. - 3:00 p.m. ET
Register Here
The U.S. Environmental Protection Agency (EPA) Office of Research and Development (ORD), as part of the Science to Achieve Results (STAR) program and in collaboration with the Air, Climate, and Energy (ACE) research program, is seeking applications proposing community-engaged research in underserved communities to advance the use of air pollution data and communication of air quality information for empowering local decisions and actions that address community-identified air pollution concerns. Specifically, this funding opportunity is soliciting research projects that involve substantial engagement with communities, community-based organizations, and/or Tribes to address both of the following priorities:
- methods and tools for data integration and analysis to characterize community exposures to air pollution in underserved communities
- effective communication of air quality information to communities and decision makers to support actions to address air pollution concerns in underserved communities
This research solicitation supports the Administration’s priorities to address environmental justice (EJ).
Air Quality Information: Making Sense of Air Pollution Data to Inform Decisions in Underserved Communities Overburdened by Air Pollution Exposures Funding Opportunity (pdf) (684.7 KB)
- Research Grants Home
- Funding Opportunities
- Air Research Grants
- Climate Change Research Grants
- Ecosystems Research Grants
- Health Research Grants
- Safer Chemicals Research Grants
- Sustainability Research Grants
- Water Research Grants
- Research Grants Events
- About Research Grants
COMMENTS
Checklist: Research results 0 / 7. I have completed my data collection and analyzed the results. I have included all results that are relevant to my research questions. I have concisely and objectively reported each result, including relevant descriptive statistics and inferential statistics. I have stated whether each hypothesis was supported ...
Research Results. Research results refer to the findings and conclusions derived from a systematic investigation or study conducted to answer a specific question or hypothesis. These results are typically presented in a written report or paper and can include various forms of data such as numerical data, qualitative data, statistics, charts, graphs, and visual aids.
Step 1: Consult the guidelines or instructions that the target journal or publisher provides authors and read research papers it has published, especially those with similar topics, methods, or results to your study. The guidelines will generally outline specific requirements for the results or findings section, and the published articles will ...
For most research papers in the social and behavioral sciences, there are two possible ways of organizing the results. Both approaches are appropriate in how you report your findings, but use only one approach. Present a synopsis of the results followed by an explanation of key findings. This approach can be used to highlight important findings.
Structure your results section around tables or figures that summarize the results of your statistical analysis. In many cases, the easiest way to accomplish this is to first create your tables and figures and then organize them in a logical way. Next, write the summary text to support your illustrative materials.
1. Context. The "results section" is the heart of the paper, around which the other sections are organized ().Research is about results and the reader comes to the paper to discover the results ().In this section, authors contribute to the development of scientific literature by providing novel, hitherto unknown knowledge ().In addition to the results, this section contains data and ...
The results section of a research paper tells the reader what you found, while the discussion section tells the reader what your findings mean. The results section should present the facts in an academic and unbiased manner, avoiding any attempt at analyzing or interpreting the data. Think of the results section as setting the stage for the ...
Chris A. Mack. SPIE. 2018. Present the results of the paper, in logical order, using tables and graphs as necessary. Explain the results and show how they help to answer the research questions posed in the Introduction. Evidence does not explain itself; the results must be presented and then explained. Avoid: presenting results that are never ...
Next, the results section needs to communicate the findings of your research in a systematic manner. The section needs to be organized such that the primary research question is addressed first, then the secondary research questions. If the research addresses multiple questions, the results section must individually connect with each of the ...
The results section of the research paper is where you report the findings of your study based upon the information gathered as a result of the methodology [or methodologies] you applied. The results section should simply state the findings, without bias or interpretation, and arranged in a logical sequence. The results section should always be ...
Developing a well-written research paper is an important step in completing a scientific study. This paper is where the principle investigator and co-authors report the purpose, methods, findings, and conclusions of the study. A key element of writing a research paper is to clearly and objectively report the study's findings in the Results section.
The "Results" section is arguably the most important section in a research manuscript as the findings of a study, obtained diligently and painstakingly, are presented in this section. A well-written results section reflects a well-conducted study. This chapter provides helpful pointers for writing an effective, organized results section.
Research paper is a type of research report. A research paper is a document that presents the results of a research study or investigation. Research papers can be written in a variety of fields, including science, social science, humanities, and business.
A research paper is unique because it has sections with varying details about a specific study topic. For example, these sections include an introduction, literature review, research methodology, results, discussion, and conclusion. In this respect, a research paper is a comprehensive document that requires students' total focus and dedication.
Writing a Results Section. The next stage of any research paper: writing the results section, announcing your findings to the world. In theory, this is the easiest part to write, because it is a straightforward commentary of exactly what you observed and found. In reality, it can be a little tricky, because it is very easy to include too much ...
The "Results section" is the third most important anatomical structure of IMRAD (Introduction, Method and Material, Result, And Discussion) frameworks, the almost universally accepted framework in many journals in the late nineteenth century. 3 Before using a structured IMRAD format, research findings in scientific papers were presented in chronological order "First, I saw this, and then ...
The APA Publication Manual is commonly used for reporting research results in the social and natural sciences. This article walks you through APA Style standards for reporting statistics in academic writing. ... To report the results of a regression analysis in the text, include the following: the R 2 value (the coefficient of determination ...
Finally, summarizing the research findings is crucial in the results section, as it provides readers with a concise summary of the study's main results and conclusions. This step should be written in a clear and straightforward manner, highlighting the most important findings and explaining their significance.
The easiest way to write a quantitative dissertation results section is to build it around a sub-question or hypothesis of your research. For each subquery, provide relevant results and include statistical analysis. Then briefly evaluate importance & reliability. Notice how each result relates to the problem or whether it supports the hypothesis.
The Results section provides the outcomes of the research process detailed in the Methods section. What Criteria to Look For. The Results section is where the authors talk about the primary data that has been collected and analyzed.Most articles will not have the complete, unanalyzed primary data, but instead have data that has already gone through some analysis for patterns, trends, and cause ...
ClinicalTrials.gov is a publicly available registry and results database of federally and privately supported clinical trials conducted in the United States and internationally.It has an extensive FAQ section ranging from general to investigation-specific. Many of these questions frequently arise at the University at Buffalo, primarily regarding either study registration or results posting.
The Problem. Although companies frequently engage in transformation initiatives, few are actually transformative. Research indicates that only 12% of major change programs produce lasting results.
ABRYSVO met its trial primary endpoints in adults aged 18 to 59 with an increased respiratory syncytial virus (RSV) disease risk. The vaccine was well-tolerated and demonstrated an immune response non-inferior to adults aged 60 years and older Pfizer intends to submit these findings to regulatory agencies to seek approval of ABRYSVO in adults 18 to 59 years of age Pfizer Inc. (NYSE: PFE) today ...
Results showed that the drug protected mouse models from similar amounts of influenza that humans experience, even at low doses. Additionally, the team found that a high drug dose could fully protect against an infection with a substantial amount of virus, which would usually be deadly. ... St. Jude Children's Research Hospital is leading the ...
Written by: Tim Brouk, [email protected] Understanding the role head and neck muscles play in eating and talking for children with cerebral palsy (CP) is a research effort led by Georgia Malandraki, professor in the Purdue University Department of Speech, Language, and Hearing Sciences, and her I-EaT Lab.The work was funded by the National Institutes of Health, the American Academy for ...
More research is needed to address the impact of harmful masculinities on sexual and reproductive health and rights (SRHR), according to a new priority research agenda drawing on a global survey of researchers that was published today in The Lancet Global Health. Harmful gender norms affect boys and men in many ways, for example by increasing risky behaviours such as substance use or ...
When the brain has trouble filtering incoming information and predicting what's likely to happen, psychosis can result, Stanford Medicine-led research shows. April 11, 2024 - By Erin Digitale People with psychosis have trouble filtering relevant information (mesh funnel) and predicting rewarding events (broken crystal ball), creating a ...
Washington Secretary of State Elections Division PO Box 40229 Olympia, WA 98504-0229 [email protected] 1 (800) 448-4881
The U.S. Environmental Protection Agency (EPA) Office of Research and Development (ORD), as part of the Science to Achieve Results (STAR) program and in collaboration with the Air, Climate, and Energy (ACE) research program, is seeking applications proposing community-engaged research in underserved communities to advance the use of air ...