
KS2, KS3 and KS4 Teaching Resources Index
Nawr ar gael yn Gymraeg! Cliciwch yma!
Diolch i Owain Jones, Catrin Jarrett, David Jones, Ffion Williams ac Alison Milton.
Warning from Owain: please check SPAG etc before use, just in case.
Blue resources are KS2 appropriate.
Green resources are IGCSE only.
Integers, Powers and Roots
Types of Numbers
Products of Prime Factors, HCF and LCM
Laws of Indices
Standard Index Form
Algebraic Proofs
Sequences, Functions and Graphs
Coordinates
nth Term, First Terms and Sequences
Arithmetic Sequences and Series
Fibonacci Sequences
Linear Graphs
Quadratic, Cubic and Reciprocal Graphs
Transformations of Graphs
Quadratic nth Term
Set Notation
Functions Including Domain and Range
Area Under Graphs
Equations of Circles and Tangents
Lines, Angles and Shapes
Types of Shapes – 2D and 3D
Types of Lines and Angles
Angles – Point, Line, Opposite, Triangle
Interior and Exterior Angles
Angles in Parallel Lines
Proving Similarity and Congruence
Properties of Circles
Circle Theorems
Data – Interpreting Results
Venn and Carroll Diagrams
Tally Charts
Averages (Mode, Median, Mean and Range)
Stem and Leaf
Scatter Graphs and Correlation
Averages from Frequency Tables
Cumulative Frequency and Box Plots
Frequency Polygons and Moving Averages
Construction and Loci
Drawing and Measuring Lines and Angles
Drawing on Isometric Paper
Plans and Elevations
Scale Drawing
Constructing Triangles
Angle and Line Bisectors
Calculations and Accuracy
Four Operations
Directed (Negative) Numbers
Order of Operations
Place Value
Money Calculations
Rounding and Estimating
Using a Calculator
Bounds (Limits of Accuracy)
Truncation and Error Intervals
Transformations
Reflection and Symmetry
Rotation and Rotational Symmetry
Translation
Enlargement
Describing Transformations
Tessellation
Simplifying and Substituting
Expanding Brackets
Factorising
Simplifying Algebraic Fractions
Ratio and Proportion
Simplifying Ratio
Dividing into a Ratio
Applied Ratio
Using the Bar Model
Pythagoras’ Theorem and Trigonometry
Pythagoras’ Theorem
SOH CAH TOA
Sine and Cosine Rules
Exact Values of Trigonometry
Trigonometry Review
Forming and Solving Equations
Function Machines
Solving Linear Equations
Worded Formulae
Rearranging Formulae
Solving Quadratic Equations
Deriving Expressions and Equations
Solving Simultaneous Equations
Area and Perimeter
Introduction to Area and Perimeter
Area and Perimeter using Formulae
Area and Circumference of Circles
Arcs and Sectors
Probability
Introduction to Probability
Frequency Trees and Systematic Listing
Two-Way Tables
Relative Frequency
Venn diagrams
Probability Trees
Volume and Surface Area
Cubes and Cuboids
Pyramids, Cones and Spheres
Fractions, Decimals and Percentages
FDP Equivalence
Percentages
Reading and Interpreting Scales
Time Calculations
Metric Unit Conversions
Compound Measures
Real Life Graphs
Similar Shapes
Inequalities
Introduction to Inequalities
Linear Inequalities
Quadratic Inequalities
Statistical Inquiry
Frequency Polygons
Frequency Polygons and Moving Averages
Petersen Capture-Recapture
Introduction to differentiation
Differentiation and graphs
Differentiation and kinematics

STPaulsMaths
Super tall paul's maths.

Revision Booklets directly from https://www.piximaths.co.uk/revision-booklets
Targeted booklets at students aiming for a grade 1, grade 3, grade 5, grade 7 and grade 9. Answers are also included.
Hopefully you find these useful.
Share this:

- Already have a WordPress.com account? Log in now.
- Subscribe Subscribed
- Copy shortlink
- Report this content
- View post in Reader
- Manage subscriptions
- Collapse this bar

Data Handling Cycle Practice Questions
Click here for questions, click here for answers, gcse revision cards.

5-a-day Workbooks
Primary Study Cards

Privacy Policy
Terms and Conditions
Corbettmaths © 2012 – 2024
Data Handling
Data handling is considered one of the most important topics in statistics as it deals with collecting sets of data, maintaining security, and the preservation of the research data. The data here is a set of numbers that help in analyzing that particular set or sets of data. Data handling can be represented visually in the form of graphs. Let us learn more about this interesting concept, the different graphs used, and solve a few examples for better understanding.
Definition of Data Handling
Data Handling is the process of gathering, recording, and presenting information in a way that is helpful to analyze, make predictions and choices. Anything that can be grouped based on certain comparable parameters can be thought of as data . Parameters mean the context in which the comparison is made between the objects. Data handling usually represent in the form of pictographs, bar graphs, pie charts, histograms , line graphs, stem and leaf plots , etc. All of them have a different purpose to serve. Have a look at the composition of the air that we have learned about in our science classes.

The constituents of air are presented with different colors in the form of parts of a pie. Do you think, a bar chart, line graph, or any other graphical representation would be able to communicate the information as effectively as this one. Definitely no. With a detailed study of each of them, you can clearly understand the purpose of each of them and use them suitably.
Types of Data
Data handling is performed depending on the types of data. Data is classified into two types, such as Quantitative Data and Qualitative Data. Quantitive data gives numerical information, while qualitative data gives descriptive information about anything. Quantitative can be either discrete or continuous data.
Important Terms in Data Handling
In data handling, there are 4 important terms or most frequently used terms that make it simple to understand the concept better. The terms are:
- Data: It is the collection of numerical figures of any kind of information
- Raw Data: The observation gathered initially is called the raw data.
- Range: It is the difference between the highest and lowest values in the data collection.
- Statistics : It deals with the collection, representation, analysis, and interpretation of numerical data.
Steps Involved in Data Handling
Following are the steps to follow in data handling:
Graphical Representation of Data Handling
Data handling can be represented in a number of graphical ways. Here is a list of various types of graphical representations of data that are very effective in data handling.
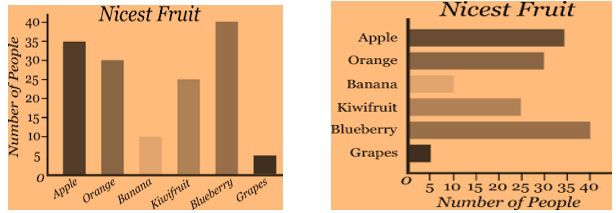
Bar graphs represent data in the form of vertical or horizontal bars showing data with rectangular bars and the heights of bars are proportional to the values that they represent. Bar graphs help in the comparison of data and this type of graph is most widely used in statistics. Look at the image below as an example.

Pictographs or Picture Graphs
Pictograph is a type of graph where information is represented in the form of pictures, icons, or symbols. It is the simplest form of representing data in statistics and data handling. Since the use of images and symbols are more in a pictograph, interpreting data is made easy along with representing a large number of data. Look at the example below for a better understanding.

Line Graphs
In data handling the data represented in the form of a line on a graph is the line graph . The graph helps in showcasing the different trends or changes in the data. The line segment plotted on the graph is constructed by connecting individual data points together. Look at the example below to understand it better.

A pie chart is data represented in a circular graph divided into smaller sectors to denote certain information. Pie charts help in showcasing the profit and loss for a business, while in school in showcasing the number depending on the data. This kind of chart is widely used in marketing sales. Look at the example below, the pie chart shows how people like the mentioned fruits from a group of 360.

Scatter Plot
Scatter plot represents the points and then the best fit line is drawn through some of the points. Any 3D data in data handling can be represented by a scatter plot. Look at the example below to understand it better.

Related Topic
Listed below are a few interesting topics related to data handling. Take a look.
- Absolute Value Graph
- Frequency Distribution Table
- Probability and Statistics
Examples on Data Handling
Example 1: Henry wants to introduce his 5-year-old daughter to data handling. Which type of graphical representation can he use for this?
As his daughter is just 5 years old, he should prefer using Pictograph to introduce data handling. In this representation, simple pictures like circles, stars are drawn to represent different data.
Example 2: How is data represented graphically?
Solution: Various types of graphs that can be used for representing data are:
- Scatter plot
- Pie chart/ Circle chart
- Picture graph
Depending on the purpose, a suitable graph can be chosen.
Example 3: Here is a review of an electronic product. Out of all the people who gave their reviews, 16 of them gave a 5-star rating to the product. Can you find out how many people provided their feedback in all?

Let the total reviews be x.
Number of people who gave 5 star = 16
Percentage of people who gave 5 star = 64%
So, number of people who gave 5 star = 64 % × x
16 = 64/100 × x
x = (16 × 64)/100
Therefore, 25 people gave reviews for the product
go to slide go to slide go to slide

Book a Free Trial Class
Practice Questions on Data Handling
go to slide go to slide
FAQs on Data Handling
What is data handling.
Data Handling is the process of gathering, recording, and presenting information in a way that is helpful to analyze, make predictions and choices. There are two types of data handling namely quantitative data and qualitative data. Data handling can be represented through various graphs.
What are the Two Types of Data Handling?
The two types of data handling are qualitative data and quantitative data. Quantitive data gives numerical information, while qualitative data gives descriptive information about anything. Quantitative can be either discrete or continuous data.
What are the Steps Involved in Data Handling?
The six steps that are involved in data handling are:
- Collection of Data
- Presentation of Data
- Graphical Representation of Data
- Analyzing the Data
What are the Types of Graphical Representations in Data Handling?
There are numerous types of graphical representation for the data that are available. Some of the most extensively used graphical representations are :
What is the Difference Between Data and Information in Data Handling?
The term data refers to the collection of certain facts that are quantitive in nature like height, number of children, etc. Information on the other hand is a form of data after being processed, arranged, and presented in a form that gives meaning to the data.
What is the Difference Between the Chart and Graph?
The difference between chart and graph can be understood from the fact that - All graphs are charts but every chart is not a graph. Charts display data in the form of a diagram, table, or graph. So, the graph is just a pictorial way of presentation of information.
- STEM Ambassadors
- School trusts
- ITE and governors
- Invest in schools
- STEM careers inspiration
- Benefits and impact
- Our supporters
- Become a STEM Ambassador
- Request a STEM Ambassador
- Employer information
- Training and support
- STEM Ambassadors Partners
- Working with community groups
- Search icon
- Join the STEM Community
- SMILE Cards/
Handling Data
This SMILE collection contains five resources of games, investigations, worksheets and practical activities supporting the teaching of handling data.
The resources cover analysing and interpreting data, collecting data, displaying data, logic and sets, and probability.
SMILE (Secondary Mathematics Individualised Learning Experiment) was initially developed as a series of practical activities for secondary school students by practising teachers in the 1970s. It became a complete individualised scheme based around a network of activity cards and assessments.
- Mathematics
- Activity sheet
- Include Physical Resources
Analysing and Interpreting Data
This SMILE resource contains two packs of games, investigations, worksheets and practical activities supporting the teaching and learning of analysing and interpreting data, from reading information from a bar chart to interpreting cumulative frequency graph.
Analysing and interpreting data pack one...
Collecting Data
This SMILE resource contains one pack of games, investigations, worksheets and practical activities supporting the teaching and learning of data collection.
Collecting data contains five work cards with activities covering how to perform a vehicle survey, how to compare hand and foot size,...
Displaying Data
This SMILE resource contains one pack of games, investigations, worksheets and practical activities supporting the teaching and learning of displaying data.
Displaying data contains fourteen work cards with a wide variety of activities covering drawing pie charts, drawing pictograms, using...
Logic and Sets
This SMILE resource contains four packs of games, investigations, worksheets and practical activities supporting the teaching and learning of logic and sets, from simple sorting activities to solving logic puzzles.
Share this resource
Did you like this resource.
If you're seeing this message, it means we're having trouble loading external resources on our website.
If you're behind a web filter, please make sure that the domains *.kastatic.org and *.kasandbox.org are unblocked.
To log in and use all the features of Khan Academy, please enable JavaScript in your browser.
Course: Class 6 > Unit 9
- Intro to data handling
- Solving problems with picture graphs

Data handling 9.1
- Your answer should be
- an integer, like 6
- an exact decimal, like 0.75
- a simplified proper fraction, like 3 / 5
- a simplified improper fraction, like 7 / 4
- a mixed number, like 1 3 / 4
Maths Sandpit
Secondary maths teaching inspiration, category archives: handling data, 342. revision jotters.
With the exams looming large, I thought I’d share how my class have been revising. To give you some context roughly a third of the class are doing Foundation GCSE, aiming for at least a Grade 4. The rest are doing Higher and aiming for a Grade 5 or better. We have three, one hour, lessons a week. I’m rotating between doing an exam paper, a whole class revision activity (eg a revision clock) and tiered revision.
I know if I tell the students to revise independently the results are going to be mixed. Some will be brilliant, some will be more laid back. To resolve this I pick a topic (or two) from each tier that I know they need to improve on from or that they have requested. It’s helpful if there is a theme to the work. I’ve recently done things like y=mx+c (F) with plotting inequalities (H).
Now the genius part: PixiMaths revision jotters
How to run the session
Photocopy a big stack of revision jotters. If you are doing black and white copying, use the b&w version. We requested the b&w version and, because PixiMaths is awesome, it is now on the website.
Clearly put on the board which topic each tier is revising
Eg Foundation: exact trig values, Higher: trig graphs
Give students 5-10 minutes to fill their revision jotters with everything they know. Have textbooks or maths dictionaries available to fill in the gaps. You may find that Higher students want to do the Foundation topic too – no problem, just make sure they have two jotters. Due to the complexity of the Higher topic, they will need more time to make initial notes.
My students are allowed headphones in revision sessions. At this point it’s headphones in for Higher and out for Foundation.
Do a skills recap on the board (exact trig values), with maybe an exam question too. Students can ask questions on the topic and add to their jotter. Then have a worksheet for students to do eg Corbett Maths or KeshMaths GCSE exam questions booklets. They can refer to their revision jotter or scan the Corbett Maths QR code for extra help.
Swap over. Headphones in for Foundation and out for Higher.
Repeat the process for Higher, with drawing trigonometric graphs. Issue an appropriate worksheet.
Once you’re done, make a judgement call. Are there students who could push it further? Maybe transform a trig graph or problem solve? Go for it. Foundation are busy, Higher are busy, spend some time stretching your most able. Every mark counts.
A huge thank you to PixiMaths for the revision jotters (and everything else).
Examples of students’ work
Shared with permission of students. You can see that they have personalised them to meet their needs and some are a work in progress. Also, the b&w jotter photocopies so nicely.
Share this:
333. resource of the week.
Just a quick resource for you today and apologies if you are already using this!
Not some new ‘youth slang’, but an amazing online tool. Students have an individual card with each side labelled A, B, C or D. You ask a multiple choice or True/False question, they hold up their card with their answer at the top, you scan the class set of cards.
It really is that simple and here is what to do to get started:
- Create a free account at www.plickers.com
- Download the app to a portable device with a camera (phone, tablet etc)
- Print out the cards
- Allocate the cards to your class on the website
- Stick the cards in your students’ books
- Set a question
- Scan the cards
I have a tablet device that I use for school purposes as I keep my phone for personal use. The only problem I had was my android tablet doesn’t have a light source or as high quality camera as my phone, but we sorted that by having students move to a brighter part of the room for scanning. Instant feedback with no handheld devices!
Finally I have to say a huge thank you to Mr L, our trainee teacher, for introducing this to the Department.
330. Still Dancing Men
You may already know about my blog posts on the ‘Dancing Man’ cipher. If not, check them out here;
34. The Dancing Cipher
97. The Dancing Cipher (part two)
Now, I have two parallel classes and I want to set the Dancing Man project as a homework, but they’ll be doing the task at different, but overlapping times. I don’t want the second class to have an unfair advantage, so I’ve written a second task. All the instructions are the same, but it’s a different text. I’m not sure whether to give each class a different text or whether to randomly assign both texts within both classes to avoid copying/generate confusion.
This text is a little more interesting than the last one … think zombies!
You can download an advanced (Beta?) copy below and I’ll update you on how it went, after I’ve done it.
Dancing Men Project 2
Letter frequency analysis project answer B
318. Election Stats
Very quick post!
If you are doing any form of data work, here is a great website to discuss bad graphs.
Skepchick Bad Election graphs
My GCSE class loved it. The image above was also a head-scratcher – how can you explain what is going on?
314. Maths is a foreign language
If I had £1 for every time I heard ‘I don’t get it!’, I could probably buy a new (modestly sized) car. That phrase is banned in my classroom. What does ‘get’ mean? What is ‘it’? Did you actually read the question?
And there we have it: reading the question.
Today’s little life skill strategy can work for all levels of literacy – because you don’t need any! I’ve taught a lot of students who just shut down when they see wordy questions and don’t look at the big picture – literally. There can be a really obvious diagram and they will skip the question. They just don’t try!
Now as you may be aware, I’m based in Wales in the UK. For those outside the UK, Wales is a principality within Great Britain. Although everyone speaks english, the traditional mother tongue is welsh – it’s particularly spoken in the North/West of the country. If you attend a welsh language school, you can do all your exams in welsh. A GCSE is called a TGAU.
But why am I telling you this?
Well, this means that the WJEC/CBAC exam board publishes their exam papers in welsh and english. Identical papers, different languages. I teach over the border in England, where only one or two students per year can speak welsh. This is where it gets interesting …
I went through a welsh language ‘Mathemateg’ paper and picked out the questions which involved diagrams – I also picked out the matching English questions so I was clear on the questions (not a native welsh speaker, just a learner). I gave my GCSE class the Welsh questions and told them to figure out what was going on. After the initial disbelief they had a really good go at the questions. Their comments included:
‘Well, it’s obvious it’s a tally chart’
This idea can be used with any bilingual exam board or any language that you speak that the students don’t. It’s a good tool for getting over ‘question blindness ‘ and literacy confidence issues too.
These are the exam papers I used:
WJEC GCSE Maths
CBAC TGAU Mathemateg
If you look at the web addresses there is one digit difference to differentiate between the languages, meaning if you go on the WJEC english language website you can find the welsh equivalent by swapping a 0 for a 5 in the second to last digit.
308. Zombie stats
I’ve used word length analysis for years as a source of comparative statistics. The concept is easy – you take a children’s book and a grown up book and compare the word lengths of the first 20, 40, 80 words. After you collect the information in a table, you can use this data to compare averages and the range.
Image credit: www.comingsoon.net But what texts to use? Well – you can’t beat a bit of Dr Seuss, but what grown up text could you use. I can highly recommend this extract from ‘Pride and Prejudice and Zombies’:
Pride and Prejudice and Zombies by Seth Grahame Smith
Not only will you be investigating mathematical concepts, but you might just be inspiring a student to pick up a book and read. Update: If you use the first chapter (say thirty words) of ‘Pride & Prejudice & Zombies’ you get some interesting data. The range is wide, but the highest frequency word length is just two. It’s a great conversation piece – why does this happen? The language is a very precise parody of 19th prose with all the correct connectives and no contractions eg ‘it is’ not ‘it’s’.
305. Get Carter
Seriously, you need to Get Carter ….
Or rather head over to the amazing website by Mr Darren Carter: MrCarterMaths.com
I don’t know where to start – in a few clicks you have access to tiered questions on a multitude of topics with answers. Answer in an exercise book or on a mini whiteboard – it’s genius! Another click and the questions change.
If that wasn’t enough, you can print out individual worksheets at each level – differentiation without a headache.
I chose to print out the three tiers and award them points. Bronze = 1 point, Silver = 2 points, Gold = 3 points. I put together a cover sheet with instructions and the students instantly had control of their homework. All I asked for was 20 points of answers. The ones who need the practise can do lots of low scoring questions, the ones who need a challenge can do fewer questions at a harder level. My task is available to download below (full credit to Mr Carter given) – It prints nicely as an A5 booklet.
Tiered Proportion Homework Booklet
Once you’ve visited the site, follow him on Twitter @MrCarterMaths
Data Handling Questions
The data handling questions and answers are provided here for students to understand the concept better. Data handling is one of the most crucial topics, which is very helpful in our studies as well as in our real life. The data handling questions given here can be used by students of any class to get a fast overview of the topics. Practise the questions, and cross-verify your answer with the explanations provided here. To know more about data handling in statistics, click here .
Go through the below-provided data handling questions and answers and practise the questions to score good marks in the examination.
Data Handling Questions with Solutions
1. What are the different types of graphical representations?
The different types of graphical representations are:
- Frequency table, and so on.
2. Is the bar graph can be drawn using vertical bars?
Yes, the bar graph can be drawn using vertical bars as well as horizontal bars.
3. The representation of data through pictures is known as _____.
Pictograph helps to represent the data through pictures.
4. The following pictograph shows the number of letters collected from a post box on each day of a particular week.
(Hint: Each letter symbol represents 10 letters)
On which day, the minimum number of letters were collected?
Given that, each letter symbol represents 10 letters.
Hence, Monday = 70 letters
Tuesday = 50 letters
Wednesday = 40 letters
Thursday = 60 letters
Friday = 80 letters
Saturday = 30 letters
Therefore, the minimum number of letters were collected on Saturday.
Also, read: Pictograph .
5. If H represents 5 hens, then how many hens does HHHH represent?
Given that, H = 5 Hens
Hence, HHHH = (5 + 5 + 5 + 5) hens
HHHH = 20 hens.
Therefore, HHHH represents 20 hens.
6. If each ⇑ symbol represents 15 houses, then ⇑⇑⇑⇑ represents how many houses?
Given that, ⇑ = 15 houses
Hence, ⇑⇑⇑⇑ = (15 + 15 + 15 + 15 ) houses
⇑⇑⇑⇑ = 60 houses.
Therefore, ⇑⇑⇑⇑ represents 60 houses.
7. The following frequency distribution table shows the marks obtained by 45 students in the English subject (out of 50 marks).
Find out which two classes have the same frequency.
From the given frequency table, two-class intervals have the same frequency (i.e., 6).
Therefore, the two-class intervals that have the same frequency are 10 – 20 and 40 – 50.
8. The bar graph shows the frequency of a, e, i, o, u in the piece of English writing.
- Which letter has occurred the maximum number of times?
- Which letter has occurred less than 30 times?
- Write down the 5 letters in the decreasing order of frequency?
From the bar graph, it is observed that,
- The letter that has occurred the maximum number of times is “a”.
- The letter that has occurred less than 30 times is “u”.
- Five letters in the decreasing order of frequency are a, e, o, i, u.
9. Look at the below-given pictograph, answer the following questions:
- Find out the number of persons employed in private service?
- In which service, the maximum number of persons were employed?
Given that, one symbol = 3000 persons.
(a) The number of persons employed in private service = 6 × 3000 = 18000 persons.
(b) The maximum number of persons were employed in government service.
I.e., 10 × 3000 = 30000 persons.
10. Draw the pie chart for the given observations, that shows the survey of different types of movies.
From the given observation, total = 20.
Now, divide each value by 20 and multiply by 100 to get the percentage.
Action – (5/20)100 = 25%
Comedy – (4/20)100 = 20%
Romance = (6/20)100 = 30%
Sci-Fi = (4/20)100 = 20%
Drama = (1/20)100 = 5%
Now, we have to find the degree of each slice (sector).
Action – (5/20)360°= 90°
Comedy – (4/20)360°= 72°
Romance = (6/20)360°=108°
Sci-Fi = (4/20)360°= 72°
Drama = (1/20)360°= 18°
Hence, the pie chart for the obtained information is:
Practice Questions
- If O represents the 20 eggs, then OOO represents how many eggs?
- The following pictograph shows the amount of money saved by Ramya in a week.
How much money did Ramya save on Wednesday?
- The daily earnings of 24 stores (in dollars) in a market was recorded as 715, 742, 650, 545, 685, 550, 700, 573, 610, 530, 680, 525, 736, 524, 585, 500, 545, 723, 532, 560, 625, 580, 645, 630. Create a frequency table taking equal class sizes.
(Note: One such class is 500-550, where 550 is not Included)
Visit BYJU’S – The Learning App, and download the app to learn all Maths concepts quickly by exploring more videos.
Leave a Comment Cancel reply
Your Mobile number and Email id will not be published. Required fields are marked *
Request OTP on Voice Call
Post My Comment
- Share Share
Register with BYJU'S & Download Free PDFs
Register with byju's & watch live videos.

Register here
In case you want to be notified about school in your locality then please register here.
- Are you a Parent or Student?
- Are you a Teacher?
- Are you a School Supplier?

- Our other Domains Olympiad Preparation Math Square Science Square English Square Cyber Square School Square Scholar Square Global Olympiads NCERT Solutions CBSE Sample Papers
- Join WhatsApp Channel
- Apply for CREST Olympiads

Data Handling

We all come across such a huge amount of data whether the marks, attendance, numbers and a lot more.
We all need to arrange these data according to our need so that in future the accessibility of the data is easy. Here we are going to learn about the handling of the data and how it has to be done.
- A data is a collection of numbers gathered to give some information .
- Data is recorded according to the requirement and then it is stored either in a tabular form or some graphical or pictorial so that in future it can be accessed and used.
- The most common and easiest way to represent and store a data is through tally marks.
- Gathering and recording information and then presenting it in a way that it is meaningful to others is called as Data Handling.
For example, when we watch a cricket match the runs scored by the batsmen, by the team, the wickets were taken by the bowler, the run rate etc are all recorded. These all are data and how the recording of data and presenting them in front of the viewers such that they are able to understand it is called as Data Handling.
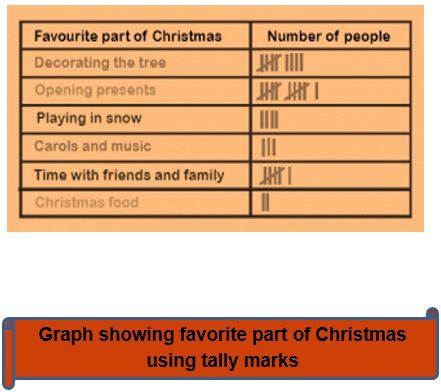
Tally Chart
- The most commonly used method of data handling is the tally graph method.
- In this method, the data is represented using the straight horizontal sticks in a group of or less, where each stick represents a data.
We all can see in the following tally chart that which is the favorite part of Christmas of how many people and here each of the tally marks shows a single person who likes that part of Christmas.
- A pictograph represents data through pictures of objects. It helps answer the questions on the data at a glance.
- Pictographs are often used by dailies and magazines to attract reader’s attention.
- In simple words, in the pictograph, we use pictures to represent the data instead of tally marks.
Example 1 : The following pictograph represents the data of the number of books sold in a week at a library. After analyzing the graph answer the following questions.
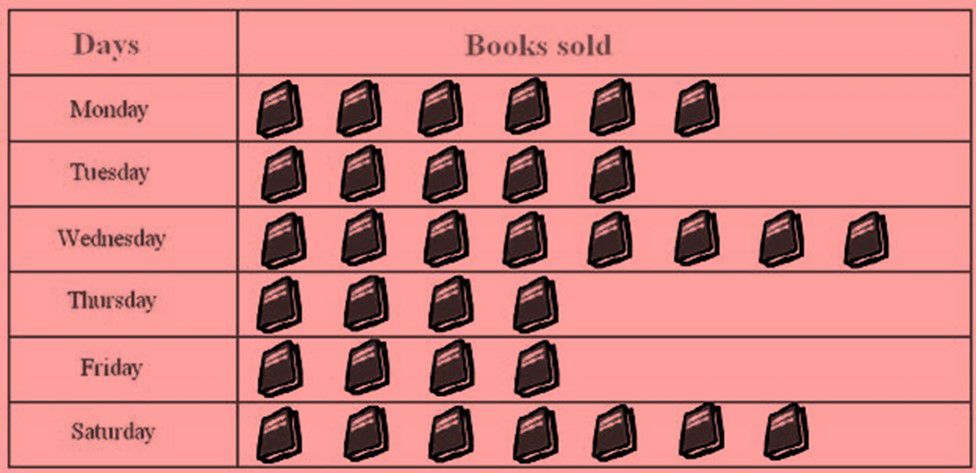
- Find the number of books sold on Saturday.
- Find the day on which the minimum and a maximum number of books are sold.
Solution : a) The number of books sold on Saturday was 7.
- b) The minimum number of books sold was on Thursday and Friday and maximum number was sold on Wednesday.
- Since representing data in the form of pictographs is really difficult and consuming hence we require a better way to represent the data in a more effective manner.
- When bars of uniform width can be drawn horizontally or vertically with equal spacing between in such a manner that the length of each bar represents the given quantity.
- Such method of representing data is called a bar diagram or a bar graph.
Example 2: The following graphs shows the numbers of students whose birthdays fall on the month of January to February. Study the graph properly and answer the following question:
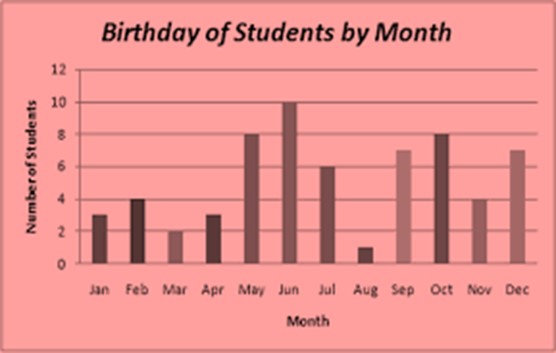
- Find the number of students who have their birthday in the month of May and August.
- Find the month on which the maximum number of students have their birthdays.
- Find the months on which the same number of students have their birthdays.
Solution : After analyzing the graph
a) 8 students have their birthdays on May and only 1 student has his birthday in August.
b) On the month of June 10 students have their birthdays.
c) On the month February and November 4 students have their birthdays.
Practice Questions
Q1) Analyze the graph and answer the following questions:
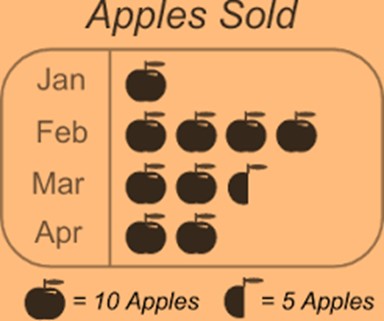
How many apples are sold in the month of February?
b) In which month maximum and in which the minimum number of apples were sold?
Q2) Analyze the graph and answer the following questions:
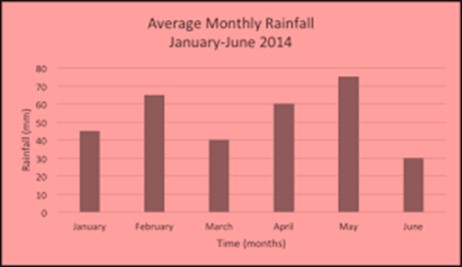
a) In which month maximum rainfall took place?
b) In which month minimum rainfall took place?
Recap
- A data is a collection of numbers gathered to give some information.
- The graphical representation of data in vertical as well as horizontal bars is known as a bar graph.
Quiz for Data Handling
Your Score: 0 /10
Other Chapters of Class 6

Quick Links

SchoolPlus Program
Yearlong program for Olympiads preparation & to build necessary skills for future.

Olympiad Exam Dates
Time to mark your calendar with the upcoming Olympiads exam schedule.

LIVE Classes for Olympiads
Take your Olympiad preparation to next-level by taking LIVE Classes.

Olympiad Test Series
Assess your performance by taking topic-wise and full length mock tests.

India’s First Summer Olympiads
Know your true potential by participating in Unicus Olympiads for classes 1-11.
Asia’s Biggest Winter Olympiads
Give wings to your innovation by appearing in CREST Olympiads for Prep/KG to classes 1-10.
- International
- Schools directory
- Resources Jobs Schools directory News Search

GCSE Maths Revision Questions on Data Handling - One Question Per Topic
Subject: Mathematics
Age range: 14-16
Resource type: Assessment and revision
Last updated
- Share through email
- Share through twitter
- Share through linkedin
- Share through facebook
- Share through pinterest

Answers included too.
Creative Commons "Sharealike"
Your rating is required to reflect your happiness.
It's good to leave some feedback.
Something went wrong, please try again later.
Fireball12fddf
Empty reply does not make any sense for the end user
Thanks for sharing
Thank you so much - very, very helpful.
soniahenae25
Just got Yhe questions about statistics :one question pertopic handling data but Can't find answers .Pls send me link for answers
Really helpful for yr 11 revision
Report this resource to let us know if it violates our terms and conditions. Our customer service team will review your report and will be in touch.
Not quite what you were looking for? Search by keyword to find the right resource:

IMAGES
VIDEO
COMMENTS
The PixiMaths problem solving booklets are aimed at "crossover" marks (questions that will be on both higher and foundation) so will be accessed by most students. The booklets are collated Edexcel exam questions; you may well recognise them from elsewhere. Each booklet has 70 marks worth of questions and will probably last two lessons ...
Problem Solving. Functional Maths. Mixed Attainment Maths. Homework Ideas. Student Assessment Sheets ... More. Data Cycle. The first lesson covers different types of data (qualitative vs quantitative, discrete vs continuous, primary vs secondary) and the second lesson looks at the data collection cycle. KS2 - KS4 Teaching Resources Index ...
Shape, Space and Measure Revision Mat (F) Number Revision Mat (F) Algebra Revision Mat (F) Ratio and Proportion Revision Mat (F) Probability Revision Mat (F) Data Handling Revision Mat (F) FOUNDATION Revision Mat Answer Pack. These HIGHER revision mats are aimed at students looking to practise key skills at grades 5/6/7. Algebra Revision Mat (H)
A walk-through of the Data Handling revision mat published by https://www.piximaths.co.uk/revision-matsHistograms: 00:23Capture/Recapture: 03:56Scatter Graph...
Data - Interpreting Results - Medium Term Plan. Download the medium term plan by clicking on the button above. Use the MTP in conjunction with assessment results and gap analyses to download required resources from below. Use the "Contact PixiMaths" page to request any resources you can't find. Venn and Carroll Diagrams - Sorting.
Forming and Solving Equations. Area and Perimeter. Probability. Volume and Surface Area. Fractions, Decimals and Percentages. Measures. Inequalities. Statistical Inquiry. Use these APP-style grids to help your students assess their own learning.
Problem Solving. Functional Maths. Mixed Attainment Maths. ... Guestbook. About PixiMaths. Consultancy. Newsletter Archive. Department Documents. Store. Blog. Aiming for... revision booklets. More. KS2, KS3 and KS4 Teaching Resources Index. Nawr ar gael yn Gymraeg! ... Data - Interpreting Results. Venn and Carroll Diagrams. Tally Charts.
We requested the b&w version and, because PixiMaths is awesome, it is now on the website. Clearly put on the board which topic each tier is revising. Eg Foundation: exact trig values, Higher: trig graphs. Give students 5-10 minutes to fill their revision jotters with everything they know. Have textbooks or maths dictionaries available to fill ...
PixiMaths Problem Solving starter packs converted into PowerPoint form (with answers included). A "record sheet" is included on the last slide which you can edit for your department.
Revision Booklets directly from Targeted booklets at students aiming for a grade 1, grade 3, grade 5, grade 7 and grade 9. Answers are also included. Hopefully you find these useful. Aiming …
Click here for Answers. . Practice Questions. Previous: Distance Between Two Points Practice Questions. Next: Adding/Subtracting Decimals Practice Questions. The Corbettmaths Practice Questions on the Data Cycle.
Following are the steps to follow in data handling: Steps. Details. Purpose. The problem or purpose is identified and well defined. Collection of Data. Data relevant to the purpose is collected. Presentation of Data. The collected data is to be presented in a form that is meaningful and easy to understand.
Then have a worksheet for students to do eg Corbett Maths or KeshMaths GCSE exam questions booklets. They can refer to their revision jotter or scan the Corbett Maths QR code for extra help. Swap over. Headphones in for Foundation and out for Higher. Repeat the process for Higher, with drawing trigonometric graphs.
A walk-through of the Data Handling revision mat published by https://www.piximaths.co.uk/revision-matsAverages: 00:21Frequency Polygons: 05:13Stem and Leaf ...
PixiMaths · April 19, 2017 · · April 19, 2017 ·
The resources cover analysing and interpreting data, collecting data, displaying data, logic and sets, and probability. SMILE (Secondary Mathematics Individualised Learning Experiment) was initially developed as a series of practical activities for secondary school students by practising teachers in the 1970s.
Data handling 9.1. Google Classroom. Problem. Arnav graphed the number of bananas sold at different stores. Fill in the blank. Fruit Zone sold. Your answer should be. an integer, like 6. an exactdecimal, like 0.75.
Category Archives: Handling Data. 342. Revision jotters. With the exams looming large, I thought I'd share how my class have been revising. To give you some context roughly a third of the class are doing Foundation GCSE, aiming for at least a Grade 4. The rest are doing Higher and aiming for a Grade 5 or better.
Note that if some division by zero occurs and the rescale result option is selected, the resulting image will probably be unusable, since the available dynamic range will first be extended to +/-3.4×10 +38 in order to keep all of the existing data, then pixel values will be rescaled to the specified range, and finally to the normalized [0,1 ...
Data Handling Definition: Data handling is the process of collecting, documenting, and presenting data in a way that makes it easier to analyse, predict, and make decisions. Data can be everything that may be grouped together based on a set of comparable parameters. Pictographs, bar graphs, pie charts, histograms, line graphs, stem and leaf plots, and other data visualisation techniques are ...
Example 1: The following pictograph represents the data of the number of books sold in a week at a library. After analyzing the graph answer the following questions. Find the number of books sold on Saturday. Find the day on which the minimum and a maximum number of books are sold. Solution: a) The number of books sold on Saturday was 7.
GCSE Maths Revision Questions on Data Handling - One Question Per Topic. Subject: Mathematics. Age range: 14-16. Resource type: Assessment and revision. File previews. rtf, 42.02 MB. Answers included too. Creative Commons "Sharealike". See more.
Flexible job shop scheduling problem (FJSP), widely prevalent in many intelligent manufacturing industries, is one of the most classic problems of production scheduling and combinatorial optimization. In actual manufacturing enterprises, the setup of machines and the handling of jobs have an important impact on the scheduling plan. Furthermore, there is a trend for a cluster of machines with ...