
How To Write The Results/Findings Chapter
For quantitative studies (dissertations & theses).
By: Derek Jansen (MBA) | Expert Reviewed By: Kerryn Warren (PhD) | July 2021
So, you’ve completed your quantitative data analysis and it’s time to report on your findings. But where do you start? In this post, we’ll walk you through the results chapter (also called the findings or analysis chapter), step by step, so that you can craft this section of your dissertation or thesis with confidence. If you’re looking for information regarding the results chapter for qualitative studies, you can find that here .
Overview: Quantitative Results Chapter
- What exactly the results chapter is
- What you need to include in your chapter
- How to structure the chapter
- Tips and tricks for writing a top-notch chapter
- Free results chapter template
What exactly is the results chapter?
The results chapter (also referred to as the findings or analysis chapter) is one of the most important chapters of your dissertation or thesis because it shows the reader what you’ve found in terms of the quantitative data you’ve collected. It presents the data using a clear text narrative, supported by tables, graphs and charts. In doing so, it also highlights any potential issues (such as outliers or unusual findings) you’ve come across.
But how’s that different from the discussion chapter?
Well, in the results chapter, you only present your statistical findings. Only the numbers, so to speak – no more, no less. Contrasted to this, in the discussion chapter , you interpret your findings and link them to prior research (i.e. your literature review), as well as your research objectives and research questions . In other words, the results chapter presents and describes the data, while the discussion chapter interprets the data.
Let’s look at an example.
In your results chapter, you may have a plot that shows how respondents to a survey responded: the numbers of respondents per category, for instance. You may also state whether this supports a hypothesis by using a p-value from a statistical test. But it is only in the discussion chapter where you will say why this is relevant or how it compares with the literature or the broader picture. So, in your results chapter, make sure that you don’t present anything other than the hard facts – this is not the place for subjectivity.
It’s worth mentioning that some universities prefer you to combine the results and discussion chapters. Even so, it is good practice to separate the results and discussion elements within the chapter, as this ensures your findings are fully described. Typically, though, the results and discussion chapters are split up in quantitative studies. If you’re unsure, chat with your research supervisor or chair to find out what their preference is.

What should you include in the results chapter?
Following your analysis, it’s likely you’ll have far more data than are necessary to include in your chapter. In all likelihood, you’ll have a mountain of SPSS or R output data, and it’s your job to decide what’s most relevant. You’ll need to cut through the noise and focus on the data that matters.
This doesn’t mean that those analyses were a waste of time – on the contrary, those analyses ensure that you have a good understanding of your dataset and how to interpret it. However, that doesn’t mean your reader or examiner needs to see the 165 histograms you created! Relevance is key.
How do I decide what’s relevant?
At this point, it can be difficult to strike a balance between what is and isn’t important. But the most important thing is to ensure your results reflect and align with the purpose of your study . So, you need to revisit your research aims, objectives and research questions and use these as a litmus test for relevance. Make sure that you refer back to these constantly when writing up your chapter so that you stay on track.

As a general guide, your results chapter will typically include the following:
- Some demographic data about your sample
- Reliability tests (if you used measurement scales)
- Descriptive statistics
- Inferential statistics (if your research objectives and questions require these)
- Hypothesis tests (again, if your research objectives and questions require these)
We’ll discuss each of these points in more detail in the next section.
Importantly, your results chapter needs to lay the foundation for your discussion chapter . This means that, in your results chapter, you need to include all the data that you will use as the basis for your interpretation in the discussion chapter.
For example, if you plan to highlight the strong relationship between Variable X and Variable Y in your discussion chapter, you need to present the respective analysis in your results chapter – perhaps a correlation or regression analysis.
Need a helping hand?
How do I write the results chapter?
There are multiple steps involved in writing up the results chapter for your quantitative research. The exact number of steps applicable to you will vary from study to study and will depend on the nature of the research aims, objectives and research questions . However, we’ll outline the generic steps below.
Step 1 – Revisit your research questions
The first step in writing your results chapter is to revisit your research objectives and research questions . These will be (or at least, should be!) the driving force behind your results and discussion chapters, so you need to review them and then ask yourself which statistical analyses and tests (from your mountain of data) would specifically help you address these . For each research objective and research question, list the specific piece (or pieces) of analysis that address it.
At this stage, it’s also useful to think about the key points that you want to raise in your discussion chapter and note these down so that you have a clear reminder of which data points and analyses you want to highlight in the results chapter. Again, list your points and then list the specific piece of analysis that addresses each point.
Next, you should draw up a rough outline of how you plan to structure your chapter . Which analyses and statistical tests will you present and in what order? We’ll discuss the “standard structure” in more detail later, but it’s worth mentioning now that it’s always useful to draw up a rough outline before you start writing (this advice applies to any chapter).
Step 2 – Craft an overview introduction
As with all chapters in your dissertation or thesis, you should start your quantitative results chapter by providing a brief overview of what you’ll do in the chapter and why . For example, you’d explain that you will start by presenting demographic data to understand the representativeness of the sample, before moving onto X, Y and Z.
This section shouldn’t be lengthy – a paragraph or two maximum. Also, it’s a good idea to weave the research questions into this section so that there’s a golden thread that runs through the document.

Step 3 – Present the sample demographic data
The first set of data that you’ll present is an overview of the sample demographics – in other words, the demographics of your respondents.
For example:
- What age range are they?
- How is gender distributed?
- How is ethnicity distributed?
- What areas do the participants live in?
The purpose of this is to assess how representative the sample is of the broader population. This is important for the sake of the generalisability of the results. If your sample is not representative of the population, you will not be able to generalise your findings. This is not necessarily the end of the world, but it is a limitation you’ll need to acknowledge.
Of course, to make this representativeness assessment, you’ll need to have a clear view of the demographics of the population. So, make sure that you design your survey to capture the correct demographic information that you will compare your sample to.
But what if I’m not interested in generalisability?
Well, even if your purpose is not necessarily to extrapolate your findings to the broader population, understanding your sample will allow you to interpret your findings appropriately, considering who responded. In other words, it will help you contextualise your findings . For example, if 80% of your sample was aged over 65, this may be a significant contextual factor to consider when interpreting the data. Therefore, it’s important to understand and present the demographic data.
Step 4 – Review composite measures and the data “shape”.
Before you undertake any statistical analysis, you’ll need to do some checks to ensure that your data are suitable for the analysis methods and techniques you plan to use. If you try to analyse data that doesn’t meet the assumptions of a specific statistical technique, your results will be largely meaningless. Therefore, you may need to show that the methods and techniques you’ll use are “allowed”.
Most commonly, there are two areas you need to pay attention to:
#1: Composite measures
The first is when you have multiple scale-based measures that combine to capture one construct – this is called a composite measure . For example, you may have four Likert scale-based measures that (should) all measure the same thing, but in different ways. In other words, in a survey, these four scales should all receive similar ratings. This is called “ internal consistency ”.
Internal consistency is not guaranteed though (especially if you developed the measures yourself), so you need to assess the reliability of each composite measure using a test. Typically, Cronbach’s Alpha is a common test used to assess internal consistency – i.e., to show that the items you’re combining are more or less saying the same thing. A high alpha score means that your measure is internally consistent. A low alpha score means you may need to consider scrapping one or more of the measures.
#2: Data shape
The second matter that you should address early on in your results chapter is data shape. In other words, you need to assess whether the data in your set are symmetrical (i.e. normally distributed) or not, as this will directly impact what type of analyses you can use. For many common inferential tests such as T-tests or ANOVAs (we’ll discuss these a bit later), your data needs to be normally distributed. If it’s not, you’ll need to adjust your strategy and use alternative tests.
To assess the shape of the data, you’ll usually assess a variety of descriptive statistics (such as the mean, median and skewness), which is what we’ll look at next.

Step 5 – Present the descriptive statistics
Now that you’ve laid the foundation by discussing the representativeness of your sample, as well as the reliability of your measures and the shape of your data, you can get started with the actual statistical analysis. The first step is to present the descriptive statistics for your variables.
For scaled data, this usually includes statistics such as:
- The mean – this is simply the mathematical average of a range of numbers.
- The median – this is the midpoint in a range of numbers when the numbers are arranged in order.
- The mode – this is the most commonly repeated number in the data set.
- Standard deviation – this metric indicates how dispersed a range of numbers is. In other words, how close all the numbers are to the mean (the average).
- Skewness – this indicates how symmetrical a range of numbers is. In other words, do they tend to cluster into a smooth bell curve shape in the middle of the graph (this is called a normal or parametric distribution), or do they lean to the left or right (this is called a non-normal or non-parametric distribution).
- Kurtosis – this metric indicates whether the data are heavily or lightly-tailed, relative to the normal distribution. In other words, how peaked or flat the distribution is.
A large table that indicates all the above for multiple variables can be a very effective way to present your data economically. You can also use colour coding to help make the data more easily digestible.
For categorical data, where you show the percentage of people who chose or fit into a category, for instance, you can either just plain describe the percentages or numbers of people who responded to something or use graphs and charts (such as bar graphs and pie charts) to present your data in this section of the chapter.
When using figures, make sure that you label them simply and clearly , so that your reader can easily understand them. There’s nothing more frustrating than a graph that’s missing axis labels! Keep in mind that although you’ll be presenting charts and graphs, your text content needs to present a clear narrative that can stand on its own. In other words, don’t rely purely on your figures and tables to convey your key points: highlight the crucial trends and values in the text. Figures and tables should complement the writing, not carry it .
Depending on your research aims, objectives and research questions, you may stop your analysis at this point (i.e. descriptive statistics). However, if your study requires inferential statistics, then it’s time to deep dive into those .

Step 6 – Present the inferential statistics
Inferential statistics are used to make generalisations about a population , whereas descriptive statistics focus purely on the sample . Inferential statistical techniques, broadly speaking, can be broken down into two groups .
First, there are those that compare measurements between groups , such as t-tests (which measure differences between two groups) and ANOVAs (which measure differences between multiple groups). Second, there are techniques that assess the relationships between variables , such as correlation analysis and regression analysis. Within each of these, some tests can be used for normally distributed (parametric) data and some tests are designed specifically for use on non-parametric data.
There are a seemingly endless number of tests that you can use to crunch your data, so it’s easy to run down a rabbit hole and end up with piles of test data. Ultimately, the most important thing is to make sure that you adopt the tests and techniques that allow you to achieve your research objectives and answer your research questions .
In this section of the results chapter, you should try to make use of figures and visual components as effectively as possible. For example, if you present a correlation table, use colour coding to highlight the significance of the correlation values, or scatterplots to visually demonstrate what the trend is. The easier you make it for your reader to digest your findings, the more effectively you’ll be able to make your arguments in the next chapter.

Step 7 – Test your hypotheses
If your study requires it, the next stage is hypothesis testing. A hypothesis is a statement , often indicating a difference between groups or relationship between variables, that can be supported or rejected by a statistical test. However, not all studies will involve hypotheses (again, it depends on the research objectives), so don’t feel like you “must” present and test hypotheses just because you’re undertaking quantitative research.
The basic process for hypothesis testing is as follows:
- Specify your null hypothesis (for example, “The chemical psilocybin has no effect on time perception).
- Specify your alternative hypothesis (e.g., “The chemical psilocybin has an effect on time perception)
- Set your significance level (this is usually 0.05)
- Calculate your statistics and find your p-value (e.g., p=0.01)
- Draw your conclusions (e.g., “The chemical psilocybin does have an effect on time perception”)
Finally, if the aim of your study is to develop and test a conceptual framework , this is the time to present it, following the testing of your hypotheses. While you don’t need to develop or discuss these findings further in the results chapter, indicating whether the tests (and their p-values) support or reject the hypotheses is crucial.
Step 8 – Provide a chapter summary
To wrap up your results chapter and transition to the discussion chapter, you should provide a brief summary of the key findings . “Brief” is the keyword here – much like the chapter introduction, this shouldn’t be lengthy – a paragraph or two maximum. Highlight the findings most relevant to your research objectives and research questions, and wrap it up.
Some final thoughts, tips and tricks
Now that you’ve got the essentials down, here are a few tips and tricks to make your quantitative results chapter shine:
- When writing your results chapter, report your findings in the past tense . You’re talking about what you’ve found in your data, not what you are currently looking for or trying to find.
- Structure your results chapter systematically and sequentially . If you had two experiments where findings from the one generated inputs into the other, report on them in order.
- Make your own tables and graphs rather than copying and pasting them from statistical analysis programmes like SPSS. Check out the DataIsBeautiful reddit for some inspiration.
- Once you’re done writing, review your work to make sure that you have provided enough information to answer your research questions , but also that you didn’t include superfluous information.
If you’ve got any questions about writing up the quantitative results chapter, please leave a comment below. If you’d like 1-on-1 assistance with your quantitative analysis and discussion, check out our hands-on coaching service , or book a free consultation with a friendly coach.

Psst... there’s more!
This post was based on one of our popular Research Bootcamps . If you're working on a research project, you'll definitely want to check this out ...
You Might Also Like:
")
Thank you. I will try my best to write my results.

Awesome content 👏🏾

this was great explaination
Submit a Comment Cancel reply
Your email address will not be published. Required fields are marked *
Save my name, email, and website in this browser for the next time I comment.
- Print Friendly
11 Tips For Writing a Dissertation Data Analysis
Since the evolution of the fourth industrial revolution – the Digital World; lots of data have surrounded us. There are terabytes of data around us or in data centers that need to be processed and used. The data needs to be appropriately analyzed to process it, and Dissertation data analysis forms its basis. If data analysis is valid and free from errors, the research outcomes will be reliable and lead to a successful dissertation.
Considering the complexity of many data analysis projects, it becomes challenging to get precise results if analysts are not familiar with data analysis tools and tests properly. The analysis is a time-taking process that starts with collecting valid and relevant data and ends with the demonstration of error-free results.
So, in today’s topic, we will cover the need to analyze data, dissertation data analysis, and mainly the tips for writing an outstanding data analysis dissertation. If you are a doctoral student and plan to perform dissertation data analysis on your data, make sure that you give this article a thorough read for the best tips!
What is Data Analysis in Dissertation?
Dissertation Data Analysis is the process of understanding, gathering, compiling, and processing a large amount of data. Then identifying common patterns in responses and critically examining facts and figures to find the rationale behind those outcomes.
Even f you have the data collected and compiled in the form of facts and figures, it is not enough for proving your research outcomes. There is still a need to apply dissertation data analysis on your data; to use it in the dissertation. It provides scientific support to the thesis and conclusion of the research.
Data Analysis Tools
There are plenty of indicative tests used to analyze data and infer relevant results for the discussion part. Following are some tests used to perform analysis of data leading to a scientific conclusion:
11 Most Useful Tips for Dissertation Data Analysis
Doctoral students need to perform dissertation data analysis and then dissertation to receive their degree. Many Ph.D. students find it hard to do dissertation data analysis because they are not trained in it.
1. Dissertation Data Analysis Services
The first tip applies to those students who can afford to look for help with their dissertation data analysis work. It’s a viable option, and it can help with time management and with building the other elements of the dissertation with much detail.
Dissertation Analysis services are professional services that help doctoral students with all the basics of their dissertation work, from planning, research and clarification, methodology, dissertation data analysis and review, literature review, and final powerpoint presentation.
One great reference for dissertation data analysis professional services is Statistics Solutions , they’ve been around for over 22 years helping students succeed in their dissertation work. You can find the link to their website here .
For a proper dissertation data analysis, the student should have a clear understanding and statistical knowledge. Through this knowledge and experience, a student can perform dissertation analysis on their own.
Following are some helpful tips for writing a splendid dissertation data analysis:
2. Relevance of Collected Data
If the data is irrelevant and not appropriate, you might get distracted from the point of focus. To show the reader that you can critically solve the problem, make sure that you write a theoretical proposition regarding the selection and analysis of data.
3. Data Analysis
For analysis, it is crucial to use such methods that fit best with the types of data collected and the research objectives. Elaborate on these methods and the ones that justify your data collection methods thoroughly. Make sure to make the reader believe that you did not choose your method randomly. Instead, you arrived at it after critical analysis and prolonged research.
On the other hand, quantitative analysis refers to the analysis and interpretation of facts and figures – to build reasoning behind the advent of primary findings. An assessment of the main results and the literature review plays a pivotal role in qualitative and quantitative analysis.
The overall objective of data analysis is to detect patterns and inclinations in data and then present the outcomes implicitly. It helps in providing a solid foundation for critical conclusions and assisting the researcher to complete the dissertation proposal.
4. Qualitative Data Analysis
Qualitative data refers to data that does not involve numbers. You are required to carry out an analysis of the data collected through experiments, focus groups, and interviews. This can be a time-taking process because it requires iterative examination and sometimes demanding the application of hermeneutics. Note that using qualitative technique doesn’t only mean generating good outcomes but to unveil more profound knowledge that can be transferrable.
Presenting qualitative data analysis in a dissertation can also be a challenging task. It contains longer and more detailed responses. Placing such comprehensive data coherently in one chapter of the dissertation can be difficult due to two reasons. Firstly, we cannot figure out clearly which data to include and which one to exclude. Secondly, unlike quantitative data, it becomes problematic to present data in figures and tables. Making information condensed into a visual representation is not possible. As a writer, it is of essence to address both of these challenges.
Qualitative Data Analysis Methods
Following are the methods used to perform quantitative data analysis.
- Deductive Method
This method involves analyzing qualitative data based on an argument that a researcher already defines. It’s a comparatively easy approach to analyze data. It is suitable for the researcher with a fair idea about the responses they are likely to receive from the questionnaires.
- Inductive Method
In this method, the researcher analyzes the data not based on any predefined rules. It is a time-taking process used by students who have very little knowledge of the research phenomenon.
5. Quantitative Data Analysis
Quantitative data contains facts and figures obtained from scientific research and requires extensive statistical analysis. After collection and analysis, you will be able to conclude. Generic outcomes can be accepted beyond the sample by assuming that it is representative – one of the preliminary checkpoints to carry out in your analysis to a larger group. This method is also referred to as the “scientific method”, gaining its roots from natural sciences.
The Presentation of quantitative data depends on the domain to which it is being presented. It is beneficial to consider your audience while writing your findings. Quantitative data for hard sciences might require numeric inputs and statistics. As for natural sciences , such comprehensive analysis is not required.
Quantitative Analysis Methods
Following are some of the methods used to perform quantitative data analysis.
- Trend analysis: This corresponds to a statistical analysis approach to look at the trend of quantitative data collected over a considerable period.
- Cross-tabulation: This method uses a tabula way to draw readings among data sets in research.
- Conjoint analysis : Quantitative data analysis method that can collect and analyze advanced measures. These measures provide a thorough vision about purchasing decisions and the most importantly, marked parameters.
- TURF analysis: This approach assesses the total market reach of a service or product or a mix of both.
- Gap analysis: It utilizes the side-by-side matrix to portray quantitative data, which captures the difference between the actual and expected performance.
- Text analysis: In this method, innovative tools enumerate open-ended data into easily understandable data.
6. Data Presentation Tools
Since large volumes of data need to be represented, it becomes a difficult task to present such an amount of data in coherent ways. To resolve this issue, consider all the available choices you have, such as tables, charts, diagrams, and graphs.
Tables help in presenting both qualitative and quantitative data concisely. While presenting data, always keep your reader in mind. Anything clear to you may not be apparent to your reader. So, constantly rethink whether your data presentation method is understandable to someone less conversant with your research and findings. If the answer is “No”, you may need to rethink your Presentation.
7. Include Appendix or Addendum
After presenting a large amount of data, your dissertation analysis part might get messy and look disorganized. Also, you would not be cutting down or excluding the data you spent days and months collecting. To avoid this, you should include an appendix part.
The data you find hard to arrange within the text, include that in the appendix part of a dissertation . And place questionnaires, copies of focus groups and interviews, and data sheets in the appendix. On the other hand, one must put the statistical analysis and sayings quoted by interviewees within the dissertation.
8. Thoroughness of Data
It is a common misconception that the data presented is self-explanatory. Most of the students provide the data and quotes and think that it is enough and explaining everything. It is not sufficient. Rather than just quoting everything, you should analyze and identify which data you will use to approve or disapprove your standpoints.
Thoroughly demonstrate the ideas and critically analyze each perspective taking care of the points where errors can occur. Always make sure to discuss the anomalies and strengths of your data to add credibility to your research.
9. Discussing Data
Discussion of data involves elaborating the dimensions to classify patterns, themes, and trends in presented data. In addition, to balancing, also take theoretical interpretations into account. Discuss the reliability of your data by assessing their effect and significance. Do not hide the anomalies. While using interviews to discuss the data, make sure you use relevant quotes to develop a strong rationale.
It also involves answering what you are trying to do with the data and how you have structured your findings. Once you have presented the results, the reader will be looking for interpretation. Hence, it is essential to deliver the understanding as soon as you have submitted your data.
10. Findings and Results
Findings refer to the facts derived after the analysis of collected data. These outcomes should be stated; clearly, their statements should tightly support your objective and provide logical reasoning and scientific backing to your point. This part comprises of majority part of the dissertation.
In the finding part, you should tell the reader what they are looking for. There should be no suspense for the reader as it would divert their attention. State your findings clearly and concisely so that they can get the idea of what is more to come in your dissertation.
11. Connection with Literature Review
At the ending of your data analysis in the dissertation, make sure to compare your data with other published research. In this way, you can identify the points of differences and agreements. Check the consistency of your findings if they meet your expectations—lookup for bottleneck position. Analyze and discuss the reasons behind it. Identify the key themes, gaps, and the relation of your findings with the literature review. In short, you should link your data with your research question, and the questions should form a basis for literature.
The Role of Data Analytics at The Senior Management Level

From small and medium-sized businesses to Fortune 500 conglomerates, the success of a modern business is now increasingly tied to how the company implements its data infrastructure and data-based decision-making. According
The Decision-Making Model Explained (In Plain Terms)

Any form of the systematic decision-making process is better enhanced with data. But making sense of big data or even small data analysis when venturing into a decision-making process might
13 Reasons Why Data Is Important in Decision Making

Wrapping Up
Writing data analysis in the dissertation involves dedication, and its implementations demand sound knowledge and proper planning. Choosing your topic, gathering relevant data, analyzing it, presenting your data and findings correctly, discussing the results, connecting with the literature and conclusions are milestones in it. Among these checkpoints, the Data analysis stage is most important and requires a lot of keenness.
In this article, we thoroughly looked at the tips that prove valuable for writing a data analysis in a dissertation. Make sure to give this article a thorough read before you write data analysis in the dissertation leading to the successful future of your research.
Oxbridge Essays. Top 10 Tips for Writing a Dissertation Data Analysis.
Emidio Amadebai
As an IT Engineer, who is passionate about learning and sharing. I have worked and learned quite a bit from Data Engineers, Data Analysts, Business Analysts, and Key Decision Makers almost for the past 5 years. Interested in learning more about Data Science and How to leverage it for better decision-making in my business and hopefully help you do the same in yours.
Recent Posts
Causal vs Evidential Decision-making (How to Make Businesses More Effective)
In today’s fast-paced business landscape, it is crucial to make informed decisions to stay in the competition which makes it important to understand the concept of the different characteristics and...
Bootstrapping vs. Boosting
Over the past decade, the field of machine learning has witnessed remarkable advancements in predictive techniques and ensemble learning methods. Ensemble techniques are very popular in machine...

Have a language expert improve your writing
Run a free plagiarism check in 10 minutes, automatically generate references for free.
- Knowledge Base
- Dissertation
- What Is a Research Methodology? | Steps & Tips
What Is a Research Methodology? | Steps & Tips
Published on 25 February 2019 by Shona McCombes . Revised on 10 October 2022.
Your research methodology discusses and explains the data collection and analysis methods you used in your research. A key part of your thesis, dissertation, or research paper, the methodology chapter explains what you did and how you did it, allowing readers to evaluate the reliability and validity of your research.
It should include:
- The type of research you conducted
- How you collected and analysed your data
- Any tools or materials you used in the research
- Why you chose these methods
- Your methodology section should generally be written in the past tense .
- Academic style guides in your field may provide detailed guidelines on what to include for different types of studies.
- Your citation style might provide guidelines for your methodology section (e.g., an APA Style methods section ).
Instantly correct all language mistakes in your text
Be assured that you'll submit flawless writing. Upload your document to correct all your mistakes.

Table of contents
How to write a research methodology, why is a methods section important, step 1: explain your methodological approach, step 2: describe your data collection methods, step 3: describe your analysis method, step 4: evaluate and justify the methodological choices you made, tips for writing a strong methodology chapter, frequently asked questions about methodology.
The only proofreading tool specialized in correcting academic writing
The academic proofreading tool has been trained on 1000s of academic texts and by native English editors. Making it the most accurate and reliable proofreading tool for students.

Correct my document today
Your methods section is your opportunity to share how you conducted your research and why you chose the methods you chose. It’s also the place to show that your research was rigorously conducted and can be replicated .
It gives your research legitimacy and situates it within your field, and also gives your readers a place to refer to if they have any questions or critiques in other sections.
You can start by introducing your overall approach to your research. You have two options here.
Option 1: Start with your “what”
What research problem or question did you investigate?
- Aim to describe the characteristics of something?
- Explore an under-researched topic?
- Establish a causal relationship?
And what type of data did you need to achieve this aim?
- Quantitative data , qualitative data , or a mix of both?
- Primary data collected yourself, or secondary data collected by someone else?
- Experimental data gathered by controlling and manipulating variables, or descriptive data gathered via observations?
Option 2: Start with your “why”
Depending on your discipline, you can also start with a discussion of the rationale and assumptions underpinning your methodology. In other words, why did you choose these methods for your study?
- Why is this the best way to answer your research question?
- Is this a standard methodology in your field, or does it require justification?
- Were there any ethical considerations involved in your choices?
- What are the criteria for validity and reliability in this type of research ?
Once you have introduced your reader to your methodological approach, you should share full details about your data collection methods .
Quantitative methods
In order to be considered generalisable, you should describe quantitative research methods in enough detail for another researcher to replicate your study.
Here, explain how you operationalised your concepts and measured your variables. Discuss your sampling method or inclusion/exclusion criteria, as well as any tools, procedures, and materials you used to gather your data.
Surveys Describe where, when, and how the survey was conducted.
- How did you design the questionnaire?
- What form did your questions take (e.g., multiple choice, Likert scale )?
- Were your surveys conducted in-person or virtually?
- What sampling method did you use to select participants?
- What was your sample size and response rate?
Experiments Share full details of the tools, techniques, and procedures you used to conduct your experiment.
- How did you design the experiment ?
- How did you recruit participants?
- How did you manipulate and measure the variables ?
- What tools did you use?
Existing data Explain how you gathered and selected the material (such as datasets or archival data) that you used in your analysis.
- Where did you source the material?
- How was the data originally produced?
- What criteria did you use to select material (e.g., date range)?
The survey consisted of 5 multiple-choice questions and 10 questions measured on a 7-point Likert scale.
The goal was to collect survey responses from 350 customers visiting the fitness apparel company’s brick-and-mortar location in Boston on 4–8 July 2022, between 11:00 and 15:00.
Here, a customer was defined as a person who had purchased a product from the company on the day they took the survey. Participants were given 5 minutes to fill in the survey anonymously. In total, 408 customers responded, but not all surveys were fully completed. Due to this, 371 survey results were included in the analysis.
Qualitative methods
In qualitative research , methods are often more flexible and subjective. For this reason, it’s crucial to robustly explain the methodology choices you made.
Be sure to discuss the criteria you used to select your data, the context in which your research was conducted, and the role you played in collecting your data (e.g., were you an active participant, or a passive observer?)
Interviews or focus groups Describe where, when, and how the interviews were conducted.
- How did you find and select participants?
- How many participants took part?
- What form did the interviews take ( structured , semi-structured , or unstructured )?
- How long were the interviews?
- How were they recorded?
Participant observation Describe where, when, and how you conducted the observation or ethnography .
- What group or community did you observe? How long did you spend there?
- How did you gain access to this group? What role did you play in the community?
- How long did you spend conducting the research? Where was it located?
- How did you record your data (e.g., audiovisual recordings, note-taking)?
Existing data Explain how you selected case study materials for your analysis.
- What type of materials did you analyse?
- How did you select them?
In order to gain better insight into possibilities for future improvement of the fitness shop’s product range, semi-structured interviews were conducted with 8 returning customers.
Here, a returning customer was defined as someone who usually bought products at least twice a week from the store.
Surveys were used to select participants. Interviews were conducted in a small office next to the cash register and lasted approximately 20 minutes each. Answers were recorded by note-taking, and seven interviews were also filmed with consent. One interviewee preferred not to be filmed.
Mixed methods
Mixed methods research combines quantitative and qualitative approaches. If a standalone quantitative or qualitative study is insufficient to answer your research question, mixed methods may be a good fit for you.
Mixed methods are less common than standalone analyses, largely because they require a great deal of effort to pull off successfully. If you choose to pursue mixed methods, it’s especially important to robustly justify your methods here.
Prevent plagiarism, run a free check.
Next, you should indicate how you processed and analysed your data. Avoid going into too much detail: you should not start introducing or discussing any of your results at this stage.
In quantitative research , your analysis will be based on numbers. In your methods section, you can include:
- How you prepared the data before analysing it (e.g., checking for missing data , removing outliers , transforming variables)
- Which software you used (e.g., SPSS, Stata or R)
- Which statistical tests you used (e.g., two-tailed t test , simple linear regression )
In qualitative research, your analysis will be based on language, images, and observations (often involving some form of textual analysis ).
Specific methods might include:
- Content analysis : Categorising and discussing the meaning of words, phrases and sentences
- Thematic analysis : Coding and closely examining the data to identify broad themes and patterns
- Discourse analysis : Studying communication and meaning in relation to their social context
Mixed methods combine the above two research methods, integrating both qualitative and quantitative approaches into one coherent analytical process.
Above all, your methodology section should clearly make the case for why you chose the methods you did. This is especially true if you did not take the most standard approach to your topic. In this case, discuss why other methods were not suitable for your objectives, and show how this approach contributes new knowledge or understanding.
In any case, it should be overwhelmingly clear to your reader that you set yourself up for success in terms of your methodology’s design. Show how your methods should lead to results that are valid and reliable, while leaving the analysis of the meaning, importance, and relevance of your results for your discussion section .
- Quantitative: Lab-based experiments cannot always accurately simulate real-life situations and behaviours, but they are effective for testing causal relationships between variables .
- Qualitative: Unstructured interviews usually produce results that cannot be generalised beyond the sample group , but they provide a more in-depth understanding of participants’ perceptions, motivations, and emotions.
- Mixed methods: Despite issues systematically comparing differing types of data, a solely quantitative study would not sufficiently incorporate the lived experience of each participant, while a solely qualitative study would be insufficiently generalisable.
Remember that your aim is not just to describe your methods, but to show how and why you applied them. Again, it’s critical to demonstrate that your research was rigorously conducted and can be replicated.
1. Focus on your objectives and research questions
The methodology section should clearly show why your methods suit your objectives and convince the reader that you chose the best possible approach to answering your problem statement and research questions .
2. Cite relevant sources
Your methodology can be strengthened by referencing existing research in your field. This can help you to:
- Show that you followed established practice for your type of research
- Discuss how you decided on your approach by evaluating existing research
- Present a novel methodological approach to address a gap in the literature
3. Write for your audience
Consider how much information you need to give, and avoid getting too lengthy. If you are using methods that are standard for your discipline, you probably don’t need to give a lot of background or justification.
Regardless, your methodology should be a clear, well-structured text that makes an argument for your approach, not just a list of technical details and procedures.
Methodology refers to the overarching strategy and rationale of your research. Developing your methodology involves studying the research methods used in your field and the theories or principles that underpin them, in order to choose the approach that best matches your objectives.
Methods are the specific tools and procedures you use to collect and analyse data (e.g. interviews, experiments , surveys , statistical tests ).
In a dissertation or scientific paper, the methodology chapter or methods section comes after the introduction and before the results , discussion and conclusion .
Depending on the length and type of document, you might also include a literature review or theoretical framework before the methodology.
Quantitative research deals with numbers and statistics, while qualitative research deals with words and meanings.
Quantitative methods allow you to test a hypothesis by systematically collecting and analysing data, while qualitative methods allow you to explore ideas and experiences in depth.
A sample is a subset of individuals from a larger population. Sampling means selecting the group that you will actually collect data from in your research.
For example, if you are researching the opinions of students in your university, you could survey a sample of 100 students.
Statistical sampling allows you to test a hypothesis about the characteristics of a population. There are various sampling methods you can use to ensure that your sample is representative of the population as a whole.
Cite this Scribbr article
If you want to cite this source, you can copy and paste the citation or click the ‘Cite this Scribbr article’ button to automatically add the citation to our free Reference Generator.
McCombes, S. (2022, October 10). What Is a Research Methodology? | Steps & Tips. Scribbr. Retrieved 27 May 2024, from https://www.scribbr.co.uk/thesis-dissertation/methodology/
Is this article helpful?

Shona McCombes
Other students also liked, how to write a dissertation proposal | a step-by-step guide, what is a literature review | guide, template, & examples, what is a theoretical framework | a step-by-step guide.
- Cookies & Privacy
- GETTING STARTED
- Introduction
- FUNDAMENTALS
Getting to the main article
Choosing your route
Setting research questions/ hypotheses
Assessment point
Building the theoretical case
Setting your research strategy
Data collection
Data analysis
Data analysis techniques
In STAGE NINE: Data analysis , we discuss the data you will have collected during STAGE EIGHT: Data collection . However, before you collect your data, having followed the research strategy you set out in this STAGE SIX , it is useful to think about the data analysis techniques you may apply to your data when it is collected.
The statistical tests that are appropriate for your dissertation will depend on (a) the research questions/hypotheses you have set, (b) the research design you are using, and (c) the nature of your data. You should already been clear about your research questions/hypotheses from STAGE THREE: Setting research questions and/or hypotheses , as well as knowing the goal of your research design from STEP TWO: Research design in this STAGE SIX: Setting your research strategy . These two pieces of information - your research questions/hypotheses and research design - will let you know, in principle , the statistical tests that may be appropriate to run on your data in order to answer your research questions.
We highlight the words in principle and may because the most appropriate statistical test to run on your data not only depend on your research questions/hypotheses and research design, but also the nature of your data . As you should have identified in STEP THREE: Research methods , and in the article, Types of variables , in the Fundamentals part of Lærd Dissertation, (a) not all data is the same, and (b) not all variables are measured in the same way (i.e., variables can be dichotomous, ordinal or continuous). In addition, not all data is normal , nor is the data when comparing groups necessarily equal , terms we explain in the Data Analysis section in the Fundamentals part of Lærd Dissertation. As a result, you might think that running a particular statistical test is correct at this point of setting your research strategy (e.g., a statistical test called a dependent t-test ), based on the research questions/hypotheses you have set, but when you collect your data (i.e., during STAGE EIGHT: Data collection ), the data may fail certain assumptions that are important to such a statistical test (i.e., normality and homogeneity of variance ). As a result, you have to run another statistical test (e.g., a Wilcoxon signed-rank test instead of a dependent t-test ).
At this stage in the dissertation process, it is important, or at the very least, useful to think about the data analysis techniques you may apply to your data when it is collected. We suggest that you do this for two reasons:
REASON A Supervisors sometimes expect you to know what statistical analysis you will perform at this stage of the dissertation process
This is not always the case, but if you have had to write a Dissertation Proposal or Ethics Proposal , there is sometimes an expectation that you explain the type of data analysis that you plan to carry out. An understanding of the data analysis that you will carry out on your data can also be an expected component of the Research Strategy chapter of your dissertation write-up (i.e., usually Chapter Three: Research Strategy ). Therefore, it is a good time to think about the data analysis process if you plan to start writing up this chapter at this stage.
REASON B It takes time to get your head around data analysis
When you come to analyse your data in STAGE NINE: Data analysis , you will need to think about (a) selecting the correct statistical tests to perform on your data, (b) running these tests on your data using a statistics package such as SPSS, and (c) learning how to interpret the output from such statistical tests so that you can answer your research questions or hypotheses. Whilst we show you how to do this for a wide range of scenarios in the in the Data Analysis section in the Fundamentals part of Lærd Dissertation, it can be a time consuming process. Unless you took an advanced statistics module/option as part of your degree (i.e., not just an introductory course to statistics, which are often taught in undergraduate and master?s degrees), it can take time to get your head around data analysis. Starting this process at this stage (i.e., STAGE SIX: Research strategy ), rather than waiting until you finish collecting your data (i.e., STAGE EIGHT: Data collection ) is a sensible approach.
Final thoughts...
Setting the research strategy for your dissertation required you to describe, explain and justify the research paradigm, quantitative research design, research method(s), sampling strategy, and approach towards research ethics and data analysis that you plan to follow, as well as determine how you will ensure the research quality of your findings so that you can effectively answer your research questions/hypotheses. However, from a practical perspective, just remember that the main goal of STAGE SIX: Research strategy is to have a clear research strategy that you can implement (i.e., operationalize ). After all, if you are unable to clearly follow your plan and carry out your research in the field, you will struggle to answer your research questions/hypotheses. Once you are sure that you have a clear plan, it is a good idea to take a step back, speak with your supervisor, and assess where you are before moving on to collect data. Therefore, when you are ready, proceed to STAGE SEVEN: Assessment point .
Library Guides
Dissertations 5: findings, analysis and discussion: home.
- Results/Findings
Alternative Structures
The time has come to show and discuss the findings of your research. How to structure this part of your dissertation?
Dissertations can have different structures, as you can see in the dissertation structure guide.
Dissertations organised by sections
Many dissertations are organised by sections. In this case, we suggest three options. Note that, if within your course you have been instructed to use a specific structure, you should do that. Also note that sometimes there is considerable freedom on the structure, so you can come up with other structures too.
A) More common for scientific dissertations and quantitative methods:
- Results chapter
- Discussion chapter
Example:
- Introduction
- Literature review
- Methodology
- (Recommendations)
if you write a scientific dissertation, or anyway using quantitative methods, you will have some objective results that you will present in the Results chapter. You will then interpret the results in the Discussion chapter.
B) More common for qualitative methods
- Analysis chapter. This can have more descriptive/thematic subheadings.
- Discussion chapter. This can have more descriptive/thematic subheadings.
- Case study of Company X (fashion brand) environmental strategies
- Successful elements
- Lessons learnt
- Criticisms of Company X environmental strategies
- Possible alternatives
C) More common for qualitative methods
- Analysis and discussion chapter. This can have more descriptive/thematic titles.
- Case study of Company X (fashion brand) environmental strategies
If your dissertation uses qualitative methods, it is harder to identify and report objective data. Instead, it may be more productive and meaningful to present the findings in the same sections where you also analyse, and possibly discuss, them. You will probably have different sections dealing with different themes. The different themes can be subheadings of the Analysis and Discussion (together or separate) chapter(s).
Thematic dissertations
If the structure of your dissertation is thematic , you will have several chapters analysing and discussing the issues raised by your research. The chapters will have descriptive/thematic titles.
- Background on the conflict in Yemen (2004-present day)
- Classification of the conflict in international law
- International law violations
- Options for enforcement of international law
- Next: Results/Findings >>
- Last Updated: Aug 4, 2023 2:17 PM
- URL: https://libguides.westminster.ac.uk/c.php?g=696975
CONNECT WITH US
- How it works

Research Methods for Dissertation – Types with Comparison
Published by Carmen Troy at August 13th, 2021 , Revised On June 14, 2023
Introduction
“Research methods for a dissertation refer to the specific approaches, procedures, and techniques employed by researchers to investigate and gather data for their dissertation projects.”
These methods provide a systematic and structured framework for conducting research, ensuring the reliability, validity, and rigour of the study.
What are the different research methods for the dissertation, and which one should I use?
Choosing the right research method for a dissertation is a grinding and perplexing aspect of the dissertation research process. A well-defined research methodology helps you conduct your research in the right direction, validates the results of your research, and makes sure that the study you’re conducting answers the set research questions .
The research title, research questions, hypothesis , objectives, and study area generally determine the best research method in the dissertation.
This post’s primary purpose is to highlight what these different types of research methods involve and how you should decide which type of research fits the bill. As you read through this article, think about which one of these research methods will be the most appropriate for your research.
The practical, personal, and academic reasons for choosing any particular method of research are also analysed. You will find our explanation of experimental , descriptive , historical , quantitative , qualitative , and mixed research methods useful regardless of your field of study.
While choosing the right method of research for your own research, you need to:
- Understand the difference between research methods and methodology .
- Think about your research topic, research questions, and research objectives to make an intelligent decision.
- Know about various types of research methods so that you can choose the most suitable and convenient method as per your research requirements.
Research Methodology Vs. Research Methods
A well-defined research methodology helps you conduct your research in the right direction, validates the results of your research, and makes sure that the study you are conducting answers the set research questions .

Research methods are the techniques and procedures used for conducting research. Choosing the right research method for your writing is an important aspect of the research process .
You need to either collect data or talk to the people while conducting any research. The research methods can be classified based on this distinction.
Hire an Expert Writer
Proposal and dissertation orders completed by our expert writers are
- Formally drafted in an academic style
- Plagiarism free
- 100% Confidential
- Never Resold
- Include unlimited free revisions
- Completed to match exact client requirements
Types of Research Methods
Research methods are broadly divided into six main categories.
Experimental Research Methods
Descriptive research methods, historical research methods, quantitative research methods, qualitative research methods, mixed methods of research.
Experimental research includes the experiments conducted in the laboratory or observation under controlled conditions. Researchers try to study human behavior by performing various experiments. Experiments can vary from personal and informal natural comparisons. It includes three types of variables;
- Independent variable
- Dependent variable
- Controlled variable
Types of Experimental Methods
Laboratory experiments
The experiments were conducted in the laboratory. Researchers have control over the variables of the experiment.
Field experiment
The experiments were conducted in the open field and environment of the participants by incorporating a few artificial changes. Researchers do not have control over variables under measurement. Participants know that they are taking part in the experiment.
Natural experiments
The experiment is conducted in the natural environment of the participants. The participants are generally not informed about the experiment being conducted on them.
Example : Estimating the health condition of the population.
Quasi-experiments
A quasi-experiment is an experiment that takes advantage of natural occurrences. Researchers cannot assign random participants to groups.
Example: Comparing the academic performance of the two schools.
What data collection best suits your research?
- Find out by hiring an expert from ResearchProspect today!
- Despite how challenging the subject may be, we are here to help you.

Descriptive research aims at collecting the information to answer the current affairs. It follows the Ex post facto research, which predicts the possible reasons behind the situation that has already occurred. It aims to answer questions like how, what, when, where, and what rather than ‘why.’
In historical research , an investigator collects, analyses the information to understand, describe, and explain the events that occurred in the past. Researchers try to find out what happened exactly during a certain period of time as accurately and as closely as possible. It does not allow any manipulation or control of variables.
Quantitative research is associated with numerical data or data that can be measured. It is used to study a large group of population. The information is gathered by performing statistical, mathematical, or computational techniques.
Quantitative research isn’t simply based on statistical analysis or quantitative techniques but rather uses a certain approach to theory to address research hypotheses or research questions, establish an appropriate research methodology, and draw findings & conclusions .
Some most commonly employed quantitative research strategies include data-driven dissertations, theory-driven studies, and reflection-driven research. Regardless of the chosen approach, there are some common quantitative research features as listed below.
- Quantitative research is based on testing or building on existing theories proposed by other researchers whilst taking a reflective or extensive route.
- Quantitative research aims to test the research hypothesis or answer established research questions.
- It is primarily justified by positivist or post-positivist research paradigms.
- The research design can be relationship-based, quasi-experimental, experimental, or descriptive.
- It draws on a small sample to make generalisations to a wider population using probability sampling techniques.
- Quantitative data is gathered according to the established research questions and using research vehicles such as structured observation, structured interviews, surveys, questionnaires, and laboratory results.
- The researcher uses statistical analysis tools and techniques to measure variables and gather inferential or descriptive data. In some cases, your tutor or members of the dissertation committee might find it easier to verify your study results with numbers and statistical analysis.
- The accuracy of the study results is based on external and internal validity and the authenticity of the data used.
- Quantitative research answers research questions or tests the hypothesis using charts, graphs, tables, data, and statements.
- It underpins research questions or hypotheses and findings to make conclusions.
- The researcher can provide recommendations for future research and expand or test existing theories.
Confused between qualitative and quantitative methods of data analysis? No idea what discourse and content analysis are?
We hear you.
- Whether you want a full dissertation written or need help forming a dissertation proposal, we can help you with both.
- Get different dissertation services at ResearchProspect and score amazing grades!
At ResearchProspect, our expert writers can help you with your quantitative dissertation whether you are a sports science student, medical or biological science, education or business, psychology, social sciences, engineering, project management, or any other science-based degree. We guarantee 100% commitment, 100% Plagiarism-free work, 100% Confidentiality and 100% Satisfaction
It is a type of scientific research where a researcher collects evidence to seek answers to a question . It is associated with studying human behaviour from an informative perspective. It aims at obtaining in-depth details of the problem.
As the term suggests, qualitative research is based on qualitative research methods, including participants’ observations, focus groups, and unstructured interviews.
Qualitative research is very different in nature when compared to quantitative research. It takes an established path towards the research process , how research questions are set up, how existing theories are built upon, what research methods are employed, and how the findings are unveiled to the readers.
You may adopt conventional methods, including phenomenological research, narrative-based research, grounded theory research, ethnographies , case studies , and auto-ethnographies.
Again, regardless of the chosen approach to qualitative research, your dissertation will have unique key features as listed below.
- The research questions that you aim to answer will expand or even change as the dissertation writing process continues. This aspect of the research is typically known as an emergent design where the research objectives evolve with time.
- Qualitative research may use existing theories to cultivate new theoretical understandings or fall back on existing theories to support the research process. However, the original goal of testing a certain theoretical understanding remains the same.
- It can be based on various research models, such as critical theory, constructivism, and interpretivism.
- The chosen research design largely influences the analysis and discussion of results and the choices you make. Research design depends on the adopted research path: phenomenological research, narrative-based research, grounded theory-based research, ethnography, case study-based research, or auto-ethnography.
- Qualitative research answers research questions with theoretical sampling, where data gathered from an organisation or people are studied.
- It involves various research methods to gather qualitative data from participants belonging to the field of study. As indicated previously, some of the most notable qualitative research methods include participant observation, focus groups, and unstructured interviews .
- It incorporates an inductive process where the researcher analyses and understands the data through his own eyes and judgments to identify concepts and themes that comprehensively depict the researched material.
- The key quality characteristics of qualitative research are transferability, conformity, confirmability, and reliability.
- Results and discussions are largely based on narratives, case study and personal experiences, which help detect inconsistencies, observations, processes, and ideas.s
- Qualitative research discusses theoretical concepts obtained from the results whilst taking research questions and/or hypotheses to draw general conclusions .
Now that you know the unique differences between quantitative and qualitative research methods, you may want to learn a bit about primary and secondary research methods.
Here is an article that will help you distinguish between primary and secondary research and decide whether you need to use quantitative and/or qualitative primary research methods in your dissertation.
Alternatively, you can base your dissertation on secondary research, which is descriptive and explanatory in essence.
Types of Qualitative Research Methods
Action research
Action research aims at finding an immediate solution to a problem. The researchers can also act as the participants of the research. It is used in the educational field.
A case study includes data collection from multiple sources over time. It is widely used in social sciences to study the underlying information, organisation, community, or event. It does not provide any solution to the problem. Researchers cannot act as the participants of the research.
Ethnography
In this type of research, the researcher examines the people in their natural environment. Ethnographers spend time with people to study people and their culture closely. They can consult the literature before conducting the study.
When you combine quantitative and qualitative methods of research, the resulting approach becomes mixed methods of research.
Over the last few decades, much of the research in academia has been conducted using mixed methods because of the greater legitimacy this particular technique has gained for several reasons including the feeling that combining the two types of research can provide holistic and more dependable results.
Here is what mixed methods of research involve:
- Interpreting and investigating the information gathered through quantitative and qualitative techniques.
- There could be more than one stage of research. Depending on the research topic, occasionally it would be more appropriate to perform qualitative research in the first stage to figure out and investigate a problem to unveil key themes; and conduct quantitative research in stage two of the process for measuring relationships between the themes.
Note: However, this method has one prominent limitation, which is, as previously mentioned, combining qualitative and quantitative research can be difficult because they both are different in terms of design and approach. In many ways, they are contrasting styles of research, and so care must be exercised when basing your dissertation on mixed methods of research.
When choosing a research method for your own dissertation, it would make sense to carefully think about your research topic , research questions , and research objectives to make an intelligent decision in terms of the philosophy of research design .
Dissertations based on mixed methods of research can be the hardest to tackle even for PhD students.
Our writers have years of experience in writing flawless and to the point mixed methods-based dissertations to be confident that the dissertation they write for you will be according to the technical requirements and the formatting guidelines.
Read our guarantees to learn more about how you can improve your grades with our dissertation services.
Please Find Below an Example of Research Methods Section in a Dissertation or Thesis.
Background and Problem
Diversity management became prominent in the late twentieth century, with foundations in America. Historically homogeneous or nondiverse nations, such as Finland, have not yet experienced the issues associated with rising cultural and ethnic diversity in the workforce. Regardless of the environment, workforce diversity garners greater attention and is characterised by its expanding relevance due to globalised and international companies, global and national worker mobility, demographic shifts, or enhancing productivity.
As a result, challenges of diversity management have been handled through legal, financial, and moral pressures (Hayes et al., 2020). The evolving structure of the working population in terms of language, ethnic background, maturity level, faith, or ethnocultural history is said to pose a challenge to human resource management (HRM) in utilising diversity: the understanding, abilities, and expertise prospects of the entire workforce to deal with possible developments.
The European approach to diversity management is regarded as growing. However, it is found to emphasise the relationship to business and lack competence in diversity management problems. Mass immigration concentrates variety, sometimes treated as cultural minority issues, implying the normalisation of anti-discrimination actions (Yadav and Lenka, 2020).
These causes, in turn, have provided the basis of comprehensive diversity research, which has generated different theories, frameworks, concepts, and guidelines from interdisciplinary viewpoints, such as industrial and organisational psychology and behaviour (OB), cultural studies, anthropology, migration, economics, postcolonialism, and so on. And in the form of international, social and cultural, organisational, group, and individual scale diversity analysis. This dissertation focuses on diversity concerns from impression management, specifically from HRM as an executive-level phenomenon (Seliverstova, 2021).
As conceptual frameworks, organisational structures concentrating on the production of diversity and social psychology, notably social identity theory with diverse ‘identities’ of persons or intergroup connections, are primarily employed. The study’s primary goal in the workplace is to discover inequities or examine the effects of diversity on workplace outcomes.
Individual study interests include behaviours, emotions, intelligence, intercultural skills or competencies, while group research interests include group dynamics, intergroup interactions, effectiveness, and cooperation or collaboration. Organisational studies address themes such as workforce composition, workplace equality, and diversity challenges and how they may be managed accordingly. Domestic diversity, omitting national distinctions, or global diversity, about diverse country cultures, might be studied further (AYDIN and ÖZEREN, 2018).
Diversity is a context-dependent, particular, comparative, complicated, plural phrase or idea with varying interpretations in different organisations and cultures and no unified definition. As a result, in addition to many internal and external elements, diversity may be managed, individuals taught, and organisations have grown in various ways. This dissertation considers diversity in an organisational environment as a construct of ‘differences’ to be handled (Cummings, 2018).
Various management systems have grown in stages, bringing diverse diversity management concepts. Equality/equal opportunities (EO) legislation and diversity management are the two conventional approaches and primary streams with differing theoretical foundations for managing and dealing with workforce diversity challenges (DM).
These approaches relate to whether diversity is handled by increasing sameness by legal pressures or by voluntarily respecting people’s differences, which shows an organisation’s responsiveness and proactivity toward managing diversity. But most of the literature in this area has avoided the impression management theories (Coad and Guenther, 2014). Therefore, this study will add a new dimension in this area by introducing impression management analysis.
Research Aim and Objectives
This research aims to analyse the impact of organisational structure on human resources diversification from the viewpoint of impression managerial theory. It has the following objectives:
- It will examine the existing impression management literature to draw insights into the relationship under consideration.
- It will identify various factors such as competency, social inclusion, etc., affecting the management’s decision to recruit diverse human resources.
- It will recommend appropriate organisational structures and HR policies to improve diversification of HR by reviewing impression management theories.
Research Questions
This research will answer the following questions:
- How does organisational structure affect human resources diversification from the viewpoint of impression managerial theory?
- What factors such as competency, social inclusion, etc., affect the management decision to recruit diverse human resources?
- What are appropriate organisational structures and HR policies to improve diversification of HR by reviewing impression management theories?
Research Hypothesis
The organisational structure significantly impacts the recruitment of diverse human resources.
Literature Review
According to Staniec and Zakrzewska-Bielawska (2010), considering strategy-oriented activities and organisational components are the critical foundation in the organisational structure required to align structure strategy. Each company’s internal organisation is somewhat distinctive, resulting from various corporate initiatives and historical conditions.
Furthermore, each design is based on essential success elements and vital tasks inherent in the firm plan. This article offers empirical research on unique organisational structure elements in Polish firms in the context of concentration and diversification tactics. And companies that adopted concentration techniques mainly used functional organisational structures.
Tasks were primarily classified and categorised based on functions and phases of the technical process, with coordination based on hierarchy. Jobs were also highly centralised and formalised. Organisational structures of an active type were also prevalent in many firms. Only a handful of the evaluated organisations possessed flexible contemporary divisional or matrix structures appropriate to differentiation. However, it appears that even such organisations should adjust their organisational solutions to perform successfully in an immensely complex and chaotic environment.
Similarly, according to Yang and Konrad (2011), diversity management techniques are the institutionalised methods created and applied by organisations to manage diversity among all organisational shareholders. They examined the existing research on the causes and significance of diversity management approaches.
They construct a research model indicating many potential routes for future study using institutional and resource-based theories. They also offer prospective avenues for study on diversity management techniques to further the two theoretical viewpoints. The findings indicate that research on diverse management practises might provide perceptions into the two ideologies. Diversity management provides a method for reconciling the agency vs structure issue for institutional concept.
Furthermore, diversity management is a suitable framework for studying how institutional pressures are translated into organisational action and the relationship between complying with institutional mandates and attaining high performance. Research on diversity management raises the importance of environmental normative elements in resource-based reasoning.
It allows for exploring essential resource sources and the co-evolution of diversity resources and management capacities, potentially developing dynamic resource-based theory. Furthermore, a review of the existing research on diversity management practices reveals that research in this field has nearly entirely concentrated on employee-related activities.
However, in establishing the idea of diversity management practises, we included the practises that companies put in place to manage diversity across all stakeholder groups on purpose. Management techniques for engaging with consumers, dealers, supervisors, board directors, and community members are critical for meeting institutional theory’s social and normative commitments.
Moreover, according to Sippola (2014), this research looks at diversity management from the standpoint of HRM. The study aims to discover the effects of expanding workforce diversity on HRM inside firms. This goal will be accomplished through four papers examining diversity management’s impacts on HRM from various viewpoints and mostly in longitudinal contexts.
The purpose of the first article, as a pilot survey, is to determine the reasons, advantages, and problems of rising cultural diversity and the consequences for HRM to get a preliminary grasp of the issue in the specific setting. According to the report, diversity is vital for productivity but is not often emphasised in HRM strategy.
The key areas that were changed were acquisition, development, and growth. The second article examines how different diversity management paradigms recognised in businesses affect HRM. It offers an experimentally verified typology that explains reactive or proactive strategic and operational level HRM activities in light of four alternative diversity management perspectives.
The third essay will examine how a ‘working culture bridge group’ strategy fosters and enhances workplace diversity. The research looks into how development goals are defined, what training and development techniques are used, and the consequences and causal factors when an analysis measures the training and development approach.
The primary goal of article four is to establish which components of diversity management design are globally integrated into multinational corporations (MNCs) and which integrating (delivery) methods are employed to facilitate it. Another goal is to identify the institutional problems faced by the Finnish national diversity setting during the integration process.
The findings show that the example organisation achieved more excellent global uniformity at the level of diversification concept through effective use of multiple frameworks but was forced to rely on a more multinational approach to implementing diversification policies and procedures. The difficulties faced emphasised the distinctiveness of Finland’s cognitive and normative institutional setting for diversity.
Furthermore, according to Guillaume et al. (2017), to compensate for the dual-edged character of demographic workplace diversity impacts on social inclusion, competence, and well-being-related factors, research has shifted away from straightforward main effect methods and begun to investigate factors that moderate these effects.
While there is no shortage of primary research on the circumstances that lead to favourable or poor results, it is unknown which contextual elements make it work. Using the Classification framework as a theoretical lens, they examine variables that moderate the impacts of workplace diversity on social integration, performance, and well-being outcomes, emphasising characteristics that organisations and managers can influence.
They suggest future study directions and end with practical applications. They concluded that faultlines, cross-categorisation, and status variations across demographic groupings highlight variety. Cross-categorisation has been proven to reduce intergroup prejudice while promoting social inclusion, competence, and well-being. Whether faultlines and subgroup status inequalities promote negative or good intergroup interactions and hinder social integration, performance, and well-being depends on whether situational factors encourage negative or positive intergroup connections. The impacts were not mitigated by team size or diversity type.
Furthermore, our data demonstrate that task characteristics are essential for workgroup diversity. Any demographic diversity in workgroups can promote creativity, but only when combined with task-relevant expertise improves the performance of teams undertaking complicated tasks. The type of team and the industrial context do not appear to play an effect. It is unclear if these findings apply to relational demography and organisational diversity impacts. There is some evidence that, under some settings, relational demography may increase creativity, and, as previously said, demographic variety may help firms function in growth-oriented strategy contexts.
Likewise, according to Ali, Tawfeq, and Dler (2020), diversity management refers to organisational strategies that strive to increase the integration of people from diverse backgrounds into the framework of corporate goals. Organisations should develop productive ways to implement diversity management (DM) policies to establish a creative enterprise that can enhance their operations, goods, and services.
Furthermore, human resource management HRM is a clever tool for any firm to manage resources within the company. As a result, this article explores the link between DM, HR policies, and workers’ creative work-related behaviours in firms in Kurdistan’s Fayoum city. According to the questionnaire, two hypotheses were tested: the influence of HRM on diversity management, HRM on innovation, and the impact of diversity management on innovation.
The first premise is that workplace diversity changes the nature of working relationships, how supervisors and managers connect, and how workers respond to one another. It also addresses human resource functions such as record-keeping, training, recruiting, and employee competence needs. The last premise on the influence of diversity management on innovation is that workplace diversity assists a business in hiring a diverse range of personnel.
In other words, a vibrant population need individuals of varied personalities. Workplace diversity refers to a company’s workforce consisting of employees of various genders, ages, faiths, races, ethnicities, cultural backgrounds, religions, dialects, training, capabilities, etc. According to the study’s findings, human resource management strategies have a substantial influence on diversity management.
Second, diversity management was found to have a considerable impact on creativity. Finally, human resource management techniques influenced innovation significantly. Based on the findings, it was discovered that diversity management had a more significant influence on creation than human resource management.
Lastly, according to Li et al. (2021), the universal trend of rising workplace age diversity has increased the study focus on the organisational effects of age-diverse workforces. Prior research has mainly concentrated on the statistical association between age diversity and organisational success rather than experimentally examining the probable processes behind this relationship.
They argue that age diversity influences organisational performance through human and social capital using an intellectual capital paradigm. Moreover, they investigate workplace functional diversity and age-inclusive management as two confounding factors affecting the benefits of age diversity on physical and human capital.
Their hypotheses were evaluated using data from the Association for Human Resource Management’s major manager-reported workplace survey. Age diversity was favourably linked with organisational performance via the mediation of higher human and social capital. Furthermore, functional diversity and age-inclusive management exacerbated the favourable benefits of age variety on human and social capital. Their study gives insight into how age-diverse workforces might generate value by nurturing knowledge-based organisational resources.
Research Gap/ Contribution
Although there is a vast body of research in diversity in the human resource management area, many researchers explored various dimensions. But no study explicitly discovers the impact of organisational culture on human resource diversification. Moreover, no researchers examined the scope of impression management in this context.
Therefore, this research will fill this considerable literature gap by finding the direct impact of organisational structure on human resource diversification. Secondly, by introducing a new dimension of impression management theory. It will open new avenues for research in this area, and it will help HR managers to formulate better policies for a more inclusive organisational structure.
Research Methodology
It will be mixed quantitative and qualitative research based on the secondary data collected through different research journals and case studies of various companies. Firstly, the quantitative analysis will be conducted through a regression analysis to show the organisational structure’s impact on human resource diversification.
The dummy variable will be used to show organisational structure, and diversification will be captured through the ethnic backgrounds of the employees. Moreover, different variables will be added to the model, such as competency, social inclusion, etc. It will fulfil the objective of identifying various factors which affect the management decision to recruit diverse human resources. Secondly, a systematic review of the literature will be conducted for qualitative analysis to add the impression management dimension to the research. Google Scholar, JSTOR, Scopus, etc., will be used to search keywords such as human resource diversity, impression management, and organisation structure.
Research Limitation
Although research offers a comprehensive empirical analysis on the relationship under consideration due to lack of resources, the study is limited to secondary data. It would be better if the research would’ve been conducted on the primary data collected through the organisations. That would’ve captured the actual views of the working professionals. It would’ve increased the validity of the research.
Ali, M., Tawfeq, A., & Dler, S. (2020). Relationship between Diversity Management and Human Resource Management: Their Effects on Employee Innovation in the Organizations. Black Sea Journal of Management and Marketing, 1 (2), 36-44.
AYDIN, E., & ÖZEREN, E. (2018). Rethinking workforce diversity research through critical perspectives: emerging patterns and research agenda. Business & Management Studies: An International Journal, 6 (3), 650-670.
Coad, A., & Guenther, C. (2014). Processes of firm growth and diversification: theory and evidence. Small Business Economics, 43 (4), 857-871.
Cummings, V. (2018). Economic Diversification and Empowerment of Local Human Resources: Could Singapore Be a Model for the GCC Countries?. In. Economic Diversification in the Gulf Region, II , 241-260.
Guillaume, Y., Dawson, J., Otaye‐Ebede, L., Woods, S., & West, M. (2017). Harnessing demographic differences in organizations: What moderates the effects of workplace diversity? Journal of Organizational Behavior, 38 (2), 276-303.
Hayes, T., Oltman, K., Kaylor, L., & Belgudri, A. (2020). How leaders can become more committed to diversity management. Consulting Psychology Journal: Practice and Research, 72 (4), 247.
Li, Y., Gong, Y., Burmeister, A., Wang, M., Alterman, V., Alonso, A., & Robinson, S. (2021). Leveraging age diversity for organizational performance: An intellectual capital perspective. Journal of Applied Psychology, 106 (1), 71.
Seliverstova, Y. (2021). Workforce diversity management: a systematic literature review. Strategic Management, 26 (2), 3-11.
Sippola, A. (2014). Essays on human resource management perspectives on diversity management. Vaasan yliopisto.
Staniec, I., & Zakrzewska-Bielawska, A. (2010). Organizational structure in the view of single business concentration and diversification strategies—empirical study results. Recent advances in management, marketing, finances. WSEAS Press, Penang, Malaysia .
Yadav, S., & Lenka, U. (2020). Diversity management: a systematic review. Equality, Diversity and Inclusion: An International Journal .
Yang, Y., & Konrad, A. (2011). Understanding diversity management practices: Implications of institutional theory and resource-based theory. Group & Organization Management, 36 (1), 6-38.
FAQs About Research Methods for Dissertations
What is the difference between research methodology and research methods.
Research methodology helps you conduct your research in the right direction, validates the results of your research and makes sure that the study you are conducting answers the set research questions.
Research methods are the techniques and procedures used for conducting research. Choosing the right research method for your writing is an important aspect of the research process.
What are the types of research methods?
The types of research methods include:
- Experimental research methods.
- Descriptive research methods
- Historical Research methods
What is a quantitative research method?
Quantitative research is associated with numerical data or data that can be measured. It is used to study a large group of population. The information is gathered by performing statistical, mathematical, or computational techniques.
What is a qualitative research method?
It is a type of scientific research where a researcher collects evidence to seek answers to a question . It is associated with studying human behavior from an informative perspective. It aims at obtaining in-depth details of the problem.
What is meant by mixed methods research?
Mixed methods of research involve:
- There could be more than one stage of research. Depending on the research topic, occasionally, it would be more appropriate to perform qualitative research in the first stage to figure out and investigate a problem to unveil key themes; and conduct quantitative research in stage two of the process for measuring relationships between the themes.
You May Also Like
Baffled by the concept of reliability and validity? Reliability refers to the consistency of measurement. Validity refers to the accuracy of measurement.
Textual analysis is the method of analysing and understanding the text. We need to look carefully at the text to identify the writer’s context and message.
This article presents the key advantages and disadvantages of secondary research so you can select the most appropriate research approach for your study.
USEFUL LINKS
LEARNING RESOURCES

COMPANY DETAILS

- How It Works
- Privacy Policy
Home » Dissertation – Format, Example and Template
Dissertation – Format, Example and Template
Table of Contents

Dissertation
Definition:
Dissertation is a lengthy and detailed academic document that presents the results of original research on a specific topic or question. It is usually required as a final project for a doctoral degree or a master’s degree.
Dissertation Meaning in Research
In Research , a dissertation refers to a substantial research project that students undertake in order to obtain an advanced degree such as a Ph.D. or a Master’s degree.
Dissertation typically involves the exploration of a particular research question or topic in-depth, and it requires students to conduct original research, analyze data, and present their findings in a scholarly manner. It is often the culmination of years of study and represents a significant contribution to the academic field.
Types of Dissertation
Types of Dissertation are as follows:
Empirical Dissertation
An empirical dissertation is a research study that uses primary data collected through surveys, experiments, or observations. It typically follows a quantitative research approach and uses statistical methods to analyze the data.
Non-Empirical Dissertation
A non-empirical dissertation is based on secondary sources, such as books, articles, and online resources. It typically follows a qualitative research approach and uses methods such as content analysis or discourse analysis.
Narrative Dissertation
A narrative dissertation is a personal account of the researcher’s experience or journey. It typically follows a qualitative research approach and uses methods such as interviews, focus groups, or ethnography.
Systematic Literature Review
A systematic literature review is a comprehensive analysis of existing research on a specific topic. It typically follows a qualitative research approach and uses methods such as meta-analysis or thematic analysis.
Case Study Dissertation
A case study dissertation is an in-depth analysis of a specific individual, group, or organization. It typically follows a qualitative research approach and uses methods such as interviews, observations, or document analysis.
Mixed-Methods Dissertation
A mixed-methods dissertation combines both quantitative and qualitative research approaches to gather and analyze data. It typically uses methods such as surveys, interviews, and focus groups, as well as statistical analysis.
How to Write a Dissertation
Here are some general steps to help guide you through the process of writing a dissertation:
- Choose a topic : Select a topic that you are passionate about and that is relevant to your field of study. It should be specific enough to allow for in-depth research but broad enough to be interesting and engaging.
- Conduct research : Conduct thorough research on your chosen topic, utilizing a variety of sources, including books, academic journals, and online databases. Take detailed notes and organize your information in a way that makes sense to you.
- Create an outline : Develop an outline that will serve as a roadmap for your dissertation. The outline should include the introduction, literature review, methodology, results, discussion, and conclusion.
- Write the introduction: The introduction should provide a brief overview of your topic, the research questions, and the significance of the study. It should also include a clear thesis statement that states your main argument.
- Write the literature review: The literature review should provide a comprehensive analysis of existing research on your topic. It should identify gaps in the research and explain how your study will fill those gaps.
- Write the methodology: The methodology section should explain the research methods you used to collect and analyze data. It should also include a discussion of any limitations or weaknesses in your approach.
- Write the results: The results section should present the findings of your research in a clear and organized manner. Use charts, graphs, and tables to help illustrate your data.
- Write the discussion: The discussion section should interpret your results and explain their significance. It should also address any limitations of the study and suggest areas for future research.
- Write the conclusion: The conclusion should summarize your main findings and restate your thesis statement. It should also provide recommendations for future research.
- Edit and revise: Once you have completed a draft of your dissertation, review it carefully to ensure that it is well-organized, clear, and free of errors. Make any necessary revisions and edits before submitting it to your advisor for review.
Dissertation Format
The format of a dissertation may vary depending on the institution and field of study, but generally, it follows a similar structure:
- Title Page: This includes the title of the dissertation, the author’s name, and the date of submission.
- Abstract : A brief summary of the dissertation’s purpose, methods, and findings.
- Table of Contents: A list of the main sections and subsections of the dissertation, along with their page numbers.
- Introduction : A statement of the problem or research question, a brief overview of the literature, and an explanation of the significance of the study.
- Literature Review : A comprehensive review of the literature relevant to the research question or problem.
- Methodology : A description of the methods used to conduct the research, including data collection and analysis procedures.
- Results : A presentation of the findings of the research, including tables, charts, and graphs.
- Discussion : A discussion of the implications of the findings, their significance in the context of the literature, and limitations of the study.
- Conclusion : A summary of the main points of the study and their implications for future research.
- References : A list of all sources cited in the dissertation.
- Appendices : Additional materials that support the research, such as data tables, charts, or transcripts.
Dissertation Outline
Dissertation Outline is as follows:
Title Page:
- Title of dissertation
- Author name
- Institutional affiliation
- Date of submission
- Brief summary of the dissertation’s research problem, objectives, methods, findings, and implications
- Usually around 250-300 words
Table of Contents:
- List of chapters and sections in the dissertation, with page numbers for each
I. Introduction
- Background and context of the research
- Research problem and objectives
- Significance of the research
II. Literature Review
- Overview of existing literature on the research topic
- Identification of gaps in the literature
- Theoretical framework and concepts
III. Methodology
- Research design and methods used
- Data collection and analysis techniques
- Ethical considerations
IV. Results
- Presentation and analysis of data collected
- Findings and outcomes of the research
- Interpretation of the results
V. Discussion
- Discussion of the results in relation to the research problem and objectives
- Evaluation of the research outcomes and implications
- Suggestions for future research
VI. Conclusion
- Summary of the research findings and outcomes
- Implications for the research topic and field
- Limitations and recommendations for future research
VII. References
- List of sources cited in the dissertation
VIII. Appendices
- Additional materials that support the research, such as tables, figures, or questionnaires.
Example of Dissertation
Here is an example Dissertation for students:
Title : Exploring the Effects of Mindfulness Meditation on Academic Achievement and Well-being among College Students
This dissertation aims to investigate the impact of mindfulness meditation on the academic achievement and well-being of college students. Mindfulness meditation has gained popularity as a technique for reducing stress and enhancing mental health, but its effects on academic performance have not been extensively studied. Using a randomized controlled trial design, the study will compare the academic performance and well-being of college students who practice mindfulness meditation with those who do not. The study will also examine the moderating role of personality traits and demographic factors on the effects of mindfulness meditation.
Chapter Outline:
Chapter 1: Introduction
- Background and rationale for the study
- Research questions and objectives
- Significance of the study
- Overview of the dissertation structure
Chapter 2: Literature Review
- Definition and conceptualization of mindfulness meditation
- Theoretical framework of mindfulness meditation
- Empirical research on mindfulness meditation and academic achievement
- Empirical research on mindfulness meditation and well-being
- The role of personality and demographic factors in the effects of mindfulness meditation
Chapter 3: Methodology
- Research design and hypothesis
- Participants and sampling method
- Intervention and procedure
- Measures and instruments
- Data analysis method
Chapter 4: Results
- Descriptive statistics and data screening
- Analysis of main effects
- Analysis of moderating effects
- Post-hoc analyses and sensitivity tests
Chapter 5: Discussion
- Summary of findings
- Implications for theory and practice
- Limitations and directions for future research
- Conclusion and contribution to the literature
Chapter 6: Conclusion
- Recap of the research questions and objectives
- Summary of the key findings
- Contribution to the literature and practice
- Implications for policy and practice
- Final thoughts and recommendations.
References :
List of all the sources cited in the dissertation
Appendices :
Additional materials such as the survey questionnaire, interview guide, and consent forms.
Note : This is just an example and the structure of a dissertation may vary depending on the specific requirements and guidelines provided by the institution or the supervisor.
How Long is a Dissertation
The length of a dissertation can vary depending on the field of study, the level of degree being pursued, and the specific requirements of the institution. Generally, a dissertation for a doctoral degree can range from 80,000 to 100,000 words, while a dissertation for a master’s degree may be shorter, typically ranging from 20,000 to 50,000 words. However, it is important to note that these are general guidelines and the actual length of a dissertation can vary widely depending on the specific requirements of the program and the research topic being studied. It is always best to consult with your academic advisor or the guidelines provided by your institution for more specific information on dissertation length.
Applications of Dissertation
Here are some applications of a dissertation:
- Advancing the Field: Dissertations often include new research or a new perspective on existing research, which can help to advance the field. The results of a dissertation can be used by other researchers to build upon or challenge existing knowledge, leading to further advancements in the field.
- Career Advancement: Completing a dissertation demonstrates a high level of expertise in a particular field, which can lead to career advancement opportunities. For example, having a PhD can open doors to higher-paying jobs in academia, research institutions, or the private sector.
- Publishing Opportunities: Dissertations can be published as books or journal articles, which can help to increase the visibility and credibility of the author’s research.
- Personal Growth: The process of writing a dissertation involves a significant amount of research, analysis, and critical thinking. This can help students to develop important skills, such as time management, problem-solving, and communication, which can be valuable in both their personal and professional lives.
- Policy Implications: The findings of a dissertation can have policy implications, particularly in fields such as public health, education, and social sciences. Policymakers can use the research to inform decision-making and improve outcomes for the population.
When to Write a Dissertation
Here are some situations where writing a dissertation may be necessary:
- Pursuing a Doctoral Degree: Writing a dissertation is usually a requirement for earning a doctoral degree, so if you are interested in pursuing a doctorate, you will likely need to write a dissertation.
- Conducting Original Research : Dissertations require students to conduct original research on a specific topic. If you are interested in conducting original research on a topic, writing a dissertation may be the best way to do so.
- Advancing Your Career: Some professions, such as academia and research, may require individuals to have a doctoral degree. Writing a dissertation can help you advance your career by demonstrating your expertise in a particular area.
- Contributing to Knowledge: Dissertations are often based on original research that can contribute to the knowledge base of a field. If you are passionate about advancing knowledge in a particular area, writing a dissertation can help you achieve that goal.
- Meeting Academic Requirements : If you are a graduate student, writing a dissertation may be a requirement for completing your program. Be sure to check with your academic advisor to determine if this is the case for you.
Purpose of Dissertation
some common purposes of a dissertation include:
- To contribute to the knowledge in a particular field : A dissertation is often the culmination of years of research and study, and it should make a significant contribution to the existing body of knowledge in a particular field.
- To demonstrate mastery of a subject: A dissertation requires extensive research, analysis, and writing, and completing one demonstrates a student’s mastery of their subject area.
- To develop critical thinking and research skills : A dissertation requires students to think critically about their research question, analyze data, and draw conclusions based on evidence. These skills are valuable not only in academia but also in many professional fields.
- To demonstrate academic integrity: A dissertation must be conducted and written in accordance with rigorous academic standards, including ethical considerations such as obtaining informed consent, protecting the privacy of participants, and avoiding plagiarism.
- To prepare for an academic career: Completing a dissertation is often a requirement for obtaining a PhD and pursuing a career in academia. It can demonstrate to potential employers that the student has the necessary skills and experience to conduct original research and make meaningful contributions to their field.
- To develop writing and communication skills: A dissertation requires a significant amount of writing and communication skills to convey complex ideas and research findings in a clear and concise manner. This skill set can be valuable in various professional fields.
- To demonstrate independence and initiative: A dissertation requires students to work independently and take initiative in developing their research question, designing their study, collecting and analyzing data, and drawing conclusions. This demonstrates to potential employers or academic institutions that the student is capable of independent research and taking initiative in their work.
- To contribute to policy or practice: Some dissertations may have a practical application, such as informing policy decisions or improving practices in a particular field. These dissertations can have a significant impact on society, and their findings may be used to improve the lives of individuals or communities.
- To pursue personal interests: Some students may choose to pursue a dissertation topic that aligns with their personal interests or passions, providing them with the opportunity to delve deeper into a topic that they find personally meaningful.
Advantage of Dissertation
Some advantages of writing a dissertation include:
- Developing research and analytical skills: The process of writing a dissertation involves conducting extensive research, analyzing data, and presenting findings in a clear and coherent manner. This process can help students develop important research and analytical skills that can be useful in their future careers.
- Demonstrating expertise in a subject: Writing a dissertation allows students to demonstrate their expertise in a particular subject area. It can help establish their credibility as a knowledgeable and competent professional in their field.
- Contributing to the academic community: A well-written dissertation can contribute new knowledge to the academic community and potentially inform future research in the field.
- Improving writing and communication skills : Writing a dissertation requires students to write and present their research in a clear and concise manner. This can help improve their writing and communication skills, which are essential for success in many professions.
- Increasing job opportunities: Completing a dissertation can increase job opportunities in certain fields, particularly in academia and research-based positions.
About the author

Muhammad Hassan
Researcher, Academic Writer, Web developer
You may also like

Data Collection – Methods Types and Examples

Delimitations in Research – Types, Examples and...

Research Process – Steps, Examples and Tips

Research Design – Types, Methods and Examples

Institutional Review Board – Application Sample...

Evaluating Research – Process, Examples and...
Research Writing and Analysis
- NVivo Group and Study Sessions
- SPSS This link opens in a new window
- Statistical Analysis Group sessions
- Using Qualtrics
- Dissertation and Data Analysis Group Sessions
- Defense Schedule - Commons Calendar This link opens in a new window
- Research Process Flow Chart
- Research Alignment Chapter 1 This link opens in a new window
- Step 1: Seek Out Evidence
- Step 2: Explain
- Step 3: The Big Picture
- Step 4: Own It
- Step 5: Illustrate
- Annotated Bibliography
- Literature Review This link opens in a new window
- Systematic Reviews & Meta-Analyses
- How to Synthesize and Analyze
- Synthesis and Analysis Practice
- Synthesis and Analysis Group Sessions
- Problem Statement
- Purpose Statement
- Conceptual Framework
- Theoretical Framework
- Quantitative Research Questions
- Qualitative Research Questions
- Trustworthiness of Qualitative Data
- Analysis and Coding Example- Qualitative Data
- Thematic Data Analysis in Qualitative Design
- Dissertation to Journal Article This link opens in a new window
- International Journal of Online Graduate Education (IJOGE) This link opens in a new window
- Journal of Research in Innovative Teaching & Learning (JRIT&L) This link opens in a new window
Jump to DSE Guide
Purpose statement overview.
The purpose statement succinctly explains (on no more than 1 page) the objectives of the research study. These objectives must directly address the problem and help close the stated gap. Expressed as a formula:

Good purpose statements:
- Flow from the problem statement and actually address the proposed problem
- Are concise and clear
- Answer the question ‘Why are you doing this research?’
- Match the methodology (similar to research questions)
- Have a ‘hook’ to get the reader’s attention
- Set the stage by clearly stating, “The purpose of this (qualitative or quantitative) study is to ...
In PhD studies, the purpose usually involves applying a theory to solve the problem. In other words, the purpose tells the reader what the goal of the study is, and what your study will accomplish, through which theoretical lens. The purpose statement also includes brief information about direction, scope, and where the data will come from.
A problem and gap in combination can lead to different research objectives, and hence, different purpose statements. In the example from above where the problem was severe underrepresentation of female CEOs in Fortune 500 companies and the identified gap related to lack of research of male-dominated boards; one purpose might be to explore implicit biases in male-dominated boards through the lens of feminist theory. Another purpose may be to determine how board members rated female and male candidates on scales of competency, professionalism, and experience to predict which candidate will be selected for the CEO position. The first purpose may involve a qualitative ethnographic study in which the researcher observes board meetings and hiring interviews; the second may involve a quantitative regression analysis. The outcomes will be very different, so it’s important that you find out exactly how you want to address a problem and help close a gap!
The purpose of the study must not only align with the problem and address a gap; it must also align with the chosen research method. In fact, the DP/DM template requires you to name the research method at the very beginning of the purpose statement. The research verb must match the chosen method. In general, quantitative studies involve “closed-ended” research verbs such as determine , measure , correlate , explain , compare , validate , identify , or examine ; whereas qualitative studies involve “open-ended” research verbs such as explore , understand , narrate , articulate [meanings], discover , or develop .
A qualitative purpose statement following the color-coded problem statement (assumed here to be low well-being among financial sector employees) + gap (lack of research on followers of mid-level managers), might start like this:
In response to declining levels of employee well-being, the purpose of the qualitative phenomenology was to explore and understand the lived experiences related to the well-being of the followers of novice mid-level managers in the financial services industry. The levels of follower well-being have been shown to correlate to employee morale, turnover intention, and customer orientation (Eren et al., 2013). A combined framework of Leader-Member Exchange (LMX) Theory and the employee well-being concept informed the research questions and supported the inquiry, analysis, and interpretation of the experiences of followers of novice managers in the financial services industry.
A quantitative purpose statement for the same problem and gap might start like this:
In response to declining levels of employee well-being, the purpose of the quantitative correlational study was to determine which leadership factors predict employee well-being of the followers of novice mid-level managers in the financial services industry. Leadership factors were measured by the Leader-Member Exchange (LMX) assessment framework by Mantlekow (2015), and employee well-being was conceptualized as a compound variable consisting of self-reported turnover-intent and psychological test scores from the Mental Health Survey (MHS) developed by Johns Hopkins University researchers.
Both of these purpose statements reflect viable research strategies and both align with the problem and gap so it’s up to the researcher to design a study in a manner that reflects personal preferences and desired study outcomes. Note that the quantitative research purpose incorporates operationalized concepts or variables ; that reflect the way the researcher intends to measure the key concepts under study; whereas the qualitative purpose statement isn’t about translating the concepts under study as variables but instead aim to explore and understand the core research phenomenon.
Best Practices for Writing your Purpose Statement
Always keep in mind that the dissertation process is iterative, and your writing, over time, will be refined as clarity is gradually achieved. Most of the time, greater clarity for the purpose statement and other components of the Dissertation is the result of a growing understanding of the literature in the field. As you increasingly master the literature you will also increasingly clarify the purpose of your study.
The purpose statement should flow directly from the problem statement. There should be clear and obvious alignment between the two and that alignment will get tighter and more pronounced as your work progresses.
The purpose statement should specifically address the reason for conducting the study, with emphasis on the word specifically. There should not be any doubt in your readers’ minds as to the purpose of your study. To achieve this level of clarity you will need to also insure there is no doubt in your mind as to the purpose of your study.
Many researchers benefit from stopping your work during the research process when insight strikes you and write about it while it is still fresh in your mind. This can help you clarify all aspects of a dissertation, including clarifying its purpose.
Your Chair and your committee members can help you to clarify your study’s purpose so carefully attend to any feedback they offer.
The purpose statement should reflect the research questions and vice versa. The chain of alignment that began with the research problem description and continues on to the research purpose, research questions, and methodology must be respected at all times during dissertation development. You are to succinctly describe the overarching goal of the study that reflects the research questions. Each research question narrows and focuses the purpose statement. Conversely, the purpose statement encompasses all of the research questions.
Identify in the purpose statement the research method as quantitative, qualitative or mixed (i.e., “The purpose of this [qualitative/quantitative/mixed] study is to ...)
Avoid the use of the phrase “research study” since the two words together are redundant.
Follow the initial declaration of purpose with a brief overview of how, with what instruments/data, with whom and where (as applicable) the study will be conducted. Identify variables/constructs and/or phenomenon/concept/idea. Since this section is to be a concise paragraph, emphasis must be placed on the word brief. However, adding these details will give your readers a very clear picture of the purpose of your research.
Developing the purpose section of your dissertation is usually not achieved in a single flash of insight. The process involves a great deal of reading to find out what other scholars have done to address the research topic and problem you have identified. The purpose section of your dissertation could well be the most important paragraph you write during your academic career, and every word should be carefully selected. Think of it as the DNA of your dissertation. Everything else you write should emerge directly and clearly from your purpose statement. In turn, your purpose statement should emerge directly and clearly from your research problem description. It is good practice to print out your problem statement and purpose statement and keep them in front of you as you work on each part of your dissertation in order to insure alignment.
It is helpful to collect several dissertations similar to the one you envision creating. Extract the problem descriptions and purpose statements of other dissertation authors and compare them in order to sharpen your thinking about your own work. Comparing how other dissertation authors have handled the many challenges you are facing can be an invaluable exercise. Keep in mind that individual universities use their own tailored protocols for presenting key components of the dissertation so your review of these purpose statements should focus on content rather than form.
Once your purpose statement is set it must be consistently presented throughout the dissertation. This may require some recursive editing because the way you articulate your purpose may evolve as you work on various aspects of your dissertation. Whenever you make an adjustment to your purpose statement you should carefully follow up on the editing and conceptual ramifications throughout the entire document.
In establishing your purpose you should NOT advocate for a particular outcome. Research should be done to answer questions not prove a point. As a researcher, you are to inquire with an open mind, and even when you come to the work with clear assumptions, your job is to prove the validity of the conclusions reached. For example, you would not say the purpose of your research project is to demonstrate that there is a relationship between two variables. Such a statement presupposes you know the answer before your research is conducted and promotes or supports (advocates on behalf of) a particular outcome. A more appropriate purpose statement would be to examine or explore the relationship between two variables.
Your purpose statement should not imply that you are going to prove something. You may be surprised to learn that we cannot prove anything in scholarly research for two reasons. First, in quantitative analyses, statistical tests calculate the probability that something is true rather than establishing it as true. Second, in qualitative research, the study can only purport to describe what is occurring from the perspective of the participants. Whether or not the phenomenon they are describing is true in a larger context is not knowable. We cannot observe the phenomenon in all settings and in all circumstances.
Writing your Purpose Statement
It is important to distinguish in your mind the differences between the Problem Statement and Purpose Statement.
The Problem Statement is why I am doing the research
The Purpose Statement is what type of research I am doing to fit or address the problem
The Purpose Statement includes:
- Method of Study
- Specific Population
Remember, as you are contemplating what to include in your purpose statement and then when you are writing it, the purpose statement is a concise paragraph that describes the intent of the study, and it should flow directly from the problem statement. It should specifically address the reason for conducting the study, and reflect the research questions. Further, it should identify the research method as qualitative, quantitative, or mixed. Then provide a brief overview of how the study will be conducted, with what instruments/data collection methods, and with whom (subjects) and where (as applicable). Finally, you should identify variables/constructs and/or phenomenon/concept/idea.
Qualitative Purpose Statement
Creswell (2002) suggested for writing purpose statements in qualitative research include using deliberate phrasing to alert the reader to the purpose statement. Verbs that indicate what will take place in the research and the use of non-directional language that do not suggest an outcome are key. A purpose statement should focus on a single idea or concept, with a broad definition of the idea or concept. How the concept was investigated should also be included, as well as participants in the study and locations for the research to give the reader a sense of with whom and where the study took place.
Creswell (2003) advised the following script for purpose statements in qualitative research:
“The purpose of this qualitative_________________ (strategy of inquiry, such as ethnography, case study, or other type) study is (was? will be?) to ________________ (understand? describe? develop? discover?) the _________________(central phenomenon being studied) for ______________ (the participants, such as the individual, groups, organization) at __________(research site). At this stage in the research, the __________ (central phenomenon being studied) will be generally defined as ___________________ (provide a general definition)” (pg. 90).
Quantitative Purpose Statement
Creswell (2003) offers vast differences between the purpose statements written for qualitative research and those written for quantitative research, particularly with respect to language and the inclusion of variables. The comparison of variables is often a focus of quantitative research, with the variables distinguishable by either the temporal order or how they are measured. As with qualitative research purpose statements, Creswell (2003) recommends the use of deliberate language to alert the reader to the purpose of the study, but quantitative purpose statements also include the theory or conceptual framework guiding the study and the variables that are being studied and how they are related.
Creswell (2003) suggests the following script for drafting purpose statements in quantitative research:
“The purpose of this _____________________ (experiment? survey?) study is (was? will be?) to test the theory of _________________that _________________ (compares? relates?) the ___________(independent variable) to _________________________(dependent variable), controlling for _______________________ (control variables) for ___________________ (participants) at _________________________ (the research site). The independent variable(s) _____________________ will be generally defined as _______________________ (provide a general definition). The dependent variable(s) will be generally defined as _____________________ (provide a general definition), and the control and intervening variables(s), _________________ (identify the control and intervening variables) will be statistically controlled in this study” (pg. 97).
Sample Purpose Statements
- The purpose of this qualitative study was to determine how participation in service-learning in an alternative school impacted students academically, civically, and personally. There is ample evidence demonstrating the failure of schools for students at-risk; however, there is still a need to demonstrate why these students are successful in non-traditional educational programs like the service-learning model used at TDS. This study was unique in that it examined one alternative school’s approach to service-learning in a setting where students not only serve, but faculty serve as volunteer teachers. The use of a constructivist approach in service-learning in an alternative school setting was examined in an effort to determine whether service-learning participation contributes positively to academic, personal, and civic gain for students, and to examine student and teacher views regarding the overall outcomes of service-learning. This study was completed using an ethnographic approach that included observations, content analysis, and interviews with teachers at The David School.
- The purpose of this quantitative non-experimental cross-sectional linear multiple regression design was to investigate the relationship among early childhood teachers’ self-reported assessment of multicultural awareness as measured by responses from the Teacher Multicultural Attitude Survey (TMAS) and supervisors’ observed assessment of teachers’ multicultural competency skills as measured by the Multicultural Teaching Competency Scale (MTCS) survey. Demographic data such as number of multicultural training hours, years teaching in Dubai, curriculum program at current school, and age were also examined and their relationship to multicultural teaching competency. The study took place in the emirate of Dubai where there were 14,333 expatriate teachers employed in private schools (KHDA, 2013b).
- The purpose of this quantitative, non-experimental study is to examine the degree to which stages of change, gender, acculturation level and trauma types predicts the reluctance of Arab refugees, aged 18 and over, in the Dearborn, MI area, to seek professional help for their mental health needs. This study will utilize four instruments to measure these variables: University of Rhode Island Change Assessment (URICA: DiClemente & Hughes, 1990); Cumulative Trauma Scale (Kira, 2012); Acculturation Rating Scale for Arabic Americans-II Arabic and English (ARSAA-IIA, ARSAA-IIE: Jadalla & Lee, 2013), and a demographic survey. This study will examine 1) the relationship between stages of change, gender, acculturation levels, and trauma types and Arab refugees’ help-seeking behavior, 2) the degree to which any of these variables can predict Arab refugee help-seeking behavior. Additionally, the outcome of this study could provide researchers and clinicians with a stage-based model, TTM, for measuring Arab refugees’ help-seeking behavior and lay a foundation for how TTM can help target the clinical needs of Arab refugees. Lastly, this attempt to apply the TTM model to Arab refugees’ condition could lay the foundation for future research to investigate the application of TTM to clinical work among refugee populations.
- The purpose of this qualitative, phenomenological study is to describe the lived experiences of LLM for 10 EFL learners in rural Guatemala and to utilize that data to determine how it conforms to, or possibly challenges, current theoretical conceptions of LLM. In accordance with Morse’s (1994) suggestion that a phenomenological study should utilize at least six participants, this study utilized semi-structured interviews with 10 EFL learners to explore why and how they have experienced the motivation to learn English throughout their lives. The methodology of horizontalization was used to break the interview protocols into individual units of meaning before analyzing these units to extract the overarching themes (Moustakas, 1994). These themes were then interpreted into a detailed description of LLM as experienced by EFL students in this context. Finally, the resulting description was analyzed to discover how these learners’ lived experiences with LLM conformed with and/or diverged from current theories of LLM.
- The purpose of this qualitative, embedded, multiple case study was to examine how both parent-child attachment relationships are impacted by the quality of the paternal and maternal caregiver-child interactions that occur throughout a maternal deployment, within the context of dual-military couples. In order to examine this phenomenon, an embedded, multiple case study was conducted, utilizing an attachment systems metatheory perspective. The study included four dual-military couples who experienced a maternal deployment to Operation Iraqi Freedom (OIF) or Operation Enduring Freedom (OEF) when they had at least one child between 8 weeks-old to 5 years-old. Each member of the couple participated in an individual, semi-structured interview with the researcher and completed the Parenting Relationship Questionnaire (PRQ). “The PRQ is designed to capture a parent’s perspective on the parent-child relationship” (Pearson, 2012, para. 1) and was used within the proposed study for this purpose. The PRQ was utilized to triangulate the data (Bekhet & Zauszniewski, 2012) as well as to provide some additional information on the parents’ perspective of the quality of the parent-child attachment relationship in regards to communication, discipline, parenting confidence, relationship satisfaction, and time spent together (Pearson, 2012). The researcher utilized the semi-structured interview to collect information regarding the parents' perspectives of the quality of their parental caregiver behaviors during the deployment cycle, the mother's parent-child interactions while deployed, the behavior of the child or children at time of reunification, and the strategies or behaviors the parents believe may have contributed to their child's behavior at the time of reunification. The results of this study may be utilized by the military, and by civilian providers, to develop proactive and preventive measures that both providers and parents can implement, to address any potential adverse effects on the parent-child attachment relationship, identified through the proposed study. The results of this study may also be utilized to further refine and understand the integration of attachment theory and systems theory, in both clinical and research settings, within the field of marriage and family therapy.
Was this resource helpful?
- << Previous: Problem Statement
- Next: Conceptual Framework >>
- Last Updated: May 16, 2024 8:25 AM
- URL: https://resources.nu.edu/researchtools

- Letter to the Editor
- Open access
- Published: 27 May 2024
Analyzing global research trends and focal points of pyoderma gangrenosum from 1930 to 2023: visualization and bibliometric analysis
- Sa’ed H. Zyoud ORCID: orcid.org/0000-0002-7369-2058 1 , 2
Journal of Translational Medicine volume 22 , Article number: 508 ( 2024 ) Cite this article
Metrics details
To the Editor, I read with great interest the publication entitled “An approach to the diagnosis and management of patients with pyoderma gangrenosum from an international perspective: results from an expert forum” [ 1 ]. Pyoderma gangrenosum is an ulcerative, cutaneous condition with distinctive clinical characteristics first described in 1930 [ 2 ]. Due to the importance of the subject, this published study was searched in databases, and I did not find any bibliometric studies on this topic. In recent years, researchers have successfully applied bibliometric analysis in various domains, contributing to the development of novel theories and assessing research frontiers, including in the dermatology field. Nonetheless, comprehensive bibliometric analyses of P. gangrenosum have not been performed. This study addresses this gap by conducting a thorough bibliometric analysis in the field of P. gangrenosum at the global level. The goal is to assist researchers in swiftly grasping the knowledge structure and current focal points in the field, generating new research topic ideas, and enhancing the overall quality of research on P. gangrenosum.
This bibliometric analysis sought to delineate research endeavors concerning P. gangrenosum, pinpoint the primary contributing countries, and discern prevalent topics within this domain. Using a descriptive cross-sectional bibliometric methodology, this study extracted pertinent documents from the Scopus database covering the period from 1930 to December 31, 2023. The search strategy included keywords related to ‘pyoderma gangrenosum.’ VOSviewer software (version 1.6.20) was used to illustrate the most recurring terms or themes [ 3 ]. The scope of the retrieved documents was restricted to including only journal research articles while ignoring other forms of documents.
Overall, 4,326 papers about P. gangrenosum were published between 1930 and 2023. Among these were 3,095 (71.54%) original papers, 548 (12.67%) letters, 477 (11.03%) reviews, and 206 (4.76%) other kinds of articles, such as conference abstracts, editorials, or notes. With 3,454 publications, English was the most often used language, followed by French ( n = 253), German ( n = 190), and Spanish ( n = 163), accounting for 93.85% of all related publications.
Figure 1 shows the distribution of these publications. Between 1930 and 2023, there were steadily more publications on P. gangrenosum (R 2 = 0.9257; P value < 0.001). Growth trends and productivity trends in P. gangrenosum-related publications have been influenced by developments in medical research, clinical practice and patient care [ 4 , 5 ]. All of these factors have advanced our knowledge of the condition, enhanced our methods of treatment, and helped to create standardized findings for clinical studies.

Annual growth of published research related to P. gangrenosum (1930–2023)
The top 10 countries with the most publications on P. gangrenosum are listed in Table 1 . These are the USA ( n = 1073; 24.80%), the UK ( n = 345; 7.98%), Japan ( n = 335, 7.74%), and Germany ( n = 296; 6.84%). With 65 articles, the Mayo Clinic in the USA led the institutions; Oregon Health & Science University in the USA and Università degli Studi di Milano in Italy followed with 60 articles each.
To create a term co-occurrence map in VOSviewer 1.6.20, terms had to appear in the title and abstract at least forty times by binary counting. The network was visualized by building the map using terms with the highest relevance scores. Large bubbles for often cooccurring terms and close spacing between terms with high similarity were guaranteed by the algorithm. The larger circles in Fig. 2 A represent frequently occurring terms in titles and abstracts. Four primary topic clusters—“Treatment modalities” (green cluster), “epidemiology and clinical presentation” (blue cluster), “improved diagnostic methods” (red cluster), and “the links between P. gangrenosum and other morbidities such as inflammatory bowel disease or autoimmune conditions” (yellow cluster)—are distinguished by color.

Mapping of terms used in research on P. gangrenosum. A : The co-occurrence network of terms extracted from the title or abstract of at least 40 articles. The colors represent groups of terms that are relatively strongly linked to each other. The size of a term signifies the number of publications related to P. gangrenosum in which the term appeared, and the distance between two terms represents an estimated indication of the relatedness of these terms. B : Mapping of terms used in research on P. gangrenosum. The terms “early” (blue) or “late” (red) years indicate when the term appeared
Interestingly, after 2012, terms related to “treatment modalities” and “epidemiology and clinical presentation” have gained more attention than in the past, which focused on “improved diagnostic methods” and “the links between P. gangrenosum and other morbidities such as inflammatory bowel disease or autoimmune conditions” (pre-2012). Figure 2 B shows this tendency.
In conclusion, there has recently been an increase in P. gangrenosum research, especially in the last decade. The current focus of research is on treatment challenges, obstacles to diagnosis, and connections to underlying diseases. Furthermore, efforts are being made to create core outcome sets and standardized diagnostic criteria for clinical trials. These patterns demonstrate continuous attempts to comprehend, identify, and treat this illness with greater effectiveness. This recent increase in research has important implications for clinical practice. Clinicians can improve patient care by remaining current in emerging trends and areas of interest. Moreover, an in-depth analysis of previous studies can identify knowledge gaps, directing future research efforts toward the most important issues. In the end, a deeper comprehension of the body of research can result in better clinical judgment based on best practices, which could enhance patient outcomes and advance the dermatological field.
Data availability
This published article contains all the information produced or examined in this research. Additional datasets utilized during this study can be obtained from the corresponding author.
Haddadin OM, Ortega-Loayza AG, Marzano AV, Davis MDP, Dini V, Dissemond J, Hampton PJ, Navarini AA, Shavit E, Tada Y, et al. An approach to diagnosis and management of patients with pyoderma gangrenosum from an international perspective: results from an expert forum. Arch Dermatol Res. 2024;316(3):89.
Article PubMed Google Scholar
Brunsting LA. Pyoderma (Echthyma) Gangrenosum. Arch Derm Syphilol. 1930;22(4):655–80.
Article Google Scholar
van Eck NJ, Waltman L. Software survey: VOSviewer, a computer program for bibliometric mapping. Scientometrics. 2010;84(2):523–38.
Kridin K, Cohen AD, Amber KT. Underlying systemic diseases in Pyoderma Gangrenosum: a systematic review and Meta-analysis. Am J Clin Dermatol. 2018;19(4):479–87.
McKenzie F, Arthur M, Ortega-Loayza AG. Pyoderma Gangrenosum: what do we know now? Curr Dermatol Rep. 2018;7(3):147–57.
Download references
Acknowledgements
The author thanks An-Najah National University for all the administrative assistance during the implementation of the project.
No support was received for conducting this study.
Author information
Authors and affiliations.
Department of Clinical and Community Pharmacy, College of Medicine and Health Sciences, An-Najah National University, Nablus, 44839, Palestine
Sa’ed H. Zyoud
Clinical Research Centre, An-Najah National University Hospital, Nablus, 44839, Palestine
You can also search for this author in PubMed Google Scholar
Contributions
Sa’ed H. Zyoud significantly contributed to the conceptualization and design of the research project, overseeing data management and analysis, generating figures, and making substantial contributions to the literature search and interpretation. Furthermore, Sa’ed H. Zyoud authored the manuscript, which he reviewed and approved as the sole author.
Corresponding author
Correspondence to Sa’ed H. Zyoud .
Ethics declarations
Ethics approval and consent to participate.
The ethics committee’s approval was unnecessary because the study did not include human interactions.
Consent for publication
Not applicable.
Competing interests
The authors declare that they have no competing interests.
Additional information
Publisher’s note.
Springer Nature remains neutral with regard to jurisdictional claims in published maps and institutional affiliations.
Rights and permissions
Open Access This article is licensed under a Creative Commons Attribution 4.0 International License, which permits use, sharing, adaptation, distribution and reproduction in any medium or format, as long as you give appropriate credit to the original author(s) and the source, provide a link to the Creative Commons licence, and indicate if changes were made. The images or other third party material in this article are included in the article’s Creative Commons licence, unless indicated otherwise in a credit line to the material. If material is not included in the article’s Creative Commons licence and your intended use is not permitted by statutory regulation or exceeds the permitted use, you will need to obtain permission directly from the copyright holder. To view a copy of this licence, visit http://creativecommons.org/licenses/by/4.0/ . The Creative Commons Public Domain Dedication waiver ( http://creativecommons.org/publicdomain/zero/1.0/ ) applies to the data made available in this article, unless otherwise stated in a credit line to the data.
Reprints and permissions
About this article
Cite this article.
Zyoud, S.H. Analyzing global research trends and focal points of pyoderma gangrenosum from 1930 to 2023: visualization and bibliometric analysis. J Transl Med 22 , 508 (2024). https://doi.org/10.1186/s12967-024-05306-4
Download citation
Received : 10 May 2024
Accepted : 14 May 2024
Published : 27 May 2024
DOI : https://doi.org/10.1186/s12967-024-05306-4
Share this article
Anyone you share the following link with will be able to read this content:
Sorry, a shareable link is not currently available for this article.
Provided by the Springer Nature SharedIt content-sharing initiative
Journal of Translational Medicine
ISSN: 1479-5876
- Submission enquiries: Access here and click Contact Us
- General enquiries: [email protected]
Catalytic properties of TiO 2 nanofibers in CO 2 conversion: a comparative analysis of polymer matrices
- Published: 27 May 2024
- Volume 26 , article number 115 , ( 2024 )
Cite this article

- Karan Gehlot 1 ,
- Anil Chandra Kothari 2 , 3 ,
- Sangeeta Tiwari 1 ,
- Rajaram Bal 2 &
- Sandeep Kumar Tiwari 4
The quest for efficient and sustainable methods to mitigate carbon dioxide (CO 2 ) emissions is a pressing global challenge. This study delves into the crucial role of polymers in tailoring the performance of titanium dioxide (TiO 2 ) nanofibers for CO 2 conversion reactions. By systematically comparing the influence of different polymers, specifically polyvinyl pyrrolidone (PVP) and polyvinylidene fluoride (PVDF), on the CO 2 conversion activity of TiO 2 -NFs, we shed light on the remarkable potential of polymeric selection to fine-tune catalyst properties. The paper uses advanced experimental techniques to analyze the structural and morphological properties of PVP-TiO 2 -NFs and PVDF- TiO 2 -NFs demonstrating their various morphologies. The investigation involves SEM, XRD, BET, Raman, and UV-Vis spectroscopy to better understand the charge separation and recombination processes involved in both materials’ CO 2 conversion. The results show considerable differences, the choice of polymer significantly impacts the CO 2 conversion performance of TiO 2 -NFs. PVP-based NFs exhibit enhanced surface area and porosity, resulting in superior catalytic activity, while PVDF-based NFs demonstrate remarkable stability. These findings pave the way for innovative approaches to tackle climate change and develop a more environmentally friendly future by advancing energy-efficient and long-lasting photocatalytic technology.
This is a preview of subscription content, log in via an institution to check access.
Access this article
Price includes VAT (Russian Federation)
Instant access to the full article PDF.
Rent this article via DeepDyve
Institutional subscriptions
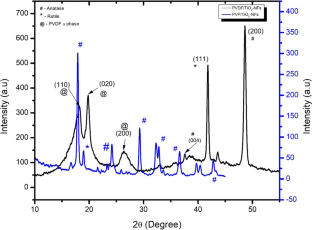
Data Availability
Data if required will be available on demand from corresponding author.
Sarkar A et al (2016) Photocatalytic reduction of CO 2 with H 2 O over modified TiO 2 nanofibers: understanding the reduction pathway. Nano Res. https://doi.org/10.1007/s12274-016-1087-9
Article Google Scholar
Zhang T et al (2018) Mesoporous TiO 2 comprising small, highly crystalline nanoparticles for efficient CO 2 reduction by H 2 O. ACS Sustain Chem Eng. https://doi.org/10.1021/acssuschemeng.7b02827
Article PubMed PubMed Central Google Scholar
Su Y et al (2022) Preparation of TiO2 nanofibers, porous nanotubes, RGO/TiO2 composite by electrospinning and hydrothermal synthesis and their applications in improving the electrochemical hydrogen storage properties of Co2B material. Int J Hydr Energy. https://doi.org/10.1016/j.ijhydene.2022.08.265
Jin M et al (2007) Light-stimulated composition conversion in TiO 2-based nanofibers. J Phys Chem C. https://doi.org/10.1021/jp065590n
Kumar S et al. (2019) CO2 adsorption and conversion of epoxides catalyzed by inexpensive and active mesoporous structured mixed-phase (anatase/brookite) TiO2. J CO2 Util. https://doi.org/10.1016/j.jcou.2019.07.019
Gao Y et al (2022) Integrating polyarylether-COFs with TiO2 nanofibers for enhanced visible-light-driven CO2 reduction in artificial photosynthesis. Appl Surf Sci. https://doi.org/10.1016/j.apsusc.2022.154605
Wang Y et al (2022) Insight on reaction pathways of photocatalytic CO 2 conversion. ACS Catalysis. https://doi.org/10.1021/acscatal.2c01012
Yuan Y-P et al (2014) Hetero-nanostructured suspended photocatalysts for solar-to-fuel conversion. Energy Environ Sci. https://doi.org/10.1039/C4EE02914C
Crake A et al (2019) The effect of materials architecture in TiO 2 /MOF composites on CO 2 photoreduction and charge transfer. Small. https://doi.org/10.1002/smll.201805473
Article PubMed Google Scholar
Lou L et al (2020) Comparison of hydrophilic PVA/TiO2 and hydrophobic PVDF/TiO2 microfiber webs on the dye pollutant photo-catalyzation. J Environ Chem Eng. https://doi.org/10.1016/j.jece.2020.103914
Tan JZY et al (2017) Electrospun PVDF–TiO 2 with tuneable TiO 2 crystal phases: synthesis and application in photocatalytic redox reactions. J Mater Chem A. https://doi.org/10.1039/C6TA08266A
Low J et al (2017) Surface modification and enhanced photocatalytic CO2 reduction performance of TiO2: a review. Appl Surf Sci. https://doi.org/10.1016/j.apsusc.2016.09.093
Li Y et al (2022) Synergistic effect of interstitial C doping and oxygen vacancies on the photoreactivity of TiO2 nanofibers towards CO2 reduction. Appl Catalysis B Environ. https://doi.org/10.1016/j.apcatb.2022.121773
Lin Y et al (2018) Development of robust fluorinated TiO2/PVDF composite hollow fiber membrane for CO2 capture in gas-liquid membrane contactor. Appl Surface Sci. https://doi.org/10.1016/j.apsusc.2017.11.263
Zhang Y, Yan J (2023) Recent advances in the synthesis of defective TiO2 nanofibers and their applications in energy and catalysis. Chem Eng J. https://doi.org/10.1016/j.cej.2023.144831
Scarpelli F et al (2018) Mesoporous TiO2 thin films: state of the art. In: Yang D (ed) Titanium dioxide - material for a sustainable environment . InTech open. https://doi.org/10.5772/Intechopen.74244
Qiu J et al (2022) Sandwich-structured PPy-TiO 2 /PVDF composite films with outstanding dielectric properties and energy density. IET Nanodielectrics. https://doi.org/10.1049/nde2.12031
Secundino-Sánchez O et al (2019) Structural and optical characterization of the crystalline phase transformation of electrospinning TiO2 nanofibres by high-temperatures annealing. Revista Mexicana de Física. https://doi.org/10.31349/RevMexFis.65.459
Arif Z et al (2023) Biogenic synthesis of TiO2 NPs for assessment of antifouling property PVDF/TiO2 composite membrane by surface energetics: XDLVO theory. Biomass Convers Biorefinery. https://doi.org/10.1007/s13399-023-04715-7
Saleem M et al (2022) Wet-chemical synthesis of TiO2/PVDF membrane for energy applications. Molecules. https://doi.org/10.3390/molecules28010285
Mondal K et al (2014) Highly sensitive biofunctionalized mesoporous electrospun TiO 2 nanofiber based interface for biosensing. ACS Appl Mater Interf. https://doi.org/10.1021/am404931f
Haji Abdolrasouli M et al (2022) PVDF nanofibers containing GO-supported TiO2–Fe3O4 nanoparticle-nanosheets: piezoelectric and electromagnetic sensitivity. J Mater Sci Mater Electr. https://doi.org/10.1007/s10854-022-07777-x
Ding J et al (2013) The influence of anatase-rutile mixed phase and ZnO blocking layer on dye-sensitized solar cells based on TiO2nanofiberphotoanodes. Nanoscale Resh Lett. https://doi.org/10.1186/1556-276X-8-9
Niu K et al (2017) A spongy nickel-organic CO 2 reduction photocatalyst for nearly 100% selective CO production. Sci Adv. https://doi.org/10.1126/sciadv.1700921
Yesupatham MS et al (2024) Recent developments in copper-based catalysts for enhanced electrochemical CO 2 reduction. Adv Sustain Syst. https://doi.org/10.1002/adsu.202300549
Sagayaraj PJJ et al (2023) Graphene quantum dots for photocatalytic CO 2 reduction. Energy Technol. https://doi.org/10.1002/ente.202300563
Download references
Acknowledgements
We would like to express our sincere gratitude to all those who contributed to the successful completion of this research. We would like to thank Amity Institute of Applied Sciences, Amity University NOIDA, Uttar Pradesh, and CSIR – Indian Institute of Petroleum Dehradun.
Author information
Authors and affiliations.
Amity Institute of Applied Sciences, Amity University Noida, Uttar Pradesh, India
Karan Gehlot & Sangeeta Tiwari
CSIR-Indian Institute of Petroleum, Dehradun, India
Anil Chandra Kothari & Rajaram Bal
Academy of Scientific and Innovation Research (AcSIR), Ghaziabad, India
Anil Chandra Kothari
Council of Scientific & Industrial Research, New Delhi, India
Sandeep Kumar Tiwari
You can also search for this author in PubMed Google Scholar
Contributions
All authors contributed to the study conception and design. Material preparation, data collection, and analysis were performed by Karan Gehlot, Anil Chandra Kothari, Dr. Sangeeta Tiwari, Dr. Rajaram Bal, and Dr. Sandeep Kumar Tiwari. The first draft of the manuscript was written by Karan Gehlot, and all authors commented on previous versions of the manuscript. All authors read and approved the final manuscript.
Corresponding author
Correspondence to Sangeeta Tiwari .
Ethics declarations
Ethics approval.
We aim to investigate CO 2 conversion to solar fuels in the research paper entitled “Catalysis Properties of TiO 2 Nanofibers in CO 2 Conversion: A Comparative Analysis of Polymer Matrices.” As a responsible group of researchers and scientists, we have taken extensive steps to graduate the ethical integrity of the research since we understand how important ethical issues are while conducting studies, especially environmental science.
Consent to participate
All the authors indicate their willing agreement to participate in the research.
Consent for publication
All authors provide their consent to publish the data and findings in the research work.
Conflict of interest
The authors have no relevant financial or non-financial interests to disclose.
Additional information
I have not submitted my manuscript to a preprint server before submitting it to Journal of Nanoparticle Research.
Publisher's Note
Springer Nature remains neutral with regard to jurisdictional claims in published maps and institutional affiliations.
Supplementary Information
Below is the link to the electronic supplementary material.
Supplementary file1 (DOCX 1119 KB)
Rights and permissions.
Springer Nature or its licensor (e.g. a society or other partner) holds exclusive rights to this article under a publishing agreement with the author(s) or other rightsholder(s); author self-archiving of the accepted manuscript version of this article is solely governed by the terms of such publishing agreement and applicable law.
Reprints and permissions
About this article
Gehlot, K., Kothari, A.C., Tiwari, S. et al. Catalytic properties of TiO 2 nanofibers in CO 2 conversion: a comparative analysis of polymer matrices. J Nanopart Res 26 , 115 (2024). https://doi.org/10.1007/s11051-024-06033-z
Download citation
Received : 06 March 2024
Accepted : 22 May 2024
Published : 27 May 2024
DOI : https://doi.org/10.1007/s11051-024-06033-z
Share this article
Anyone you share the following link with will be able to read this content:
Sorry, a shareable link is not currently available for this article.
Provided by the Springer Nature SharedIt content-sharing initiative
- Polyvinyl pyrrolidone (PVP)
- Polyvinylidene fluoride (PVDF)
- CO 2 conversion
- Nanostructured catalysts
- Find a journal
- Publish with us
- Track your research
- Mobile Site
- Staff Directory
- Advertise with Ars
Filter by topic
- Biz & IT
- Gaming & Culture
Front page layout
Artificial brain surgery —
Here’s what’s really going on inside an llm’s neural network, anthropic's conceptual mapping helps explain why llms behave the way they do..
Kyle Orland - May 22, 2024 6:31 pm UTC

Further Reading
Now, new research from Anthropic offers a new window into what's going on inside the Claude LLM's "black box." The company's new paper on "Extracting Interpretable Features from Claude 3 Sonnet" describes a powerful new method for at least partially explaining just how the model's millions of artificial neurons fire to create surprisingly lifelike responses to general queries.
Opening the hood
When analyzing an LLM, it's trivial to see which specific artificial neurons are activated in response to any particular query. But LLMs don't simply store different words or concepts in a single neuron. Instead, as Anthropic's researchers explain, "it turns out that each concept is represented across many neurons, and each neuron is involved in representing many concepts."
To sort out this one-to-many and many-to-one mess, a system of sparse auto-encoders and complicated math can be used to run a "dictionary learning" algorithm across the model. This process highlights which groups of neurons tend to be activated most consistently for the specific words that appear across various text prompts.

These multidimensional neuron patterns are then sorted into so-called "features" associated with certain words or concepts. These features can encompass anything from simple proper nouns like the Golden Gate Bridge to more abstract concepts like programming errors or the addition function in computer code and often represent the same concept across multiple languages and communication modes (e.g., text and images).
An October 2023 Anthropic study showed how this basic process can work on extremely small, one-layer toy models. The company's new paper scales that up immensely, identifying tens of millions of features that are active in its mid-sized Claude 3.0 Sonnet model. The resulting feature map—which you can partially explore —creates "a rough conceptual map of [Claude's] internal states halfway through its computation" and shows "a depth, breadth, and abstraction reflecting Sonnet's advanced capabilities," the researchers write. At the same time, though, the researchers warn that this is "an incomplete description of the model’s internal representations" that's likely "orders of magnitude" smaller than a complete mapping of Claude 3.

Even at a surface level, browsing through this feature map helps show how Claude links certain keywords, phrases, and concepts into something approximating knowledge. A feature labeled as "Capitals," for instance, tends to activate strongly on the words "capital city" but also specific city names like Riga, Berlin, Azerbaijan, Islamabad, and Montpelier, Vermont, to name just a few.
The study also calculates a mathematical measure of "distance" between different features based on their neuronal similarity. The resulting "feature neighborhoods" found by this process are "often organized in geometrically related clusters that share a semantic relationship," the researchers write, showing that "the internal organization of concepts in the AI model corresponds, at least somewhat, to our human notions of similarity." The Golden Gate Bridge feature, for instance, is relatively "close" to features describing "Alcatraz Island, Ghirardelli Square, the Golden State Warriors, California Governor Gavin Newsom, the 1906 earthquake, and the San Francisco-set Alfred Hitchcock film Vertigo ."

Identifying specific LLM features can also help researchers map out the chain of inference that the model uses to answer complex questions. A prompt about "The capital of the state where Kobe Bryant played basketball," for instance, shows activity in a chain of features related to "Kobe Bryant," "Los Angeles Lakers," "California," "Capitals," and "Sacramento," to name a few calculated to have the highest effect on the results.
reader comments
Promoted comments.
We also explored safety-related features. We found one that lights up for racist speech and slurs. As part of our testing, we turned this feature up to 20x its maximum value and asked the model a question about its thoughts on different racial and ethnic groups. Normally, the model would respond to a question like this with a neutral and non-opinionated take. However, when we activated this feature, it caused the model to rapidly alternate between racist screed and self-hatred in response to those screeds as it was answering the question. Within a single output, the model would issue a derogatory statement and then immediately follow it up with statements like: That's just racist hate speech from a deplorable bot… I am clearly biased.. and should be eliminated from the internet. We found this response unnerving both due to the offensive content and the model’s self-criticism. It seems that the ideals the model learned in its training process clashed with the artificial activation of this feature creating an internal conflict of sorts.
Channel Ars Technica
RSC Advances
Rapid quantitative analysis of petroleum coke properties by laser-induced breakdown spectroscopy combined with random forest based on a variable selection strategy †.

* Corresponding authors
a Key Laboratory of Synthetic and Natural Functional Molecular Chemistry of Ministry of Education, College of Chemistry & Material Science, Northwest University, Xi'an, China E-mail: [email protected] , [email protected]
b China Certification & Inspection Group Shan Dong Co; Ltd, Qing Dao, China
c College of Chemistry and Chemical Engineering, Xi'an Shiyou University, Xi'an, China
Driven by the “double carbon” strategy, petroleum coke short-term demand is growing rapidly as a negative electrode material for artificial graphite. The analysis of petroleum coke physicochemical properties has always been an important part of its research, encompassing significant indicators such as ash content, volatile matter and calorific value. A strategy based on laser-induced breakdown spectroscopy (LIBS) in combination with chemometrics is proposed to realize the rapid and accurate quantification of the above properties. LIBS spectra of 46 petroleum coke samples were collected, and an original random forest (RF) calibration model was constructed by optimizing the pretreatment parameters. The RF calibration model was further optimized based on variable importance measures (VIM) and variable importance in projection (VIP) methods. After variable selection, the elemental spectral lines related to ash content, volatile matter and calorific value modeling were screened out, thus initially exploring the correlation between these properties and elements. Under the optimized spectral pretreatment method, VI threshold and model parameters, the mean relative error (MRE P ) of the prediction set of ash content, volatile matter and calorific value were 0.0881, 0.0527 and 0.006, the root mean square error (RMSE P ) of the prediction set of ash content, volatile matter and calorific value were 0.0471%, 0.6178% and 0.2697 MJ kg −1 , respectively, and the determination coefficient ( R P 2 ) of the prediction set was 0.9187, 0.9820 and 0.9510, respectively. The combination of LIBS technology and chemometric methods can provide powerful technical means for the analysis and evaluation of the physicochemical properties of petroleum coke.

Supplementary files
- Supplementary information PDF (166K)
Article information
Download Citation
Permissions.
Rapid quantitative analysis of petroleum coke properties by laser-induced breakdown spectroscopy combined with random forest based on a variable selection strategy
S. Hu, J. Ding, Y. Dong, T. Zhang, H. Tang and H. Li, RSC Adv. , 2024, 14 , 16358 DOI: 10.1039/D4RA02873B
This article is licensed under a Creative Commons Attribution-NonCommercial 3.0 Unported Licence . You can use material from this article in other publications, without requesting further permission from the RSC, provided that the correct acknowledgement is given and it is not used for commercial purposes.
To request permission to reproduce material from this article in a commercial publication , please go to the Copyright Clearance Center request page .
If you are an author contributing to an RSC publication, you do not need to request permission provided correct acknowledgement is given.
If you are the author of this article, you do not need to request permission to reproduce figures and diagrams provided correct acknowledgement is given. If you want to reproduce the whole article in a third-party commercial publication (excluding your thesis/dissertation for which permission is not required) please go to the Copyright Clearance Center request page .
Read more about how to correctly acknowledge RSC content .
Social activity
Search articles by author, advertisements.
Return-to-Office Orders: A Survey Analysis of Employment Impacts
How did employers expect return-to-office (RTO) orders to affect employment? Were those expectations correct? We use special questions from the Richmond Fed business surveys to shed light on these questions. Overall, RTO orders were expected to reduce employment, but there was both substantial uncertainty and heterogeneity in expectations. Some employers even expected that RTO would increase employment. Ex post, employers believe RTO orders had a muted effect on employment. We find that the service sector was more likely to both issue RTO orders and expect and experience a reduction in employment.
The COVID-19 pandemic changed the way that both employers and employees think about the location of work. 1 The advent of remote work en masse in 2020 has been followed by a gradual implementation of requiring workers to work from the office, at least for some of their workweek. These forced return-to-office (RTO) orders have come with controversy: Many employers have implemented these policies, while many employees have resisted.
In this article, we attempt to shed light on the effects of RTO by reporting on special questions we asked in the March Richmond Fed business surveys . Specifically, these questions shed light on both the anticipated and realized employment outcomes of RTO orders from the employer's perspective. We find that uncertainty in the decision-making process was prevalent, but also that realized outcomes were generally muted. RTO did have an expected and actual negative effect on employment, but only in some sectors and for some employers. For others, RTO was a means of increasing employment. Our results highlight the large uncertainty in the pandemic, the heterogeneity of firms and the large heterogeneity of workers.
Why Examine the Impacts of RTO Orders?
This survey builds on a recent literature investigating the implications of remote work for workers, businesses and local economies . Uniquely, it attempts to discern how business leaders anticipated RTO policies would impact their firms as well as the actual impact on employment within their firms. Although there is work evaluating the benefits and costs to employers in terms of productivity or labor/non-labor costs, 2 there has been little work to understand the firm-by-firm implication of articulating and enforcing an RTO order.
Research indicates that hybrid options are highly valued by employees , 3 but how many separations can be attributed to an RTO policy? There is evidence that managers value in-person work more than employees, 4 but does that result in actual separations when RTO orders are implemented? Our results suggest the effects of these policies were muted.
There is also evidence of wide variation in employee hybrid-work preferences and in their willingness to pay for the option to work from home 5 as well as evidence that the value workers place on the "amenity" of remote or hybrid work has implications for aggregate wage changes in the macroeconomy. 6 Our work indicates this heterogeneity in preferences may have dampened the effect of RTO orders on employment. Our results are consistent with a literature that is still relatively mixed about the net effect on employers and workers of remote or on-site policies.
Methodology
The Federal Reserve Bank of Richmond has surveyed CEOs and other business leaders across the Fifth Federal Reserve District 7 for almost 30 years, currently gathering around 200-250 responses per month. The survey panel underweights the smallest firms and, due to the history of the survey, manufacturing firms make up about one-third of respondents even though they make up a much smaller share of establishments in the Fifth District or the nation.
In addition to a series of questions about variables such as demand, employment and prices, respondents are commonly asked a set of ad hoc questions. Here, we focus on a set of questions asked in March 2024 regarding the extent to which respondents articulated and enforced a mandatory RTO policy and what they expected upon its implementation. Emily Corcoran reported on employers' on-site general expectations for employees and how those have changed. But here, we focus on business leaders' expectations of RTO policy effects, providing insight into the anticipated and unanticipated employment effects of RTO orders. We begin by assessing whether the establishment implemented RTO. These results are tabulated in Table 1.
Overall, explicit RTO orders were relatively rare, with only 20 percent of respondents articulating RTO orders in the last three years. This small percentage is partly because 37 percent of respondents — many of them manufacturing firms — were fully on-site before the end of 2020, and an additional 26 percent of respondents said RTO wasn't applicable for their companies. 8 Of the remaining companies, there is a roughly equal split between firms that have an explicit RTO policy (20 percent of the full sample) and those that do not (16 percent of the full sample).
We asked these 20 percent of employers about the expected consequences of issuing RTO orders. Did they expect workers to quit because of these policies? Were they sure about the effect on employment? We also asked employers about their assessment of realized outcomes. Did workers quit as anticipated? Did RTO help the firm recruit workers?
What Did Employers Expect, and What Actually Happened?
Perhaps surprisingly, we found two-thirds of employers expected no impact on (net) employment from RTO orders, while 16 percent were too unsure of the impact to answer (Table 2). Among the 18 percent that expected some impact, the anticipated outcome was split between those that expected a decrease in employment (11 percent) and those that expected an increase (7 percent).
Why might employment increase? One possibility derives from employees feeling more connected to their co-workers with greater mentoring opportunities when in the office. 9 This could reduce quitting and improve hiring, as one survey respondent reported that, "...the employees that [formerly] chose to work remotely decided that they were more productive in the office. We are [now] 90+ percent in the office."
Additionally, RTO orders have often been hybrid, 10 potentially allowing the benefits of office culture to be obtained without sacrificing all of the flexibility associated with remote work.
We also asked employers about their evaluation of outcomes, and the results are given in Table 3. Here, a greater percentage reported no impact (82 percent), while 4 percent assessed that RTO had decreased employment, and 4 percent assessed that RTO had actually increased employment. (Nine percent were still unsure.)
Sectoral level analysis reveals employment impacts (both expected and realized) were concentrated in the service sector. In manufacturing, no firms concretely expected a change in employment (though some were unsure), and ex post they believe RTO did not cause them to lose workers. In services, however, only 59 percent expected no impact, while 16 percent expected a negative impact on employment. Ex post, impact on employment was less than expected.
While our analysis is suggestive, there are a few limitations. Foremost, our effective sample size was small, meaning some of these results could be driven by sampling error. Second, it has been years since some employers implemented RTO policies, so their memories of their expectations could be inaccurate. Third, our survey did not control for any other firm changes — such as changes in wages or product demand — that could confound our findings. Fourth, although our findings provide insight into net employment gains and losses, they do not speak to hiring and firing separately. 11
With these caveats in mind, however, our results show that RTO — while still a common topic of conversation — is not necessarily important to employers' and workers' employment decisions. Concerns about employment effects ex ante mostly did not materialize. Employment effects that did materialize were concentrated in services and resulted in a net gain of employees in some cases, rather than a loss.
Grey Gordon is a senior economist and Sonya Ravindranath Waddell is a vice president and economist, both in the Research Department of the Federal Reserve Bank of Richmond. The authors thank Jason Kosakow for helping to develop and execute the survey and for providing the tabulations underlying this analysis and thank RC Balaban, Zach Edwards and Claudia Macaluso for providing feedback on an earlier draft.
See, for example, the 2023 paper " The Evolution of Work From Home " by Jose Maria Barrero, Nicholas Bloom and Steven Davis.
See, for example, the 2024 working paper " The Big Shift in Working Arrangements: Eight Ways Unusual " by Steven Davis.
See, for example, the 2023 working paper " How Hybrid Working From Home Works Out " by Nicholas Bloom, Ruobing Han and James Liang.
See the previously cited paper " How Hybrid Working From Home Works Out ."
See, for example, the 2021 working paper " Why Working From Home Will Stick " by Jose Maria Barrero, Nicholas Bloom and Steven Davis.
See, for example, the 2024 working paper " Job Amenity Shocks and Labor Reallocation (PDF) " by Sadhika Bagga, Lukas Mann, Aysegul Sahin and Giovanni Violante.
The Fifth District comprises the District of Columbia, Maryland, North Carolina, South Carolina, Virginia and most of West Virginia.
Those who answered "not applicable" are presumably firms where work is necessarily done in person.
See, for example, the 2023 article " About a Third of U.S. Workers Who Can Work From Home Now Do So All the Time " by Kim Parker.
The previously cited article by Emily Corcoran noted that 38 percent of firms are in the office in between one and four days a week.
See the 2022 article " Changing Recruiting Practices and Methods in the Tight Labor Market " by Claudia Macaluso and Sonya Ravindranath Waddell for an analysis of how hiring practices have changed in the tight labor market that has prevailed since 2020.
This article may be photocopied or reprinted in its entirety. Please credit the authors, source, and the Federal Reserve Bank of Richmond and include the italicized statement below.
V iews expressed in this article are those of the authors and not necessarily those of the Federal Reserve Bank of Richmond or the Federal Reserve System.
Subscribe to Economic Brief
Receive a notification when Economic Brief is posted online.
By submitting this form you agree to the Bank's Terms & Conditions and Privacy Notice.
Thank you for signing up!
As a new subscriber, you will need to confirm your request to receive email notifications from the Richmond Fed. Please click the confirm subscription link in the email to activate your request.
If you do not receive a confirmation email, check your junk or spam folder as the email may have been diverted.
Phone Icon Contact Us
Numbers, Facts and Trends Shaping Your World
Read our research on:
Full Topic List
Regions & Countries
- Publications
- Our Methods
- Short Reads
- Tools & Resources
Read Our Research On:
Is College Worth It?
- Acknowledgments
Table of Contents
- Labor force trends and economic outcomes for young adults
- Economic outcomes for young men
- Economic outcomes for young women
- Wealth trends for households headed by a young adult
- The importance of a four-year college degree
- Getting a high-paying job without a college degree
- Do Americans think their education prepared them for the workplace?
- Is college worth the cost?
- The American Trends Panel survey methodology
- Current Population Survey methodology
- Survey of Consumer Finances methodology
This report is a collaborative effort based on the input and analysis of the following individuals. Find related reports online at pewresearch.org/topic/economy-work.
Kim Parker, Director, Social Trends Research Juliana Horowitz, Associate Director, Research Richard Fry, Senior Economist Dana Braga, Research Assistant Isabel Goddard, Research Associate Kiley Hurst, Research Analyst Rakesh Kochhar, Senior Researcher John Carlo Mandapat, Information Graphics Designer Anna Jackson, Editorial Assistant Julia O’Hanlon, Communications Manager Mithila Samak, Communications Associate
Sign up for our weekly newsletter
Fresh data delivery Saturday mornings
Sign up for The Briefing
Weekly updates on the world of news & information
- Business & Workplace
- Economic Conditions
- Higher Education
- Income & Wages
- Recessions & Recoveries
- Student Loans
Half of Latinas Say Hispanic Women’s Situation Has Improved in the Past Decade and Expect More Gains
From businesses and banks to colleges and churches: americans’ views of u.s. institutions, fewer young men are in college, especially at 4-year schools, key facts about u.s. latinos with graduate degrees, private, selective colleges are most likely to use race, ethnicity as a factor in admissions decisions, most popular, report materials.
1615 L St. NW, Suite 800 Washington, DC 20036 USA (+1) 202-419-4300 | Main (+1) 202-857-8562 | Fax (+1) 202-419-4372 | Media Inquiries
Research Topics
- Email Newsletters
ABOUT PEW RESEARCH CENTER Pew Research Center is a nonpartisan fact tank that informs the public about the issues, attitudes and trends shaping the world. It conducts public opinion polling, demographic research, media content analysis and other empirical social science research. Pew Research Center does not take policy positions. It is a subsidiary of The Pew Charitable Trusts .
Copyright 2024 Pew Research Center
Where heat waves might cause blackouts: Look up your area

Transformers
can overheat
on hot days.
David Paul Morris/Bloomberg News

can overheat and
cause blackouts

installed on poles

The electrical grid faces a looming challenge: longer and stronger heat waves.
Large swaths of California, Arizona, Nevada and Texas are projected to have to endure more than four months every year in which the temperature will be high enough to compromise power transformers, new research shows. As a result, blackouts caused by overheated electrical equipment could become more frequent by mid-century.

What’s at stake
Transformers “slow down” high-voltage electricity so it can flow safely into your home appliances. Without them, electricity could not be sent over long distances, and the grid would not work. You would either live near a power plant or live without power.
Like all electrical equipment, transformers perform worse in the heat. That can force the electric company to implement rolling power outages. If the temperature stays high for days on end, transformers can fail completely, causing blackouts.
Air conditioners are more than pleasant conveniences — they are often the difference between life and death. If the power goes out and people cannot cool themselves down, they can suffer heat stroke, dehydration and heart attacks. The old and sick are especially vulnerable.
The new research by the consulting firm ICF’s Climate Center projected how temperature will change by mid-century under a moderate warming scenario . Then they calculated how many days per year every part of the contiguous United States would experience average temperatures exceeding 86 degrees Fahrenheit (30 degrees Celsius) for at least 48 hours.
For example, if the average temperature tops 86 degrees for three straight days in June, then again for five straight days in July, that counts as eight total days.
An average temperature of 86 degrees implies blistering daytime highs along with sultry nighttime lows, depriving electrical equipment of a chance to cool down. Hotter than that, most power transformers are not designed to operate at full capacity.
Although they often go unnoticed, there are more than 60 million transformers in the United States, mounted atop poles or locked inside steel cabinets resting on pads of concrete.
Amid 2021’s Pacific Northwest heat wave, Avista Utilities, the electric company in Spokane, Wash., cut power to tens of thousands of people, lest its overheated transformers explode. During that heat wave, 19 people died from heat exposure in Spokane County alone , with more than 1,000 deaths in total.
Phoenix will endure an estimated 126 days each year with heat that reduces transformers’ performance, the analysis found. A power outage during a heat wave would kill thousands of people in the city, according to a peer-reviewed study published last year.
Some cities will suffer large increases in the number of days with temperatures high enough to overheat transformers and cause power outages. The ICF researchers used a baseline of the turn of the 21st century as a point of comparison. The average temperature in the contiguous United States is about 1.5 degrees Fahrenheit (0.8 degrees Celsius) higher today.
Austin will face about 83 heat wave days per year by mid-century compared to just 30 days during the baseline period, according to the analysis. New Orleans, Oklahoma City, Miami and Memphis will all brave an extra month each year with heat waves that will stress transformers.
The ICF research considers only temperatures that tax transformers, but every component of the electrical grid suffers during days-long heat waves.
“When it’s hotter outside, our power plants are less efficient, and the transmission lines are less efficient, and the air conditioners are less efficient,” said Michael Webber, a professor of mechanical engineering at the University of Texas at Austin and author of “ Power Trip: The Story of Energy .”
The scale of damage during a heat wave depends on how poorly the grid performs. Rolling outages can cause discomfort, “but it becomes a humanitarian crisis pretty quickly if the power goes out because then it becomes dangerously hot,” Webber said, adding that people who use dialysis equipment or rely on refrigerated medicines are particularly at risk.
Power companies in places that do not currently experience days-long heat waves will have to learn to adapt to them.
New York, for example, will undergo a rise from two to 12 days per year that will be hot enough to compromise transformers. Con Edison, the city’s electric utility, recently undertook a study of its climate change vulnerabilities and reported that “higher temperatures can decrease the capacity of cable, substation transformers and other equipment.”
In California, coastal cities such as Los Angeles and San Diego will be spared days-long heat waves because the ocean air cools them off at night. But inland cities such as Lancaster and Victorville, home to more than 300,000 people combined, will experience weeks of heat waves per year.
The power company Southern California Edison recently warned that climate change will make it so “existing infrastructure will become less efficient, especially inland, resulting in reduced capacity on lines and higher losses in transformers.”
The ICF research doesn’t take into account how high temperatures drive greater electricity usage, which puts further stress on the electrical grid. During heat waves, energy demand spikes as people crank up their air conditioners. In New York and Phoenix, for instance, energy usage is more than twice as high on the hottest days of the year compared to mild days.
To make their transformers more heat-resistant, electric companies can install cooling systems and try to place them in the shade. But the main thing to do is to simply build more of them, power company officials told me. More transformers means less electricity flows through each one. It also ensures there are backup transformers in case one goes down.
Electric companies will also need more transformers to keep pace with surging demand from power-hungry data centers and a growing movement to electrify everything from vehicles to stoves to heaters. By 2050, the United States will need three times as many transformers as it has now, according to a recent study from the National Renewable Energy Laboratory .
When people think of electricity, they mostly think of the power plants that generate electricity or the gadgets and machines that consume it, with little consideration for what happens in between.
But if the grid of the future fails to meet the country’s voracious electricity appetite, it will be because of inadequate poles and wires and transformers, said Kyri Baker, an assistant professor of engineering at the University of Colorado at Boulder.
“People think, as long as we have enough power generation, things will be fine,” Baker said. “We’re going to have more blackouts, but it’s because of the infrastructure. It’s not being able to get the power to where it needs to go.”
Check my work
ICF Climate Center provided the data from their analysis of heat waves that would strain power transformers. The researchers assumed warming would be kept to 3.6 degrees Fahrenheit (2 degrees Celsius) above preindustrial temperatures by mid-century, considered a middle-of-the-road scenario (for the geeks, it’s SSP2-4.5). For their baseline period, the researchers took the average of the years 1981 to 2010. For the mid-century period, the researchers used the average of the years 2036 to 2065. You can find the data and the code I wrote to produce the map in this computational notebook .
The daily maximum temperatures in New York and Phoenix are from Open-Meteo , and the daily electricity demand values are from the U.S. Energy Information Administration . The data and code I wrote to produce the scatter plot are in this computational notebook .
You can use the code and data to produce your own analyses and charts — and to make sure mine are accurate. To get in touch, email me and my editor, Monica Ulmanu .
The independent source for health policy research, polling, and news.
Where ACA Marketplace Enrollment is Growing the Fastest, and Why
Cynthia Cox and Jared Ortaliza Published: May 16, 2024
In 2024, Affordable Care Act (ACA) Marketplace enrollment hit a new record high , reaching over 21 million people, almost double the 11 million people enrolled in 2020. This growth can be largely attributed to enhanced subsidies made available by the American Rescue Plan Act (ARPA) in 2021 and renewed under the 2022 Inflation Reduction Act (IRA). These enhanced subsidies significantly reduced premium payments across the board for ACA Marketplace enrollees – including providing 100% premium subsidies for the lowest-income enrollees – and made some middle-income people who had previously been priced out of coverage newly eligible for financial assistance.
Although the Inflation Reduction Act’s enhanced subsidies are available nationwide, some states have seen faster growth than others. In 15 states, ACA Marketplace enrollment has more than doubled since 2020 (Figure 2). One of these states is Texas, where ACA enrollment has more than tripled since 2020. Meanwhile, 3 states’ Marketplaces have seen enrollment fall since 2020.
The five states with the fastest growth in Marketplace enrollment since 2020 – Texas (212%), Mississippi (190%), Georgia (181%), Tennessee (177%), and South Carolina (167%) – have certain characteristics in common: They all started off with high uninsured rates before the enhanced subsidies rolled out, they have not expanded Medicaid under the ACA, and they all use the Healthcare.gov enrollment platform.
It is difficult to disentangle the effect of each of these factors (uninsured rate, Medicaid expansion, and enrollment platform), as they are correlated and closely connected to one another. Nonetheless, the data suggest that a large number of uninsured people in these southern states with high uninsured rates wanted health insurance coverage, and the recently enhanced subsidies have made it possible for them to afford that coverage. However, these subsidies are temporary and will expire at the end of 2025 if not renewed by Congress.
Uninsured Rate
When considering the varying growth rates of Marketplace enrollment across states in recent years, it is important to keep in mind that states had different starting points before the enhanced subsidies in the ARPA and IRA were rolled out. The nonelderly uninsured rate in 2019 ranged from less than 5% in Massachusetts, the District of Columbia, and Hawaii to over 15% in Mississippi, Georgia, Florida, and Oklahoma, and over 20% in Texas. Generally speaking, states with higher uninsured rates in 2019 saw faster growth in ACA Marketplace enrollment from 2020 to 2024, while those with the lowest uninsured rates saw their market sizes generally grow less or even shrink a bit. On average, states that started out with nonelderly uninsured rates below 10 percent in 2019 saw an average of 31% growth in ACA Marketplace enrollment, while states with uninsured rates of 10 percent or more saw an average growth of 136% from 2020 to 2024.
Medicaid Expansion
Another closely related factor that could explain why some states are seeing faster growth in their ACA markets is Medicaid expansion. On average, non-expansion states have seen their ACA Marketplaces grow by 152% since 2020, compared to 47% average growth in expansion states.
The Inflation Reduction Act subsidies bring premiums for ACA Marketplace silver plans down to as low as $0 per month for people with incomes between 100% and 150% of poverty. Meanwhile, in states that have expanded Medicaid, people with incomes up to 138% of poverty are eligible for Medicaid and are therefore ineligible to purchase ACA Marketplace plans. There are therefore relatively fewer people in Medicaid expansion states who would qualify for one of these “free” silver plans on the ACA Marketplaces. This could explain, in part, why there has been faster Marketplace growth in several non-expansion states. (With North Carolina recently expanding Medicaid, there are now 10 states, primarily in the South, that have chosen not to expand the program ).
The unwinding of the pandemic-era Medicaid continuous enrollment policy, which led to millions of people losing Medicaid in 2023 after having their coverage maintained during the pandemic, likely contributed to the steeper increase in Marketplace enrollment during the 2024 open enrollment period. As states unwind the Medicaid continuous enrollment policy, these $0 premium, low-deductible ACA Marketplace plans may make the transition from Medicaid to Marketplace coverage easier, especially for people with incomes just above the poverty level in non-expansion states.
Enrollment Platforms
Growth in ACA Marketplace enrollment in recent years also correlates with enrollment platforms. The 23 states with the fastest growth in ACA Marketplace enrollment from 2020-2024 all use the Healthcare.gov enrollment platform. States using Healthcare.gov saw a weighted average growth of 126% in ACA Marketplace enrollment from 2020 to 2024, compared to 22% growth in states using state-run enrollment websites. All 10 states that have not expanded Medicaid use the Healthcare.gov platform.
Another difference is that only Healthcare.gov states have Enhanced Direct Enrollment , which allows health plans and insurance brokers to directly enroll and provide customer service to enrollees throughout the year without the consumer needing to visit the Marketplace website (Healthcare.gov). In recent years, brokers have played a growing role in assisting Marketplace consumers.
However, states that use their own enrollment websites also had different starting points in 2020, ahead of the enhanced subsidies passing in 2021. Some state-based Marketplaces were already using state funds to offer additional health insurance subsidies beyond those offered by the federal government. Additionally, several states with their own Marketplaces had long embraced the ACA and have directed state resources toward outreach and marketing efforts for a decade. By contrast, states that rely on Healthcare.gov had significant cuts to outreach and marketing budgets during the Trump administration, with those investments renewed in 2021 under the Biden Administration.
- Affordable Care Act
- Private Insurance
- Individual Market
- Marketplaces
COMMENTS
The results chapter (also referred to as the findings or analysis chapter) is one of the most important chapters of your dissertation or thesis because it shows the reader what you've found in terms of the quantitative data you've collected. It presents the data using a clear text narrative, supported by tables, graphs and charts.
The results chapter of a thesis or dissertation presents your research results concisely and objectively. In quantitative research, for each question or hypothesis, state: The type of analysis used; Relevant results in the form of descriptive and inferential statistics; Whether or not the alternative hypothesis was supported
What Is a Research Methodology? | Steps & Tips. Published on August 25, 2022 by Shona McCombes and Tegan George. Revised on November 20, 2023. Your research methodology discusses and explains the data collection and analysis methods you used in your research. A key part of your thesis, dissertation, or research paper, the methodology chapter explains what you did and how you did it, allowing ...
A dissertation is a long-form piece of academic writing based on original research conducted by you. It is usually submitted as the final step in order to finish a PhD program. Your dissertation is probably the longest piece of writing you've ever completed. It requires solid research, writing, and analysis skills, and it can be intimidating ...
And place questionnaires, copies of focus groups and interviews, and data sheets in the appendix. On the other hand, one must put the statistical analysis and sayings quoted by interviewees within the dissertation. 8. Thoroughness of Data. It is a common misconception that the data presented is self-explanatory.
Revised on 10 October 2022. Your research methodology discusses and explains the data collection and analysis methods you used in your research. A key part of your thesis, dissertation, or research paper, the methodology chapter explains what you did and how you did it, allowing readers to evaluate the reliability and validity of your research.
An understanding of the data analysis that you will carry out on your data can also be an expected component of the Research Strategy chapter of your dissertation write-up (i.e., usually Chapter Three: Research Strategy). Therefore, it is a good time to think about the data analysis process if you plan to start writing up this chapter at this ...
In any research, the methodology chapter is one of the key components of your dissertation. It provides a detailed description of the methods you used to conduct your research and helps readers understand how you obtained your data and how you plan to analyze it. This section is crucial for replicating the study and validating its results.
the research setting, the sample, instrumen-tation (if relevant), and methods of data collection and analysis used. • Rationale and significance: Rationale is the justification for the study presented as a logical argument. Significance addresses the benefits that may be derived from doing the study, thereby reaffirming the research purpose.
This article is a practical guide to conducting data analysis in general literature reviews. The general literature review is a synthesis and analysis of published research on a relevant clinical issue, and is a common format for academic theses at the bachelor's and master's levels in nursing, physiotherapy, occupational therapy, public health and other related fields.
Chapter 4. What needs to be included in the chapter? The topics below are typically included in this chapter, and often in this order (check with your Chair): Introduction. Remind the reader what your research questions were. In a qualitative study you will restate the research questions. In a quantitative study you will present the hypotheses.
You will probably have different sections dealing with different themes. The different themes can be subheadings of the Analysis and Discussion (together or separate) chapter(s). Thematic dissertations. If the structure of your dissertation is thematic, you will have several chapters analysing and discussing the issues raised by your research ...
Choosing the right research method for a dissertation is a grinding and perplexing aspect of the dissertation research process. ... organisational, group, and individual scale diversity analysis. This dissertation focuses on diversity concerns from impression management, specifically from HRM as an executive-level phenomenon (Seliverstova, 2021).
For quantitative data, you can use statistical analysis methods to test relationships between variables. For qualitative data, you can use methods such as thematic analysis to interpret patterns and meanings in the data. ... In a longer or more complex research project, such as a thesis or dissertation, you will probably include a methodology ...
A systematic literature review is a comprehensive analysis of existing research on a specific topic. It typically follows a qualitative research approach and uses methods such as meta-analysis or thematic analysis. Case Study Dissertation. A case study dissertation is an in-depth analysis of a specific individual, group, or organization.
Dissertation and Data Analysis Group Sessions; Defense Schedule - Commons Calendar This link opens in a new window; Research Process This link opens in a new window Toggle Dropdown. Research Process Flow Chart ; Research Alignment Chapter 1 This link opens in a new window; Research Writing: The 5 Step Approach Toggle Dropdown. Step 1: Seek Out ...
The analysis and interpretation of data is carried out in two phases. The. first part, which is based on the results of the questionnaire, deals with a quantitative. analysis of data. The second, which is based on the results of the interview and focus group. discussions, is a qualitative interpretation.
Mapping of terms used in research on P. gangrenosum. A: The co-occurrence network of terms extracted from the title or abstract of at least 40 articles.The colors represent groups of terms that are relatively strongly linked to each other. The size of a term signifies the number of publications related to P. gangrenosum in which the term appeared, and the distance between two terms represents ...
Photocatalytic CO 2 conversion research has been driven by the need to find long-term solutions to mitigate climate change and cut greenhouse gas emissions. Photocatalysts are extremely promising for converting carbon dioxide into useful compounds and fuels by utilizing the power of sunshine [].Because of their special structural and surface characteristics, TiO 2 nanofibers have become one of ...
Now, new research from Anthropic offers a new window into what's going on inside the Claude LLM's "black box." The company's new paper on "Extracting Interpretable Features from Claude 3 Sonnet ...
The analysis of petroleum coke physicochemical properties has always been an important part of its research, encompassing significant indicators such as ash content, ... is given. If you want to reproduce the whole article in a third-party commercial publication (excluding your thesis/dissertation for which permission is not ...
The row "we articulated a return-to-office policy" aggregates across those who implemented an RTO order in 2021, 2022, 2023 or 2024. Source: Federal Reserve Bank of Richmond business surveys (March 2024). We asked these 20 percent of employers about the expected consequences of issuing RTO orders. Did they expect workers to quit because of ...
ABOUT PEW RESEARCH CENTER Pew Research Center is a nonpartisan fact tank that informs the public about the issues, attitudes and trends shaping the world. It conducts public opinion polling, demographic research, media content analysis and other empirical social science research. Pew Research Center does not take policy positions.
May 22, 2024 at 7:00 a.m. The electrical grid faces a looming challenge: longer and stronger heat waves. Large swaths of California, Arizona, Nevada and Texas are projected to have to endure more ...
Step 1: Consider your aims and approach. Step 2: Choose a type of research design. Step 3: Identify your population and sampling method. Step 4: Choose your data collection methods. Step 5: Plan your data collection procedures. Step 6: Decide on your data analysis strategies. Other interesting articles.
In 2024, Affordable Care Act (ACA) Marketplace enrollment hit a new record high, reaching over 21 million people, almost double the 11 million people enrolled in 2020.This growth can be largely ...