
How to Determine Sample Size for a Research Study
Frankline kibuacha | apr. 06, 2021 | 3 min. read.

This article will discuss considerations to put in place when determining your sample size and how to calculate the sample size.
Confidence Interval and Confidence Level
As we have noted before, when selecting a sample there are multiple factors that can impact the reliability and validity of results, including sampling and non-sampling errors . When thinking about sample size, the two measures of error that are almost always synonymous with sample sizes are the confidence interval and the confidence level.
Confidence Interval (Margin of Error)
Confidence intervals measure the degree of uncertainty or certainty in a sampling method and how much uncertainty there is with any particular statistic. In simple terms, the confidence interval tells you how confident you can be that the results from a study reflect what you would expect to find if it were possible to survey the entire population being studied. The confidence interval is usually a plus or minus (±) figure. For example, if your confidence interval is 6 and 60% percent of your sample picks an answer, you can be confident that if you had asked the entire population, between 54% (60-6) and 66% (60+6) would have picked that answer.
Confidence Level
The confidence level refers to the percentage of probability, or certainty that the confidence interval would contain the true population parameter when you draw a random sample many times. It is expressed as a percentage and represents how often the percentage of the population who would pick an answer lies within the confidence interval. For example, a 99% confidence level means that should you repeat an experiment or survey over and over again, 99 percent of the time, your results will match the results you get from a population.
The larger your sample size, the more confident you can be that their answers truly reflect the population. In other words, the larger your sample for a given confidence level, the smaller your confidence interval.
Standard Deviation
Another critical measure when determining the sample size is the standard deviation, which measures a data set’s distribution from its mean. In calculating the sample size, the standard deviation is useful in estimating how much the responses you receive will vary from each other and from the mean number, and the standard deviation of a sample can be used to approximate the standard deviation of a population.
The higher the distribution or variability, the greater the standard deviation and the greater the magnitude of the deviation. For example, once you have already sent out your survey, how much variance do you expect in your responses? That variation in responses is the standard deviation.
Population Size

As demonstrated through the calculation below, a sample size of about 385 will give you a sufficient sample size to draw assumptions of nearly any population size at the 95% confidence level with a 5% margin of error, which is why samples of 400 and 500 are often used in research. However, if you are looking to draw comparisons between different sub-groups, for example, provinces within a country, a larger sample size is required. GeoPoll typically recommends a sample size of 400 per country as the minimum viable sample for a research project, 800 per country for conducting a study with analysis by a second-level breakdown such as females versus males, and 1200+ per country for doing third-level breakdowns such as males aged 18-24 in Nairobi.
How to Calculate Sample Size
As we have defined all the necessary terms, let us briefly learn how to determine the sample size using a sample calculation formula known as Andrew Fisher’s Formula.
- Determine the population size (if known).
- Determine the confidence interval.
- Determine the confidence level.
- Determine the standard deviation ( a standard deviation of 0.5 is a safe choice where the figure is unknown )
- Convert the confidence level into a Z-Score. This table shows the z-scores for the most common confidence levels:
- Put these figures into the sample size formula to get your sample size.

Here is an example calculation:
Say you choose to work with a 95% confidence level, a standard deviation of 0.5, and a confidence interval (margin of error) of ± 5%, you just need to substitute the values in the formula:
((1.96)2 x .5(.5)) / (.05)2
(3.8416 x .25) / .0025
.9604 / .0025
Your sample size should be 385.
Fortunately, there are several available online tools to help you with this calculation. Here’s an online sample calculator from Easy Calculation. Just put in the confidence level, population size, the confidence interval, and the perfect sample size is calculated for you.
GeoPoll’s Sampling Techniques
With the largest mobile panel in Africa, Asia, and Latin America, and reliable mobile technologies, GeoPoll develops unique samples that accurately represent any population. See our country coverage here , or contact our team to discuss your upcoming project.
Related Posts
Sample Frame and Sample Error
Probability and Non-Probability Samples
How GeoPoll Conducts Nationally Representative Surveys
- Tags market research , Market Research Methods , sample size , survey methodology
Root out friction in every digital experience, super-charge conversion rates, and optimise digital self-service
Uncover insights from any interaction, deliver AI-powered agent coaching, and reduce cost to serve
Increase revenue and loyalty with real-time insights and recommendations delivered straight to teams on the ground
Know exactly how your people feel and empower managers to improve employee engagement, productivity, and retention
Take action in the moments that matter most along the employee journey and drive bottom line growth
Whatever they’re are saying, wherever they’re saying it, know exactly what’s going on with your people
Get faster, richer insights with qual and quant tools that make powerful market research available to everyone
Run concept tests, pricing studies, prototyping + more with fast, powerful studies designed by UX research experts
Track your brand performance 24/7 and act quickly to respond to opportunities and challenges in your market
Meet the operating system for experience management
- Free Account
- For Digital
- For Customer Care
- For Human Resources
- For Researchers
- Financial Services
- All Industries
Popular Use Cases
- Customer Experience
- Employee Experience
- Employee Exit Interviews
- Net Promoter Score
- Voice of Customer
- Customer Success Hub
- Product Documentation
- Training & Certification
- XM Institute
- Popular Resources
- Customer Stories
- Artificial Intelligence
- Market Research
- Partnerships
- Marketplace
The annual gathering of the experience leaders at the world’s iconic brands building breakthrough business results.
- English/AU & NZ
- Español/Europa
- Español/América Latina
- Português Brasileiro
- REQUEST DEMO
- Experience Management
- Sampling Methods
- How To determine Sample Size
Try Qualtrics for free
Determining sample size: how to make sure you get the correct sample size.
16 min read Sample size can make or break your research project. Here’s how to master the delicate art of choosing the right sample size.
What is sample size?
Sample size is the beating heart of any research project. It’s the invisible force that gives life to your data, making your findings robust, reliable and believable.
Sample size is what determines if you see a broad view or a focus on minute details; the art and science of correctly determining it involves a careful balancing act. Finding an appropriate sample size demands a clear understanding of the level of detail you wish to see in your data and the constraints you might encounter along the way.
Remember, whether you’re studying a small group or an entire population, your findings are only ever as good as the sample you choose.
Free eBook: Empower your market research efforts today
Let’s delve into the world of sampling and uncover the best practices for determining sample size for your research.
How to determine sample size
“How much sample do we need?” is one of the most commonly-asked questions and stumbling points in the early stages of research design . Finding the right answer to it requires first understanding and answering two other questions:
How important is statistical significance to you and your stakeholders?
What are your real-world constraints.
At the heart of this question is the goal to confidently differentiate between groups, by describing meaningful differences as statistically significant. Statistical significance isn’t a difficult concept, but it needs to be considered within the unique context of your research and your measures.
First, you should consider when you deem a difference to be meaningful in your area of research. While the standards for statistical significance are universal, the standards for “meaningful difference” are highly contextual.
For example, a 10% difference between groups might not be enough to merit a change in a marketing campaign for a breakfast cereal, but a 10% difference in efficacy of breast cancer treatments might quite literally be the difference between life and death for hundreds of patients. The exact same magnitude of difference has very little meaning in one context, but has extraordinary meaning in another. You ultimately need to determine the level of precision that will help you make your decision.
Within sampling, the lowest amount of magnification – or smallest sample size – could make the most sense, given the level of precision needed, as well as timeline and budgetary constraints.
If you’re able to detect statistical significance at a difference of 10%, and 10% is a meaningful difference, there is no need for a larger sample size, or higher magnification. However, if the study will only be useful if a significant difference is detected for smaller differences – say, a difference of 5% — the sample size must be larger to accommodate this needed precision. Similarly, if 5% is enough, and 3% is unnecessary, there is no need for a larger statistically significant sample size.
You should also consider how much you expect your responses to vary. When there isn’t a lot of variability in response, it takes a lot more sample to be confident that there are statistically significant differences between groups.
For instance, it will take a lot more sample to find statistically significant differences between groups if you are asking, “What month do you think Christmas is in?” than if you are asking, “How many miles are there between the Earth and the moon?”. In the former, nearly everybody is going to give the exact same answer, while the latter will give a lot of variation in responses. Simply put, when your variables do not have a lot of variance, larger sample sizes make sense.
Statistical significance
The likelihood that the results of a study or experiment did not occur randomly or by chance, but are meaningful and indicate a genuine effect or relationship between variables.
Magnitude of difference
The size or extent of the difference between two or more groups or variables, providing a measure of the effect size or practical significance of the results.
Actionable insights
Valuable findings or conclusions drawn from data analysis that can be directly applied or implemented in decision-making processes or strategies to achieve a particular goal or outcome.
It’s crucial to understand the differences between the concepts of “statistical significance”, “magnitude of difference” and “actionable insights” – and how they can influence each other:
- Even if there is a statistically significant difference, it doesn’t mean the magnitude of the difference is large: with a large enough sample, a 3% difference could be statistically significant
- Even if the magnitude of the difference is large, it doesn’t guarantee that this difference is statistically significant: with a small enough sample, an 18% difference might not be statistically significant
- Even if there is a large, statistically significant difference, it doesn’t mean there is a story, or that there are actionable insights
There is no way to guarantee statistically significant differences at the outset of a study – and that is a good thing.
Even with a sample size of a million, there simply may not be any differences – at least, any that could be described as statistically significant. And there are times when a lack of significance is positive.
Imagine if your main competitor ran a multi-million dollar ad campaign in a major city and a huge pre-post study to detect campaign effects, only to discover that there were no statistically significant differences in brand awareness . This may be terrible news for your competitor, but it would be great news for you.

With Stats iQ™ you can analyze your research results and conduct significance testing
As you determine your sample size, you should consider the real-world constraints to your research.
Factors revolving around timings, budget and target population are among the most common constraints, impacting virtually every study. But by understanding and acknowledging them, you can definitely navigate the practical constraints of your research when pulling together your sample.
Timeline constraints
Gathering a larger sample size naturally requires more time. This is particularly true for elusive audiences, those hard-to-reach groups that require special effort to engage. Your timeline could become an obstacle if it is particularly tight, causing you to rethink your sample size to meet your deadline.
Budgetary constraints
Every sample, whether large or small, inexpensive or costly, signifies a portion of your budget. Samples could be like an open market; some are inexpensive, others are pricey, but all have a price tag attached to them.
Population constraints
Sometimes the individuals or groups you’re interested in are difficult to reach; other times, they’re a part of an extremely small population. These factors can limit your sample size even further.
What’s a good sample size?
A good sample size really depends on the context and goals of the research. In general, a good sample size is one that accurately represents the population and allows for reliable statistical analysis.
Larger sample sizes are typically better because they reduce the likelihood of sampling errors and provide a more accurate representation of the population. However, larger sample sizes often increase the impact of practical considerations, like time, budget and the availability of your audience. Ultimately, you should be aiming for a sample size that provides a balance between statistical validity and practical feasibility.
4 tips for choosing the right sample size
Choosing the right sample size is an intricate balancing act, but following these four tips can take away a lot of the complexity.
1) Start with your goal
The foundation of your research is a clearly defined goal. You need to determine what you’re trying to understand or discover, and use your goal to guide your research methods – including your sample size.
If your aim is to get a broad overview of a topic, a larger, more diverse sample may be appropriate. However, if your goal is to explore a niche aspect of your subject, a smaller, more targeted sample might serve you better. You should always align your sample size with the objectives of your research.
2) Know that you can’t predict everything
Research is a journey into the unknown. While you may have hypotheses and predictions, it’s important to remember that you can’t foresee every outcome – and this uncertainty should be considered when choosing your sample size.
A larger sample size can help to mitigate some of the risks of unpredictability, providing a more diverse range of data and potentially more accurate results. However, you shouldn’t let the fear of the unknown push you into choosing an impractically large sample size.
3) Plan for a sample that meets your needs and considers your real-life constraints
Every research project operates within certain boundaries – commonly budget, timeline and the nature of the sample itself. When deciding on your sample size, these factors need to be taken into consideration.
Be realistic about what you can achieve with your available resources and time, and always tailor your sample size to fit your constraints – not the other way around.
4) Use best practice guidelines to calculate sample size
There are many established guidelines and formulas that can help you in determining the right sample size.
The easiest way to define your sample size is using a sample size calculator , or you can use a manual sample size calculation if you want to test your math skills. Cochran’s formula is perhaps the most well known equation for calculating sample size, and widely used when the population is large or unknown.

Beyond the formula, it’s vital to consider the confidence interval, which plays a significant role in determining the appropriate sample size – especially when working with a random sample – and the sample proportion. This represents the expected ratio of the target population that has the characteristic or response you’re interested in, and therefore has a big impact on your correct sample size.
If your population is small, or its variance is unknown, there are steps you can still take to determine the right sample size. Common approaches here include conducting a small pilot study to gain initial estimates of the population variance, and taking a conservative approach by assuming a larger variance to ensure a more representative sample size.
Empower your market research
Conducting meaningful research and extracting actionable intelligence are priceless skills in today’s ultra competitive business landscape. It’s never been more crucial to stay ahead of the curve by leveraging the power of market research to identify opportunities, mitigate risks and make informed decisions.
Equip yourself with the tools for success with our essential eBook, “The ultimate guide to conducting market research” .
With this front-to-back guide, you’ll discover the latest strategies and best practices that are defining effective market research. Learn about practical insights and real-world applications that are demonstrating the value of research in driving business growth and innovation.
Learn how to determine sample size
To choose the correct sample size, you need to consider a few different factors that affect your research, and gain a basic understanding of the statistics involved. You’ll then be able to use a sample size formula to bring everything together and sample confidently, knowing that there is a high probability that your survey is statistically accurate.
The steps that follow are suitable for finding a sample size for continuous data – i.e. data that is counted numerically. It doesn’t apply to categorical data – i.e. put into categories like green, blue, male, female etc.
Stage 1: Consider your sample size variables
Before you can calculate a sample size, you need to determine a few things about the target population and the level of accuracy you need:
1. Population size
How many people are you talking about in total? To find this out, you need to be clear about who does and doesn’t fit into your group. For example, if you want to know about dog owners, you’ll include everyone who has at some point owned at least one dog. (You may include or exclude those who owned a dog in the past, depending on your research goals.) Don’t worry if you’re unable to calculate the exact number. It’s common to have an unknown number or an estimated range.
2. Margin of error (confidence interval)
Errors are inevitable – the question is how much error you’ll allow. The margin of error , AKA confidence interval, is expressed in terms of mean numbers. You can set how much difference you’ll allow between the mean number of your sample and the mean number of your population. If you’ve ever seen a political poll on the news, you’ve seen a confidence interval and how it’s expressed. It will look something like this: “68% of voters said yes to Proposition Z, with a margin of error of +/- 5%.”
3. Confidence level
This is a separate step to the similarly-named confidence interval in step 2. It deals with how confident you want to be that the actual mean falls within your margin of error. The most common confidence intervals are 90% confident, 95% confident, and 99% confident.
4. Standard deviation
This step asks you to estimate how much the responses you receive will vary from each other and from the mean number. A low standard deviation means that all the values will be clustered around the mean number, whereas a high standard deviation means they are spread out across a much wider range with very small and very large outlying figures. Since you haven’t yet run your survey, a safe choice is a standard deviation of .5 which will help make sure your sample size is large enough.
Stage 2: Calculate sample size
Now that you’ve got answers for steps 1 – 4, you’re ready to calculate the sample size you need. This can be done using an online sample size calculator or with paper and pencil.
1. Find your Z-score
Next, you need to turn your confidence level into a Z-score. Here are the Z-scores for the most common confidence levels:
- 90% – Z Score = 1.645
- 95% – Z Score = 1.96
- 99% – Z Score = 2.576
If you chose a different confidence level, use this Z-score table (a resource owned and hosted by SJSU.edu) to find your score.
2. Use the sample size formula
Plug in your Z-score, standard of deviation, and confidence interval into the sample size calculator or use this sample size formula to work it out yourself:

This equation is for an unknown population size or a very large population size. If your population is smaller and known, just use the sample size calculator.
What does that look like in practice?
Here’s a worked example, assuming you chose a 95% confidence level, .5 standard deviation, and a margin of error (confidence interval) of +/- 5%.
((1.96)2 x .5(.5)) / (.05)2
(3.8416 x .25) / .0025
.9604 / .0025
385 respondents are needed
Voila! You’ve just determined your sample size.
eBook: 2022 Market Research Global Trends Report
Related resources
Convenience sampling 15 min read, non-probability sampling 17 min read, probability sampling 8 min read, stratified random sampling 13 min read, simple random sampling 10 min read, sampling methods 15 min read, sampling and non-sampling errors 10 min read, request demo.
Ready to learn more about Qualtrics?
Sample Size Calculator
Table of contents
If you're conducting research and wonder how many measurements you need so that it is statistically significant , this sample size calculator is here to help you. All you need to do is ask yourself these three questions before you use it:
- How accurate should your result be? (margin of error)
- What level of confidence do you need? (confidence level)
- What is your initial estimate ? (proportion estimate)
Read on to learn how to calculate the sample size using this tool, and what do all the variables in the sample size calculation formula mean.
Sample size calculation formula
The equation that our sample size calculator uses is:
- Z Z Z — The z-score associated with the confidence level you chose. Our statistical significance calculator calculates this value automatically, but if you want to learn how to calculate it by hand, take a look at the instructions of our confidence interval calculator .
- M E \mathrm{ME} ME — Margin of error, also known as the confidence interval . It tells you that you can be sure (with a probability of confidence level, for example, 95%), that the real value doesn't differ from the one that you obtained by more than this percentage. You can learn more about it at our margin of error calculator .
- p p p — Your initial proportion estimate. For example, if you are conducting a survey among students trying to find out how many of them read more than 5 books last year, you may know a result of a previous survey — 40%. If you have no such estimate, use the conservative value of 50%.
- n 1 n_1 n 1 — Required sample size.
If your population is finite — for example, you are conducting a survey among students of only one faculty — you need to include a correction in the following form:
- N N N — Total population size.
- n 2 n_2 n 2 — Size of the sample taken from the whole population that will make your research statistically significant.
How to calculate sample size: an example
We will analyze a survey case step-by-step so you can get a clear picture of how to use our sample size calculator . You are planning to conduct a survey to find out what is the proportion of students on your campus who regularly eat their lunch at the campus canteen.
Decide how accurate you want your result to be. Let's say that it is important for the canteen to know the result, with a margin of error of 2 % 2\% 2% maximum.
Decide on your confidence level . We can assume you want to be 99 % 99\% 99% sure that your result is correct.
Do you have an initial proportion guess ? Let's say you accessed a similar survey from 10 years ago, and the proportion was equal to 30 % 30\% 30% . You can assume it as your initial estimate.
Is the total population of students so high that you can assume it's infinite ? Probably not. You need to find the current data for the number of students on the campus — let's assume it is 25 , 000 25,000 25 , 000 .
All you need to do now is input all this data into our sample size calculator. It finds the sample size required for the result to be statistically significant is 3 , 051 3,051 3 , 051 . You need to ask that many students the same question… Are you sure you can't settle for a 95 % 95\% 95% confidence level? 😀
Other useful tools beyond the sample size calculator
Now that you know how to calculate sample size, you can go beyond and use it to calculate other statistics of interest in your research:
Sampling error calculator : sample size is the most influential feature when predicting the sampling error. Use it to calculate the error of your sample.
Normal probability calculator for sampling distributions : use your sample size, along with the population mean and standard deviation, to find the probability that your sample mean falls within a specific range.
Sampling distribution of the sample proportion calculator : use your sample size and the population proportion to find the probability that your sample proportion falls within a specific range.
.css-slt4t3.css-slt4t3{color:#2B3148;background-color:transparent;font-family:"Roboto","Helvetica","Arial",sans-serif;font-size:20px;line-height:24px;overflow:visible;padding-top:0px;position:relative;}.css-slt4t3.css-slt4t3:after{content:'';-webkit-transform:scale(0);-moz-transform:scale(0);-ms-transform:scale(0);transform:scale(0);position:absolute;border:2px solid #EA9430;border-radius:2px;inset:-8px;z-index:1;}.css-slt4t3 .js-external-link-button.link-like,.css-slt4t3 .js-external-link-anchor{color:inherit;border-radius:1px;-webkit-text-decoration:underline;text-decoration:underline;}.css-slt4t3 .js-external-link-button.link-like:hover,.css-slt4t3 .js-external-link-anchor:hover,.css-slt4t3 .js-external-link-button.link-like:active,.css-slt4t3 .js-external-link-anchor:active{text-decoration-thickness:2px;text-shadow:1px 0 0;}.css-slt4t3 .js-external-link-button.link-like:focus-visible,.css-slt4t3 .js-external-link-anchor:focus-visible{outline:transparent 2px dotted;box-shadow:0 0 0 2px #6314E6;}.css-slt4t3 p,.css-slt4t3 div{margin:0px;display:block;}.css-slt4t3 pre{margin:0px;display:block;}.css-slt4t3 pre code{display:block;width:-webkit-fit-content;width:-moz-fit-content;width:fit-content;}.css-slt4t3 pre:not(:first-child){padding-top:8px;}.css-slt4t3 ul,.css-slt4t3 ol{display:block margin:0px;padding-left:20px;}.css-slt4t3 ul li,.css-slt4t3 ol li{padding-top:8px;}.css-slt4t3 ul ul,.css-slt4t3 ol ul,.css-slt4t3 ul ol,.css-slt4t3 ol ol{padding-top:0px;}.css-slt4t3 ul:not(:first-child),.css-slt4t3 ol:not(:first-child){padding-top:4px;} .css-4okk7a{margin:auto;background-color:white;overflow:auto;overflow-wrap:break-word;word-break:break-word;}.css-4okk7a code,.css-4okk7a kbd,.css-4okk7a pre,.css-4okk7a samp{font-family:monospace;}.css-4okk7a code{padding:2px 4px;color:#444;background:#ddd;border-radius:4px;}.css-4okk7a figcaption,.css-4okk7a caption{text-align:center;}.css-4okk7a figcaption{font-size:12px;font-style:italic;overflow:hidden;}.css-4okk7a h3{font-size:1.75rem;}.css-4okk7a h4{font-size:1.5rem;}.css-4okk7a .mathBlock{font-size:24px;-webkit-padding-start:4px;padding-inline-start:4px;}.css-4okk7a .mathBlock .katex{font-size:24px;text-align:left;}.css-4okk7a .math-inline{background-color:#f0f0f0;display:inline-block;font-size:inherit;padding:0 3px;}.css-4okk7a .videoBlock,.css-4okk7a .imageBlock{margin-bottom:16px;}.css-4okk7a .imageBlock__image-align--left,.css-4okk7a .videoBlock__video-align--left{float:left;}.css-4okk7a .imageBlock__image-align--right,.css-4okk7a .videoBlock__video-align--right{float:right;}.css-4okk7a .imageBlock__image-align--center,.css-4okk7a .videoBlock__video-align--center{display:block;margin-left:auto;margin-right:auto;clear:both;}.css-4okk7a .imageBlock__image-align--none,.css-4okk7a .videoBlock__video-align--none{clear:both;margin-left:0;margin-right:0;}.css-4okk7a .videoBlock__video--wrapper{position:relative;padding-bottom:56.25%;height:0;}.css-4okk7a .videoBlock__video--wrapper iframe{position:absolute;top:0;left:0;width:100%;height:100%;}.css-4okk7a .videoBlock__caption{text-align:left;}@font-face{font-family:'KaTeX_AMS';src:url(/katex-fonts/KaTeX_AMS-Regular.woff2) format('woff2'),url(/katex-fonts/KaTeX_AMS-Regular.woff) format('woff'),url(/katex-fonts/KaTeX_AMS-Regular.ttf) format('truetype');font-weight:normal;font-style:normal;}@font-face{font-family:'KaTeX_Caligraphic';src:url(/katex-fonts/KaTeX_Caligraphic-Bold.woff2) format('woff2'),url(/katex-fonts/KaTeX_Caligraphic-Bold.woff) format('woff'),url(/katex-fonts/KaTeX_Caligraphic-Bold.ttf) format('truetype');font-weight:bold;font-style:normal;}@font-face{font-family:'KaTeX_Caligraphic';src:url(/katex-fonts/KaTeX_Caligraphic-Regular.woff2) format('woff2'),url(/katex-fonts/KaTeX_Caligraphic-Regular.woff) format('woff'),url(/katex-fonts/KaTeX_Caligraphic-Regular.ttf) format('truetype');font-weight:normal;font-style:normal;}@font-face{font-family:'KaTeX_Fraktur';src:url(/katex-fonts/KaTeX_Fraktur-Bold.woff2) format('woff2'),url(/katex-fonts/KaTeX_Fraktur-Bold.woff) format('woff'),url(/katex-fonts/KaTeX_Fraktur-Bold.ttf) format('truetype');font-weight:bold;font-style:normal;}@font-face{font-family:'KaTeX_Fraktur';src:url(/katex-fonts/KaTeX_Fraktur-Regular.woff2) format('woff2'),url(/katex-fonts/KaTeX_Fraktur-Regular.woff) format('woff'),url(/katex-fonts/KaTeX_Fraktur-Regular.ttf) format('truetype');font-weight:normal;font-style:normal;}@font-face{font-family:'KaTeX_Main';src:url(/katex-fonts/KaTeX_Main-Bold.woff2) format('woff2'),url(/katex-fonts/KaTeX_Main-Bold.woff) format('woff'),url(/katex-fonts/KaTeX_Main-Bold.ttf) format('truetype');font-weight:bold;font-style:normal;}@font-face{font-family:'KaTeX_Main';src:url(/katex-fonts/KaTeX_Main-BoldItalic.woff2) format('woff2'),url(/katex-fonts/KaTeX_Main-BoldItalic.woff) format('woff'),url(/katex-fonts/KaTeX_Main-BoldItalic.ttf) format('truetype');font-weight:bold;font-style:italic;}@font-face{font-family:'KaTeX_Main';src:url(/katex-fonts/KaTeX_Main-Italic.woff2) format('woff2'),url(/katex-fonts/KaTeX_Main-Italic.woff) format('woff'),url(/katex-fonts/KaTeX_Main-Italic.ttf) format('truetype');font-weight:normal;font-style:italic;}@font-face{font-family:'KaTeX_Main';src:url(/katex-fonts/KaTeX_Main-Regular.woff2) format('woff2'),url(/katex-fonts/KaTeX_Main-Regular.woff) format('woff'),url(/katex-fonts/KaTeX_Main-Regular.ttf) format('truetype');font-weight:normal;font-style:normal;}@font-face{font-family:'KaTeX_Math';src:url(/katex-fonts/KaTeX_Math-BoldItalic.woff2) format('woff2'),url(/katex-fonts/KaTeX_Math-BoldItalic.woff) format('woff'),url(/katex-fonts/KaTeX_Math-BoldItalic.ttf) format('truetype');font-weight:bold;font-style:italic;}@font-face{font-family:'KaTeX_Math';src:url(/katex-fonts/KaTeX_Math-Italic.woff2) format('woff2'),url(/katex-fonts/KaTeX_Math-Italic.woff) format('woff'),url(/katex-fonts/KaTeX_Math-Italic.ttf) format('truetype');font-weight:normal;font-style:italic;}@font-face{font-family:'KaTeX_SansSerif';src:url(/katex-fonts/KaTeX_SansSerif-Bold.woff2) format('woff2'),url(/katex-fonts/KaTeX_SansSerif-Bold.woff) format('woff'),url(/katex-fonts/KaTeX_SansSerif-Bold.ttf) format('truetype');font-weight:bold;font-style:normal;}@font-face{font-family:'KaTeX_SansSerif';src:url(/katex-fonts/KaTeX_SansSerif-Italic.woff2) format('woff2'),url(/katex-fonts/KaTeX_SansSerif-Italic.woff) format('woff'),url(/katex-fonts/KaTeX_SansSerif-Italic.ttf) format('truetype');font-weight:normal;font-style:italic;}@font-face{font-family:'KaTeX_SansSerif';src:url(/katex-fonts/KaTeX_SansSerif-Regular.woff2) format('woff2'),url(/katex-fonts/KaTeX_SansSerif-Regular.woff) format('woff'),url(/katex-fonts/KaTeX_SansSerif-Regular.ttf) format('truetype');font-weight:normal;font-style:normal;}@font-face{font-family:'KaTeX_Script';src:url(/katex-fonts/KaTeX_Script-Regular.woff2) format('woff2'),url(/katex-fonts/KaTeX_Script-Regular.woff) format('woff'),url(/katex-fonts/KaTeX_Script-Regular.ttf) format('truetype');font-weight:normal;font-style:normal;}@font-face{font-family:'KaTeX_Size1';src:url(/katex-fonts/KaTeX_Size1-Regular.woff2) format('woff2'),url(/katex-fonts/KaTeX_Size1-Regular.woff) format('woff'),url(/katex-fonts/KaTeX_Size1-Regular.ttf) format('truetype');font-weight:normal;font-style:normal;}@font-face{font-family:'KaTeX_Size2';src:url(/katex-fonts/KaTeX_Size2-Regular.woff2) format('woff2'),url(/katex-fonts/KaTeX_Size2-Regular.woff) format('woff'),url(/katex-fonts/KaTeX_Size2-Regular.ttf) format('truetype');font-weight:normal;font-style:normal;}@font-face{font-family:'KaTeX_Size3';src:url(/katex-fonts/KaTeX_Size3-Regular.woff2) format('woff2'),url(/katex-fonts/KaTeX_Size3-Regular.woff) format('woff'),url(/katex-fonts/KaTeX_Size3-Regular.ttf) format('truetype');font-weight:normal;font-style:normal;}@font-face{font-family:'KaTeX_Size4';src:url(/katex-fonts/KaTeX_Size4-Regular.woff2) format('woff2'),url(/katex-fonts/KaTeX_Size4-Regular.woff) format('woff'),url(/katex-fonts/KaTeX_Size4-Regular.ttf) format('truetype');font-weight:normal;font-style:normal;}@font-face{font-family:'KaTeX_Typewriter';src:url(/katex-fonts/KaTeX_Typewriter-Regular.woff2) format('woff2'),url(/katex-fonts/KaTeX_Typewriter-Regular.woff) format('woff'),url(/katex-fonts/KaTeX_Typewriter-Regular.ttf) format('truetype');font-weight:normal;font-style:normal;}.css-4okk7a .katex{font:normal 1.21em KaTeX_Main,Times New Roman,serif;line-height:1.2;text-indent:0;text-rendering:auto;}.css-4okk7a .katex *{-ms-high-contrast-adjust:none!important;border-color:currentColor;}.css-4okk7a .katex .katex-version::after{content:'0.13.13';}.css-4okk7a .katex .katex-mathml{position:absolute;clip:rect(1px, 1px, 1px, 1px);padding:0;border:0;height:1px;width:1px;overflow:hidden;}.css-4okk7a .katex .katex-html>.newline{display:block;}.css-4okk7a .katex .base{position:relative;display:inline-block;white-space:nowrap;width:-webkit-min-content;width:-moz-min-content;width:-webkit-min-content;width:-moz-min-content;width:min-content;}.css-4okk7a .katex .strut{display:inline-block;}.css-4okk7a .katex .textbf{font-weight:bold;}.css-4okk7a .katex .textit{font-style:italic;}.css-4okk7a .katex .textrm{font-family:KaTeX_Main;}.css-4okk7a .katex .textsf{font-family:KaTeX_SansSerif;}.css-4okk7a .katex .texttt{font-family:KaTeX_Typewriter;}.css-4okk7a .katex .mathnormal{font-family:KaTeX_Math;font-style:italic;}.css-4okk7a .katex .mathit{font-family:KaTeX_Main;font-style:italic;}.css-4okk7a .katex .mathrm{font-style:normal;}.css-4okk7a .katex .mathbf{font-family:KaTeX_Main;font-weight:bold;}.css-4okk7a .katex .boldsymbol{font-family:KaTeX_Math;font-weight:bold;font-style:italic;}.css-4okk7a .katex .amsrm{font-family:KaTeX_AMS;}.css-4okk7a .katex .mathbb,.css-4okk7a .katex .textbb{font-family:KaTeX_AMS;}.css-4okk7a .katex .mathcal{font-family:KaTeX_Caligraphic;}.css-4okk7a .katex .mathfrak,.css-4okk7a .katex .textfrak{font-family:KaTeX_Fraktur;}.css-4okk7a .katex .mathtt{font-family:KaTeX_Typewriter;}.css-4okk7a .katex .mathscr,.css-4okk7a .katex .textscr{font-family:KaTeX_Script;}.css-4okk7a .katex .mathsf,.css-4okk7a .katex .textsf{font-family:KaTeX_SansSerif;}.css-4okk7a .katex .mathboldsf,.css-4okk7a .katex .textboldsf{font-family:KaTeX_SansSerif;font-weight:bold;}.css-4okk7a .katex .mathitsf,.css-4okk7a .katex .textitsf{font-family:KaTeX_SansSerif;font-style:italic;}.css-4okk7a .katex .mainrm{font-family:KaTeX_Main;font-style:normal;}.css-4okk7a .katex .vlist-t{display:inline-table;table-layout:fixed;border-collapse:collapse;}.css-4okk7a .katex .vlist-r{display:table-row;}.css-4okk7a .katex .vlist{display:table-cell;vertical-align:bottom;position:relative;}.css-4okk7a .katex .vlist>span{display:block;height:0;position:relative;}.css-4okk7a .katex .vlist>span>span{display:inline-block;}.css-4okk7a .katex .vlist>span>.pstrut{overflow:hidden;width:0;}.css-4okk7a .katex .vlist-t2{margin-right:-2px;}.css-4okk7a .katex .vlist-s{display:table-cell;vertical-align:bottom;font-size:1px;width:2px;min-width:2px;}.css-4okk7a .katex .vbox{display:-webkit-inline-box;display:-webkit-inline-flex;display:-ms-inline-flexbox;display:inline-flex;-webkit-flex-direction:column;-ms-flex-direction:column;flex-direction:column;-webkit-align-items:baseline;-webkit-box-align:baseline;-ms-flex-align:baseline;align-items:baseline;}.css-4okk7a .katex .hbox{display:-webkit-inline-box;display:-webkit-inline-flex;display:-ms-inline-flexbox;display:inline-flex;-webkit-flex-direction:row;-ms-flex-direction:row;flex-direction:row;width:100%;}.css-4okk7a .katex .thinbox{display:-webkit-inline-box;display:-webkit-inline-flex;display:-ms-inline-flexbox;display:inline-flex;-webkit-flex-direction:row;-ms-flex-direction:row;flex-direction:row;width:0;max-width:0;}.css-4okk7a .katex .msupsub{text-align:left;}.css-4okk7a .katex .mfrac>span>span{text-align:center;}.css-4okk7a .katex .mfrac .frac-line{display:inline-block;width:100%;border-bottom-style:solid;}.css-4okk7a .katex .mfrac .frac-line,.css-4okk7a .katex .overline .overline-line,.css-4okk7a .katex .underline .underline-line,.css-4okk7a .katex .hline,.css-4okk7a .katex .hdashline,.css-4okk7a .katex .rule{min-height:1px;}.css-4okk7a .katex .mspace{display:inline-block;}.css-4okk7a .katex .llap,.css-4okk7a .katex .rlap,.css-4okk7a .katex .clap{width:0;position:relative;}.css-4okk7a .katex .llap>.inner,.css-4okk7a .katex .rlap>.inner,.css-4okk7a .katex .clap>.inner{position:absolute;}.css-4okk7a .katex .llap>.fix,.css-4okk7a .katex .rlap>.fix,.css-4okk7a .katex .clap>.fix{display:inline-block;}.css-4okk7a .katex .llap>.inner{right:0;}.css-4okk7a .katex .rlap>.inner,.css-4okk7a .katex .clap>.inner{left:0;}.css-4okk7a .katex .clap>.inner>span{margin-left:-50%;margin-right:50%;}.css-4okk7a .katex .rule{display:inline-block;border:solid 0;position:relative;}.css-4okk7a .katex .overline .overline-line,.css-4okk7a .katex .underline .underline-line,.css-4okk7a .katex .hline{display:inline-block;width:100%;border-bottom-style:solid;}.css-4okk7a .katex .hdashline{display:inline-block;width:100%;border-bottom-style:dashed;}.css-4okk7a .katex .sqrt>.root{margin-left:0.27777778em;margin-right:-0.55555556em;}.css-4okk7a .katex .sizing.reset-size1.size1,.css-4okk7a .katex .fontsize-ensurer.reset-size1.size1{font-size:1em;}.css-4okk7a .katex .sizing.reset-size1.size2,.css-4okk7a .katex .fontsize-ensurer.reset-size1.size2{font-size:1.2em;}.css-4okk7a .katex .sizing.reset-size1.size3,.css-4okk7a .katex .fontsize-ensurer.reset-size1.size3{font-size:1.4em;}.css-4okk7a .katex .sizing.reset-size1.size4,.css-4okk7a .katex .fontsize-ensurer.reset-size1.size4{font-size:1.6em;}.css-4okk7a .katex .sizing.reset-size1.size5,.css-4okk7a .katex .fontsize-ensurer.reset-size1.size5{font-size:1.8em;}.css-4okk7a .katex .sizing.reset-size1.size6,.css-4okk7a .katex .fontsize-ensurer.reset-size1.size6{font-size:2em;}.css-4okk7a .katex .sizing.reset-size1.size7,.css-4okk7a .katex .fontsize-ensurer.reset-size1.size7{font-size:2.4em;}.css-4okk7a .katex .sizing.reset-size1.size8,.css-4okk7a .katex .fontsize-ensurer.reset-size1.size8{font-size:2.88em;}.css-4okk7a .katex .sizing.reset-size1.size9,.css-4okk7a .katex .fontsize-ensurer.reset-size1.size9{font-size:3.456em;}.css-4okk7a .katex .sizing.reset-size1.size10,.css-4okk7a .katex .fontsize-ensurer.reset-size1.size10{font-size:4.148em;}.css-4okk7a .katex .sizing.reset-size1.size11,.css-4okk7a .katex .fontsize-ensurer.reset-size1.size11{font-size:4.976em;}.css-4okk7a .katex .sizing.reset-size2.size1,.css-4okk7a .katex .fontsize-ensurer.reset-size2.size1{font-size:0.83333333em;}.css-4okk7a .katex .sizing.reset-size2.size2,.css-4okk7a .katex .fontsize-ensurer.reset-size2.size2{font-size:1em;}.css-4okk7a .katex .sizing.reset-size2.size3,.css-4okk7a .katex .fontsize-ensurer.reset-size2.size3{font-size:1.16666667em;}.css-4okk7a .katex .sizing.reset-size2.size4,.css-4okk7a .katex .fontsize-ensurer.reset-size2.size4{font-size:1.33333333em;}.css-4okk7a .katex .sizing.reset-size2.size5,.css-4okk7a .katex .fontsize-ensurer.reset-size2.size5{font-size:1.5em;}.css-4okk7a .katex .sizing.reset-size2.size6,.css-4okk7a .katex .fontsize-ensurer.reset-size2.size6{font-size:1.66666667em;}.css-4okk7a .katex .sizing.reset-size2.size7,.css-4okk7a .katex .fontsize-ensurer.reset-size2.size7{font-size:2em;}.css-4okk7a .katex .sizing.reset-size2.size8,.css-4okk7a .katex .fontsize-ensurer.reset-size2.size8{font-size:2.4em;}.css-4okk7a .katex .sizing.reset-size2.size9,.css-4okk7a .katex .fontsize-ensurer.reset-size2.size9{font-size:2.88em;}.css-4okk7a .katex .sizing.reset-size2.size10,.css-4okk7a .katex .fontsize-ensurer.reset-size2.size10{font-size:3.45666667em;}.css-4okk7a .katex .sizing.reset-size2.size11,.css-4okk7a .katex .fontsize-ensurer.reset-size2.size11{font-size:4.14666667em;}.css-4okk7a .katex .sizing.reset-size3.size1,.css-4okk7a .katex .fontsize-ensurer.reset-size3.size1{font-size:0.71428571em;}.css-4okk7a .katex .sizing.reset-size3.size2,.css-4okk7a .katex .fontsize-ensurer.reset-size3.size2{font-size:0.85714286em;}.css-4okk7a .katex .sizing.reset-size3.size3,.css-4okk7a .katex .fontsize-ensurer.reset-size3.size3{font-size:1em;}.css-4okk7a .katex .sizing.reset-size3.size4,.css-4okk7a .katex .fontsize-ensurer.reset-size3.size4{font-size:1.14285714em;}.css-4okk7a .katex .sizing.reset-size3.size5,.css-4okk7a .katex .fontsize-ensurer.reset-size3.size5{font-size:1.28571429em;}.css-4okk7a .katex .sizing.reset-size3.size6,.css-4okk7a .katex .fontsize-ensurer.reset-size3.size6{font-size:1.42857143em;}.css-4okk7a .katex .sizing.reset-size3.size7,.css-4okk7a .katex .fontsize-ensurer.reset-size3.size7{font-size:1.71428571em;}.css-4okk7a .katex .sizing.reset-size3.size8,.css-4okk7a .katex .fontsize-ensurer.reset-size3.size8{font-size:2.05714286em;}.css-4okk7a .katex .sizing.reset-size3.size9,.css-4okk7a .katex .fontsize-ensurer.reset-size3.size9{font-size:2.46857143em;}.css-4okk7a .katex .sizing.reset-size3.size10,.css-4okk7a .katex .fontsize-ensurer.reset-size3.size10{font-size:2.96285714em;}.css-4okk7a .katex .sizing.reset-size3.size11,.css-4okk7a .katex .fontsize-ensurer.reset-size3.size11{font-size:3.55428571em;}.css-4okk7a .katex .sizing.reset-size4.size1,.css-4okk7a .katex .fontsize-ensurer.reset-size4.size1{font-size:0.625em;}.css-4okk7a .katex .sizing.reset-size4.size2,.css-4okk7a .katex .fontsize-ensurer.reset-size4.size2{font-size:0.75em;}.css-4okk7a .katex .sizing.reset-size4.size3,.css-4okk7a .katex .fontsize-ensurer.reset-size4.size3{font-size:0.875em;}.css-4okk7a .katex .sizing.reset-size4.size4,.css-4okk7a .katex .fontsize-ensurer.reset-size4.size4{font-size:1em;}.css-4okk7a .katex .sizing.reset-size4.size5,.css-4okk7a .katex .fontsize-ensurer.reset-size4.size5{font-size:1.125em;}.css-4okk7a .katex .sizing.reset-size4.size6,.css-4okk7a .katex .fontsize-ensurer.reset-size4.size6{font-size:1.25em;}.css-4okk7a .katex .sizing.reset-size4.size7,.css-4okk7a .katex .fontsize-ensurer.reset-size4.size7{font-size:1.5em;}.css-4okk7a .katex .sizing.reset-size4.size8,.css-4okk7a .katex .fontsize-ensurer.reset-size4.size8{font-size:1.8em;}.css-4okk7a .katex .sizing.reset-size4.size9,.css-4okk7a .katex .fontsize-ensurer.reset-size4.size9{font-size:2.16em;}.css-4okk7a .katex .sizing.reset-size4.size10,.css-4okk7a .katex .fontsize-ensurer.reset-size4.size10{font-size:2.5925em;}.css-4okk7a .katex .sizing.reset-size4.size11,.css-4okk7a .katex .fontsize-ensurer.reset-size4.size11{font-size:3.11em;}.css-4okk7a .katex .sizing.reset-size5.size1,.css-4okk7a .katex .fontsize-ensurer.reset-size5.size1{font-size:0.55555556em;}.css-4okk7a .katex .sizing.reset-size5.size2,.css-4okk7a .katex .fontsize-ensurer.reset-size5.size2{font-size:0.66666667em;}.css-4okk7a .katex .sizing.reset-size5.size3,.css-4okk7a .katex .fontsize-ensurer.reset-size5.size3{font-size:0.77777778em;}.css-4okk7a .katex .sizing.reset-size5.size4,.css-4okk7a .katex .fontsize-ensurer.reset-size5.size4{font-size:0.88888889em;}.css-4okk7a .katex .sizing.reset-size5.size5,.css-4okk7a .katex .fontsize-ensurer.reset-size5.size5{font-size:1em;}.css-4okk7a .katex .sizing.reset-size5.size6,.css-4okk7a .katex .fontsize-ensurer.reset-size5.size6{font-size:1.11111111em;}.css-4okk7a .katex .sizing.reset-size5.size7,.css-4okk7a .katex .fontsize-ensurer.reset-size5.size7{font-size:1.33333333em;}.css-4okk7a .katex .sizing.reset-size5.size8,.css-4okk7a .katex .fontsize-ensurer.reset-size5.size8{font-size:1.6em;}.css-4okk7a .katex .sizing.reset-size5.size9,.css-4okk7a .katex .fontsize-ensurer.reset-size5.size9{font-size:1.92em;}.css-4okk7a .katex .sizing.reset-size5.size10,.css-4okk7a .katex .fontsize-ensurer.reset-size5.size10{font-size:2.30444444em;}.css-4okk7a .katex .sizing.reset-size5.size11,.css-4okk7a .katex .fontsize-ensurer.reset-size5.size11{font-size:2.76444444em;}.css-4okk7a .katex .sizing.reset-size6.size1,.css-4okk7a .katex .fontsize-ensurer.reset-size6.size1{font-size:0.5em;}.css-4okk7a .katex .sizing.reset-size6.size2,.css-4okk7a .katex .fontsize-ensurer.reset-size6.size2{font-size:0.6em;}.css-4okk7a .katex .sizing.reset-size6.size3,.css-4okk7a .katex .fontsize-ensurer.reset-size6.size3{font-size:0.7em;}.css-4okk7a .katex .sizing.reset-size6.size4,.css-4okk7a .katex .fontsize-ensurer.reset-size6.size4{font-size:0.8em;}.css-4okk7a .katex .sizing.reset-size6.size5,.css-4okk7a .katex .fontsize-ensurer.reset-size6.size5{font-size:0.9em;}.css-4okk7a .katex .sizing.reset-size6.size6,.css-4okk7a .katex .fontsize-ensurer.reset-size6.size6{font-size:1em;}.css-4okk7a .katex .sizing.reset-size6.size7,.css-4okk7a .katex .fontsize-ensurer.reset-size6.size7{font-size:1.2em;}.css-4okk7a .katex .sizing.reset-size6.size8,.css-4okk7a .katex .fontsize-ensurer.reset-size6.size8{font-size:1.44em;}.css-4okk7a .katex .sizing.reset-size6.size9,.css-4okk7a .katex .fontsize-ensurer.reset-size6.size9{font-size:1.728em;}.css-4okk7a .katex .sizing.reset-size6.size10,.css-4okk7a .katex .fontsize-ensurer.reset-size6.size10{font-size:2.074em;}.css-4okk7a .katex .sizing.reset-size6.size11,.css-4okk7a .katex .fontsize-ensurer.reset-size6.size11{font-size:2.488em;}.css-4okk7a .katex .sizing.reset-size7.size1,.css-4okk7a .katex .fontsize-ensurer.reset-size7.size1{font-size:0.41666667em;}.css-4okk7a .katex .sizing.reset-size7.size2,.css-4okk7a .katex .fontsize-ensurer.reset-size7.size2{font-size:0.5em;}.css-4okk7a .katex .sizing.reset-size7.size3,.css-4okk7a .katex .fontsize-ensurer.reset-size7.size3{font-size:0.58333333em;}.css-4okk7a .katex .sizing.reset-size7.size4,.css-4okk7a .katex .fontsize-ensurer.reset-size7.size4{font-size:0.66666667em;}.css-4okk7a .katex .sizing.reset-size7.size5,.css-4okk7a .katex .fontsize-ensurer.reset-size7.size5{font-size:0.75em;}.css-4okk7a .katex .sizing.reset-size7.size6,.css-4okk7a .katex .fontsize-ensurer.reset-size7.size6{font-size:0.83333333em;}.css-4okk7a .katex .sizing.reset-size7.size7,.css-4okk7a .katex .fontsize-ensurer.reset-size7.size7{font-size:1em;}.css-4okk7a .katex .sizing.reset-size7.size8,.css-4okk7a .katex .fontsize-ensurer.reset-size7.size8{font-size:1.2em;}.css-4okk7a .katex .sizing.reset-size7.size9,.css-4okk7a .katex .fontsize-ensurer.reset-size7.size9{font-size:1.44em;}.css-4okk7a .katex .sizing.reset-size7.size10,.css-4okk7a .katex .fontsize-ensurer.reset-size7.size10{font-size:1.72833333em;}.css-4okk7a .katex .sizing.reset-size7.size11,.css-4okk7a .katex .fontsize-ensurer.reset-size7.size11{font-size:2.07333333em;}.css-4okk7a .katex .sizing.reset-size8.size1,.css-4okk7a .katex .fontsize-ensurer.reset-size8.size1{font-size:0.34722222em;}.css-4okk7a .katex .sizing.reset-size8.size2,.css-4okk7a .katex .fontsize-ensurer.reset-size8.size2{font-size:0.41666667em;}.css-4okk7a .katex .sizing.reset-size8.size3,.css-4okk7a .katex .fontsize-ensurer.reset-size8.size3{font-size:0.48611111em;}.css-4okk7a .katex .sizing.reset-size8.size4,.css-4okk7a .katex .fontsize-ensurer.reset-size8.size4{font-size:0.55555556em;}.css-4okk7a .katex .sizing.reset-size8.size5,.css-4okk7a .katex .fontsize-ensurer.reset-size8.size5{font-size:0.625em;}.css-4okk7a .katex .sizing.reset-size8.size6,.css-4okk7a .katex .fontsize-ensurer.reset-size8.size6{font-size:0.69444444em;}.css-4okk7a .katex .sizing.reset-size8.size7,.css-4okk7a .katex .fontsize-ensurer.reset-size8.size7{font-size:0.83333333em;}.css-4okk7a .katex .sizing.reset-size8.size8,.css-4okk7a .katex .fontsize-ensurer.reset-size8.size8{font-size:1em;}.css-4okk7a .katex .sizing.reset-size8.size9,.css-4okk7a .katex .fontsize-ensurer.reset-size8.size9{font-size:1.2em;}.css-4okk7a .katex .sizing.reset-size8.size10,.css-4okk7a .katex .fontsize-ensurer.reset-size8.size10{font-size:1.44027778em;}.css-4okk7a .katex .sizing.reset-size8.size11,.css-4okk7a .katex .fontsize-ensurer.reset-size8.size11{font-size:1.72777778em;}.css-4okk7a .katex .sizing.reset-size9.size1,.css-4okk7a .katex .fontsize-ensurer.reset-size9.size1{font-size:0.28935185em;}.css-4okk7a .katex .sizing.reset-size9.size2,.css-4okk7a .katex .fontsize-ensurer.reset-size9.size2{font-size:0.34722222em;}.css-4okk7a .katex .sizing.reset-size9.size3,.css-4okk7a .katex .fontsize-ensurer.reset-size9.size3{font-size:0.40509259em;}.css-4okk7a .katex .sizing.reset-size9.size4,.css-4okk7a .katex .fontsize-ensurer.reset-size9.size4{font-size:0.46296296em;}.css-4okk7a .katex .sizing.reset-size9.size5,.css-4okk7a .katex .fontsize-ensurer.reset-size9.size5{font-size:0.52083333em;}.css-4okk7a .katex .sizing.reset-size9.size6,.css-4okk7a .katex .fontsize-ensurer.reset-size9.size6{font-size:0.5787037em;}.css-4okk7a .katex .sizing.reset-size9.size7,.css-4okk7a .katex .fontsize-ensurer.reset-size9.size7{font-size:0.69444444em;}.css-4okk7a .katex .sizing.reset-size9.size8,.css-4okk7a .katex .fontsize-ensurer.reset-size9.size8{font-size:0.83333333em;}.css-4okk7a .katex .sizing.reset-size9.size9,.css-4okk7a .katex .fontsize-ensurer.reset-size9.size9{font-size:1em;}.css-4okk7a .katex .sizing.reset-size9.size10,.css-4okk7a .katex .fontsize-ensurer.reset-size9.size10{font-size:1.20023148em;}.css-4okk7a .katex .sizing.reset-size9.size11,.css-4okk7a .katex .fontsize-ensurer.reset-size9.size11{font-size:1.43981481em;}.css-4okk7a .katex .sizing.reset-size10.size1,.css-4okk7a .katex .fontsize-ensurer.reset-size10.size1{font-size:0.24108004em;}.css-4okk7a .katex .sizing.reset-size10.size2,.css-4okk7a .katex .fontsize-ensurer.reset-size10.size2{font-size:0.28929605em;}.css-4okk7a .katex .sizing.reset-size10.size3,.css-4okk7a .katex .fontsize-ensurer.reset-size10.size3{font-size:0.33751205em;}.css-4okk7a .katex .sizing.reset-size10.size4,.css-4okk7a .katex .fontsize-ensurer.reset-size10.size4{font-size:0.38572806em;}.css-4okk7a .katex .sizing.reset-size10.size5,.css-4okk7a .katex .fontsize-ensurer.reset-size10.size5{font-size:0.43394407em;}.css-4okk7a .katex .sizing.reset-size10.size6,.css-4okk7a .katex .fontsize-ensurer.reset-size10.size6{font-size:0.48216008em;}.css-4okk7a .katex .sizing.reset-size10.size7,.css-4okk7a .katex .fontsize-ensurer.reset-size10.size7{font-size:0.57859209em;}.css-4okk7a .katex .sizing.reset-size10.size8,.css-4okk7a .katex .fontsize-ensurer.reset-size10.size8{font-size:0.69431051em;}.css-4okk7a .katex .sizing.reset-size10.size9,.css-4okk7a .katex .fontsize-ensurer.reset-size10.size9{font-size:0.83317261em;}.css-4okk7a .katex .sizing.reset-size10.size10,.css-4okk7a .katex .fontsize-ensurer.reset-size10.size10{font-size:1em;}.css-4okk7a .katex .sizing.reset-size10.size11,.css-4okk7a .katex .fontsize-ensurer.reset-size10.size11{font-size:1.19961427em;}.css-4okk7a .katex .sizing.reset-size11.size1,.css-4okk7a .katex .fontsize-ensurer.reset-size11.size1{font-size:0.20096463em;}.css-4okk7a .katex .sizing.reset-size11.size2,.css-4okk7a .katex .fontsize-ensurer.reset-size11.size2{font-size:0.24115756em;}.css-4okk7a .katex .sizing.reset-size11.size3,.css-4okk7a .katex .fontsize-ensurer.reset-size11.size3{font-size:0.28135048em;}.css-4okk7a .katex .sizing.reset-size11.size4,.css-4okk7a .katex .fontsize-ensurer.reset-size11.size4{font-size:0.32154341em;}.css-4okk7a .katex .sizing.reset-size11.size5,.css-4okk7a .katex .fontsize-ensurer.reset-size11.size5{font-size:0.36173633em;}.css-4okk7a .katex .sizing.reset-size11.size6,.css-4okk7a .katex .fontsize-ensurer.reset-size11.size6{font-size:0.40192926em;}.css-4okk7a .katex .sizing.reset-size11.size7,.css-4okk7a .katex .fontsize-ensurer.reset-size11.size7{font-size:0.48231511em;}.css-4okk7a .katex .sizing.reset-size11.size8,.css-4okk7a .katex .fontsize-ensurer.reset-size11.size8{font-size:0.57877814em;}.css-4okk7a .katex .sizing.reset-size11.size9,.css-4okk7a .katex .fontsize-ensurer.reset-size11.size9{font-size:0.69453376em;}.css-4okk7a .katex .sizing.reset-size11.size10,.css-4okk7a .katex .fontsize-ensurer.reset-size11.size10{font-size:0.83360129em;}.css-4okk7a .katex .sizing.reset-size11.size11,.css-4okk7a .katex .fontsize-ensurer.reset-size11.size11{font-size:1em;}.css-4okk7a .katex .delimsizing.size1{font-family:KaTeX_Size1;}.css-4okk7a .katex .delimsizing.size2{font-family:KaTeX_Size2;}.css-4okk7a .katex .delimsizing.size3{font-family:KaTeX_Size3;}.css-4okk7a .katex .delimsizing.size4{font-family:KaTeX_Size4;}.css-4okk7a .katex .delimsizing.mult .delim-size1>span{font-family:KaTeX_Size1;}.css-4okk7a .katex .delimsizing.mult .delim-size4>span{font-family:KaTeX_Size4;}.css-4okk7a .katex .nulldelimiter{display:inline-block;width:0.12em;}.css-4okk7a .katex .delimcenter{position:relative;}.css-4okk7a .katex .op-symbol{position:relative;}.css-4okk7a .katex .op-symbol.small-op{font-family:KaTeX_Size1;}.css-4okk7a .katex .op-symbol.large-op{font-family:KaTeX_Size2;}.css-4okk7a .katex .op-limits>.vlist-t{text-align:center;}.css-4okk7a .katex .accent>.vlist-t{text-align:center;}.css-4okk7a .katex .accent .accent-body{position:relative;}.css-4okk7a .katex .accent .accent-body:not(.accent-full){width:0;}.css-4okk7a .katex .overlay{display:block;}.css-4okk7a .katex .mtable .vertical-separator{display:inline-block;min-width:1px;}.css-4okk7a .katex .mtable .arraycolsep{display:inline-block;}.css-4okk7a .katex .mtable .col-align-c>.vlist-t{text-align:center;}.css-4okk7a .katex .mtable .col-align-l>.vlist-t{text-align:left;}.css-4okk7a .katex .mtable .col-align-r>.vlist-t{text-align:right;}.css-4okk7a .katex .svg-align{text-align:left;}.css-4okk7a .katex svg{display:block;position:absolute;width:100%;height:inherit;fill:currentColor;stroke:currentColor;fill-rule:nonzero;fill-opacity:1;stroke-width:1;stroke-linecap:butt;stroke-linejoin:miter;stroke-miterlimit:4;stroke-dasharray:none;stroke-dashoffset:0;stroke-opacity:1;}.css-4okk7a .katex svg path{stroke:none;}.css-4okk7a .katex img{border-style:none;min-width:0;min-height:0;max-width:none;max-height:none;}.css-4okk7a .katex .stretchy{width:100%;display:block;position:relative;overflow:hidden;}.css-4okk7a .katex .stretchy::before,.css-4okk7a .katex .stretchy::after{content:'';}.css-4okk7a .katex .hide-tail{width:100%;position:relative;overflow:hidden;}.css-4okk7a .katex .halfarrow-left{position:absolute;left:0;width:50.2%;overflow:hidden;}.css-4okk7a .katex .halfarrow-right{position:absolute;right:0;width:50.2%;overflow:hidden;}.css-4okk7a .katex .brace-left{position:absolute;left:0;width:25.1%;overflow:hidden;}.css-4okk7a .katex .brace-center{position:absolute;left:25%;width:50%;overflow:hidden;}.css-4okk7a .katex .brace-right{position:absolute;right:0;width:25.1%;overflow:hidden;}.css-4okk7a .katex .x-arrow-pad{padding:0 0.5em;}.css-4okk7a .katex .cd-arrow-pad{padding:0 0.55556em 0 0.27778em;}.css-4okk7a .katex .x-arrow,.css-4okk7a .katex .mover,.css-4okk7a .katex .munder{text-align:center;}.css-4okk7a .katex .boxpad{padding:0 0.3em 0 0.3em;}.css-4okk7a .katex .fbox,.css-4okk7a .katex .fcolorbox{box-sizing:border-box;border:0.04em solid;}.css-4okk7a .katex .cancel-pad{padding:0 0.2em 0 0.2em;}.css-4okk7a .katex .cancel-lap{margin-left:-0.2em;margin-right:-0.2em;}.css-4okk7a .katex .sout{border-bottom-style:solid;border-bottom-width:0.08em;}.css-4okk7a .katex .angl{box-sizing:border-box;border-top:0.049em solid;border-right:0.049em solid;margin-right:0.03889em;}.css-4okk7a .katex .anglpad{padding:0 0.03889em 0 0.03889em;}.css-4okk7a .katex .eqn-num::before{counter-increment:katexEqnNo;content:'(' counter(katexEqnNo) ')';}.css-4okk7a .katex .mml-eqn-num::before{counter-increment:mmlEqnNo;content:'(' counter(mmlEqnNo) ')';}.css-4okk7a .katex .mtr-glue{width:50%;}.css-4okk7a .katex .cd-vert-arrow{display:inline-block;position:relative;}.css-4okk7a .katex .cd-label-left{display:inline-block;position:absolute;right:calc(50% + 0.3em);text-align:left;}.css-4okk7a .katex .cd-label-right{display:inline-block;position:absolute;left:calc(50% + 0.3em);text-align:right;}.css-4okk7a .katex-display{display:block;margin:1em 0;text-align:center;}.css-4okk7a .katex-display>.katex{display:block;white-space:nowrap;}.css-4okk7a .katex-display>.katex>.katex-html{display:block;position:relative;}.css-4okk7a .katex-display>.katex>.katex-html>.tag{position:absolute;right:0;}.css-4okk7a .katex-display.leqno>.katex>.katex-html>.tag{left:0;right:auto;}.css-4okk7a .katex-display.fleqn>.katex{text-align:left;padding-left:2em;}.css-4okk7a body{counter-reset:katexEqnNo mmlEqnNo;}.css-4okk7a table{width:-webkit-max-content;width:-moz-max-content;width:max-content;}.css-4okk7a .tableBlock{max-width:100%;margin-bottom:1rem;overflow-y:scroll;}.css-4okk7a .tableBlock thead,.css-4okk7a .tableBlock thead th{border-bottom:1px solid #333!important;}.css-4okk7a .tableBlock th,.css-4okk7a .tableBlock td{padding:10px;text-align:left;}.css-4okk7a .tableBlock th{font-weight:bold!important;}.css-4okk7a .tableBlock caption{caption-side:bottom;color:#555;font-size:12px;font-style:italic;text-align:center;}.css-4okk7a .tableBlock caption>p{margin:0;}.css-4okk7a .tableBlock th>p,.css-4okk7a .tableBlock td>p{margin:0;}.css-4okk7a .tableBlock [data-background-color='aliceblue']{background-color:#f0f8ff;color:#000;}.css-4okk7a .tableBlock [data-background-color='black']{background-color:#000;color:#fff;}.css-4okk7a .tableBlock [data-background-color='chocolate']{background-color:#d2691e;color:#fff;}.css-4okk7a .tableBlock [data-background-color='cornflowerblue']{background-color:#6495ed;color:#fff;}.css-4okk7a .tableBlock [data-background-color='crimson']{background-color:#dc143c;color:#fff;}.css-4okk7a .tableBlock [data-background-color='darkblue']{background-color:#00008b;color:#fff;}.css-4okk7a .tableBlock [data-background-color='darkseagreen']{background-color:#8fbc8f;color:#000;}.css-4okk7a .tableBlock [data-background-color='deepskyblue']{background-color:#00bfff;color:#000;}.css-4okk7a .tableBlock [data-background-color='gainsboro']{background-color:#dcdcdc;color:#000;}.css-4okk7a .tableBlock [data-background-color='grey']{background-color:#808080;color:#fff;}.css-4okk7a .tableBlock [data-background-color='lemonchiffon']{background-color:#fffacd;color:#000;}.css-4okk7a .tableBlock [data-background-color='lightpink']{background-color:#ffb6c1;color:#000;}.css-4okk7a .tableBlock [data-background-color='lightsalmon']{background-color:#ffa07a;color:#000;}.css-4okk7a .tableBlock [data-background-color='lightskyblue']{background-color:#87cefa;color:#000;}.css-4okk7a .tableBlock [data-background-color='mediumblue']{background-color:#0000cd;color:#fff;}.css-4okk7a .tableBlock [data-background-color='omnigrey']{background-color:#f0f0f0;color:#000;}.css-4okk7a .tableBlock [data-background-color='white']{background-color:#fff;color:#000;}.css-4okk7a .tableBlock [data-text-align='center']{text-align:center;}.css-4okk7a .tableBlock [data-text-align='left']{text-align:left;}.css-4okk7a .tableBlock [data-text-align='right']{text-align:right;}.css-4okk7a .tableBlock [data-vertical-align='bottom']{vertical-align:bottom;}.css-4okk7a .tableBlock [data-vertical-align='middle']{vertical-align:middle;}.css-4okk7a .tableBlock [data-vertical-align='top']{vertical-align:top;}.css-4okk7a .tableBlock__font-size--xxsmall{font-size:10px;}.css-4okk7a .tableBlock__font-size--xsmall{font-size:12px;}.css-4okk7a .tableBlock__font-size--small{font-size:14px;}.css-4okk7a .tableBlock__font-size--large{font-size:18px;}.css-4okk7a .tableBlock__border--some tbody tr:not(:last-child){border-bottom:1px solid #e2e5e7;}.css-4okk7a .tableBlock__border--bordered td,.css-4okk7a .tableBlock__border--bordered th{border:1px solid #e2e5e7;}.css-4okk7a .tableBlock__border--borderless tbody+tbody,.css-4okk7a .tableBlock__border--borderless td,.css-4okk7a .tableBlock__border--borderless th,.css-4okk7a .tableBlock__border--borderless tr,.css-4okk7a .tableBlock__border--borderless thead,.css-4okk7a .tableBlock__border--borderless thead th{border:0!important;}.css-4okk7a .tableBlock:not(.tableBlock__table-striped) tbody tr{background-color:unset!important;}.css-4okk7a .tableBlock__table-striped tbody tr:nth-of-type(odd){background-color:#f9fafc!important;}.css-4okk7a .tableBlock__table-compactl th,.css-4okk7a .tableBlock__table-compact td{padding:3px!important;}.css-4okk7a .tableBlock__full-size{width:100%;}.css-4okk7a .textBlock{margin-bottom:16px;}.css-4okk7a .textBlock__text-formatting--finePrint{font-size:12px;}.css-4okk7a .textBlock__text-infoBox{padding:0.75rem 1.25rem;margin-bottom:1rem;border:1px solid transparent;border-radius:0.25rem;}.css-4okk7a .textBlock__text-infoBox p{margin:0;}.css-4okk7a .textBlock__text-infoBox--primary{background-color:#cce5ff;border-color:#b8daff;color:#004085;}.css-4okk7a .textBlock__text-infoBox--secondary{background-color:#e2e3e5;border-color:#d6d8db;color:#383d41;}.css-4okk7a .textBlock__text-infoBox--success{background-color:#d4edda;border-color:#c3e6cb;color:#155724;}.css-4okk7a .textBlock__text-infoBox--danger{background-color:#f8d7da;border-color:#f5c6cb;color:#721c24;}.css-4okk7a .textBlock__text-infoBox--warning{background-color:#fff3cd;border-color:#ffeeba;color:#856404;}.css-4okk7a .textBlock__text-infoBox--info{background-color:#d1ecf1;border-color:#bee5eb;color:#0c5460;}.css-4okk7a .textBlock__text-infoBox--dark{background-color:#d6d8d9;border-color:#c6c8ca;color:#1b1e21;}.css-4okk7a .text-overline{-webkit-text-decoration:overline;text-decoration:overline;}.css-4okk7a.css-4okk7a{color:#2B3148;background-color:transparent;font-family:"Roboto","Helvetica","Arial",sans-serif;font-size:20px;line-height:24px;overflow:visible;padding-top:0px;position:relative;}.css-4okk7a.css-4okk7a:after{content:'';-webkit-transform:scale(0);-moz-transform:scale(0);-ms-transform:scale(0);transform:scale(0);position:absolute;border:2px solid #EA9430;border-radius:2px;inset:-8px;z-index:1;}.css-4okk7a .js-external-link-button.link-like,.css-4okk7a .js-external-link-anchor{color:inherit;border-radius:1px;-webkit-text-decoration:underline;text-decoration:underline;}.css-4okk7a .js-external-link-button.link-like:hover,.css-4okk7a .js-external-link-anchor:hover,.css-4okk7a .js-external-link-button.link-like:active,.css-4okk7a .js-external-link-anchor:active{text-decoration-thickness:2px;text-shadow:1px 0 0;}.css-4okk7a .js-external-link-button.link-like:focus-visible,.css-4okk7a .js-external-link-anchor:focus-visible{outline:transparent 2px dotted;box-shadow:0 0 0 2px #6314E6;}.css-4okk7a p,.css-4okk7a div{margin:0px;display:block;}.css-4okk7a pre{margin:0px;display:block;}.css-4okk7a pre code{display:block;width:-webkit-fit-content;width:-moz-fit-content;width:fit-content;}.css-4okk7a pre:not(:first-child){padding-top:8px;}.css-4okk7a ul,.css-4okk7a ol{display:block margin:0px;padding-left:20px;}.css-4okk7a ul li,.css-4okk7a ol li{padding-top:8px;}.css-4okk7a ul ul,.css-4okk7a ol ul,.css-4okk7a ul ol,.css-4okk7a ol ol{padding-top:0px;}.css-4okk7a ul:not(:first-child),.css-4okk7a ol:not(:first-child){padding-top:4px;} Statistical parameters
Confidence level
Margin of error
Proportion estimate
Your initial estimate of the result you will obtain.
Sample size
Correction for finite population
- Cookies & Privacy
- GETTING STARTED
- Introduction
- FUNDAMENTALS
- Acknowledgements
- Research questions & hypotheses
- Concepts, constructs & variables
- Research limitations
- Getting started
- Sampling Strategy
- Research Quality
- Research Ethics
- Data Analysis
Sampling: The Basics
Sampling is an important component of any piece of research because of the significant impact that it can have on the quality of your results/findings . If you are new to sampling, there are a number of key terms and basic principles that act as a foundation to the subject. This article explains these key terms and basic principles. Rather than a comprehensive look at sampling, the article presents the sampling basics that you would need to know if you were an undergraduate or master's level student about to perform a dissertation (or similar piece of research). It also provides links to other articles within the Sampling Strategy section of this website that you may find useful. Some of the key sampling terms you will come across include population , units , sample , sample size , sampling frame , sampling techniques and sampling bias . Each is discussed in turn:
- Sample size
Sampling frame
Sampling bias, sampling techniques.
The word population is different when used in research compared with the way we think about a population under normal circumstances. Typically, we refer to the population of a country (or region), such as the United States or Great Britain. However, in research (and the theory of sampling ), the word population has a different meaning. In sampling, a population signifies the units that we are interested in studying. These units could be people , cases and pieces of data . Some examples of each of these types of population are present below:
Students enrolled at a university (e.g., Harvard University) or studying a particular course (e.g., Statistics 101) United States Senators or Congressman who are Democrats Users of Facebook or Twitter Presidents and CEOs of Fortune 500 or FTSE 100 companies Nurses working at hospitals in the State of Texas
Cases (i.e., organisations, institutions, countries, etc.)
Recruitment agencies in Greater London, England Law firms in Manhattan, New York, United States The World Trade Organisation (WTO) The European Parliament Countries that are members of NATO Signatories of the Helsinki Accord
Pieces of data
Customer transactions at Wal-Mart or Tesco between two time points (e.g., 1st April 2009 and 31st March 2010) The breaking distances (in kpm/m) of a particular model of car University applications in the United States in 2011 Households with broadband subscriptions in the town of Carmarthen, Wales
When thinking about the population you are interested in studying, it is important to be precise . For example, if we say that our population is users of Facebook , this would imply that we were interested in all 500 million (or more) Facebook users, irrespective of what country they were in, whether they were male or female, what age they were, how often they used Facebook, and so forth. However, if the population you were interested in was more specific , you should make this clear. Perhaps our population is not Facebook users , but frequent, male Facebook users in the United States . When we come to describe our population further, we would also need to define what we meant by frequent users (e.g., people that log in to Facebook at least once a day).
As discussed above, the population that you are interested consists of units , which can be people , cases or pieces of data . These terms can sometimes be used interchangeably. In this website, we use the word units whenever we are referring to those things that make up a population. However, since you may find other textbooks referring to these units as people, cases, or pieces of data, we have provided some further clarification below:
The population you are interested in consists of one or more units. For example, if the population we were interested in was all 500 million (or more) Facebook users, each of these Facebook users would be a unit . So we would have 500 million (or more) units in our population. If we were interested in CEOs (or Presidents) of Fortune 500 companies, the CEOs (or Presidents ) would be our units.
Sometimes the word units is replaced with the word cases . As highlighted in the population examples above, sometimes the populations we are interested in are organisations, institutions and countries. In such cases, it is often more appropriate to refer to each of these (e.g., recruitment agencies, law firms) as cases . You may be interested in a population that consists of only one case (e.g., the World Trade Organisation or European Parliament) or maybe you are interested in a population that has many cases (e.g., recruitment agencies in London, of which there must be hundreds).
Finally, researchers sometimes refer to populations consisting of data (or pieces of data ) instead of units or cases . For example, researchers may be interested in customer transactions at a particular supermarket (e.g., Wal-Mart or Tesco) between two time points (e.g., 1st April 2009 and 31st March 2010); perhaps because they want to examine the effect of certain promotions on sales figures.
When we are interested in a population, it is often impractical and sometimes undesirable to try and study the entire population. For example, if the population we were interested in was frequent, male Facebook users in the United States , this could be millions of users (i.e., millions of units). If we chose to study these Facebook users using structured interviews (i.e., our chosen research method), it could take a lifetime. Therefore, we choose to study just a sample of these Facebook users.
Whilst we discuss more about sampling and why we sample later in this article, the important point to remember here is that a sample consists of only those units (in this case, Facebook users) from our population of interest (i.e., X million frequent, male, Facebook users in the United States) that we actually study (e.g., 500 or 1000 of these Facebook users).
Sample Size
The sample size is simply the number of units in your sample. In the example above, the sample size selected may be just 500 or 1000 of the Facebook users that are part of our population of frequent, male, Facebook users in the United States .
In practice, the sample size that is selected for a study can have a significant impact on the quality of your results/findings , with sample sizes that are either too small or excessively large both potentially leading to incorrect findings. As a result, sample size calculations are sometimes performed to determine how large your sample size needs to be to avoid such problems. However, these calculations can be complex, and are typically not performed at the undergraduate and master's level when completing a dissertation.
The sampling frame is very similar to the population you are studying, and may be exactly the same . When selecting units from the population to be included in your sample, it is sometimes desirable to get hold of a list of the population from which you select units. This is the case when using certain types of sampling technique (i.e., probability sampling techniques ), which we discuss later in the article. This list can be referred to as the sampling frame . We explain more about sampling frames in the article: Probability sampling .
Sampling bias occurs when the units that are selected from the population for inclusion in your sample are not characteristic of (i.e., do not reflect) the population. This can lead to your sample being unrepresentative of the population you are interested in.
For example, you want to measure how often residents in New York go to a Broadway show in a given year . Clearly, standing along Broadway and asking people as they pass by how often they went to Broadway shows in a given year would not make sense because a higher proportion of those passing by are likely to have just come out of a show. The sample would therefore be biased .
For this reason, we have to think carefully about the types of sampling techniques we use when selecting units to be included in our sample. Some sampling techniques, such as convenience sampling , a type of non-probability sampling (which reflected the Broadway example above), are prone to greater bias than probability sampling techniques . We discuss sampling techniques further next.
As we have mentioned above, when we are interested in a population, we typically study a sample of that population rather than attempt to study the whole population (e.g., just 500 of the X million frequent, male Facebook users in the United States). If we imagine that our desired sample size was just 500 of these Facebook users, the question arises: How do we know what Facebook users to invite to take part in our sample? In other words, what Facebook users will become part of our sample?
The purpose of sampling techniques is to help you select units (e.g., Facebook users) to be included in your sample (e.g., of 500 Facebook users). Broadly speaking, there are two groups of sampling technique: probability sampling techniques and non-probability sampling techniques .
Probability sampling techniques
Probability sampling techniques use random selection (i.e., probabilistic methods ) to help you select units from your sampling frame (i.e., similar or exactly that same as your population) to be included in your sample. These procedures (i.e., probabilistic methods ) are very clearly defined, making it easy to follow them. Since the characteristics of the sample researchers are interested in vary, different types of probability sampling technique exist to help you select the appropriate units to be included in your sample. These types of probability sampling technique include simple random sampling , systematic random sampling , stratified random sampling and cluster sampling .
We discuss probability sampling in more detail the article, Probability sampling . We also discuss each of these different types of probability sampling technique, how to carry them out, and their advantages and disadvantages [see the articles: Simple random sampling , Systematic random sampling and Stratified random sampling ].
Non-probability sampling techniques
Non-probability sampling techniques refer on the subjective judgement of the researcher when selecting units from the population to be included in the sample. For some of the different types of non-probability sampling technique, the procedures for selecting units to be included in the sample are very clearly defined, just like probability sampling techniques. However, in others (e.g., purposive sampling ), the subjective judgement required to select units from the population, which involves a combination of theory , experience and insight from the research process , makes selecting units more complicated. Overall, the types of non-probability sampling technique you are likely to come across include quota sampling , purposive sampling , convenience sampling , snowball sampling and self-section sampling .
We discuss non-probability sampling in more detail in the article, Non-probability sampling . We also discuss each of these different types of non-probability sampling technique, how to carry them out, and their advantages and disadvantages [see the articles: Quota sampling , Purposive sampling , Convenience sampling , Snowball sampling and Self-selection sampling ].
If you want to know more about the sampling techniques you may use in your dissertation, read up on probability sampling and non-probability sampling .
- A/B Monadic Test
- A/B Pre-Roll Test
- Key Driver Analysis
- Multiple Implicit
- Penalty Reward
- Price Sensitivity
- Segmentation
- Single Implicit
- Category Exploration
- Competitive Landscape
- Consumer Segmentation
- Innovation & Renovation
- Product Portfolio
- Marketing Creatives
- Advertising
- Shelf Optimization
- Performance Monitoring
- Better Brand Health Tracking
- Ad Tracking
- Trend Tracking
- Satisfaction Tracking
- AI Insights
- Case Studies
quantilope is the Consumer Intelligence Platform for all end-to-end research needs
How To Determine Sample Size for Quantitative Research

This blog post looks at how large a sample size should be for reliable, usable market research findings.
Table of Contents:
What is sample size , why do you need to determine sample size , variables that impact sample size.
- Determining sample size
The sample size of a quantitative study is the number of people who complete questionnaires in a research project. It is a representative sample of the target audience in which you are interested.
Back to Table of Contents
You need to determine how big of a sample size you need so that you can be sure the quantitative data you get from a survey is reflective of your target population as a whole - and so that the decisions you make based on the research have a firm foundation. Too big a sample and a project can be needlessly expensive and time-consuming. Too small a sample size, and you risk interviewing the wrong respondents - meaning ultimately you miss out on valuable insights.
There are a few variables to be aware of before working out the right sample size for your project.
Population size
The subject matter of your research will determine who your respondents are - chocolate eaters, dentists, homeowners, drivers, people who work in IT, etc. For your respective group of interest, the total of this target group (i.e. the number of chocolate eaters/homeowners/drivers that exist in the general population) will guide how many respondents you need to interview for reliable results in that field.
Ideally, you would use a random sample of people who fit within the group of people you’re interested in. Some of these people are easy to get hold of, while others aren‘t as easy. Some represent smaller groups of people in the population, so a small sample is inevitable. For example, if you’re interviewing chocolate eaters aged 5-99 you’ll have a larger sample size - and a much easier time sampling the population - than if you’re interviewing healthcare professionals who specialize in a niche branch of medicine.
Confidence interval (margin of error)
Confidence intervals, otherwise known as the margin of error, indicate the reliability of statistics that have been calculated by research; in other words, how certain you can be that the statistics are close to what they would be if it were possible to interview the entire population of the people you’re researching.
Confidence intervals are helpful since it would be impossible to interview all chocolate eaters in the US. However, statistics and research enable you to take a sample of that group and achieve results that reflect their opinions as a total population. Before starting a research project, you can decide how large a margin of error you will allow between the mean number of your sample and the mean number of its total population. The confidence interval is expressed as +/- a number, indicating the margin of error on either side of your statistic. For example, if 35% of chocolate eaters say that they eat chocolate for breakfast and your margin of error is 5, you’ll know that if you had asked the entire population, 30-40% of people would admit to eating chocolate at that time of day.
Confidence level
The confidence level indicates how probable it is that if you were to repeat your study multiple times with a random sample, you would get the same statistics and they would fall within the confidence interval every time.
In the example above, if you were to repeat the chocolate study over and over, you would have a certain level of confidence that those eating chocolate for breakfast would always fall within the 30-40% parameters. Most research studies have confidence intervals of 90% confident, 95% confident, or 99% confident. The number you choose will depend on whether you are happy to accept a broadly accurate set of data or whether the nature of your study demands one that is almost completely reliable.
Standard deviation
Standard deviation represents how much the results will vary from the mean number and from each other. A high standard deviation means that there is a wide range of responses to your research questions, while a low standard deviation indicates that responses are more similar to each other, clustered around the mean number. A standard deviation of 0.5 is a safe level to pick to ensure that the sample size is large enough.
Population variability
If you already know anything about your target audience, you should have a feel for the degree to which their opinions vary. If you’re interviewing the entire population of a city, without any other criteria, their views are going to be wildly diverse so you’ll want to sample a high number of residents. If you’re honing in on a sample of chocolate breakfast eaters - there’s probably a limited number of reasons why that’s their meal of choice, so you can feel confident with a much smaller sample.
Project scope
The scope and objectives of the research will have an influence on how big the sample is. If the project aims to evaluate four different pieces of stimulus (an advert, a concept, a website, etc.) and each respondent is giving feedback on a single piece, then a higher number of respondents will need to be interviewed than if each respondent were evaluating all four; the same would be true when looking for reads on four different sub-audiences vs. not needing any sub-group data cuts.
Determining a good sample size for quantitative research
Sample size, as we’ve seen, is an important factor to consider in market research projects. Getting the sample size right will result in research findings you can use confidently when translating them into action. So now that you’ve thought about the subject of your research, the population that you’d like to interview, and how confident you want to be with the findings, how do you calculate the appropriate sample size?
There are many factors that can go into determining the sample size for a study, including z-scores, standard deviations, confidence levels, and margins of error. The great thing about quantilope is that your research consultants and data scientists are the experts in helping you land on the right target so you can focus on the actual study and the findings.
To learn more about determining sample size for quantitative research, get in touch below:
Get in touch to learn more about quantitative sample sizes!
Related posts, quantilope & greenbook webinar: tapping into consumers' subconscious through implicit research, master the art of tracking with quantilope's certification course, van westendorp price sensitivity meter questions, quantilope & organic valley: understanding consumer values behind behaviors.
.webp "how to calculate sample size for dissertation")
Advanced Research
How to Calculate Your Sample Size Using a Sample Size Formula

November 25, 2021
Research 101
Maria Noesi
How To Calculate Your Sample Size Using a Sample Size Formula
Calculate sample size with a margin of error using these simple sample size formulas for your market research.

Anika Nishat
March 22, 2024
Calculating your sample size
During the course of your market research , you may be unable to reach the entire population you want to gather data about. While larger sample sizes bring you closer to a 1:1 representation of your target population, working with them can be time-consuming, expensive, and inconvenient. However, small samples risk yielding results that aren’t representative of the target population.
Luckily, you can easily identify an ideal subset that represents the population and produces strong, statistically significant results that don’t gobble up all of your resources. In this article, we'll teach how to calculate sample size with a margin of error to identify that subset.
Five steps to finding your sample size
- Define population size or number of people
Designate your margin of error
- Determine your confidence level
- Predict expected variance
- Finalize your sample size
Follow these five steps to ensure you get the right selection size for your research needs.
Download: The State of AI in Market Research

Define the size of your population
Your sample size needs will differ depending on the true population size or the total number of people you’re looking to conclude on. That’s why determining the minimum number of individuals required to represent your selection is an important first step.
Defining the size of your population can be easier said than done. While there is a lot of population data available, you may be targeting a complex population or for which no reliable data currently exists.
Knowing the size of your population is more important when dealing with relatively small, easy-to-measure groups of people. If you’re dealing with a larger population, take your best estimate, and roll with it.
This is the first step in a sample size formula, yielding more accurate results than a simple estimate – and accurately reflecting the population.

Random sample errors are inevitable whenever you’re using a subset of your total population. Be confident that your results are accurate by designating how much error you intend to permit: that’s your margin of error.
Sometimes called a "confidence interval," a margin of error indicates how much you’re willing for your sample mean to differ from your population mean . It’s often expressed alongside statistics as a plus-minus (±) figure, indicating a range which you can be relatively certain about.
For example, say you take a sample proportion of your colleagues with a designated 3% margin of error and find that 65% of your office uses some form of voice recognition technology at home. If you were to ask your entire office, you could be sure that in reality, as low as 62% and as high as 68% might use some form of voice recognition technology at home.

Determine how confident you can be
Your confidence level reveals how certain you can be that the true proportion of the total population would pick an answer within a particular range. The most common confidence levels are 90%, 95%, and 99%. Researchers most often employ a 95% confidence level.
Don’t confuse confidence levels for confidence intervals (i.e., mean of error). Remember the distinction by thinking about how the concepts relate to each other to sample more confidently.
In our example from the previous step, when you put confidence levels and intervals together, you can say you’re 95% certain that the true percentage of your colleagues who use voice recognition technology at home is within ± three percentage points from the sample mean of 65%, or between 62% and 68%.
Your confidence level corresponds to something called a "z-score." A z-score is a value that indicates the placement of your raw score (meaning the percent of your confidence level) in any number of standard deviations below or above the population mean.
Z-scores for the most common confidence intervals are:
- 90% = 2.576
- 99% = 2.576
If you’re using a different confidence interval, use this z-score table to find the correct value for your calculation.

Decide the variance you expect
The last thing you’ll want to consider when calculating your sample size is the amount of variance you expect to see among participant responses.
Standard deviation measures how much individual sample data points deviate from the average population.
Don’t know how much variance to expect? Use the standard deviation of 0.5 to make sure your group is large enough.
Read: Best Practices for Writing Discussion Guides (eBook)

Finding your ideal sample size
Now that you know what goes into determining sample size, you can calculate sample size online. Or, calculate it the old-fashioned way: by hand.
Below, find two sample size calculations - one for the known population proportion and one for the unknown population.
Sample size for known population

Sample size for unknown population

Here’s how the calculations work out for our voice recognition technology example in an office of 500 people, with a 95% confidence level and 5% margin of error:

There you have it! 197 respondents are needed.
You can tweak some things if that number is too big to swallow.
Try increasing your margin of error or decreasing your confidence level which will reduce the number of respondents necessary but increase chances for errors.
Summing Up Sample Size
Calculating sample size sounds complicated - but, utilizing an easy sample size formula and even calculators are now available to make this tedious part of research faster!
Now, it's time to recruit your sample and run a focus group or even a customer satisfaction survey . Whatever you decide, you now have the information needed to make decisions with confidence.
Want to whip your research skills into shape? Check out our go-to eBook on writing discussion guides !

Multi-Language Conversations: Unlocking Global Research for All

Rethinking insights: The rise of conversational research

From Surveys to AI: The Evolution of Employee Listening
Stay up-to date..
Stay ahead of the curve. Get it all. Or get what suits you. Our 101 material is great if you’re used to working with an agency. Are you a seasoned pro? Sign up to receive just our advanced materials.
Get insights in your inbox . Sign up to stay up to date on the latest research tactics and breakthroughs.

©All Rights Reserved 2024. Read our Privacy policy
No data capture tricks. No bull SEO content for ranking. Just good, solid, honest, research ed.
By entering your email address, you agree to receive marketing communications in accordance with our privacy policy.
Request a demo
Dive Deeper
Finding the Minimum Sample Size

When completing your thesis or dissertation, you will most likely be collecting data and running some statistical analysis on the data that you collect. When writing proposals for their theses and dissertations, students commonly overlook a priori power analysis which can be critical in their study.
What is power?
Statistical power is the ability for statisticians to use statistical tests to determine if significance exists between variables in a study. Power (though in a different metric) is the inverse of the alpha level. Insufficient statistical power increases the likelihood of a type II (or beta) error, which occurs when researchers fail to reject null hypotheses [link to article Introduction to Null Hypothesis Significance Testing] when alternative hypotheses are discovered to be true.
What are the factors relating to power?
Many factors relate to statistical power, such as sample size, significance level, effect size, beta level, number of groups being compared, etc. Increasing the sample size, significance level, or effect size will increase statistical power. Having more group comparisons will lower statistical power.
What is a priori power?
The term a priori comes from Latin and means “from the earlier.” It is a type of power analysis that researchers calculate prior to data collection to determine the minimum sample size to find significance (if significance exists). Calculating a minimum sample size helps researchers maximize their resources. By knowing the minimum number of participants needed for significance, researchers do not waste time collecting more data than they need to determine significance between variables. Additionally, knowing the minimum sample size also helps researchers confirm that they have sufficient data to find significance, which decreases chances of a type II error.
How do you calculate a priori power?
A priori power is calculated from the factors related to power, factors that were previously discussed in the “What are the factors relating to power?” section. Before collecting your data, you will need to determine your alpha level (typically .05), to estimate the expected effect size (it is best to be moderate in your estimation), and to count number of groups being compared (if applicable). The last step is to determine how much power you want for your study. Ideally, when running this type of power analysis, you should set your power to .90; however, some statisticians argue that power as low as .80 is acceptable.
There are many software programs researchers and students can use; G*Power is the most common free software program used.
Click here to cancel reply.
You must be logged in to post a comment.
Copyright © 2024 PhDStudent.com. All rights reserved. Designed by Divergent Web Solutions, LLC .
Sample Size Determination
Sample size is the subset of the population used for statistical analysis based on its characteristics and accuracy of results. proper sample size determination and sample size calculation ensures that the chosen subset adequately represents the entire population, leading to more reliable and meaningful research outcomes..
Determining the number of samples is a crucial step in order to perform reliable analysis. This ensures the purpose of statistical tests and checks if there is no or small margin of error. Justification of the choice of samples is as important as choosing them, since they will be tested for statistical tolerance limits. These samples will be further used to estimate the parameters in any given distribution type. Below are the features of a good sample size:

Sample size regulation and our services
Determining the characteristics.
Since a sample represents a population or universe, the researcher must select the samples based on their characteristics. We consider factors such as level of precision, data required, degree of interpretation and variability for determination. Sample Size Determination, integrated with these considerations, ensures that the chosen sample size is appropriately balanced to capture the nuances of the population while maintaining statistical validity. Sample Size Calculation ensures that the selected sample size is optimized to capture the population's essence effectively while accounting for the parameters that drive meaningful results.
Expandability of size
A sample size needs to be flexible in nature. We reduce the sample size in instances such as availability of information, time and funds. These are non-statistical considerations. We also consider precision under statistical considerations affecting sample size.
Choice between methods
Since there is a need to understand which kind of sampling method a research needs, one has to specifically understand the required process of selection of participants. Our expert panel of researchers segregate the sampling methods under random or non-random selection. Sample Size Determination, in conjunction with this classification, ensures that the selected sampling method aligns with the study's objectives and allows for statistically reliable conclusions to be drawn from the collected data. Sample Size Calculation plays a pivotal role in this determination, ensuring that the chosen method and subsequent sample size align with the research's goals and statistical significance requirements.
Collection of sample unit
Sample units are selected based on the objective of the study excerpting from the elements of the universe. We select the appropriate participants satisfying the purpose of the study and also the requirement in size of the samples. Sample Size Determination plays a crucial role in this process, ensuring that the selected participants are representative enough to yield meaningful and accurate insights. Sample Size Calculation further refines our selection process, ensuring that the chosen participants not only fulfill the study's objectives but also provide statistically significant results due to the appropriate sample size determination.
Sampling frame selection
Defining a sampling frame should be done prior to selecting samples. We list all the units of population constituting the sample frame. This helps you apply the research findings to the population which are defined under the sampling frame.
Power analysis consequences
We combine the help of our statistical analysis tools, our expert subject knowledge and your requirements to determine the necessary size of samples. Statistical power analysis is a hypothesis test to detect existing effects that require assistance by researchers with subject experience.
Get in touch
If you require Predictive analytics help or have any inquiries, please don't hesitate to reach out to us. You can get in touch via telephone, email, or by simply clicking on the "contact us" button provided below.
- Sign Up Now
- -- Navigate To -- CR Dashboard Connect for Researchers Connect for Participants
- Log In Log Out Log In
- Recent Press
- Papers Citing Connect
- Connect for Participants
- Connect for Researchers
- Connect AI Training
- Managed Research
- Prime Panels
- MTurk Toolkit
- Health & Medicine
- Conferences
- Knowledge Base
- A Researcher’s Guide To Statistical Significance And Sample Size Calculations
Determining Sample Size: How Many Survey Participants Do You Need?

Quick Navigation:
How to calculate a statistically significant sample size in research, determining sample size for probability-based surveys and polling studies, determining sample size for controlled surveys, determining sample size for experiments, how to calculate sample size for simple experiments, an example sample size calculation for an a/b test, what if i don’t know what size difference to expect, part iii: sample size: how many participants do i need for a survey to be valid.
In the U.S., there is a Presidential election every four years. In election years, there is a steady stream of polls in the months leading up to the election announcing which candidates are up and which are down in the horse race of popular opinion.
If you have ever wondered what makes these polls accurate and how each poll decides how many voters to talk to, then you have thought like a researcher who seeks to know how many participants they need in order to obtain statistically significant survey results.
Statistically significant results are those in which the researchers have confidence their findings are not due to chance . Obtaining statistically significant results depends on the researchers’ sample size (how many people they gather data from) and the overall size of the population they wish to understand (voters in the U.S., for example).
Calculating sample sizes can be difficult even for expert researchers. Here, we show you how to calculate sample size for a variety of different research designs.
Before jumping into the details, it is worth noting that formal sample size calculations are often based on the premise that researchers are conducting a representative survey with probability-based sampling techniques. Probability-based sampling ensures that every member of the population being studied has an equal chance of participating in the study and respondents are selected at random.
For a variety of reasons, probability sampling is not feasible for most behavioral studies conducted in industry and academia . As a result, we outline the steps required to calculate sample sizes for probability-based surveys and then extend our discussion to calculating sample sizes for non-probability surveys (i.e., controlled samples) and experiments.
Determining how many people you need to sample in a survey study can be difficult. How difficult? Look at this formula for sample size.
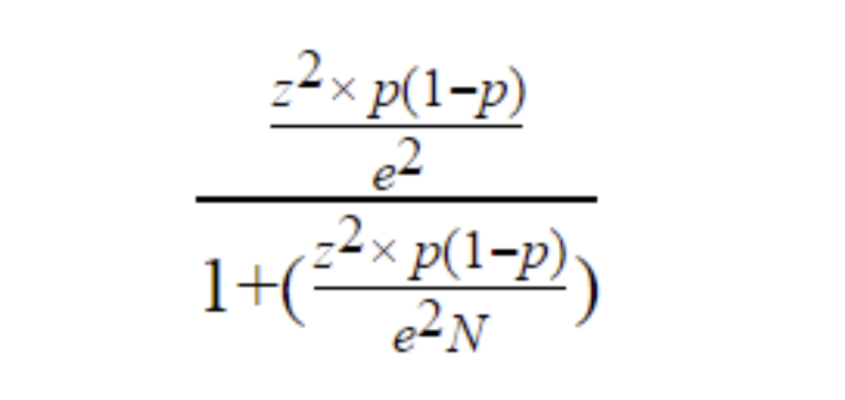
No one wants to work through something like that just to know how many people they should sample. Fortunately, there are several sample size calculators online that simplify knowing how many people to collect data from.
Even if you use a sample size calculator, however, you still need to know some important details about your study. Specifically, you need to know:
- What is the population size in my research?
Population size is the total number of people in the group you are trying to study. If, for example, you were conducting a poll asking U.S. voters about Presidential candidates, then your population of interest would be everyone living in the U.S.—about 330 million people.
Determining the size of the population you’re interested in will often require some background research. For instance, if your company sells digital marketing services and you’re interested in surveying potential customers, it isn’t easy to determine the size of your population. Everyone who is currently engaged in digital marketing may be a potential customer. In situations like these, you can often use industry data or other information to arrive at a reasonable estimate for your population size.
- What margin of error should you use?
Margin of error is a percentage that tells you how much the results from your sample may deviate from the views of the overall population. The smaller your margin of error, the closer your data reflect the opinion of the population at a given confidence level.
Generally speaking, the more people you gather data from the smaller your margin of error. However, because it is almost never feasible to collect data from everyone in the population, some margin of error is necessary in most studies.
- What is your survey’s significance level?
The significance level is a percentage that tells you how confident you can be that the true population value lies within your margin of error. So, for example, if you are asking people whether they support a candidate for President, the significance level tells you how likely it is that the level of support for the candidate in the population (i.e., people not in your sample) falls within the margin of error found in your sample.
Common significance levels in survey research are 90%, 95%, and 99%.
Once you know the values above, you can plug them into a sample size formula or more conveniently an online calculator to determine your sample size.
The table below displays the necessary sample size for different sized populations and margin of errors. As you can see, even when a population is large, researchers can often understand the entire group with about 1,000 respondents.
- How Many People Should I Invite to My Study?
Sample size calculations tell you how many people you need to complete your survey. What they do not tell you, however, is how many people you need to invite to your survey. To find that number, you need to consider the response rate.
For example, if you are conducting a study of customer satisfaction and you know from previous experience that only about 30% of the people you contact will actually respond to your survey, then you can determine how many people you should invite to the survey to wind up with your desired sample size.
All you have to do is take the number of respondents you need, divide by your expected response rate, and multiple by 100. For example, if you need 500 customers to respond to your survey and you know the response rate is 30%, you should invite about 1,666 people to your study (500/30*100 = 1,666).
Sample size formulas are based on probability sampling techniques—methods that randomly select people from the population to participate in a survey. For most market surveys and academic studies, however, researchers do not use probability sampling methods. Instead they use a mix of convenience and purposive sampling methods that we refer to as controlled sampling .
When surveys and descriptive studies are based on controlled sampling methods, how should researchers calculate sample size?
When the study’s aim is to measure the frequency of something or to describe people’s behavior, we recommend following the calculations made for probability sampling. This often translates to a sample of about 1,000 to 2,000 people. When a study’s aim is to investigate a correlational relationship, however, we recommend sampling between 500 and 1,000 people. More participants in a study will always be better, but these numbers are a useful rule of thumb for researchers seeking to find out how many participants they need to sample.
If you look online, you will find many sources with information for calculating sample size when conducting a survey, but fewer resources for calculating sample size when conducting an experiment. Experiments involve randomly assigning people to different conditions and manipulating variables in order to determine a cause-and-effect relationship. The reason why sample size calculators for experiments are hard to find is simple: experiments are complex and sample size calculations depend on several factors.
The guidance we offer here is to help researchers calculate sample size for some of the simplest and most common experimental designs: t -tests, A/B tests, and chi square tests.
Many businesses today rely on A/B tests. Especially in the digital environment, A/B tests provide an efficient way to learn what kinds of features, messages, and displays cause people to spend more time or money on a website or an app.
For example, one common use of A/B testing is marketing emails. A marketing manager might create two versions of an email, randomly send one to half the company’s customers and randomly send the second to the other half of customers and then measure which email generates more sales.
In many cases , researchers may know they want to conduct an A/B test but be unsure how many people they need in their sample to obtain statistically significant results. In order to begin a sample size calculation, you need to know three things.
1. The significance level .
The significance level represents how sure you want to be that your results are not due to chance. A significance level of .05 is a good starting point, but you may adjust this number up or down depending on the aim of your study.
2. Your desired power.
Statistical tests are only useful when they have enough power to detect an effect if one actually exists. Most researchers aim for 80% power—meaning their tests are sensitive enough to detect an effect 8 out of 10 times if one exists.
3. The minimum effect size you are interested in.
The final piece of information you need is the minimum effect size, or difference between groups, you are interested in. Sometimes there may be a difference between groups, but if the difference is so small that it makes little practical difference to your business, it probably isn’t worth investigating. Determining the minimum effect size you are interested in requires some thought about your goals and the potential impact on your business.
Once you have decided on the factors above, you can use a sample size calculator to determine how many people you need in each of your study’s conditions.
Let’s say a marketing team wants to test two different email campaigns. They set their significance level at .05 and their power at 80%. In addition, the team determines that the minimum response rate difference between groups that they are interested in is 7.5%. Plugging these numbers into an effect size calculator reveals that the team needs 693 people in each condition of their study, for a total of 1,386.
Sending an email out to 1,386 people who are already on your contact list doesn’t cost too much. But for many other studies, each respondent you recruit will cost money. For this reason, it is important to strongly consider what the minimum effect size of interest is when planning a study.
When you don’t know what size difference to expect among groups, you can default to one of a few rules of thumb. First, use the effect size of minimum practical significance. By deciding what the minimum difference is between groups that would be meaningful, you can avoid spending resources investigating things that are likely to have little consequences for your business.
A second rule of thumb that is particularly relevant for researchers in academia is to assume an effect size of d = .4. A d = .4 is considered by some to be the smallest effect size that begins to have practical relevance . And fortunately, with this effect size and just two conditions, researchers need about 100 people per condition.
After you know how many people to recruit for your study, the next step is finding your participants. By using CloudResearch’s Prime Panels or MTurk Toolkit, you can gain access to more than 50 million people worldwide in addition to user-friendly tools designed to make running your study easy. We can help you find your sample regardless of what your study entails. Need people from a narrow demographic group? Looking to collect data from thousands of people? Do you need people who are willing to engage in a long or complicated study? Our team has the knowledge and expertise to match you with the right group of participants for your study. Get in touch with us today and learn what we can do for you.
Continue Reading: A Researcher’s Guide to Statistical Significance and Sample Size Calculations

Part 1: What Does It Mean for Research to Be Statistically Significant?

Part 2: How to Calculate Statistical Significance
Related articles, what is data quality and why is it important.
If you were a researcher studying human behavior 30 years ago, your options for identifying participants for your studies were limited. If you worked at a university, you might be...
How to Identify and Handle Invalid Responses to Online Surveys
As a researcher, you are aware that planning studies, designing materials and collecting data each take a lot of work. So when you get your hands on a new dataset,...
SUBSCRIBE TO RECEIVE UPDATES
2024 grant application form, personal and institutional information.
- Full Name * First Last
- Position/Title *
- Affiliated Academic Institution or Research Organization *
Detailed Research Proposal Questions
- Project Title *
- Research Category * - Antisemitism Islamophobia Both
- Objectives *
- Methodology (including who the targeted participants are) *
- Expected Outcomes *
- Significance of the Study *
Budget and Grant Tier Request
- Requested Grant Tier * - $200 $500 $1000 Applicants requesting larger grants may still be eligible for smaller awards if the full amount requested is not granted.
- Budget Justification *
Research Timeline
- Projected Start Date * MM slash DD slash YYYY Preference will be given to projects that can commence soon, preferably before September 2024.
- Estimated Completion Date * MM slash DD slash YYYY Preference will be given to projects that aim to complete within a year.
- Project Timeline *
- Phone This field is for validation purposes and should be left unchanged.
- Name * First Name Last Name
- I would like to request a demo of the Sentry platform
- Email This field is for validation purposes and should be left unchanged.
- Name * First name Last name
- Name * First Last
- Comments This field is for validation purposes and should be left unchanged.
- Name * First and Last
- Please select the best time to discuss your project goals/details to claim your free Sentry pilot for the next 60 days or to receive 10% off your first Managed Research study with Sentry.
- Name This field is for validation purposes and should be left unchanged.
- Email * Enter Email Confirm Email
- Organization
- Job Title *
Sample Size Calculator
Find out the sample size.
This calculator computes the minimum number of necessary samples to meet the desired statistical constraints.
Find Out the Margin of Error
This calculator gives out the margin of error or confidence interval of observation or survey.
Related Standard Deviation Calculator | Probability Calculator
In statistics, information is often inferred about a population by studying a finite number of individuals from that population, i.e. the population is sampled, and it is assumed that characteristics of the sample are representative of the overall population. For the following, it is assumed that there is a population of individuals where some proportion, p , of the population is distinguishable from the other 1-p in some way; e.g., p may be the proportion of individuals who have brown hair, while the remaining 1-p have black, blond, red, etc. Thus, to estimate p in the population, a sample of n individuals could be taken from the population, and the sample proportion, p̂ , calculated for sampled individuals who have brown hair. Unfortunately, unless the full population is sampled, the estimate p̂ most likely won't equal the true value p , since p̂ suffers from sampling noise, i.e. it depends on the particular individuals that were sampled. However, sampling statistics can be used to calculate what are called confidence intervals, which are an indication of how close the estimate p̂ is to the true value p .
Statistics of a Random Sample
The uncertainty in a given random sample (namely that is expected that the proportion estimate, p̂ , is a good, but not perfect, approximation for the true proportion p ) can be summarized by saying that the estimate p̂ is normally distributed with mean p and variance p(1-p)/n . For an explanation of why the sample estimate is normally distributed, study the Central Limit Theorem . As defined below, confidence level, confidence intervals, and sample sizes are all calculated with respect to this sampling distribution. In short, the confidence interval gives an interval around p in which an estimate p̂ is "likely" to be. The confidence level gives just how "likely" this is – e.g., a 95% confidence level indicates that it is expected that an estimate p̂ lies in the confidence interval for 95% of the random samples that could be taken. The confidence interval depends on the sample size, n (the variance of the sample distribution is inversely proportional to n , meaning that the estimate gets closer to the true proportion as n increases); thus, an acceptable error rate in the estimate can also be set, called the margin of error, ε , and solved for the sample size required for the chosen confidence interval to be smaller than e ; a calculation known as "sample size calculation."
Confidence Level
The confidence level is a measure of certainty regarding how accurately a sample reflects the population being studied within a chosen confidence interval. The most commonly used confidence levels are 90%, 95%, and 99%, which each have their own corresponding z-scores (which can be found using an equation or widely available tables like the one provided below) based on the chosen confidence level. Note that using z-scores assumes that the sampling distribution is normally distributed, as described above in "Statistics of a Random Sample." Given that an experiment or survey is repeated many times, the confidence level essentially indicates the percentage of the time that the resulting interval found from repeated tests will contain the true result.
Confidence Interval
In statistics, a confidence interval is an estimated range of likely values for a population parameter, for example, 40 ± 2 or 40 ± 5%. Taking the commonly used 95% confidence level as an example, if the same population were sampled multiple times, and interval estimates made on each occasion, in approximately 95% of the cases, the true population parameter would be contained within the interval. Note that the 95% probability refers to the reliability of the estimation procedure and not to a specific interval. Once an interval is calculated, it either contains or does not contain the population parameter of interest. Some factors that affect the width of a confidence interval include: size of the sample, confidence level, and variability within the sample.
There are different equations that can be used to calculate confidence intervals depending on factors such as whether the standard deviation is known or smaller samples (n<30) are involved, among others. The calculator provided on this page calculates the confidence interval for a proportion and uses the following equations:

Within statistics, a population is a set of events or elements that have some relevance regarding a given question or experiment. It can refer to an existing group of objects, systems, or even a hypothetical group of objects. Most commonly, however, population is used to refer to a group of people, whether they are the number of employees in a company, number of people within a certain age group of some geographic area, or number of students in a university's library at any given time.
It is important to note that the equation needs to be adjusted when considering a finite population, as shown above. The (N-n)/(N-1) term in the finite population equation is referred to as the finite population correction factor, and is necessary because it cannot be assumed that all individuals in a sample are independent. For example, if the study population involves 10 people in a room with ages ranging from 1 to 100, and one of those chosen has an age of 100, the next person chosen is more likely to have a lower age. The finite population correction factor accounts for factors such as these. Refer below for an example of calculating a confidence interval with an unlimited population.
EX: Given that 120 people work at Company Q, 85 of which drink coffee daily, find the 99% confidence interval of the true proportion of people who drink coffee at Company Q on a daily basis.

Sample Size Calculation
Sample size is a statistical concept that involves determining the number of observations or replicates (the repetition of an experimental condition used to estimate the variability of a phenomenon) that should be included in a statistical sample. It is an important aspect of any empirical study requiring that inferences be made about a population based on a sample. Essentially, sample sizes are used to represent parts of a population chosen for any given survey or experiment. To carry out this calculation, set the margin of error, ε , or the maximum distance desired for the sample estimate to deviate from the true value. To do this, use the confidence interval equation above, but set the term to the right of the ± sign equal to the margin of error, and solve for the resulting equation for sample size, n . The equation for calculating sample size is shown below.

EX: Determine the sample size necessary to estimate the proportion of people shopping at a supermarket in the U.S. that identify as vegan with 95% confidence, and a margin of error of 5%. Assume a population proportion of 0.5, and unlimited population size. Remember that z for a 95% confidence level is 1.96. Refer to the table provided in the confidence level section for z scores of a range of confidence levels.

Thus, for the case above, a sample size of at least 385 people would be necessary. In the above example, some studies estimate that approximately 6% of the U.S. population identify as vegan, so rather than assuming 0.5 for p̂ , 0.06 would be used. If it was known that 40 out of 500 people that entered a particular supermarket on a given day were vegan, p̂ would then be 0.08.

An official website of the United States government
The .gov means it’s official. Federal government websites often end in .gov or .mil. Before sharing sensitive information, make sure you’re on a federal government site.
The site is secure. The https:// ensures that you are connecting to the official website and that any information you provide is encrypted and transmitted securely.
- Publications
- Account settings
Preview improvements coming to the PMC website in October 2024. Learn More or Try it out now .
- Advanced Search
- Journal List
- Indian J Psychol Med
- v.35(2); Apr-Jun 2013
How to Calculate Sample Size for Different Study Designs in Medical Research?
Jaykaran charan.
Department of Pharmacology, Govt. Medical College, Surat, Gujarat, India
Tamoghna Biswas
1 Independent Researcher, Kolkata, West Bengal, India
Calculation of exact sample size is an important part of research design. It is very important to understand that different study design need different method of sample size calculation and one formula cannot be used in all designs. In this short review we tried to educate researcher regarding various method of sample size calculation available for different study designs. In this review sample size calculation for most frequently used study designs are mentioned. For genetic and microbiological studies readers are requested to read other sources.
INTRODUCTION
In the recent era of evidence-based medicine, biomedical statistics has come under increased scrutiny. Evidence is as good as the research it is based on, which in turn depends on the statistical soundness of the claims it make. One of the important issues faced by a biomedical researcher during the design phase of the study is sample size calculation. Various studies published in Indian and International journals revealed that sample size calculations are not reported properly in the published articles. Many of the studies published in these journals have less than required sample size and hence less power.[ 1 , 2 , 3 ] Many articles have been published in existing literature explaining the methods of calculation of sample size but still a lot of confusion exists.[ 4 , 5 , 6 ] It is very important to understand that method of sample size calculation is different for different study designs and one blanket formula for sample size calculation cannot be used for all study designs. In this article different formulae of sample size calculations are explained based on study designs. Readers are advised to understand the basics of prerequisites needed for calculation of sample size calculation through this article and from other sources also and once they have understood the basics they can use different paid/freely available software available for sample size calculations. For simple study designs formulae given in this article can be used for sample size calculation.
Sample size calculation for cross sectional studies/surveys
Cross sectional studies or cross sectional survey are done to estimate a population parameter like prevalence of some disease in a community or finding the average value of some quantitative variable in a population. Sample size formula for qualitative variable and quantities variable are different.
For qualitative variable
Suppose an epidemiologist want to know proportion of children who are hypertensive in a population then this formula should be used as proportion is a qualitative variable.

So if the researcher is interested in knowing the average systolic blood pressure in pediatric age group of that city at 5% of type of 1 error and precision of 5 mmHg of either side (more or less than mean systolic BP) and standard deviation, based on previously done studies, is 25 mmHg then formula for sample size calculation will be

So if the researcher wants to calculate sample size for the above-mentioned case control study to know link between childhood sexual abuse with psychiatric disorder in adulthood and he wants to fix power of study at 80% and assuming expected proportions in case group and control group are 0.35 and 0.20 respectively, and he wants to have equal number cases and control; then the sample size per group will be

So, the researcher has to take 59 samples in each group.
It is worthy of mention here that these formulas for case control and cohort study are for independent design studies. They are not for matched case control and cohort studies. These formulae can be modified or corrected depending on population size or ratio between sample size and population size. Detailed text should be read to know more about technical aspects of sample size calculation.[ 7 , 8 ] Readers are advised to use various freely available epidemiological calculators like openEpi given in appendix to calculate sample size formula.
Sample size calculation for testing a hypothesis (Clinical trials or clinical interventional studies)
In this kind of research design researcher wants to see the effect of an intervention. Suppose a researcher want to see the effect of an antihypertensive drug so he will select two groups, one group will be given antihypertensive drug and another group will be give placebo. After giving these drug s for a fixed time period blood pressure of both groups will be measured and mean blood pressure of both groups will be compared to see if difference is significant or not. Complex formulae are used for this type of studies and we want to advise readers to use statistical software for calculation of exact sample size. The procedure for calculation of samle size in clinical trials/intervention studies involving two groups is mentioned here. In the case of only two groups method of calculation is mentioned here but if design involves more than two groups then statistical software like G Power should be used for sample size calculation. But understanding of various prerequisites which are needed for sample size calculation is very important.
Formula for sample size calculation for comparison between two groups when endpoint is quantitative data
When the variable is quantitative data like blood pressure, weight, height, etc., then the followingformula can be used for calculation of sample size for comparison between two groups.

So researcher needs 294 subjects per group.
So simple calculation for sample size when comparison is for two independent groups can be done manually by given formulae but for more than two groups or for matched data and for other complex calculations software should be used [ appendix 1 ].
Sample size formula for animal studies
For animal studies there are two method of calculation of sample size. The most preferred method is the same method which has been mentioned in sample size calculation for testing the hypothesis. While all efforts should be done to calculate the sample size by that method, sometimes it is not possible to get information related to the prerequisites needed for sample size calculation by power analysis like standard deviation, effect size etc. In that condition a second method can be used this is called as “resource equation method”.[ 9 ] In this method a value E is calculated based on decided sample size. The value if E should lies within 10 to 20 for optimum sample size. If a value of E is less than 10 then more animal should be included and if it is more than 20 then sample size should be decreased.
E = Total number of animals - Total number of groups
Suppose in an animal study a researcher formed 4 groups of animal having 8 animals each for different interventions then total animals will be 32 (4 × 8). Hence E will be
E = 32 – 4 = 28
This is more than 20 hence animals should be decreased in each group. So if researcher takes 5 rats in each group then E will be
E = 20 – 4 = 16
E is 16 which lies within 10-20 hence five rats per group for four groups can be considered as appropriate sample size. This is a crude method and should be used only if sample size calculation cannot be done by power analysis method explained in above section for testing the hypothesis.
APPENDIX 1: – FREE SOFTWARE AND CALCULATORS AVAILABLE ONLINE FOR SAMPLE SIZE CALCULATION

Source of Support: Nil
Conflict of Interest: None.
- Statisticians
- Free Tutorials
Statistics Consultation

- Sample Size Determination
Consultation on Sample Size determination
Selection of a sample size, large enough to be a representative of the population that you are studying, is difficult. The principles of probability and statistical analysis must be known if you are to select the perfect sample size. Your research committee will lay emphasis on selection of the correct sample size. We help you include a valid justification for your sample size in the methodology chapter.
We take into consideration a number of factors while performing sample size calculation on behalf of our clients:
- Precision Level or Accuracy
- Need for Data for Research
- Level of Confidence
- The Degree of Variability and Deviation
Our calculations also take into consideration whether the research needs small or large population. Thus, the approaches vary depending on the necessity of the study. Two types of sampling techniques are adopted by us:
- Probability or Representative Sampling
- Non-Probability or Judgmental Sampling
The method adopted for determining the sample size under both these techniques is complicated, and PhD statisticians associated with us are able to help scholars with precision.
Determination of sample size for any study is not as simple as using the formulae on any arbitrary figure that the researcher deems fit. Request for quote today through our contact us page .
Research Methodology Consultation Data Analysis,Chapter 4 Research Methodology + Data Analysis Review of Data Analysis
Need more details? Contact us
- Dissertations
- Qualitative Research
- Quantitative Research
- Academic Writing
- Getting Published
News & Events
How to determine the sample size for your study.
- May 1, 2017
- Posted by: Mike Rucker
- Category: Research

When conducting quantitative research, it is very important to determine the sample size for your study. Your sample needs to represent the target population you plan to examine. Sample size calculation should be done before you set off to collect any of your data. Almost all researchers generally like to work with large samples. However, this is not always feasible — especially for students (time, money, resources, etc.) — so it is a good idea to assess your need before any real research takes place to determine how many participants you really need (and can feasibly get) before planning your research.
This post presents a brief overview of sample size calculations and covers some of the basics. For complex cases and more detail, you will probably require more thorough text on the subject (see: Sample Size Determination and Power ).
A Few Terms That Relate to the Size of Your Sample
Here are some expressions you will most likely come across when designing your study and deciding on a sample size.
- Population – This is the complete set of data points, for example, all Americans.
- Target population – This is the complete group for which you are studying; your data will have specific characteristics (demographics, clinical characteristics) that you are interested in — for example, Americans over the age of 65, who live at home and have had a stroke in the past 6 months.
- Sample – A subset of the target population that represents the target population.
- Margin of Error – The margin of error is about a degree of uncertainty in statistics. How much error will you allow? We would like the mean of our data to represent the mean of the target population; however, this is generally not going to happen. The margin of error tells us how much higher or lower than the true value will we let our sample mean fall. In articles, you usually see a +/-5% or +/-3% margin of error.
- Confidence Interval – Confidence interval (CI) is usually set at 90%, 95% or 99%. It tells us how confident we are that if the study was repeated again and again, we would get the same results. If confidence level is 95%, we would get the same results in 95% of the cases.
- Standard Deviation – Standard deviation tells us the variation in the data from your sample.
- Power – This refers to the chance of missing a real difference (‘false negatives’). Usually, studies have a power of around 80%, which means that you accept the possibility that in 20% of the cases, the real difference was missed (you concluded there was no effect when there was one). Larger samples generally yield higher statistical power.
How to Calculate a Sample Size
It is fairly easy to determine your desired sample size. Formulas found in textbooks often appear very intimidating. However, they can be broken down and simplified if you are familiar with the above terms.
Scott Smith , Ph.D., presents a rather simpler version. His formula for size calculation goes as follows:
(Z value) 2 X standard deviation (1-standard deviation)/(margin of error) 2 = n
This formula, however, can only be used for large populations or unknown population sizes.
The Z-value or Z-score corresponds with your chosen confidence level. There are usually Z tables available that tell you the Z-score. You can then insert that value into the formula. Below are values for the most commonly used confidence intervals.
You can use the formula to calculate a sample size for a confidence level of 99% and margin of error +/-1% (.01), using the standard deviation suggestion of .05.
(2.58) 2 *0.5(1-0.5)/(0.01) 2 = 6.656*0.5(0.5)/0.0001= 16,641
The sample size for the chosen parameters should be 16,641, which is a very large sample. To make it a more realistic number, you might consider reducing your confidence level and margin of error. If you reduce it to 95% confidence level and 5% margin of error, you get a more manageable 384.16 participants, which you round up to 385.
Software for Calculating Your Sample Size
If this still appears like a pretty cumbersome task (or you have a smaller population size), you can also turn to various software programs and websites that will calculate the size for you. An example of such a site is The Survey System , which offers a free online sample size calculator. Another option is Survey Monkey ’s sample size calculator, which can also be accessed online. These calculators usually ask you to enter your target population size, confidence level and margin of error.
You can also ask for guidance and assistance from other members of your department who might be more skilled at statistics. For additional ideas on how to get help with statistics, you can have a look at this post .

IMAGES
VIDEO
COMMENTS
CHART 2. Sample size calculation to estimate the frequency (prevalence) of sunscreen use in the population, considering different scenarios but keeping the significance level (95%) and the design effect (1.0) constant. Target population. Prevalence (p) of outcome. Sunscreen use at work p=10%.
4) Use best practice guidelines to calculate sample size. There are many established guidelines and formulas that can help you in determining the right sample size. The easiest way to define your sample size is using a sample size calculator, or you can use a manual sample size calculation if you want to test your math skills. Cochran's ...
2.58. Put these figures into the sample size formula to get your sample size. Here is an example calculation: Say you choose to work with a 95% confidence level, a standard deviation of 0.5, and a confidence interval (margin of error) of ± 5%, you just need to substitute the values in the formula: ( (1.96)2 x .5 (.5)) / (.05)2.
This can be done using an online sample size calculator or with paper and pencil. 1. Find your Z-score. Next, you need to turn your confidence level into a Z-score. Here are the Z-scores for the most common confidence levels: 90% - Z Score = 1.645. 95% - Z Score = 1.96. 99% - Z Score = 2.576.
An important step when designing an empirical study is to justify the sample size that will be collected. The key aim of a sample size justification for such studies is to explain how the collected data is expected to provide valuable information given the inferential goals of the researcher. In this overview article six approaches are discussed to justify the sample size in a quantitative ...
Sample size calculation formula. The equation that our sample size calculator uses is: n_1 = Z^2\cdot p \cdot \frac {1-p} {\mathrm {ME}^2} n1 = Z 2 ⋅ p ⋅ ME21 − p. where: Z Z — The z-score associated with the confidence level you chose. Our statistical significance calculator calculates this value automatically, but if you want to learn ...
Sample size calculations require assumptions about expected means and standard deviations, or event risks, in different groups; or, upon expected effect sizes. For example, a study may be powered to detect an effect size of 0.5; or a response rate of 60% with drug vs. 40% with placebo. When no guesstimates or expectations are possible, pilot ...
Sample Size. The sample size is simply the number of units in your sample. In the example above, the sample size selected may be just 500 or 1000 of the Facebook users that are part of our population of frequent, male, Facebook users in the United States.. In practice, the sample size that is selected for a study can have a significant impact on the quality of your results/findings, with ...
The sample size/power analysis calculator then presents the write-up with references which can easily be integrated in your dissertation document. Click here for a sample. For questions about these or any of our products and services, please email [email protected] or call 877-437-8622.
You need to determine how big of a sample size you need so that you can be sure the quantitative data you get from a survey is reflective of your target population as a whole - and so that the decisions you make based on the research have a firm foundation. Too big a sample and a project can be needlessly expensive and time-consuming.
A z-score is a value that indicates the placement of your raw score (meaning the percent of your confidence level) in any number of standard deviations below or above the population mean. Z-scores for the most common confidence intervals are: 90% = 2.576. 95% = 1.96. 99% = 2.576. If you're using a different confidence interval, use this z ...
To calculate an appropriate sample size for testing whether the two groups are practically equivalent, we used the TOST (Schuirmann, 1987) method. We used an α of .05. We set the aimed TPR to be 0.8 because [1) it is the common standard in the field; 2) it is the journal publishing requirement]. We consider all effect sizes below 0.2 ...
It is a type of power analysis that researchers calculate prior to data collection to determine the minimum sample size to find significance (if significance exists). Calculating a minimum sample size helps researchers maximize their resources. By knowing the minimum number of participants needed for significance, researchers do not waste time ...
Sample Size Determination. Sample size is the subset of the population used for statistical analysis based on its characteristics and accuracy of results. Proper sample size determination and sample size calculation ensures that the chosen subset adequately represents the entire population, leading to more reliable and meaningful research ...
The guidance we offer here is to help researchers calculate sample size for some of the simplest and most common experimental designs: t-tests, A/B tests, and chi square tests. How to Calculate Sample Size for Simple Experiments. Many businesses today rely on A/B tests. Especially in the digital environment, A/B tests provide an efficient way ...
Some factors that affect the width of a confidence interval include: size of the sample, confidence level, and variability within the sample. There are different equations that can be used to calculate confidence intervals depending on factors such as whether the standard deviation is known or smaller samples (n 30) are involved, among others.
So there was no uniform answer to the question and the ranges varied according to methodology. In fact, Shaw and Holland (2014) claim, sample size will largely depend on the method. (p. 87), "In truth," they write, "many decisions about sample size are made on the basis of resources, purpose of the research" among other factors. (p. 87).
Another good method for determining a representative sample size was suggested (Dillman, 2000). Thus, given the population size of 2,400, the sample size was computed using the below
This vid discusses some basic but key considerations for determining and justifying one's research sample size for theses and research papers. Please SUB...
In this method a value E is calculated based on decided sample size. The value if E should lies within 10 to 20 for optimum sample size. If a value of E is less than 10 then more animal should be included and if it is more than 20 then sample size should be decreased. E = Total number of animals - Total number of groups.
Two types of sampling techniques are adopted by us: Probability or Representative Sampling. Non-Probability or Judgmental Sampling. The method adopted for determining the sample size under both these techniques is complicated, and PhD statisticians associated with us are able to help scholars with precision. Determination of sample size for any ...
How to Calculate a Sample Size It is fairly easy to determine your desired sample size. Formulas found in textbooks often appear very intimidating. However, they can be broken down and simplified if you are familiar with the above terms. Scott Smith, Ph.D., presents a rather simpler version. His formula for size calculation goes as follows: