Want to create or adapt books like this? Learn more about how Pressbooks supports open publishing practices.

3.2 Quantitative Research Designs
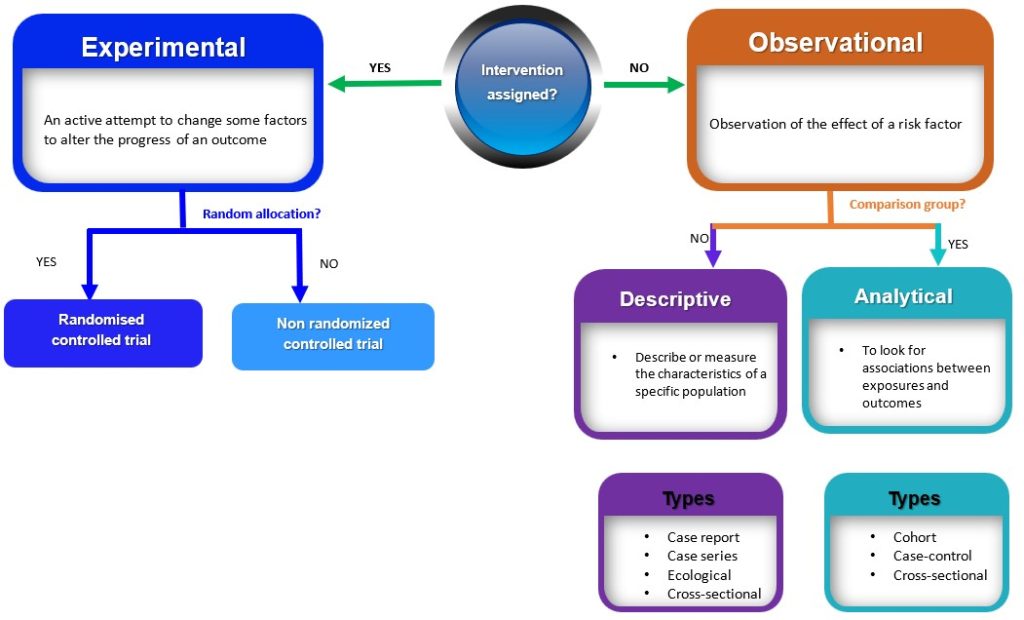
Quantitive research study designs can be broadly classified into two main groups (observational and experimental) depending on if an intervention is assigned. If an intervention is assigned, then an experimental study design will be considered; however, if no intervention is planned or assigned, then an observational study will be conducted. 3 These broad classes are further subdivided into specific study designs, as shown in Figure 3.1. In practice, quantitative studies usually begin simply as descriptive studies, which could subsequently be progressed to more complex analytic studies and then to experimental studies where appropriate.
Observational studies
Observational studies are research designs that involve observing and measuring the characteristics of a sample or population without intervening, altering or manipulating any variables (Figure 3.1). 3 Observational studies can be further subdivided into descriptive and analytic studies. 3
Descriptive observational studies
Descriptive studies are research designs that describe or measure the characteristics of a specific population or phenomenon. These characteristics include descriptions related to the phenomenon under investigation, the people involved, the place, and the time. 4 These study designs are typically non-experimental and do not involve manipulating variables; rather, they rely on the collection and analysis of numerical data to draw conclusions. Examples of descriptive studies include case reports, case series, ecological studies and cross-sectional (prevalence studies). 2 These are discussed below
- Case Reports and Case series
Case reports and case series are both types of descriptive studies in research. A case report is a detailed account of the medical history, diagnosis, treatment, and outcome of a single patient. 5 On the other hand, case series is a collection of cases with similar clinical features. 5 Case series are frequently used to explain the natural history of a disease, the clinical characteristics, and the health outcomes for a group of patients who underwent a certain treatment. Case series typically involve a larger number of patients than case reports. 5 Both case reports and case series are used to illustrate unusual or atypical features found in patients in practice. 5 In a typical, real-world clinical situation, they are both used to describe the clinical characteristics and outcomes of individual patients or a group of patients with a particular condition. These studies have the potential to generate new research questions and ideas. 5 However, there are drawbacks to both case reports and case series, such as the absence of control groups and the potential for bias. Yet, they can be useful sources of clinical data, particularly when researching uncommon or recently discovered illnesses. 5 An example of a case report is the study by van Tulleken, Tipton and Haper, 2018 which showed that open-water swimming was used as a treatment for major depressive disorder for a 24-year-old female patient. 6 Weekly open (cold) water swimming was trialled, leading to an immediate improvement in mood following each swim. A sustained and gradual reduction in symptoms of depression, and consequently a reduction in, and cessation of, medication was observed. 6 An example of a case series is the article by Chen et al , 2020 which described the epidemiology and clinical characteristics of COVID-19 infection among 12 confirmed cases in Jilin Province, China. 7
- Ecological studies
Ecological studies examine the relationship between exposure and outcome at the population level. Unlike other epidemiological studies focusing on individual-level data, ecological studies use aggregate data to investigate the relationship between exposure and outcome of interest. 8 In ecological studies, data on prevalence and the degree of exposure to a given risk factor within a population are typically collected and analysed to see if exposure and results are related. 8 Ecological studies shed light on the total burden of disease or health-related events within a population and assist in the identification of potential risk factors that might increase the incidence of disease/event. However, these studies cannot prove causation or take into account characteristics at the individual level that can influence the connection between exposure and result. This implies that ecological findings cannot be interpreted and extrapolated to individuals. 9 For example, the association between urbanisation and Type 2 Diabetes was investigated at the country level, and the role of intermediate variables (physical inactivity, sugar consumption and obesity) was examined. One of the key findings of the study showed that in high-income countries (HIC), physical inactivity and obesity were the main determinants of T2D prevalence. 10 However, it will be wrong to infer that people who are physically inactive and obese in HIC have a higher risk of T2D.
- Cross-sectional Descriptive (Prevalence) studies
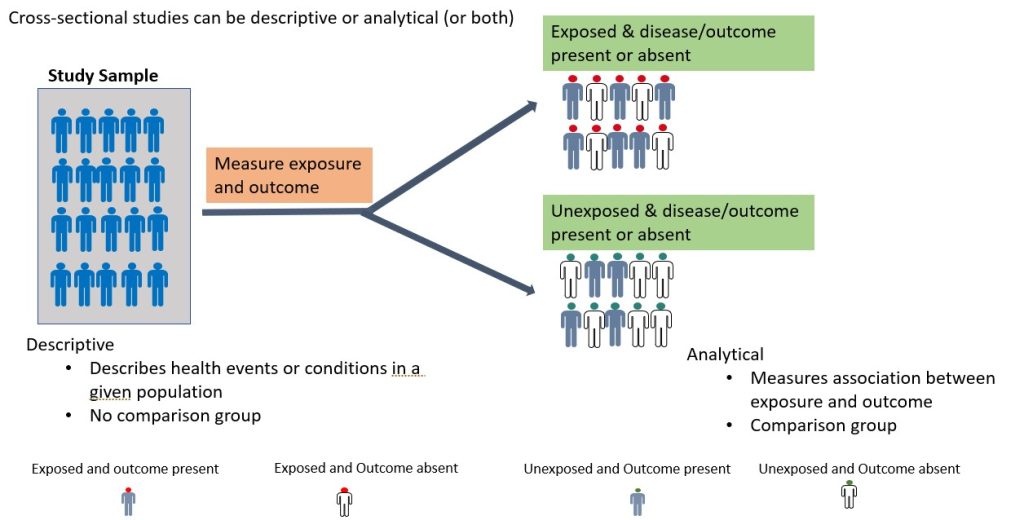
A cross-sectional study is an observational study in which the researcher collects data on a group of participants at a single point in time. 11 The goal is to describe the characteristics of the group or to explore relationships between variables. Cross-sectional studies can be either descriptive or analytical (Figure 3.2). 11 Descriptive cross-sectional studies are also known as prevalence studies measuring the proportions of health events or conditions in a given population. 11 Although analytical cross-sectional studies also measure prevalence, however, the relationship between the outcomes and other variables, such as risk factors, is also assessed. 12 The main strength of cross-sectional studies is that they are quick and cost-effective. However, they cannot establish causality and may be vulnerable to bias and confounding ( these concepts will be discussed further later in this chapter under “avoiding error in quantitative research) . An example of a cross-sectional study is the study by Kim et al., 2020 which examined burnout and job stress among physical and occupational therapists in various Korean hospital settings. 13 Findings of the study showed that burnout and work-related stress differed significantly based on several factors, with hospital size, gender, and age as the main contributory factors. The more vulnerable group consisted of female therapists in their 20s at small- or medium-sized hospitals with lower scores for quality of life. 13
Analytical Observational studies
Analytical observational studies aim to establish an association between exposure and outcome and identify causes of disease (causal relationship). 14 Analytical observational studies include analytical cross-sectional ( discussed above ), case-control and cohort studies. 14 This research method could be prospective(cohort study) or retrospective (case-control study), depending on the direction of the enquiry. 14
- Case-control studies
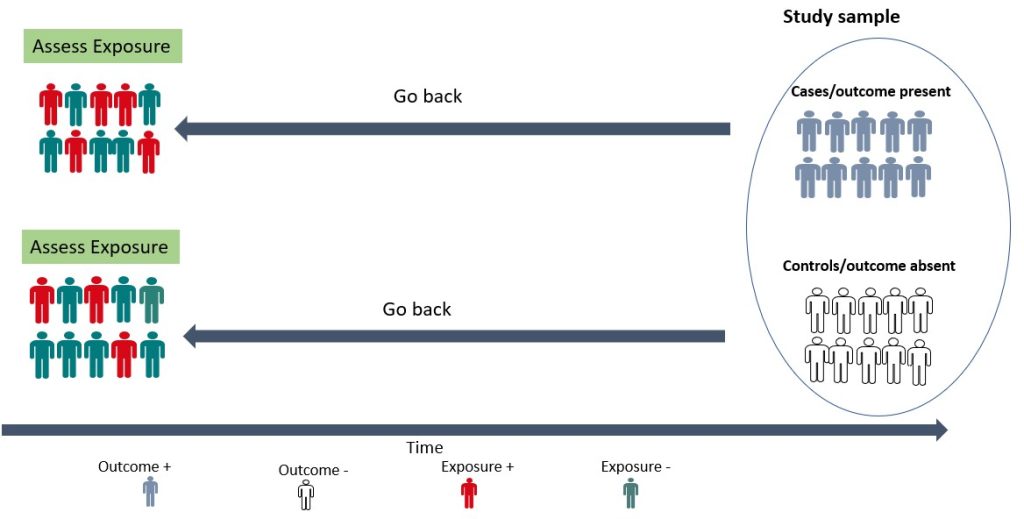
A case-control study is a retrospective study in which the researcher compares a group of individuals with a specific outcome (cases) to a group of individuals without that outcome (controls) to identify factors associated with the outcome. 15 As shown in Figure 3.3 below, the cases and controls are recruited and asked questions retrospectively (going back in time) about possible risk factors for the outcome under investigation. A case-control study is relatively efficient in terms of time, money and effort, suited for rare diseases or outcomes with a long latent period, and can examine multiple risk factors. 15 For example, before the cause of lung cancer, was established, a case-control study was conducted by British researchers Richard Doll and Bradford Hill in 1950. 16 Subjects with lung cancer were compared with those who did not have lung cancer, and details about their smoking habits were obtained. 16 The findings from this initial study showed that cancer patients were more frequent and heavy smokers. 16 Over the years, more evidence has been generated implicating tobacco as a significant cause of lung cancer. 17, 18 Case-control studies are, therefore, useful for examining rare outcomes and can be conducted more quickly and with fewer resources than other study designs. Nonetheless, it should be noted that case-control studies are susceptible to bias in selecting cases and controls and may not be representative of the overall population. 15
- Cohort Study
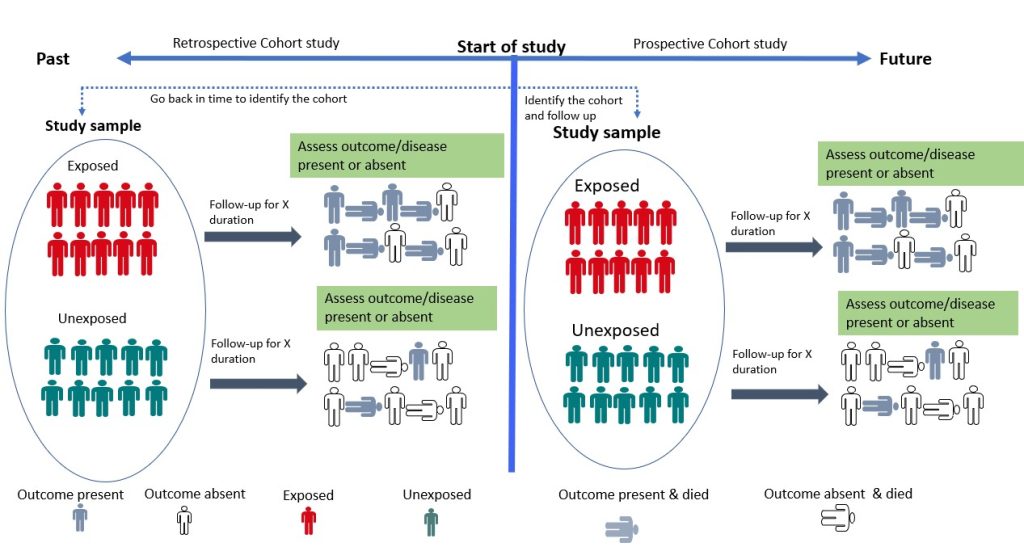
Cohort studies are longitudinal studies in which the researcher follows a group of individuals who share a common characteristic (e.g., age, occupation) over time to monitor the occurrence of a particular health outcome. 19 The study begins with the selection of a group of individuals who are initially free of the disease or health outcome of interest (the “cohort”). The cohort is then divided into two or more groups based on their level of exposure (for example, those who have been exposed to a certain risk factor and those who have not). 19 Participants are then followed up, and their health outcomes are tracked over time. The incidence of the health outcome is compared between exposed and non-exposed groups, and the relationship between exposure and the outcome is quantified using statistical methods. 19 Cohort studies can be prospective or retrospective (Figure 3.4). 20 In a prospective cohort study, the researchers plan the study so that participants are enrolled at the start of the study and followed over time. 20, 21 In a retrospective cohort study, data on exposure and outcome are collected from existing records or databases. The researchers go back in time (via available records) to find a cohort that was initially healthy and “at risk” and assess each participant’s exposure status at the start of the observation period. 20, 21 Cohort studies provide an understanding of disease risk factors based on findings in thousands of individuals over many years and are the foundation of epidemiological research. 19 They are useful for investigating the natural history of a disease, identifying risk factors for a disease, providing strong evidence for causality and estimating the incidence of a disease or health outcome in a population. However, they can be expensive and time-consuming to conduct. 15 An example of a cohort study is the study by Watts et al, 2015 which investigated whether the communication and language skills of children who have a history of stuttering are different from children who do not have a history of stuttering at ages 2–5 years. 22 The findings revealed that children with a history of stuttering, as a group, demonstrated higher scores on early communication and language measures compared to their fluent peers. According to the authors, clinicians can be reassured by the finding that, on average, children who stutter have early communication and language skills that meet developmental expectations. 22
Experimental Study Designs (Interventional studies)
Experimental studies involve manipulating one or more variables in order to measure their effects on one or more outcomes. 23 In this type of study, the researcher assigns individuals to two or more groups that receive or do not receive the intervention. Well-designed and conducted interventional studies are used to establish cause-and-effect relationships between variables. 23 Experimental studies can be broadly classified into two – randomised controlled trials and non-randomised controlled trials. 23 These study designs are discussed below:
- Randomised Controlled Trial
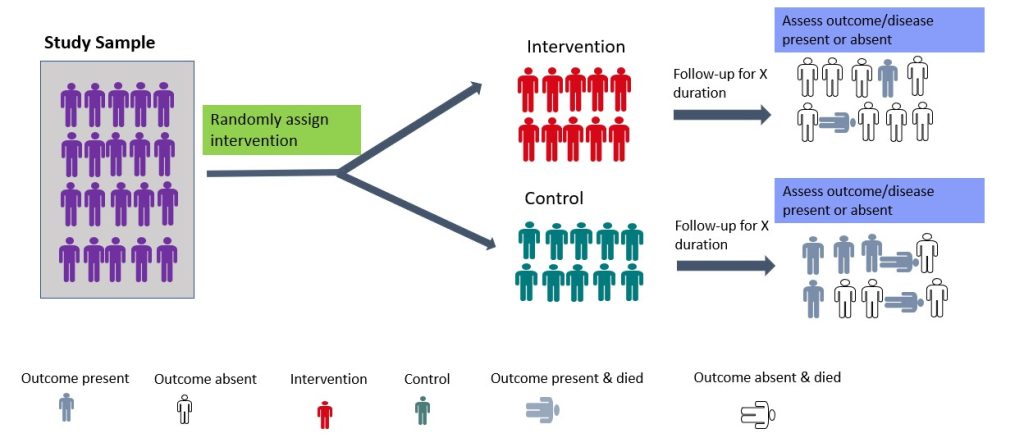
Randomised controlled trials (RCTs) are experimental studies in which participants are randomly assigned to the intervention or control arm of the study. 23 The experimental group receives the intervention, while the control group does not (Figure 3.5). RCTs involve random allocation (not by choice of the participants or investigators) of participants to a control or intervention group (Figure 3.5). 24 Randomization or random allocation minimises bias and offers a rigorous method to analyse cause-and-effect links between an intervention and outcome. 24 Randomization balances participant characteristics (both observed and unobserved) between the groups. 24 This is so that any differences in results can be attributed to the research intervention. 24 The most basic form of randomisation is allocating treatment by tossing a coin. Other methods include using statistical software to generate random number tables and assigning participants by simple randomisation or allocating them sequentially using numbered opaque envelopes containing treatment information. 25 This is why RCTs are often considered the gold standard in research methodology. 24 While RCTs are effective in establishing causality, they are not without limitations. RCTs are expensive to conduct and time-consuming. In addition, ethical considerations may limit the types of interventions that can be tested in RCTs. They may also not be appropriate for rare events or diseases and may not always reflect real-world situations, limiting their application in clinical practice. 24 An example of a randomised controlled trial is the study by Shebib et al., 2019 which investigated the effect of a 12-week digital care program (DCP) on improving lower-back pain. The treatment group (DCP) received the 12-week DCP, consisting of sensor-guided exercise therapy, education, cognitive behavioural therapy, team and individual behavioural coaching, activity tracking, and symptom tracking – all administered remotely via an app. 26 While the control group received three digital education articles only. The findings of the study showed that the DCP resulted in improved health outcomes compared to treatment-as-usual and has the potential to scale personalised evidence-based non-invasive treatment for patients with lower-back pain. 26
- Non-randomised controlled design (Quasi-experimental)
Non-randomised controlled trial (non-RCT) designs are used where randomisation is impossible or difficult to achieve. This type of study design requires allocation of the exposure/intervention by the researcher. 23 In some clinical settings, it is impossible to randomise or blind participants. In such cases, non-randomised designs are employed. 27 Examples include pre-posttest design (with or without controls) and interrupted time series. 27, 28 For the pre-posttest design that involves a control group, participants (subjects) are allocated to intervention or control groups (without randomisation) by the researcher. 28 On the other hand, it could be a single pre-posttest design study where all subjects are assessed at baseline, the intervention is given, and the subjects are re-assessed post-intervention. 28 An example of this type of study was reported by Lamont and Brunero (2018 ), who examined the effect of a workplace violence training program for generalist nurses in the acute hospital setting. The authors found a statistically significant increase in behaviour intention scores and overall confidence in coping with patient aggression post-test. 29 Another type of non-RCT study is the interrupted time series (ITS) in which data are gathered before and after intervention at various evenly spaced time points (such as weekly, monthly, or yearly). 30 Thus, it is crucial to take note of the precise moment an intervention occurred. The primary goal of an interrupted time series is to determine whether the data pattern observed post-intervention differs from that noted prior. 30 Several ITS were conducted to investigate the effectiveness of the different prevention strategies (such as lockdown and border closure) used during the COVID pandemic. 31, 32 Although non-RCT may be more feasible to RCTs, they are more prone to bias than RCTs due to the lack of randomisation and may not be able to control for all the variables that might affect the outcome. 23
Hierarchy of Evidence
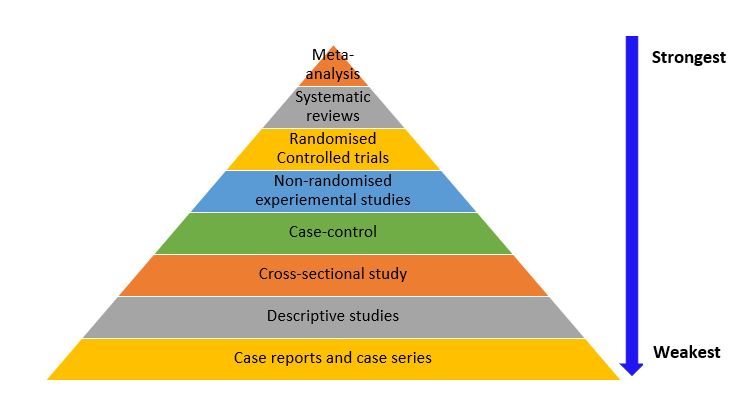
While each study design has its unique characteristics and strengths, they are not without weaknesses (as already discussed) that impact the accuracy of the results and research evidence they provide. The hierarchy of evidence is a framework used to rank the evidence provided by different study designs in research evaluating healthcare interventions with respect to the strength of the presented results (i.e., validity and reliability of the findings). 33 Study designs can be ranked in terms of their ability to provide valid evidence on the effectiveness (intervention achieves the intended outcomes), appropriateness (impact of the intervention from the perspective of its recipient) and feasibility (intervention is implementable) of the research results they provide. 33 As shown in Figure 3.6, meta-analyses, systematic reviews, and RCTs provide stronger best-practice evidence and scientific base for clinical practice than descriptive studies as well as case reports and case series. Nonetheless, it is important to note that the research question/ hypothesis determines the study design, and not all questions can be answered using an interventional design. In addition, there are other factors that need to be considered when choosing a study design, such as funding, time constraints, and ethical considerations, and these factors are discussed in detail in chapter 6.
An Introduction to Research Methods for Undergraduate Health Profession Students Copyright © 2023 by Faith Alele and Bunmi Malau-Aduli is licensed under a Creative Commons Attribution-NonCommercial 4.0 International License , except where otherwise noted.
Academia.edu no longer supports Internet Explorer.
To browse Academia.edu and the wider internet faster and more securely, please take a few seconds to upgrade your browser .
Enter the email address you signed up with and we'll email you a reset link.
- We're Hiring!
- Help Center

Chapter 3: Methodology (Quantitative

Related Papers
Godwill Medukenya
Sandeep Kumar
Alliana Ulila
Spring Season Publications
vasant kothari
Ralph Renzo Salangsang
Second Language Learning and Teaching
Magdalena Walenta
Air Medical Journal
cheryl Thompson
ribwar aljaf
RELATED PAPERS
OEm Conversations With
Filipa Pinho
Vichi Iacob
Economic and Environmental Geology
Sang-Mo KOH
Jurnal Potensi
Dedi Hantono
Geraldine Macdonald
Brazilian Journal of Development
Karem Vieira
The American journal of tropical medicine and hygiene
Camila Petzoldt
Bernardo Pérez
Bioelectrochemistry
Benoit Van den Eynde
Physical Science International Journal
Khan Hossain
Nina Mastra
Mustapha Lemiti
Sustainability
Ana Fernández-Viciana
Vittorio Morfino
Biochemical Engineering Journal
Sergio Quispe Rios
Synthetic Metals
Talat Yalcin
Mikko Itälahti
Frontiers in Cellular Neuroscience
Anton Liopo
International Journal of Accounting, Finance and Social Science Research (IJAFSSR)
Muyiwa DAGUNDURO
IOP Conference Series: Earth and Environmental Science
siti halimah
Acta ethologica
Natividade Vieira
Journal of Cleaner Production
heinz leuenberger
실시간카지노 토토사이트
Ernesto Rodriguez Ramos
West African Journal of Applied Ecology
Irene Appeaning
- We're Hiring!
- Help Center
- Find new research papers in:
- Health Sciences
- Earth Sciences
- Cognitive Science
- Mathematics
- Computer Science
- Academia ©2024
Research Methodology
- First Online: 29 June 2019
Cite this chapter

- Vaneet Kaur 3
Part of the book series: Innovation, Technology, and Knowledge Management ((ITKM))
1059 Accesses
The chapter presents methodology employed for examining framework developed, during the literature review, for the purpose of present study. In light of the research objectives, the chapter works upon the ontology, epistemology as well as the methodology adopted for the present study. The research is based on positivist philosophy which postulates that phenomena of interest in the social world, can be studied as concrete cause and effect relationships, following a quantitative research design and a deductive approach. Consequently, the present study has used the existing body of literature to deduce relationships between constructs and develops a strategy to test the proposed theory with the ultimate objective of confirming and building upon the existing knowledge in the field. Further, the chapter presents a roadmap for the study which showcases the journey towards achieving research objectives in a series of well-defined logical steps. The process followed for building survey instrument as well as sampling design has been laid down in a similar manner. While the survey design enumerates various methods adopted along with justifications, the sampling design sets forth target population, sampling frame, sampling units, sampling method and suitable sample size for the study. The chapter also spells out the operational definitions of the key variables before exhibiting the three-stage research process followed in the present study. In the first stage, questionnaire has been developed based upon key constructs from various theories/researchers in the field. Thereafter, the draft questionnaire has been refined with the help of a pilot study and its reliability and validity has been tested. Finally, in light of the results of the pilot study, the questionnaire has been finalized and final data has been collected. In doing so, the step-by-step process of gathering data from various sources has been presented. Towards end, the chapter throws spotlight on various statistical methods employed for analysis of data, along with the presentation of rationale for the selection of specific techniques used for the purpose of presentation of outcomes of the present research.
This is a preview of subscription content, log in via an institution to check access.
Access this chapter
- Available as EPUB and PDF
- Read on any device
- Instant download
- Own it forever
- Compact, lightweight edition
- Dispatched in 3 to 5 business days
- Free shipping worldwide - see info
- Durable hardcover edition
Tax calculation will be finalised at checkout
Purchases are for personal use only
Institutional subscriptions
Aasland, A. (2008). A user manual for SPSS analysis (pp. 1–60).
Google Scholar
Accenture Annual Report. (2016). Annual Report: 2016 Leading in the New. Retrieved February 13, 2017 from https://www.accenture.com/t20161030T213116__w__/in-en/_acnmedia/PDF-35/Accenture-2016-Shareholder-Letter10-K006.pdf#zoom=50 .
Achieng’Nyaura, L., & Omwenga, D. J. (2016). Factors affecting employee retention in the hotel industry in Mombasa County. Imperial Journal of Interdisciplinary Research, 2 (12).
Agariya, A. K., & Yayi, S. H. (2015). ERM scale development and validation in Indian IT sector. Journal of Internet Banking and Commerce, 20 (1), 1–16.
Aibinu, A. A., & Al-Lawati, A. M. (2010). Using PLS-SEM technique to model construction organizations’ willingness to participate in e-bidding. Automation in Construction, 19 (6), 714–724.
Article Google Scholar
Akgün, A. E., Keskin, H., & Byrne, J. (2012). Antecedents and contingent effects of organizational adaptive Capability on firm product innovativeness. Journal of Production and Innovation Management, 29 (S1), 171–189.
Akman, G., & Yilmaz, C. (2008). Innovative capability, innovation strategy and market orientation. International Journal of Innovation and Management, 12 (1), 69–111.
Akroush, M. N., Abu-ElSamen, A. A., Al-Shibly, M. S., & Al-Khawaldeh, F. M. (2010). Conceptualisation and development of customer service skills scale: An investigation of Jordanian customers. International Journal of Mobile Communications, 8 (6), 625–653.
AlKindy, A. M., Shah, I. M., & Jusoh, A. (2016). The impact of transformational leadership behaviors on work performance of Omani civil service agencies. Asian Social Science, 12 (3), 152.
Al-Mabrouk, K., & Soar, J. (2009). A delphi examination of emerging issues for successful information technology transfer in North Africa a case of Libya. African Journal of Business Management, 3 (3), 107.
Alonso-Almeida. (2015). Proactive and reactive strategies deployed by restaurants in times of crisis: Effects on capabilities, organization and competitive advantage. International Journal of Contemporary Hospitality Management, 27 (7), 1641–1661.
Alrubaiee, P., Alzubi, H. M., Hanandeh, R., & Ali, R. A. (2015). Investigating the relationship between knowledge management processes and organizational performance the mediating effect of organizational innovation. International Review of Management and Business Research, 4 (4), 989–1009.
Alters, B. J. (1997). Whose nature of science? Journal of Research in Science Teaching, 34 (1), 39–55.
Al-Thawwad, R. M. (2008). Technology transfer and sustainability-adapting factors: Culture, physical environment, and geographical location. In Proceedings of the 2008 IAJC-IJME International Conference .
Ammachchi, N. (2017). Healthcare demand spurring cloud & analytics development rush. Retrieved February 19, 2017 from http://www.nearshoreamericas.com/firms-focus-developing-low-cost-solutions-demand-outsourcing-rises-healthcare-sector-report/ .
Anatan, L. (2014). Factors influencing supply chain competitive advantage and performance. International Journal of Business and Information, 9 (3), 311–335.
Arkkelin, D. (2014). Using SPSS to understand research and data analysis.
Aroian, K. J., Kulwicki, A., Kaskiri, E. A., Templin, T. N., & Wells, C. L. (2007). Psychometric evaluation of the Arabic language version of the profile of mood states. Research in Nursing & Health, 30 (5), 531–541.
Asongu, S. A. (2013). Liberalization and financial sector competition: A critical contribution to the empirics with an African assessment.
Ayagre, P., Appiah-Gyamerah, I., & Nartey, J. (2014). The effectiveness of internal control systems of banks. The case of Ghanaian banks. International Journal of Accounting and Financial Reporting, 4 (2), 377.
Azizi, R., Maleki, M., Moradi-moghadam, M., & Cruz-machado, V. (2016). The impact of knowledge management practices on supply chain quality management and competitive advantages. Management and Production Engineering Review, 7 (1), 4–12.
Baariu, F. K. (2015). Factors influencing subscriber adoption of Mobile payments: A case of Safaricom’s Lipana M-Pesa Service in Embu Town , Kenya (Doctoral dissertation, University of Nairobi).
Babbie, E. R. (2011). Introduction to social research . Belmont: Wadsworth Cengage Learning.
Bagozzi, R. P., & Heatherton, T. F. (1994). A general approach to representing multifaceted personality constructs: Application to state self-esteem. Structural Equation Modeling: A Multidisciplinary Journal, 1 (1), 35–67.
Barlett, J. E., Kotrlik, J. W., & Higgins, C. C. (2001). Organizational research: Determining appropriate sample size in survey research. Information Technology, Learning, and Performance Journal, 19 (1), 43.
Barrales-molina, V., Bustinza, Ó. F., & Gutiérrez-gutiérrez, L. J. (2013). Explaining the causes and effects of dynamic capabilities generation: A multiple-indicator multiple-cause modelling approach. British Journal of Management, 24 , 571–591.
Barrales-molina, V., Martínez-lópez, F. J., & Gázquez-abad, J. C. (2014). Dynamic marketing capabilities: Toward an integrative framework. International Journal of Management Reviews, 16 , 397–416.
Bastian, R. W., & Thomas, J. P. (2016). Do talkativeness and vocal loudness correlate with laryngeal pathology? A study of the vocal overdoer/underdoer continuum. Journal of Voice, 30 (5), 557–562.
Bentler, P. M., & Mooijaart, A. B. (1989). Choice of structural model via parsimony: A rationale based on precision. Psychological Bulletin, 106 (2), 315–317.
Boari, C., Fratocchi, L., & Presutti, M. (2011). The Interrelated Impact of Social Networks and Knowledge Acquisition on Internationalisation Process of High-Tech Small Firms. In Proceedings of the 32th Annual Conference Academy of International Business, Bath .
Boralh, C. F. (2013). Impact of stress on depression and anxiety in dental students and professionals. International Public Health Journal, 5 (4), 485.
Bound, J. P., & Voulvoulis, N. (2005). Household disposal of pharmaceuticals as a pathway for aquatic contamination in the United Kingdom. Environmental Health Perspectives, 113 , 1705–1711.
Breznik, L., & Lahovnik, M. (2014). Renewing the resource base in line with the dynamic capabilities view: A key to sustained competitive advantage in the IT industry. Journal for East European Management Studies, 19 (4), 453–485.
Breznik, L., & Lahovnik, M. (2016). Dynamic capabilities and competitive advantage: Findings from case studies. Management: Journal of Contemporary Management Issues, 21 (Special issue), 167–185.
Cadiz, D., Sawyer, J. E., & Griffith, T. L. (2009). Developing and validating field measurement scales for absorptive capacity and experienced community of practice. Educational and Psychological Measurement, 69 (6), 1035–1058.
Carroll, G. B., Hébert, D. M., & Roy, J. M. (1999). Youth action strategies in violence prevention. Journal of Adolescent Health, 25 (1), 7–13.
Cepeda, G., & Vera, D. (2007). Dynamic capabilities and operational capabilities: A knowledge management perspective. Journal of Business Research, 60 (5), 426–437.
Chaharmahali, S. M., & Siadat, S. A. (2010). Achieving organizational ambidexterity: Understanding and explaining ambidextrous organisation.
Champoux, A., & Ommanney, C. S. L. (1986). Photo-interpretation, digital mapping, and the evolution of glaciers in glacier National Park, BC. Annals of Glaciology, 8 (1), 27–30.
Charan, C. S., & Nambirajan, T. (2016). An empirical investigation of supply chain engineering on lean thinking paradigms of in-house goldsmiths. The International Journal of Applied Business and Economic Research, 14 (6), 4475–4492.
Chau, P. Y. (2001). Inhibitors to EDI adoption in small business: An empirical investigation. Journal of Electronic Commerce Research, 2 (2), 78–88.
Chen, L. C. (2010). Multi-skilling in the hotel industry in Taiwan.
Chen, H. H., Lee, P. Y., & Lay, T. J. (2009). Drivers of dynamic learning and dynamic competitive capabilities in international strategic alliances. Journal of Business Research, 62 (12), 1289–1295.
Chen, C. W., Yu, P. H., & Li, Y. J. (2016). Understanding group-buying websites continuous use behavior: A use and gratifications theory perspective. Journal of Economics and Management, 12 (2), 177–204.
Chua, R. L., Cockfield, G., & Al-Hakim, L. (2008, November). Factors affecting trust within Australian beef supply chain. In 4th international congress on logistics and SCM systems: Effective supply chain and logistic management for sustainable development (pp. 26–28).
Cognizant Annual Report. (2015). Cognizant annual report 2015. Retrieved February 14, 2017 from http://investors.cognizant.com/download/Cognizant_AnnualReport_2015.pdf .
Cox, B. G., Mage, D. T., & Immerman, F. W. (1988). Sample design considerations for indoor air exposure surveys. JAPCA, 38 (10), 1266–1270.
Creswell, J. W. (2009). Editorial: Mapping the field of mixed methods research. Journal of Mixed Methods Research, 3 (2), 95–108.
Creswell, J. W., & Clark, V. L. P. (2007). Designing and conducting mixed methods research . Thousand Oaks: Sage.
Daniel, J. (2011). Sampling essentials: Practical guidelines for making sampling choices . London: Sage.
De Winter, J. C., & Dodou, D. (2010). Five-point Likert items: T test versus Mann-Whitney-Wilcoxon. Practical Assessment, Research & Evaluation, 15 (11), 1–12.
Deans, P. C., Karwan, K. R., Goslar, M. D., Ricks, D. A., & Toyne, B. (1991). Identification of key international information systems issues in US-based multinational corporations. Journal of Management Information Systems, 7 (4), 27–50.
Dei Mensah, R. (2014). Effects of human resource management practices on retention of employees in the banking industry in Accra, Ghana (Doctoral dissertation, Kenyatta University).
Dubey, R. (2016). Re-imagining Infosys. Retrieved February 19, 2017 from http://www.businesstoday.in/magazine/cover-story/how-infosys-ceo-is-trying-to-bring-back-the-company-into-high-growth-mode/story/230431.html .
Dunn, S., Cragg, B., Graham, I. D., Medves, J., & Gaboury, I. (2013). Interprofessional shared decision making in the NICU: A survey of an interprofessional healthcare team. Journal of Research in Interprofessional Practice and Education, 3 (1).
Einwiller, S. (2003). When reputation engenders trust: An empirical investigation in business-to-consumer electronic commerce. Electronic Markets, 13 (3), 196–209.
Eliassen, K. M., & Hopstock, L. A. (2011). Sleep promotion in the intensive care unit—A survey of nurses’ interventions. Intensive and Critical Care Nursing, 27 (3), 138–142.
Elliott, M., Page, K., Worrall-Carter, L., & Rolley, J. (2013). Examining adverse events after intensive care unit discharge: Outcomes from a pilot questionnaire. International Journal of Nursing Practice, 19 (5), 479–486.
Fabrigar, L. R., Wegener, D. T., MacCallum, R. C., & Strahan, E. J. (1999). Evaluating the use of exploratory factor analysis in psychological research. Psychological Methods, 4 (3), 272–299.
Filippini, R., Güttel, W. H., & Nosella, A. (2012). Dynamic capabilities and the evolution of knowledge management projects in SMEs. International Journal of Technology Management, 60 (3/4), 202.
Finstad, K. (2010). Response interpolation and scale sensitivity: Evidence against 5-point scales. Journal of Usability Studies, 5 (3), 104–110.
Fleming, C. M., & Bowden, M. (2009). Web-based surveys as an alternative to traditional mail methods. Journal of Environmental Management, 90 (1), 284–292.
Foss, N. J., & Pedersen, T. (2004). Organizing knowledge processes in the multinational corporation: An introduction. Journal of International Business Studies, 35 (5), 340–349.
Frosi, G., Barros, V. A., Oliveira, M. T., Cavalcante, U. M. T., Maia, L. C., & Santos, M. G. (2016). Increase in biomass of two woody species from a seasonal dry tropical forest in association with AMF with different phosphorus levels. Applied Soil Ecology, 102 , 46–52.
Fujisato, H., Ito, M., Takebayashi, Y., Hosogoshi, H., Kato, N., Nakajima, S., & Horikoshi, M. (2017). Reliability and validity of the Japanese version of the emotion regulation skills questionnaire. Journal of Affective Disorders, 208 , 145–152.
Garg, R., & De, K. (2012). Impact of dynamic capabilities on the export orientation and export performance of small and medium sized enterprises in emerging markets: A conceptual model. African Journal of Business Management, 6 (29), 8464–8474.
Gerbing, D. W., & Anderson, J. C. (1988). An updated paradigm for scale development incorporating unidimensionality and its assessment. Journal of Marketing Research, 25 , 186–192.
Getz, L. M., Marks, S., & Roy, M. (2014). The influence of stress, optimism, and music training on music uses and preferences. Psychology of Music, 42 (1), 71–85.
Gibson, C. B., & Birkinshaw, J. (2004). The antecedents, consequences, and mediating role of organizational ambidexterity. Academy of Management Journal, 47 (2), 209–226.
Glasow, P. A. (2005). Fundamentals of survey research methodology.
Global MAKE Report. (2016). Global Most Admired Knowledge Enterprises (MAKE) report: Executive summary. Retrieved February 22, 2017 from http://www.knowledgebusiness.com/knowledgebusiness/templates/ViewAttachment.aspx?hyperLinkId=6695 .
Gold, A. H., Malhotra, A., & Segars, A. H. (2001). Knowledge management: An organizational capabilities perspective. Journal of Management Information Systems, 18 (1), 185–214.
Goltz, N. G. (2012). Influence of the first impression on credibility evaluation of online information (Bachelor’s thesis, University of Twente).
Graham, J. D., Beaulieu, N. D., Sussman, D., Sadowitz, M., & Li, Y. C. (1999). Who lives near coke plants and oil refineries? An exploration of the environmental inequity hypothesis. Risk Analysis, 19 (2), 171–186.
Granados, M. L. (2015). Knowing what social enterprises know. In 5th EMES International Research Conference on Social Enterprise (pp. 1–20).
Guo, Y. M., & Poole, M. S. (2009). Antecedents of flow in online shopping: A test of alternative models. Information Systems Journal, 19 (4), 369–390.
Hadadi, M., Ebrahimi Takamjani, I., Ebrahim Mosavi, M., Aminian, G., Fardipour, S., & Abbasi, F. (2016). Cross-cultural adaptation, reliability, and validity of the Persian version of the Cumberland ankle instability tool. Disability and Rehabilitation , 8288(February), 1–9. https://doi.org/10.1080/09638288.2016.1207105
Haghighi, M. A., Bagheri, R., & Kalat, P. S. (2015). The relationship of knowledge management and organizational performance in science and technology parks of Tehran. Independent Journal of Management & Production, 6 (2), 422–448.
Hahm, S., Knuth, D., Kehl, D., & Schmidt, S. (2016). The impact of different natures of experience on risk perception regarding fire-related incidents: A comparison of firefighters and emergency survivors using cross-national data. Safety Science, 82 , 274–282.
Hansen, S. S., & Lee, J. K. (2013). What drives consumers to pass along marketer-generated eWOM in social network games? Social and game factors in play. Journal of Theoretical and Applied Electronic Commerce Research, 8 (1), 53–68.
Haq, M. (2015). A comparative analysis of qualitative and quantitative research methods and a justification for adopting mixed methods in social research.
Hashim, Y. A. (2010). Determining sufficiency of sample size in management survey research activities. International Journal of Organisational Management & Entrepreneurship Development, 6 (1), 119–130.
Hill, R. (1998). What sample size is “enough” in internet survey research. Interpersonal Computing and Technology: An Electronic Journal for the 21st Century, 6 (3–4), 1–12.
Hinkin, T. R. (1995). A review of scale development practices in the study of organizations. Journal of Management, 21 (5), 967–988.
Hogan, S. J., Soutar, G. N., McColl-Kennedy, J. R., & Sweeney, J. C. (2011). Reconceptualizing professional service firm innovation capability: Scale development. Industrial Marketing Management, 40 (8), 1264–1273.
Holm, K. E., LaChance, H. R., Bowler, R. P., Make, B. J., & Wamboldt, F. S. (2010). Family factors are associated with psychological distress and smoking status in chronic obstructive pulmonary disease. General Hospital Psychiatry, 32 (5), 492–498.
Horng, J. S., Teng, C. C., & Baum, T. G. (2009). Evaluating the quality of undergraduate hospitality, tourism and leisure programmes. Journal of Hospitality, Leisure, Sport and Tourism Education, 8 (1), 37–54.
Huan, Y., & Li, D. (2015). Effects of intellectual capital on innovative performance: The role of knowledge- based dynamic capability. Management Decision, 53 (1), 40–56.
Huckleberry, S. D. (2011). Commitment to coaching: Using the sport commitment model as a theoretical framework with soccer coaches (Doctoral dissertation, Ohio University).
Humborstad, S. I. W., & Perry, C. (2011). Employee empowerment, job satisfaction and organizational commitment: An in-depth empirical investigation. Chinese Management Studies, 5 (3), 325–344.
Infosys Annual Report. (2015). Infosys annual report 2015. Retrieved February 12, 2017 from https://www.infosys.com/investors/reports-filings/annual-report/annual/Documents/infosys-AR-15.pdf .
Investment Standard. (2016). Cognizant is the best pick out of the 4 information technology service providers. Retrieved February 19, 2017 from http://seekingalpha.com/article/3961500-cognizant-best-pick-4-information-technology-service-providers .
Jansen, J. J., Van Den Bosch, F. A., & Volberda, H. W. (2005). Managing potential and realized absorptive capacity: How do organizational antecedents matter? Academy of Management Journal, 48 (6), 999–1015.
John, N. A., Seme, A., Roro, M. A., & Tsui, A. O. (2017). Understanding the meaning of marital relationship quality among couples in peri-urban Ethiopia. Culture, Health & Sexuality, 19 (2), 267–278.
Joo, J., & Sang, Y. (2013). Exploring Koreans’ smartphone usage: An integrated model of the technology acceptance model and uses and gratifications theory. Computers in Human Behavior, 29 (6), 2512–2518.
Kaehler, C., Busatto, F., Becker, G. V., Hansen, P. B., & Santos, J. L. S. (2014). Relationship between adaptive capability and strategic orientation: An empirical study in a Brazilian company. iBusiness .
Kajfez, R. L. (2014). Graduate student identity: A balancing act between roles.
Kam Sing Wong, S., & Tong, C. (2012). The influence of market orientation on new product success. European Journal of Innovation Management, 15 (1), 99–121.
Karttunen, V., Sahlman, H., Repo, J. K., Woo, C. S. J., Myöhänen, K., Myllynen, P., & Vähäkangas, K. H. (2015). Criteria and challenges of the human placental perfusion–Data from a large series of perfusions. Toxicology In Vitro, 29 (7), 1482–1491.
Kaur, V., & Mehta, V. (2016a). Knowledge-based dynamic capabilities: A new perspective for achieving global competitiveness in IT sector. Pacific Business Review International, 1 (3), 95–106.
Kaur, V., & Mehta, V. (2016b). Leveraging knowledge processes for building higher-order dynamic capabilities: An empirical evidence from IT sector in India. JIMS 8M , July- September.
Kaya, A., Iwamoto, D. K., Grivel, M., Clinton, L., & Brady, J. (2016). The role of feminine and masculine norms in college women’s alcohol use. Psychology of Men & Masculinity, 17 (2), 206–214.
Kenny, A., McLoone, S., Ward, T., & Delaney, D. (2006). Using user perception to determine suitable error thresholds for dead reckoning in distributed interactive applications.
Kianpour, K., Jusoh, A., & Asghari, M. (2012). Importance of Price for buying environmentally friendly products. Journal of Economics and Behavioral Studies, 4 (6), 371–375.
Kim, J., & Forsythe, S. (2008). Sensory enabling technology acceptance model (SE-TAM): A multiple-group structural model comparison. Psychology & Marketing, 25 (9), 901–922.
Kim, Y. J., Oh, Y., Park, S., Cho, S., & Park, H. (2013). Stratified sampling design based on data mining. Healthcare Informatics Research, 19 (3), 186–195.
Kim, R., Yang, H., & Chao, Y. (2016). Effect of brand equity& country origin on Korean consumers’ choice for beer brands. The Business & Management Review, 7 (3), 398.
Kimweli, J. M. (2013). The role of monitoring and evaluation practices to the success of donor funded food security intervention projects a case study of Kibwezi District. International Journal of Academic Research in Business and Social Sciences, 3 (6), 9.
Kinsfogel, K. M., & Grych, J. H. (2004). Interparental conflict and adolescent dating relationships: Integrating cognitive, emotional, and peer influences. Journal of Family Psychology, 18 (3), 505–515.
Kivimäki, M., Vahtera, J., Pentti, J., Thomson, L., Griffiths, A., & Cox, T. (2001). Downsizing, changes in work, and self-rated health of employees: A 7-year 3-wave panel study. Anxiety, Stress and Coping, 14 (1), 59–73.
Klemann, B. (2012). The unknowingly consumers of Fairtrade products.
Kothari, C. R. (2004). Research methodology: Methods and techniques . New Delhi: New Age International.
Krause, D. R. (1999). The antecedents of buying firms’ efforts to improve suppliers. Journal of Operations Management, 17 (2), 205–224.
Krejcie, R. V., & Morgan, D. W. (1970). Determining sample size for research activities. Educational and Psychological Measurement., 30 , 607–610.
Krige, S. M., Mahomoodally, F. M., Subratty, A. H., & Ramasawmy, D. (2012). Relationship between socio-demographic factors and eating practices in a multicultural society. Food and Nutrition Sciences, 3 (3), 286–295.
Krzakiewicz, K. (2013). Dynamic capabilities and knowledge management. Management, 17 (2), 1–15.
Kuzic, J., Fisher, J., Scollary, A., Dawson, L., Kuzic, M., & Turner, R. (2005). Modus vivendi of E-business. PACIS 2005 Proceedings , 99.
Laframboise, K., Croteau, A. M., Beaudry, A., & Manovas, M. (2009). Interdepartmental knowledge transfer success during information technology projects. International Journal of Knowledge Management , 189–210.
Landaeta, R. E. (2008). Evaluating benefits and challenges of knowledge transfer across projects. Engineering Management Journal, 20 (1), 29–38.
Lee, Y., Chen, A., Yang, Y. L., Ho, G. H., Liu, H. T., & Lai, H. Y. (2005). The prophylactic antiemetic effects of ondansetron, propofol, and midazolam in female patients undergoing sevoflurane anaesthesia for ambulatory surgery: A-42. European Journal of Anaesthesiology (EJA), 22 , 11–12.
Lee, V. H., Foo, A. T. L., Leong, L. Y., & Ooi, K. B. (2016). Can competitive advantage be achieved through knowledge management? A case study on SMEs. Expert Systems with Applications, 65 , 136–151.
Leech, N. L., Barrett, K. C., & Morgan, G. A. (2005). SPSS for intermediate statistics: Use and interpretation . New Jersey: Psychology Press.
Leonardi, F., Spazzafumo, L., & Marcellini, F. (2005). Subjective Well-being: The constructionist point of view. A longitudinal study to verify the predictive power of top-down effects and bottom-up processes. Social Indicators Research, 70 (1), 53–77.
Li, D. Y., & Liu, J. (2014). Dynamic capabilities, environmental dynamism, and competitive advantage: Evidence from China. Journal of Business Research, 67 (1), 2793–2799.
Liao, S. H., Fei, W. C., & Chen, C. C. (2007). Knowledge sharing, absorptive capacity, and innovation capability: An empirical study of Taiwan’s knowledge-intensive industries. Journal of Information Science, 33 (3), 340–359.
Liao, S. H., & Wu, C. C. (2009). The relationship among knowledge management, organizational learning, and organizational performance. International Journal of Business and Management, 4 (4), 64.
Liao, T. S., Rice, J., & Lu, J. C. (2014). The vicissitudes of Competitive advantage: Empirical evidence from Australian manufacturing SMEs. Journal of Small Business Management, 53 (2), 469–481.
Liu, S., & Deng, Z. (2015). Understanding knowledge management capability in business process outsourcing: A cluster analysis. Management Decision, 53 (1), 1–11.
Liu, C. L. E., Ghauri, P. N., & Sinkovics, R. R. (2010). Understanding the impact of relational capital and organizational learning on alliance outcomes. Journal of World Business, 45 (3), 237–249.
Luís, C., Cothran, E. G., & do Mar Oom, M. (2007). Inbreeding and genetic structure in the endangered Sorraia horse breed: Implications for its conservation and management. Journal of Heredity, 98 (3), 232–237.
MacDonald, C. M., & Atwood, M. E. (2014, June). What does it mean for a system to be useful?: An exploratory study of usefulness. In Proceedings of the 2014 conference on designing interactive systems (pp. 885–894). New York: ACM.
Mafini, C., & Dlodlo, N. (2014). The relationship between extrinsic motivation, job satisfaction and life satisfaction amongst employees in a public organisation. SA Journal of Industrial Psychology, 40 (1), 01–12.
Mafini, C., Dhurup, M., & Mandhlazi, L. (2014). Shopper typologies amongst a generation Y consumer cohort and variations in terms of age in the fashion apparel market: Original research. Acta Commercii, 14 (1), 1–11.
Mageswari, S. U., Sivasubramanian, C., & Dath, T. S. (2015). Knowledge management enablers, processes and innovation in Small manufacturing firms: A structural equation modeling approach. IUP Journal of Knowledge Management, 13 (1), 33.
Mahoney, J. T. (2005). Resource-based theory, dynamic capabilities, and real options. In Foundations for organizational science. Economic foundations of strategy . Thousand Oaks: SAGE Publications.
Malhotra, N., Hall, J., Shaw, M., & Oppenheim, P. (2008). Essentials of marketing research, 2nd Australian edition.
Manan, R. M. (2016). The use of hangman game in motivating students in Learning English. ELT Perspective, 4 (2).
Manco-Johnson, M., Morrissey-Harding, G., Edelman-Lewis, B., Oster, G., & Larson, P. (2004). Development and validation of a measure of disease-specific quality of life in young children with haemophilia. Haemophilia, 10 (1), 34–41.
Marek, L. (2016). Guess which Illinois company uses the most worker visas. Retrieved February 13, 2017 from http://www.chicagobusiness.com/article/20160227/ISSUE01/302279994/guess-which-illinois-company-uses-the-most-worker-visas .
Martin, C. M., Roach, V. A., Nguyen, N., Rice, C. L., & Wilson, T. D. (2013). Comparison of 3D reconstructive technologies used for morphometric research and the translation of knowledge using a decision matrix. Anatomical Sciences Education, 6 (6), 393–403.
Maskatia, S. A., Altman, C. A., Morris, S. A., & Cabrera, A. G. (2013). The echocardiography “boot camp”: A novel approach in pediatric cardiovascular imaging education. Journal of the American Society of Echocardiography, 26 (10), 1187–1192.
Matson, J. L., Boisjoli, J., Rojahn, J., & Hess, J. (2009). A factor analysis of challenging behaviors assessed with the baby and infant screen for children with autism traits. Research in Autism Spectrum Disorders, 3 (3), 714–722.
Matusik, S. F., & Heeley, M. B. (2005). Absorptive capacity in the software Industry: Identifying dimensions that affect knowledge and knowledge creation activities. Journal of Management, 31 (4), 549–572.
Matveev, A. V. (2002). The advantages of employing quantitative and qualitative methods in intercultural research: Practical implications from the study of the perceptions of intercultural communication competence by American and Russian managers. Bulletin of Russian Communication Association Theory of Communication and Applied Communication, 1 , 59–67.
McDermott, E. P., & Ervin, D. (2005). The influence of procedural and distributive variables on settlement rates in employment discrimination mediation. Journal of Dispute Resolution, 45 , 1–16.
McKelvie, A. (2007). Innovation in new firms: Examining the role of knowledge and growth willingness.
Mendonca, J., & Sen, A. (2016). IT companies including TCS, Infosys, Wipro bracing for slowest topline expansion on annual basis. Retrieved February 19 2017 from http://economictimes.indiatimes.com/markets/stocks/earnings/it-companies-including-tcs-infosys-wipro-bracing-for-slowest-topline-expansion-on-annual-basis/articleshow/51639858.cms .
Mesina, F., De Deyne, C., Judong, M., Vandermeersch, E., & Heylen, R. (2005). Quality survey of pre-operative assessment: Influence of a standard questionnaire: A-38. European Journal of Anaesthesiology (EJA), 22 , 11.
Michailova, S., & Zhan, W. (2014). Dynamic capabilities and innovation in MNC subsidiaries. Journal of World Business , 1–9.
Miller, R., Salmona, M., & Melton, J. (2012). Modeling student concern for professional online image. Journal of Internet Social Networking & Virtual Communities, 3 (2), 1.
Minarro-Viseras, E., Baines, T., & Sweeney, M. (2005). Key success factors when implementing strategic manufacturing initiatives. International Journal of Operations & Production Management, 25 (2), 151–179.
Monferrer, D., Blesa, A., & Ripollés, M. (2015). Catching dynamic capabilities through market-oriented networks. European Journal of International Management, 9 (3), 384–408.
Moyer, J. E. (2007). Learning from leisure reading: A study of adult public library patrons. Reference & User Services Quarterly, 46 , 66–79.
Mulaik, S. A., James, L. R., Van Alstine, J., Bennett, N., Lind, S., & Stilwell, C. D. (1989). Evaluation of goodness-of-fit indices for structural equation models. Psychological Bulletin, 105 (3), 430–445.
Murphy, T. H., & Terry, H. R. (1998). Faculty needs associated with agricultural distance education. Journal of Agricultural Education, 39 , 17–27.
Murphy, C., Hearty, C., Murray, M., & McCaul, C. (2005). Patient preferences for desired post-anaesthesia outcomes-a comparison with medical provider perspective: A-40. European Journal of Anaesthesiology (EJA), 22 , 11.
Nair, A., Rustambekov, E., McShane, M., & Fainshmidt, S. (2014). Enterprise risk management as a dynamic Capability: A test of its effectiveness during a crisis. Managerial and Decision Economics, 35 , 555–566.
Nandan, S. (2010). Determinants of customer satisfaction on service quality: A study of railway platforms in India. Journal of Public Transportation, 13 (1), 6.
NASSCOM Indian IT-BPM Industry Report. (2016). NASSCOM Indian IT-BPM Industry Report 2016. Retrieved January 11, 2017 from http://www.nasscom.in/itbpm-sector-india-strategic-review-2016 .
Nedzinskas, Š. (2013). Dynamic capabilities and organizational inertia interaction in volatile environment. Retrieved from http://archive.ism.lt/handle/1/301 .
Nguyen, T. N. Q. (2010). Knowledge management capability and competitive advantage: An empirical study of Vietnamese enterprises.
Nguyen, N. T. D., & Aoyama, A. (2014). Achieving efficient technology transfer through a specific corporate culture facilitated by management practices. The Journal of High Technology Management Research, 25 (2), 108–122.
Nguyen, Q. T. N., & Neck, P. A. (2008, July). Knowledge management as dynamic capabilities: Does it work in emerging less developed countries. In Proceedings of the 16th Annual Conference on Pacific Basin Finance, Economics, Accounting and Management (pp. 1–18).
Nieves, J., & Haller, S. (2014). Building dynamic capabilities through knowledge resources. Tourism Management, 40 , 224–232.
Nirmal, R. (2016). Indian IT firms late movers in digital race. Retrieved February 19, 2017 from http://www.thehindubusinessline.com/info-tech/indian-it-firms-late-movers-in-digital-race/article8505379.ece .
Numthavaj, P., Bhongmakapat, T., Roongpuwabaht, B., Ingsathit, A., & Thakkinstian, A. (2017). The validity and reliability of Thai Sinonasal outcome Test-22. European Archives of Oto-Rhino-Laryngology, 274 (1), 289–295.
Obwoge, M. E., Mwangi, S. M., & Nyongesa, W. J. (2013). Linking TVET institutions and industry in Kenya: Where are we. The International Journal of Economy, Management and Social Science, 2 (4), 91–96.
Oktemgil, M., & Greenley, G. (1997). Consequences of high and low adaptive capability in UK companies. European Journal of Marketing, 31 (7), 445–466.
Ouyang, Y. (2015). A cyclic model for knowledge management capability-a review study. Arabian Journal of Business and Management Review, 5 (2), 1–9.
Paloniemi, R., & Vainio, A. (2011). Legitimacy and empowerment: Combining two conceptual approaches for explaining forest owners’ willingness to cooperate in nature conservation. Journal of Integrative Environmental Sciences, 8 (2), 123–138.
Pant, S., & Lado, A. (2013). Strategic business process offshoring and Competitive advantage: The role of strategic intent and absorptive capacity. Journal of Information Science and Technology, 9 (1), 25–58.
Paramati, S. R., Gupta, R., Maheshwari, S., & Nagar, V. (2016). The empirical relationship between the value of rupee and performance of information technology firms: Evidence from India. International Journal of Business and Globalisation, 16 (4), 512–529.
Parida, V., Oghazi, P., & Cedergren, S. (2016). A study of how ICT capabilities can influence dynamic capabilities. Journal of Enterprise Information Management, 29 (2), 1–22.
Parkhurst, K. A., Conwell, Y., & Van Orden, K. A. (2016). The interpersonal needs questionnaire with a shortened response scale for oral administration with older adults. Aging & Mental Health, 20 (3), 277–283.
Payne, A. A., Gottfredson, D. C., & Gottfredson, G. D. (2006). School predictors of the intensity of implementation of school-based prevention programs: Results from a national study. Prevention Science, 7 (2), 225–237.
Pereira-Moliner, J., Font, X., Molina-Azorín, J., Lopez-Gamero, M. D., Tarí, J. J., & Pertusa-Ortega, E. (2015). The holy grail: Environmental management, competitive advantage and business performance in the Spanish hotel industry. International Journal of Contemporary Hospitality Management, 27 (5), 714–738.
Persada, S. F., Razif, M., Lin, S. C., & Nadlifatin, R. (2014). Toward paperless public announcement on environmental impact assessment (EIA) through SMS gateway in Indonesia. Procedia Environmental Sciences, 20 , 271–279.
Pertusa-Ortega, E. M., Molina-Azorín, J. F., & Claver-Cortés, E. (2010). Competitive strategy, structure and firm performance: A comparison of the resource-based view and the contingency approach. Management Decision, 48 (8), 1282–1303.
Peters, M. D., Wieder, B., Sutton, S. G., & Wake, J. (2016). Business intelligence systems use in performance measurement capabilities: Implications for enhanced competitive advantage. International Journal of Accounting Information Systems, 21 (1–17), 1–17.
Protogerou, A., Caloghirou, Y., & Lioukas, S. (2011). Dynamic capabilities and their indirect impact on firm performance. Industrial and Corporate Change, 21 (3), 615–647.
Rapiah, M., Wee, S. H., Ibrahim Kamal, A. R., & Rozainun, A. A. (2010). The relationship between strategic performance measurement systems and organisational competitive advantage. Asia-Pacific Management Accounting Journal, 5 (1), 1–20.
Reuner, T. (2016). HfS blueprint Report, ServiceNow services 2016, excerpt for Cognizant. Retrieved February 2, 2017 from https://www.cognizant.com/services-resources/Services/hfs-blueprint-report-servicenow-2016.pdf .
Ríos, V. R., & del Campo, E. P. (2013). Business research methods: Theory and practice . Madrid: ESIC Editorial.
Sachitra, V. (2015). Review of Competitive advantage measurements: The case of agricultural firms. IV, 303–317.
Sahney, S., Banwet, D. K., & Karunes, S. (2004). Customer requirement constructs: The premise for TQM in education: A comparative study of select engineering and management institutions in the Indian context. International Journal of Productivity and Performance Management, 53 (6), 499–520.
Sampe, F. (2012). The influence of organizational learning on performance in Indonesian SMEs.
Sarlak, M. A., Shafiei, M., Sarlak, M. A., Shafiei, M., Capability, M., Capability, I., & Competitive, S. (2013). A research in relationship between entrepreneurship, marketing Capability, innovative Capability and sustainable Competitive advantage. Kaveh Industrial City, 7 (8), 1490–1497.
Saunders, M., Lewis, P., & Thornhill, A. (2012). Research methods for business students . Pearson.
Schiff, J. H., Fornaschon, S., Schiff, M., Martin, E., & Motsch, J. (2005). Measuring patient dissatisfaction with anethesia care: A-41. European Journal of Anaesthesiology (EJA), 22 , 11.
Schwartz, S. J., Coatsworth, J. D., Pantin, H., Prado, G., Sharp, E. H., & Szapocznik, J. (2006). The role of ecodevelopmental context and self-concept in depressive and externalizing symptoms in Hispanic adolescents. International Journal of Behavioral Development, 30 (4), 359–370.
Scott, V. C., Sandberg, J. G., Harper, J. M., & Miller, R. B. (2012). The impact of depressive symptoms and health on sexual satisfaction for older couples: Implications for clinicians. Contemporary Family Therapy, 34 (3), 376–390.
Shafia, M. A., Shavvalpour, S., Hosseini, M., & Hosseini, R. (2016). Mediating effect of technological innovation capabilities between dynamic capabilities and competitiveness of research and technology organisations. Technology Analysis & Strategic Management, 28 , 1–16. https://doi.org/10.1080/09537325.2016.1158404 .
Shahzad, K., Faisal, A., Farhan, S., Sami, A., Bajwa, U., & Sultani, R. (2016). Integrating knowledge management (KM) strategies and processes to enhance organizational creativity and performance: An empirical investigation. Journal of Modelling in Management, 11 (1), 1–34.
Sharma, A. (2016). Five reasons why you should avoid investing in IT stocks. Retrieved February 19, 2017 from http://www.businesstoday.in/markets/company-stock/five-reasons-why-you-should-avoid-investing-in-infosys-tcs-wipro/story/238225.html .
Sharma, J. K., & Singh, A. K. (2012). Absorptive capability and competitive advantage: Some insights from Indian pharmaceutical Industry. International Journal of Management and Business Research, 2 (3), 175–192.
Shepherd, R. M., & Edelmann, R. J. (2005). Reasons for internet use and social anxiety. Personality and Individual Differences, 39 (5), 949–958.
Singh, R., & Khanduja, D. (2010). Customer requirements grouping–a prerequisite for successful implementation of TQM in technical education. International Journal of Management in Education, 4 (2), 201–215.
Small, M. J., Gupta, J., Frederic, R., Joseph, G., Theodore, M., & Kershaw, T. (2008). Intimate partner and nonpartner violence against pregnant women in rural Haiti. International Journal of Gynecology & Obstetrics, 102 (3), 226–231.
Srivastava, M. (2016). IT biggies expect weaker Sept quarter. Retrieved February 19, 2017 from http://www.business-standard.com/article/companies/it-biggies-expect-weaker-sept-quarter-116100400680_1.html .
Stoten, D. W. (2016). Discourse, knowledge and power: The continuing debate over the DBA. Journal of Management Development, 35 (4), 430–447.
Sudarvel, J., & Velmurugan, R. (2015). Semi month effect in Indian IT sector with reference to BSE IT index. International Journal of Advance Research in Computer Science and Management Studies, 3 (10), 155–159.
Sylvia, M., & Terhaar, M. (2014). An approach to clinical data Management for the Doctor of nursing practice curriculum. Journal of Professional Nursing, 30 (1), 56–62.
Tabachnick, B. G., & Fidell, L. S. (2007). Multivariate analysis of variance and covariance. Using Multivariate Statistics, 3 , 402–407.
Teece, D. J. (2014). The foundations of Enterprise performance: Dynamic and ordinary capabilities in an (economic) theory of firms. The Academy of Management Perspectives, 28 (4), 328–352.
Teece, D. J., Pisano, G., & Shuen, A. (1997). Dynamic capabilities and strategic management. Strategic Management Journal, 18 (7), 509–533.
Thomas, J. B., Sussman, S. W., & Henderson, J. C. (2001). Understanding “strategic learning”: Linking organizational learning, knowledge management, and sensemaking. Organization Science, 12 (3), 331–345.
Travis, S. E., & Grace, J. B. (2010). Predicting performance for ecological restoration: A case study using Spartina alterniflora. Ecological Applications, 20 (1), 192–204.
Tseng, S., & Lee, P. (2014). The effect of knowledge management capability and dynamic capability on organizational performance. Journal of Enterprise Information Management, 27 (2), 158–179.
Turker, D. (2009). Measuring corporate social responsibility: A scale development study. Journal of Business Ethics, 85 (4), 411–427.
Vanham, D., Mak, T. N., & Gawlik, B. M. (2016). Urban food consumption and associated water resources: The example of Dutch cities. Science of the Total Environment, 565 , 232–239.
Visser, P. S., Krosnick, J. A., & Lavrakas, P. J. (2000). Survey research. In H.T. Reis & C.M. Judd (Eds.), Handbook of research methods in social and personality psychology (pp. 223-252). New York: Cambridge.
Vitale, G., Sala, F., Consonni, F., Teruzzi, M., Greco, M., Bertoli, E., & Maisano, P. (2005). Perioperative complications correlate with acid-base balance in elderly trauma patients: A-37. European Journal of Anaesthesiology (EJA), 22 , 10–11.
Wang, C. L., & Ahmed, P. K. (2004). Leveraging knowledge in the innovation and learning process at GKN. International Journal of Technology Management, 27 (6/7), 674–688.
Wang, C. L., Senaratne, C., & Rafiq, M. (2015). Success traps, dynamic capabilities and firm performance. British Journal of Management, 26 , 26–44.
Wasswa Katono, I. (2011). Student evaluation of e-service quality criteria in Uganda: The case of automatic teller machines. International Journal of Emerging Markets, 6 (3), 200–216.
Wasylkiw, L., Currie, M. A., Meuse, R., & Pardoe, R. (2010). Perceptions of male ideals: The power of presentation. International Journal of Men's Health, 9 (2), 144–153.
Wilhelm, H., Schlömer, M., & Maurer, I. (2015). How dynamic capabilities affect the effectiveness and efficiency of operating routines under high and Low levels of environmental dynamism. British Journal of Management , 1–19.
Wilkens, U., Menzel, D., & Pawlowsky, P. (2004). Inside the black-box : Analysing the generation of Core competencies and dynamic capabilities by exploring collective minds. An organizational learning perspective. Management Review, 15 (1), 8–27.
Willemsen, M. C., & de Vries, H. (1996). Saying “no” to environmental tobacco smoke: Determinants of assertiveness among nonsmoking employees. Preventive Medicine, 25 (5), 575–582.
Williams, M., Peterson, G. M., Tenni, P. C., & Bindoff, I. K. (2012). A clinical knowledge measurement tool to assess the ability of community pharmacists to detect drug-related problems. International Journal of Pharmacy Practice, 20 (4), 238–248.
Wintermark, M., Huss, D. S., Shah, B. B., Tustison, N., Druzgal, T. J., Kassell, N., & Elias, W. J. (2014). Thalamic connectivity in patients with essential tremor treated with MR imaging–guided focused ultrasound: In vivo Fiber tracking by using diffusion-tensor MR imaging. Radiology, 272 (1), 202–209.
Wipro Annual Report. (2015). Wipro annual report 2014–15. Retrieved February 16, 2017 from http://www.wipro.com/documents/investors/pdf-files/Wipro-annual-report-2014-15.pdf .
Wu, J., & Chen, X. (2012). Leaders’ social ties, knowledge acquisition capability and firm competitive advantage. Asia Pacific Journal of Management, 29 (2), 331–350.
Yamane, T. (1967). Elementary Sampling Theory Prentice Inc. Englewood Cliffs. NS, USA, 1, 371–390.
Zahra, S., Sapienza, H. J., & Davidsson, P. (2006). Entrepreneurship and dynamic capabilities: A review, model and research agenda. Journal of Management Studies, 43 (4), 917–955.
Zaied, A. N. H. (2012). An integrated knowledge management capabilities framework for assessing organizational performance. International Journal of Information Technology and Computer Science, 4 (2), 1–10.
Zakaria, Z. A., Anuar, H. S., & Udin, Z. M. (2015). The relationship between external and internal factors of information systems success towards employee performance: A case of Royal Malaysia custom department. International Journal of Economics, Finance and Management, 4 (2), 54–60.
Zheng, S., Zhang, W., & Du, J. (2011). Knowledge-based dynamic capabilities and innovation in networked environments. Journal of Knowledge Management, 15 (6), 1035–1051.
Zikmund, W. G., Babin, B. J., Carr, J. C., & Griffin, M. (2010). Business research methods . Mason: South Western Cengage Learning.
Download references
Author information
Authors and affiliations.
The University of Texas at Dallas, Richardson, TX, USA
Vaneet Kaur
You can also search for this author in PubMed Google Scholar
Rights and permissions
Reprints and permissions
Copyright information
© 2019 Springer Nature Switzerland AG
About this chapter
Kaur, V. (2019). Research Methodology. In: Knowledge-Based Dynamic Capabilities. Innovation, Technology, and Knowledge Management. Springer, Cham. https://doi.org/10.1007/978-3-030-21649-8_3
Download citation
DOI : https://doi.org/10.1007/978-3-030-21649-8_3
Published : 29 June 2019
Publisher Name : Springer, Cham
Print ISBN : 978-3-030-21648-1
Online ISBN : 978-3-030-21649-8
eBook Packages : Business and Management Business and Management (R0)
Share this chapter
Anyone you share the following link with will be able to read this content:
Sorry, a shareable link is not currently available for this article.
Provided by the Springer Nature SharedIt content-sharing initiative
- Publish with us
Policies and ethics
- Find a journal
- Track your research
Want to create or adapt books like this? Learn more about how Pressbooks supports open publishing practices.
2 Types of Quantitative Research Designs
There are three main groups of Research Designs that will be explored in this chapter.
- Experimental
- Quasi-experimental
- Non-experimental
When reviewing each design, the purpose and key features of the design, advantages and disadvantages, and the most commonly used designs within the category will be reviewed.
1. Experimental Design
Purpose: Evaluate outcomes in terms of efficacy and/or cost effectiveness
Experimental design features include:
- Randomization of subjects to groups
- Manipulation of independent variable (e.g., an intervention or treatment)
- Control – the use of a control group and control measures (for controlling extraneous variables )
Advantages:
- Most appropriate for testing cause-and-effect relationships (e.g., generalizability is most likely)
- Provides the highest level of evidence (e.g., level II) for single studies
Disadvantages:
- Attrition especially control group participants or with ‘before-after’ experimental designs
- Feasibility and logistics may be an issue is certain settings (e.g., long-term care homes)
Caution: Not all research questions are amenable to experimental manipulation or randomization
Most Commonly Used Experimental Designs
- True experimental (pre- post-test ) design (also referred to as Randomized Control Trials or RCTs ):

Figure 3. True experimental design (pre-post-test).
- After-only (post-test only) design :

Figure 4. After-only (post-test only) design.
- Solomon four-group design
This design is similar to the true experimental design but has an additional two groups, for a total of four groups. Two groups are experimental, while two groups are control. These “extra” groups do not receive the pre-test, allowing the researchers to evaluate the effect of the pretest on the post-test in the first two groups.
2. Quasi-Experimental Design
Purpose: Similar to experimental design, but used when not all the features of an experimental design can be met:
- Manipulation of the independent variable (e.g., an intervention or treatment)
- Experimental and control groups may not be randomly assigned (no randomization)
- There may or may not be a control group
Advantages:
- Feasibility and logistics are enhanced, particularly in clinical settings
- Offers some degree of generalizability (e.g., applicable to population of interest)
- May be more adaptable in real-world practice environments
Disadvantages:
- Generally weaker than experimental designs because groups may not be equal with respect to extraneous variable due to the lack of randomization
- As a result, cause-and-effect relationships are difficult to claim
Options for Quasi-experimental Designs include :
- Non-equivalent control group design

Figure 5. Classical Quasi-Experimental Design. Adapted from Knowledge for Health
- After-only control group design

Figure 6. Post-Test Only Quasi-Experimental Design. Adapted from Knowledge for Health.
- Time-series design Important note: The time series design is considered quasi-experimental because subjects serve as their ‘own controls’ (same group of people, compared before and after the intervention for changes over time).

Figure 7. Time-series design. Adapted from Knowledge for Health
- One group pre-test-post-design design In this design there is no control group. The one group, considered the experimental group, is tested pre and post the intervention. The design is still considered quasi-experimental as there is manipulation of the intervention.
3. Non-experimental
Purpose: When the problem to be solved or examined is not amenable to experimentation; used when the researcher wants to:
- Study a phenomenon at one point in time or over a period of time
- Study (and measure) variables as they naturally occur
- Test relationships and differences among variables
- Used when the knowledge base on a phenomenon of interest is limited or when the research question is broad or exploratory in nature
- Appropriate for forecasting or making predictions
- Useful when the features of an experiment (e.g., randomization, control, and manipulation) are not appropriate or possible (e.g., ethical issues)
- Inability to claim cause-and-effect relationships
Options for Non-experimental Designs include:
- Survey studies: descriptive, exploratory, comparative
- Relationship or difference studies: Correlational, developmental
- Cross-sectional studies
- Longitudinal or Prospective studies

Figure 8. Longitudinal or Prospective studies. Adapted from University of Minnesota, Driven for Discover Libraries .
- Retrospective ( Ex Post Facto ) studies

Additional terms to consider when reading research
Learners may find it difficult when reading research to identify the Research Design used. Please consult the table below for more information on terms frequently used in research.
This refers to how the sample is selected. When randomization is used each participant from the desired population has an equal chance of being assigned to the experimental or control group.
These are variable that may interfere with the independent and dependent variables. Also called mediating variables.
The loss of participants from the study.
An Introduction to Quantitative Research Design for Students in Health Sciences Copyright © 2024 by Amy Hallaran and Julie Gaudet is licensed under a Creative Commons Attribution-NonCommercial-NoDerivatives 4.0 International License , except where otherwise noted.
Share This Book
- Technical Support
- Find My Rep
You are here
Research Design Qualitative, Quantitative, and Mixed Methods Approaches
- John W. Creswell - Department of Family Medicine, University of Michigan
- J. David Creswell - Carnegie Mellon University, USA
- Description
See what’s new to this edition by selecting the Features tab on this page. Should you need additional information or have questions regarding the HEOA information provided for this title, including what is new to this edition, please email [email protected] . Please include your name, contact information, and the name of the title for which you would like more information. For information on the HEOA, please go to http://ed.gov/policy/highered/leg/hea08/index.html .
For assistance with your order: Please email us at [email protected] or connect with your SAGE representative.
SAGE 2455 Teller Road Thousand Oaks, CA 91320 www.sagepub.com
Supplements
“A long time ago, I participated in one of Dr. Creswell’s workshops on mixed methods research.... I am still learning from Dr. Creswell. I appreciate how he takes complex topics and makes them accessible to everyone. But I must caution my students that Dr. Creswell’s easygoing cadence and elegant descriptions sometimes mask the depth of the material. This reminds me of why he is such a highly respected researcher and teacher.”
“I always have enjoyed using Creswell's books (as a student and as an instructor) because the writing is straightforward.”
“This book is based around dissertation chapters, and that's why I love it using in my class. Practical, concise, and to the point!”
“This book is easy to use. The information and additional charts are also helpful.”
Clear material, student support website, and faculty resources.
The book provides a comprehensive overview and does well at demystifying the research philosophy. I have recommended it to my level 7 students for their dissertation project.
This book will be added to next academic year's reading list.
I am fed up with trying to get access to this "inspection copy". You don't respond to emails (and the email addresses you provide do not work). I get regular emails from you saying my ebook order is ready, but it does not appear in VitalSource and I cannot access it through any link on this web page. I am not willing to waste any more time on this. There are good alternatives.
Excellent introduction for research methods.
Creswell has always had excellent textbooks. Sixth Edition is no exception!
- Fully updated for the 7th edition of the Publication Manual of the American Psychological Association.
- More inclusive and supportive language throughout helps readers better see themselves in the research process.
- Learning Objectives provide additional structure and clarity to the reading process.
- The latest information on participatory research, evaluating literature for quality, using software to design literature maps, and additional statistical software types is newly included in this edition.
- Chapter 4: Writing Strategies and Ethical Considerations now includes information on indigenous populations and data collection after IRB review.
- An updated Chapter 8: Quantitative Methods now includes more foundational details, such as Type 1 and Type 2 errors and discussions of advantages and disadvantages of quantitative designs.
- A restructured and revised Chapter 10: Mixed Methods Procedures brings state-of-the-art thinking to this increasingly popular approach.
- Chapters 8, 9, and 10 now have parallel structures so readers can better compare and contrast each approach.
- Reworked end-of-chapter exercises offer a more straightforward path to application for students.
- New research examples throughout the text offer students contemporary studies for evaluation.
- Current references and additional readings are included in this new edition.
- Compares qualitative, quantitative, and mixed methods research in one book for unparalleled coverage.
- Highly interdisciplinary examples make this book widely appealing to a broad range of courses and disciplines.
- Ethical coverage throughout consistently reminds students to use good judgment and to be fair and unbiased in their research.
- Writing exercises conclude each chapter so that readers can practice the principles learned in the chapter; if the reader completes all of the exercises, they will have a written plan for their scholarly study.
- Numbered points provide checklists of each step in a process.
- Annotated passages help reinforce the reader's comprehension of key research ideas.
Sample Materials & Chapters
Chapter 1: The Selection of a Research Approach
Chapter 2: Review of the Literature
For instructors
Select a purchasing option, related products.

Chapter 3 -- Survey Research Design and Quantitative Methods of Analysis for Cross-sectional Data
Almost everyone has had experience with surveys. Market surveys ask respondents whether they recognize products and their feelings about them. Political polls ask questions about candidates for political office or opinions related to political and social issues. Needs assessments use surveys that identify the needs of groups. Evaluations often use surveys to assess the extent to which programs achieve their goals. Survey research is a method of collecting information by asking questions. Sometimes interviews are done face-to-face with people at home, in school, or at work. Other times questions are sent in the mail for people to answer and mail back. Increasingly, surveys are conducted by telephone. SAMPLE SURVEYS Although we want to have information on all people, it is usually too expensive and time consuming to question everyone. So we select only some of these individuals and question them. It is important to select these people in ways that make it likely that they represent the larger group. The population is all the individuals in whom we are interested. (A population does not always consist of individuals. Sometimes, it may be geographical areas such as all cities with populations of 100,000 or more. Or we may be interested in all households in a particular area. In the data used in the exercises of this module the population consists of individuals who are California residents.) A sample is the subset of the population involved in a study. In other words, a sample is part of the population. The process of selecting the sample is called sampling . The idea of sampling is to select part of the population to represent the entire population. The United States Census is a good example of sampling. The census tries to enumerate all residents every ten years with a short questionnaire. Approximately every fifth household is given a longer questionnaire. Information from this sample (i.e., every fifth household) is used to make inferences about the population. Political polls also use samples. To find out how potential voters feel about a particular race, pollsters select a sample of potential voters. This module uses opinions from three samples of California residents age 18 and over. The data were collected during July, 1985, September, 1991, and February, 1995, by the Field Research Corporation (The Field Institute 1985, 1991, 1995). The Field Research Corporation is a widely-respected survey research firm and is used extensively by the media, politicians, and academic researchers. Since a survey can be no better than the quality of the sample, it is essential to understand the basic principles of sampling. There are two types of sampling-probability and nonprobability. A probability sample is one in which each individual in the population has a known, nonzero chance of being selected in the sample. The most basic type is the simple random sample . In a simple random sample, every individual (and every combination of individuals) has the same chance of being selected in the sample. This is the equivalent of writing each person's name on a piece of paper, putting them in plastic balls, putting all the balls in a big bowl, mixing the balls thoroughly, and selecting some predetermined number of balls from the bowl. This would produce a simple random sample. The simple random sample assumes that we can list all the individuals in the population, but often this is impossible. If our population were all the households or residents of California, there would be no list of the households or residents available, and it would be very expensive and time consuming to construct one. In this type of situation, a multistage cluster sample would be used. The idea is very simple. If we wanted to draw a sample of all residents of California, we might start by dividing California into large geographical areas such as counties and selecting a sample of these counties. Our sample of counties could then be divided into smaller geographical areas such as blocks and a sample of blocks would be selected. We could then construct a list of all households for only those blocks in the sample. Finally, we would go to these households and randomly select one member of each household for our sample. Once the household and the member of that household have been selected, substitution would not be allowed. This often means that we must call back several times, but this is the price we must pay for a good sample. The Field Poll used in this module is a telephone survey. It is a probability sample using a technique called random-digit dialing . With random-digit dialing, phone numbers are dialed randomly within working exchanges (i.e., the first three digits of the telephone number). Numbers are selected in such a way that all areas have the proper proportional chance of being selected in the sample. Random-digit dialing makes it possible to include numbers that are not listed in the telephone directory and households that have moved into an area so recently that they are not included in the current telephone directory. A nonprobability sample is one in which each individual in the population does not have a known chance of selection in the sample. There are several types of nonprobability samples. For example, magazines often include questionnaires for readers to fill out and return. This is a volunteer sample since respondents self-select themselves into the sample (i.e., they volunteer to be in the sample). Another type of nonprobability sample is a quota sample . Survey researchers may assign quotas to interviewers. For example, interviewers might be told that half of their respondents must be female and the other half male. This is a quota on sex. We could also have quotas on several variables (e.g., sex and race) simultaneously. Probability samples are preferable to nonprobability samples. First, they avoid the dangers of what survey researchers call "systematic selection biases" which are inherent in nonprobability samples. For example, in a volunteer sample, particular types of persons might be more likely to volunteer. Perhaps highly-educated individuals are more likely to volunteer to be in the sample and this would produce a systematic selection bias in favor of the highly educated. In a probability sample, the selection of the actual cases in the sample is left to chance. Second, in a probability sample we are able to estimate the amount of sampling error (our next concept to discuss). We would like our sample to give us a perfectly accurate picture of the population. However, this is unrealistic. Assume that the population is all employees of a large corporation, and we want to estimate the percent of employees in the population that is satisfied with their jobs. We select a simple random sample of 500 employees and ask the individuals in the sample how satisfied they are with their jobs. We discover that 75 percent of the employees in our sample are satisfied. Can we assume that 75 percent of the population is satisfied? That would be asking too much. Why would we expect one sample of 500 to give us a perfect representation of the population? We could take several different samples of 500 employees and the percent satisfied from each sample would vary from sample to sample. There will be a certain amount of error as a result of selecting a sample from the population. We refer to this as sampling error . Sampling error can be estimated in a probability sample, but not in a nonprobability sample. It would be wrong to assume that the only reason our sample estimate is different from the true population value is because of sampling error. There are many other sources of error called nonsampling error . Nonsampling error would include such things as the effects of biased questions, the tendency of respondents to systematically underestimate such things as age, the exclusion of certain types of people from the sample (e.g., those without phones, those without permanent addresses), or the tendency of some respondents to systematically agree to statements regardless of the content of the statements. In some studies, the amount of nonsampling error might be far greater than the amount of sampling error. Notice that sampling error is random in nature, while nonsampling error may be nonrandom producing systematic biases. We can estimate the amount of sampling error (assuming probability sampling), but it is much more difficult to estimate nonsampling error. We can never eliminate sampling error entirely, and it is unrealistic to expect that we could ever eliminate nonsampling error. It is good research practice to be diligent in seeking out sources of nonsampling error and trying to minimize them. DATA ANALYSIS Examining Variables One at a Time (Univariate Analysis) The rest of this chapter will deal with the analysis of survey data . Data analysis involves looking at variables or "things" that vary or change. A variable is a characteristic of the individual (assuming we are studying individuals). The answer to each question on the survey forms a variable. For example, sex is a variable-some individuals in the sample are male and some are female. Age is a variable; individuals vary in their ages. Looking at variables one at a time is called univariate analysis . This is the usual starting point in analyzing survey data. There are several reasons to look at variables one at a time. First, we want to describe the data. How many of our sample are men and how many are women? How many are black and how many are white? What is the distribution by age? How many say they are going to vote for Candidate A and how many for Candidate B? How many respondents agree and how many disagree with a statement describing a particular opinion? Another reason we might want to look at variables one at a time involves recoding. Recoding is the process of combining categories within a variable. Consider age, for example. In the data set used in this module, age varies from 18 to 89, but we would want to use fewer categories in our analysis, so we might combine age into age 18 to 29, 30 to 49, and 50 and over. We might want to combine African Americans with the other races to classify race into only two categories-white and nonwhite. Recoding is used to reduce the number of categories in the variable (e.g., age) or to combine categories so that you can make particular types of comparisons (e.g., white versus nonwhite). The frequency distribution is one of the basic tools for looking at variables one at a time. A frequency distribution is the set of categories and the number of cases in each category. Percent distributions show the percentage in each category. Table 3.1 shows frequency and percent distributions for two hypothetical variables-one for sex and one for willingness to vote for a woman candidate. Begin by looking at the frequency distribution for sex. There are three columns in this table. The first column specifies the categories-male and female. The second column tells us how many cases there are in each category, and the third column converts these frequencies into percents. Table 3.1 -- Frequency and Percent Distributions for Sex and Willingness to Vote for a Woman Candidate (Hypothetical Data) Sex Voting Preference Category Freq. Percent Category Freq. Percent Valid Percent Male 380 40.0 Willing to Vote for a Woman 460 48.4 51.1 Female 570 60.0 Not Willing to Vote for a Woman 440 46.3 48.9 Total 950 100.0 Refused 50 5.3 Missing Total 950 100.0 100.0 In this hypothetical example, there are 380 males and 570 females or 40 percent male and 60 percent female. There are a total of 950 cases. Since we know the sex for each case, there are no missing data (i.e., no cases where we do not know the proper category). Look at the frequency distribution for voting preference in Table 3.1. How many say they are willing to vote for a woman candidate and how many are unwilling? (Answer: 460 willing and 440 not willing) How many refused to answer the question? (Answer: 50) What percent say they are willing to vote for a woman, what percent are not, and what percent refused to answer? (Answer: 48.4 percent willing to vote for a woman, 46.3 percent not willing, and 5.3 percent refused to tell us.) The 50 respondents who didn't want to answer the question are called missing data because we don't know which category into which to place them, so we create a new category (i.e., refused) for them. Since we don't know where they should go, we might want a percentage distribution considering only the 900 respondents who answered the question. We can determine this easily by taking the 50 cases with missing information out of the base (i.e., the denominator of the fraction) and recomputing the percentages. The fourth column in the frequency distribution (labeled "valid percent") gives us this information. Approximately 51 percent of those who answered the question were willing to vote for a woman and approximately 49 percent were not. With these data we will use frequency distributions to describe variables one at a time. There are other ways to describe single variables. The mean, median, and mode are averages that may be used to describe the central tendency of a distribution. The range and standard deviation are measures of the amount of variability or dispersion of a distribution. (We will not be using measures of central tendency or variability in this module.) Exploring the Relationship Between Two Variables (Bivariate Analysis) Usually we want to do more than simply describe variables one at a time. We may want to analyze the relationship between variables. Morris Rosenberg (1968:2) suggests that there are three types of relationships: "(1) neither variable may influence one another .... (2) both variables may influence one another ... (3) one of the variables may influence the other." We will focus on the third of these types which Rosenberg calls "asymmetrical relationships." In this type of relationship, one of the variables (the independent variable ) is assumed to be the cause and the other variable (the dependent variable ) is assumed to be the effect. In other words, the independent variable is the factor that influences the dependent variable. For example, researchers think that smoking causes lung cancer. The statement that specifies the relationship between two variables is called a hypothesis (see Hoover 1992, for a more extended discussion of hypotheses). In this hypothesis, the independent variable is smoking (or more precisely, the amount one smokes) and the dependent variable is lung cancer. Consider another example. Political analysts think that income influences voting decisions, that rich people vote differently from poor people. In this hypothesis, income would be the independent variable and voting would be the dependent variable. In order to demonstrate that a causal relationship exists between two variables, we must meet three criteria: (1) there must be a statistical relationship between the two variables, (2) we must be able to demonstrate which one of the variables influences the other, and (3) we must be able to show that there is no other alternative explanation for the relationship. As you can imagine, it is impossible to show that there is no other alternative explanation for a relationship. For this reason, we can show that one variable does not influence another variable, but we cannot prove that it does. We can only show that it is more plausible or credible to believe that a causal relationship exists. In this section, we will focus on the first two criteria and leave this third criterion to the next section. In the previous section we looked at the frequency distributions for sex and voting preference. All we can say from these two distributions is that the sample is 40 percent men and 60 percent women and that slightly more than half of the respondents said they would be willing to vote for a woman, and slightly less than half are not willing to. We cannot say anything about the relationship between sex and voting preference. In order to determine if men or women are more likely to be willing to vote for a woman candidate, we must move from univariate to bivariate analysis. A crosstabulation (or contingency table ) is the basic tool used to explore the relationship between two variables. Table 3.2 is the crosstabulation of sex and voting preference. In the lower right-hand corner is the total number of cases in this table (900). Notice that this is not the number of cases in the sample. There were originally 950 cases in this sample, but any case that had missing information on either or both of the two variables in the table has been excluded from the table. Be sure to check how many cases have been excluded from your table and to indicate this figure in your report. Also be sure that you understand why these cases have been excluded. The figures in the lower margin and right-hand margin of the table are called the marginal distributions. They are simply the frequency distributions for the two variables in the whole table. Here, there are 360 males and 540 females (the marginal distribution for the column variable-sex) and 460 people who are willing to vote for a woman candidate and 440 who are not (the marginal distribution for the row variable-voting preference). The other figures in the table are the cell frequencies. Since there are two columns and two rows in this table (sometimes called a 2 x 2 table), there are four cells. The numbers in these cells tell us how many cases fall into each combination of categories of the two variables. This sounds complicated, but it isn't. For example, 158 males are willing to vote for a woman and 302 females are willing to vote for a woman. Table 3.2 -- Crosstabulation of Sex and Voting Preference (Frequencies) Sex Voting Preference Male Female Total Willing to Vote for a Woman 158 302 460 Not Willing to Vote for a Woman 202 238 440 Total 360 540 900 We could make comparisons rather easily if we had an equal number of women and men. Since these numbers are not equal, we must use percentages to help us make the comparisons. Since percentages convert everything to a common base of 100, the percent distribution shows us what the table would look like if there were an equal number of men and women. Before we percentage Table 3.2, we must decide which of these two variables is the independent and which is the dependent variable. Remember that the independent variable is the variable we think might be the influencing factor. The independent variable is hypothesized to be the cause, and the dependent variable is the effect. Another way to express this is to say that the dependent variable is the one we want to explain. Since we think that sex influences willingness to vote for a woman candidate, sex would be the independent variable. Once we have decided which is the independent variable, we are ready to percentage the table. Notice that percentages can be computed in different ways. In Table 3.3, the percentages have been computed so that they sum down to 100. These are called column percents . If they sum across to 100, they are called row percents . If the independent variable is the column variable, then we want the percents to sum down to 100 (i.e., we want the column percents). If the independent variable is the row variable, we want the percents to sum across to 100 (i.e., we want the row percents). This is a simple, but very important, rule to remember. We'll call this our rule for computing percents . Although we often see the independent variable as the column variable so the table sums down to 100 percent, it really doesn't matter whether the independent variable is the column or the row variable. In this module, we will put the independent variable as the column variable. Many others (but not everyone) use this convention. It would be helpful if you did this when you write your report. Table 3.3 -- Voting Preference by Sex (Percents) Voting Preference Male Female Total Willing to Vote for a Woman 43.9 55.9 51.1 Not Willing to Vote for a Woman 56.1 44.1 100.0 Total Percent 100.0 100.0 100.0 (Total Frequency) (360) (540) (900) Now we are ready to interpret this table. Interpreting a table means to explain what the table is saying about the relationship between the two variables. First, we can look at each category of the independent variable separately to describe the data and then we compare them to each other. Since the percents sum down to 100 percent, we describe down and compare across. The rule for interpreting percents is to compare in the direction opposite to the way the percents sum to 100. So, if the percents sum down to 100, we compare across, and if the percents sum across to 100, compare down. If the independent variable is the column variable, the percents will always sum down to 100. We can look at each category of the independent variable separately to describe the data and then compare them to each other-describe down and then compare across. In Table 3.3, row one shows the percent of males and the percent of females who are willing to vote for a woman candidate--43.9 percent of males are willing to vote for a woman, while 55.9 percent of the females are. This is a difference of 12 percentage points. Somewhat more females than males are willing to vote for a woman. The second row shows the percent of males and females who are not willing to vote for a woman. Since there are only two rows, the second row will be the complement (or the reverse) of the first row. It shows that males are somewhat more likely to be unwilling to vote for a woman candidate (a difference of 12 percentage points in the opposite direction). When we observe a difference, we must also decide whether it is significant. There are two different meanings for significance-statistical significance and substantive significance. Statistical significance considers whether the difference is great enough that it is probably not due to chance factors. Substantive significance considers whether a difference is large enough to be important. With a very large sample, a very small difference is often statistically significant, but that difference may be so small that we decide it isn't substantively significant (i.e., it's so small that we decide it doesn't mean very much). We're going to focus on statistical significance, but remember that even if a difference is statistically significant, you must also decide if it is substantively significant. Let's discuss this idea of statistical significance. If our population is all men and women of voting age in California, we want to know if there is a relationship between sex and voting preference in the population of all individuals of voting age in California. All we have is information about a sample from the population. We use the sample information to make an inference about the population. This is called statistical inference . We know that our sample is not a perfect representation of our population because of sampling error . Therefore, we would not expect the relationship we see in our sample to be exactly the same as the relationship in the population. Suppose we want to know whether there is a relationship between sex and voting preference in the population. It is impossible to prove this directly, so we have to demonstrate it indirectly. We set up a hypothesis (called the null hypothesis ) that says that sex and voting preference are not related to each other in the population. This basically says that any difference we see is likely to be the result of random variation. If the difference is large enough that it is not likely to be due to chance, we can reject this null hypothesis of only random differences. Then the hypothesis that they are related (called the alternative or research hypothesis ) will be more credible.
In the first column of Table 3.4, we have listed the four cell frequencies from the crosstabulation of sex and voting preference. We'll call these the observed frequencies (f o ) because they are what we observe from our table. In the second column, we have listed the frequencies we would expect if, in fact, there is no relationship between sex and voting preference in the population. These are called the expected frequencies (f e ). We'll briefly explain how these expected frequencies are obtained. Notice from Table 3.1 that 51.1 percent of the sample were willing to vote for a woman candidate, while 48.9 percent were not. If sex and voting preference are independent (i.e., not related), we should find the same percentages for males and females. In other words, 48.9 percent (or 176) of the males and 48.9 percent (or 264) of the females would be unwilling to vote for a woman candidate. (This explanation is adapted from Norusis 1997.) Now, we want to compare these two sets of frequencies to see if the observed frequencies are really like the expected frequencies. All we do is to subtract the expected from the observed frequencies (column three). We are interested in the sum of these differences for all cells in the table. Since they always sum to zero, we square the differences (column four) to get positive numbers. Finally, we divide this squared difference by the expected frequency (column five). (Don't worry about why we do this. The reasons are technical and don't add to your understanding.) The sum of column five (12.52) is called the chi square statistic . If the observed and the expected frequencies are identical (no difference), chi square will be zero. The greater the difference between the observed and expected frequencies, the larger the chi square. If we get a large chi square, we are willing to reject the null hypothesis. How large does the chi square have to be? We reject the null hypothesis of no relationship between the two variables when the probability of getting a chi square this large or larger by chance is so small that the null hypothesis is very unlikely to be true. That is, if a chi square this large would rarely occur by chance (usually less than once in a hundred or less than five times in a hundred). In this example, the probability of getting a chi square as large as 12.52 or larger by chance is less than one in a thousand. This is so unlikely that we reject the null hypothesis, and we conclude that the alternative hypothesis (i.e., there is a relationship between sex and voting preference) is credible (not that it is necessarily true, but that it is credible). There is always a small chance that the null hypothesis is true even when we decide to reject it. In other words, we can never be sure that it is false. We can only conclude that there is little chance that it is true. Just because we have concluded that there is a relationship between sex and voting preference does not mean that it is a strong relationship. It might be a moderate or even a weak relationship. There are many statistics that measure the strength of the relationship between two variables. Chi square is not a measure of the strength of the relationship. It just helps us decide if there is a basis for saying a relationship exists regardless of its strength. Measures of association estimate the strength of the relationship and are often used with chi square. (See Appendix D for a discussion of how to compute the two measures of association discussed below.) Cramer's V is a measure of association appropriate when one or both of the variables consists of unordered categories. For example, race (white, African American, other) or religion (Protestant, Catholic, Jewish, other, none) are variables with unordered categories. Cramer's V is a measure based on chi square. It ranges from zero to one. The closer to zero, the weaker the relationship; the closer to one, the stronger the relationship. Gamma (sometimes referred to as Goodman and Kruskal's Gamma) is a measure of association appropriate when both of the variables consist of ordered categories. For example, if respondents answer that they strongly agree, agree, disagree, or strongly disagree with a statement, their responses are ordered. Similarly, if we group age into categories such as under 30, 30 to 49, and 50 and over, these categories would be ordered. Ordered categories can logically be arranged in only two ways-low to high or high to low. Gamma ranges from zero to one, but can be positive or negative. For this module, the sign of Gamma would have no meaning, so ignore the sign and focus on the numerical value. Like V, the closer to zero, the weaker the relationship and the closer to one, the stronger the relationship. Choosing whether to use Cramer's V or Gamma depends on whether the categories of the variable are ordered or unordered. However, dichotomies (variables consisting of only two categories) may be treated as if they are ordered even if they are not. For example, sex is a dichotomy consisting of the categories male and female. There are only two possible ways to order sex-male, female and female, male. Or, race may be classified into two categories-white and nonwhite. We can treat dichotomies as if they consisted of ordered categories because they can be ordered in only two ways. In other words, when one of the variables is a dichotomy, treat this variable as if it were ordinal and use gamma. This is important when choosing an appropriate measure of association. In this chapter we have described how surveys are done and how we analyze the relationship between two variables. In the next chapter we will explore how to introduce additional variables into the analysis. REFERENCES AND SUGGESTED READING Methods of Social Research Riley, Matilda White. 1963. Sociological Research I: A Case Approach . New York: Harcourt, Brace and World. Hoover, Kenneth R. 1992. The Elements of Social Scientific Thinking (5 th Ed.). New York: St. Martin's. Interviewing Gorden, Raymond L. 1987. Interviewing: Strategy, Techniques and Tactics . Chicago: Dorsey. Survey Research and Sampling Babbie, Earl R. 1990. Survey Research Methods (2 nd Ed.). Belmont, CA: Wadsworth. Babbie, Earl R. 1997. The Practice of Social Research (8 th Ed). Belmont, CA: Wadsworth. Statistical Analysis Knoke, David, and George W. Bohrnstedt. 1991. Basic Social Statistics . Itesche, IL: Peacock. Riley, Matilda White. 1963. Sociological Research II Exercises and Manual . New York: Harcourt, Brace & World. Norusis, Marija J. 1997. SPSS 7.5 Guide to Data Analysis . Upper Saddle River, New Jersey: Prentice Hall. Data Sources The Field Institute. 1985. California Field Poll Study, July, 1985 . Machine-readable codebook. The Field Institute. 1991. California Field Poll Study, September, 1991 . Machine-readable codebook. The Field Institute. 1995. California Field Poll Study, February, 1995 . Machine-readable codebook.
Document Viewers
- Free PDF Viewer
- Free Word Viewer
- Free Excel Viewer
- Free PowerPoint Viewer

- Chapter 3: Home
- Developing the Quantitative Research Design
- Qualitative Descriptive Design
- Qualitative Narrative Inquiry Research
- SAGE Research Methods
- Alignment of Dissertation Components for DIS-9902ABC
- IRB Resources This link opens in a new window
- Research Examples (SAGE) This link opens in a new window
- Dataset Examples (SAGE) This link opens in a new window
- Last Updated: Nov 2, 2023 10:17 AM
- URL: https://resources.nu.edu/c.php?g=1007179

COMMENTS
Research Design and Methodology. Chapter 3 consists of three parts: (1) Purpose of the. study and research design, (2) Methods, and (3) Statistical. Data analysis procedure. Part one, Purpose of ...
Instruments. This section should include the instruments you plan on using to measure the variables in the research questions. (a) the source or developers of the instrument. (b) validity and reliability information. •. (c) information on how it was normed. •. (d) other salient information (e.g., number of. items in each scale, subscales ...
Chapter 3: Research Design and Methodology. Introduction. The purpose of the study is to examine the impact social support (e.g., psych services, peers, family, bullying support groups) has on ...
Research Design and Research Methods CHAPTER 3 This chapter uses an emphasis on research design to discuss qualitative, quantitative, and mixed methods research as three major approaches to research in the social sciences. The first major section considers the role of research methods in each of these approaches. This discussion then
Step 1: Consider your aims and approach. Step 2: Choose a type of research design. Step 3: Identify your population and sampling method. Step 4: Choose your data collection methods. Step 5: Plan your data collection procedures. Step 6: Decide on your data analysis strategies. Other interesting articles.
CHAPTER 3. RESEARCH DESIGN AND METHODOLOGY. 3.1 INTRODUCTION. According to Brink (1999), the aim of data analysis is to reduce and synthesise information to make sense out of it and to allow inference about a population, while the aim of interpretation is to combine the results of data analysis with value statements, criteria, and standards in ...
3 Presenting Methodology and Research Approach OVERVIEW Chapter 3 of the dissertation presents the research design and the specific procedures used in conducting your study. A research design includes various interrelated elements that reflect its sequential nature. This chapter is intended to show the reader that you have
3.2 Quantitative Research Designs Quantitive research study designs can be broadly classified into two main groups (observational and experimental) depending on if an intervention is assigned. If an intervention is assigned, then an experimental study design will be considered; however, if no intervention is planned or assigned, then an ...
Writing Chapter 3 Chapter 3: Methodology (Quantitative) Components of Chapter 3 • Participants • Instruments • Procedures Design • Data Analysis • Limitations Future or Paste tense? ... The Research Design • The research design is the actual structure or framework that indicates (a) the time frame(s) in which data will be collected ...
The first step in developing research is identifying the appropriate quantitative design as well as target population and sample. Please access the NU library database "SAGE Research Methods" for help in identifying the appropriate design for your quantitative dissertation. Quantitative studies are experimental, quasi-experimental, or non ...
CHAPTER 3: METHODOLOGY The methods used in this research consist of a combination of quantitative and qualitative approaches: a "mixed methods" approach, which is described in more detail in this chapter. The first section explains the rationale for using a mixed methods approach and ethical and practical issues.
methods will be explained independently from the research design section. In a nutshell, the following is the procedure of research design: 1. Dene the purpose of your project. Determine whether it will be exploratory, descriptive, or explanatory. 2. Specify the meanings of each concept you want to study. 3. Select a research method. 4.
The study has used the quantitative research design to test the theory and to draw conclusions. The choice of quantitative methodology is based upon numerous rea- ... Chapter 6 Fig. 3.4 Steps in research design. (Source: Adapted from Zikmund et al. 2010) 3 Research Methodology. 83
The research design used for this study is outlined in Figure 1 on page 32. 3.3 RESEARCH PARADIGM Opie (2004, 18) defines paradigm as "a basic set of beliefs that guides action", and suggests that historically two main paradigms have influenced educational research, the qualitative and quantitative research paradigms. Both Gall et al. (1996 ...
the quantitative results of the IPI-T to determine how and why the data converged. Measuring Student Cognitive Engagement When Using Technology 37 A web-based questionnaire, created by the researcher, was used to collect qualitative data. ... Chapter 3: Research Design, Data Collection, and Analysis Procedures .
Figure 3. True experimental design (pre-post-test). After-only (post-test only) design: Figure 4. After-only (post-test only) design. Solomon four-group design; This design is similar to the true experimental design but has an additional two groups, for a total of four groups. Two groups are experimental, while two groups are control.
Dissertation Chapter 3 Sample. be be 1. Describe. quantitative, CHAPTER III: METHOD introduce the qualitative, the method of the chapter and mixed-methods). used (i.e. The purpose of this chapter is to introduce the research methodology for this. methodology the specific connects to it question(s). research.
The Sixth Edition of the bestselling Research Design: Qualitative, Quantitative, and Mixed Methods Approaches provides clear and concise instruction for designing research projects or developing research proposals. This user-friendly text walks readers through research methods, from reviewing the literature to writing a research question and stating a hypothesis to designing the study.
Research Approach, Design, and Analysis. Chapter 3 explains the research method being used in the study. It describes the instruments associated with the chosen research method and design used; this includes information regarding instrument origin, reliability, and validity. Chapter 3 details the planned research approach, design, and analysis.
The research design was useful aimed at describing reality and establishing the importance or condition of a certain phenomenon (p. 5). In addition, a survey is also a structured way of collecting information through questionnaires. ... Chapter 3 Sample - Quantitative. Course: STRUCTURE (AE3710) 78 Documents. Students shared 78 documents in ...
Chapter 3 -- Survey Research Design and Quantitative Methods of Analysis for Cross-sectional Data. Last Modified 15 August 1998. Almost everyone has had experience with surveys. Market surveys ask respondents whether they recognize products and their feelings about them. ... Chapter 6 -- Research Design and Methods of Analysis for Change Over ...
Based on these criteria, a quantitative quasi-experimental research design was deemed to be appropriate. This chapter presents a discussion of the following specifications: (a) the research design, (b) sample size, (c) research questions/hypotheses, (d) variables, and finally (e) the data analysis that would be conducted in order to
Chapter 3: Home; Developing the Quantitative Research Design; Developing the Qualitative Research Design . Qualitative Descriptive Design ; Qualitative Narrative Inquiry Research ; SAGE Research Methods; Alignment of Dissertation Components for DIS-9902ABC; IRB Resources This link opens in a new window; Research Examples (SAGE) This link opens ...