

Reading and interpreting visual resources in Geography
Reading and interpreting maps.
Maps are one of the geographer's key tools for representing and explaining spatial information, patterns and processes. Reading and interpreting maps is thus central to geographical education. To effectively read maps, students need to develop a range of interrelated skills:
- locational skills - using grid references, coordinates, longitudes/latitudes
- symbol skills - using the key to interpret the different symbols
- understanding of scale - using a scale to estimate distances and compare areas
- interpretation of data - describing and comparing information shown on thematic maps. (Adapted from Biddulph, Lambert, & Balderstone, 2015)
The two strategies below scaffold students' ability to read and interpret information represented in visual form. Geography teachers can adapt the Strategies that demonstrate how to explicitly teach the semiotic (meaning-making) systems of visual texts in Science. For a brief explanation of the types of maps encountered in Geography, including their function and a brief description of some of the semiotic systems they use, teachers can view 'Types of maps' produced by the Intergovernmental Committee on Surveying and Mapping.
Explicitly teaching semiotic systems of maps
Maps are a core tool used to communicate in geography. However, they can be complex multimodal texts, each of which may a different semiotic (meaning-making) systems to represent information. Students need to be explicitly taught ways to read and interpret information presented in maps.
Geography teachers would be familiar with explicitly teaching the six features of a map using BOLTSS (this acronym represents the first letters of the six features listed below):
- B – Border: A line around the map to show the edges of the map to prevent confusion with other text
- O – Orientation: Shows direction using a compass rose or North arrow
- L – Legend: Key to the symbols and colours used
- T – Title: A precise name of the map, usually placed above the map or sometimes in the figure caption
- S – Scale: A measure between the map and real-world usually a linear scale, and sometimes a ratio or statement
- S – Source: A source is the origin of the data shown on the map so that the reader knows where the information comes from.
In addition to teaching each of these features, teachers can show students a range of map types and engage them in discussion to explicitly teach the various semiotic systems each map employs (an example of a rainfall map is below). This can be done for each feature of BOLTS, which is demonstrated by teacher questioning in the table below. Responses to these questions will differ depending on the type of map being shown.
The example below is a Year 7 or 8 student's semiotic analysis of the Australian Rainfall Analysis for the week ending 25 February 2020.

Pattern, Quantify, Exceptions (PQE)
One strategy used by geographers to interpret thematic maps (e.g. choropleth maps, isoline maps) and graphs is the Pattern, Quantify, Exceptions (PQE) tool. PQE is a way of expressing literate understanding and is an important first step before analysing data.
The PQE tool asks students to:
- observe general spatial patterns on maps
- examine maps closely for specific details of patterns
- identify and describe exceptions (sometimes these are called anomalies)
- draw on prior knowledge to explain the observed patterns and anomalies.
The procedure for using the PQE tool is adapted from Easton et al. (2013). Teacher questioning and guided discussion support students to better complete each of the steps.
The example included below relates to a Year 9 or 10 class learning about biomes ( VCGGK133 ), but the strategy can be used to support the Data and information sub-strand from Years 7 to 10 ( VCGGC102 , VCGGC104 , VCGGC130 , VCGGC132 ). The map shows the distribution of Australia's forest types in 2013, and the source is ABARES (Australian Bureau of Agricultural and Resource Economics and Sciences. The map can also be found Access the 'Distribution of Australia's forest types, 2013' map on the Department of Agriculture's website.
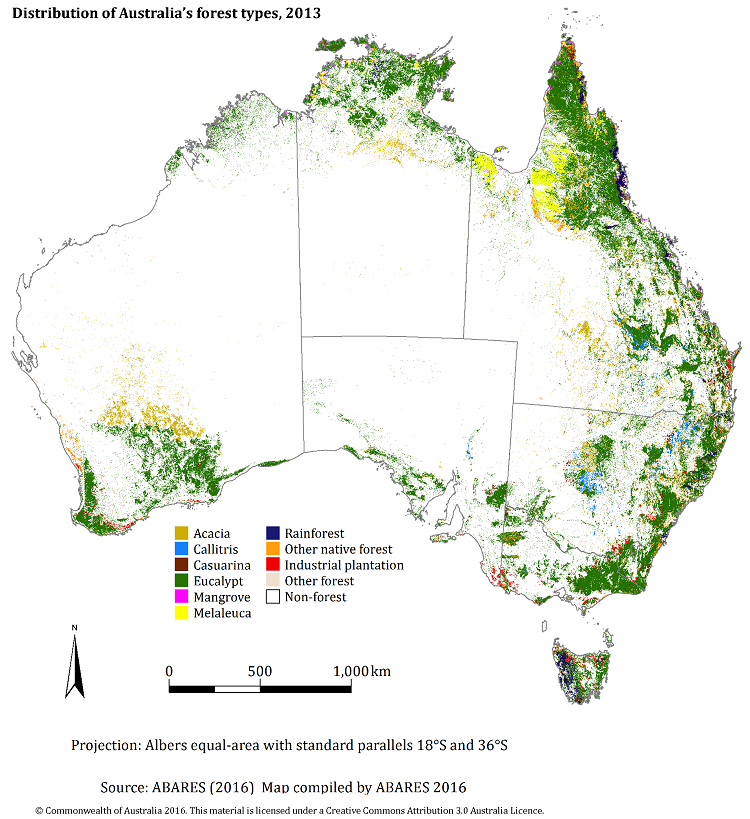
P – Pattern
Observe and identify the general patterns across the map by finding a high and low concentration of a particular feature.
For example: In the map below, most of Australia's forests are found along the eastern coast.
Q – Quantify
Extract specific and accurate information from the map as evidence of the patterns. Quantifying involves using statistics, amounts, sizes and locations to give specific details.
For example: Most of the forest types are eucalypts. Australian forests span from the northern tropical regions in Queensland to the temperate regions in the southeast including Tasmania.
E – Exceptions
Identify and quantify details that do not fit the patterns identified. Anomalies are also significant information for geographers.
For example: Forests can also be found on the south-western and southern parts of West Australia, including some inland regions.
Literacy in Practice Video: Geography - Photographs
Teacher: gareth evans.
Unpacking photographs
Photographs frequently feature as a visual resource in the geography classroom. Students today are exposed to visual images every day, within and beyond the classroom, so it is important to help them develop a more critical eye to interpret photographs geographically (Halocha, 2008).
Photographs are often taken for specific purposes. Students need to consider how these purposes may affect their interpretation of the issue or aspect that the photographs are trying to portray. In addition, photographs provide a small and selective view. It is important therefore that students can understand the broader context in which the photograph is situated.
Geographers use several types of photographs, including ground-level photographs, oblique and vertical aerial photographs, and satellite images. Whereas vertical aerial photos and satellite images are more similar to maps (they are useful for portraying information about patterns across large areas of space), ground-level and oblique aerial photos require rather different interpretation skills.
Layers of inference
One strategy to help students interpret photographs critically is the layers of inference framework. This framework encourages students to first identify the literal meanings in photographs, then draw on their prior knowledge to build inferences and predictions.
The purposes of using the layers of inference framework are to encourage students to:
- examine photographs closely to identify specific features
- draw on their prior knowledge to make inferences or informed guesses or predictions
- become aware that the photographs present only partial evidence
- be curious and ask questions
- be critical by considering both what is shown and what is not shown (adapted from Roberts, 2013, p.155).
Teachers can support students to analyse photographs using the layers of inference framework using either a graphic organiser or as template below (Riley, 1999; Roberts, 2013). This strategy supports the Data and information sub-strand from Years 7 to 10 ( VCGGC102 , VCGGC104 , VCGGC130 , VCGGC132 ).

Layers of inference framework graphic organiser

Layers of inference framework template
The following procedure for using the layers of inference framework involves three sequential steps (adapted from Roberts, 2013). These steps can be used by individual students, but the process is strengthened by peer collaboration. A Year 10 student work sample for Geographies of human wellbeing is provided ( VCGGK153 ).
- Examine the photograph and any available contextual information for the photograph. This is often outlined in a caption.
- Answer the layers of inference questions starting with the inner questions and proceeding to the outer layers in turn. If possible, students work collaboratively to discuss and write their ideas and questions in the framework.
- Discuss responses to questions in turn and have students share their ideas and questions.

Our website uses a free tool to translate into other languages. This tool is a guide and may not be accurate. For more, see: Information in your language
- Open access
- Published: 19 July 2015
The role of visual representations in scientific practices: from conceptual understanding and knowledge generation to ‘seeing’ how science works
- Maria Evagorou 1 ,
- Sibel Erduran 2 &
- Terhi Mäntylä 3
International Journal of STEM Education volume 2 , Article number: 11 ( 2015 ) Cite this article
73k Accesses
78 Citations
13 Altmetric
Metrics details
The use of visual representations (i.e., photographs, diagrams, models) has been part of science, and their use makes it possible for scientists to interact with and represent complex phenomena, not observable in other ways. Despite a wealth of research in science education on visual representations, the emphasis of such research has mainly been on the conceptual understanding when using visual representations and less on visual representations as epistemic objects. In this paper, we argue that by positioning visual representations as epistemic objects of scientific practices, science education can bring a renewed focus on how visualization contributes to knowledge formation in science from the learners’ perspective.
This is a theoretical paper, and in order to argue about the role of visualization, we first present a case study, that of the discovery of the structure of DNA that highlights the epistemic components of visual information in science. The second case study focuses on Faraday’s use of the lines of magnetic force. Faraday is known of his exploratory, creative, and yet systemic way of experimenting, and the visual reasoning leading to theoretical development was an inherent part of the experimentation. Third, we trace a contemporary account from science focusing on the experimental practices and how reproducibility of experimental procedures can be reinforced through video data.
Conclusions
Our conclusions suggest that in teaching science, the emphasis in visualization should shift from cognitive understanding—using the products of science to understand the content—to engaging in the processes of visualization. Furthermore, we suggest that is it essential to design curriculum materials and learning environments that create a social and epistemic context and invite students to engage in the practice of visualization as evidence, reasoning, experimental procedure, or a means of communication and reflect on these practices. Implications for teacher education include the need for teacher professional development programs to problematize the use of visual representations as epistemic objects that are part of scientific practices.
During the last decades, research and reform documents in science education across the world have been calling for an emphasis not only on the content but also on the processes of science (Bybee 2014 ; Eurydice 2012 ; Duschl and Bybee 2014 ; Osborne 2014 ; Schwartz et al. 2012 ), in order to make science accessible to the students and enable them to understand the epistemic foundation of science. Scientific practices, part of the process of science, are the cognitive and discursive activities that are targeted in science education to develop epistemic understanding and appreciation of the nature of science (Duschl et al. 2008 ) and have been the emphasis of recent reform documents in science education across the world (Achieve 2013 ; Eurydice 2012 ). With the term scientific practices, we refer to the processes that take place during scientific discoveries and include among others: asking questions, developing and using models, engaging in arguments, and constructing and communicating explanations (National Research Council 2012 ). The emphasis on scientific practices aims to move the teaching of science from knowledge to the understanding of the processes and the epistemic aspects of science. Additionally, by placing an emphasis on engaging students in scientific practices, we aim to help students acquire scientific knowledge in meaningful contexts that resemble the reality of scientific discoveries.
Despite a wealth of research in science education on visual representations, the emphasis of such research has mainly been on the conceptual understanding when using visual representations and less on visual representations as epistemic objects. In this paper, we argue that by positioning visual representations as epistemic objects, science education can bring a renewed focus on how visualization contributes to knowledge formation in science from the learners’ perspective. Specifically, the use of visual representations (i.e., photographs, diagrams, tables, charts) has been part of science and over the years has evolved with the new technologies (i.e., from drawings to advanced digital images and three dimensional models). Visualization makes it possible for scientists to interact with complex phenomena (Richards 2003 ), and they might convey important evidence not observable in other ways. Visual representations as a tool to support cognitive understanding in science have been studied extensively (i.e., Gilbert 2010 ; Wu and Shah 2004 ). Studies in science education have explored the use of images in science textbooks (i.e., Dimopoulos et al. 2003 ; Bungum 2008 ), students’ representations or models when doing science (i.e., Gilbert et al. 2008 ; Dori et al. 2003 ; Lehrer and Schauble 2012 ; Schwarz et al. 2009 ), and students’ images of science and scientists (i.e., Chambers 1983 ). Therefore, studies in the field of science education have been using the term visualization as “the formation of an internal representation from an external representation” (Gilbert et al. 2008 , p. 4) or as a tool for conceptual understanding for students.
In this paper, we do not refer to visualization as mental image, model, or presentation only (Gilbert et al. 2008 ; Philips et al. 2010 ) but instead focus on visual representations or visualization as epistemic objects. Specifically, we refer to visualization as a process for knowledge production and growth in science. In this respect, modeling is an aspect of visualization, but what we are focusing on with visualization is not on the use of model as a tool for cognitive understanding (Gilbert 2010 ; Wu and Shah 2004 ) but the on the process of modeling as a scientific practice which includes the construction and use of models, the use of other representations, the communication in the groups with the use of the visual representation, and the appreciation of the difficulties that the science phase in this process. Therefore, the purpose of this paper is to present through the history of science how visualization can be considered not only as a cognitive tool in science education but also as an epistemic object that can potentially support students to understand aspects of the nature of science.
Scientific practices and science education
According to the New Generation Science Standards (Achieve 2013 ), scientific practices refer to: asking questions and defining problems; developing and using models; planning and carrying out investigations; analyzing and interpreting data; using mathematical and computational thinking; constructing explanations and designing solutions; engaging in argument from evidence; and obtaining, evaluating, and communicating information. A significant aspect of scientific practices is that science learning is more than just about learning facts, concepts, theories, and laws. A fuller appreciation of science necessitates the understanding of the science relative to its epistemological grounding and the process that are involved in the production of knowledge (Hogan and Maglienti 2001 ; Wickman 2004 ).
The New Generation Science Standards is, among other changes, shifting away from science inquiry and towards the inclusion of scientific practices (Duschl and Bybee 2014 ; Osborne 2014 ). By comparing the abilities to do scientific inquiry (National Research Council 2000 ) with the set of scientific practices, it is evident that the latter is about engaging in the processes of doing science and experiencing in that way science in a more authentic way. Engaging in scientific practices according to Osborne ( 2014 ) “presents a more authentic picture of the endeavor that is science” (p.183) and also helps the students to develop a deeper understanding of the epistemic aspects of science. Furthermore, as Bybee ( 2014 ) argues, by engaging students in scientific practices, we involve them in an understanding of the nature of science and an understanding on the nature of scientific knowledge.
Science as a practice and scientific practices as a term emerged by the philosopher of science, Kuhn (Osborne 2014 ), refers to the processes in which the scientists engage during knowledge production and communication. The work that is followed by historians, philosophers, and sociologists of science (Latour 2011 ; Longino 2002 ; Nersessian 2008 ) revealed the scientific practices in which the scientists engage in and include among others theory development and specific ways of talking, modeling, and communicating the outcomes of science.
Visualization as an epistemic object
Schematic, pictorial symbols in the design of scientific instruments and analysis of the perceptual and functional information that is being stored in those images have been areas of investigation in philosophy of scientific experimentation (Gooding et al. 1993 ). The nature of visual perception, the relationship between thought and vision, and the role of reproducibility as a norm for experimental research form a central aspect of this domain of research in philosophy of science. For instance, Rothbart ( 1997 ) has argued that visualizations are commonplace in the theoretical sciences even if every scientific theory may not be defined by visualized models.
Visual representations (i.e., photographs, diagrams, tables, charts, models) have been used in science over the years to enable scientists to interact with complex phenomena (Richards 2003 ) and might convey important evidence not observable in other ways (Barber et al. 2006 ). Some authors (e.g., Ruivenkamp and Rip 2010 ) have argued that visualization is as a core activity of some scientific communities of practice (e.g., nanotechnology) while others (e.g., Lynch and Edgerton 1988 ) have differentiated the role of particular visualization techniques (e.g., of digital image processing in astronomy). Visualization in science includes the complex process through which scientists develop or produce imagery, schemes, and graphical representation, and therefore, what is of importance in this process is not only the result but also the methodology employed by the scientists, namely, how this result was produced. Visual representations in science may refer to objects that are believed to have some kind of material or physical existence but equally might refer to purely mental, conceptual, and abstract constructs (Pauwels 2006 ). More specifically, visual representations can be found for: (a) phenomena that are not observable with the eye (i.e., microscopic or macroscopic); (b) phenomena that do not exist as visual representations but can be translated as such (i.e., sound); and (c) in experimental settings to provide visual data representations (i.e., graphs presenting velocity of moving objects). Additionally, since science is not only about replicating reality but also about making it more understandable to people (either to the public or other scientists), visual representations are not only about reproducing the nature but also about: (a) functioning in helping solving a problem, (b) filling gaps in our knowledge, and (c) facilitating knowledge building or transfer (Lynch 2006 ).
Using or developing visual representations in the scientific practice can range from a straightforward to a complicated situation. More specifically, scientists can observe a phenomenon (i.e., mitosis) and represent it visually using a picture or diagram, which is quite straightforward. But they can also use a variety of complicated techniques (i.e., crystallography in the case of DNA studies) that are either available or need to be developed or refined in order to acquire the visual information that can be used in the process of theory development (i.e., Latour and Woolgar 1979 ). Furthermore, some visual representations need decoding, and the scientists need to learn how to read these images (i.e., radiologists); therefore, using visual representations in the process of science requires learning a new language that is specific to the medium/methods that is used (i.e., understanding an X-ray picture is different from understanding an MRI scan) and then communicating that language to other scientists and the public.
There are much intent and purposes of visual representations in scientific practices, as for example to make a diagnosis, compare, describe, and preserve for future study, verify and explore new territory, generate new data (Pauwels 2006 ), or present new methodologies. According to Latour and Woolgar ( 1979 ) and Knorr Cetina ( 1999 ), visual representations can be used either as primary data (i.e., image from a microscope). or can be used to help in concept development (i.e., models of DNA used by Watson and Crick), to uncover relationships and to make the abstract more concrete (graphs of sound waves). Therefore, visual representations and visual practices, in all forms, are an important aspect of the scientific practices in developing, clarifying, and transmitting scientific knowledge (Pauwels 2006 ).
Methods and Results: Merging Visualization and scientific practices in science
In this paper, we present three case studies that embody the working practices of scientists in an effort to present visualization as a scientific practice and present our argument about how visualization is a complex process that could include among others modeling and use of representation but is not only limited to that. The first case study explores the role of visualization in the construction of knowledge about the structure of DNA, using visuals as evidence. The second case study focuses on Faraday’s use of the lines of magnetic force and the visual reasoning leading to the theoretical development that was an inherent part of the experimentation. The third case study focuses on the current practices of scientists in the context of a peer-reviewed journal called the Journal of Visualized Experiments where the methodology is communicated through videotaped procedures. The three case studies represent the research interests of the three authors of this paper and were chosen to present how visualization as a practice can be involved in all stages of doing science, from hypothesizing and evaluating evidence (case study 1) to experimenting and reasoning (case study 2) to communicating the findings and methodology with the research community (case study 3), and represent in this way the three functions of visualization as presented by Lynch ( 2006 ). Furthermore, the last case study showcases how the development of visualization technologies has contributed to the communication of findings and methodologies in science and present in that way an aspect of current scientific practices. In all three cases, our approach is guided by the observation that the visual information is an integral part of scientific practices at the least and furthermore that they are particularly central in the scientific practices of science.
Case study 1: use visual representations as evidence in the discovery of DNA
The focus of the first case study is the discovery of the structure of DNA. The DNA was first isolated in 1869 by Friedrich Miescher, and by the late 1940s, it was known that it contained phosphate, sugar, and four nitrogen-containing chemical bases. However, no one had figured the structure of the DNA until Watson and Crick presented their model of DNA in 1953. Other than the social aspects of the discovery of the DNA, another important aspect was the role of visual evidence that led to knowledge development in the area. More specifically, by studying the personal accounts of Watson ( 1968 ) and Crick ( 1988 ) about the discovery of the structure of the DNA, the following main ideas regarding the role of visual representations in the production of knowledge can be identified: (a) The use of visual representations was an important part of knowledge growth and was often dependent upon the discovery of new technologies (i.e., better microscopes or better techniques in crystallography that would provide better visual representations as evidence of the helical structure of the DNA); and (b) Models (three-dimensional) were used as a way to represent the visual images (X-ray images) and connect them to the evidence provided by other sources to see whether the theory can be supported. Therefore, the model of DNA was built based on the combination of visual evidence and experimental data.
An example showcasing the importance of visual representations in the process of knowledge production in this case is provided by Watson, in his book The Double Helix (1968):
…since the middle of the summer Rosy [Rosalind Franklin] had had evidence for a new three-dimensional form of DNA. It occurred when the DNA 2molecules were surrounded by a large amount of water. When I asked what the pattern was like, Maurice went into the adjacent room to pick up a print of the new form they called the “B” structure. The instant I saw the picture, my mouth fell open and my pulse began to race. The pattern was unbelievably simpler than those previously obtained (A form). Moreover, the black cross of reflections which dominated the picture could arise only from a helical structure. With the A form the argument for the helix was never straightforward, and considerable ambiguity existed as to exactly which type of helical symmetry was present. With the B form however, mere inspection of its X-ray picture gave several of the vital helical parameters. (p. 167-169)
As suggested by Watson’s personal account of the discovery of the DNA, the photo taken by Rosalind Franklin (Fig. 1 ) convinced him that the DNA molecule must consist of two chains arranged in a paired helix, which resembles a spiral staircase or ladder, and on March 7, 1953, Watson and Crick finished and presented their model of the structure of DNA (Watson and Berry 2004 ; Watson 1968 ) which was based on the visual information provided by the X-ray image and their knowledge of chemistry.
X-ray chrystallography of DNA
In analyzing the visualization practice in this case study, we observe the following instances that highlight how the visual information played a role:
Asking questions and defining problems: The real world in the model of science can at some points only be observed through visual representations or representations, i.e., if we are using DNA as an example, the structure of DNA was only observable through the crystallography images produced by Rosalind Franklin in the laboratory. There was no other way to observe the structure of DNA, therefore the real world.
Analyzing and interpreting data: The images that resulted from crystallography as well as their interpretations served as the data for the scientists studying the structure of DNA.
Experimenting: The data in the form of visual information were used to predict the possible structure of the DNA.
Modeling: Based on the prediction, an actual three-dimensional model was prepared by Watson and Crick. The first model did not fit with the real world (refuted by Rosalind Franklin and her research group from King’s College) and Watson and Crick had to go through the same process again to find better visual evidence (better crystallography images) and create an improved visual model.
Example excerpts from Watson’s biography provide further evidence for how visualization practices were applied in the context of the discovery of DNA (Table 1 ).
In summary, by examining the history of the discovery of DNA, we showcased how visual data is used as scientific evidence in science, identifying in that way an aspect of the nature of science that is still unexplored in the history of science and an aspect that has been ignored in the teaching of science. Visual representations are used in many ways: as images, as models, as evidence to support or rebut a model, and as interpretations of reality.
Case study 2: applying visual reasoning in knowledge production, the example of the lines of magnetic force
The focus of this case study is on Faraday’s use of the lines of magnetic force. Faraday is known of his exploratory, creative, and yet systemic way of experimenting, and the visual reasoning leading to theoretical development was an inherent part of this experimentation (Gooding 2006 ). Faraday’s articles or notebooks do not include mathematical formulations; instead, they include images and illustrations from experimental devices and setups to the recapping of his theoretical ideas (Nersessian 2008 ). According to Gooding ( 2006 ), “Faraday’s visual method was designed not to copy apparent features of the world, but to analyse and replicate them” (2006, p. 46).
The lines of force played a central role in Faraday’s research on electricity and magnetism and in the development of his “field theory” (Faraday 1852a ; Nersessian 1984 ). Before Faraday, the experiments with iron filings around magnets were known and the term “magnetic curves” was used for the iron filing patterns and also for the geometrical constructs derived from the mathematical theory of magnetism (Gooding et al. 1993 ). However, Faraday used the lines of force for explaining his experimental observations and in constructing the theory of forces in magnetism and electricity. Examples of Faraday’s different illustrations of lines of magnetic force are given in Fig. 2 . Faraday gave the following experiment-based definition for the lines of magnetic forces:
a Iron filing pattern in case of bar magnet drawn by Faraday (Faraday 1852b , Plate IX, p. 158, Fig. 1), b Faraday’s drawing of lines of magnetic force in case of cylinder magnet, where the experimental procedure, knife blade showing the direction of lines, is combined into drawing (Faraday, 1855, vol. 1, plate 1)
A line of magnetic force may be defined as that line which is described by a very small magnetic needle, when it is so moved in either direction correspondent to its length, that the needle is constantly a tangent to the line of motion; or it is that line along which, if a transverse wire be moved in either direction, there is no tendency to the formation of any current in the wire, whilst if moved in any other direction there is such a tendency; or it is that line which coincides with the direction of the magnecrystallic axis of a crystal of bismuth, which is carried in either direction along it. The direction of these lines about and amongst magnets and electric currents, is easily represented and understood, in a general manner, by the ordinary use of iron filings. (Faraday 1852a , p. 25 (3071))
The definition describes the connection between the experiments and the visual representation of the results. Initially, the lines of force were just geometric representations, but later, Faraday treated them as physical objects (Nersessian 1984 ; Pocovi and Finlay 2002 ):
I have sometimes used the term lines of force so vaguely, as to leave the reader doubtful whether I intended it as a merely representative idea of the forces, or as the description of the path along which the power was continuously exerted. … wherever the expression line of force is taken simply to represent the disposition of forces, it shall have the fullness of that meaning; but that wherever it may seem to represent the idea of the physical mode of transmission of the force, it expresses in that respect the opinion to which I incline at present. The opinion may be erroneous, and yet all that relates or refers to the disposition of the force will remain the same. (Faraday, 1852a , p. 55-56 (3075))
He also felt that the lines of force had greater explanatory power than the dominant theory of action-at-a-distance:
Now it appears to me that these lines may be employed with great advantage to represent nature, condition, direction and comparative amount of the magnetic forces; and that in many cases they have, to the physical reasoned at least, a superiority over that method which represents the forces as concentrated in centres of action… (Faraday, 1852a , p. 26 (3074))
For giving some insight to Faraday’s visual reasoning as an epistemic practice, the following examples of Faraday’s studies of the lines of magnetic force (Faraday 1852a , 1852b ) are presented:
(a) Asking questions and defining problems: The iron filing patterns formed the empirical basis for the visual model: 2D visualization of lines of magnetic force as presented in Fig. 2 . According to Faraday, these iron filing patterns were suitable for illustrating the direction and form of the magnetic lines of force (emphasis added):
It must be well understood that these forms give no indication by their appearance of the relative strength of the magnetic force at different places, inasmuch as the appearance of the lines depends greatly upon the quantity of filings and the amount of tapping; but the direction and forms of these lines are well given, and these indicate, in a considerable degree, the direction in which the forces increase and diminish . (Faraday 1852b , p.158 (3237))
Despite being static and two dimensional on paper, the lines of magnetic force were dynamical (Nersessian 1992 , 2008 ) and three dimensional for Faraday (see Fig. 2 b). For instance, Faraday described the lines of force “expanding”, “bending,” and “being cut” (Nersessian 1992 ). In Fig. 2 b, Faraday has summarized his experiment (bar magnet and knife blade) and its results (lines of force) in one picture.
(b) Analyzing and interpreting data: The model was so powerful for Faraday that he ended up thinking them as physical objects (e.g., Nersessian 1984 ), i.e., making interpretations of the way forces act. Of course, he made a lot of experiments for showing the physical existence of the lines of force, but he did not succeed in it (Nersessian 1984 ). The following quote illuminates Faraday’s use of the lines of force in different situations:
The study of these lines has, at different times, been greatly influential in leading me to various results, which I think prove their utility as well as fertility. Thus, the law of magneto-electric induction; the earth’s inductive action; the relation of magnetism and light; diamagnetic action and its law, and magnetocrystallic action, are the cases of this kind… (Faraday 1852a , p. 55 (3174))
(c) Experimenting: In Faraday's case, he used a lot of exploratory experiments; in case of lines of magnetic force, he used, e.g., iron filings, magnetic needles, or current carrying wires (see the quote above). The magnetic field is not directly observable and the representation of lines of force was a visual model, which includes the direction, form, and magnitude of field.
(d) Modeling: There is no denying that the lines of magnetic force are visual by nature. Faraday’s views of lines of force developed gradually during the years, and he applied and developed them in different contexts such as electromagnetic, electrostatic, and magnetic induction (Nersessian 1984 ). An example of Faraday’s explanation of the effect of the wire b’s position to experiment is given in Fig. 3 . In Fig. 3 , few magnetic lines of force are drawn, and in the quote below, Faraday is explaining the effect using these magnetic lines of force (emphasis added):
Picture of an experiment with different arrangements of wires ( a , b’ , b” ), magnet, and galvanometer. Note the lines of force drawn around the magnet. (Faraday 1852a , p. 34)
It will be evident by inspection of Fig. 3 , that, however the wires are carried away, the general result will, according to the assumed principles of action, be the same; for if a be the axial wire, and b’, b”, b”’ the equatorial wire, represented in three different positions, whatever magnetic lines of force pass across the latter wire in one position, will also pass it in the other, or in any other position which can be given to it. The distance of the wire at the place of intersection with the lines of force, has been shown, by the experiments (3093.), to be unimportant. (Faraday 1852a , p. 34 (3099))
In summary, by examining the history of Faraday’s use of lines of force, we showed how visual imagery and reasoning played an important part in Faraday’s construction and representation of his “field theory”. As Gooding has stated, “many of Faraday’s sketches are far more that depictions of observation, they are tools for reasoning with and about phenomena” (2006, p. 59).
Case study 3: visualizing scientific methods, the case of a journal
The focus of the third case study is the Journal of Visualized Experiments (JoVE) , a peer-reviewed publication indexed in PubMed. The journal devoted to the publication of biological, medical, chemical, and physical research in a video format. The journal describes its history as follows:
JoVE was established as a new tool in life science publication and communication, with participation of scientists from leading research institutions. JoVE takes advantage of video technology to capture and transmit the multiple facets and intricacies of life science research. Visualization greatly facilitates the understanding and efficient reproduction of both basic and complex experimental techniques, thereby addressing two of the biggest challenges faced by today's life science research community: i) low transparency and poor reproducibility of biological experiments and ii) time and labor-intensive nature of learning new experimental techniques. ( http://www.jove.com/ )
By examining the journal content, we generate a set of categories that can be considered as indicators of relevance and significance in terms of epistemic practices of science that have relevance for science education. For example, the quote above illustrates how scientists view some norms of scientific practice including the norms of “transparency” and “reproducibility” of experimental methods and results, and how the visual format of the journal facilitates the implementation of these norms. “Reproducibility” can be considered as an epistemic criterion that sits at the heart of what counts as an experimental procedure in science:
Investigating what should be reproducible and by whom leads to different types of experimental reproducibility, which can be observed to play different roles in experimental practice. A successful application of the strategy of reproducing an experiment is an achievement that may depend on certain isiosyncratic aspects of a local situation. Yet a purely local experiment that cannot be carried out by other experimenters and in other experimental contexts will, in the end be unproductive in science. (Sarkar and Pfeifer 2006 , p.270)
We now turn to an article on “Elevated Plus Maze for Mice” that is available for free on the journal website ( http://www.jove.com/video/1088/elevated-plus-maze-for-mice ). The purpose of this experiment was to investigate anxiety levels in mice through behavioral analysis. The journal article consists of a 9-min video accompanied by text. The video illustrates the handling of the mice in soundproof location with less light, worksheets with characteristics of mice, computer software, apparatus, resources, setting up the computer software, and the video recording of mouse behavior on the computer. The authors describe the apparatus that is used in the experiment and state how procedural differences exist between research groups that lead to difficulties in the interpretation of results:
The apparatus consists of open arms and closed arms, crossed in the middle perpendicularly to each other, and a center area. Mice are given access to all of the arms and are allowed to move freely between them. The number of entries into the open arms and the time spent in the open arms are used as indices of open space-induced anxiety in mice. Unfortunately, the procedural differences that exist between laboratories make it difficult to duplicate and compare results among laboratories.
The authors’ emphasis on the particularity of procedural context echoes in the observations of some philosophers of science:
It is not just the knowledge of experimental objects and phenomena but also their actual existence and occurrence that prove to be dependent on specific, productive interventions by the experimenters” (Sarkar and Pfeifer 2006 , pp. 270-271)
The inclusion of a video of the experimental procedure specifies what the apparatus looks like (Fig. 4 ) and how the behavior of the mice is captured through video recording that feeds into a computer (Fig. 5 ). Subsequently, a computer software which captures different variables such as the distance traveled, the number of entries, and the time spent on each arm of the apparatus. Here, there is visual information at different levels of representation ranging from reconfiguration of raw video data to representations that analyze the data around the variables in question (Fig. 6 ). The practice of levels of visual representations is not particular to the biological sciences. For instance, they are commonplace in nanotechnological practices:
Visual illustration of apparatus
Video processing of experimental set-up
Computer software for video input and variable recording
In the visualization processes, instruments are needed that can register the nanoscale and provide raw data, which needs to be transformed into images. Some Imaging Techniques have software incorporated already where this transformation automatically takes place, providing raw images. Raw data must be translated through the use of Graphic Software and software is also used for the further manipulation of images to highlight what is of interest to capture the (inferred) phenomena -- and to capture the reader. There are two levels of choice: Scientists have to choose which imaging technique and embedded software to use for the job at hand, and they will then have to follow the structure of the software. Within such software, there are explicit choices for the scientists, e.g. about colour coding, and ways of sharpening images. (Ruivenkamp and Rip 2010 , pp.14–15)
On the text that accompanies the video, the authors highlight the role of visualization in their experiment:
Visualization of the protocol will promote better understanding of the details of the entire experimental procedure, allowing for standardization of the protocols used in different laboratories and comparisons of the behavioral phenotypes of various strains of mutant mice assessed using this test.
The software that takes the video data and transforms it into various representations allows the researchers to collect data on mouse behavior more reliably. For instance, the distance traveled across the arms of the apparatus or the time spent on each arm would have been difficult to observe and record precisely. A further aspect to note is how the visualization of the experiment facilitates control of bias. The authors illustrate how the olfactory bias between experimental procedures carried on mice in sequence is avoided by cleaning the equipment.
Our discussion highlights the role of visualization in science, particularly with respect to presenting visualization as part of the scientific practices. We have used case studies from the history of science highlighting a scientist’s account of how visualization played a role in the discovery of DNA and the magnetic field and from a contemporary illustration of a science journal’s practices in incorporating visualization as a way to communicate new findings and methodologies. Our implicit aim in drawing from these case studies was the need to align science education with scientific practices, particularly in terms of how visual representations, stable or dynamic, can engage students in the processes of science and not only to be used as tools for cognitive development in science. Our approach was guided by the notion of “knowledge-as-practice” as advanced by Knorr Cetina ( 1999 ) who studied scientists and characterized their knowledge as practice, a characterization which shifts focus away from ideas inside scientists’ minds to practices that are cultural and deeply contextualized within fields of science. She suggests that people working together can be examined as epistemic cultures whose collective knowledge exists as practice.
It is important to stress, however, that visual representations are not used in isolation, but are supported by other types of evidence as well, or other theories (i.e., in order to understand the helical form of DNA, or the structure, chemistry knowledge was needed). More importantly, this finding can also have implications when teaching science as argument (e.g., Erduran and Jimenez-Aleixandre 2008 ), since the verbal evidence used in the science classroom to maintain an argument could be supported by visual evidence (either a model, representation, image, graph, etc.). For example, in a group of students discussing the outcomes of an introduced species in an ecosystem, pictures of the species and the ecosystem over time, and videos showing the changes in the ecosystem, and the special characteristics of the different species could serve as visual evidence to help the students support their arguments (Evagorou et al. 2012 ). Therefore, an important implication for the teaching of science is the use of visual representations as evidence in the science curriculum as part of knowledge production. Even though studies in the area of science education have focused on the use of models and modeling as a way to support students in the learning of science (Dori et al. 2003 ; Lehrer and Schauble 2012 ; Mendonça and Justi 2013 ; Papaevripidou et al. 2007 ) or on the use of images (i.e., Korfiatis et al. 2003 ), with the term using visuals as evidence, we refer to the collection of all forms of visuals and the processes involved.
Another aspect that was identified through the case studies is that of the visual reasoning (an integral part of Faraday’s investigations). Both the verbalization and visualization were part of the process of generating new knowledge (Gooding 2006 ). Even today, most of the textbooks use the lines of force (or just field lines) as a geometrical representation of field, and the number of field lines is connected to the quantity of flux. Often, the textbooks use the same kind of visual imagery than in what is used by scientists. However, when using images, only certain aspects or features of the phenomena or data are captured or highlighted, and often in tacit ways. Especially in textbooks, the process of producing the image is not presented and instead only the product—image—is left. This could easily lead to an idea of images (i.e., photos, graphs, visual model) being just representations of knowledge and, in the worse case, misinterpreted representations of knowledge as the results of Pocovi and Finlay ( 2002 ) in case of electric field lines show. In order to avoid this, the teachers should be able to explain how the images are produced (what features of phenomena or data the images captures, on what ground the features are chosen to that image, and what features are omitted); in this way, the role of visualization in knowledge production can be made “visible” to students by engaging them in the process of visualization.
The implication of these norms for science teaching and learning is numerous. The classroom contexts can model the generation, sharing and evaluation of evidence, and experimental procedures carried out by students, thereby promoting not only some contemporary cultural norms in scientific practice but also enabling the learning of criteria, standards, and heuristics that scientists use in making decisions on scientific methods. As we have demonstrated with the three case studies, visual representations are part of the process of knowledge growth and communication in science, as demonstrated with two examples from the history of science and an example from current scientific practices. Additionally, visual information, especially with the use of technology is a part of students’ everyday lives. Therefore, we suggest making use of students’ knowledge and technological skills (i.e., how to produce their own videos showing their experimental method or how to identify or provide appropriate visual evidence for a given topic), in order to teach them the aspects of the nature of science that are often neglected both in the history of science and the design of curriculum. Specifically, what we suggest in this paper is that students should actively engage in visualization processes in order to appreciate the diverse nature of doing science and engage in authentic scientific practices.
However, as a word of caution, we need to distinguish the products and processes involved in visualization practices in science:
If one considers scientific representations and the ways in which they can foster or thwart our understanding, it is clear that a mere object approach, which would devote all attention to the representation as a free-standing product of scientific labor, is inadequate. What is needed is a process approach: each visual representation should be linked with its context of production (Pauwels 2006 , p.21).
The aforementioned suggests that the emphasis in visualization should shift from cognitive understanding—using the products of science to understand the content—to engaging in the processes of visualization. Therefore, an implication for the teaching of science includes designing curriculum materials and learning environments that create a social and epistemic context and invite students to engage in the practice of visualization as evidence, reasoning, experimental procedure, or a means of communication (as presented in the three case studies) and reflect on these practices (Ryu et al. 2015 ).
Finally, a question that arises from including visualization in science education, as well as from including scientific practices in science education is whether teachers themselves are prepared to include them as part of their teaching (Bybee 2014 ). Teacher preparation programs and teacher education have been critiqued, studied, and rethought since the time they emerged (Cochran-Smith 2004 ). Despite the years of history in teacher training and teacher education, the debate about initial teacher training and its content still pertains in our community and in policy circles (Cochran-Smith 2004 ; Conway et al. 2009 ). In the last decades, the debate has shifted from a behavioral view of learning and teaching to a learning problem—focusing on that way not only on teachers’ knowledge, skills, and beliefs but also on making the connection of the aforementioned with how and if pupils learn (Cochran-Smith 2004 ). The Science Education in Europe report recommended that “Good quality teachers, with up-to-date knowledge and skills, are the foundation of any system of formal science education” (Osborne and Dillon 2008 , p.9).
However, questions such as what should be the emphasis on pre-service and in-service science teacher training, especially with the new emphasis on scientific practices, still remain unanswered. As Bybee ( 2014 ) argues, starting from the new emphasis on scientific practices in the NGSS, we should consider teacher preparation programs “that would provide undergraduates opportunities to learn the science content and practices in contexts that would be aligned with their future work as teachers” (p.218). Therefore, engaging pre- and in-service teachers in visualization as a scientific practice should be one of the purposes of teacher preparation programs.
Achieve. (2013). The next generation science standards (pp. 1–3). Retrieved from http://www.nextgenscience.org/ .
Google Scholar
Barber, J, Pearson, D, & Cervetti, G. (2006). Seeds of science/roots of reading . California: The Regents of the University of California.
Bungum, B. (2008). Images of physics: an explorative study of the changing character of visual images in Norwegian physics textbooks. NorDiNa, 4 (2), 132–141.
Bybee, RW. (2014). NGSS and the next generation of science teachers. Journal of Science Teacher Education, 25 (2), 211–221. doi: 10.1007/s10972-014-9381-4 .
Article Google Scholar
Chambers, D. (1983). Stereotypic images of the scientist: the draw-a-scientist test. Science Education, 67 (2), 255–265.
Cochran-Smith, M. (2004). The problem of teacher education. Journal of Teacher Education, 55 (4), 295–299. doi: 10.1177/0022487104268057 .
Conway, PF, Murphy, R, & Rath, A. (2009). Learning to teach and its implications for the continuum of teacher education: a nine-country cross-national study .
Crick, F. (1988). What a mad pursuit . USA: Basic Books.
Dimopoulos, K, Koulaidis, V, & Sklaveniti, S. (2003). Towards an analysis of visual images in school science textbooks and press articles about science and technology. Research in Science Education, 33 , 189–216.
Dori, YJ, Tal, RT, & Tsaushu, M. (2003). Teaching biotechnology through case studies—can we improve higher order thinking skills of nonscience majors? Science Education, 87 (6), 767–793. doi: 10.1002/sce.10081 .
Duschl, RA, & Bybee, RW. (2014). Planning and carrying out investigations: an entry to learning and to teacher professional development around NGSS science and engineering practices. International Journal of STEM Education, 1 (1), 12. doi: 10.1186/s40594-014-0012-6 .
Duschl, R., Schweingruber, H. A., & Shouse, A. (2008). Taking science to school . Washington DC: National Academies Press.
Erduran, S, & Jimenez-Aleixandre, MP (Eds.). (2008). Argumentation in science education: perspectives from classroom-based research . Dordrecht: Springer.
Eurydice. (2012). Developing key competencies at school in Europe: challenges and opportunities for policy – 2011/12 (pp. 1–72).
Evagorou, M, Jimenez-Aleixandre, MP, & Osborne, J. (2012). “Should we kill the grey squirrels?” A study exploring students’ justifications and decision-making. International Journal of Science Education, 34 (3), 401–428. doi: 10.1080/09500693.2011.619211 .
Faraday, M. (1852a). Experimental researches in electricity. – Twenty-eighth series. Philosophical Transactions of the Royal Society of London, 142 , 25–56.
Faraday, M. (1852b). Experimental researches in electricity. – Twenty-ninth series. Philosophical Transactions of the Royal Society of London, 142 , 137–159.
Gilbert, JK. (2010). The role of visual representations in the learning and teaching of science: an introduction (pp. 1–19).
Gilbert, J., Reiner, M. & Nakhleh, M. (2008). Visualization: theory and practice in science education . Dordrecht, The Netherlands: Springer.
Gooding, D. (2006). From phenomenology to field theory: Faraday’s visual reasoning. Perspectives on Science, 14 (1), 40–65.
Gooding, D, Pinch, T, & Schaffer, S (Eds.). (1993). The uses of experiment: studies in the natural sciences . Cambridge: Cambridge University Press.
Hogan, K, & Maglienti, M. (2001). Comparing the epistemological underpinnings of students’ and scientists’ reasoning about conclusions. Journal of Research in Science Teaching, 38 (6), 663–687.
Knorr Cetina, K. (1999). Epistemic cultures: how the sciences make knowledge . Cambridge: Harvard University Press.
Korfiatis, KJ, Stamou, AG, & Paraskevopoulos, S. (2003). Images of nature in Greek primary school textbooks. Science Education, 88 (1), 72–89. doi: 10.1002/sce.10133 .
Latour, B. (2011). Visualisation and cognition: drawing things together (pp. 1–32).
Latour, B, & Woolgar, S. (1979). Laboratory life: the construction of scientific facts . Princeton: Princeton University Press.
Lehrer, R, & Schauble, L. (2012). Seeding evolutionary thinking by engaging children in modeling its foundations. Science Education, 96 (4), 701–724. doi: 10.1002/sce.20475 .
Longino, H. E. (2002). The fate of knowledge . Princeton: Princeton University Press.
Lynch, M. (2006). The production of scientific images: vision and re-vision in the history, philosophy, and sociology of science. In L Pauwels (Ed.), Visual cultures of science: rethinking representational practices in knowledge building and science communication (pp. 26–40). Lebanon, NH: Darthmouth College Press.
Lynch, M. & S. Y. Edgerton Jr. (1988). ‘Aesthetic and digital image processing representational craft in contemporary astronomy’, in G. Fyfe & J. Law (eds), Picturing Power; Visual Depictions and Social Relations (London, Routledge): 184 – 220.
Mendonça, PCC, & Justi, R. (2013). An instrument for analyzing arguments produced in modeling-based chemistry lessons. Journal of Research in Science Teaching, 51 (2), 192–218. doi: 10.1002/tea.21133 .
National Research Council (2000). Inquiry and the national science education standards . Washington DC: National Academies Press.
National Research Council (2012). A framework for K-12 science education . Washington DC: National Academies Press.
Nersessian, NJ. (1984). Faraday to Einstein: constructing meaning in scientific theories . Dordrecht: Martinus Nijhoff Publishers.
Book Google Scholar
Nersessian, NJ. (1992). How do scientists think? Capturing the dynamics of conceptual change in science. In RN Giere (Ed.), Cognitive Models of Science (pp. 3–45). Minneapolis: University of Minnesota Press.
Nersessian, NJ. (2008). Creating scientific concepts . Cambridge: The MIT Press.
Osborne, J. (2014). Teaching scientific practices: meeting the challenge of change. Journal of Science Teacher Education, 25 (2), 177–196. doi: 10.1007/s10972-014-9384-1 .
Osborne, J. & Dillon, J. (2008). Science education in Europe: critical reflections . London: Nuffield Foundation.
Papaevripidou, M, Constantinou, CP, & Zacharia, ZC. (2007). Modeling complex marine ecosystems: an investigation of two teaching approaches with fifth graders. Journal of Computer Assisted Learning, 23 (2), 145–157. doi: 10.1111/j.1365-2729.2006.00217.x .
Pauwels, L. (2006). A theoretical framework for assessing visual representational practices in knowledge building and science communications. In L Pauwels (Ed.), Visual cultures of science: rethinking representational practices in knowledge building and science communication (pp. 1–25). Lebanon, NH: Darthmouth College Press.
Philips, L., Norris, S. & McNab, J. (2010). Visualization in mathematics, reading and science education . Dordrecht, The Netherlands: Springer.
Pocovi, MC, & Finlay, F. (2002). Lines of force: Faraday’s and students’ views. Science & Education, 11 , 459–474.
Richards, A. (2003). Argument and authority in the visual representations of science. Technical Communication Quarterly, 12 (2), 183–206. doi: 10.1207/s15427625tcq1202_3 .
Rothbart, D. (1997). Explaining the growth of scientific knowledge: metaphors, models and meaning . Lewiston, NY: Mellen Press.
Ruivenkamp, M, & Rip, A. (2010). Visualizing the invisible nanoscale study: visualization practices in nanotechnology community of practice. Science Studies, 23 (1), 3–36.
Ryu, S, Han, Y, & Paik, S-H. (2015). Understanding co-development of conceptual and epistemic understanding through modeling practices with mobile internet. Journal of Science Education and Technology, 24 (2-3), 330–355. doi: 10.1007/s10956-014-9545-1 .
Sarkar, S, & Pfeifer, J. (2006). The philosophy of science, chapter on experimentation (Vol. 1, A-M). New York: Taylor & Francis.
Schwartz, RS, Lederman, NG, & Abd-el-Khalick, F. (2012). A series of misrepresentations: a response to Allchin’s whole approach to assessing nature of science understandings. Science Education, 96 (4), 685–692. doi: 10.1002/sce.21013 .
Schwarz, CV, Reiser, BJ, Davis, EA, Kenyon, L, Achér, A, Fortus, D, et al. (2009). Developing a learning progression for scientific modeling: making scientific modeling accessible and meaningful for learners. Journal of Research in Science Teaching, 46 (6), 632–654. doi: 10.1002/tea.20311 .
Watson, J. (1968). The Double Helix: a personal account of the discovery of the structure of DNA . New York: Scribner.
Watson, J, & Berry, A. (2004). DNA: the secret of life . New York: Alfred A. Knopf.
Wickman, PO. (2004). The practical epistemologies of the classroom: a study of laboratory work. Science Education, 88 , 325–344.
Wu, HK, & Shah, P. (2004). Exploring visuospatial thinking in chemistry learning. Science Education, 88 (3), 465–492. doi: 10.1002/sce.10126 .
Download references
Acknowledgements
The authors would like to acknowledge all reviewers for their valuable comments that have helped us improve the manuscript.
Author information
Authors and affiliations.
University of Nicosia, 46, Makedonitissa Avenue, Egkomi, 1700, Nicosia, Cyprus
Maria Evagorou
University of Limerick, Limerick, Ireland
Sibel Erduran
University of Tampere, Tampere, Finland
Terhi Mäntylä
You can also search for this author in PubMed Google Scholar
Corresponding author
Correspondence to Maria Evagorou .
Additional information
Competing interests.
The authors declare that they have no competing interests.
Authors’ contributions
ME carried out the introductory literature review, the analysis of the first case study, and drafted the manuscript. SE carried out the analysis of the third case study and contributed towards the “Conclusions” section of the manuscript. TM carried out the second case study. All authors read and approved the final manuscript.
Rights and permissions
Open Access This article is distributed under the terms of the Creative Commons Attribution 4.0 International License ( https://creativecommons.org/licenses/by/4.0 ), which permits use, duplication, adaptation, distribution, and reproduction in any medium or format, as long as you give appropriate credit to the original author(s) and the source, provide a link to the Creative Commons license, and indicate if changes were made.
Reprints and permissions
About this article
Cite this article.
Evagorou, M., Erduran, S. & Mäntylä, T. The role of visual representations in scientific practices: from conceptual understanding and knowledge generation to ‘seeing’ how science works. IJ STEM Ed 2 , 11 (2015). https://doi.org/10.1186/s40594-015-0024-x
Download citation
Received : 29 September 2014
Accepted : 16 May 2015
Published : 19 July 2015
DOI : https://doi.org/10.1186/s40594-015-0024-x
Share this article
Anyone you share the following link with will be able to read this content:
Sorry, a shareable link is not currently available for this article.
Provided by the Springer Nature SharedIt content-sharing initiative
- Visual representations
- Epistemic practices
- Science learning
- Search Events & CPD
- GA Annual Conference and Exhibition
- GA CPD courses
- Consultancy services
- Quality Marks
- CPD Toolkit
- Study Tours
- Geography Education Research
- Online Teaching Resources
- Geography subject leadership
- Curriculum planning
- Progression and assessment in geography
- Classroom practice
- Geography fieldwork
- Promoting geography
- Become a geography teacher
- Support for geography teacher educators
Support for trainees and ECTs
- Networking Calendar
- GA Branches
- Student Activities
Support the GA
- Volunteer Groups
- Write for the GA
Using visual images in geography
“Use a picture. It’s worth a thousand words.”
Arthur Brisbane, editor of the New York Evening Journal in 1911
Topics on this page:
Introduction to images, using photographs in geography lessons, good practice in using visual images, photo interpretation and analysis skills.
- Discussion: Planning to teach photo interpretation skills
Photographs and place
- Try out a vision frame
- Plan the use of photographs in a lesson
Involving students in taking or selecting photographs
Other visual resources, aerial photographs and remote sensing (satellite) images, whiteboards, classroom display.
Images are essential to bring reality into the classroom and are a ‘bread and butter’ resource for the geography teacher. Look at The promise of geography in education by David Lambert. This provides an excellent example of how a geographer can ‘read’ and interpret a photograph. You need to be able to do this in order to use a photograph effectively as a teaching resource.
A wide range of visual images are used as a stimulus in geography lessons. Although we start with photographic images, do not ignore the value of other images, including remote sensing, aerial photographs, diagrams, cartoons, advertisements, sketches and drawings. These are discussed on this webpage.
The web gives us easy access to many more images than were available previously, which can provide varied perspectives. YouTube films, online photographs, articles and newspapers, produced by people from countries all over the world, can transform and enrich the way we see and understand places and help us guard against stereotyping and othering. But all representations must be open to analysis, evaluation and critical scrutiny, because they could be partial or misleading.
- See The Geographical Association Magazine, Spring 2020, p.32, for a focus on images and some useful hints on how to take, share, edit and use them, whether for use in the classroom or on fieldwork.
- Look at the PowerPoint Evaluating the educational benefits of immersive imagery at KS4 in which Amy Vigus and Dr Richard Waller explore the long and rich tradition in the use of different types of imagery in geographical education and the possibilities offered by new technology.
The main uses of photographs in geography lessons are to:
- Teach photo interpretation skills
- To help students to find out about people, places and geographical features
- To encourage students to explore their own values and attitudes about people and places
- Be a stimulus for geographical enquiry.
To use a photograph in your teaching you need to know:
- The learning skills that can be developed through photographs and how students learn to ‘read’ and ‘interpret’ an image
- How visual images help students acquire knowledge, and perceptions, about people and places
- Different strategies for using photographic material in your lessons.
Bear these points in mind when you are planning to use photographs and images in your lessons:
- Have the learning objectives clearly in mind when you select the photographs to use.
- Use good quality images and make sure all students in the class can see them clearly e.g. projected onto a whiteboard.
- Allow students time to study an image and do not use too many in one lesson.
- Plan activities that make students look at images carefully and analyse what they see.
- Check whether students have basic photo interpretation skills before you ask them to use an image.
- Use images to challenge (not reinforce) stereotypes.
Key Reading
- Hoare, C. (2019) ‘Using visuals to develop independent learning’, Teaching Geography, Spring. (This discusses using visuals with current technology in today’s GCSE geography classroom).
- Rayner, D. (2017) ‘Resources’ in Jones, M. (ed) Secondary Geography Handbook . Sheffield: Geographical Association. Chapter 12 pp 155-7 and Figure 3 for a comparison of the advantages and disadvantage of methods of displaying and using images.
- Roberts, M. (1998) ‘Using slide images to promote active learning’, Teaching Geography, January. (This is essential reading. Ignore the reference to slides, the techniques discussed can be used with modern technology).
Consider how you are going to source and manage all the digital visual materials you use in your lessons. (You must be aware of the copyright issues of using images from the internet.) Most teachers today use software such as PowerPoint to present images to students in lessons.
The GA resource page Visual geography provides a set of base resources for PowerPoint or interactive whiteboards. The teacher supplies the images they want to use in their sequence of lessons. You need to download the PowerPoint files to access the links.
Students need to learn how to make sense of photographic evidence in geography and their photographic interpretation skills develop gradually.
- Refer to Biddulph, et al (2021) 169 for a list of learning skills that can be developed using photographic material.
Consider this four-stage progression to develop students’ photo interpretation and analysis skills:
- Description : Encourage students to look at photographs carefully and describe what they can see before they begin interpretation. To do this consider:
- Activities that label geographical features or write descriptions of what students see in images. Bateman and Papper (2007) describe the use of text boxes (or call outs).
- ‘Modelling’ techniques with the whole class using a projected image so students understand what is expected before they create labels or describe photographs themselves.
- Activities such as ‘observations’, ‘sketching’, ‘captions’, and ‘spot the difference’ (see 21 photograph activities ) to develop observation skills.
- Explanation : Students develop explanations of what they observe. Consider:
- Using prompts such as, ‘What does this picture show?’, ‘Where in the world do you think it is?’, ‘Why?’. Bateman and Papper (2007) show how a simple use of callouts (textboxes) in PowerPoint can aid the development of explanation skills.
- The Development compass rose as a framework to analyse an image from social, economic, environmental and political perspectives.
- Deduction: A further level of difficulty is for students to deduce the geography from the evidence of this image. Consider:
- Harris (2017) Figure 4.6 used a question matrix to analyse a photograph of flooding.
- Hawley (2014) suggests some strategies and learning activities to help students to engage with an image of a physical landscape and to talk about its past, present and likely future. Students often struggle with this.
- Riley’s prompt sheet for Reading an image geographically , from the 2016 GA Conference.
- Thompson (1999) suggests students are asked, ‘Why it is as it is’, or ‘what might it be like in the future?’ using clues from the photograph.
- Critical analysis ; This is the highest skill with respect to studying an image. Consider:
- Roberts (1998) argues that students should think about what might have been omitted from an image and why?
- The list of questions to use with students to engage them in a critical analysis of an image on p169 in Biddulph et al (2021).
- Using ideas from Media literacy .
- Look at The power of geographical thinking . This videocast by Professor Peter Jackson illustrates how a 1750s image can be interpreted by geographers.
Discuss with your geography mentor different ways to use photographs to develop students’ skills of observation and analysis.
Review lessons you have taught, or observed, and discuss how successful the activities were in developing students’ skills. How can the students move on to the next stage using the sequence suggested above in Biddulph et al (2021)? How can you incorporate this in your lesson planning?
Photographs are particularly important in teaching about the geography of place and analysing students’ own and others’ perceptions of people and places. Students should understand that we interpret photographs in different ways depending on our own experiences and how the image was selected or created.
Bermingham et al (1999) and Halocha (2008) discuss a range of techniques that can be used with photographs of place and how images can convey powerful and, sometimes, controversial messages.
- See This book’s rubbish for an example of a stimulating activity where students are asked to ‘read’ and respond to some unsettling images.
- See Discussions with photographs for a range of ideas that you can use to encourage students to discuss photographs of places.
For more ideas:
- Rayner (2017) p 157-8 Figure 6: Sources of photos and Figure 7:Activities using photographs and images.
- Roberts, M. (2023) Geography through Enquiry: Approaches to teaching and learning in the secondary school , Second edition, Sheffield: Geographical Association.
- Thinking activities often use images such as 5Ws and Reading photographs .
- Before and after photos – comparing photos of a place at different times.
- Landscape bingo – Biddulph et al (2021) p 170.
- Using Transects photos to a sequence e.g . Rawding and Halliwell, D (2004).
- In the picture – a PowerPoint file that includes different frames you can adapt to use with your own images.
A vision frame is when a photo is put in the centre of a large piece of sugar paper. Students discuss in groups what they see and write their conclusions in boxes around the ‘frame’. They should be given question prompts such as:
- Describe exactly what you can see.
- What do you think the people are feeling/thinking?
- What do you think is the relationship between the people and the place?
- How do you respond to this image?
- What is it about this image that makes you feel this way?
- What questions would you like to ask about this image?
Ignore that some of the articles listed below may refer to out-of-date technology. The teaching strategies discussed will work equally well, or even better, with modern digital images projected onto a screen or whiteboard.
- Bateman, D. and Papper, R. (2007) ‘Image Sequences for Learning’, Teaching Geography Spring.
- Biddulph, M., Lambert, D. and Balderstone, D. (2021) Learning to Teach Geography in the Secondary School: A Companion to School Experience , 4th edition. Abingdon: Routledge. pp 168-170.
- Halocha, J. (2008) ‘Geography in the Frame: using photographs’, Teaching Geography , Spring.
- Harris, M. (2017) Becoming an Outstanding Geography Teacher , Routledge, Chapter 4.
- Hawley, D. (2014) ‘Looking into the physical future’, Teaching Geography , Spring.
- Rawding, C. and Halliwell, D. (2004) ‘Accessing land use through digital images’, Teaching Geography , October.
- Thompson, P. (1999) ‘Photographic enquiry and the geographical detective’, Teaching Geography , July. This discusses progression and an ‘incline of tasks’ for using photographs. It also provides interesting examples and analyses of different students’ responses.
- Plan a series of lessons to develop some of the learning skills using photographic material using ideas from the readings above.
- Devise a lesson to engage students in a critical analysis of ONE image. Using questions such as those in Biddulph et al (2021) p 169.
- Use In the frame (see above) and adapt it to use in your own lessons with your own images.
The pictures do not always have to be selected by the teacher. Consider these approaches:
- Students taking photographs using digital cameras or smartphones. Refer to Fox, P. (2003) ‘Putting you in the picture’, Teaching Geography, July.
- Students selecting photographs: e.g. from the web to illustrate a geographical topic and write an analysis of them. Refer to Urban landscapes and visual literacy: Imagining places from the GA’s KS4 ICT project which outlines a lesson which explicitly teaches some of the skills involved in the selection and analysis of photos.
- Read Brown, A. (2021) ‘Walk and click: photography as a conduit for connecting with a place’, Teaching Geography , Summer. The author shares research she undertook with year 9 geographers to use photography to engage with a place.
Other forms of visual images can support learning. They can help teachers to emphasise essential information they wish to convey to students or summarise information and provide an overview of a process which can make it easier for student to remember.
Many of the learning activities suggested for photos can also be used with other forms of other forms of static visual images.
- Read Caviglioli, O. (2018) ‘Six ways visuals help learning’, Impact (Chartered College of Teaching), February.
Aerial imagery is now readily available digitally which makes is more easily accessible. This is the same for satellite (or remotely sensed) imagery. Students need to be introduced to the use of false colours to represent different phenomena in remotely sensed images so they can decode and interpret and analyse them.
It is noted in the Ofsted Research Review: Geography (2021) that regular use of aerial and satellite imagery improves students’ knowledge of and fluency in interpreting such resources.
Make sure you have the skills to analyse each of both aerial photographs and remote sensing images, because they should be integral to students’ study because it helps them to visualise both physical or human phenomena. The requirements for GCSE geography include the use of:
- Aerial photographs (oblique and vertical)
- Images from weather satellites
- LANDSAT remote sensing images.
- Refer to Biddulph et al. (2021) pp 166-8 for further information about using aerial photographs and remote sensing images in the geography classroom, including information on progression in the development of interpretation skills.
- To help students to interpret aerial photos it is useful to display images and OS maps side by side. The Juicy Geography website has suggestions for classroom activities.
- The Met Office has weather data, including satellite imagery, for every continent of the world.
Cartoons often reflect topical issues in newspapers and magazines and are widely used in textbooks as illustrations. The power of the cartoon image as a teaching tool lies in their ability to present complex issues, events and social trends in a simplified and accessible form.
They often require considerable interpretation and a knowledge of the context to which the cartoon alludes, so care is needed to ensure they are used appropriately. They often work best with more able, older and analytical students. You should be alert to stereotyping when you use cartoons as a resource.
Some of the benefits to using carefully selected cartoons are that they can:
- They can arouse interest to help students to engage with a key teaching point
- Give an insight into the world around us and help students think ‘outside the box’
- Encourage students to use their imagination
- Help interpret meaning that is otherwise difficult to explain
- Help students to retain information through a memorable stimulus
- Be used to develop students’ ability to think critically about geographical issues.
You can use cartoons:
- To introduce a new concept
- To reinforce a specific idea
- To initiate classroom discussion and debate
- To encourage students to speculate on the message being conveyed
- To ask students to create their own caption.
Reading about cartoons
- Bermingham, S., Slater, F., and Yangopoulos, S. (1999) ‘Multiple texts, alternative texts, multiple readings, alternative readings’ , Teaching Geography, October.
- Biddulph et al (2021) Learning to Teach Geography in the Secondary School: A Companion to School Experience , 4th edition. Abingdon: Routledge. p 174.
- Cartoon interpretation about Japan’s Natural Hazard Profile .
- Hunt, P. (2018) ‘A critical pedagogy approach to the use of images in the geography classroom’, Teaching Geography, Autumn.
- Jenkins, P. (2003) ‘Cartoons with a message’, Teaching Geography, January.
Do not ignore this basic classroom resource and its role to support your oral explanation with the visual (often called dual coding ). It is particularly useful for scaffolding learning by using notes, diagrams and sketches.
As you explain an idea make notes on the white board or draw a flow diagram or sketch to illustrate the key points. In this way you are acting as a model of note taking as well providing a reminder of what has been said.
Rayner (2017) notes that, ‘ In the most effective classrooms, there are always high-quality displays of students’ work that not only celebrate achievement but also act as a resource for revision and information for visitors’.
Good geographical displays have several purposes. They make the classroom a pleasant environment for teaching and also provide a useful resource. Displays can also promote students’ use of maps, photos and diagrams. When you are a trainee teacher, you must obtain the permission of the class teacher before you begin making a display.
You should also ensure high quality presentation, carefully mounting the materials and using clear text to ensure the whole display is pleasing on the eye. Consider how you can involve students in the creation of displays so they have a sense of ‘ownership’.
See this Powerpoint, The impact of display in a geography classroom , from a trainee teacher using examples from their placement school experience.
Reading about classroom display
- Cawley, R. (1997) ‘Display – the forgotten teaching method’, Teaching Geography, January.
- Grant, R. and Talbot, P. (2000) ‘Wall posters from fieldwork’, Teaching Geography, April.
- Rayner, D. (2017) ‘Resources’ in Jones, M. (ed) The Handbook of Secondary Geography . Sheffield: Geographical Association Chapter 12 for information on word walls (p162) and hotboards and work displays (p163).
Also available from the ITE section

Media literacy and the web

Using technology in geography teaching

Moving images

Using resources for geography teaching
Keep in touch.
Sign up to the GA’s newsletter for the latest ideas, support and advice in geography education.
© The Geographical Association 2024
Charity No: 1135148 Company No: 07139068
Strategic Partners

Rediscovering Geography: New Relevance for Science and Society (1997)
Chapter: 4 geography's techniques, 4— geography's techniques.
This chapter provides a brief discussion of contributions made by geographers to the development of techniques for observation, display, and analysis of geographic data. With respect to observation, the chapter addresses two extremes on the geographic scales of observation: local fieldwork and remote sensing. With respect to the display and analysis of data, the chapter examines cartography, visualization, geographic information systems (GISs), and spatial statistics.
The techniques that geographers use in their work are not developed in a vacuum. They are developed to address specific problems and, thus, reflect the focus of the discipline at particular times. These techniques reflect the conscious decisions of geographers about the kinds of information that are important to collect; the spatial scales at which information should be collected, compiled, analyzed, and displayed; data sampling strategies and experimental designs; data representation; and methods for data analysis. As theoretical paradigms change, so do the techniques for empirical research. Thus, advancement of the discipline goes hand in hand with the development of new and improved techniques for collecting, analyzing, and interpreting information. Sidebars 4.1 and 4.2 illustrate the close relationship between advancement of the discipline and technique development.
The variety of perspectives in geography and a recognition of how different world views and experiences influence theoretical work (see Chapter 3 ) help geographers remain conscious of the influence of theory on technique development (and the reverse). The current popularity of GISs, for example, both reflects and reinforces the influence of spatial analytic theories in the discipline. There
is a lively debate about whether the popularity of GISs is hindering the development of other theoretical approaches, such as social theory, that require different techniques for empirical analysis.
This chapter illustrates some of the ways in which geographers have made substantial contributions to empirical scientific techniques through their methodological research. Some of these techniques were developed by other disciplines for other purposes and were adapted by geographers to meet the special challenges posed by the study of spatial and temporal aspects of phenomena, processes, and events. Some of the techniques developed by geographers have found widespread use in other disciplines and in the public and private sectors generally. Perhaps the best current examples are GISs that store, manipulate, and display geographically referenced information. The potential of GISs to handle large quantities of spatially related information fills an important need in research, education, and applied work in the public and private sectors. The geographic information system, in addition to being a stimulus for theoretical research in spatial representation (see
Chapter 3 ), is a major topic of techniques-related research in geography and it is one of the principal topics of specialization within the field, currently demanded by students and employers alike.
The focus of this chapter on techniques for empirical analysis should not be taken to mean that methodological contributions in geography have been restricted to observation and hypothesis testing. For the past 20 years the discipline has been a fertile field of theoretical research, particularly in conceptualizing and modeling geographic processes. In many ways these theoretical developments have given the discipline its secure intellectual foundation.
Observation
Observation of phenomena and events is central to geography's concern for accurately representing the complexity of the real world. The traditional and still widely practiced method of observation is through direct "on-the-ground" contact between geographer and subject through field observation and exploration. Fieldwork is particularly effective for making observations at micro- to mesoscales, as typified, for example, by the study of single watersheds or cities.
Fieldwork is an intensive endeavor. It can require substantial investments of human and financial resources, particularly if carried out over extended periods of time.
The intensive nature of fieldwork makes it impractical for macroscale observations of the Earth's surface. Such observations are best made by using remote sensing techniques that utilize air- or spaceborne platforms and sensors. The development of these techniques, and especially the collection of remote sensing data, have often been led by geographers.
Field Observation/Exploration
The principal laboratory for geographic investigation is the field. Indeed, Sayer (1993) has argued that the intensive, comparative case-study research enabled by field observation is central to understanding the variations between places that geographers specialize in studying. Many of geography's most compelling questions center around changes in the physical and built landscape. Addressing those questions usually requires field observation and spatial sampling. Geographers interested in social patterns and processes also use archival research, interviewing and surveying techniques, and participant observation methods that are associated with the social sciences more generally.
Fieldwork allows geographers to make direct observations in places where local data are missing or unreliable and to check the validity of existing secondary sources such as census statistics. While the increased availability of remote sensing imagery would seem to reduce the need for fieldwork in some research, in truth it makes such work even more important because accurate interpretation of imagery depends on detailed knowledge of the actual patterns on the ground. To decide, for example, which areas on a forested scene represent healthy old-growth forest as opposed to disease-infested old-growth or young secondary forest, researchers need field data on the composition and distribution of different forest stands so that they can assess how such stands are ''seen" by remote sensors.
Fieldwork may also be needed to test the validity of interpretations (e.g., a vegetation map) that others have made based on remote sensing imagery—just as it is necessary to test the validity of other secondary data sources, digital or otherwise. The wide availability of digitized secondary datasets (not just interpreted imagery but also census data and other information) makes it easy for students and researchers to download information and perform their own analyses. Unfortunately, such datasets frequently do not include detailed descriptions of the origins and reliability of the information. In cases where these "meta-data" are missing, the digital datasets may only be useful if the researcher is able to assess their reliability through fieldwork. In a digital age, when it seems so easy to collect observations "automatically" from space or secondhand from online datasets, fieldwork becomes more, rather than less, important to good scholarship.
The contributions of geography to the practice of field research derive from the discipline's emphasis on location and synthesis. As noted in Chapter 3 , geographers are concerned with distributions and spatial patterns of phenomena. In these connections they have contributed to our understanding of distributions and patterns through the development of innovative field mapping techniques. To geographers, field maps are more than orientation aids. They are a tool to record and to uncover relationships among observations. Geographers have developed field mapping techniques to shed light on everything from spatial cognition to the origin and diffusion of cultural traits. With the explosion of GISs, global positioning systems (GPSs), and related technologies, geographers are at the forefront in automating the compilation, manipulation, and analysis of field observations (see Figure 4.2 ).
The field geographer's interest in distributions and spatial patterns is part of a larger concern with synthesis: how and why particular phenomena come together in specific places to create distinctive environments. This concern leads geographers in the field to observe and study a wide range of physical and social phenomena. Research on land reform, for example, might involve soil sampling as well as interviews with affected individuals.
The enduring importance of fieldwork in geography extends beyond research to pedagogy. At a time when new ways are being sought to promote environmental and cultural awareness through education, geographic fieldwork offers a unique and valuable perspective. Field excursions are incorporated routinely into many geography courses. They are designed to teach students about the environment in which they live and to encourage them to be inquisitive about the processes that shape landscapes and cultures. Fieldwork thus provides both a tool for the acquisition of knowledge and a means of promoting awareness and appreciation of culture and the environment.
Remote Sensing
Remote sensing is defined here as the detection and recording of electromagnetic radiation signals from the Earth's surface and atmosphere using sensors placed aboard aircraft and satellites. These signals are usually recorded in digital form, where each "digit" denotes one piece of information about an average property of a small area of the Earth.
Geographers have been using remote sensing data since they first became available about 30 years ago. Geographers who study the Earth's climate, for example, use satellites to collect data on atmospheric conditions for monitoring and predicting change. Remotely sensed data also are very useful in creating and updating maps of physical, biological, and cultural features at the Earth's surface. The ability of certain sensor systems to "see" through cloud cover, and their unrestricted access to all portions of the Earth, provide information that may not be available from other sources.
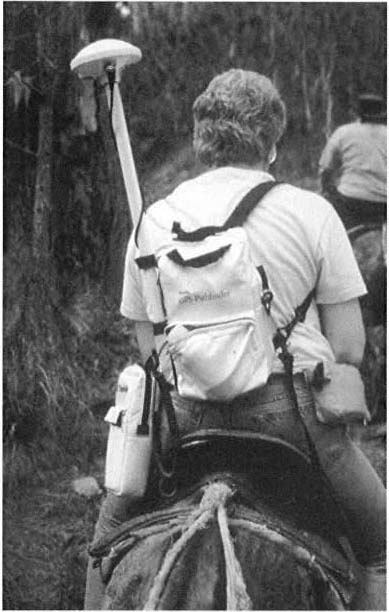
This photograph shows a GPS (mounted on the rider's back) being used to record positional data while traversing remote highlands of the Dominican Republic for a research project on Quaternary paleoclimatology and biogeography. Data were subsequently entered into a GIS to map trail routes and geomorphic features under study.
Geographers have played important roles in efforts to use satellite data for taking inventory of and monitoring land cover, both regionally and globally. For instance, a joint U.S. Geological Survey (EROS Data Center)/Center for Advanced Land Management Information Technologies project recently demonstrated a method using multisource data that successfully characterized 159 land cover classes for the United States (see Plate 11 ). The acquisition of global land cover data has been recognized as a top priority by the National Research Council and the International Geosphere-Biosphere Programme (e.g., Townshend, 1992; NRC, 1994).
Geographers have also played key roles in the collection and processing of remotely sensed data for the National Oceanic and Atmospheric Administration's Coastwatch Change Analysis Project, a joint state and federal program designed to monitor environmental changes in coastal wetlands, uplands, and submerged habitats. Klemas et al. (1993), for example, developed a coastal land cover classification system for use with satellite imagery. The system is compatible with existing coastal mapping programs and databases and with GIS. Dobson and co-workers (Dobson and Bright, 1991; Dobson et al., 1993) have conducted prototype studies in the Chesapeake Bay watershed and have helped develop a protocol for mapping locations, characteristics, and changes in coastal zone habitats. Jensen and co-workers (Jensen et al., 1993a, b) have used remote sensing data to predict the effect of sea-level changes on coastal wetlands (see Plate 3 ).
Scale is a fundamental issue for collection of data by remote methods. In this context, scale can refer to the spatial, spectral, radiometric, or temporal characteristics of sensor systems, all of which—singly and in combination—affect the quality and usefulness of the collected data. Geographers have made valuable contributions in understanding the spatial- and temporal-scale dependence of geographic data and in determining optimal measurement scales for remotely gathered data.
Geographers are also involved in developing new technologies for integrating, analyzing, and visualizing multiresolution satellite data in integrated geographic information systems. The integration and visualization of satellite imagery with other types of data hold enormous potential for researchers, resource managers, and decision makers as they strive to inventory, understand, and manage the Earth's human and natural environment.
Sampling and Choice of Observations
An important component of much geographic research is estimation of the values of variables through sampling. Evaluating the efficacy of sampling designs is an important topic of research in geography and an important aspect of applying geography's techniques.
Traditionally, sample collection in geography utilized sampling designs borrowed from classical statistics, but for many geographic data, classical sampling
designs may not produce representative samples. Random samples are not necessarily representative samples because of the way processes can vary in time and space. For spatially referenced data there is no consistent relationship between the number of observations and their representativeness. Quite commonly, other information is available that permits the differential weighting of sample observations. Such Bayesian weighting schemes, for example, are becoming especially important in interpreting the geographic patterns of disease distributions. The "samples" of observed diseases are hypothesized to be drawn from known processes, and the interest is in observing differences between observed and expected patterns of disease given the geographic distribution of conditions known to affect the likelihood of the disease being present in a population (Langford, 1994). Generating samples from known processes, computing the reference distribution and finding the relationship of an observed sample estimate to it, is often accomplished using Monte Carlo simulation methods (Openshaw et al., 1987, 1988).
Many samples of geographic data are taken from datasets designed for other purposes (e.g., from the census). This resampling of samples confounds classical statistical probability assessments and hypothesis testing. A number of geographers have begun to move away from classical statistical approaches toward more flexible approaches that incorporate geographic understanding. The move from "direct" to "indirect" estimation techniques that rely on knowledge from related observations to estimate the conditions of small areas illustrates this change. In qualitative approaches in human geography, formal sampling designs are often questioned, since space is not conceived of as an empty space whose content is to be captured through systematic samples—but, rather, as a differentiated space with meanings attached to areas that change across space in noncontinuous ways. In qualitative analyses a contrast is made between time, which is seen as one-dimensional and unidirectional, and space, which is seen as multidimensional and ordered in many different ways. For the qualitative geographer, who is often cultivating the middle ground between the universality of science and the particularity of history, interpreting the meaning of change in space becomes the goal and purposive sampling the tool for this end.
An example of a new approach to sampling design and evaluation is the ongoing effort to assess global climate and climatic change from weather station measurements. Rain gauge networks provide spatial samples of the continually varying global precipitation field. Their spatial distributions are neither random by design nor demonstrably random in effect (see Figure 4.3 ); nevertheless, the nodes of these sampling networks (the rain gauge locations) are arguably the best representations of historical precipitation variability. Standard statistical approaches are inadequate for assessing precipitation variability from such samples for the reasons mentioned above. In their place, computer-intensive, nonparametric methods of evaluating the rain gauge networks and, in turn, the precipita-
Spatial distribution of precipitation stations in the National Center for Atmospheric Research's World Surface Climatology for (a) 1900, (b) 1930, and (c) 1960. Station locations are denoted by closed circles.
Source: Willmott et al. (1994).
tion fields that they represent have proven useful, when informed by climatological understanding.
Display and Analysis
The traditional tool in geography for the display of spatially referenced information is the map. Cartography is a subdiscipline traditionally concerned with formalized procedures for making maps. To many, the term map connotes a fixed, two-dimensional paper product containing point, line, and area data. During the past generation, however, advances in data collection, storage, analysis, and display have greatly expanded this traditional view. The "modern" map is a dynamic and multidimensional product that exists in digital form. The advent of such maps has opened up new fields of research and application for geographic investigation.
Any geographer educated 25 years ago who returned to the discipline today would be impressed by the methods geographers now use to record and process spatial information (Laurini and Thomas, 1992). The changes extend beyond the development of GISs to new techniques for geographic visualization and spatial statistical analysis, which provide for an increasingly complex and contextual understanding of the world. This same observer would also be impressed by the problems that remain to be solved. For example, a substantial methodology now exists for statistical analysis of spatial data, but it has not yet been integrated into GISs. Indeed, as a platform for the investigation of scientific questions, GISs are still in their infancy. Many geographers believe that a large dividend would come from integrating GISs as information science with visualization techniques and spatial analysis methods.
The following subsections provide a brief review of some of the substantive methodological contributions of the discipline to display and analysis techniques. These include cartography, GISs, geographic visualization, and spatial statistics.
Cartography
The traditional close association between geography and maps is appropriate given the discipline's concern with space and place. The symbiotic link between geographers and maps has ensured the persistence of cartography as a subdiscipline of geography within most academic settings.
The field of cartography has changed enormously during the past three decades, primarily because of the widespread availability of computers. Computers have made possible new forms of symbolization, such as dynamic (i.e., animated) maps, customized maps for individual users, and interactive maps. They have also made possible new methods for scientific visualization and spatial data analysis.
Geographic cartographers have made especially valuable contributions to
the development of automated mapping systems. Their research on map reading processes, map production techniques, cartographic generalization, and cartographic design has facilitated the automation and formalization of what had been an intuitive manual procedure. With generalization, for example, a conceptual model has been devised that separates the subjective and holistic approaches of traditional cartography into discrete subcomponents that have been successfully incorporated into digital mapping software (McMaster and Shea, 1992). Cartographers have also worked to prevent the inadvertent misuse of computer mapping systems and maps by developing expert systems for map production.
Some of the most interesting and potentially useful research conducted by geographers today is in the realm of dynamic or animated cartography. Animation enables the visualization of changes in phenomena across space, through time, and in attributes of the phenomena themselves (see Sidebar 4.3 ). One of the earliest animated maps of the microcomputer era showed the spread of AIDS at the county level in Pennsylvania (Gould, 1989). This animation was used to highlight the initial concentrations and spatial diffusion of the disease more effectively than a sequence of static maps. The intention of this dramatic portrayal was to inform and educate health care researchers and the general population. The cartographic techniques developed in this research subsequently led to inclusion of a series of animated maps in one of the best-selling CD-ROM encyclopedias.
Geographers have led the way in research on another new cartographic format: electronic atlases and atlases on CD-ROMs. In a recent project undertaken jointly by Florida State University, the Florida Department of Education, and IBM, an atlas of Florida was published on a CD-ROM and distributed to all schools in the state ("Atlas of Florida," 1994; see Figure 4.5 ). This format permits the inclusion of multimedia material that could not be accommodated by traditional printed text: audio, video, animation, or a multitude of photographs and other graphics. Electronic atlases and related geographic programs are already proving to be effective in educational settings, especially at the kindergarten through grade 12 levels. The newly released "ExplOregon: A Geographic Tour of Oregon" (a 1995 multimedia CD-ROM developed by William Loy with Digital Chisel software by Pierian Spring Software) is changing the way that the geography of Oregon is taught and learned in schools throughout the state. As national standards for geography education are developed, educational aids such as electronic atlases will become indispensable.
Geographic Information Systems
Geographic information systems were defined in 1992 by the U.S. Geological Survey as "computer system[s] capable of assembling, storing, manipulating, and displaying geographically referenced information" (USGS, 1992). Such systems, in fact, have power, utility, and importance far beyond this definition, both within and beyond the field of geography. Their most valuable potential capability,
which sets them apart from computer mapping systems, is the ability to perform spatial analyses to address research and application questions.
Fundamental to the successful propagation of GISs is the development of methods for representing and coding spatial data (see Sidebar 4.4 ). GISs can be used to perform an extensive variety of spatial operations and analyses on properly coded data. At the most elementary level are computations of distances, areas, centroids, gradients, and volumes. More complex operations that add spatial
Choropleth map from the "Atlas of Florida" CD-ROM showing arrests for drug sales and possession by county for 1989. By clicking on the graph icon at the lower left of the screen, the user can display an animated bar graph that depicts changes over time in drug-related crimes and enforcement.
Source: "Atlas of Florida" (1994).
referencing to a basic calculation are also possible—for example, going beyond questions about the total length of a city's sewer lines to questions about the total length of sewer lines in a given area in a particular city and what proportion of this length is more than 50 years old. GISs are also capable of more complicated operations such as (1) calculating new spatial datasets based on attributes of existing data—for example, calculating slopes from elevations; (2) comparing two or more spatial datasets based on user-specified criteria—for example, identifying toxic waste sites that are situated on permeable soil; (3) delimiting areas that possess certain characteristics defined by the user—for example, delimiting locations of commercially zoned land within 2 miles of an interstate highway; and (4) modeling the possible outcomes of alternative processes and policies—for example, determining the impact of flooding along the Mississippi River given the presence or absence of levees (see Plate 10 ).
GISs are being used to facilitate a variety of management and planning decisions in both the public and the private sectors. For instance, in Wake County, North Carolina, potential sites for schools, libraries, and other facilities have been determined by identifying adequately sized parcels of vacant land and providing information about utilities, topography, and demographic characteris-
tics of the local population. By incorporating population data from the 1990 census into their GIS, Wake County planners can generate population projections, vacancy rate estimates, and growth rates in demands for services (Juhl, 1994).
Plate 4 provides a further illustration of the capabilities of GISs to integrate data from diverse sources to create products for planners and policy makers. The figure shows a map of a portion of Columbia, South Carolina, that was created by combining 1990 census block-level data on racial composition with the county assessor's parcel-level data on land use. Proportional pie graphs provide a visualization of the varying levels of racial integration within blocks. This type of display would be especially useful for political reapportionment.
Another challenge in which GISs have found use is in monitoring natural resources. For example, GISs are being used to assess the impact of water releases from the Glen Canyon Dam on water flow in the Colorado River through the Grand Canyon (Powers et al., 1994). Researchers constructed databases that contain spatial coordinates of the study area and ''layers" of information about the canyon's vegetation, surficial geology, and hydrology. These three characteristics are being monitored and analyzed to determine trends through time in riparian vegetation growth, habitat, and "events" such as channel scouring and channel constriction.
In addition, GISs have a growing role in international policy and planning associated with human welfare. One particularly compelling example, cutting
across the issues outlined in Chapter 2 , involves the Bangladesh Flood Action Plan (FAP) of the International Council for Scientific Unions-International Geographical Union (ICSU-IGU). FAP is a major international research and policy development effort designed to provide flood warning, coordinate assistance efforts during flood events, and develop long-term flood mitigation plans. The project brings geographers in Bangladesh together with an international team of experts (coordinated by the IGU) to build a knowledge and technology base at the University of Dhaka. A particularly important component of the project involves rapid field mapping by local technicians using handheld GPS monitors integrated with pen computers. Data are gathered and fed directly into the GIS to allow for updated mapping and integration with remotely sensed images.
Although GISs are being utilized at ever-increasing rates, their full potential remains to be realized. Geographers have an intrinsic interest in GISs from at least three perspectives: (1) as users of GISs for research and applications; (2) as contributors to the development of GIS methods, theories, and applications; and (3) as educators. The interest in GISs as an education tool is becoming increasingly important because their applications are growing rapidly and their impacts promise to be powerful. Geographers will be responsible for preparing future generations of GIS users and must provide them with strong backgrounds in understanding geographic processes and patterns, spatial analysis, and spatial visualization techniques.
To the end user of a GIS, its operation can be a deceptively simple "black box" that generates answers to queries at the press of a few keys. There is an inherent danger in this apparent simplicity, however, in that users can easily and unknowingly misuse the power of GISs to produce irrelevant or erroneous solutions (Cartography and Geographic Information Systems, 1995). Users need considerable background knowledge of the subject matter to which GISs are being applied, as well as an understanding of the analytical operations available on the systems, in order to know what questions to ask, the relevant variables to invoke, and how to recognize nonsensical procedures and answers.
An outgrowth of GISs (linked to geographic visualization and spatial statistics—both discussed separately below) is the development of geographic information analysis (GIA) tools. Such tools typically use an existing GIS as a base (or rely on data structures originally designed to support GIS) to which numerical analysis and sophisticated visual display methods are linked. Among the more successful early GIA tools was the Geographical Analysis Machine (GAM), the goal of which was to generate an automated answer to the question of "where" to look for patterns by initially looking everywhere (Openshaw et al., 1987). GAM is part of a larger effort to develop a "computational human geography," an approach to human geography that builds on the massive databases of social and economic data being generated together with inductive approaches to arriving at useful generalizations. Application of the original GAM resulted in successful
identification of clusters of leukemia cases. The method was, however, limited by its use of brute force (nonefficient) methods.
In a recent extension of GAM, Openshaw (1995) has implemented a space-time-attribute analysis machine (STAM) linked directly to GIS. The goal of STAM is to determine a set of GIS operators that, when applied to a database query, will identify cases that form a statistically unusual pattern. In its most recent implementation STAM incorporates the use of "genetic" algorithms (i.e., algorithms that adapt to their environment, for example, by defining the appropriate spatial scale and resolution for a particular problem context).
Another significant development in GIA is the incorporation of object-oriented programming (OOP) concepts to extract the data needed for an analysis from a GIS, solve spatial analytic problems, and subsequently link the solutions back to the GIS for display of results and further analysis. One example of this approach involves development of custom routing software for use by the U.S. Agency for International Development (USAID) in decision making related to food aid transport in southern Africa (Ralston, 1994). Southern Africa imports large quantities of food grains, and the state of the economy dictates that much of this is in the form of food aid. The software developed for USAID is based on an OOP approach linked to the commercial GIS, ArcInfo. The combination provides a flexible tool for prepositioning food in storage facilities, setting prices for acquisition of more carrying capacity, determining where to add more storage, making distribution decisions, choosing best modes and routes for transport, and determining the location and cost of bottlenecks. The OOP approach was found to be particularly useful in quickly adapting the decision model to deal with changes in obstacles to distribution.
Geographic Visualization
Geographic visualization (GVis) can be defined as "the use of concrete visual representations . . . to make spatial contexts and problems visible, so as to engage the most powerful human information processing abilities, those associated with vision" (MacEachren et al., 1992, p. 101). The dramatic increase in volume of georeferenced data being collected and generated today is exceeding our capacity to analyze and digest it. Using the power of human vision to recognize patterns and synthesize spatial information increases the capacity of geographic researchers to cope with this data volume. For example, a simple 48 × 48 matrix of fiscal transfers for the United States generates 2,256 pieces of information for each time period considered. Such information can be concisely summarized in a simple yet effective visualization (e.g., see Figure 4.6 ).
GVis combines display with analysis capabilities to enable the search for patterns and relationships; the identification of anomalies; the analysis of directions and flows; the delineation of regions; and the integration of local, regional, and global information (see Figure 4.6 ). The development of flexible GVis tools
Estimated trajectories of fiscal transfers via federal accounts for 1975 (Tobler, 1981). The flow pattern has been estimated from a rather coarse 61 × 95 finite difference mesh, having an approximate resolution of 400 km. The flow lines depict the theoretical paths of fiscal transfers computed from the potential field obtained as the solution of Poisson's equation. This simple but effective visual depiction dramatically illustrates the general direction of flow and also depicts partitioning into flow regions quite clearly. The resolution upon which it was based, which was partly a function of computational power in 1981, does not support identification of particular origins and destinations.
is an important topic of geographic research because such tools are essential to fully exploit the information "content" of georeferenced data. Geography as a discipline is involved with GVis in three ways: development, application, and assessment of the implications of its use.
The most active topics of GVis research are exploratory spatial data analysis (ESDA) and the application of multimedia to spatial analysis, education, and policy decisions. Research on ESDA includes work on extending classical statistics to deal with spatial data, as described later in this chapter. Research in this field also includes the development of new data transformation and symbolization techniques and the development of computer interfaces to allow interactive analysis of spatial data (see Sidebar 4.5 ).
In the field of multimedia research, cartographers are developing techniques and computer interfaces that allow animation to be used as a tool for spatial pattern recognition. Multimedia tools are also being developed to link maps, graphics, text, and data to understand the complexities of geographic processes in
problems involving human-environment interactions. GVis concepts also provide structure for the design of multimedia tools for interactive learning. Multimedia visualization technology is important in the context of digital geographic libraries. A particularly innovative development in this context is the first comprehensive collection of Native American maps (Andrews and Tilton, 1993). The library contains high-resolution images of original maps stored at a variety of resolutions and accessible through a comprehensive cross-referenced indexing tool that takes advantage of the nonlinear structure inherent in hypermedia applications. 1
Geographers are exploiting the dynamic capabilities of GVis—its abilities to directly manipulate model parameters or map elements or its capacity for animation—to analyze complex spatial processes. As noted in Sidebar 4.3 , for example, animation has been used to understand tree species migration across North America and to compare it with predictions from climate models.
Beyond its role in exploratory research, interactive GVis is rapidly evolving as a tool in policy formulation. A good example is Shiffer's (1993) multimedia environment, which was developed to allow participants at public meetings concerned with airport siting to hear the noise that would be generated at specified locations in relation to the proposed facility.
GVis and scientific visualization in general represent a shift away from strict quantitative analysis to increased reliance on qualitative sensory perception. Particularly when used with modeling and simulation, GVis has important ramifications for geography and the rest of science. These include fundamental issues of how research questions are framed and even what constitutes a problem worthy of investigation. As geographers move away from the use of fixed maps and avail themselves of the multiple perspectives permissible with GVis, they must come to grips with how the "truth" of the representations generated can be judged—and even what truth is. There is a growing need to address such issues as truth in representation, particularly in relation to the use of GVis and GISs in public policy applications.
Spatial Statistics
The analysis of geographically referenced information poses statistical challenges not faced in most other disciplines. First, observations are not always scalar numbers, such as points on a map. They may be multidimensional, consisting of lines, areas, and volumes. Second, the observations may be spatially or spatiotemporally covariant—that is, the values of observations made in one location may depend on the values of observations from other locations or from the same
location at different times. This violates a key assumption central to much statistical theory—that observations are mutually independent.
Attempts to deal with these challenges have stimulated the development of a new subfield of statistics. Although this work began in ecology and biostatistics and has lately attracted the interest of statisticians, many of these developments were pioneered by geographers. For example, geographers have developed methods for estimating the degree and nature of spatial autocovariance in point, line, and area data. They have also addressed such complicating features as periodicity or waves in spatial patterns. Geographers have also played an important role in developing multivariate statistical analysis methods to deal with the spatial and temporal autocovariance of much spatially referenced data.
Spatial data pose special problems that are subjects for research by geographers. Because geographic data often fail to meet distributional assumptions necessary for classical statistical procedures, geographers have been at the center of attempts to develop distribution-free methods for estimating statistical relationships among variables. They also have been involved in the development of methods for estimating prior probability distributions, either through Monte Carlo simulations that generate reference distributions unique to each locality or by developing Bayesian methods that allow investigators to incorporate knowledge of known relationships in statistical investigations.
Methods for evaluating data for spatial dependencies have received recent attention from geographers (e.g., Getis and Ord, 1992). Such measures are used both to identify spatial patterns in data and to allow analysts to understand spatial relationships in their data so that appropriate analytical techniques can be chosen. When measures of spatial dependency are applied to real world datasets of the magnitude needed to address the societal problems identified in Chapter 2 , spatial dependency measures can become intractable. One promising solution to the dilemma is the application of massively parallel processing methods (Armstrong and Marciano, 1995).
Recent research in GISs aims to develop "data models" that facilitate the routine analysis of spatial dependence, spatial heterogeneity and spatially referenced diagnosis of regression models. These spatial data models are used to prepare data in the special forms needed to efficiently accomplish these spatial analysis methods. The intent is to bring the same level of enabling technology to spatial analysis that spreadsheets and statistical packages have brought to statistical analysis (Anselin et al., 1993).
Research in spatial statistics is believed by many to be in its infancy because many research questions are likely to yield to computational approaches. There are enormous complexities in the analysis of spatially referenced data that require additional research. For instance, research is needed to understand the scale dependence of statistical methods and sampling designs. This work is necessary to understand why different aggregations of spatially referenced observations give statistical results that vary dramatically and unpredictably from one spatial
specification to another (e.g., Tobler, 1969). Research is also needed to understand how to separate environmental effects from other geographic variations in health research—how, for instance, to separate environmental factors that cause cancer from the density of susceptible populations when searching for cancer clusters. This last example illustrates the importance of research in addressing important public policy questions.
Conclusions
Current trends in geography's techniques suggest a future in which researchers, students, business people, and public policy makers will explore a world of shared spatial data from their desktops. They will request analyses from a rich menu of options, select the geographic area and spatial scale of analysis, and display their results in multimedia formats that are unanticipated today.
In developing GIS-GVis tools of the future, developers need to think more broadly about the context of the problems and the knowledge and skill levels of users. The users of tomorrow are likely to be a far broader group than at present—in background, perspectives, and skills. Indeed, many will be novices by today's standards, and they will rely on the embedded knowledge of experts in their use of these tools.
The users of the future will also bring different world views and theoretical perspectives to these tools. They will challenge the adequacy of current techniques for analyzing and understanding geographic phenomena, posing challenges that must be taken up by developers when designing next-generation tools and theories.
As political, economic, and environmental issues increasingly spread across the globe, the science of geography is being rediscovered by scientists, policymakers, and educators alike. Geography has been made a core subject in U.S. schools, and scientists from a variety of disciplines are using analytical tools originally developed by geographers.
Rediscovering Geography presents a broad overview of geography's renewed importance in a changing world. Through discussions and highlighted case studies, this book illustrates geography's impact on international trade, environmental change, population growth, information infrastructure, the condition of cities, the spread of AIDS, and much more.
The committee examines some of the more significant tools for data collection, storage, analysis, and display, with examples of major contributions made by geographers.
Rediscovering Geography provides a blueprint for the future of the discipline, recommending how to strengthen its intellectual and institutional foundation and meet the demand for geographic expertise among professionals and the public.
READ FREE ONLINE
Welcome to OpenBook!
You're looking at OpenBook, NAP.edu's online reading room since 1999. Based on feedback from you, our users, we've made some improvements that make it easier than ever to read thousands of publications on our website.
Do you want to take a quick tour of the OpenBook's features?
Show this book's table of contents , where you can jump to any chapter by name.
...or use these buttons to go back to the previous chapter or skip to the next one.
Jump up to the previous page or down to the next one. Also, you can type in a page number and press Enter to go directly to that page in the book.
Switch between the Original Pages , where you can read the report as it appeared in print, and Text Pages for the web version, where you can highlight and search the text.
To search the entire text of this book, type in your search term here and press Enter .
Share a link to this book page on your preferred social network or via email.
View our suggested citation for this chapter.
Ready to take your reading offline? Click here to buy this book in print or download it as a free PDF, if available.
Get Email Updates
Do you enjoy reading reports from the Academies online for free ? Sign up for email notifications and we'll let you know about new publications in your areas of interest when they're released.
- Subject List
- Take a Tour
- For Authors
- Subscriber Services
- Publications
- African American Studies
- African Studies
- American Literature
- Anthropology
- Architecture Planning and Preservation
- Art History
- Atlantic History
- Biblical Studies
- British and Irish Literature
- Childhood Studies
- Chinese Studies
- Cinema and Media Studies
- Communication
- Criminology
- Environmental Science
- Evolutionary Biology
- International Law
- International Relations
- Islamic Studies
- Jewish Studies
- Latin American Studies
- Latino Studies
- Linguistics
- Literary and Critical Theory
- Medieval Studies
- Military History
- Political Science
- Public Health
- Renaissance and Reformation
- Social Work
- Urban Studies
- Victorian Literature
- Browse All Subjects
How to Subscribe
- Free Trials
In This Article Expand or collapse the "in this article" section Photographic and Video Methods in Geography
Introduction, key theoretical works.
- General Overviews
- Visual Surveys and Repeat Photography
- Photo-Elicitation and Interviewing with Photographs
- Collaborative and Participatory Methods
- Creative and Critical Methods
- Interpreting Visual Sources
- Photo and Video in Geography Education
Related Articles Expand or collapse the "related articles" section about
About related articles close popup.
Lorem Ipsum Sit Dolor Amet
Vestibulum ante ipsum primis in faucibus orci luctus et ultrices posuere cubilia Curae; Aliquam ligula odio, euismod ut aliquam et, vestibulum nec risus. Nulla viverra, arcu et iaculis consequat, justo diam ornare tellus, semper ultrices tellus nunc eu tellus.
- Qualitative Methods
- Unoccupied Aircraft Systems
Other Subject Areas
Forthcoming articles expand or collapse the "forthcoming articles" section.
- GeoCapabilities in Geography Education
- Geography Faculty Development
- Urban Greening
- Find more forthcoming articles...
- Export Citations
- Share This Facebook LinkedIn Twitter
Photographic and Video Methods in Geography by Tim Hall LAST REVIEWED: 11 January 2018 LAST MODIFIED: 11 January 2018 DOI: 10.1093/obo/9780199874002-0176
Photographic and video methods (often referred to collectively as visual research methods) have undoubtedly gained increased prominence within many social science disciplines since the 1990s. This has also been true within the literatures of human geography, with a number of geographers having either argued for the significance and contributions of photographic and video methods to the discipline or demonstrated this through their research (see General Overviews ). Photography and video are used as part of the research process either by the researcher or, in the cases of collaborative visual research methods, with or by the populations being researched. Photographs and video are also used within interviews. There is also a long tradition of geographers sourcing and critically interpreting visual texts such as photographs, films, artworks, advertising media, and newspapers and magazines as sources of data within their inquiries (see Interpreting Visual Sources ). The methods employed by geographers have included collaborative and interview approaches (see Photo-Elicitation and Interviewing with Photographs and Collaborative and Participatory Methods ), the construction of realist visual surveys (see Visual Surveys and Repeat Photography ), and the construction of more impressionistic post-structural visual texts (see Creative and Critical Methods ). This recent interest in visual research methods in human geography builds on a long tradition of photography being central to both academic and nonacademic geographic discourses, in the latter cases including those associated with expeditions, colonialism, or tourism (see Interpreting Visual Sources ). However, despite these histories, the critical use of visual research methods has failed to become as central to geographical enquiry as it has to other social sciences, where subdisciplines such as visual sociology and anthropology are supported and promoted through well-established associations such as the International Visual Sociology Association and journals such as Visual Anthropology and Visual Studies . However, the direction of travel within geography is toward the more widespread use of visual research methods, and such methods are becoming more central to human geographers’ methodological and analytical tool kits. These research methods can be deployed in a variety of ways and are particularly suited to the collection of visual evidence of how geographic processes unfold across space and how places change through time. They also allow the active engagement of researchers and their subjects in the production and interpretation of visual representations. These methods encourage reflexive engagement with the research process through the reviewing and selection of photographs and other visual imagery created during the research process, and they justify the use of visual materials within research texts.
Photography, in addition to emerging as an important technology, has been recognized as a key cultural force within modern society, and it has long been the site of reflection for cultural theorists of various stripes. Although many of the pioneering works of photographic theory have been subject to much criticism since their original publication, their influence on shaping critical perspectives on photography across a number of disciplines is undeniable. Students seeking to engage deeply with the issues discussed here, in the contexts of both photography and video, are encouraged to seek out these original theoretical works and to trace their influence on more recent works that are more obviously directly relevant to their own research and practice.
Barthes, Roland. Camera Lucida: Reflections on Photography . Translated by Richard Howard. London: Vintage, 1993.
A deeply personal reflection on the nature of photography, originally published in 1980. Barthes was a philosopher and literary theorist influential across a range of disciplines. Camera Lucida was the culmination of a long interest in photography. Although much criticized since, the book is important for its focus on the viewer and the object of photography, rather than the photographer’s intentions.
Berger, John. Understanding a Photograph . Edited by Geoff Dyer. London: Penguin, 2013.
Berger was a pioneering Marxist art critic who saw visual images as reflective of and active in the reproduction of unequal power relations. Understanding a Photograph collects many of Berger’s essays on photography, some previously unpublished.
Berger, John, and Jean Mohr. Another Way of Telling: A Possible Theory of Photography . London: Bloomsbury, 2016.
Berger’s key work on photography, produced with Jean Mohr, a documentary photographer, and first published in 1982. In probing the essence and meaning of photography, they highlight its ambiguity and the contradictory intentions that photographs embody.
Sontag, Susan. On Photography . London: Penguin, 1979.
One of the most influential discussions of photography ever published. The book talks about the power of photography in terms of aesthetics, memory, and its emotional impacts, and as a form of evidence. The essays, which were originally published separately in the New York Review of Books between 1973 and 1977, span the history of photography and its roles in modern society.
Tagg, John. The Burden of Representation: Essays on Photographies and Histories . Basingstoke, UK: Palgrave Macmillan, 1988.
DOI: 10.1007/978-1-349-19355-4
A book that traces the multiple histories of photography, traditionally not brought together in this way, as a technology, as art, as documentary, and as professional and amateur practices. The perspective from which it is written combines art history and critical theory, grounding the discussion of photography within its social contexts. Tagg has continued to write on the history of photography since the publication of this book.
back to top
Users without a subscription are not able to see the full content on this page. Please subscribe or login .
Oxford Bibliographies Online is available by subscription and perpetual access to institutions. For more information or to contact an Oxford Sales Representative click here .
- About Geography »
- Meet the Editorial Board »
- Abortion, Geographies of
- Accessing and Visualizing Archived Weather and Climate Dat...
- Activity Space
- Actor Network Theory (ANT)
- Age, Geographies of
- Agent-based Modeling
- Agricultural Geography
- Agricultural Meteorology/Climatology
- Animal Geographies
- Anthropocene and Geography, The
- Anthropogenic Climate Change
- Applied Geography
- Arctic Climatology
- Arctic, The
- Art and Geography
- Assessment in Geography Education
- Atmospheric Composition and Structure
- Automobility
- Aviation Meteorology
- Beer, Geography of
- Behavioral and Cognitive Geography
- Belt and Road Initiative
- Biodiversity Conservation
- Biodiversity Gradients
- Biogeography
- Biogeomorphology and Zoogeomorphology
- Biometric Technologies
- Biopedoturbation
- Body, Geographies of the
- Borders and Boundaries
- Brownfields
- Carbon Cycle
- Carceral Geographies
- Cartography
- Cartography, History of
- Cartography, Mapping, and War
- Chicago School
- Children and Childhood, Geographies of
- Citizenship
- Climate Literacy and Education
- Climatology
- Community Mapping
- Comparative Urbanism
- Conservation Biogeography
- Consumption, Geographies of
- Crime Analysis, GIS and
- Crime, Geography of
- Critical GIS
- Critical Historical Geography
- Critical Military Geographies
- Cultural Ecology and Human Ecology
- Cultural Geography
- Cultural Landscape
- Cyberspace, Geography of
- Desertification
- Developing World
- Development, Regional
- Development Theory
- Disability, Geography of
- Disease, Geography of
- Drones, Geography of
- Drugs, Geography of
- Economic Geography
- Economic Historical Geography
- Edge Cities and Urban Sprawl
- Education (K-12), Geography
- El Niño Southern Oscillation (ENSO)
- Elderly, Geography and the
- Electoral Geography
- Empire, Geography and
- Energy, Geographies of
- Energy, Renewable
- Energy Resources and Use
- Environment and Development
- Environmental Electronic Sensing Systems
- Environmental Justice
- Ethics, Geographers and
- Ethics, Geography and
- Ethnography
- Ethnonationalism
- Everyday Life, Geography and
- Extreme Heat
- Family, Geographies of the
- Feminist Geography
- Film, Geography and
- Finance, Geography of
- Financial Geographies of Debt and Crisis
- Fluvial Geomorphology
- Folk Culture and Geography
- Future, Geographies of the
- Gender and Geography
- Gentrification
- Geocomputation in Geography Education
- Geographic Information Science
- Geographic Methods: Archival Research
- Geographic Methods: Discourse Analysis
- Geographic Methods: Interviews
- Geographic Methods: Life Writing Analysis
- Geographic Methods: Visual Analysis
- Geographic Thought (US)
- Geographic Vulnerability to Climate Change
- Geographies of Affect
- Geographies of Diplomacy
- Geographies of Education
- Geographies of Resilience
- Geography and Class
- Geography, Gramsci and
- Geography, Legal
- Geography of Biofuels
- Geography of Food
- Geography of Hunger and Famine
- Geography of Industrialization
- Geography of Public Policy
- Geography of Resources
- Geopolitics
- Geopolitics, Energy and
- Geospatial Artificial Intelligence (GeoAI)
- GIS and Computational Social Sciences
- GIS and Health
- GIS and Remote Sensing Applications in Geomorphology
- GIS and Virtual Reality
- GIS applications in Human Geography
- GIS, Geospatial Technology, and Spatial Thinking in Geogra...
- GIS, Historical
- GIS, History of
- GIS, Space-Time
- Glacial and Periglacial Geomorphology
- Glaciers, Geography of
- Globalization
- Health Care, Geography of
- Hegemony and Geographic Knowledge
- Historical Geography
- Historical Mobilities
- Histories of Protest and Social Movements
- History, Environmental
- Homelessness
- Human Dynamics, GIScience of
- Human Geographies of Outer Space
- Human Trafficking
- Humanistic Geography
- Human-Landscape Interactions
- Humor, Geographies of
- Hydroclimatology and Climate Variability
- Identity and Place
- "Imagining a Better Future through Place": Geographies of ...
- Immigration and Immigrants
- Indigenous Peoples and the Global Indigenous Movement
- Informal Economy
- Innovation, Geography of
- Intelligence, Geographical
- Islands, Human Geography and
- Justice, Geography of
- Knowledge Economy: Spatial Approaches
- Knowledge, Geography of
- Labor, Geography of
- Land Use and Cover Change
- Land-Atmosphere Interactions
- Landscape Interpretation
- Literature, Geography and
- Location Theory
- Marine Biogeography
- Marine Conservation and Fisheries Management
- Media Geography
- Medical Geography
- Migration, International Student
- Military Geographies and the Environment
- Military Geographies of Popular Culture
- Military Geographies of Urban Space and War
- Military Geography
- Moonsoons, Geography of
- Mountain Geography
- Mountain Meteorology
- Music, Sound, and Auditory Culture, Geographies of
- National Assessment of Educational Progress (NAEP) in Geog...
- Nations and Nationalism
- Natural Hazards and Risk
- Nature-Society Theory
- Neogeography
- New Urbanism
- Non-representational Theory
- Nuclear War, Geographies of
- Nutrition Transition, The
- Orientalism and Geography
- Participatory Action Research
- Peace, Geographies of
- Pedagogical Content Knowledge in Geography Education
- Perspectives in Geography Internships
- Phenology and Climate
- Photographic and Video Methods in Geography
- Physical Geography
- Polar Geography
- Policy Mobilities
- Political Ecology
- Political Geography
- Political Geology
- Popular Culture, Geography and
- Population Geography
- Ports and Maritime Trade
- Postcolonialism
- Postmodernism and Poststructuralism
- Pragmatism, Geographies of
- Producer Services
- Psychogeography
- Public Participation GIS, Participatory GIS, and Participa...
- Qualitative GIS
- Quantitative Methods in Human Geography
- Questionnaires
- Race and Racism
- Refugees, Geography of
- Religion, Geographies of
- Retail Trade, Geography of
- Rural Geography
- Science and Technology Studies (STS) in Geography
- Sea-Level Research, Quaternary
- Security and Securitization, Geographies of
- Segregation, Ethnic and Racial
- Service Industries, Geography of
- Settlement Geography
- Sexuality, Geography of
- Slope Processes
- Social Justice
- Social Media Analytics
- Soils, Diversity of
- Sonic Methods in Geography
- Spatial Analysis
- Spatial Autocorrelation
- Sports, Geography of
- Sustainability Education at the School Level, Geography an...
- Sustainability Science
- Sustainable Agriculture
- Synoptic Climatology
- Technological Change, Geography of
- Telecommunications
- Teleconnections, Atmospheric
- Terrestrial Snow, Measurement of
- Territory and Territoriality
- Terrorism, Geography of
- The Climate Security Nexus
- The Voluntary Sector and Geography
- Time, Geographies of
- Time Geography
- Time-Space Compression
- Tourism Geography
- Touristification
- Transnational Corporations
- Urban Geography
- Urban Heritage
- Urban Historical Geography
- Urban Meteorology and Climatology
- Urban Planning and Geography
- Urban Political Ecology
- Urban Sustainability
- Visualizations
- Vulnerability, Risk, and Hazards
- Vulnerability to Climate Change
- War on Terror, Geographies of the
- Weather and Climate Damage Studies
- Whiteness, Geographies of
- Wine, Geography of
- World Cities
- Young People's Geography
- Privacy Policy
- Cookie Policy
- Legal Notice
- Accessibility
Powered by:
- [66.249.64.20|185.66.15.189]
- 185.66.15.189
- Privacy Policy
- Terms and Conditions
- GIS Analysis
- Maps & Cartography
- GIS Software
- GIS Mapping
Why Do Geographers Use Maps? An Exploration of Spatial Representation
- October 2, 2023 March 23, 2023

As human beings, we have always been curious about the world around us. From ancient times, explorers and cartographers have sought to map out the vast and complex terrain of our planet. In this article, we will explore why do geographers use maps and the importance of spatial representation in helping us better understand the world we live in.
Today, geographers continue to use a variety of maps to represent the world, from traditional paper maps to digital representations in Geographic Information Systems (GIS)
Table of Contents
What is Cartography?
Cartography is the science and art of creating maps. It involves the use of geographic data to create accurate and informative representations of the Earth’s surface. Cartographers use a range of tools and techniques to create maps, including surveying, remote sensing , and Geographic Information Systems (GIS).
Why Do Geographers Use Maps?
Geographers use maps to help them better understand the spatial relationships that exist between different regions and features on the Earth’s surface. Maps allow geographers to visualize complex data in a way that is easy to understand, and to identify patterns and trends that might not be immediately apparent when looking at raw data.
Maps are also important for communicating information to others. They are a universal language that can be understood by people from different cultures and backgrounds. Maps can be used to communicate information about the location of resources, the distribution of populations, and the impact of natural disasters, among other things.
Why Do Geographers Use Different Types of Maps?
Geography is a fascinating field that studies the earth’s physical and human features, including its natural resources, topography, and cultures. One of the essential tools used in geography is maps. However, geographers use various types of maps for different purposes. Here are some reasons why geographers use diverse map types:
- To Represent Different Features: Geographers use different maps to represent various features such as political boundaries, topography, weather patterns, population density, and more. For instance, topographic maps show elevation changes, while political maps show governmental boundaries.
- To Emphasize Different Aspects: Depending on the purpose, geographers may emphasize different aspects of a particular region. For example, a tourist map would highlight tourist attractions, while a road map would emphasize transportation networks.
- To Provide Different Perspectives: Different map types provide different perspectives on a particular region. For instance, a satellite map shows a bird’s eye view of an area, while a street map shows a ground-level view.
Why Do Geographers Use Different Map Projections?
Geographers use different map projections because the earth is a three-dimensional object, and it’s challenging to represent it accurately on a two-dimensional map. Map projections are ways of flattening the earth’s surface onto a two-dimensional plane, and each projection has its strengths and weaknesses. For example, some projections accurately represent the shape and size of area, while others preserve the direction of a location from a particular point.
Geographers choose different map projections based on their needs and the purpose of the map. For instance, a geographer creating a map for navigation purposes may choose a Mercator projection, which accurately preserves the direction of a location from a particular point.
In contrast, a geographer creating a map to show the distribution of resources may choose an equal area projection, which accurately represents the size of an area.
Overall, geographers use different map projections to create accurate and useful maps that can help us understand and explore our world.
The Importance of Spatial Representation
One of the key reasons why geographers use maps is that they provide a way to represent spatial relationships in a way that is easy to understand. Spatial representation refers to the process of depicting the Earth’s surface in a way that accurately reflects its physical and cultural features.
Spatial representation is important for a number of reasons. First, it allows us to visualize complex data in a way that is easy to understand. By representing data in the form of a map, we can identify patterns and relationships that might not be immediately apparent when looking at raw data.
Second, spatial representation allows us to communicate information to others in a way that is accessible and easy to understand. Maps are a universal language that can be understood by people from different cultures and backgrounds.
Finally, spatial representation is important because it allows us to better understand our world and our place within it. By studying maps, we can gain a better understanding of the physical and cultural features of different regions, and we can develop a deeper appreciation for the diversity and complexity of our planet.
How Do Geographers Use Maps?
Geographers use maps in a variety of ways, depending on the type of information they are trying to convey. Some common uses of maps in geography include:
1. Planning and Design
Geographers use maps to help plan and design new developments, such as cities, transportation networks, and parks. Maps can be used to identify areas of high population density, natural resources, and potential hazards, among other things.
2. Environmental Analysis
Geographers use maps to analyze the impact of human activity on the environment. Maps can be used to identify areas of deforestation, water pollution, and other environmental issues, and to monitor changes in these areas over time.
3. Disaster Response and Management
Maps are also an important tool for disaster response and management. Geographers use maps to identify areas that are at risk of natural disasters, such as hurricanes, earthquakes, and floods. Maps can also be used to track the spread of diseases and to coordinate emergency response efforts.
4. Navigation and Wayfinding
Maps are also an important tool for navigation and wayfinding. They can be used to plan routes for transportation, to navigate while hiking or driving, and to identify the location of different landmarks and features.
The Role of Geographic Information Systems (GIS)
In recent years, Geographic Information Systems (GIS) have become an increasingly important tool for geographers. GIS refers to a set of software tools that are used to create, analyze, and visualize geographic data.
GIS allows geographers to combine different types of data, such as satellite imagery , topographic maps, and demographic data, to create complex and informative representations of the Earth’s surface. GIS can be used to analyze patterns and trends in data, to identify areas of high population density or natural resources, and to develop maps that can be used for planning and analysis.
GIS is also an important tool for collaboration and communication. By using GIS, geographers can share data and information with others in a way that is accessible and easy to understand. This can help to facilitate collaboration and cooperation among researchers and policymakers, and can lead to more informed decision-making.
In conclusion, maps are an essential tool for geographers, helping them to better understand the spatial relationships that exist between different regions and features on the Earth’s surface. Maps allow geographers to visualize complex data in a way that is easy to understand, and to communicate information to others in a way that is accessible and universal.
FAQs: Why Do Geographers Use Maps?
Why do geographers use maps.
Geographers use maps to visually represent and analyze spatial information. Maps allow geographers to identify patterns and relationships in the distribution of physical and human features across the Earth’s surface.
What are some benefits of using maps in geography?
Maps can help geographers to understand and communicate complex spatial information, make predictions about future trends, and inform decision-making in areas such as urban planning, resource management, and emergency response.
How do geographers create maps?
Geographers use a variety of tools and techniques to create maps, including satellite imagery, geographic information systems (GIS), remote sensing, and surveying.
Leave a Reply Cancel reply
Your email address will not be published. Required fields are marked *
Save my name, email, and website in this browser for the next time I comment.
This site uses Akismet to reduce spam. Learn how your comment data is processed .
- Search Menu
- Browse content in Arts and Humanities
- Browse content in Archaeology
- Anglo-Saxon and Medieval Archaeology
- Archaeological Methodology and Techniques
- Archaeology by Region
- Archaeology of Religion
- Archaeology of Trade and Exchange
- Biblical Archaeology
- Contemporary and Public Archaeology
- Environmental Archaeology
- Historical Archaeology
- History and Theory of Archaeology
- Industrial Archaeology
- Landscape Archaeology
- Mortuary Archaeology
- Prehistoric Archaeology
- Underwater Archaeology
- Urban Archaeology
- Zooarchaeology
- Browse content in Architecture
- Architectural Structure and Design
- History of Architecture
- Residential and Domestic Buildings
- Theory of Architecture
- Browse content in Art
- Art Subjects and Themes
- History of Art
- Industrial and Commercial Art
- Theory of Art
- Biographical Studies
- Byzantine Studies
- Browse content in Classical Studies
- Classical History
- Classical Philosophy
- Classical Mythology
- Classical Literature
- Classical Reception
- Classical Art and Architecture
- Classical Oratory and Rhetoric
- Greek and Roman Papyrology
- Greek and Roman Epigraphy
- Greek and Roman Law
- Greek and Roman Archaeology
- Late Antiquity
- Religion in the Ancient World
- Digital Humanities
- Browse content in History
- Colonialism and Imperialism
- Diplomatic History
- Environmental History
- Genealogy, Heraldry, Names, and Honours
- Genocide and Ethnic Cleansing
- Historical Geography
- History by Period
- History of Emotions
- History of Agriculture
- History of Education
- History of Gender and Sexuality
- Industrial History
- Intellectual History
- International History
- Labour History
- Legal and Constitutional History
- Local and Family History
- Maritime History
- Military History
- National Liberation and Post-Colonialism
- Oral History
- Political History
- Public History
- Regional and National History
- Revolutions and Rebellions
- Slavery and Abolition of Slavery
- Social and Cultural History
- Theory, Methods, and Historiography
- Urban History
- World History
- Browse content in Language Teaching and Learning
- Language Learning (Specific Skills)
- Language Teaching Theory and Methods
- Browse content in Linguistics
- Applied Linguistics
- Cognitive Linguistics
- Computational Linguistics
- Forensic Linguistics
- Grammar, Syntax and Morphology
- Historical and Diachronic Linguistics
- History of English
- Language Evolution
- Language Reference
- Language Acquisition
- Language Variation
- Language Families
- Lexicography
- Linguistic Anthropology
- Linguistic Theories
- Linguistic Typology
- Phonetics and Phonology
- Psycholinguistics
- Sociolinguistics
- Translation and Interpretation
- Writing Systems
- Browse content in Literature
- Bibliography
- Children's Literature Studies
- Literary Studies (Romanticism)
- Literary Studies (American)
- Literary Studies (Asian)
- Literary Studies (European)
- Literary Studies (Eco-criticism)
- Literary Studies (Modernism)
- Literary Studies - World
- Literary Studies (1500 to 1800)
- Literary Studies (19th Century)
- Literary Studies (20th Century onwards)
- Literary Studies (African American Literature)
- Literary Studies (British and Irish)
- Literary Studies (Early and Medieval)
- Literary Studies (Fiction, Novelists, and Prose Writers)
- Literary Studies (Gender Studies)
- Literary Studies (Graphic Novels)
- Literary Studies (History of the Book)
- Literary Studies (Plays and Playwrights)
- Literary Studies (Poetry and Poets)
- Literary Studies (Postcolonial Literature)
- Literary Studies (Queer Studies)
- Literary Studies (Science Fiction)
- Literary Studies (Travel Literature)
- Literary Studies (War Literature)
- Literary Studies (Women's Writing)
- Literary Theory and Cultural Studies
- Mythology and Folklore
- Shakespeare Studies and Criticism
- Browse content in Media Studies
- Browse content in Music
- Applied Music
- Dance and Music
- Ethics in Music
- Ethnomusicology
- Gender and Sexuality in Music
- Medicine and Music
- Music Cultures
- Music and Media
- Music and Religion
- Music and Culture
- Music Education and Pedagogy
- Music Theory and Analysis
- Musical Scores, Lyrics, and Libretti
- Musical Structures, Styles, and Techniques
- Musicology and Music History
- Performance Practice and Studies
- Race and Ethnicity in Music
- Sound Studies
- Browse content in Performing Arts
- Browse content in Philosophy
- Aesthetics and Philosophy of Art
- Epistemology
- Feminist Philosophy
- History of Western Philosophy
- Metaphysics
- Moral Philosophy
- Non-Western Philosophy
- Philosophy of Language
- Philosophy of Mind
- Philosophy of Perception
- Philosophy of Science
- Philosophy of Action
- Philosophy of Law
- Philosophy of Religion
- Philosophy of Mathematics and Logic
- Practical Ethics
- Social and Political Philosophy
- Browse content in Religion
- Biblical Studies
- Christianity
- East Asian Religions
- History of Religion
- Judaism and Jewish Studies
- Qumran Studies
- Religion and Education
- Religion and Health
- Religion and Politics
- Religion and Science
- Religion and Law
- Religion and Art, Literature, and Music
- Religious Studies
- Browse content in Society and Culture
- Cookery, Food, and Drink
- Cultural Studies
- Customs and Traditions
- Ethical Issues and Debates
- Hobbies, Games, Arts and Crafts
- Lifestyle, Home, and Garden
- Natural world, Country Life, and Pets
- Popular Beliefs and Controversial Knowledge
- Sports and Outdoor Recreation
- Technology and Society
- Travel and Holiday
- Visual Culture
- Browse content in Law
- Arbitration
- Browse content in Company and Commercial Law
- Commercial Law
- Company Law
- Browse content in Comparative Law
- Systems of Law
- Competition Law
- Browse content in Constitutional and Administrative Law
- Government Powers
- Judicial Review
- Local Government Law
- Military and Defence Law
- Parliamentary and Legislative Practice
- Construction Law
- Contract Law
- Browse content in Criminal Law
- Criminal Procedure
- Criminal Evidence Law
- Sentencing and Punishment
- Employment and Labour Law
- Environment and Energy Law
- Browse content in Financial Law
- Banking Law
- Insolvency Law
- History of Law
- Human Rights and Immigration
- Intellectual Property Law
- Browse content in International Law
- Private International Law and Conflict of Laws
- Public International Law
- IT and Communications Law
- Jurisprudence and Philosophy of Law
- Law and Politics
- Law and Society
- Browse content in Legal System and Practice
- Courts and Procedure
- Legal Skills and Practice
- Primary Sources of Law
- Regulation of Legal Profession
- Medical and Healthcare Law
- Browse content in Policing
- Criminal Investigation and Detection
- Police and Security Services
- Police Procedure and Law
- Police Regional Planning
- Browse content in Property Law
- Personal Property Law
- Study and Revision
- Terrorism and National Security Law
- Browse content in Trusts Law
- Wills and Probate or Succession
- Browse content in Medicine and Health
- Browse content in Allied Health Professions
- Arts Therapies
- Clinical Science
- Dietetics and Nutrition
- Occupational Therapy
- Operating Department Practice
- Physiotherapy
- Radiography
- Speech and Language Therapy
- Browse content in Anaesthetics
- General Anaesthesia
- Neuroanaesthesia
- Clinical Neuroscience
- Browse content in Clinical Medicine
- Acute Medicine
- Cardiovascular Medicine
- Clinical Genetics
- Clinical Pharmacology and Therapeutics
- Dermatology
- Endocrinology and Diabetes
- Gastroenterology
- Genito-urinary Medicine
- Geriatric Medicine
- Infectious Diseases
- Medical Toxicology
- Medical Oncology
- Pain Medicine
- Palliative Medicine
- Rehabilitation Medicine
- Respiratory Medicine and Pulmonology
- Rheumatology
- Sleep Medicine
- Sports and Exercise Medicine
- Community Medical Services
- Critical Care
- Emergency Medicine
- Forensic Medicine
- Haematology
- History of Medicine
- Browse content in Medical Skills
- Clinical Skills
- Communication Skills
- Nursing Skills
- Surgical Skills
- Browse content in Medical Dentistry
- Oral and Maxillofacial Surgery
- Paediatric Dentistry
- Restorative Dentistry and Orthodontics
- Surgical Dentistry
- Medical Ethics
- Medical Statistics and Methodology
- Browse content in Neurology
- Clinical Neurophysiology
- Neuropathology
- Nursing Studies
- Browse content in Obstetrics and Gynaecology
- Gynaecology
- Occupational Medicine
- Ophthalmology
- Otolaryngology (ENT)
- Browse content in Paediatrics
- Neonatology
- Browse content in Pathology
- Chemical Pathology
- Clinical Cytogenetics and Molecular Genetics
- Histopathology
- Medical Microbiology and Virology
- Patient Education and Information
- Browse content in Pharmacology
- Psychopharmacology
- Browse content in Popular Health
- Caring for Others
- Complementary and Alternative Medicine
- Self-help and Personal Development
- Browse content in Preclinical Medicine
- Cell Biology
- Molecular Biology and Genetics
- Reproduction, Growth and Development
- Primary Care
- Professional Development in Medicine
- Browse content in Psychiatry
- Addiction Medicine
- Child and Adolescent Psychiatry
- Forensic Psychiatry
- Learning Disabilities
- Old Age Psychiatry
- Psychotherapy
- Browse content in Public Health and Epidemiology
- Epidemiology
- Public Health
- Browse content in Radiology
- Clinical Radiology
- Interventional Radiology
- Nuclear Medicine
- Radiation Oncology
- Reproductive Medicine
- Browse content in Surgery
- Cardiothoracic Surgery
- Gastro-intestinal and Colorectal Surgery
- General Surgery
- Neurosurgery
- Paediatric Surgery
- Peri-operative Care
- Plastic and Reconstructive Surgery
- Surgical Oncology
- Transplant Surgery
- Trauma and Orthopaedic Surgery
- Vascular Surgery
- Browse content in Science and Mathematics
- Browse content in Biological Sciences
- Aquatic Biology
- Biochemistry
- Bioinformatics and Computational Biology
- Developmental Biology
- Ecology and Conservation
- Evolutionary Biology
- Genetics and Genomics
- Microbiology
- Molecular and Cell Biology
- Natural History
- Plant Sciences and Forestry
- Research Methods in Life Sciences
- Structural Biology
- Systems Biology
- Zoology and Animal Sciences
- Browse content in Chemistry
- Analytical Chemistry
- Computational Chemistry
- Crystallography
- Environmental Chemistry
- Industrial Chemistry
- Inorganic Chemistry
- Materials Chemistry
- Medicinal Chemistry
- Mineralogy and Gems
- Organic Chemistry
- Physical Chemistry
- Polymer Chemistry
- Study and Communication Skills in Chemistry
- Theoretical Chemistry
- Browse content in Computer Science
- Artificial Intelligence
- Computer Architecture and Logic Design
- Game Studies
- Human-Computer Interaction
- Mathematical Theory of Computation
- Programming Languages
- Software Engineering
- Systems Analysis and Design
- Virtual Reality
- Browse content in Computing
- Business Applications
- Computer Security
- Computer Games
- Computer Networking and Communications
- Digital Lifestyle
- Graphical and Digital Media Applications
- Operating Systems
- Browse content in Earth Sciences and Geography
- Atmospheric Sciences
- Environmental Geography
- Geology and the Lithosphere
- Maps and Map-making
- Meteorology and Climatology
- Oceanography and Hydrology
- Palaeontology
- Physical Geography and Topography
- Regional Geography
- Soil Science
- Urban Geography
- Browse content in Engineering and Technology
- Agriculture and Farming
- Biological Engineering
- Civil Engineering, Surveying, and Building
- Electronics and Communications Engineering
- Energy Technology
- Engineering (General)
- Environmental Science, Engineering, and Technology
- History of Engineering and Technology
- Mechanical Engineering and Materials
- Technology of Industrial Chemistry
- Transport Technology and Trades
- Browse content in Environmental Science
- Applied Ecology (Environmental Science)
- Conservation of the Environment (Environmental Science)
- Environmental Sustainability
- Environmentalist Thought and Ideology (Environmental Science)
- Management of Land and Natural Resources (Environmental Science)
- Natural Disasters (Environmental Science)
- Nuclear Issues (Environmental Science)
- Pollution and Threats to the Environment (Environmental Science)
- Social Impact of Environmental Issues (Environmental Science)
- History of Science and Technology
- Browse content in Materials Science
- Ceramics and Glasses
- Composite Materials
- Metals, Alloying, and Corrosion
- Nanotechnology
- Browse content in Mathematics
- Applied Mathematics
- Biomathematics and Statistics
- History of Mathematics
- Mathematical Education
- Mathematical Finance
- Mathematical Analysis
- Numerical and Computational Mathematics
- Probability and Statistics
- Pure Mathematics
- Browse content in Neuroscience
- Cognition and Behavioural Neuroscience
- Development of the Nervous System
- Disorders of the Nervous System
- History of Neuroscience
- Invertebrate Neurobiology
- Molecular and Cellular Systems
- Neuroendocrinology and Autonomic Nervous System
- Neuroscientific Techniques
- Sensory and Motor Systems
- Browse content in Physics
- Astronomy and Astrophysics
- Atomic, Molecular, and Optical Physics
- Biological and Medical Physics
- Classical Mechanics
- Computational Physics
- Condensed Matter Physics
- Electromagnetism, Optics, and Acoustics
- History of Physics
- Mathematical and Statistical Physics
- Measurement Science
- Nuclear Physics
- Particles and Fields
- Plasma Physics
- Quantum Physics
- Relativity and Gravitation
- Semiconductor and Mesoscopic Physics
- Browse content in Psychology
- Affective Sciences
- Clinical Psychology
- Cognitive Psychology
- Cognitive Neuroscience
- Criminal and Forensic Psychology
- Developmental Psychology
- Educational Psychology
- Evolutionary Psychology
- Health Psychology
- History and Systems in Psychology
- Music Psychology
- Neuropsychology
- Organizational Psychology
- Psychological Assessment and Testing
- Psychology of Human-Technology Interaction
- Psychology Professional Development and Training
- Research Methods in Psychology
- Social Psychology
- Browse content in Social Sciences
- Browse content in Anthropology
- Anthropology of Religion
- Human Evolution
- Medical Anthropology
- Physical Anthropology
- Regional Anthropology
- Social and Cultural Anthropology
- Theory and Practice of Anthropology
- Browse content in Business and Management
- Business Ethics
- Business Strategy
- Business History
- Business and Technology
- Business and Government
- Business and the Environment
- Comparative Management
- Corporate Governance
- Corporate Social Responsibility
- Entrepreneurship
- Health Management
- Human Resource Management
- Industrial and Employment Relations
- Industry Studies
- Information and Communication Technologies
- International Business
- Knowledge Management
- Management and Management Techniques
- Operations Management
- Organizational Theory and Behaviour
- Pensions and Pension Management
- Public and Nonprofit Management
- Strategic Management
- Supply Chain Management
- Browse content in Criminology and Criminal Justice
- Criminal Justice
- Criminology
- Forms of Crime
- International and Comparative Criminology
- Youth Violence and Juvenile Justice
- Development Studies
- Browse content in Economics
- Agricultural, Environmental, and Natural Resource Economics
- Asian Economics
- Behavioural Finance
- Behavioural Economics and Neuroeconomics
- Econometrics and Mathematical Economics
- Economic History
- Economic Systems
- Economic Methodology
- Economic Development and Growth
- Financial Markets
- Financial Institutions and Services
- General Economics and Teaching
- Health, Education, and Welfare
- History of Economic Thought
- International Economics
- Labour and Demographic Economics
- Law and Economics
- Macroeconomics and Monetary Economics
- Microeconomics
- Public Economics
- Urban, Rural, and Regional Economics
- Welfare Economics
- Browse content in Education
- Adult Education and Continuous Learning
- Care and Counselling of Students
- Early Childhood and Elementary Education
- Educational Equipment and Technology
- Educational Strategies and Policy
- Higher and Further Education
- Organization and Management of Education
- Philosophy and Theory of Education
- Schools Studies
- Secondary Education
- Teaching of a Specific Subject
- Teaching of Specific Groups and Special Educational Needs
- Teaching Skills and Techniques
- Browse content in Environment
- Applied Ecology (Social Science)
- Climate Change
- Conservation of the Environment (Social Science)
- Environmentalist Thought and Ideology (Social Science)
- Natural Disasters (Environment)
- Social Impact of Environmental Issues (Social Science)
- Browse content in Human Geography
- Cultural Geography
- Economic Geography
- Political Geography
- Browse content in Interdisciplinary Studies
- Communication Studies
- Museums, Libraries, and Information Sciences
- Browse content in Politics
- African Politics
- Asian Politics
- Chinese Politics
- Comparative Politics
- Conflict Politics
- Elections and Electoral Studies
- Environmental Politics
- European Union
- Foreign Policy
- Gender and Politics
- Human Rights and Politics
- Indian Politics
- International Relations
- International Organization (Politics)
- International Political Economy
- Irish Politics
- Latin American Politics
- Middle Eastern Politics
- Political Behaviour
- Political Economy
- Political Institutions
- Political Methodology
- Political Communication
- Political Philosophy
- Political Sociology
- Political Theory
- Politics and Law
- Public Policy
- Public Administration
- Quantitative Political Methodology
- Regional Political Studies
- Russian Politics
- Security Studies
- State and Local Government
- UK Politics
- US Politics
- Browse content in Regional and Area Studies
- African Studies
- Asian Studies
- East Asian Studies
- Japanese Studies
- Latin American Studies
- Middle Eastern Studies
- Native American Studies
- Scottish Studies
- Browse content in Research and Information
- Research Methods
- Browse content in Social Work
- Addictions and Substance Misuse
- Adoption and Fostering
- Care of the Elderly
- Child and Adolescent Social Work
- Couple and Family Social Work
- Developmental and Physical Disabilities Social Work
- Direct Practice and Clinical Social Work
- Emergency Services
- Human Behaviour and the Social Environment
- International and Global Issues in Social Work
- Mental and Behavioural Health
- Social Justice and Human Rights
- Social Policy and Advocacy
- Social Work and Crime and Justice
- Social Work Macro Practice
- Social Work Practice Settings
- Social Work Research and Evidence-based Practice
- Welfare and Benefit Systems
- Browse content in Sociology
- Childhood Studies
- Community Development
- Comparative and Historical Sociology
- Economic Sociology
- Gender and Sexuality
- Gerontology and Ageing
- Health, Illness, and Medicine
- Marriage and the Family
- Migration Studies
- Occupations, Professions, and Work
- Organizations
- Population and Demography
- Race and Ethnicity
- Social Theory
- Social Movements and Social Change
- Social Research and Statistics
- Social Stratification, Inequality, and Mobility
- Sociology of Religion
- Sociology of Education
- Sport and Leisure
- Urban and Rural Studies
- Browse content in Warfare and Defence
- Defence Strategy, Planning, and Research
- Land Forces and Warfare
- Military Administration
- Military Life and Institutions
- Naval Forces and Warfare
- Other Warfare and Defence Issues
- Peace Studies and Conflict Resolution
- Weapons and Equipment

- < Previous chapter
- Next chapter >
5 On the Function of Visual Representation
- Published: April 1996
- Cite Icon Cite
- Permissions Icon Permissions
The advent of the computer age enabled significant developments in the study of visual representation, particularly in the emergence of computational theories which are able to make sense of the large volume of data collected. This background leads into a discussion of the “Literalist View,” which explains the phenomenon of perception as the product of similar logical computations by the brain to reconcile visual stimuli with existing mental “retinotopic structures,” which are assumed to be truthful representations of our world. The chapter then cites several works—namely, that of Churchland, Grimes, and the Nina experiments—that discuss the loopholes in the theory. An alternative, non-Literalist theory is then offered—the “Functional View”—which provides a different insight into how the brain interprets visual stimuli. Specifically, it is posited that there is evidence of selective visual representation, dependent on the importance of the visual stimuli to the particular individual.
Signed in as
Institutional accounts.
- GoogleCrawler [DO NOT DELETE]
- Google Scholar Indexing
Personal account
- Sign in with email/username & password
- Get email alerts
- Save searches
- Purchase content
- Activate your purchase/trial code
Institutional access
- Sign in with a library card Sign in with username/password Recommend to your librarian
- Institutional account management
- Get help with access
Access to content on Oxford Academic is often provided through institutional subscriptions and purchases. If you are a member of an institution with an active account, you may be able to access content in one of the following ways:
IP based access
Typically, access is provided across an institutional network to a range of IP addresses. This authentication occurs automatically, and it is not possible to sign out of an IP authenticated account.
Sign in through your institution
Choose this option to get remote access when outside your institution. Shibboleth/Open Athens technology is used to provide single sign-on between your institution’s website and Oxford Academic.
- Click Sign in through your institution.
- Select your institution from the list provided, which will take you to your institution's website to sign in.
- When on the institution site, please use the credentials provided by your institution. Do not use an Oxford Academic personal account.
- Following successful sign in, you will be returned to Oxford Academic.
If your institution is not listed or you cannot sign in to your institution’s website, please contact your librarian or administrator.
Sign in with a library card
Enter your library card number to sign in. If you cannot sign in, please contact your librarian.
Society Members
Society member access to a journal is achieved in one of the following ways:
Sign in through society site
Many societies offer single sign-on between the society website and Oxford Academic. If you see ‘Sign in through society site’ in the sign in pane within a journal:
- Click Sign in through society site.
- When on the society site, please use the credentials provided by that society. Do not use an Oxford Academic personal account.
If you do not have a society account or have forgotten your username or password, please contact your society.
Sign in using a personal account
Some societies use Oxford Academic personal accounts to provide access to their members. See below.
A personal account can be used to get email alerts, save searches, purchase content, and activate subscriptions.
Some societies use Oxford Academic personal accounts to provide access to their members.
Viewing your signed in accounts
Click the account icon in the top right to:
- View your signed in personal account and access account management features.
- View the institutional accounts that are providing access.
Signed in but can't access content
Oxford Academic is home to a wide variety of products. The institutional subscription may not cover the content that you are trying to access. If you believe you should have access to that content, please contact your librarian.
For librarians and administrators, your personal account also provides access to institutional account management. Here you will find options to view and activate subscriptions, manage institutional settings and access options, access usage statistics, and more.
Our books are available by subscription or purchase to libraries and institutions.
- About Oxford Academic
- Publish journals with us
- University press partners
- What we publish
- New features
- Open access
- Rights and permissions
- Accessibility
- Advertising
- Media enquiries
- Oxford University Press
- Oxford Languages
- University of Oxford
Oxford University Press is a department of the University of Oxford. It furthers the University's objective of excellence in research, scholarship, and education by publishing worldwide
- Copyright © 2024 Oxford University Press
- Cookie settings
- Cookie policy
- Privacy policy
- Legal notice
This Feature Is Available To Subscribers Only
Sign In or Create an Account
This PDF is available to Subscribers Only
For full access to this pdf, sign in to an existing account, or purchase an annual subscription.
IMAGES
VIDEO
COMMENTS
This article brings together texts that have a focus on analyzing visual representations, visual technologies, and the acts of viewing and of producing visual media, highlighting the differences between methodologies used and the theoretical work they are informed by or most linked with. ... An important turning point for visual analysis is the ...
Introduction. Geography has always been a visual discipline, unique in "the way it has relied and continues to rely on certain kinds of visualities and visual images to construct its knowledges" (Citation Rose 2003, p212).This project grew out of an interest in how we represent the world visually, as well as exploring the effectiveness of visualisation to enable students to investigate and ...
The importance of spatial representation as a third dimension of geography's perspectives (see Figure 3.1) is perhaps best exemplified by the long and close association of cartography with geography (see Chapter 4). Research emphasizing spatial representation complements, underpins, and sometimes drives research in other branches of geography ...
Reading and interpreting maps. Maps are one of the geographer's key tools for representing and explaining spatial information, patterns and processes. Reading and interpreting maps is thus central to geographical education. To effectively read maps, students need to develop a range of interrelated skills: locational skills - using grid ...
The use of visual representations (i.e., photographs, diagrams, models) has been part of science, and their use makes it possible for scientists to interact with and represent complex phenomena, not observable in other ways. Despite a wealth of research in science education on visual representations, the emphasis of such research has mainly been on the conceptual understanding when using ...
The main uses of photographs in geography lessons are to: Teach photo interpretation skills. To help students to find out about people, places and geographical features. To encourage students to explore their own values and attitudes about people and places. Be a stimulus for geographical enquiry.
Evaluating the efficacy of sampling designs is an important topic of research in geography and an important aspect of applying geography's techniques. ... can be defined as "the use of concrete visual representations . . . to make spatial contexts and problems visible, so as to engage the most powerful human information processing abilities ...
Abstract. This paper forwards a hauntological approach to the study of visual images in human geography, providing a nuanced understanding of what images can do: their power, meanings, and our responses to them. Like ghosts, visual images have an undecidable, 'in-between' status, haunting between material and immaterial, real and virtual.
In this report, the map is defined as 'a representation or abstraction of geographical reality: a tool for presenting geographical information in a way that is visual, digital, or tactile'. Clearly, the map was seen at this time as a communication tool (technology) that includes multimodal ways of representation (art), without any explicit ...
Introduction. Photographic and video methods (often referred to collectively as visual research methods) have undoubtedly gained increased prominence within many social science disciplines since the 1990s. This has also been true within the literatures of human geography, with a number of geographers having either argued for the significance ...
This commentary engages with Gonin et al. in terms of how their novel concept of terrestrial territory can be read through the importance of representations: visual, linguistic, and otherwise. This supports their effort to reframe and address the challenges of the Anthropocene.
Visual literacy in geography also requires spatial thinking, as the visual representations of reality using symbols are linked to geographical axioms such as spatial location, spatial ...
The Importance of Spatial Representation. One of the key reasons why geographers use maps is that they provide a way to represent spatial relationships in a way that is easy to understand. Spatial representation refers to the process of depicting the Earth's surface in a way that accurately reflects its physical and cultural features.
Fig. 1.Example drawings by learners. Panel (a) shows a drawing created by a learner after reading about the law of action and reaction in swimming (Schmidgall et al., 2019).Panel (b) shows a drawing by a physics student asked to invent a three-dimensional depiction of a quantum-mechanical wave function they had previously encountered only in one-dimensional and two-dimensional depictions ...
Visu al information plays a fundamental role in our understanding, more than any other form of information (Colin, 2012). Colin (2012: 2) defines. visualisation as "a graphica l representation ...
Visual representations include maps, photographs, posters and films. Oral and aural representations include music, film soundtracks and audio recordings, as well as the stories we tell about the relationships between people and places. The boundaries between these different forms of representation are fluid—films combine visual and aural ...
The Importance of Visual Literacy for a. Changing Geography. Anna de Jager. Department of Geography. University of South Africa, Science Campus, Florida, South Africa. [email protected]. The ...
GRAPHIC REPRESENTATION IN GEOGRAPHY. I. GEOGRAPHY as taught in the schools today, and as presented. in our modern text-books, is almost a new subject. One of the. features of the so-called new geography is the prominence given. to relief and to the various landscape forms. The surface of. the land - that is, the relation of high lands to low ...
regional geography is particularly important and the importance of visual representation increases throughout the school years : in textbooks for lo wer secondary schools, less than tw o - thirds ...
2.1. Communication challenges and use of visual representations. Studies on communication in geographically distributed NPD projects have received attention among scholars as well as practitioners because of the increased globalisation in manufacturing industries (e.g. Eris, Martelaro, and Badke-Schaub Citation 2014).Geographical distribution is associated with actors residing in different ...
In mathematics and science education, learners need to have the ability to work with both symbolic and visual representations (e.g., equations and diagrams) and to relate them to each other in ...
Despite the notable number of publications on the benefits of using visual representations in a variety of fields (Meyer, Höllerer, Jancsary, & Van Leeuwen, 2013), few studies have systematically investigated the possible pitfalls that exist when creating or interpreting visual representations.Some information visualization researchers, however, have raised the issue and called to action ...
Sarah Pink argues for an "anthropology of the relationship between the visual and other elements of culture, society, practice and experience and the methodological practice of combining visual and other media in the production and representation of anthropological knowledge" (2006, 144). Her focus is on the visual as data collection.
An alternative, non-Literalist theory is then offered—the "Functional View"—which provides a different insight into how the brain interprets visual stimuli. Specifically, it is posited that there is evidence of selective visual representation, dependent on the importance of the visual stimuli to the particular individual.