- Privacy Policy
Home » Secondary Data – Types, Methods and Examples

Secondary Data – Types, Methods and Examples
Table of Contents

Secondary Data
Definition:
Secondary data refers to information that has been collected, processed, and published by someone else, rather than the researcher gathering the data firsthand. This can include data from sources such as government publications, academic journals, market research reports, and other existing datasets.
Secondary Data Types
Types of secondary data are as follows:
- Published data: Published data refers to data that has been published in books, magazines, newspapers, and other print media. Examples include statistical reports, market research reports, and scholarly articles.
- Government data: Government data refers to data collected by government agencies and departments. This can include data on demographics, economic trends, crime rates, and health statistics.
- Commercial data: Commercial data is data collected by businesses for their own purposes. This can include sales data, customer feedback, and market research data.
- Academic data: Academic data refers to data collected by researchers for academic purposes. This can include data from experiments, surveys, and observational studies.
- Online data: Online data refers to data that is available on the internet. This can include social media posts, website analytics, and online customer reviews.
- Organizational data: Organizational data is data collected by businesses or organizations for their own purposes. This can include data on employee performance, financial records, and customer satisfaction.
- Historical data : Historical data refers to data that was collected in the past and is still available for research purposes. This can include census data, historical documents, and archival records.
- International data: International data refers to data collected from other countries for research purposes. This can include data on international trade, health statistics, and demographic trends.
- Public data : Public data refers to data that is available to the general public. This can include data from government agencies, non-profit organizations, and other sources.
- Private data: Private data refers to data that is not available to the general public. This can include confidential business data, personal medical records, and financial data.
- Big data: Big data refers to large, complex datasets that are difficult to manage and analyze using traditional data processing methods. This can include social media data, sensor data, and other types of data generated by digital devices.
Secondary Data Collection Methods
Secondary Data Collection Methods are as follows:
- Published sources: Researchers can gather secondary data from published sources such as books, journals, reports, and newspapers. These sources often provide comprehensive information on a variety of topics.
- Online sources: With the growth of the internet, researchers can now access a vast amount of secondary data online. This includes websites, databases, and online archives.
- Government sources : Government agencies often collect and publish a wide range of secondary data on topics such as demographics, crime rates, and health statistics. Researchers can obtain this data through government websites, publications, or data portals.
- Commercial sources: Businesses often collect and analyze data for marketing research or customer profiling. Researchers can obtain this data through commercial data providers or by purchasing market research reports.
- Academic sources: Researchers can also obtain secondary data from academic sources such as published research studies, academic journals, and dissertations.
- Personal contacts: Researchers can also obtain secondary data from personal contacts, such as experts in a particular field or individuals with specialized knowledge.
Secondary Data Formats
Secondary data can come in various formats depending on the source from which it is obtained. Here are some common formats of secondary data:
- Numeric Data: Numeric data is often in the form of statistics and numerical figures that have been compiled and reported by organizations such as government agencies, research institutions, and commercial enterprises. This can include data such as population figures, GDP, sales figures, and market share.
- Textual Data: Textual data is often in the form of written documents, such as reports, articles, and books. This can include qualitative data such as descriptions, opinions, and narratives.
- Audiovisual Data : Audiovisual data is often in the form of recordings, videos, and photographs. This can include data such as interviews, focus group discussions, and other types of qualitative data.
- Geospatial Data: Geospatial data is often in the form of maps, satellite images, and geographic information systems (GIS) data. This can include data such as demographic information, land use patterns, and transportation networks.
- Transactional Data : Transactional data is often in the form of digital records of financial and business transactions. This can include data such as purchase histories, customer behavior, and financial transactions.
- Social Media Data: Social media data is often in the form of user-generated content from social media platforms such as Facebook, Twitter, and Instagram. This can include data such as user demographics, content trends, and sentiment analysis.
Secondary Data Analysis Methods
Secondary data analysis involves the use of pre-existing data for research purposes. Here are some common methods of secondary data analysis:
- Descriptive Analysis: This method involves describing the characteristics of a dataset, such as the mean, standard deviation, and range of the data. Descriptive analysis can be used to summarize data and provide an overview of trends.
- Inferential Analysis: This method involves making inferences and drawing conclusions about a population based on a sample of data. Inferential analysis can be used to test hypotheses and determine the statistical significance of relationships between variables.
- Content Analysis: This method involves analyzing textual or visual data to identify patterns and themes. Content analysis can be used to study the content of documents, media coverage, and social media posts.
- Time-Series Analysis : This method involves analyzing data over time to identify trends and patterns. Time-series analysis can be used to study economic trends, climate change, and other phenomena that change over time.
- Spatial Analysis : This method involves analyzing data in relation to geographic location. Spatial analysis can be used to study patterns of disease spread, land use patterns, and the effects of environmental factors on health outcomes.
- Meta-Analysis: This method involves combining data from multiple studies to draw conclusions about a particular phenomenon. Meta-analysis can be used to synthesize the results of previous research and provide a more comprehensive understanding of a particular topic.
Secondary Data Gathering Guide
Here are some steps to follow when gathering secondary data:
- Define your research question: Start by defining your research question and identifying the specific information you need to answer it. This will help you identify the type of secondary data you need and where to find it.
- Identify relevant sources: Identify potential sources of secondary data, including published sources, online databases, government sources, and commercial data providers. Consider the reliability and validity of each source.
- Evaluate the quality of the data: Evaluate the quality and reliability of the data you plan to use. Consider the data collection methods, sample size, and potential biases. Make sure the data is relevant to your research question and is suitable for the type of analysis you plan to conduct.
- Collect the data: Collect the relevant data from the identified sources. Use a consistent method to record and organize the data to make analysis easier.
- Validate the data: Validate the data to ensure that it is accurate and reliable. Check for inconsistencies, missing data, and errors. Address any issues before analyzing the data.
- Analyze the data: Analyze the data using appropriate statistical and analytical methods. Use descriptive and inferential statistics to summarize and draw conclusions from the data.
- Interpret the results: Interpret the results of your analysis and draw conclusions based on the data. Make sure your conclusions are supported by the data and are relevant to your research question.
- Communicate the findings : Communicate your findings clearly and concisely. Use appropriate visual aids such as graphs and charts to help explain your results.
Examples of Secondary Data
Here are some examples of secondary data from different fields:
- Healthcare : Hospital records, medical journals, clinical trial data, and disease registries are examples of secondary data sources in healthcare. These sources can provide researchers with information on patient demographics, disease prevalence, and treatment outcomes.
- Marketing : Market research reports, customer surveys, and sales data are examples of secondary data sources in marketing. These sources can provide marketers with information on consumer preferences, market trends, and competitor activity.
- Education : Student test scores, graduation rates, and enrollment statistics are examples of secondary data sources in education. These sources can provide researchers with information on student achievement, teacher effectiveness, and educational disparities.
- Finance : Stock market data, financial statements, and credit reports are examples of secondary data sources in finance. These sources can provide investors with information on market trends, company performance, and creditworthiness.
- Social Science : Government statistics, census data, and survey data are examples of secondary data sources in social science. These sources can provide researchers with information on population demographics, social trends, and political attitudes.
- Environmental Science : Climate data, remote sensing data, and ecological monitoring data are examples of secondary data sources in environmental science. These sources can provide researchers with information on weather patterns, land use, and biodiversity.
Purpose of Secondary Data
The purpose of secondary data is to provide researchers with information that has already been collected by others for other purposes. Secondary data can be used to support research questions, test hypotheses, and answer research objectives. Some of the key purposes of secondary data are:
- To gain a better understanding of the research topic : Secondary data can be used to provide context and background information on a research topic. This can help researchers understand the historical and social context of their research and gain insights into relevant variables and relationships.
- To save time and resources: Collecting new primary data can be time-consuming and expensive. Using existing secondary data sources can save researchers time and resources by providing access to pre-existing data that has already been collected and organized.
- To provide comparative data : Secondary data can be used to compare and contrast findings across different studies or datasets. This can help researchers identify trends, patterns, and relationships that may not have been apparent from individual studies.
- To support triangulation: Triangulation is the process of using multiple sources of data to confirm or refute research findings. Secondary data can be used to support triangulation by providing additional sources of data to support or refute primary research findings.
- To supplement primary data : Secondary data can be used to supplement primary data by providing additional information or insights that were not captured by the primary research. This can help researchers gain a more complete understanding of the research topic and draw more robust conclusions.
When to use Secondary Data
Secondary data can be useful in a variety of research contexts, and there are several situations in which it may be appropriate to use secondary data. Some common situations in which secondary data may be used include:
- When primary data collection is not feasible : Collecting primary data can be time-consuming and expensive, and in some cases, it may not be feasible to collect primary data. In these situations, secondary data can provide valuable insights and information.
- When exploring a new research area : Secondary data can be a useful starting point for researchers who are exploring a new research area. Secondary data can provide context and background information on a research topic, and can help researchers identify key variables and relationships to explore further.
- When comparing and contrasting research findings: Secondary data can be used to compare and contrast findings across different studies or datasets. This can help researchers identify trends, patterns, and relationships that may not have been apparent from individual studies.
- When triangulating research findings: Triangulation is the process of using multiple sources of data to confirm or refute research findings. Secondary data can be used to support triangulation by providing additional sources of data to support or refute primary research findings.
- When validating research findings : Secondary data can be used to validate primary research findings by providing additional sources of data that support or refute the primary findings.
Characteristics of Secondary Data
Secondary data have several characteristics that distinguish them from primary data. Here are some of the key characteristics of secondary data:
- Non-reactive: Secondary data are non-reactive, meaning that they are not collected for the specific purpose of the research study. This means that the researcher has no control over the data collection process, and cannot influence how the data were collected.
- Time-saving: Secondary data are pre-existing, meaning that they have already been collected and organized by someone else. This can save the researcher time and resources, as they do not need to collect the data themselves.
- Wide-ranging : Secondary data sources can provide a wide range of information on a variety of topics. This can be useful for researchers who are exploring a new research area or seeking to compare and contrast research findings.
- Less expensive: Secondary data are generally less expensive than primary data, as they do not require the researcher to incur the costs associated with data collection.
- Potential for bias : Secondary data may be subject to biases that were present in the original data collection process. For example, data may have been collected using a biased sampling method or the data may be incomplete or inaccurate.
- Lack of control: The researcher has no control over the data collection process and cannot ensure that the data were collected using appropriate methods or measures.
- Requires careful evaluation : Secondary data sources must be evaluated carefully to ensure that they are appropriate for the research question and analysis. This includes assessing the quality, reliability, and validity of the data sources.
Advantages of Secondary Data
There are several advantages to using secondary data in research, including:
- Time-saving : Collecting primary data can be time-consuming and expensive. Secondary data can be accessed quickly and easily, which can save researchers time and resources.
- Cost-effective: Secondary data are generally less expensive than primary data, as they do not require the researcher to incur the costs associated with data collection.
- Large sample size : Secondary data sources often have larger sample sizes than primary data sources, which can increase the statistical power of the research.
- Access to historical data : Secondary data sources can provide access to historical data, which can be useful for researchers who are studying trends over time.
- No ethical concerns: Secondary data are already in existence, so there are no ethical concerns related to collecting data from human subjects.
- May be more objective : Secondary data may be more objective than primary data, as the data were not collected for the specific purpose of the research study.
Limitations of Secondary Data
While there are many advantages to using secondary data in research, there are also some limitations that should be considered. Some of the main limitations of secondary data include:
- Lack of control over data quality : Researchers do not have control over the data collection process, which means they cannot ensure the accuracy or completeness of the data.
- Limited availability: Secondary data may not be available for the specific research question or study design.
- Lack of information on sampling and data collection methods: Researchers may not have access to information on the sampling and data collection methods used to gather the secondary data. This can make it difficult to evaluate the quality of the data.
- Data may not be up-to-date: Secondary data may not be up-to-date or relevant to the current research question.
- Data may be incomplete or inaccurate : Secondary data may be incomplete or inaccurate due to missing or incorrect data points, data entry errors, or other factors.
- Biases in data collection: The data may have been collected using biased sampling or data collection methods, which can limit the validity of the data.
- Lack of control over variables: Researchers have limited control over the variables that were measured in the original data collection process, which can limit the ability to draw conclusions about causality.
About the author

Muhammad Hassan
Researcher, Academic Writer, Web developer
You may also like

Primary Data – Types, Methods and Examples

Qualitative Data – Types, Methods and Examples

Research Data – Types Methods and Examples

Quantitative Data – Types, Methods and Examples

Information in Research – Types and Examples
Root out friction in every digital experience, super-charge conversion rates, and optimize digital self-service
Uncover insights from any interaction, deliver AI-powered agent coaching, and reduce cost to serve
Increase revenue and loyalty with real-time insights and recommendations delivered to teams on the ground
Know how your people feel and empower managers to improve employee engagement, productivity, and retention
Take action in the moments that matter most along the employee journey and drive bottom line growth
Whatever they’re are saying, wherever they’re saying it, know exactly what’s going on with your people
Get faster, richer insights with qual and quant tools that make powerful market research available to everyone
Run concept tests, pricing studies, prototyping + more with fast, powerful studies designed by UX research experts
Track your brand performance 24/7 and act quickly to respond to opportunities and challenges in your market
Explore the platform powering Experience Management
- Free Account
- For Digital
- For Customer Care
- For Human Resources
- For Researchers
- Financial Services
- All Industries
Popular Use Cases
- Customer Experience
- Employee Experience
- Net Promoter Score
- Voice of Customer
- Customer Success Hub
- Product Documentation
- Training & Certification
- XM Institute
- Popular Resources
- Customer Stories
- Artificial Intelligence
Market Research
- Partnerships
- Marketplace
The annual gathering of the experience leaders at the world’s iconic brands building breakthrough business results, live in Salt Lake City.
- English/AU & NZ
- Español/Europa
- Español/América Latina
- Português Brasileiro
- REQUEST DEMO
- Experience Management
- Secondary Research
Try Qualtrics for free
Secondary research: definition, methods, & examples.
19 min read This ultimate guide to secondary research helps you understand changes in market trends, customers buying patterns and your competition using existing data sources.
In situations where you’re not involved in the data gathering process ( primary research ), you have to rely on existing information and data to arrive at specific research conclusions or outcomes. This approach is known as secondary research.
In this article, we’re going to explain what secondary research is, how it works, and share some examples of it in practice.
Free eBook: The ultimate guide to conducting market research
What is secondary research?
Secondary research, also known as desk research, is a research method that involves compiling existing data sourced from a variety of channels . This includes internal sources (e.g.in-house research) or, more commonly, external sources (such as government statistics, organizational bodies, and the internet).
Secondary research comes in several formats, such as published datasets, reports, and survey responses , and can also be sourced from websites, libraries, and museums.
The information is usually free — or available at a limited access cost — and gathered using surveys , telephone interviews, observation, face-to-face interviews, and more.
When using secondary research, researchers collect, verify, analyze and incorporate it to help them confirm research goals for the research period.
As well as the above, it can be used to review previous research into an area of interest. Researchers can look for patterns across data spanning several years and identify trends — or use it to verify early hypothesis statements and establish whether it’s worth continuing research into a prospective area.
How to conduct secondary research
There are five key steps to conducting secondary research effectively and efficiently:
1. Identify and define the research topic
First, understand what you will be researching and define the topic by thinking about the research questions you want to be answered.
Ask yourself: What is the point of conducting this research? Then, ask: What do we want to achieve?
This may indicate an exploratory reason (why something happened) or confirm a hypothesis. The answers may indicate ideas that need primary or secondary research (or a combination) to investigate them.
2. Find research and existing data sources
If secondary research is needed, think about where you might find the information. This helps you narrow down your secondary sources to those that help you answer your questions. What keywords do you need to use?
Which organizations are closely working on this topic already? Are there any competitors that you need to be aware of?
Create a list of the data sources, information, and people that could help you with your work.
3. Begin searching and collecting the existing data
Now that you have the list of data sources, start accessing the data and collect the information into an organized system. This may mean you start setting up research journal accounts or making telephone calls to book meetings with third-party research teams to verify the details around data results.
As you search and access information, remember to check the data’s date, the credibility of the source, the relevance of the material to your research topic, and the methodology used by the third-party researchers. Start small and as you gain results, investigate further in the areas that help your research’s aims.
4. Combine the data and compare the results
When you have your data in one place, you need to understand, filter, order, and combine it intelligently. Data may come in different formats where some data could be unusable, while other information may need to be deleted.
After this, you can start to look at different data sets to see what they tell you. You may find that you need to compare the same datasets over different periods for changes over time or compare different datasets to notice overlaps or trends. Ask yourself: What does this data mean to my research? Does it help or hinder my research?
5. Analyze your data and explore further
In this last stage of the process, look at the information you have and ask yourself if this answers your original questions for your research. Are there any gaps? Do you understand the information you’ve found? If you feel there is more to cover, repeat the steps and delve deeper into the topic so that you can get all the information you need.
If secondary research can’t provide these answers, consider supplementing your results with data gained from primary research. As you explore further, add to your knowledge and update your findings. This will help you present clear, credible information.
Primary vs secondary research
Unlike secondary research, primary research involves creating data first-hand by directly working with interviewees, target users, or a target market. Primary research focuses on the method for carrying out research, asking questions, and collecting data using approaches such as:
- Interviews (panel, face-to-face or over the phone)
- Questionnaires or surveys
- Focus groups
Using these methods, researchers can get in-depth, targeted responses to questions, making results more accurate and specific to their research goals. However, it does take time to do and administer.
Unlike primary research, secondary research uses existing data, which also includes published results from primary research. Researchers summarize the existing research and use the results to support their research goals.
Both primary and secondary research have their places. Primary research can support the findings found through secondary research (and fill knowledge gaps), while secondary research can be a starting point for further primary research. Because of this, these research methods are often combined for optimal research results that are accurate at both the micro and macro level.
Sources of Secondary Research
There are two types of secondary research sources: internal and external. Internal data refers to in-house data that can be gathered from the researcher’s organization. External data refers to data published outside of and not owned by the researcher’s organization.
Internal data
Internal data is a good first port of call for insights and knowledge, as you may already have relevant information stored in your systems. Because you own this information — and it won’t be available to other researchers — it can give you a competitive edge . Examples of internal data include:
- Database information on sales history and business goal conversions
- Information from website applications and mobile site data
- Customer-generated data on product and service efficiency and use
- Previous research results or supplemental research areas
- Previous campaign results
External data
External data is useful when you: 1) need information on a new topic, 2) want to fill in gaps in your knowledge, or 3) want data that breaks down a population or market for trend and pattern analysis. Examples of external data include:
- Government, non-government agencies, and trade body statistics
- Company reports and research
- Competitor research
- Public library collections
- Textbooks and research journals
- Media stories in newspapers
- Online journals and research sites
Three examples of secondary research methods in action
How and why might you conduct secondary research? Let’s look at a few examples:
1. Collecting factual information from the internet on a specific topic or market
There are plenty of sites that hold data for people to view and use in their research. For example, Google Scholar, ResearchGate, or Wiley Online Library all provide previous research on a particular topic. Researchers can create free accounts and use the search facilities to look into a topic by keyword, before following the instructions to download or export results for further analysis.
This can be useful for exploring a new market that your organization wants to consider entering. For instance, by viewing the U.S Census Bureau demographic data for that area, you can see what the demographics of your target audience are , and create compelling marketing campaigns accordingly.
2. Finding out the views of your target audience on a particular topic
If you’re interested in seeing the historical views on a particular topic, for example, attitudes to women’s rights in the US, you can turn to secondary sources.
Textbooks, news articles, reviews, and journal entries can all provide qualitative reports and interviews covering how people discussed women’s rights. There may be multimedia elements like video or documented posters of propaganda showing biased language usage.
By gathering this information, synthesizing it, and evaluating the language, who created it and when it was shared, you can create a timeline of how a topic was discussed over time.
3. When you want to know the latest thinking on a topic
Educational institutions, such as schools and colleges, create a lot of research-based reports on younger audiences or their academic specialisms. Dissertations from students also can be submitted to research journals, making these places useful places to see the latest insights from a new generation of academics.
Information can be requested — and sometimes academic institutions may want to collaborate and conduct research on your behalf. This can provide key primary data in areas that you want to research, as well as secondary data sources for your research.
Advantages of secondary research
There are several benefits of using secondary research, which we’ve outlined below:
- Easily and readily available data – There is an abundance of readily accessible data sources that have been pre-collected for use, in person at local libraries and online using the internet. This data is usually sorted by filters or can be exported into spreadsheet format, meaning that little technical expertise is needed to access and use the data.
- Faster research speeds – Since the data is already published and in the public arena, you don’t need to collect this information through primary research. This can make the research easier to do and faster, as you can get started with the data quickly.
- Low financial and time costs – Most secondary data sources can be accessed for free or at a small cost to the researcher, so the overall research costs are kept low. In addition, by saving on preliminary research, the time costs for the researcher are kept down as well.
- Secondary data can drive additional research actions – The insights gained can support future research activities (like conducting a follow-up survey or specifying future detailed research topics) or help add value to these activities.
- Secondary data can be useful pre-research insights – Secondary source data can provide pre-research insights and information on effects that can help resolve whether research should be conducted. It can also help highlight knowledge gaps, so subsequent research can consider this.
- Ability to scale up results – Secondary sources can include large datasets (like Census data results across several states) so research results can be scaled up quickly using large secondary data sources.
Disadvantages of secondary research
The disadvantages of secondary research are worth considering in advance of conducting research :
- Secondary research data can be out of date – Secondary sources can be updated regularly, but if you’re exploring the data between two updates, the data can be out of date. Researchers will need to consider whether the data available provides the right research coverage dates, so that insights are accurate and timely, or if the data needs to be updated. Also, fast-moving markets may find secondary data expires very quickly.
- Secondary research needs to be verified and interpreted – Where there’s a lot of data from one source, a researcher needs to review and analyze it. The data may need to be verified against other data sets or your hypotheses for accuracy and to ensure you’re using the right data for your research.
- The researcher has had no control over the secondary research – As the researcher has not been involved in the secondary research, invalid data can affect the results. It’s therefore vital that the methodology and controls are closely reviewed so that the data is collected in a systematic and error-free way.
- Secondary research data is not exclusive – As data sets are commonly available, there is no exclusivity and many researchers can use the same data. This can be problematic where researchers want to have exclusive rights over the research results and risk duplication of research in the future.
When do we conduct secondary research?
Now that you know the basics of secondary research, when do researchers normally conduct secondary research?
It’s often used at the beginning of research, when the researcher is trying to understand the current landscape . In addition, if the research area is new to the researcher, it can form crucial background context to help them understand what information exists already. This can plug knowledge gaps, supplement the researcher’s own learning or add to the research.
Secondary research can also be used in conjunction with primary research. Secondary research can become the formative research that helps pinpoint where further primary research is needed to find out specific information. It can also support or verify the findings from primary research.
You can use secondary research where high levels of control aren’t needed by the researcher, but a lot of knowledge on a topic is required from different angles.
Secondary research should not be used in place of primary research as both are very different and are used for various circumstances.
Questions to ask before conducting secondary research
Before you start your secondary research, ask yourself these questions:
- Is there similar internal data that we have created for a similar area in the past?
If your organization has past research, it’s best to review this work before starting a new project. The older work may provide you with the answers, and give you a starting dataset and context of how your organization approached the research before. However, be mindful that the work is probably out of date and view it with that note in mind. Read through and look for where this helps your research goals or where more work is needed.
- What am I trying to achieve with this research?
When you have clear goals, and understand what you need to achieve, you can look for the perfect type of secondary or primary research to support the aims. Different secondary research data will provide you with different information – for example, looking at news stories to tell you a breakdown of your market’s buying patterns won’t be as useful as internal or external data e-commerce and sales data sources.
- How credible will my research be?
If you are looking for credibility, you want to consider how accurate the research results will need to be, and if you can sacrifice credibility for speed by using secondary sources to get you started. Bear in mind which sources you choose — low-credibility data sites, like political party websites that are highly biased to favor their own party, would skew your results.
- What is the date of the secondary research?
When you’re looking to conduct research, you want the results to be as useful as possible , so using data that is 10 years old won’t be as accurate as using data that was created a year ago. Since a lot can change in a few years, note the date of your research and look for earlier data sets that can tell you a more recent picture of results. One caveat to this is using data collected over a long-term period for comparisons with earlier periods, which can tell you about the rate and direction of change.
- Can the data sources be verified? Does the information you have check out?
If you can’t verify the data by looking at the research methodology, speaking to the original team or cross-checking the facts with other research, it could be hard to be sure that the data is accurate. Think about whether you can use another source, or if it’s worth doing some supplementary primary research to replicate and verify results to help with this issue.
We created a front-to-back guide on conducting market research, The ultimate guide to conducting market research , so you can understand the research journey with confidence.
In it, you’ll learn more about:
- What effective market research looks like
- The use cases for market research
- The most important steps to conducting market research
- And how to take action on your research findings
Download the free guide for a clearer view on secondary research and other key research types for your business.
Related resources
Market intelligence 10 min read, marketing insights 11 min read, ethnographic research 11 min read, qualitative vs quantitative research 13 min read, qualitative research questions 11 min read, qualitative research design 12 min read, primary vs secondary research 14 min read, request demo.
Ready to learn more about Qualtrics?
What is secondary research?
Last updated
7 February 2023
Reviewed by
Cathy Heath
In this guide, we explain in detail what secondary research is, including the difference between this research method and primary research, the different sources for secondary research, and how you can benefit from this research method.
Analyze your secondary research
Bring your secondary research together inside Dovetail, tag PDFs, and uncover actionable insights
- Overview of secondary research
Secondary research is a method by which the researcher finds existing data, filters it to meet the context of their research question, analyzes it, and then summarizes it to come up with valid research conclusions.
This research method involves searching for information, often via the internet, using keywords or search terms relevant to the research question. The goal is to find data from internal and external sources that are up-to-date and authoritative, and that fully answer the question.
Secondary research reviews existing research and looks for patterns, trends, and insights, which helps determine what further research, if any, is needed.
- Secondary research methods
Secondary research is more economical than primary research, mainly because the methods for this type of research use existing data and do not require the data to be collected first-hand or by a third party that you have to pay.
Secondary research is referred to as ‘desk research’ or ‘desktop research,’ since the data can be retrieved from behind a desk instead of having to host a focus group and create the research from scratch.
Finding existing research is relatively easy since there are numerous accessible sources organizations can use to obtain the information they need. These include:
The internet: This data is either free or behind a paywall. Yet, while there are plenty of sites on the internet with information that can be used, businesses need to be careful to collect information from trusted and authentic websites to ensure the data is accurate.
Government agencies: Government agencies are typically known to provide valuable, trustworthy information that companies can use for their research.
The public library: This establishment holds paper-based and online sources of reliable information, including business databases, magazines, newspapers, and government publications. Be mindful of any copyright restrictions that may apply when using these sources.
Commercial information: This source provides first-hand information on politics, demographics, and economic developments through information aggregators, newspapers, magazines, radio, blogs, podcasts, and journals. This information may be free or behind a paywall.
Educational and scientific facilities: Universities, colleges, and specialized research facilities carry out significant amounts of research. As a result, they have data that may be available to the public and businesses for use.
- Key differences between primary research and secondary research
Both primary and secondary research methods provide researchers with vital, complementary information, despite some major differences between the two approaches.
Primary research involves gathering first-hand information by directly working with the target market, users, and interviewees. Researchers ask questions directly using surveys , interviews, and focus groups.
Through the primary research method, researchers obtain targeted responses and accurate results directly related to their overall research goals.
Secondary research uses existing data, such as published reports, that have already been completed through earlier primary and secondary research. Researchers can use this existing data to support their research goals and preliminary research findings.
Other notable differences between primary and secondary research include:
Relevance: Primary research uses raw data relevant to the investigation's goals. Secondary research may contain irrelevant data or may not neatly fit the parameters of the researcher's goals.
Time: Primary research takes a lot of time. Secondary research can be done relatively quickly.
Researcher bias: Primary research can be subject to researcher bias.
Cost: Primary research can be expensive. Secondary research can be more affordable because the data is often free. However, valuable data is often behind a paywall. The piece of secondary research you want may not exist or be very expensive, so you may have to turn to primary research to fill the information gap.
- When to conduct secondary research
Both primary and secondary research have roles to play in providing a holistic and accurate understanding of a topic. Generally, secondary research is done at the beginning of the research phase, especially if the topic is new.
Secondary research can provide context and critical background information to understand the issue at hand and identify any gaps, that could then be filled by primary research.
- How to conduct secondary research
Researchers usually follow several steps for secondary research.
1. Identify and define the research topic
Before starting either of these research methods, you first need to determine the following:
Topic to be researched
Purpose of this research
For instance, you may want to explore a question, determine why something happened, or confirm whether an issue is true.
At this stage, you also need to consider what search terms or keywords might be the most effective for this topic. You could do this by looking at what synonyms exist for your topic, the use of industry terms and acronyms, as well as the balance between statistical or quantitative data and contextual data to support your research topic.
It’s also essential to define what you don’t want to cover in your secondary research process. This might be choosing only to use recent information or only focusing on research based on a particular country or type of consumer. From there, once you know what you want to know and why you can decide whether you need to use both primary and secondary research to answer your questions.
2. Find research and existing data sources
Once you have determined your research topic , select the information sources that will provide you with the most appropriate and relevant data for your research. If you need secondary research, you want to determine where this information can likely be found, for example:
Trade associations
Government sources
Create a list of the relevant data sources , and other organizations or people that can help you find what you need.
3. Begin searching and collecting the existing data
Once you have narrowed down your sources, you will start gathering this information and putting it into an organized system. This often involves:
Checking the credibility of the source
Setting up meetings with research teams
Signing up for accounts to access certain websites or journals
One search result on the internet often leads to other pieces of helpful information, known as ‘pearl gathering’ or ‘pearl harvesting.’ This is usually a serendipitous activity, which can lead to valuable nuggets of information you may not have been aware of or considered.
4. Combine the data and compare the results
Once you have gathered all the data, start going through it by carefully examining all the information and comparing it to ensure the data is usable and that it isn’t duplicated or corrupted. Contradictory information is useful—just make sure you note the contradiction and the context. Be mindful of copyright and plagiarism when using secondary research and always cite your sources.
Once you have assessed everything, you will begin to look at what this information tells you by checking out the trends and comparing the different datasets. You will also investigate what this information means for your research, whether it helps your overall goal, and any gaps or deficiencies.
5. Analyze your data and explore further
In the final stage of conducting secondary research, you will analyze the data you have gathered and determine if it answers the questions you had before you started researching. Check that you understand the information, whether it fills in all your gaps, and whether it provides you with other insights or actions you should take next.
If you still need further data, repeat these steps to find additional information that can help you explore your topic more deeply. You may also need to supplement what you find with primary research to ensure that your data is complete, accurate, transparent, and credible.
- The advantages of secondary research
There are numerous advantages to performing secondary research. Some key benefits are:
Quicker than primary research: Because the data is already available, you can usually find the information you need fairly quickly. Not only will secondary research help you research faster, but you will also start optimizing the data more quickly.
Plenty of available data: There are countless sources for you to choose from, making research more accessible. This data may be already compiled and arranged, such as statistical information, so you can quickly make use of it.
Lower costs: Since you will not have to carry out the research from scratch, secondary research tends to be much more affordable than primary research.
Opens doors to further research: � Existing research usually identifies whether more research needs to be done. This could mean follow-up surveys or telephone interviews with subject matter experts (SME) to add value to your own research.
- The disadvantages of secondary research
While there are plenty of benefits to secondary research are plenty, there are some issues you should be aware of. These include:
Credibility issues: It is important to verify the sources used. Some information may be biased and not reflect or hide, relevant issues or challenges. It could also be inaccurate.
No recent information: Even if data may seem accurate, it may not be up to date, so the information you gather may no longer be correct. Outdated research can distort your overall findings.
Poor quality: Because secondary research tends to make conclusions from primary research data, the success of secondary research will depend on the quality and context of the research that has already been completed. If the research you are using is of poor quality, this will bring down the quality of your own findings.
Research doesn’t exist or is not easily accessible, or is expensive: Sometimes the information you need is confidential or proprietary, such as sales or earnings figures. Many information-based businesses attach value to the information they hold or publish, so the costs to access this information can be prohibitive.
Should you complete secondary research or primary research first?
Due to the costs and time involved in primary research, it may be more beneficial to conduct secondary market research first. This will save you time and provide a picture of what issues you may come across in your research. This allows you to focus on using more expensive primary research to get the specific answers you want.
What should you ask yourself before using secondary research data?
Check the date of the research to make sure it is still relevant. Also, determine the data source so you can assess how credible and trustworthy it is likely to be. For example, data from known brands, professional organizations, and even government agencies are usually excellent sources to use in your secondary research, as it tends to be trustworthy.
Be careful when using some websites and personal blogs as they may be based on opinions rather than facts. However, these sources can be useful for determining sentiment about a product or service, and help direct any primary research.
Editor’s picks
Last updated: 11 January 2024
Last updated: 15 January 2024
Last updated: 25 November 2023
Last updated: 12 May 2023
Last updated: 30 April 2024
Last updated: 18 May 2023
Last updated: 10 April 2023
Latest articles
Related topics, .css-je19u9{-webkit-align-items:flex-end;-webkit-box-align:flex-end;-ms-flex-align:flex-end;align-items:flex-end;display:-webkit-box;display:-webkit-flex;display:-ms-flexbox;display:flex;-webkit-flex-direction:row;-ms-flex-direction:row;flex-direction:row;-webkit-box-flex-wrap:wrap;-webkit-flex-wrap:wrap;-ms-flex-wrap:wrap;flex-wrap:wrap;-webkit-box-pack:center;-ms-flex-pack:center;-webkit-justify-content:center;justify-content:center;row-gap:0;text-align:center;max-width:671px;}@media (max-width: 1079px){.css-je19u9{max-width:400px;}.css-je19u9>span{white-space:pre;}}@media (max-width: 799px){.css-je19u9{max-width:400px;}.css-je19u9>span{white-space:pre;}} decide what to .css-1kiodld{max-height:56px;display:-webkit-box;display:-webkit-flex;display:-ms-flexbox;display:flex;-webkit-align-items:center;-webkit-box-align:center;-ms-flex-align:center;align-items:center;}@media (max-width: 1079px){.css-1kiodld{display:none;}} build next, decide what to build next.

Users report unexpectedly high data usage, especially during streaming sessions.

Users find it hard to navigate from the home page to relevant playlists in the app.

It would be great to have a sleep timer feature, especially for bedtime listening.

I need better filters to find the songs or artists I’m looking for.
Log in or sign up
Get started for free
- Skip to main content
- Skip to primary sidebar
- Skip to footer
- QuestionPro

- Solutions Industries Gaming Automotive Sports and events Education Government Travel & Hospitality Financial Services Healthcare Cannabis Technology Use Case NPS+ Communities Audience Contactless surveys Mobile LivePolls Member Experience GDPR Positive People Science 360 Feedback Surveys
- Resources Blog eBooks Survey Templates Case Studies Training Help center
Home Market Research
Secondary Research: Definition, Methods and Examples.

In the world of research, there are two main types of data sources: primary and secondary. While primary research involves collecting new data directly from individuals or sources, secondary research involves analyzing existing data already collected by someone else. Today we’ll discuss secondary research.
One common source of this research is published research reports and other documents. These materials can often be found in public libraries, on websites, or even as data extracted from previously conducted surveys. In addition, many government and non-government agencies maintain extensive data repositories that can be accessed for research purposes.
LEARN ABOUT: Research Process Steps
While secondary research may not offer the same level of control as primary research, it can be a highly valuable tool for gaining insights and identifying trends. Researchers can save time and resources by leveraging existing data sources while still uncovering important information.
What is Secondary Research: Definition
Secondary research is a research method that involves using already existing data. Existing data is summarized and collated to increase the overall effectiveness of the research.
One of the key advantages of secondary research is that it allows us to gain insights and draw conclusions without having to collect new data ourselves. This can save time and resources and also allow us to build upon existing knowledge and expertise.
When conducting secondary research, it’s important to be thorough and thoughtful in our approach. This means carefully selecting the sources and ensuring that the data we’re analyzing is reliable and relevant to the research question . It also means being critical and analytical in the analysis and recognizing any potential biases or limitations in the data.
LEARN ABOUT: Level of Analysis
Secondary research is much more cost-effective than primary research , as it uses already existing data, unlike primary research, where data is collected firsthand by organizations or businesses or they can employ a third party to collect data on their behalf.
LEARN ABOUT: Data Analytics Projects
Secondary Research Methods with Examples
Secondary research is cost-effective, one of the reasons it is a popular choice among many businesses and organizations. Not every organization is able to pay a huge sum of money to conduct research and gather data. So, rightly secondary research is also termed “ desk research ”, as data can be retrieved from sitting behind a desk.
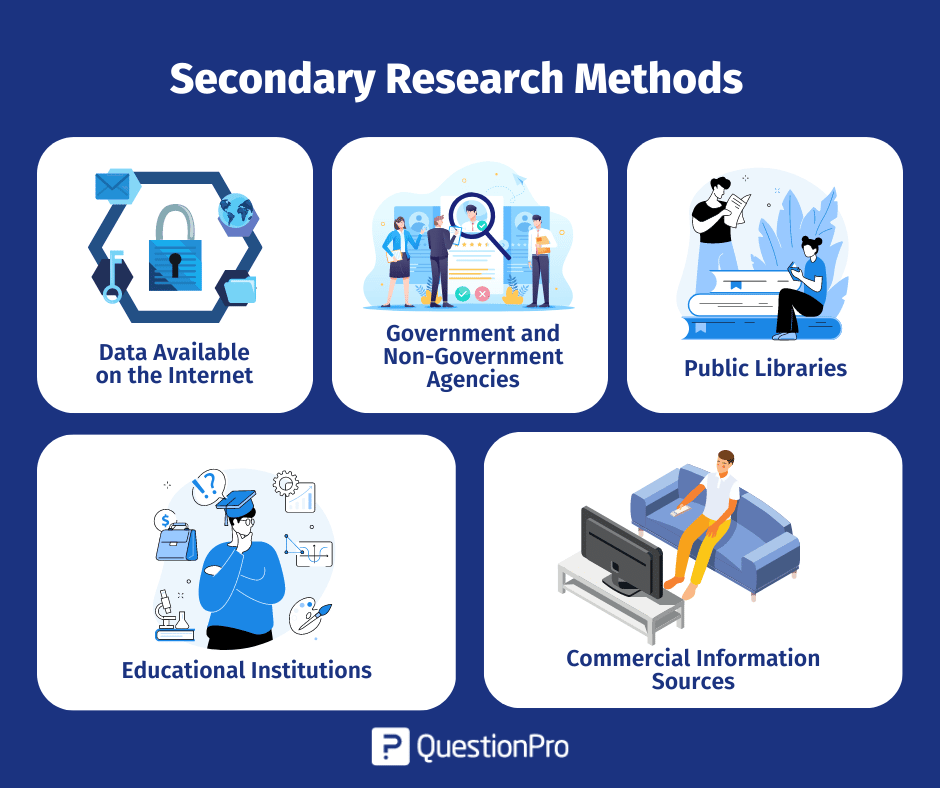
The following are popularly used secondary research methods and examples:
1. Data Available on The Internet
One of the most popular ways to collect secondary data is the internet. Data is readily available on the internet and can be downloaded at the click of a button.
This data is practically free of cost, or one may have to pay a negligible amount to download the already existing data. Websites have a lot of information that businesses or organizations can use to suit their research needs. However, organizations need to consider only authentic and trusted website to collect information.
2. Government and Non-Government Agencies
Data for secondary research can also be collected from some government and non-government agencies. For example, US Government Printing Office, US Census Bureau, and Small Business Development Centers have valuable and relevant data that businesses or organizations can use.
There is a certain cost applicable to download or use data available with these agencies. Data obtained from these agencies are authentic and trustworthy.
3. Public Libraries
Public libraries are another good source to search for data for this research. Public libraries have copies of important research that were conducted earlier. They are a storehouse of important information and documents from which information can be extracted.
The services provided in these public libraries vary from one library to another. More often, libraries have a huge collection of government publications with market statistics, large collection of business directories and newsletters.
4. Educational Institutions
Importance of collecting data from educational institutions for secondary research is often overlooked. However, more research is conducted in colleges and universities than any other business sector.
The data that is collected by universities is mainly for primary research. However, businesses or organizations can approach educational institutions and request for data from them.
5. Commercial Information Sources
Local newspapers, journals, magazines, radio and TV stations are a great source to obtain data for secondary research. These commercial information sources have first-hand information on economic developments, political agenda, market research, demographic segmentation and similar subjects.
Businesses or organizations can request to obtain data that is most relevant to their study. Businesses not only have the opportunity to identify their prospective clients but can also know about the avenues to promote their products or services through these sources as they have a wider reach.
Key Differences between Primary Research and Secondary Research
Understanding the distinction between primary research and secondary research is essential in determining which research method is best for your project. These are the two main types of research methods, each with advantages and disadvantages. In this section, we will explore the critical differences between the two and when it is appropriate to use them.
How to Conduct Secondary Research?
We have already learned about the differences between primary and secondary research. Now, let’s take a closer look at how to conduct it.
Secondary research is an important tool for gathering information already collected and analyzed by others. It can help us save time and money and allow us to gain insights into the subject we are researching. So, in this section, we will discuss some common methods and tips for conducting it effectively.
Here are the steps involved in conducting secondary research:
1. Identify the topic of research: Before beginning secondary research, identify the topic that needs research. Once that’s done, list down the research attributes and its purpose.
2. Identify research sources: Next, narrow down on the information sources that will provide most relevant data and information applicable to your research.
3. Collect existing data: Once the data collection sources are narrowed down, check for any previous data that is available which is closely related to the topic. Data related to research can be obtained from various sources like newspapers, public libraries, government and non-government agencies etc.
4. Combine and compare: Once data is collected, combine and compare the data for any duplication and assemble data into a usable format. Make sure to collect data from authentic sources. Incorrect data can hamper research severely.
4. Analyze data: Analyze collected data and identify if all questions are answered. If not, repeat the process if there is a need to dwell further into actionable insights.
Advantages of Secondary Research
Secondary research offers a number of advantages to researchers, including efficiency, the ability to build upon existing knowledge, and the ability to conduct research in situations where primary research may not be possible or ethical. By carefully selecting their sources and being thoughtful in their approach, researchers can leverage secondary research to drive impact and advance the field. Some key advantages are the following:
1. Most information in this research is readily available. There are many sources from which relevant data can be collected and used, unlike primary research, where data needs to collect from scratch.
2. This is a less expensive and less time-consuming process as data required is easily available and doesn’t cost much if extracted from authentic sources. A minimum expenditure is associated to obtain data.
3. The data that is collected through secondary research gives organizations or businesses an idea about the effectiveness of primary research. Hence, organizations or businesses can form a hypothesis and evaluate cost of conducting primary research.
4. Secondary research is quicker to conduct because of the availability of data. It can be completed within a few weeks depending on the objective of businesses or scale of data needed.
As we can see, this research is the process of analyzing data already collected by someone else, and it can offer a number of benefits to researchers.
Disadvantages of Secondary Research
On the other hand, we have some disadvantages that come with doing secondary research. Some of the most notorious are the following:
1. Although data is readily available, credibility evaluation must be performed to understand the authenticity of the information available.
2. Not all secondary data resources offer the latest reports and statistics. Even when the data is accurate, it may not be updated enough to accommodate recent timelines.
3. Secondary research derives its conclusion from collective primary research data. The success of your research will depend, to a greater extent, on the quality of research already conducted by primary research.
LEARN ABOUT: 12 Best Tools for Researchers
In conclusion, secondary research is an important tool for researchers exploring various topics. By leveraging existing data sources, researchers can save time and resources, build upon existing knowledge, and conduct research in situations where primary research may not be feasible.
There are a variety of methods and examples of secondary research, from analyzing public data sets to reviewing previously published research papers. As students and aspiring researchers, it’s important to understand the benefits and limitations of this research and to approach it thoughtfully and critically. By doing so, we can continue to advance our understanding of the world around us and contribute to meaningful research that positively impacts society.
QuestionPro can be a useful tool for conducting secondary research in a variety of ways. You can create online surveys that target a specific population, collecting data that can be analyzed to gain insights into consumer behavior, attitudes, and preferences; analyze existing data sets that you have obtained through other means or benchmark your organization against others in your industry or against industry standards. The software provides a range of benchmarking tools that can help you compare your performance on key metrics, such as customer satisfaction, with that of your peers.
Using QuestionPro thoughtfully and strategically allows you to gain valuable insights to inform decision-making and drive business success. Start today for free! No credit card is required.
LEARN MORE FREE TRIAL
MORE LIKE THIS

The Best Email Survey Tool to Boost Your Feedback Game
May 7, 2024

Top 10 Employee Engagement Survey Tools

Top 20 Employee Engagement Software Solutions
May 3, 2024

15 Best Customer Experience Software of 2024
May 2, 2024
Other categories
- Academic Research
- Artificial Intelligence
- Assessments
- Brand Awareness
- Case Studies
- Communities
- Consumer Insights
- Customer effort score
- Customer Engagement
- Customer Experience
- Customer Loyalty
- Customer Research
- Customer Satisfaction
- Employee Benefits
- Employee Engagement
- Employee Retention
- Friday Five
- General Data Protection Regulation
- Insights Hub
- Life@QuestionPro
- Market Research
- Mobile diaries
- Mobile Surveys
- New Features
- Online Communities
- Question Types
- Questionnaire
- QuestionPro Products
- Release Notes
- Research Tools and Apps
- Revenue at Risk
- Survey Templates
- Training Tips
- Uncategorized
- Video Learning Series
- What’s Coming Up
- Workforce Intelligence

Secondary Research Guide: Definition, Methods, Examples
Apr 3, 2024
8 min. read
The internet has vastly expanded our access to information, allowing us to learn almost anything about everything. But not all market research is created equal , and this secondary research guide explains why.
There are two key ways to do research. One is to test your own ideas, make your own observations, and collect your own data to derive conclusions. The other is to use secondary research — where someone else has done most of the heavy lifting for you.
Here’s an overview of secondary research and the value it brings to data-driven businesses.
Secondary Research Definition: What Is Secondary Research?
Primary vs Secondary Market Research
What Are Secondary Research Methods?
Advantages of secondary research, disadvantages of secondary research, best practices for secondary research, how to conduct secondary research with meltwater.
Secondary research definition: The process of collecting information from existing sources and data that have already been analyzed by others.
Secondary research (aka desk research or complementary research ) provides a foundation to help you understand a topic, with the goal of building on existing knowledge. They often cover the same information as primary sources, but they add a layer of analysis and explanation to them.

Users can choose from several secondary research types and sources, including:
- Journal articles
- Research papers
With secondary sources, users can draw insights, detect trends , and validate findings to jumpstart their research efforts.
Primary vs. Secondary Market Research
We’ve touched a little on primary research , but it’s essential to understand exactly how primary and secondary research are unique.

Think of primary research as the “thing” itself, and secondary research as the analysis of the “thing,” like these primary and secondary research examples:
- An expert gives an interview (primary research) and a marketer uses that interview to write an article (secondary research).
- A company conducts a consumer satisfaction survey (primary research) and a business analyst uses the survey data to write a market trend report (secondary research).
- A marketing team launches a new advertising campaign across various platforms (primary research) and a marketing research firm, like Meltwater for market research , compiles the campaign performance data to benchmark against industry standards (secondary research).
In other words, primary sources make original contributions to a topic or issue, while secondary sources analyze, synthesize, or interpret primary sources.
Both are necessary when optimizing a business, gaining a competitive edge , improving marketing, or understanding consumer trends that may impact your business.
Secondary research methods focus on analyzing existing data rather than collecting primary data . Common examples of secondary research methods include:
- Literature review . Researchers analyze and synthesize existing literature (e.g., white papers, research papers, articles) to find knowledge gaps and build on current findings.
- Content analysis . Researchers review media sources and published content to find meaningful patterns and trends.
- AI-powered secondary research . Platforms like Meltwater for market research analyze vast amounts of complex data and use AI technologies like natural language processing and machine learning to turn data into contextual insights.
Researchers today have access to more secondary research companies and market research tools and technology than ever before, allowing them to streamline their efforts and improve their findings.
Want to see how Meltwater can complement your secondary market research efforts? Simply fill out the form at the bottom of this post, and we'll be in touch.
Conducting secondary research offers benefits in every job function and use case, from marketing to the C-suite. Here are a few advantages you can expect.
Cost and time efficiency
Using existing research saves you time and money compared to conducting primary research. Secondary data is readily available and easily accessible via libraries, free publications, or the Internet. This is particularly advantageous when you face time constraints or when a project requires a large amount of data and research.
Access to large datasets
Secondary data gives you access to larger data sets and sample sizes compared to what primary methods may produce. Larger sample sizes can improve the statistical power of the study and add more credibility to your findings.
Ability to analyze trends and patterns
Using larger sample sizes, researchers have more opportunities to find and analyze trends and patterns. The more data that supports a trend or pattern, the more trustworthy the trend becomes and the more useful for making decisions.
Historical context
Using a combination of older and recent data allows researchers to gain historical context about patterns and trends. Learning what’s happened before can help decision-makers gain a better current understanding and improve how they approach a problem or project.
Basis for further research
Ideally, you’ll use secondary research to further other efforts . Secondary sources help to identify knowledge gaps, highlight areas for improvement, or conduct deeper investigations.
Tip: Learn how to use Meltwater as a research tool and how Meltwater uses AI.
Secondary research comes with a few drawbacks, though these aren’t necessarily deal breakers when deciding to use secondary sources.
Reliability concerns
Researchers don’t always know where the data comes from or how it’s collected, which can lead to reliability concerns. They don’t control the initial process, nor do they always know the original purpose for collecting the data, both of which can lead to skewed results.
Potential bias
The original data collectors may have a specific agenda when doing their primary research, which may lead to biased findings. Evaluating the credibility and integrity of secondary data sources can prove difficult.
Outdated information
Secondary sources may contain outdated information, especially when dealing with rapidly evolving trends or fields. Using outdated information can lead to inaccurate conclusions and widen knowledge gaps.
Limitations in customization
Relying on secondary data means being at the mercy of what’s already published. It doesn’t consider your specific use cases, which limits you as to how you can customize and use the data.
A lack of relevance
Secondary research rarely holds all the answers you need, at least from a single source. You typically need multiple secondary sources to piece together a narrative, and even then you might not find the specific information you need.
To make secondary market research your new best friend, you’ll need to think critically about its strengths and find ways to overcome its weaknesses. Let’s review some best practices to use secondary research to its fullest potential.
Identify credible sources for secondary research
To overcome the challenges of bias, accuracy, and reliability, choose secondary sources that have a demonstrated history of excellence . For example, an article published in a medical journal naturally has more credibility than a blog post on a little-known website.

Assess credibility based on peer reviews, author expertise, sampling techniques, publication reputation, and data collection methodologies. Cross-reference the data with other sources to gain a general consensus of truth.
The more credibility “factors” a source has, the more confidently you can rely on it.
Evaluate the quality and relevance of secondary data
You can gauge the quality of the data by asking simple questions:
- How complete is the data?
- How old is the data?
- Is this data relevant to my needs?
- Does the data come from a known, trustworthy source?
It’s best to focus on data that aligns with your research objectives. Knowing the questions you want to answer and the outcomes you want to achieve ahead of time helps you focus only on data that offers meaningful insights.
Document your sources
If you’re sharing secondary data with others, it’s essential to document your sources to gain others’ trust. They don’t have the benefit of being “in the trenches” with you during your research, and sharing your sources can add credibility to your findings and gain instant buy-in.
Secondary market research offers an efficient, cost-effective way to learn more about a topic or trend, providing a comprehensive understanding of the customer journey . Compared to primary research, users can gain broader insights, analyze trends and patterns, and gain a solid foundation for further exploration by using secondary sources.
Meltwater for market research speeds up the time to value in using secondary research with AI-powered insights, enhancing your understanding of the customer journey. Using natural language processing, machine learning, and trusted data science processes, Meltwater helps you find relevant data and automatically surfaces insights to help you understand its significance. Our solution identifies hidden connections between data points you might not know to look for and spells out what the data means, allowing you to make better decisions based on accurate conclusions. Learn more about Meltwater's power as a secondary research solution when you request a demo by filling out the form below:
Continue Reading

How To Do Market Research: Definition, Types, Methods

What Are Consumer Insights? Meaning, Examples, Strategy

Market Intelligence 101: What It Is & How To Use It

The 13 Best Market Research Tools

Consumer Intelligence: Definition & Examples

9 Top Consumer Insights Tools & Companies

What Is Desk Research? Meaning, Methodology, Examples

Top Secondary Market Research Companies | Desk Research Companies
What is Secondary Research? Types, Methods, Examples
Appinio Research · 20.09.2023 · 13min read

Have you ever wondered how researchers gather valuable insights without conducting new experiments or surveys? That's where secondary research steps in—a powerful approach that allows us to explore existing data and information others collect.
Whether you're a student, a professional, or someone seeking to make informed decisions, understanding the art of secondary research opens doors to a wealth of knowledge.
What is Secondary Research?
Secondary Research refers to the process of gathering and analyzing existing data, information, and knowledge that has been previously collected and compiled by others. This approach allows researchers to leverage available sources, such as articles, reports, and databases, to gain insights, validate hypotheses, and make informed decisions without collecting new data.
Benefits of Secondary Research
Secondary research offers a range of advantages that can significantly enhance your research process and the quality of your findings.
- Time and Cost Efficiency: Secondary research saves time and resources by utilizing existing data sources, eliminating the need for data collection from scratch.
- Wide Range of Data: Secondary research provides access to vast information from various sources, allowing for comprehensive analysis.
- Historical Perspective: Examining past research helps identify trends, changes, and long-term patterns that might not be immediately apparent.
- Reduced Bias: As data is collected by others, there's often less inherent bias than in conducting primary research, where biases might affect data collection.
- Support for Primary Research: Secondary research can lay the foundation for primary research by providing context and insights into gaps in existing knowledge.
- Comparative Analysis : By integrating data from multiple sources, you can conduct robust comparative analyses for more accurate conclusions.
- Benchmarking and Validation: Secondary research aids in benchmarking performance against industry standards and validating hypotheses.
Primary Research vs. Secondary Research
When it comes to research methodologies, primary and secondary research each have their distinct characteristics and advantages. Here's a brief comparison to help you understand the differences.

Primary Research
- Data Source: Involves collecting new data directly from original sources.
- Data Collection: Researchers design and conduct surveys, interviews, experiments, or observations.
- Time and Resources: Typically requires more time, effort, and resources due to data collection.
- Fresh Insights: Provides firsthand, up-to-date information tailored to specific research questions.
- Control: Researchers control the data collection process and can shape methodologies.
Secondary Research
- Data Source: Involves utilizing existing data and information collected by others.
- Data Collection: Researchers search, select, and analyze data from published sources, reports, and databases.
- Time and Resources: Generally more time-efficient and cost-effective as data is already available.
- Existing Knowledge: Utilizes data that has been previously compiled, often providing broader context.
- Less Control: Researchers have limited control over how data was collected originally, if any.
Choosing between primary and secondary research depends on your research objectives, available resources, and the depth of insights you require.
Types of Secondary Research
Secondary research encompasses various types of existing data sources that can provide valuable insights for your research endeavors. Understanding these types can help you choose the most relevant sources for your objectives.
Here are the primary types of secondary research:
Internal Sources
Internal sources consist of data generated within your organization or entity. These sources provide valuable insights into your own operations and performance.
- Company Records and Data: Internal reports, documents, and databases that house information about sales, operations, and customer interactions.
- Sales Reports and Customer Data: Analysis of past sales trends, customer demographics, and purchasing behavior.
- Financial Statements and Annual Reports: Financial data, such as balance sheets and income statements, offer insights into the organization's financial health.
External Sources
External sources encompass data collected and published by entities outside your organization.
These sources offer a broader perspective on various subjects.
- Published Literature and Journals: Scholarly articles, research papers, and academic studies available in journals or online databases.
- Market Research Reports: Reports from market research firms that provide insights into industry trends, consumer behavior, and market forecasts.
- Government and NGO Databases: Data collected and maintained by government agencies and non-governmental organizations, offering demographic, economic, and social information.
- Online Media and News Articles: News outlets and online publications that cover current events, trends, and societal developments.
Each type of secondary research source holds its value and relevance, depending on the nature of your research objectives. Combining these sources lets you understand the subject matter and make informed decisions.
How to Conduct Secondary Research?
Effective secondary research involves a thoughtful and systematic approach that enables you to extract valuable insights from existing data sources. Here's a step-by-step guide on how to navigate the process:
1. Define Your Research Objectives
Before delving into secondary research, clearly define what you aim to achieve. Identify the specific questions you want to answer, the insights you're seeking, and the scope of your research.
2. Identify Relevant Sources
Begin by identifying the most appropriate sources for your research. Consider the nature of your research objectives and the data type you require. Seek out sources such as academic journals, market research reports, official government databases, and reputable news outlets.
3. Evaluate Source Credibility
Ensuring the credibility of your sources is crucial. Evaluate the reliability of each source by assessing factors such as the author's expertise, the publication's reputation, and the objectivity of the information provided. Choose sources that align with your research goals and are free from bias.
4. Extract and Analyze Information
Once you've gathered your sources, carefully extract the relevant information. Take thorough notes, capturing key data points, insights, and any supporting evidence. As you accumulate information, start identifying patterns, trends, and connections across different sources.
5. Synthesize Findings
As you analyze the data, synthesize your findings to draw meaningful conclusions. Compare and contrast information from various sources to identify common themes and discrepancies. This synthesis process allows you to construct a coherent narrative that addresses your research objectives.
6. Address Limitations and Gaps
Acknowledge the limitations and potential gaps in your secondary research. Recognize that secondary data might have inherent biases or be outdated. Where necessary, address these limitations by cross-referencing information or finding additional sources to fill in gaps.
7. Contextualize Your Findings
Contextualization is crucial in deriving actionable insights from your secondary research. Consider the broader context within which the data was collected. How does the information relate to current trends, societal changes, or industry shifts? This contextual understanding enhances the relevance and applicability of your findings.
8. Cite Your Sources
Maintain academic integrity by properly citing the sources you've used for your secondary research. Accurate citations not only give credit to the original authors but also provide a clear trail for readers to access the information themselves.
9. Integrate Secondary and Primary Research (If Applicable)
In some cases, combining secondary and primary research can yield more robust insights. If you've also conducted primary research, consider integrating your secondary findings with your primary data to provide a well-rounded perspective on your research topic.
You can use a market research platform like Appinio to conduct primary research with real-time insights in minutes!
10. Communicate Your Findings
Finally, communicate your findings effectively. Whether it's in an academic paper, a business report, or any other format, present your insights clearly and concisely. Provide context for your conclusions and use visual aids like charts and graphs to enhance understanding.
Remember that conducting secondary research is not just about gathering information—it's about critically analyzing, interpreting, and deriving valuable insights from existing data. By following these steps, you'll navigate the process successfully and contribute to the body of knowledge in your field.
Secondary Research Examples
To better understand how secondary research is applied in various contexts, let's explore a few real-world examples that showcase its versatility and value.
Market Analysis and Trend Forecasting
Imagine you're a marketing strategist tasked with launching a new product in the smartphone industry. By conducting secondary research, you can:
- Access Market Reports: Utilize market research reports to understand consumer preferences, competitive landscape, and growth projections.
- Analyze Trends: Examine past sales data and industry reports to identify trends in smartphone features, design, and user preferences.
- Benchmark Competitors: Compare market share, customer satisfaction, and pricing strategies of key competitors to develop a strategic advantage.
- Forecast Demand: Use historical sales data and market growth predictions to estimate demand for your new product.
Academic Research and Literature Reviews
Suppose you're a student researching climate change's effects on marine ecosystems. Secondary research aids your academic endeavors by:
- Reviewing Existing Studies: Analyze peer-reviewed articles and scientific papers to understand the current state of knowledge on the topic.
- Identifying Knowledge Gaps: Identify areas where further research is needed based on what existing studies still need to cover.
- Comparing Methodologies: Compare research methodologies used by different studies to assess the strengths and limitations of their approaches.
- Synthesizing Insights: Synthesize findings from various studies to form a comprehensive overview of the topic's implications on marine life.
Competitive Landscape Assessment for Business Strategy
Consider you're a business owner looking to expand your restaurant chain to a new location. Secondary research aids your strategic decision-making by:
- Analyzing Demographics: Utilize demographic data from government databases to understand the local population's age, income, and preferences.
- Studying Local Trends: Examine restaurant industry reports to identify the types of cuisines and dining experiences currently popular in the area.
- Understanding Consumer Behavior: Analyze online reviews and social media discussions to gauge customer sentiment towards existing restaurants in the vicinity.
- Assessing Economic Conditions: Access economic reports to evaluate the local economy's stability and potential purchasing power.
These examples illustrate the practical applications of secondary research across various fields to provide a foundation for informed decision-making, deeper understanding, and innovation.
Secondary Research Limitations
While secondary research offers many benefits, it's essential to be aware of its limitations to ensure the validity and reliability of your findings.
- Data Quality and Validity: The accuracy and reliability of secondary data can vary, affecting the credibility of your research.
- Limited Contextual Information: Secondary sources might lack detailed contextual information, making it important to interpret findings within the appropriate context.
- Data Suitability: Existing data might not align perfectly with your research objectives, leading to compromises or incomplete insights.
- Outdated Information: Some sources might provide obsolete information that doesn't accurately reflect current trends or situations.
- Potential Bias: While secondary data is often less biased, biases might still exist in the original data sources, influencing your findings.
- Incompatibility of Data: Combining data from different sources might pose challenges due to variations in definitions, methodologies, or units of measurement.
- Lack of Control: Unlike primary research, you have no control over how data was collected or its quality, potentially affecting your analysis. Understanding these limitations will help you navigate secondary research effectively and make informed decisions based on a well-rounded understanding of its strengths and weaknesses.
Secondary research is a valuable tool that businesses can use to their advantage. By tapping into existing data and insights, companies can save time, resources, and effort that would otherwise be spent on primary research. This approach equips decision-makers with a broader understanding of market trends, consumer behaviors, and competitive landscapes. Additionally, benchmarking against industry standards and validating hypotheses empowers businesses to make informed choices that lead to growth and success.
As you navigate the world of secondary research, remember that it's not just about data retrieval—it's about strategic utilization. With a clear grasp of how to access, analyze, and interpret existing information, businesses can stay ahead of the curve, adapt to changing landscapes, and make decisions that are grounded in reliable knowledge.
How to Conduct Secondary Research in Minutes?
In the world of decision-making, having access to real-time consumer insights is no longer a luxury—it's a necessity. That's where Appinio comes in, revolutionizing how businesses gather valuable data for better decision-making. As a real-time market research platform, Appinio empowers companies to tap into the pulse of consumer opinions swiftly and seamlessly.
- Fast Insights: Say goodbye to lengthy research processes. With Appinio, you can transform questions into actionable insights in minutes.
- Data-Driven Decisions: Harness the power of real-time consumer insights to drive your business strategies, allowing you to make informed choices on the fly.
- Seamless Integration: Appinio handles the research and technical complexities, freeing you to focus on what truly matters: making rapid data-driven decisions that propel your business forward.
Join the loop 💌
Be the first to hear about new updates, product news, and data insights. We'll send it all straight to your inbox.
Get the latest market research news straight to your inbox! 💌
Wait, there's more

07.05.2024 | 28min read
Interval Scale: Definition, Characteristics, Examples

03.05.2024 | 29min read
What is Qualitative Observation? Definition, Types, Examples

02.05.2024 | 32min read
What is a Perceptual Map and How to Make One? (+ Template)

What Is Secondary Data? A Complete Guide

What is secondary data, and why is it important? Find out in this post.
Within data analytics, there are many ways of categorizing data. A common distinction, for instance, is that between qualitative and quantitative data . In addition, you might also distinguish your data based on factors like sensitivity. For example, is it publicly available or is it highly confidential?
Probably the most fundamental distinction between different types of data is their source. Namely, are they primary, secondary, or third-party data? Each of these vital data sources supports the data analytics process in its own way. In this post, we’ll focus specifically on secondary data. We’ll look at its main characteristics, provide some examples, and highlight the main pros and cons of using secondary data in your analysis.
We’ll cover the following topics:
What is secondary data?
- What’s the difference between primary, secondary, and third-party data?
- What are some examples of secondary data?
- How to analyse secondary data
- Advantages of secondary data
- Disadvantages of secondary data
- Wrap-up and further reading
Ready to learn all about secondary data? Then let’s go.
1. What is secondary data?
Secondary data (also known as second-party data) refers to any dataset collected by any person other than the one using it.
Secondary data sources are extremely useful. They allow researchers and data analysts to build large, high-quality databases that help solve business problems. By expanding their datasets with secondary data, analysts can enhance the quality and accuracy of their insights. Most secondary data comes from external organizations. However, secondary data also refers to that collected within an organization and then repurposed.
Secondary data has various benefits and drawbacks, which we’ll explore in detail in section four. First, though, it’s essential to contextualize secondary data by understanding its relationship to two other sources of data: primary and third-party data. We’ll look at these next.

2. What’s the difference between primary, secondary, and third-party data?
To best understand secondary data, we need to know how it relates to the other main data sources: primary and third-party data.
What is primary data?
‘Primary data’ (also known as first-party data) are those directly collected or obtained by the organization or individual that intends to use them. Primary data are always collected for a specific purpose. This could be to inform a defined goal or objective or to address a particular business problem.
For example, a real estate organization might want to analyze current housing market trends. This might involve conducting interviews, collecting facts and figures through surveys and focus groups, or capturing data via electronic forms. Focusing only on the data required to complete the task at hand ensures that primary data remain highly relevant. They’re also well-structured and of high quality.
As explained, ‘secondary data’ describes those collected for a purpose other than the task at hand. Secondary data can come from within an organization but more commonly originate from an external source. If it helps to make the distinction, secondary data is essentially just another organization’s primary data.
Secondary data sources are so numerous that they’ve started playing an increasingly vital role in research and analytics. They are easier to source than primary data and can be repurposed to solve many different problems. While secondary data may be less relevant for a given task than primary data, they are generally still well-structured and highly reliable.
What is third-party data?
‘Third-party data’ (sometimes referred to as tertiary data) refers to data collected and aggregated from numerous discrete sources by third-party organizations. Because third-party data combine data from numerous sources and aren’t collected with a specific goal in mind, the quality can be lower.
Third-party data also tend to be largely unstructured. This means that they’re often beset by errors, duplicates, and so on, and require more processing to get them into a usable format. Nevertheless, used appropriately, third-party data are still a useful data analytics resource. You can learn more about structured vs unstructured data here .
OK, now that we’ve placed secondary data in context, let’s explore some common sources and types of secondary data.

3. What are some examples of secondary data?
External secondary data.
Before we get to examples of secondary data, we first need to understand the types of organizations that generally provide them. Frequent sources of secondary data include:
- Government departments
- Public sector organizations
- Industry associations
- Trade and industry bodies
- Educational institutions
- Private companies
- Market research providers
While all these organizations provide secondary data, government sources are perhaps the most freely accessible. They are legally obliged to keep records when registering people, providing services, and so on. This type of secondary data is known as administrative data. It’s especially useful for creating detailed segment profiles, where analysts hone in on a particular region, trend, market, or other demographic.
Types of secondary data vary. Popular examples of secondary data include:
- Tax records and social security data
- Census data (the U.S. Census Bureau is oft-referenced, as well as our favorite, the U.S. Bureau of Labor Statistics )
- Electoral statistics
- Health records
- Books, journals, or other print media
- Social media monitoring, internet searches, and other online data
- Sales figures or other reports from third-party companies
- Libraries and electronic filing systems
- App data, e.g. location data, GPS data, timestamp data, etc.
Internal secondary data
As mentioned, secondary data is not limited to that from a different organization. It can also come from within an organization itself.
Sources of internal secondary data might include:
- Sales reports
- Annual accounts
- Quarterly sales figures
- Customer relationship management systems
- Emails and metadata
- Website cookies
In the right context, we can define practically any type of data as secondary data. The key takeaway is that the term ‘secondary data’ doesn’t refer to any inherent quality of the data themselves, but to how they are used. Any data source (external or internal) used for a task other than that for which it was originally collected can be described as secondary data.

4. How to analyse secondary data
The process of analysing secondary data can be performed either quantitatively or qualitatively, depending on the kind of data the researcher is dealing with. The quantitative method of secondary data analysis is used on numerical data and is analyzed mathematically. The qualitative method uses words to provide in-depth information about data.
There are different stages of secondary data analysis, which involve events before, during, and after data collection. These stages include:
- Statement of purpose: Before collecting secondary data, you need to know your statement of purpose. This means you should have a clear awareness of the goal of the research work and how this data will help achieve it. This will guide you to collect the right data, then choosing the best data source and method of analysis.
- Research design: This is a plan on how the research activities will be carried out. It describes the kind of data to be collected, the sources of data collection, the method of data collection, tools used, and method of analysis. Once the purpose of the research has been identified, the researcher should design a research process that will guide the data analysis process.
- Developing the research questions: Once you’ve identified the research purpose, an analyst should also prepare research questions to help identify secondary data. For example, if a researcher is looking to learn more about why working adults are increasingly more interested in the “gig economy” as opposed to full-time work, they may ask, “What are the main factors that influence adults decisions to engage in freelance work?” or, “Does education level have an effect on how people engage in freelance work?
- Identifying secondary data: Using the research questions as a guide, researchers will then begin to identify relevant data from the sources provided. If the kind of data to be collected is qualitative, a researcher can filter out qualitative data—for example.
- Evaluating secondary data: Once relevant data has been identified and collates, it will be evaluated to ensure it fulfils the criteria of the research topic. Then, it is analyzed either using the quantitative or qualitative method, depending on the type of data it is.
You can learn more about secondary data analysis in this post .
5. Advantages of secondary data
Secondary data is suitable for any number of analytics activities. The only limitation is a dataset’s format, structure, and whether or not it relates to the topic or problem at hand.
When analyzing secondary data, the process has some minor differences, mainly in the preparation phase. Otherwise, it follows much the same path as any traditional data analytics project.
More broadly, though, what are the advantages and disadvantages of using secondary data? Let’s take a look.
Advantages of using secondary data
It’s an economic use of time and resources: Because secondary data have already been collected, cleaned, and stored, this saves analysts much of the hard work that comes from collecting these data firsthand. For instance, for qualitative data, the complex tasks of deciding on appropriate research questions or how best to record the answers have already been completed. Secondary data saves data analysts and data scientists from having to start from scratch.
It provides a unique, detailed picture of a population: Certain types of secondary data, especially government administrative data, can provide access to levels of detail that it would otherwise be extremely difficult (or impossible) for organizations to collect on their own. Data from public sources, for instance, can provide organizations and individuals with a far greater level of population detail than they could ever hope to gather in-house. You can also obtain data over larger intervals if you need it., e.g. stock market data which provides decades’-worth of information.
Secondary data can build useful relationships: Acquiring secondary data usually involves making connections with organizations and analysts in fields that share some common ground with your own. This opens the door to a cross-pollination of disciplinary knowledge. You never know what nuggets of information or additional data resources you might find by building these relationships.
Secondary data tend to be high-quality: Unlike some data sources, e.g. third-party data, secondary data tends to be in excellent shape. In general, secondary datasets have already been validated and therefore require minimal checking. Often, such as in the case of government data, datasets are also gathered and quality-assured by organizations with much more time and resources available. This further benefits the data quality , while benefiting smaller organizations that don’t have endless resources available.
It’s excellent for both data enrichment and informing primary data collection: Another benefit of secondary data is that they can be used to enhance and expand existing datasets. Secondary data can also inform primary data collection strategies. They can provide analysts or researchers with initial insights into the type of data they might want to collect themselves further down the line.
6. Disadvantages of secondary data
They aren’t always free: Sometimes, it’s unavoidable—you may have to pay for access to secondary data. However, while this can be a financial burden, in reality, the cost of purchasing a secondary dataset usually far outweighs the cost of having to plan for and collect the data firsthand.
The data isn’t always suited to the problem at hand: While secondary data may tick many boxes concerning its relevance to a business problem, this is not always true. For instance, secondary data collection might have been in a geographical location or time period ill-suited to your analysis. Because analysts were not present when the data were initially collected, this may also limit the insights they can extract.
The data may not be in the preferred format: Even when a dataset provides the necessary information, that doesn’t mean it’s appropriately stored. A basic example: numbers might be stored as categorical data rather than numerical data. Another issue is that there may be gaps in the data. Categories that are too vague may limit the information you can glean. For instance, a dataset of people’s hair color that is limited to ‘brown, blonde and other’ will tell you very little about people with auburn, black, white, or gray hair.
You can’t be sure how the data were collected: A structured, well-ordered secondary dataset may appear to be in good shape. However, it’s not always possible to know what issues might have occurred during data collection that will impact their quality. For instance, poor response rates will provide a limited view. While issues relating to data collection are sometimes made available alongside the datasets (e.g. for government data) this isn’t always the case. You should therefore treat secondary data with a reasonable degree of caution.
Being aware of these disadvantages is the first step towards mitigating them. While you should be aware of the risks associated with using secondary datasets, in general, the benefits far outweigh the drawbacks.
7. Wrap-up and further reading
In this post we’ve explored secondary data in detail. As we’ve seen, it’s not so different from other forms of data. What defines data as secondary data is how it is used rather than an inherent characteristic of the data themselves.
To learn more about data analytics, check out this free, five-day introductory data analytics short course . You can also check out these articles to learn more about the data analytics process:
- What is data cleaning and why is it important?
- What is data visualization? A complete introductory guide
- 10 Great places to find free datasets for your next project
- What is Secondary Data? + [Examples, Sources, & Analysis]

- Data Collection
Aside from consulting the primary origin or source, data can also be collected through a third party, a process common with secondary data. It takes advantage of the data collected from previous research and uses it to carry out new research.
Secondary data is one of the two main types of data, where the second type is the primary data. These 2 data types are very useful in research and statistics, but for the sake of this article, we will be restricting our scope to secondary data.
We will study secondary data, its examples, sources, and methods of analysis.
What is Secondary Data?
Secondary data is the data that has already been collected through primary sources and made readily available for researchers to use for their own research. It is a type of data that has already been collected in the past.
A researcher may have collected the data for a particular project, then made it available to be used by another researcher. The data may also have been collected for general use with no specific research purpose like in the case of the national census.
Data classified as secondary for particular research may be said to be primary for another research. This is the case when data is being reused, making it primary data for the first research and secondary data for the second research it is being used for.
Sources of Secondary Data
Sources of secondary data include books, personal sources, journals, newspapers, websitess, government records etc. Secondary data are known to be readily available compared to that of primary data. It requires very little research and needs for manpower to use these sources.
With the advent of electronic media and the internet, secondary data sources have become more easily accessible. Some of these sources are highlighted below.
Books are one of the most traditional ways of collecting data. Today, there are books available for all topics you can think of. When carrying out research, all you have to do is look for a book on the topic being researched, then select from the available repository of books in that area. Books, when carefully chosen are an authentic source of authentic data and can be useful in preparing a literature review.
- Published Sources
There are a variety of published sources available for different research topics. The authenticity of the data generated from these sources depends majorly on the writer and publishing company.
Published sources may be printed or electronic as the case may be. They may be paid or free depending on the writer and publishing company’s decision.
- Unpublished Personal Sources
This may not be readily available and easily accessible compared to the published sources. They only become accessible if the researcher shares with another researcher who is not allowed to share it with a third party.
For example, the product management team of an organization may need data on customer feedback to assess what customers think about their product and improvement suggestions. They will need to collect the data from the customer service department, which primarily collected the data to improve customer service.
Journals are gradually becoming more important than books these days when data collection is concerned. This is because journals are updated regularly with new publications on a periodic basis, therefore giving to date information.
Also, journals are usually more specific when it comes to research. For example, we can have a journal on, “Secondary data collection for quantitative data ” while a book will simply be titled, “Secondary data collection”.
In most cases, the information passed through a newspaper is usually very reliable. Hence, making it one of the most authentic sources of collecting secondary data.
The kind of data commonly shared in newspapers is usually more political, economic, and educational than scientific. Therefore, newspapers may not be the best source for scientific data collection.
The information shared on websites is mostly not regulated and as such may not be trusted compared to other sources. However, there are some regulated websites that only share authentic data and can be trusted by researchers.
Most of these websites are usually government websites or private organizations that are paid, data collectors.
Blogs are one of the most common online sources for data and may even be less authentic than websites. These days, practically everyone owns a blog, and a lot of people use these blogs to drive traffic to their website or make money through paid ads.
Therefore, they cannot always be trusted. For example, a blogger may write good things about a product because he or she was paid to do so by the manufacturer even though these things are not true.
They are personal records and as such rarely used for data collection by researchers. Also, diaries are usually personal, except for these days when people now share public diaries containing specific events in their life.
A common example of this is Anne Frank’s diary which contained an accurate record of the Nazi wars.
- Government Records
Government records are a very important and authentic source of secondary data. They contain information useful in marketing, management, humanities, and social science research.
Some of these records include; census data, health records, education institute records, etc. They are usually collected to aid proper planning, allocation of funds, and prioritizing of projects.
Podcasts are gradually becoming very common these days, and a lot of people listen to them as an alternative to radio. They are more or less like online radio stations and are generating increasing popularity.
Information is usually shared during podcasts, and listeners can use it as a source of data collection.
Some other sources of data collection include:
- Radio stations
- Public sector records.
What are the Secondary Data Collection Tools?
Popular tools used to collect secondary data include; bots, devices, libraries, etc. In order to ease the data collection process from the sources of secondary data highlighted above, researchers use these important tools which are explained below.
There are a lot of data online and it may be difficult for researchers to browse through all these data and find what they are actually looking for. In order to ease this process of data collection, programmers have created bots to do an automatic web scraping for relevant data.
These bots are “ software robots ” programmed to perform some task for the researcher. It is common for businesses to use bots to pull data from forums and social media for sentiment and competitive analysis.
- Internet-Enabled Devices
This could be a mobile phone, PC, or tablet that has access to an internet connection. They are used to access journals, books, blogs, etc. to collect secondary data.
This is a traditional secondary data collection tool for researchers. The library contains relevant materials for virtually all the research areas you can think of, and it is accessible to everyone.
A researcher might decide to sit in the library for some time to collect secondary data or borrow the materials for some time and return when done collecting the required data.
Radio stations are one of the secondary sources of data collection, and one needs radio to access them. The advent of technology has even made it possible to listen to the radio on mobile phones, deeming it unnecessary to get a radio.
Secondary Data Analysis
Secondary data analysis is the process of analyzing data collected from another researcher who primarily collected this data for another purpose. Researchers leverage secondary data to save time and resources that would have been spent on primary data collection.
The secondary data analysis process can be carried out quantitatively or qualitatively depending on the kind of data the researcher is dealing with. The quantitative method of secondary data analysis is used on numerical data and is analyzed mathematically, while the qualitative method uses words to provide in-depth information about data.
How to Analyse Secondary Data
There are different stages of secondary data analysis, which involve events before, during, and after data collection. These stages include;
- Statement of Purpose
Before collecting secondary data for analysis, you need to know your statement of purpose. That is, a clear understanding of why you are collecting the data—the ultimate aim of the research work and how this data will help achieve it.
This will help direct your path towards collecting the right data, and choosing the best data source and method of analysis.
- Research Design
This is a written-down plan on how the research activities will be carried out. It describes the kind of data to be collected, the sources of data collection, method of data collection, tools, and even method of analysis.
A research design may also contain a timestamp of when each of these activities will be carried out. Therefore, serving as a guide for the secondary data analysis.
After identifying the purpose of the research, the researcher should design a research process that will guide the data analysis process.
- Developing the Research Questions
It is not enough to just know the research purpose, you need to develop research questions that will help in better identifying Secondary data. This is because they are usually a pool of data to choose from, and asking the right questions will assist in collecting authentic data.
For example, a researcher trying to collect data about the best fish feeds to enable fast growth in fishes will have to ask questions like, What kind of fish is considered? Is the data meant to be quantitative or qualitative? What is the content of the fish feed? The growth rate in fishes after feeding on it, and so on.
- Identifying Secondary Data
After developing the research questions, researchers use them as a guide to identifying relevant data from the data repository. For example, if the kind of data to be collected is qualitative, a researcher can filter out qualitative data.
The suitable secondary data will be the one that correctly answers the questions highlighted above. When looking for the solutions to a linear programming problem, for instance, the solutions will be numbers that satisfy both the objective and the constraints.
Any answer that doesn’t satisfy both, is not a solution.
- Evaluating Secondary Data
This stage is what many classify as the real data analysis stage because it is the point where analysis is actually performed. However, the stages highlighted above are a part of the data analysis process, because they influence how the analysis is performed.
Once a dataset that appears viable in addressing the initial requirements discussed above is located, the next step in the process is the evaluation of the dataset to ensure the appropriateness for the research topic. The data is evaluated to ensure that it really addresses the statement of the problem and answers the research questions.
After which it will now be analyzed either using the quantitative method or the qualitative method depending on the type of data it is.
Advantages of Secondary Data
- Ease of Access
Most of the sources of secondary data are easily accessible to researchers. Most of these sources can be accessed online through a mobile device. People who do not have access to the internet can also access them through print.
They are usually available in libraries, book stores, and can even be borrowed from other people.
- Inexpensive
Secondary data mostly require little to no cost for people to acquire them. Many books, journals, and magazines can be downloaded for free online. Books can also be borrowed for free from public libraries by people who do not have access to the internet.
Researchers do not have to spend money on investigations, and very little is spent on acquiring books if any.
- Time-Saving
The time spent on collecting secondary data is usually very little compared to that of primary data. The only investigation necessary for secondary data collection is the process of sourcing for necessary data sources.
Therefore, cutting the time that would normally be spent on the investigation. This will save a significant amount of time for the researcher
- Longitudinal and Comparative Studies
Secondary data makes it easy to carry out longitudinal studies without having to wait for a couple of years to draw conclusions. For example, you may want to compare the country’s population according to census 5 years ago, and now.
Rather than waiting for 5 years, the comparison can easily be made by collecting the census 5 years ago and now.
- Generating new insights
When re-evaluating data, especially through another person’s lens or point of view, new things are uncovered. There might be a thing that wasn’t discovered in the past by the primary data collector, that secondary data collection may reveal.
For example, when customers complain about difficulty using an app to the customer service team, they may decide to create a user guide teaching customers how to use it. However, when a product developer has access to this data, it may be uncovered that the issue came from and UI/UX design that needs to be worked on.
Disadvantages of Secondary Data
- Data Quality:
The data collected through secondary sources may not be as authentic as when collected directly from the source. This is a very common disadvantage with online sources due to a lack of regulatory bodies to monitor the kind of content that is being shared.
Therefore, working with this kind of data may have negative effects on the research being carried out.
- Irrelevant Data:
Researchers spend so much time surfing through a pool of irrelevant data before finally getting the one they need. This is because the data was not collected mainly for the researcher.
In some cases, a researcher may not even find the exact data he or she needs, but have to settle for the next best alternative.
- Exaggerated Data
Some data sources are known to exaggerate the information that is being shared. This bias may be some to maintain a good public image or due to a paid advert.
This is very common with many online blogs that even go a bead to share false information just to gain web traffic. For example, a FinTech startup may exaggerate the amount of money it has processed just to attract more customers.
A researcher gathering this data to investigate the total amount of money processed by FinTech startups in the US for the quarter may have to use this exaggerated data.
- Outdated Information
Some of the data sources are outdated and there are no new available data to replace the old ones. For example, the national census is not usually updated yearly.
Therefore, there have been changes in the country’s population since the last census. However, someone working with the country’s population will have to settle for the previously recorded figure even though it is outdated.
Secondary data has various uses in research, business, and statistics. Researchers choose secondary data for different reasons, with some of it being due to price, availability, or even needs of the research.
Although old, secondary data may be the only source of data in some cases. This may be due to the huge cost of performing research or due to its delegation to a particular body (e.g. national census).
In short, secondary data has its shortcomings, which may affect the outcome of the research negatively and also some advantages over primary data. It all depends on the situation, the researcher in question, and the kind of research being carried out.
Connect to Formplus, Get Started Now - It's Free!
- advantages of secondary data
- secondary data analysis
- secondary data examples
- sources of secondary data
- busayo.longe
You may also like:
What is Numerical Data? [Examples,Variables & Analysis]
A simple guide on numerical data examples, definitions, numerical variables, types and analysis
Categorical Data: Definition + [Examples, Variables & Analysis]
A simple guide on categorical data definitions, examples, category variables, collection tools and its disadvantages
Brand vs Category Development Index: Formula & Template
In this article, we are going to break down the brand and category development index along with how it applies to all brands in the market.
Primary vs Secondary Data:15 Key Differences & Similarities
Simple guide on secondary and primary data differences on examples, types, collection tools, advantages, disadvantages, sources etc.
Formplus - For Seamless Data Collection
Collect data the right way with a versatile data collection tool. try formplus and transform your work productivity today..
Chapter 2: Sociological Research
Research methods: secondary data analysis, learning outcomes.
- Describe secondary data analysis
Secondary Data
While sociologists often engage in original research studies, they also contribute knowledge to the discipline through secondary data analysis . Secondary data do not result from firsthand research collected from primary sources, but are the already completed work of other researchers. Sociologists might study works written by historians, economists, teachers, or early sociologists. They might search through periodicals, newspapers, or magazines from any period in history.
Figure 1. This 1930 Chicago census record is an example of secondary data.
Using available information not only saves time and money but can also add depth to a study. Sociologists often interpret findings in a new way, a way that was not part of an author’s original purpose or intention. To study how women were encouraged to act and behave in the 1960s, for example, a researcher might watch movies, televisions shows, and situation comedies from that period. Or to research changes in behavior and attitudes due to the emergence of television in the late 1950s and early 1960s, a sociologist would rely on new interpretations of secondary data. Decades from now, researchers will most likely conduct similar studies on the advent of mobile phones, the Internet, or Facebook.
Content Analysis of Poor in Magazines
Martin Gilens (1996) wanted to find out why survey research shows that the American public substantially exaggerates the percentage of African Americans among the poor. He examined whether media representations influence public perceptions and did a content analysis of photographs of poor people in American news magazines. He coded and then systematically recorded incidences of three variables: (1) Race: white, black, indeterminate; (2) Employed: working, not working; and (3) Age.
Gilens discovered that not only were African Americans markedly over-represented in news magazine photographs of poverty, but that the photos also tended to under-represent “sympathetic” subgroups of the poor—the elderly and working poor—while over-representing less sympathetic groups—unemployed, working age adults. Gilens concluded that by providing a distorted representation of poverty, U.S. news magazines “reinforce negative stereotypes of blacks as mired in poverty and contribute to the belief that poverty is primarily a ‘black problem’” (1996).
Social scientists also learn by analyzing the research of a variety of agencies. Governmental departments and global groups, like the U.S. Bureau of Labor Statistics or the World Health Organization, publish studies with findings that are useful to sociologists. A public statistic like the foreclosure rate might be useful for studying the effects of the 2008 recession; a racial demographic profile might be compared with data on education funding to examine the resources accessible to different groups.
One of the advantages of secondary data is that they are nonreactive research (or unobtrusive research), meaning that they do not include direct contact with subjects and will not alter or influence people’s behaviors. Unlike studies requiring direct contact with people, using previously published data doesn’t require entering a population, with all the investment and potential risks inherent in that research process.
Using available data does have its challenges. Public records are not always easy to access. A researcher will need to do some legwork to track them down and gain access to records. To guide the search through a vast library of materials and avoid wasting time reading unrelated sources, sociologists employ content analysis , applying a systematic approach to record and value information gleaned from secondary data as they relate to the study at hand.
But, in some cases, there is no way to verify the accuracy of existing data. It is easy to count how many drunk drivers, for example, are pulled over by the police. But how many are not? While it is possible to discover the percentage of teenage students who drop out of high school, it might be more challenging to determine the number who return to school or get their GED later.
Another problem arises when data are unavailable in the exact form needed or do not include the precise angle the researcher seeks. For example, the average salaries paid to professors at a public school is a matter of public record. But the separate figures do not necessarily reveal how long it took each professor to reach the salary range, what their educational backgrounds are, or how long the have been teaching.
When conducting content analysis, it is important to consider the date of publication of an existing source and to take into account attitudes and common cultural ideals that may have influenced the research. For example, Robert S. Lynd and Helen Merrell Lynd gathered research for their book Middletown: A Study in Modern American Culture in the 1920s. Attitudes and cultural norms were vastly different then than they are now. Beliefs about gender roles, race, education, and work have changed significantly since then. At the time, the study’s purpose was to reveal the truth about small U.S. communities. Today, it is an illustration of attitudes and values of the 1920s.

Comparative effectiveness research methodology using secondary data: A starting user's guide
Affiliations.
- 1 Division of Urological Surgery and Center for Surgery and Public Health, Brigham and Women's Hospital, Harvard Medical School, Boston, MA; The Lank Center for Genitourinary Oncology, Medical Oncology, Dana-Farber Cancer Institute, Harvard Medical School, Boston, MA. Electronic address: [email protected].
- 2 Division of Urological Surgery and Center for Surgery and Public Health, Brigham and Women's Hospital, Harvard Medical School, Boston, MA.
- PMID: 29146037
- DOI: 10.1016/j.urolonc.2017.10.011
Background: The use of secondary data, such as claims or administrative data, in comparative effectiveness research has grown tremendously in recent years.
Purpose: We believe that the current review can help investigators relying on secondary data to (1) gain insight into both the methodologies and statistical methods, (2) better understand the necessity of a rigorous planning before initiating a comparative effectiveness investigation, and (3) optimize the quality of their investigations.
Main findings: Specifically, we review concepts of adjusted analyses and confounders, methods of propensity score analyses, and instrumental variable analyses, risk prediction models (logistic and time-to-event), decision-curve analysis, as well as the interpretation of the P value and hypothesis testing.
Conclusions: Overall, we hope that the current review article can help research investigators relying on secondary data to perform comparative effectiveness research better understand the necessity of a rigorous planning before study start, and gain better insight in the choice of statistical methods so as to optimize the quality of the research study.
Keywords: Comparative effectiveness research; Oncology; Review; Secondary data; Urology.
Copyright © 2017 Elsevier Inc. All rights reserved.
Publication types
- Comparative Effectiveness Research / methods
- Comparative Effectiveness Research / standards*
- Guidelines as Topic
- Logistic Models
- Medical Oncology / methods*
- Medical Oncology / standards
- Propensity Score
- Research Design / standards*
- Risk Assessment / methods
- Urology / methods*
- Urology / standards

Want to create or adapt books like this? Learn more about how Pressbooks supports open publishing practices.
Integrated Primary & Secondary Research
5 Types of Secondary Research Data

Secondary sources allow you to broaden your research by providing background information, analyses, and unique perspectives on various elements for a specific campaign. Bibliographies of these sources can lead to the discovery of further resources to enhance research for organizations.
There are two common types of secondary data: Internal data and External data. Internal data is the information that has been stored or organized by the organization itself. External data is the data organized or collected by someone else.
Internal Secondary Sources
Internal secondary sources include databases containing reports from individuals or prior research. This is often an overlooked resource—it’s amazing how much useful information collects dust on an organization’s shelves! Other individuals may have conducted research of their own or bought secondary research that could be useful to the task at hand. This prior research would still be considered secondary even if it were performed internally because it was conducted for a different purpose.
External Secondary Sources
A wide range of information can be obtained from secondary research. Reliable databases for secondary sources include Government Sources, Business Source Complete, ABI, IBISWorld, Statista, and CBCA Complete. This data is generated by others but can be considered useful when conducting research into a new scope of the study. It also means less work for a non-for-profit organization as they would not have to create their own data and instead can piggyback off the data of others.
Examples of Secondary Sources
Government sources.
A lot of secondary data is available from the government, often for free, because it has already been paid for by tax dollars. Government sources of data include the Census Bureau, the Bureau of Labor Statistics, and the National Centre for Health Statistics.
For example, through the Census Bureau, the Bureau of Labor Statistics regularly surveys individuals to gain information about them (Bls.gov, n.d). These surveys are conducted quarterly, through an interview survey and a diary survey, and they provide data on expenditures, income, and household information (families or single). Detailed tables of the Expenditures Reports include the age of the reference person, how long they have lived in their place of residence and which geographic region they live in.
Syndicated Sources
A syndicated survey is a large-scale instrument that collects information about a wide variety of people’s attitudes and capital expenditures. The Simmons Market Research Bureau conducts a National Consumer Survey by randomly selecting families throughout the country that agree to report in great detail what they eat, read, watch, drive, and so on. They also provide data about their media preferences.
Other Types of Sources
Gallup, which has a rich tradition as the world’s leading public opinion pollster, also provides in-depth reports based on its proprietary probability-based techniques (called the Gallup Panel), in which respondents are recruited through a random digit dial method so that results are more reliably generalizable. The Gallup organization operates one of the largest telephone research data-collection systems in the world, conducting more than twenty million interviews over the last five years and averaging ten thousand completed interviews per day across two hundred individual survey research questionnaires (GallupPanel, n.d).
Attribution
This page contains materials taken from:
Bls.gov. (n.d). U.S Bureau of Labor Statistics. Retrieved from https://www.bls.gov/
Define Quantitative and Qualitative Evidence. (2020). Retrieved July 23, 2020, from http://sgba-resource.ca/en/process/module-8-evidence/define-quantitative-and-qualitative-evidence/
GallupPanel. (n.d). Gallup Panel Research. Retrieved from http://www.galluppanel.com
Secondary Data. (2020). Retrieved July 23, 2020, from https://2012books.lardbucket.org/books/advertising-campaigns-start-to-finish/s08-03-secondary-data.html
An Open Guide to Integrated Marketing Communications (IMC) Copyright © by Andrea Niosi and KPU Marketing 4201 Class of Summer 2020 is licensed under a Creative Commons Attribution-NonCommercial-ShareAlike 4.0 International License , except where otherwise noted.
Share This Book
This paper is in the following e-collection/theme issue:
Published on 8.5.2024 in Vol 26 (2024)
Application of Patient-Reported Outcome Measurements in Adult Tumor Clinical Trials in China: Cross-Sectional Study
Authors of this article:
Original Paper
- Yan Jia 1, 2 * ;
- Qi Li 1, 2 * ;
- Xiaowen Zhang 1 , MS ;
- Yi Yan 3 ;
- Shiyan Yan 4 , PhD ;
- Shunping Li 5 , PhD ;
- Wei Li 6 , PhD ;
- Xiaowen Wu 7 , PhD ;
- Hongguo Rong 1, 8 * , PhD ;
- Jianping Liu 1, 8 , PhD
1 Center for Evidence-Based Chinese Medicine, Beijing University of Chinese Medicine, Beijing, China
2 Dongzhimen Hospital, Beijing University of Chinese Medicine, Beijing, China
3 School of Traditional Chinese Medicine, Beijing University of Chinese Medicine, Beijing, China
4 College of Acupuncture and Massage, Beijing University of Chinese Medicine, Beijing, China
5 Centre for Health Management and Policy Research, Shandong University, Shandong, China
6 International Research Center for Medicinal Administration, Peking University, Beijing, China
7 Peking University Cancer Hospital & Institute, Peking University, Beijng, China
8 Institute for Excellence in Evidence-Based Chinese Medicine, Beijing University of Chinese Medicine, Beijing, China
*these authors contributed equally
Corresponding Author:
Hongguo Rong, PhD
Center for Evidence-Based Chinese Medicine
Beijing University of Chinese Medicine
No. 11 Beisanhuan East Road, Chaoyang District
Beijing, 100029
Phone: 86 (10)64286757
Email: [email protected]
Background: International health policies and researchers have emphasized the value of evaluating patient-reported outcomes (PROs) in clinical studies. However, the characteristics of PROs in adult tumor clinical trials in China remain insufficiently elucidated.
Objective: This study aims to assess the application and characteristics of PRO instruments as primary or secondary outcomes in adult randomized clinical trials related to tumors in China.
Methods: This cross-sectional study identified tumor-focused randomized clinical trials conducted in China between January 1, 2010, and June 30, 2022. The ClinicalTrials.gov database and the Chinese Clinical Trial Registry were selected as the databases. Trials were classified into four groups based on the use of PRO instruments: (1) trials listing PRO instruments as primary outcomes, (2) trials listing PRO instruments as secondary outcomes, (3) trials listing PRO instruments as coprimary outcomes, and (4) trials without any mention of PRO instruments. Pertinent data, including study phase, settings, geographic regions, centers, participant demographics (age and sex), funding sources, intervention types, target diseases, and the names of PRO instruments, were extracted from these trials. The target diseases involved in the trials were grouped according to the American Joint Committee on Cancer Staging Manual, 8th Edition .
Results: Among the 6445 trials examined, 2390 (37.08%) incorporated PRO instruments as part of their outcomes. Within this subset, 26.82% (641/2390) listed PRO instruments as primary outcomes, 52.72% (1260/2390) as secondary outcomes, and 20.46% (489/2390) as coprimary outcomes. Among the 2,155,306 participants included in these trials, PRO instruments were used to collect data from 613,648 (28.47%) patients as primary or secondary outcomes and from 74,287 (3.45%) patients as coprimary outcomes. The most common conditions explicitly using specified PRO instruments included thorax tumors (217/1280, 16.95%), breast tumors (176/1280, 13.75%), and lower gastrointestinal tract tumors (173/1280, 13.52%). Frequently used PRO instruments included the European Organisation for Research and Treatment of Cancer Quality of Life Core Questionnaire–30, the visual analog scale, the numeric rating scale, the Traditional Chinese Medicine Symptom Scale, and the Pittsburgh Sleep Quality Index.
Conclusions: Over recent years, the incorporation of PROs has demonstrated an upward trajectory in adult randomized clinical trials on tumors in China. Nonetheless, the infrequent measurement of the patient’s voice remains noteworthy. Disease-specific PRO instruments should be more effectively incorporated into various tumor disease categories in clinical trials, and there is room for improvement in the inclusion of PRO instruments as clinical trial end points.
Introduction
Patient-reported outcome (PRO) instruments are defined as any report regarding a patient’s health status obtained directly from the patient, excluding interpretation of the patient’s responses by clinicians or other individuals [ 1 ]. PRO data consist of information obtained directly from patients concerning their health status, symptoms, treatment adherence, physical and social functioning, health-related quality of life, and satisfaction with health care [ 2 - 4 ]. Serving as noninvasive, comprehensive, and patient-centered metrics, PROs play a pivotal role in enhancing patient engagement, facilitating informed clinical decisions, and improving patient-clinician communication [ 5 - 9 ]. High-quality PRO measures examined in rigorous trials can evaluate treatment effectiveness, assess patient adherence to treatment, guide drug research, and inform health care policies [ 2 , 5 ]. In addition, some PRO instruments could supplement safety data and contribute to the assessment of tolerability (eg, Patient-Reported Outcomes version of the Common Terminology Criteria for Adverse Events [PRO-CTCAE]) [ 2 , 5 ].
In particular, PROs are valuable end points in trials of disabling, chronic, and incurable conditions because they systematically capture the patients’ perspectives in a scientifically rigorous way [ 3 , 10 , 11 ]. Recognizing their importance, clinical trials focused on tumors are increasingly incorporating PRO instruments as primary or secondary outcomes [ 12 - 15 ]. The European Commission has indicated the priority of preventing cancer and ensuring a high quality of life for patients with cancer within the framework of Europe’s Beating Cancer Plan [ 16 ]. The incorporation of PROs in clinical trials offers distinct advantages, including improvements in health-related quality of life, patient-clinician communication, and economic benefits from reduced health care use [ 17 - 20 ]. To uphold best practices in tumor clinical trials that use PROs, several methodological recommendations have emerged in recent years, such as SPIRIT-PRO (Standard Protocol Items: Recommendations for Interventional Trials–Patient-Reported Outcome), CONSORT-PRO (Consolidated Standards of Reporting Trials–Patient-Reported Outcome), SISAQOL (Setting International Standards in Analysing Patient-Reported Outcomes and Quality of Life Endpoints), and other relevant guidelines [ 2 - 4 , 21 ]. However, PRO measures often receive lower priority in the design of oncology-related clinical trials when compared to survival, imaging, and biomarker-related outcomes [ 22 ].
In China, PROs are increasingly being used in clinical trials, but there are challenges as well. A cross-sectional survey of interventional clinical trials conducted in China revealed that only 29.7% of the included trials listed PRO instruments as primary or secondary outcomes [ 23 ]. Moreover, there is a notable absence of comprehensive assessments evaluating the application of PRO instruments in tumor clinical trials in China. Unlike previous cross-sectional studies that encompassed all types of clinical trials, our study primarily examined adult tumor clinical trials in China that have listed PRO instruments as primary or secondary outcomes, referencing the methodologies and reporting patterns of a previous study [ 23 ]. We extracted the registration information of adult randomized clinical trials conducted in China to systematically analyze the application of PRO instruments in tumor clinical trials, aiming to evaluate the application of PRO instruments in adult tumor clinical trials in China and provide potential directions for further investigation.
Study Design
This cross-sectional study was designed to describe the characteristics of adult tumor clinical trials conducted in China between January 1, 2010, and June 30, 2022, that listed PRO instruments as primary or secondary outcomes. All clinical trials should be registered, and data of clinical trials were collected from 2 clinical trial registries, namely ClinicalTrials.gov and the Chinese Clinical Trial Registry, with public disclosure. We conducted data retrieval and export in July 2022. The clinical trials covered 34 provincial-level administrative regions in accordance with the 2019 version of China’s administrative divisions. We further sought to describe the PRO instruments frequently used in trials encompassing diverse target tumor conditions.
Data Collection Strategy
This study focused on interventional randomized clinical trials conducted in China involving participants aged ≥18 years ( Figure 1 ). Duplicate trials with 2 registration identification numbers were treated as a single trial (ClinicalTrials.gov records were retained). The evaluation of tumor clinical trials included three types of information: (1) basic information (registration number, registration date, scientific name, recruiting country, and other information), (2) key information (outcome, target disease, and age and sex of participants), and (3) characteristic information (main sponsor’s location, study settings, number of setting centers, study stage, funding source, and intervention type).

Data Classification
PRO instruments were defined by the US Food and Drug Administration in 2009 [ 1 ] as any report about a patient’s health status obtained directly from the patient, excluding interpretation of the patient’s response by clinicians or other individuals. Trials using PRO instruments as primary or secondary outcomes were considered PRO trials. On the basis of a previous study of PRO labeling of new US Food and Drug Administration–approved drugs (2016-2020) [ 24 ], eligible trials were classified into four groups: (1) trials that listed PRO instruments as primary outcomes, (2) trials that listed PRO instruments as secondary outcomes, (3) trials that listed PRO instruments as coprimary outcomes, and (4) trials without any mention of PRO instruments.
Statistical Analysis
Data related to the characteristics of the included trials (clinical phase, study setting, participant age and sex, region of the primary sponsor, setting center, number of PROs, funding source, and type of intervention) were extracted independently by 2 authors with a predesigned data extraction table. Owing to the varied categories and wide variation of target diseases, we classified similar target diseases based on classifications from the American Joint Committee on Cancer Staging Manual, 8th Edition ( Multimedia Appendix 1 ). On the basis of this categorization of diseases, we consolidated the PRO instruments used in each trial to identify those used most frequently. We conducted quantitative analysis only on items that listed the names of PRO instruments for a more detailed understanding of the commonly used evaluation tools. All data analyses were performed using Stata (version 14.0; StataCorp LLC).
Ethical Considerations
According to the Common Rule (45 CFR part 46) of the US Department of Health and Human Services (Office for Human Research Protections), this study is exempt from institutional review board approval and the requirement for informed patient consent because it did not involve clinical data or human participants. This study followed the STROBE (Strengthening the Reporting of Observational Studies in Epidemiology) reporting guidelines designed for observational studies in epidemiology.
Trial Characteristics
Table 1 presents a comprehensive overview of the included trials. The study included 7251 tumor-focused randomized controlled trials conducted in China between January 1, 2010, and June 30, 2022. Of these 7251 trials, 3276 (45.18%) were sourced from ClinicalTrials.gov, and 3975 (54.82%) were identified from the Chinese Clinical Trial Registry. Of these 7251 trials, after excluding 806 (11.12%) trials (n=5, 0.6% duplicates; n=465, 57.7% non-Chinese trials; n=321, 39.8% trials involving children; and n=15, 1.9% trials with incomplete reports), 6445 (88.88%) eligible trials were identified for analysis.
a The early phase trials included a clinical pretest as well as phase 0 and phase 1 trials.
b Diagnostic new technique clinical study, inspection technology, and trials involving multiple phases.
c Rehabilitation center, nursing home, campus, centers for disease control, home, and research institute.
d The trials were conducted in China, but their sponsor was based overseas.
e N/A: not applicable.
f Combination trials were funded partly by industry and partly by nonindustry institutions, such as universities, hospitals, and so on.
Of the 2,155,306 participants recruited in all included trials, 139,297 (6.46%) were involved in trials with PRO instruments as primary outcomes, 400,064 (18.56%) in trials with PRO instruments as secondary outcomes, and 74,287 (3.45%) in trials with PRO instruments as coprimary outcomes. Among the 6445 trials included, 2390 (37.08%) used PRO instruments as either primary or secondary outcomes, while 4055 (62.92%) did not use any PRO instrument.
The majority of the studies (6098/6445, 94.62%) did not impose any age restrictions on participants (children were excluded). In trials involving PROs, the proportion of older participants (aged >65 y; 42/2390, 1.78%) was slightly higher than in those without PROs (100/6445, 1.55%). Among all trials that incorporated PRO measurements, 17.15% (410/2390) included only female participants, while 4.48% (107/2390) included only male participants. Furthermore, in trials involving only female participants, the vast majority (974/1000, 97.4%) studied breast and female reproductive organ tumors. In trials exclusively involving male participants, more than half (135/267, 50.5%) centered around male genital organ tumors.
Regarding trial phases, of the 6445 clinical trials, early phase trials were the most prevalent (n=1317, 20.43%), followed by phase 3 trials (n=1004, 15.58%), phase 2 trials (n=873, 13.56%), and phase 4 trials (n=779, 12.09%). Of the 2390 PRO-related trials, early phase trials were again the most common (n=575, 24.06%), followed by phase 3 trials (n=284, 11.88%), phase 4 trials (n=269, 11.26%), and phase 2 trials (n=218, 9.12%).
Most of the trials (6034/6445, 93.62%) were conducted in hospitals, with hardly any (3/6445, 0.05%) conducted in community settings. More than half of the primary sponsors were located in eastern China (3745/6445, 58.11%), followed by northern (797/6445, 12.37%) and southern (682/6445, 10.58%) China, while 18.85% (1215/6445) of the primary sponsors were situated in other regions of China, such as the southwestern, central, northwestern, and northeastern regions. Similar patterns were observed for studies involving PROs. The majority of the major sponsors (1916/2390, 80.17%) originated from the eastern, northern, and southern regions of China, while 19.79% (473/2390) hailed from the southwestern, central, northeastern, and northwestern regions. There were differences in the proportions of PRO trials were noted among different provinces; the distribution of PRO instruments across Chinese provinces can be found in Multimedia Appendix 2 .
Moreover, 87.29% (5626/6445) of the trials were single-center trials, and only 11.11% (716/6445) were multicenter trials. Similar phenomena were observed for PRO-related studies, but multicenter trials accounted for a slightly higher percentage (312/2390, 13.05%). Of the 2390 PRO trials, 2144 (89.71%) used 1 to 3 PRO instruments, followed by 4 to 6 (n=218, 9.12%) and 7 to 9 (n=25, 1.05%) PRO instruments. The majority of the trials were nonindustry-funded trials (5443/6445, 84.45%), while 11.67% (752/6445) were industry-funded trials.
Table 2 shows the frequency of intervention types used across different trial classifications. The data indicated that more than a third of the included trials used drugs as the intervention (2496/6445, 38.73%), followed by combination therapies (1350/6445, 20.95%) and surgery (1044/6445, 16.2%). Among clinical trials involving drug interventions, nearly four-tenths (989/2496, 39.62%) used PRO instruments as their outcomes. Trials using drugs as the intervention exhibited a higher incidence of using PRO instruments as their primary or coprimary outcomes (468/989, 47.32%) compared to trials using other intervention types.
a PRO: patient-reported outcome.
b Other interventions included acupuncture, physical exercise, and psychosocial treatment.
Conditions and Participants
The annual counts of tumor clinical trials are listed in Figure 2 . During the study period—from January 1, 2010, to June 30, 2022—the number of tumor clinical trial registrations exhibited a consistent upward trajectory, paralleled by a commensurate increase in the number of clinical trials related to PROs.

Figures 3 and 4 depict the distribution of trial counts and corresponding participant numbers across different tumor types, respectively, wherein PROs served as outcomes. Among the 2390 tumor-related trials that used PRO instruments as primary or secondary outcomes, the top 5 tumors were thorax (448/2390, 18.74%), upper gastrointestinal tract (306/2390, 12.8%), lower gastrointestinal tract (300/2390, 12.55%), breast (289/2390, 12.09%), and head and neck (177/2390, 7.41%) tumors. Trials regarding female reproductive organ (168/2390, 7.03%) and hepatobiliary system (146/2390, 6.11%) tumors were also frequently observed. Male genital organ tumors (56/2390, 2.34%), central nervous system tumors (51/2390, 2.13%), endocrine system tumors (47/2390, 1.97%), and urinary tract tumors (33/2390, 1.38%) all accounted for proportions ranging from 1% to 5%, and hematologic malignant tumors (22/2390, 0.92%), neuroendocrine tumors (14/2390, 0.59%), bone tumors (8/2390, 0.33%), skin tumors (4/2390, 0.17%), ophthalmic tumors (2/2390, 0.08%), and soft tissue sarcoma (1/2390, 0.04%) constituted <1% of the trials.

Among the 613,648 participants enrolled in these PRO trials, 134,940 (22%) were diagnosed with lower gastrointestinal tract tumors, 131,470 (21.42%) with upper gastrointestinal tract tumors, and 79,068 (12.88%) with thorax tumors. Furthermore, there were a number of patients with breast tumors (63,238/613,648, 10.31%), female reproductive organ tumors (440,975/613,648, 6.68%), head and neck tumors (35,642/613,648, 5.81%), or hepatobiliary system tumors (22,044/613,648, 3.59%), each involving >10,000 patients. By contrast, conditions with <10,000 participants encompassed central nervous system tumors (8897/613,648, 1.45%), endocrine system tumors (8472/613,648, 1.38%), male genital organ tumors (8357/613,648, 1.36%), urinary tract tumors (6784/613,648, 1.11%), neuroendocrine tumors (3539/613,648, 0.58%), hematologic malignant tumors (2629/613,648, 0.43%), bone tumors (825/613,648, 0.13%), skin tumors (311/613,648, 0.05%), ophthalmic tumors (274/613,648, 0.04%), and soft tissue sarcoma (266/613,648, 0.04%).
PRO Instruments Used in Clinical Trials
Table 3 presents the number of explicitly specified PROs where trials precisely listed the names of the PRO instruments and the number of implicitly specified PROs where trials referenced patients’ subjective feelings without specifying the instruments used, separately for the 3 trial types. Specifically, the trial that specified the PRO instruments used was classified into “explicitly specified PROs,” and the trial that did not specify the instruments used was classified into “implicitly specified PROs.” It was evident that in primary and coprimary outcome trial sets, a greater number of trials explicitly listed the PRO instruments compared to those that did not specify the instruments used. Among the 3 trial types, the coprimary outcome category exhibited the highest proportion of explicitly specified PROs (339/489, 69.3%).
Tables 4 - 6 display the frequency of use of PRO scales for different diseases under the 3 categories. In trials using PRO instruments as coprimary outcomes, the visual analog scale (VAS) and the numeric rating scale (NRS) were the most commonly used scales for various tumors. For trials using PRO instruments as primary outcomes, the VAS was the most commonly used scale for various diseases. For trials using PRO instruments as secondary outcomes, the most commonly used scale for each disease was the European Organisation for Research and Treatment of Cancer Quality of Life Core Questionnaire-30 (EORTC QLQ-C30).
a VAS: visual analog scale.
b NRS: numeric rating scale.
c EORTC QLQ-LC43: European Organisation for Research and Treatment of Cancer Quality of Life Questionnaire–Lung Cancer 43.
d SF-36: 36-item Short Form Health Survey.
e PSQI: Pittsburgh Sleep Quality Index.
f IPSS: International Prostate Symptom Score.
g LARS: Low Anterior Resection Syndrome.
h EORTC QLQ-C30: European Organisation for Research and Treatment of Cancer Quality of Life Core Questionnaire-30.
i EORTC QLQ-STO22: European Organisation for Research and Treatment of Cancer Quality of Life Questionnaire–Stomach 22.
j UW-QOL: University of Washington Quality of Life Questionnaire.
k QoR-40: Quality of Recovery-40.
l IDS: Involvement-Detachment Scale.
m IIEF-15: International Index of Erectile Function-15.
n QoR-15: Quality of Recovery-15.
o TCMSS: Traditional Chinese Medicine Symptom Scale.
p N/A: not applicable.
a EORTC QLQ-C30: European Organisation for Research and Treatment of Cancer Quality of Life Core Questionnaire-30.
b FACT-L: Functional Assessment of Cancer Therapy–Lung.
c EORTC QLQ-LC13: European Organisation for Research and Treatment of Cancer Quality of Life Questionnaire–Lung Cancer 13.
d FACT-B: Functional Assessment of Cancer Therapy–Breast.
e EORTC QLQ-BR23: European Organisation for Research and Treatment of Cancer Quality of Life Questionnaire–Breast Cancer 23.
f VAS: visual analog scale.
g EORTC QLQ-OES18: European Organisation for Research and Treatment of Cancer Quality of Life Questionnaire–Oesophageal Cancer 18.
h EORTC QLQ-H&N35: European Organisation for Research and Treatment of Cancer Quality of Life Questionnaire–Head and Neck Cancer 35.
i NRS: numeric rating scale.
j EORTC QLQ-CX24: European Organisation for Research and Treatment of Cancer Quality of Life Questionnaire–Cervical Cancer 24.
k EORTC QLQ-HCC18: European Organisation for Research and Treatment of Cancer Quality of Life Questionnaire–Hepatocellular Carcinoma 18.
l FACT-P: Functional Assessment of Cancer Therapy–Prostate.
m BPI-SF: Brief Pain Inventory–Short Form.
n FACT-G: Functional Assessment of Cancer Therapy–General.
o QoR-40: Quality of Recovery-40.
p SF-36: 36-item Short Form Health Survey.
q QoR-15: Quality of Recovery-15.
r WHOQOL-BREF: World Health Organization Quality of Life Brief Version.
s EORTC QLQ-PAN26: European Organisation for Research and Treatment of Cancer Quality of Life Questionnaire–Pancreatic Cancer 26.
t FACIT: Functional Assessment of Chronic Illness Therapy.
u HF-QOL: Hand-Foot Skin Reaction and Quality of Life.
v N/A: not applicable.
w EORTC QLQ-OPT30: European Organisation for Research and Treatment of Cancer Quality of Life Questionnaire–Ophthalmic Cancer 30.
c EORTC QLQ-C30: European Organisation for Research and Treatment of Cancer Quality of Life Core Questionnaire-30.
d QoR-15: Quality of Recovery-15.
e TNSS: Total Nasal Symptom Score.
f BCS: Bruggemann Comfort Scale.
g PSQI: Pittsburgh Sleep Quality Index.
h ICIQ-SF: International Consultation on Incontinence Questionnaire–Short Form.
i FACT-P: Functional Assessment of Cancer Therapy–Prostate.
j HADS: Hospital Anxiety and Depression Scale.
k EORTC IADL-BN32: European Organisation for Research and Treatment of Cancer Instrumental Activities of Daily Living in Patients With Brain Tumors-32.
l N/A: not applicable.
m SAS: Self-Rating Anxiety Scale.
n SDS: Self-Rating Depression Scale.
To analyze the overall application of scales in explicitly specified PROs by condition, we examined the specific PRO instruments used in trials that explicitly mentioned the PRO instruments as primary or secondary outcomes ( Table 7 ). Of the 1280 trials, 321 (25.08%) used the EORTC QLQ-C30 ( Multimedia Appendix 3 ), which was the most commonly used PRO scale. Of note, the EORTC QLQ-C30 was the most commonly used scale in trials concerning lower gastrointestinal tract, upper gastrointestinal tract, head and neck, female reproductive organ, hepatobiliary system, bone, neuroendocrine, skin, and ophthalmic tumors as well as hematologic malignancies. In addition, the VAS was used in 24.77% (317/1280) of the trials ( Multimedia Appendix 3 ), predominating in trials involving thorax, breast, male genital organ, endocrine system, central nervous system, and urinary tract tumors. The NRS was also frequently used (169/1280, 13.2%) in cancer trials. More targeted scales have been used for different tumor diseases; for example, the European Organisation for Research and Treatment of Cancer Quality of Life Questionnaire (EORTC QLQ)–Head and Neck Cancer 35 (36/101, 35.6%) was more common in head and neck tumor trials, the EORTC QLQ–Oesophageal Cancer 18 (15/140, 10.7%) and the EORTC QLQ–Stomach 22 (14/140, 10%) were frequently observed in upper gastrointestinal cancer trials, the EORTC QLQ–Colorectal Cancer 29 (14/173, 8.1%) scale was prevalent in lower gastrointestinal cancer trials, the EORTC QLQ–Hepatocellular Carcinoma 18 (8/67, 12%) was frequently found in hepatobiliary system tumor trials, the Functional Assessment of Cancer Therapy (FACT)–Lung (21/217, 9.7%) and the EORTC QLQ–Lung Cancer 13 (19/217, 8.8%) commonly featured in thorax tumor trials, the FACT–Breast (29/176, 16.5%) and the EORTC QLQ–Breast Cancer 23 (16/176, 9.1%) were frequently seen in breast cancer trials, the EORTC QLQ–Ovarian Cancer 28 (6/85, 7%) was a typical scale used in female reproductive organ tumor trials, the FACT–Prostate (7/31, 23%) was often used in male genital organ tumor trials, and the FACT–Anemia (1/9, 11%) and the FACT–Lymphoma (1/9, 11%) were common choices in hematologic malignant tumor trials.
b EORTC QLQ-C30: European Organisation for Research and Treatment of Cancer Quality of Life Core Questionnaire-30.
c NRS: numeric rating scale.
d FACT-L: Functional Assessment of Cancer Therapy–Lung.
e EORTC QLQ-LC13: European Organisation for Research and Treatment of Cancer Quality of Life Questionnaire–Lung Cancer 13.
f FACT-B: Functional Assessment of Cancer Therapy–Breast.
g EORTC QLQ-BR23: European Organisation for Research and Treatment of Cancer Quality of Life Questionnaire–Breast Cancer 23.
h EORTC QLQ-CR29: European Organisation for Research and Treatment of Cancer Quality of Life Questionnaire–Colorectal Cancer 29.
i EORTC QLQ-OES18: European Organisation for Research and Treatment of Cancer Quality of Life Questionnaire–Oesophageal Cancer 18.
j EORTC QLQ-STO22: European Organisation for Research and Treatment of Cancer Quality of Life Questionnaire–Stomach 22.
k EORTC QLQ-H&N35: European Organisation for Research and Treatment of Cancer Quality of Life Questionnaire–Head and Neck Cancer 35.
l PG-SGA: Patient-Generated Subjective Global Assessment.
m SDS: Self-Rating Depression Scale.
n EORTC QLQ-OV28: European Organisation for Research and Treatment of Cancer Quality of Life Questionnaire–Ovarian Cancer 28.
o EORTC QLQ-HCC18: European Organisation for Research and Treatment of Cancer Quality of Life Questionnaire–Hepatocellular Carcinoma 18.
p TCMSS: Traditional Chinese Medicine Symptom Scale.
q FACT-P: Functional Assessment of Cancer Therapy–Prostate.
r BPI: Brief Pain Inventory.
s IPSS: International Prostate Symptom Score.
t QoR-15: Quality of Recovery-15.
u QoR-40: Quality of Recovery-40.
v PCSQ: Preparedness for Colorectal Cancer Surgery Questionnaire.
w WHOQOL-BREF: World Health Organization Quality of Life Brief Version.
x FACT-An: Functional Assessment of Cancer Therapy–Anemia.
y FACT-Lym: Functional Assessment of Cancer Therapy–Lymphoma.
z SF-36: 36-item Short Form Health Survey.
aa EORTC QLQ-PAN26: European Organisation for Research and Treatment of Cancer Quality of Life Questionnaire–Pancreatic Cancer 26.
ab N/A: not applicable.
ac HF-QoL: Hand-Foot Skin Reaction and Quality of Life.
ad EORTC QLQ-OPT30: European Organisation for Research and Treatment of Cancer Quality of Life Questionnaire–Ophthalmic Cancer 30.
ae PSQI: Pittsburgh Sleep Quality Index.
af BFI: Brief Fatigue Inventory.
Principal Findings
This cross-sectional study depicted the general characteristics of adult tumor clinical trials incorporating PROs in China and analyzed the application of PRO instruments in randomized clinical trials of tumors to provide potential directions for future research and serve as a reference for tumor clinical practice. The findings revealed that a significant proportion, specifically 62.92% (4055/6445) of the included trials, missed the opportunity to capture patients’ subjective evaluations. Of the trials with PRO instruments as end points, 26.82% (641/2390) used PRO instruments as primary outcomes, 52.72% (1260/2390) as secondary outcomes, and 20.46% (489/2390) as coprimary outcomes. The majority of PRO trials (2144/2390, 89.71%) used 1 to 3 PRO instruments. Given that PROs can authentically represent patients’ subjective experiences and evaluations, they should receive heightened emphasis in the context of tumor clinical trials. However, in light of the small proportion of tumor-related randomized clinical trials assessing PROs, policy makers and standard-setting bodies are recommended to further promote the collection of PROs in such trials in China.
This study delved into the yearly distribution of tumor clinical trials, indicating a notable surge in the use of PRO instruments as end points between January 1, 2010, and June 30, 2022. Among the trials incorporating PROs, early phase trials constituted the largest proportion (575/2390, 24.06%), followed by phase 3 (284/2390, 11.88%) and phase 4 (269/2390, 11.26%) trials. A retrospective cross-sectional study suggested a potential correlation between the use of PROs in late-stage trials and improved drug outcomes, such as overall survival [ 25 ]. However, the omission of PROs in late-stage trial results may reduce the value of patient participation in these trials. Previous work has shown that the concern regarding funding for PRO research seems significant, and additional funding was needed—and considered important—to pay for the use of PRO instruments to collect relevant data [ 26 ]. This may also be the reason why, among the included studies, there were few PRO tumor trials funded by industry. Relevant policies could provide more financial support for PRO tumor trials. In addition, our study indicated that the application of PRO instruments was more prevalent in trials involving drug interventions. PRO instruments can serve as valuable tools for assessing patient experiences during treatment, which is an essential aspect of drug discovery [ 27 ], and their absence can result in the exclusion of critical information, such as opportunities for patient-centered support programs and insights into benefit-risk profiles [ 27 ].
In accordance with prior research [ 23 ], our study also identified regional differences in the use of PROs. Tumor trials were more prevalent in the eastern, northern, and southern regions of China—especially in Shanghai, Beijing, Guangdong, and Jiangsu—and the adoption of PRO measurements followed a similar pattern. Conversely, in other regions of China, especially in the northwestern and northeastern regions—such as Qinghai, Tibet and Heilongjiang—both the overall number of tumor clinical trials and those incorporating PRO instruments as end points were conspicuously lower. These results indicated the relationship between the volume of tumor clinical trials and the adoption of PRO tools. In addition, other factors such as economic conditions and medical resources also played an important role in this phenomenon [ 28 ]. Relevant policies can continue to encourage medical resources to be tilted toward rural and less developed areas. Remarkably, the study suggested that in resource-constrained remote regions, simplified applications of PRO instruments may be considered in tumor clinical trials. Moreover, our investigation revealed a lower prevalence of industry-funded trials in tumor clinical trials in China. This discrepancy may be attributed to previous findings that tumor trials were characterized by increased risk and costliness [ 29 ].
This study further found that thorax tumors, breast tumors, and lower gastrointestinal tract tumors were the most common conditions in trials with explicit PRO instruments. This might be related to variances in tumor incidence and different clinical concerns [ 30 ]. In the primary and coprimary outcome trial sets, a higher proportion of trials explicitly listed the PRO instruments as end points compared to those not specifying PROs, underscoring the normative inclination to formalize the acquisition and application of PRO instruments. Adherence to guidelines and standardization of PRO application is essential to maximize the application of PRO trial data, enhance their impact, and minimize research waste [ 31 ]. In particular, studies have shown that the standardized PROs were conducive to making trials or clinical treatments more scientifically rigorous and ethically sound [ 32 - 35 ]. Therefore, the need to standardize the application of PRO instruments remains important, with an increased emphasis on explicitly specifying PRO instruments in clinical trials.
This study analyzed the frequency of the use of PRO instruments in different classifications of trials by medical condition and found that the VAS and the NRS were the most commonly used in trials where PROs were designated as coprimary outcomes. Meanwhile, in all trials that used PRO instruments as outcomes, the VAS and the NRS were consistently prevalent. This prevalence can be attributed to the precision, simplicity, and sensitivity of VAS scores, as well as the ease of use and standardized format of the NRS for assessing subjective indicators [ 36 - 38 ]. In addition, almost 90% of patients with cancer would experience pain during the course of their illness [ 39 ]. The pain is both prevalent and burdensome for patients, but there is a lack of objective evaluation indices available for this purpose [ 40 , 41 ]. Consequently, the VAS emerged as the preferred choice for pain assessment in clinical research. Similarly, the NRS, with its user-friendly nature and standardized format, has been the preferred tool for pain assessment [ 36 - 38 ]. PROs continue to represent the gold standard for evaluating patients’ core pain outcomes [ 42 - 44 ]. In this study, among the trials that used PRO instruments as secondary outcomes, the EORTC QLQ-C30 was the most commonly used (223/606, 36.8%), which might be attributed to the significance of addressing quality-of-life concerns for patients with tumors. This study also scrutinized the prevalent PRO instruments used in various medical conditions and found that the quality-of-life scale was frequently used in clinical trials involving tumors. The high frequency of the EORTC QLQ-C30 and FACT scale groups underscored the widespread application of these instruments in assessing patients’ quality of life in cancer clinical trials in China. Specific modules in the EORTC QLQ scale system, such as the EORTC QLQ–Breast Cancer 23, the EORTC QLQ–Lung Cancer 13, and the EORTC QLQ–Colorectal Cancer 29, have been widely used in various cancer diseases [ 45 , 46 ]. Similarly, specific modules in the FACT scales, such as FACT–Lung (lung cancer), FACT–Breast (breast cancer), and FACT–Prostate (prostate cancer), have exhibited a high rate of use in cancer clinical trials in China. The extensive use of various PRO scales indicates a growing awareness and acceptance of PRO instruments, which, in turn, encourages the development of more effective and reliable PRO instruments. PRO instruments can be divided into universal and disease-specific PRO instruments. Considering the heterogeneity of symptom types in patients with tumors, symptom assessment should be performed for specific diseases [ 47 ]. However, in different tumor trials, the explicitly specified PRO instruments were primarily quality-of-life scales, the VAS, and the NRS, suggesting a need for the application of disease-specific PRO scales for different tumor types in clinical trials. It is suggested that according to the heterogeneity of diseases, experts from different fields should be brought together to develop or improve the disease-specific scale through participatory and consensus approaches under the guidance of relevant guidelines [ 33 , 47 , 48 ]. Acceptance of the scale by a wide range of stakeholders would be beneficial to improve the quality and specificity of the scale [ 48 ]. Training of clinicians and researchers on disease-specific scales is recommended. In addition, regarding the implementation of PRO measurement, it can be attempted as part of routine clinical care delivery for corresponding diseases, as well as continuous quality improvement as a clinical care priority [ 48 ].
This study undertook an in-depth analysis of the fundamental aspects of tumor clinical trials encompassing PROs in China, involving categorizing tumors and assessing the application of specific PRO tools for each tumor type. The findings underscore the critical importance of integrating PRO measures into tumor clinical trials in China and the need to standardize the use of PRO instruments within these trials. In recent years, the Chinese government has attached great importance to the application of PRO instruments in clinical trials. To encourage the patient-centered concept of new drug development and make reasonable use of PRO instruments, the National Medical Products Administration formulated the Guiding Principles for the Application of Patient Reported Outcomes in Drug Clinical Research and Development in 2022. To further promote these guiding principles, the relevant departments can educate researchers about the importance of regulating the application of PRO instruments, provide an interpretation of these principles to researchers, and advise them to follow the guidelines. We encourage researchers to communicate relevant information to regulators in a timely manner to conduct higher-quality clinical trials, such as the background of the study, the type of study, and the scale used. Policy makers should further formulate and implement pertinent policies, and PRO application platforms need to be developed and promoted to accelerate rational use of PROs in tumor clinical trials. It is recommended to define or form an institution or department to coordinate and standardize the use of PROs in clinical trials [ 49 ]. The institution or department can provide researchers with some support, such as methodological guidance for PRO applications, interpretation of relevant guidelines, and guidance on internet technologies. Efforts should also be made to encourage communication and collaboration among policy makers, researchers, and medical institutions to promote the high-quality application of PROs in clinical trials. Furthermore, it is crucial to train clinicians in how to use PRO instruments in clinical practice. Ideally, this training can be part of standard medical education programs in the future. The most successful and effective way of training involved real patient cases and problem-based learning using audio and video clips, which could enable clinicians to know how to use PRO instruments and refer to the PRO data [ 50 ]. Researchers are encouraged to follow relevant guidelines and principles and actively engage in conducting high-quality tumor clinical trials to improve well-established PRO protocols and enrich the array of available PRO instruments, thereby advancing personalized population health. In addition, it is suggested to encourage and provide relevant support to patients who have difficulties in completing the PRO reports [ 51 ].
Limitations
It is important to acknowledge several limitations to this study. First, we excluded trials lacking detailed end point information, which may have introduced bias into the results. Second, the inclusion of trials that have not yet commenced participant recruitment, although necessary for our investigation, may have inflated the reported outcomes. Finally, the exclusion of trials involving children due to their limited expressive ability and the potential influence of parental reporting on outcomes may have introduced bias in the findings.
Conclusions
In China, the incorporation of PROs has demonstrated an upward trajectory in adult randomized clinical trials of tumors in recent years. Nonetheless, the infrequent measurement of the patient’s voice remains noteworthy. This study highlights the need for a more comprehensive evaluation of patients’ experiences in adult tumor clinical trials in China. The incorporation of patients’ subjective feelings in the context of tumor diseases is necessary. Disease-specific PRO instruments should be widely used in different categories of tumor disease. Pertinent policies should be formulated and implemented, and PRO application platforms need to be developed and promoted as well. In addition, researchers should actively engage in conducting high-quality tumor clinical trials. There is room for improvement in the standardization of PROs in China.
Acknowledgments
This work was supported by the high-level traditional Chinese Medicine Key Subjects Construction Project of the National Administration of Traditional Chinese Medicine—Evidence-Based Traditional Chinese Medicine (zyyzdxk-2023249).
Data Availability
The data sets generated and analyzed during this study are available from the corresponding author on reasonable request.
Authors' Contributions
HR and JL conceived of the presented idea. YJ and QL coordinated the data collection and analysis. XW, YY, and YJ performed the data extraction. YJ and QL wrote the first draft of the paper; and SY, SL, WL, and XW provided inputs for subsequent drafts. JL and HR provided comments related to the presentation of the findings and critically reviewed the manuscript. All authors read and approved the final manuscript.
Conflicts of Interest
None declared.
Classification of specific diseases.
The number of trials with patient-reported outcomes in each province of China.
Patient-reported outcome tests used most frequently.
- Patrick DL, Burke LB, Powers JH, Scott JA, Rock EP, Dawisha S, et al. Patient-reported outcomes to support medical product labeling claims: FDA perspective. Value Health. 2007;10 Suppl 2:S125-S137. [ FREE Full text ] [ CrossRef ] [ Medline ]
- Calvert M, Kyte D, Mercieca-Bebber R, Slade A, Chan AW, King MT, the SPIRIT-PRO Group, et al. Guidelines for inclusion of patient-reported outcomes in clinical trial protocols: the SPIRIT-PRO extension. JAMA. Feb 06, 2018;319(5):483-494. [ FREE Full text ] [ CrossRef ] [ Medline ]
- Calvert M, Blazeby J, Altman DG, Revicki DA, Moher D, Brundage MD. Reporting of patient-reported outcomes in randomized trials: the CONSORT PRO extension. JAMA. Feb 27, 2013;309(8):814-822. [ CrossRef ] [ Medline ]
- U.S. Department of Health and Human Services FDA Center for Drug Evaluation and Research, U.S. Department of Health and Human Services FDA Center for Biologics Evaluation and Research, U.S. Department of Health and Human Services FDA Center for Devices and Radiological Health. Guidance for industry: patient-reported outcome measures: use in medical product development to support labeling claims: draft guidance. Health Qual Life Outcomes. Oct 11, 2006;4:79. [ FREE Full text ] [ CrossRef ] [ Medline ]
- The Lancet Neurology. Patient-reported outcomes in the spotlight. Lancet Neurol. Nov 2019;18(11):981. [ CrossRef ]
- Marshall S, Haywood K, Fitzpatrick R. Impact of patient-reported outcome measures on routine practice: a structured review. J Eval Clin Pract. Oct 2006;12(5):559-568. [ CrossRef ] [ Medline ]
- Greenhalgh J, Gooding K, Gibbons E, Dalkin S, Wright J, Valderas J, et al. How do patient reported outcome measures (PROMs) support clinician-patient communication and patient care? A realist synthesis. J Patient Rep Outcomes. Dec 2018;2:42. [ FREE Full text ] [ CrossRef ] [ Medline ]
- Chan G, Bezuidenhout L, Walker L, Rowan R. The Impact on Life questionnaire: validation for elective surgery prioritisation in New Zealand prioritisation criteria in orthopaedic surgery. N Z Med J. Apr 01, 2016;129(1432):26-32. [ Medline ]
- Black N. Patient reported outcome measures could help transform healthcare. BMJ. Jan 28, 2013;346:f167. [ FREE Full text ] [ CrossRef ] [ Medline ]
- Tong A, Oberbauer R, Bellini MI, Budde K, Caskey FJ, Dobbels F, et al. Patient-reported outcomes as endpoints in clinical trials of kidney transplantation interventions. Transpl Int. May 20, 2022;35:10134. [ FREE Full text ] [ CrossRef ] [ Medline ]
- Qian Y, Walters SJ, Jacques R, Flight L. Comprehensive review of statistical methods for analysing patient-reported outcomes (PROs) used as primary outcomes in randomised controlled trials (RCTs) published by the UK's Health Technology Assessment (HTA) journal (1997-2020). BMJ Open. Sep 06, 2021;11(9):e051673. [ FREE Full text ] [ CrossRef ] [ Medline ]
- Dai W, Feng W, Zhang Y, Wang XS, Liu Y, Pompili C, et al. Patient-reported outcome-based symptom management versus usual care after lung cancer surgery: a multicenter randomized controlled trial. J Clin Oncol. Mar 20, 2022;40(9):988-996. [ FREE Full text ] [ CrossRef ] [ Medline ]
- Kouzy R, Abi Jaoude J, Lin D, Nguyen ND, El Alam MB, Ludmir EB, et al. Patient-reported outcome measures in pancreatic cancer receiving radiotherapy. Cancers (Basel). Sep 02, 2020;12(9):2487. [ FREE Full text ] [ CrossRef ] [ Medline ]
- Singhal U, Skolarus TA, Gore JL, Parry MG, Chen RC, Nossiter J, et al. Implementation of patient-reported outcome measures into health care for men with localized prostate cancer. Nat Rev Urol. May 2022;19(5):263-279. [ CrossRef ] [ Medline ]
- Stover AM, Basch EM. Using patient-reported outcome measures as quality indicators in routine cancer care. Cancer. Feb 01, 2016;122(3):355-357. [ FREE Full text ] [ CrossRef ] [ Medline ]
- Albreht T. Europe's beating cancer plan-a new step towards more comprehensive and equitable cancer control in Europe. Eur J Public Health. Jul 13, 2021;31(3):456-457. [ CrossRef ] [ Medline ]
- Lizán L, Pérez-Carbonell L, Comellas M. Additional value of patient-reported symptom monitoring in cancer care: a systematic review of the literature. Cancers (Basel). Sep 15, 2021;13(18):4615. [ FREE Full text ] [ CrossRef ] [ Medline ]
- Graupner C, Kimman ML, Mul S, Slok AH, Claessens D, Kleijnen J, et al. Patient outcomes, patient experiences and process indicators associated with the routine use of patient-reported outcome measures (PROMs) in cancer care: a systematic review. Support Care Cancer. Feb 2021;29(2):573-593. [ FREE Full text ] [ CrossRef ] [ Medline ]
- Engstrom T, Tanner S, Lee WR, Forbes C, Walker R, Bradford N, et al. Patient reported outcome measure domains and tools used among adolescents and young adults with cancer: a scoping review. Crit Rev Oncol Hematol. Jan 2023;181:103867. [ CrossRef ] [ Medline ]
- Yang LY, Manhas DS, Howard AF, Olson RA. Patient-reported outcome use in oncology: a systematic review of the impact on patient-clinician communication. Support Care Cancer. Jan 2018;26(1):41-60. [ CrossRef ] [ Medline ]
- Coens C, Pe M, Dueck AC, Sloan J, Basch E, Calvert M, et al. International standards for the analysis of quality-of-life and patient-reported outcome endpoints in cancer randomised controlled trials: recommendations of the SISAQOL Consortium. Lancet Oncol. Feb 2020;21(2):e83-e96. [ CrossRef ]
- Basch E, Geoghegan C, Coons SJ, Gnanasakthy A, Slagle AF, Papadopoulos EJ, et al. Patient-reported outcomes in cancer drug development and US regulatory review: perspectives from industry, the food and drug administration, and the patient. JAMA Oncol. Jun 01, 2015;1(3):375-379. [ CrossRef ] [ Medline ]
- Zhou H, Yao M, Gu X, Liu M, Zeng R, Li Q, et al. Application of patient-reported outcome measurements in clinical trials in China. JAMA Netw Open. May 02, 2022;5(5):e2211644. [ FREE Full text ] [ CrossRef ] [ Medline ]
- Gnanasakthy A, Norcross L, DeMuro Romano C, Carson RT. A review of patient-reported outcome labeling of FDA-approved new drugs (2016-2020): counts, categories, and comprehensibility. Value Health. Apr 2022;25(4):647-655. [ FREE Full text ] [ CrossRef ] [ Medline ]
- Haslam A, Herrera-Perez D, Gill J, Prasad V. Patient experience captured by quality-of-life measurement in oncology clinical trials. JAMA Netw Open. Mar 02, 2020;3(3):e200363. [ FREE Full text ] [ CrossRef ] [ Medline ]
- Watkins Bruner D, Bryan CJ, Aaronson N, Blackmore CC, Brundage M, Cella D, et al. Issues and challenges with integrating patient-reported outcomes in clinical trials supported by the National Cancer Institute–sponsored clinical trials networks. J Clin Oncol. Nov 10, 2007;25(32):5051-5057. [ CrossRef ]
- Basch E, Dueck AC. Patient-reported outcome measurement in drug discovery: a tool to improve accuracy and completeness of efficacy and safety data. Expert Opin Drug Discov. Aug 2016;11(8):753-758. [ CrossRef ] [ Medline ]
- Liniker E, Harrison M, Weaver JM, Agrawal N, Chhabra A, Kingshott V, et al. Treatment costs associated with interventional cancer clinical trials conducted at a single UK institution over 2 years (2009-2010). Br J Cancer. Oct 15, 2013;109(8):2051-2057. [ FREE Full text ] [ CrossRef ] [ Medline ]
- Wong CH, Siah KW, Lo AW. Estimation of clinical trial success rates and related parameters. Biostatistics. Apr 01, 2019;20(2):273-286. [ FREE Full text ] [ CrossRef ] [ Medline ]
- Cao W, Chen HD, Yu YW, Li N, Chen WQ. Changing profiles of cancer burden worldwide and in China: a secondary analysis of the global cancer statistics 2020. Chin Med J (Engl). Mar 17, 2021;134(7):783-791. [ FREE Full text ] [ CrossRef ] [ Medline ]
- Rivera SC, Kyte DG, Aiyegbusi OL, Slade AL, McMullan C, Calvert MJ. The impact of patient-reported outcome (PRO) data from clinical trials: a systematic review and critical analysis. Health Qual Life Outcomes. Oct 16, 2019;17(1):156. [ FREE Full text ] [ CrossRef ] [ Medline ]
- Di Maio M, Gallo C, Leighl NB, Piccirillo MC, Daniele G, Nuzzo F, et al. Symptomatic toxicities experienced during anticancer treatment: agreement between patient and physician reporting in three randomized trials. J Clin Oncol. Mar 10, 2015;33(8):910-915. [ FREE Full text ] [ CrossRef ] [ Medline ]
- Howell D, Molloy S, Wilkinson K, Green E, Orchard K, Wang K, et al. Patient-reported outcomes in routine cancer clinical practice: a scoping review of use, impact on health outcomes, and implementation factors. Ann Oncol. Sep 2015;26(9):1846-1858. [ FREE Full text ] [ CrossRef ] [ Medline ]
- Crites JS, Chuang C, Dimmock A, Hwang W, Johannes B, Paranjape A, et al. PROs in the balance: ethical implications of collecting patient reported outcome measures in the electronic health record. Am J Bioeth. Mar 16, 2016;16(4):67-68. [ CrossRef ] [ Medline ]
- Kyte D, Draper H, Calvert M. Patient-reported outcome alerts: ethical and logistical considerations in clinical trials. JAMA. Sep 25, 2013;310(12):1229-1230. [ CrossRef ] [ Medline ]
- Jensen MP. The validity and reliability of pain measures in adults with cancer. J Pain. Feb 2003;4(1):2-21. [ FREE Full text ] [ CrossRef ] [ Medline ]
- Caraceni A, Brunelli C, Martini C, Zecca E, De Conno F. Cancer pain assessment in clinical trials. A review of the literature (1999-2002). J Pain Symptom Manage. May 2005;29(5):507-519. [ FREE Full text ] [ CrossRef ] [ Medline ]
- Hjermstad MJ, Fayers PM, Haugen DF, Caraceni A, Hanks GW, Loge JH, et al. Studies comparing Numerical Rating Scales, Verbal Rating Scales, and Visual Analogue Scales for assessment of pain intensity in adults: a systematic literature review. J Pain Symptom Manage. Jun 2011;41(6):1073-1093. [ FREE Full text ] [ CrossRef ] [ Medline ]
- Hjermstad MJ, Fainsinger R, Kaasa S, European Palliative Care Research Collaborative (EPCRC). Assessment and classification of cancer pain. Curr Opin Support Palliat Care. Mar 2009;3(1):24-30. [ CrossRef ] [ Medline ]
- Santoni A, Santoni M, Arcuri E. Chronic cancer pain: opioids within tumor microenvironment affect neuroinflammation, tumor and pain evolution. Cancers (Basel). Apr 30, 2022;14(9):2253. [ FREE Full text ] [ CrossRef ] [ Medline ]
- Morishita S, Hirabayashi R, Tsubaki A, Aoki O, Fu JB, Onishi H, et al. Relationship between balance function and QOL in cancer survivors and healthy subjects. Medicine (Baltimore). Nov 19, 2021;100(46):e27822. [ FREE Full text ] [ CrossRef ] [ Medline ]
- Comer SD, Zacny JP, Dworkin RH, Turk DC, Bigelow GE, Foltin RW, et al. Core outcome measures for opioid abuse liability laboratory assessment studies in humans: IMMPACT recommendations. Pain. Dec 2012;153(12):2315-2324. [ FREE Full text ] [ CrossRef ] [ Medline ]
- Dworkin RH, Turk DC, McDermott MP, Peirce-Sandner S, Burke LB, Cowan P, et al. Interpreting the clinical importance of group differences in chronic pain clinical trials: IMMPACT recommendations. Pain. Dec 2009;146(3):238-244. [ CrossRef ] [ Medline ]
- Younger J, McCue R, Mackey S. Pain outcomes: a brief review of instruments and techniques. Curr Pain Headache Rep. Feb 23, 2009;13(1):39-43. [ FREE Full text ] [ CrossRef ] [ Medline ]
- Wan C, Meng Q, Yang Z, Tu X, Feng C, Tang X, et al. Validation of the simplified Chinese version of EORTC QLQ-C30 from the measurements of five types of inpatients with cancer. Ann Oncol. Dec 2008;19(12):2053-2060. [ FREE Full text ] [ CrossRef ] [ Medline ]
- Aaronson NK, Ahmedzai S, Bergman B, Bullinger M, Cull A, Duez NJ, et al. The European Organization for Research and Treatment of Cancer QLQ-C30: a quality-of-life instrument for use in international clinical trials in oncology. J Natl Cancer Inst. Mar 03, 1993;85(5):365-376. [ CrossRef ] [ Medline ]
- Taylor F, Reasner DS, Carson RT, Deal LS, Foley C, Iovin R, et al. Development of a symptom-based patient-reported outcome instrument for functional dyspepsia: a preliminary conceptual model and an evaluation of the adequacy of existing instruments. Patient. Oct 28, 2016;9(5):409-418. [ FREE Full text ] [ CrossRef ] [ Medline ]
- Howell D, Fitch M, Bakker D, Green E, Sussman J, Mayo S, et al. Core domains for a person-focused outcome measurement system in cancer (PROMS-Cancer Core) for routine care: a scoping review and Canadian Delphi Consensus. Value Health. 2013;16(1):76-87. [ FREE Full text ] [ CrossRef ] [ Medline ]
- Eton DT, Beebe TJ, Hagen PT, Halyard MY, Montori VM, Naessens JM, et al. Harmonizing and consolidating the measurement of patient-reported information at health care institutions: a position statement of the Mayo Clinic. Patient Relat Outcome Meas. Feb 10, 2014;5:7-15. [ FREE Full text ] [ CrossRef ] [ Medline ]
- Santana MJ, Haverman L, Absolom K, Takeuchi E, Feeny D, Grootenhuis M, et al. Training clinicians in how to use patient-reported outcome measures in routine clinical practice. Qual Life Res. Jul 2015;24(7):1707-1718. [ FREE Full text ] [ CrossRef ] [ Medline ]
- Riedl D, Lehmann J, Rothmund M, Dejaco D, Grote V, Fischer MJ, et al. Usability of electronic patient-reported outcome measures for older patients with cancer: secondary analysis of data from an observational single center study. J Med Internet Res. Sep 21, 2023;25:e49476. [ FREE Full text ] [ CrossRef ] [ Medline ]
Abbreviations
Edited by A Mavragani; submitted 14.01.23; peer-reviewed by Y Chu, L Guo; comments to author 24.10.23; revised version received 29.10.23; accepted 09.02.24; published 08.05.24.
©Yan Jia, Qi Li, Xiaowen Zhang, Yi Yan, Shiyan Yan, Shunping Li, Wei Li, Xiaowen Wu, Hongguo Rong, Jianping Liu. Originally published in the Journal of Medical Internet Research (https://www.jmir.org), 08.05.2024.
This is an open-access article distributed under the terms of the Creative Commons Attribution License (https://creativecommons.org/licenses/by/4.0/), which permits unrestricted use, distribution, and reproduction in any medium, provided the original work, first published in the Journal of Medical Internet Research, is properly cited. The complete bibliographic information, a link to the original publication on https://www.jmir.org/, as well as this copyright and license information must be included.
Internet explorer is no longer supported
We have detected that you are using Internet Explorer to visit this website. Internet Explorer is now being phased out by Microsoft. As a result, NHS Digital no longer supports any version of Internet Explorer for our web-based products, as it involves considerable extra effort and expense, which cannot be justified from public funds. Some features on this site will not work. You should use a modern browser such as Edge, Chrome, Firefox, or Safari. If you have difficulty installing or accessing a different browser, contact your IT support team.
We are the statutory custodian for health and care data for England, serving stakeholders across the UK. We enable the health and social care system to make best use of its data to improve healthcare outcomes, efficiency of services and the impact of research, while safeguarding the privacy of the people whose data we hold.

Data collection and curation
We manage around 200 data collections from health and social care organisations in England so it can be used to improve our delivery of health services, support world-class medical research, and inform policy development.

Statistical publications, open data and data products
We produce a wide range of statistical publications and dashboards to provide visibility of how our health service is performing. We also provide open data to enable the public to benefit from our data assets.

Secure data access for authorised users
We provide access to confidential data for planning and evaluating NHS services and for medical research. This access is subject to strict controls and granted for legally authorised purposes which benefit the health and care system.

Keeping data safe and benefitting the public
We collect, process and store healthcare data about patients. We protect this data by keeping it secure and we only use it for authorised purposes.
NHS Digital merger with NHS England

NHS England will continue to be an effective and secure guardian of public data, when it assumes all responsibilities previously undertaken by NHS Digital on 1 February. Learn how we will protect and safely use data in the new NHS England.
Our data blog

Experts talk about how we are using data to drive research and improve NHS and care services.
Latest publications
[mi] learning disabilities health check scheme, march 2024, out of area placements in mental health services, february 2024, [mi] nhs e-referral service open data october 2019 to april 2024, provisional monthly hospital episode statistics for admitted patient care, outpatient and accident and emergency data, april 2023 - march 2024 (m12), freedom of information.
The Freedom of Information (FOI) Act 2000 gives you the right to obtain information held by public authorities unless there are good reasons to keep it confidential.
College of Nursing
Easing the pressure: supporting icu nurse decision making through digital innovation.

College of Nursing Assistant Professor Anna Krupp , PhD, MSHP, RN and Associate Professor Karen Dunn Lopez , PhD, MPH, RN, FAAN understand that intensive care unit (ICU) patients have a greater chance of developing functional decline, which may include new limitations in walking or a decreased ability to manage basic physical needs after hospital discharge. One common contributing factor for this is long periods of immobility, or remaining in bed, during ICU hospitalization.
With funding from the Agency for Healthcare Research and Quality , Krupp and Dunn Lopez are proposing to develop a decision support tool in the electronic health record. The goal is to make complex decisions about when it is safe to assist ICU patients out of bed more efficient for nurses. Currently, nurses look in multiple locations in the EHR for this information. The tool will summarize key patient information on one screen.
“ICU nurses make hundreds of decisions during a shift and the decision to assist a patient to sit on the edge of the bed or walk in the room requires that nurses know a lot about the patient and their stability over the previous shift,” said Clinical Assistant Professor and Co-Investigator Heather Dunn , PhD, ACNP-BC, ARNP. “Enhancing mobility in the ICU is crucial for positive patient outcomes. However, assessing readiness for activities like walking is challenging when data needs to be gathered from multiple sections of the medical record.”

The project will be conducted in two phases. First, they’ll develop the decision support tool with input from practicing ICU nurses. Next, the tool will be studied in two environments—a simulated EHR with nurses from across the nation and a real-world trial in the ICU.
Both Krupp and Dunn Lopez bring differing expertise. Dunn Lopez will use her knowledge with usability science and focus her time in a simulated setting identifying the ease, use, and effectiveness of the tool.
“One thing we know is that if something is not easy to use, it isn’t going to get used. But there are methods that can make sure that what you are developing is useful to the people who use it,” Dunn Lopez said.
Krupp will apply her ICU-based clinical expertise with her implementation science training to plan and study how decision support is used in everyday clinical practice.

“The best-designed tool does not guarantee routine use in complex healthcare settings. Implementation science identifies and addresses contextual factors to help promote its use,” said Krupp.
Krupp and Dunn Lopez suspect the results of the study will influence a “pragmatic way of accelerating the use of patient data with guideline recommendations at the point of care to support ICU clinicians in delivering evidence-based care, decreasing the duration of bed rest, and reducing hospital-acquired functional decline.”
Read more from our spring 2024 alumni newsletter .
- Open access
- Published: 08 May 2024
A method for mining condition-specific co-expressed genes in Camellia sinensis based on k-means clustering
- Xinghai Zheng 1 , 2 ,
- Peng Ken Lim 2 ,
- Marek Mutwil 2 &
- Yuefei Wang 1
BMC Plant Biology volume 24 , Article number: 373 ( 2024 ) Cite this article
58 Accesses
Metrics details
As one of the world’s most important beverage crops, tea plants ( Camellia sinensis ) are renowned for their unique flavors and numerous beneficial secondary metabolites, attracting researchers to investigate the formation of tea quality. With the increasing availability of transcriptome data on tea plants in public databases, conducting large-scale co-expression analyses has become feasible to meet the demand for functional characterization of tea plant genes. However, as the multidimensional noise increases, larger-scale co-expression analyses are not always effective. Analyzing a subset of samples generated by effectively downsampling and reorganizing the global sample set often leads to more accurate results in co-expression analysis. Meanwhile, global-based co-expression analyses are more likely to overlook condition-specific gene interactions, which may be more important and worthy of exploration and research.
Here, we employed the k-means clustering method to organize and classify the global samples of tea plants, resulting in clustered samples. Metadata annotations were then performed on these clustered samples to determine the “conditions” represented by each cluster. Subsequently, we conducted gene co-expression network analysis (WGCNA) separately on the global samples and the clustered samples, resulting in global modules and cluster-specific modules. Comparative analyses of global modules and cluster-specific modules have demonstrated that cluster-specific modules exhibit higher accuracy in co-expression analysis. To measure the degree of condition specificity of genes within condition-specific clusters, we introduced the correlation difference value (CDV). By incorporating the CDV into co-expression analyses, we can assess the condition specificity of genes. This approach proved instrumental in identifying a series of high CDV transcription factor encoding genes upregulated during sustained cold treatment in Camellia sinensis leaves and buds, and pinpointing a pair of genes that participate in the antioxidant defense system of tea plants under sustained cold stress.
Conclusions
To summarize, downsampling and reorganizing the sample set improved the accuracy of co-expression analysis. Cluster-specific modules were more accurate in capturing condition-specific gene interactions. The introduction of CDV allowed for the assessment of condition specificity in gene co-expression analyses. Using this approach, we identified a series of high CDV transcription factor encoding genes related to sustained cold stress in Camellia sinensis . This study highlights the importance of considering condition specificity in co-expression analysis and provides insights into the regulation of the cold stress in Camellia sinensis .
Peer Review reports
Introduction
As one of the most popular non-alcoholic beverages worldwide, tea contains a wide range of secondary metabolites beneficial to human health, such as polyphenols, alkaloids, and theanine [ 1 ]. As such, the tea plant ( Camellia sinensis ) possesses a diverse range of germplasm resources [ 2 ]. Different cultivars of Camellia sinensis are each prized for certain desirable qualitiesin their own right and exhibit significant differences in plant morphology, leaf characteristics, growth habits, adaptability, and secondary metabolites [ 3 , 4 ]. Consequently, said tea cultivars have garnered much research interest in the post-genomic era to understand and improve tea traits.
With an increasing number of studies on the epigenetic variations and compositional changes of secondary metabolites in tea plants under different experimental conditions [ 1 , 4 , 5 ], the omics dataset of Camellia sinensis has also become increasingly extensive. This has led to the use of systems biology approaches on sequencing data hosted on public databases [ 6 , 7 , 8 ], such as gene co-expression analysis, becoming a trend in analyzing omics data of Camellia sinensis , providing tea researchers with a more macroscopic and comprehensive perspective. Researchers have further downloaded large-scale transcriptome data of tea plants and created a more systematic and comprehensive co-expression database TeaCoN (http://teacon.wchoda.com) [ 9 ].
Although the large sample size of publicly-derived Camellia sinensis transcriptomic data improves the statistical significance of relationships between genes and increases the reliability of inferring gene correlations, indiscriminately combining multiple samples may not be universally beneficial [ 10 ]. As datasets become larger and more diverse, the derived coexpression networks become less informative due to increased multidimensional noise [ 11 ]. One way to improve the utility of the network is downsampling. Downsampling subdivides samples either by manually grouping them based on experimental conditions or by using automated methods such as k-means clustering [ 12 , 13 , 14 ]. However, manual grouping often lacks sufficient sample description to accurately classify them, so automated methods like k-means clustering are more effective [ 12 ].
Furthermore, co-expression networks at a large scale of samples may miss specific gene interactions formed under particular conditions [ 15 ]. Increasing evidence suggests that different gene networks operate in different biological contexts [ 16 , 17 ]. Therefore, it becomes increasingly important to compare and contrast coexpression networks under specific conditions [ 18 , 19 , 20 ]. Experimental results demonstrate that over one-third of genetic interactions are condition-specific [ 21 ]. Several studies have also shown that the patterns of gene coexpression vary under different conditions [ 22 , 23 , 24 ]. Hence, when conducting coexpression analysis on large-scale samples, incorporating sample auto-classification and mining condition-specific coexpressed genes can enhance the accuracy and informativeness of co-expression analysis.
In this study, all Camellia sinensis samples downloaded from NCBI were subjected to k-means clustering to obtain four clusters representing different “conditions” (experimental treatments, tissues, and cultivars). Cluster metadata annotations were obtained through sample metadata annotation. Then, weighted gene co-expression network analysis (WGCNA) was performed on the expression profiles of both the global samples and the cluster samples to obtain their respective co-expression modules. Subsequently, the correlation difference value (CDV) was proposed to measure the degree of condition specificity of genes within condition-specific clusters. By comparing between clusters and within clusters, highly condition-specific clusters and biological functions were identified. By incorporating the CDV into gene regulatory networks and visualizing it, condition-specific genes and conserved genes can be distinguished, providing more information for the selection of key genes. Overall, this study aims to improve gene co-expression analysis methods for large-scale transcriptomic data of tea plants by performing condition-specific analysis and providing a more accurate understanding of the relationships between gene expression patterns and phenotypic traits.
Data sources and sample metadata annotation
By searching and filtering using the keyword “Camellia sinensis” in the NCBI SRA database, a total of 760 RNA-Seq raw reads were obtained. The initial annotation of these RNA-Seq raw data were performed, selecting the relatively important metadata fields in the NCBI SRA database for Camellia sinensis research, including cultivar, plant tissue, and experimental treatments. Subsequently, the corresponding original papers for each RNA-Seq data were searched to retrieve annotation information (Table S 1 ).
To facilitate differentiation from other experimental treatments, the control group and samples directly collected without any treatment were uniformly labeled as “no treatment” in the experimental treatment column. The samples with missing annotations in the metadata fields of the NCBI SRA database and could not be found in the retrieved original papers were labeled as “missing”.
Expression quantification and gene functional annotation
Seven hundred sixty RNA-seq samples were processed using fastp tool [ 25 ] to obtain high-quality clean data by removing adapter sequences and low-quality reads using default parameters. Coding sequences (CDS) annotations of the “Shuchazao” Camellia sinesis cultivar (http://tpia.teaplant.org) [ 26 ] were used as pseudoalignment reference, the processed reads were then used to quantify the gene expression, in transcripts per million (TPM) values, for all RNA-seq samples using Kallisto [ 27 ] (Table S 2 ).
The CDS annotations of the tea plant cultivar “Shuchazao” were subjected to gene functional annotation using the Mercator v4 6.0 [ 28 ] (Table S 3 ).
K-means clustering and cluster metadata annotation
Firstly, 16,094 genes were selected from the CDS of "Shuchazao" whose average expression levels were greater than 2 in 760 samples and were annotated with detailed biological functions by Mercator v4 6.0. Then, a gene expression profile was constructed using TPM values of 16,094 genes from 760 RNA-seq samples. The batch effects in the gene expression profile were reduced by normalizing the expression levels using the StandardScaler tool from the sklearn.preprocessing package. The KMeans tool from the sklearn.cluster package was used for k-means clustering on all RNA-seq samples with a random seed set to 1024 (np.random.seed(1024)) and a target number of clusters set to 4 (n_clusters=4) [ 29 ]. The selection of 4 as the value of k in k-means clustering is based on the Silhouette plot, where 4 resulted in a better classification of the samples (Figure S 1 ) [ 30 ].
Then, the TSNE tool from the sklearn.manifold package was applied to the standardized gene expression profile to perform dimensionality reduction, retaining the top principal components Component 1 and Component 2. Finally, the samples were visualized in the Component 1 and Component 2 space to explore potential clustering structures and similarities among the samples, as described by [ 31 ].
To annotate the 4 clusters obtained from k-means clustering, the hypergeom tool from the scipy.stats package was used to perform a hypergeometric test between each sample in each cluster and the samples associated with each cultivar term [ 32 ]. Then, the fdrcorrection tool from the statsmodels.stats.multitest package was used to correct the p-values of all cultivar terms corresponding to each cluster, obtaining the false discovery rate (FDR) values [ 33 ]. Cultivar terms with FDR values less than or equal to 0.05 were selected as metadata annotations for the samples in that cluster. The same approach was applied to obtain metadata annotations for the tissue terms and experimental treatment terms (Figure S 2 ; Table S 4 ).
Weighted gene co-expression network analysis (WGCNA)
The global expression profile and cluster expression profiles comprise the expression levels of 16,094 genes from global samples and samples from different clusters (cluster samples), respectively.
R package WGCNA was then employed to construct a co-expression network [ 34 ]. WGCNA was performed following the guidelines provided in the tutorial ( https://horvath.genetics.ucla.edu/html/CoexpressionNetwork/Rpackages/WGCNA/Tutorials/ ) [ 35 ], where employing a stepwise approach to divide the modules based on the obtained soft threshold and utilized the DynamicTreecut package to cluster the modules.
The eigengenes of each module were calculated based on the expression profiles and module color codes. Eigengenes represent the main expression patterns of each module and can be used to describe the overall expression patterns of the module. Then, hierarchical clustering (average linkage) was applied to cluster the module eigengenes. A merging height threshold of 0.25 was set, corresponding to a correlation threshold of 0.75, and called the mergeCloseModules function for automatic module merging. The merged modules were assigned new color codes, which served as the final module color codes (Figure S 2 ). For easy reference, the color modules were mapped to alphabetical letters (Table S 5 ).
In this step, the co-expression modules obtained from the global expression profile are referred to as “global modules”, while the co-expression modules obtained from the cluster expression profiles are referred to as “cluster-specific modules”
Calculation of clustering similarity and gene condition specificity
The Fowlkes-Mallows score (FMS) and adjusted mutual information score (AMIS), which is used to analyze the similarity of co-expression modules in WGCNA under different samples, was calculated using the fowlkes_mallows_score and adjusted_mutual_info_score tool from the sklearn.metrics package [ 36 , 37 ].
Then, for each cluster, the two kinds of gene-module consistency coefficient (GMC) were calculated for each gene - the GMC of the gene in the cluster-specific module and the GMC of the gene in the global module based on corresponding cluster samples. The GMC of a gene is defined as the Pearson correlation coefficient (PCC) between the gene’s expression profile and the module eigengene expression profile of the co-expression module it belongs to [ 38 ]. The mathematical formula for GMC is as follows:
where g i and e.g. i represent the expression values of gene and module eigengene in the i -th sample, ` g and `e.g. represent the average expression values of gene and module eigengene, and n is the number of samples. This study used the GMC of genes to investigate the consistency of gene expression patterns within co-expression modules.
Furthermore, for each cluster, the correlation difference value (CDV) of each gene was calculated by subtracting the GMC of the gene in the cluster-specific module from the GMC of the gene in the global module. The mathematical formula for CDV is as follows:
where ce.g. i and ge.g. i represent the expression values of eigengene in the cluster-specific module and global module in the i -th sample, ` ceg and ` geg represent the average expression values of eigengene in the cluster-specific module eigengene and global module, and m is the number of samples in the cluster. In this study, CDV was used to measure the condition-specificity of each gene. The genes with only GMC(Cluster) greater than or equal to 0.6 and GMC(Global) greater than or equal to 0.6 were used to calculate the CDV value.
Functional enrichment analysis of co-expression modules
To annotate the functions of modules, the hypergeometric tests [ 32 ] were performed using the hypergeom tool from the scipy.stats package for each gene in the module and each gene included in the mapman entries. To ensure the displayed mapman entries are as detailed as possible, covering all biological functions and with a substantial number of genes, only mapman entries with detailed classification and containing more than 100 genes are selected. Then, the p-values of all mapman entries corresponding to each module are corrected using the fdrcorrection tool from the statsmodels.stats.multitest package to obtain FDR values [ 33 ]. Mapman entries with FDR values less than or equal to 0.05 are considered functional annotations for the genes in that module (Table S 6 ).
Construction of the gene regulatory network
Based on module correlation and module functional annotation, the module associated with the metadata annotation of the cluster was selected. R package GENIE3 was then employed to predict the regulatory relationships between genes within the module [ 39 ]. To construct the gene regulatory network, only gene pairs with a weight value greater than or equal to 0.06 were considered.
The constructed gene regulatory networks were imported into Cytoscape software [ 40 ] for visualization and analysis. Finally, the network was further customized with layout, labeling, and color coding to provide a clearer representation of the interactions between genes to understand the structure and function of the gene network and to reveal important associations and regulatory mechanisms in biological processes.
Metadata annotation of RNA-Seq samples exhibits an imbalanced distribution characteristic
During the metadata annotation of 760 RNA-seq samples of Camellia sinensis , we observed that there was an imbalance in the sample distribution across each metadata category, including cultivars, tissues, and treatments (Fig. 1 ; Table S 1 ). Specifically, certain categories within tissues and treatments have a higher number of samples compared to others. For example, in the 760 Camellia sinensis RNA-seq samples, the “leaf and bud” samples accounted for 78.3% of the total, while the “no treatment” samples in the experimental treatments category accounted for 46.3%, far exceeding the numbers of other categories (Fig. 1 ). Regarding cultivars, we saw a relatively balanced representation across different categories, but some cultivars have a higher proportion. For instance, “Shuchazao” accounts for 17.8%, “Longjing 43” accounts for 17.2%, and “Fuding Dabaicha” accounts for 11.6% (Fig. 1 ).

Analysis of metadata for RNA-seq samples of Camellia sinensis . A Cultivar. B Tissue. C Experimental treatments
K-means clustering effectively classified global samples and significantly improved the accuracy of co-expression analysis
K-means clustering is used to organize and classify the globally imbalanced samples in the metadata term. The metadata annotations of the clustered samples are then used as the “conditions” representing the specificity of the cluster samples.
In this study, the silhouette score was used to determine the value of K in k-means clustering. The method of selecting the appropriate K value using the silhouette score primarily considers two indicators: (1) For a particular K value, all clusters should have a silhouette score higher than the average score of the dataset, as represented by the red-dotted line on the x-axis. Clusters with K values of 3, 5, 6, 10, and 11 are eliminated because they do not meet this condition (Figure S 1 ). (2) There should not be significant fluctuations in the cluster sizes. The width of the clusters corresponds to the number of sample points. Only K values of 2 and 4 exhibit relatively uniform widths (Figure S 1 ). Here, we chose 4 as the K value.
After analyzing 760 Camellia sinensis RNA-seq samples using the k-means clustering algorithm, four clusters were obtained, with Cluster 1 to Cluster 4 accounting for 30.9% (235 samples), 23.8% (181 samples), 32.1% (244 samples), and 13.2% (100 samples) of the total samples, respectively (Fig. 2 A) (Table 1 ). By performing t-Distributed Stochastic Neighbor Embedding (t-SNE) on the transcriptome data to reduce the dimensionality of the genes, the spatial distribution of these samples in Component 1 and Component 2 was observed, where samples from the 4 clusters were separated (Fig. 2 B).

K-means clustering of Camellia sinensis RNA-seq samples and comparative analysis of global vs. cluster-specific co-expression modules. (A) Pie chart showing the proportion of k-means clusters. (B) Scatter plots of t-SNE show the spatial distribution of all Camellia sinensis RNA-seq samples on Component 1 and Component 2. Different clusters are distinguished using different colors, while the same cluster remains consistent across A and B. (C) Similarity analysis of global and cluster-specific co-expression modules. The intensity of colors in the heatmap represents the magnitude of the Fowlkes-Mallows score (FMS). (D) Comparison of the gene-module consistency coefficient (GMC) of all genes between the global module and the cluster-specific module for each cluster
By conducting enrichment analysis on the metadata of k-means clusters, metadata terms related to cultivars, tissues, and treatments were annotated to each k-means cluster, facilitating a better understanding of the characteristics and functions of Camellia sinensis RNA-seq samples represented by each k-means cluster (Table 1 ). For example, Cluster 2 mainly includes leaves and buds of the “Longjing 43” and “Shuchazao” cultivar, with experimental treatments focused on cold stress and shading. Such annotations are also called “conditions” represented by Cluster 2.
Weighted gene co-expression network analysis (WGCNA) was used to obtain global modules and cluster-specific modules from global samples and cluster samples. 23 co-expression modules were obtained based on the global expression profile, indicating the presence of complex and diverse co-expression relationships among genes (Table S 5 ). Different numbers of co-expression modules were obtained based on the cluster expression profiles. Specifically, 12, 23, 22, and 14 co-expression modules were obtained based on Cluster 1 to Cluster 4 expression profiles, respectively (Table 1 ). The varying numbers of cluster-specific co-expression modules reflect changes in gene expression patterns under different cultivars, tissues, and experimental treatments.
Two perspectives of analysis were performed to elucidate the extent of differences in co-expression modules obtained from global samples and cluster samples: similarity analysis of module genes and internal consistency analysis of module expression profiles.
To investigate the similarity of co-expression modules obtained from global samples and cluster samples in WGCNA, the Fowlkes-Mallows score (FMS) was used as a metric. FMS is commonly used to compare the similarity of clusters or co-expression modules obtained from different samples or conditions. The FMS score ranges from 0 to 1, where a value closer to 1 indicates a higher similarity between the two data sets. Conversely, when FMS approaches 0, it indicates a low consistency between the two datasets. We observed that the FMS between the global module and cluster-specific modules ranges from 0.55 to 0.85 (Fig. 2 C). Specifically, the similarity between the global module and the cluster-specific modules of Cluster 2 is low (Fig. 2 C). Additionally, the cluster-specific module of Cluster 2 shows low similarity with the majority of other clusters’ specific modules (Fig. 2 C). This suggests a higher level of uniqueness for Cluster 2, suggesting that the condition of Cluster 2 might employ a transcriptional program different from the other conditions.
We used the gene-module consistency coefficient (GMC) to assess the similarity between the expression profiles of genes and the average expression profile within a module. The GMC is essentially the correlation coefficient between the expression profiles of genes and the eigengene within a module. It ranges from−1 to 1, where a value greater than 0 indicates a positive correlation and a value less than 0 indicates a negative correlation. As expected, genes from the same module tend to have a GMC score larger than 0, as genes in the same module should be correlated (Fig. 2 D). We observed that the median GMC of genes in the cluster-specific modules tends to be slightly higher than the GMC of genes in the global module, especially Cluster 2, which is significantly higher than the global module (Fig. 2 D). This confirms that after classifying samples using k-means clustering, conducting co-expression analysis with cluster-specific samples generally improves accuracy, particularly for cluster samples that exhibit significant differences from the global samples, such as in Cluster 2.
Understanding the condition-specificity of co-expression modules from two perspectives
In traditional WGCNA, after obtaining co-expression modules, there is often a biological functional annotation of the modules. However, here, we not only annotate the modules with functional information, but also calculate the conditional specificity of each module to each function. In this study, correlation difference value (CDV) is proposed as a measure of gene condition specificity. CDV is calculated as the difference between the gene-module consistency coefficient (GMC) of a gene in the cluster-specific module and its GMC in the global module. CDV values range from−2 to 2. A CDV value closer to 2 indicates a higher level of gene condition specificity, while a value closer to 0 indicates a higher level of conservation, as the average expression of the gene is more similar to the expression profile of the global module.
To explain the biological function of condition-specific genes, we analyzed a series of CDV thresholds ranging from 0 to 1. For each threshold, genes with CDV values higher than the threshold were considered cluster-specific, while genes with CDV values lower than the threshold were considered conserved. For each threshold, we calculated the similarity between the global module and the cluster-specific module after removing genes with values higher than the threshold (Fig. 3 A). Therefore, lines in the line plot can be understood as follows: when the threshold is close to 0, there is a high similarity between the global module and the cluster-specific module. However, as the threshold increases from 0 to 1, genes with higher CDV values are included in both the global module and the cluster-specific module, resulting in a decrease in the similarity between them (Fig. 3 B). In other words, genes with higher CDV values lead to lower similarity between the global module and the cluster-specific module, indicating higher condition specificity, while genes with lower CDV values have minimal impact on the similarity between the global module and the cluster-specific module. In Cluster 2, the similarity decreases most rapidly with increasing threshold, indicating that genes with high CDV values in Cluster 2 are more condition-specific (Fig. 3 B).

Relationship between correlation difference value (CDV) and condition specificity, and average CDV of different biological functions in different clusters. A Illustrative graph demonstrating the change in module similarity as the threshold increases from 0.3 to 0.9. B The impact of genes with different CDV on the similarity of global modules and cluster-specific modules. C CDV heatmap for each bio-function in each cluster. Cells marked with asterisks (*) indicate significant enrichment, and the color of the cells represents the average CDV
Subsequently, the average CDV of genes with different biological functions in the four clusters revealed that Cluster 2, which was found to be least similar to the global module, has a higher proportion of genes with high average CDV values associated with specific biological functions (Fig. 3 C). This further underscores the relationship between CDV and condition specificity. We observed that in Cluster 2, genes with CDV values higher than 0.2 are mainly enriched in biological functions such as “transcriptional co-regulation”, “MAP kinase cascade signalling” and several “ubiquitin-proteasome system”-related terms (Fig. 3 C).
As discovered in the previous section, the Cluster 2 specific module is the least similar to the global module and is most likely to uncover condition-specific modules and biological functions. We analyzed Cluster 2 from two perspectives: gene condition specificity and biological function enrichment. By combining the average CDV (correlation difference value) heatmap, with the specific modules of Cluster 1 as the x-axis, and biological functions as the y-axis, and the results of significant biological function enrichment, we observed that the biological function with the highest average CDV are “MADS/AGL transcription factor”, “R2R3-MYB transcription factor family”, “secondary metabolism.terpenoids”, and “transcriptional co-regulation”, the module with the highest average CDV are “darkgrey”, “skyblue”, and “steelblue” (Fig. 4 ). Genes with high CDV values in the “purple” module are significantly enriched in biological functions such as “AP2/ERF family.ERF subfamily”, “transcriptional co-regulation”, “ubiquitin-proteasome system.F-BOX substrate adaptor”, and “redox homeostasis.glutathione-based redox regulation”, which has piqued our interest, prompting further investigation into this module (Fig. 4 ).

Correlation difference value (CDV) and functional enrichment heatmap corresponding to various biological functions for each co-expression module in Cluster 2. Cells marked with asterisks (*) indicate significant enrichment, and the color of the cells represents the average CDV. The blank cells in the figure indicate that the co-expressed module does not contain genes in that biological term or only genes with no CDV values
Combining condition specificity and gene regulatory network reveals a series of transcription factors important in sustained cold stress
To predict the regulatory relationships between genes in the “purple” module and identify condition-specific co-expressed genes that could potentially explain the specificity of Cluster 2 under certain conditions, we constructed a gene regulatory network for the “purple” module and annotated the genes with their CDV. We observed that in the gene regulatory network of the “purple” module, there are 12 transcription factor encoding genes with CDV values greater than 0.4 (Fig. 5 A). They encode transcription factors including AP2/ERF-ERF, C3H, SET, IWS1, C2H2, GRAS, TUB, HSF, and MYB-related (Fig. 5 A). Additionally, there are 14 target genes regulated by transcription factors with CDV values greater than 0.6 (Fig. 5 A). They encode proteins including PIP5K, PRPF3, RCF1, SEU/SLK, and glutathione S-transferase (Fig. 5 A).

Gene regulatory network and comparison analysis of expression profiles. A Gene regulatory network of genes in the “purple” module of Cluster 2. The color intensity of the edges represents the weight between two nodes, and the color variation of the node borders represents the level of correlation difference value (CDV). B Comparison of the expression profile of gene CSS0042951.1 with the expression profiles of the eigengenes of the Cluster 2 module and the Global module. C Comparison of the expression profile of gene CSS0047322.2 with the expression profiles of the eigengenes of the Cluster 2 module and the Global module. D Expression levels of the high CDV transcription factor-encoding genes in the “purple” module of Cluster 2 under sustained low-temperature treatment in the first leaf (FL) and two leaves and a bud (TAB)
To further compare the differences between cluster-specific co-expression modules and global co-expression modules, and to demonstrate the role of CDV values, we selected a high CDV gene and a low CDV gene from the gene regulatory network of the “purple” module and plotted their expression profiles. By comparing the expression profile of the eigengene in the module where the gene in Cluster 2 is located (yellow line) with the expression profiles of the eigengene in the module where the gene in global is located (green line), we found that the eigengene of Cluster 2 module effectively capture the expression differences among samples within Cluster 2, while the eigengene of the global module do not represent the expression characteristics of the samples well (Fig. 5 BC). This indicates that k-means clustering significantly enhances the accuracy of cluster sample co-expression analysis. Furthermore, the expression profile of gene CSS0042951.1 with a higher CDV (0.8542) is more similar to the eigengene of Cluster 2 module, while the expression profile of gene CSS0047322.2 with a lower CDV (0.1518) is difficult to distinguish and is more similar to the eigengene of the global module rather than the eigengene of Cluster 2 module, which intuitively demonstrates that genes with higher CDV values are more valuable for research (Fig. 5 BC).
The eigengene expression profile of Cluster 2 in the “purple” module exhibits several very distinct peaks, corresponding to samples primarily concentrated in a sustained cold stress treatment experiment. We plotted the expression profiles of 12 transcription factor encoding genes with CDV values greater than 0.4 in this experiment. We observed that with increasing duration of cold treatment (from 0 h to 48 h), the expression levels of the majority of high CDV transcription factor encoding genes significantly increased, regardless of whether it was in the tea tree first leaf (FL) or two leaves and a bud (TAB) samples (Fig. 5 D). Only two AP2/ERF-ERF encoding genes showed a significant increase in expression levels in two leaves and a bud (TAB) samples (Fig. 5 D).
Tea plant ( Camellia sinensis ), being one of the world’s most important beverage crops, is known for its numerous secondary metabolites that contribute to the tea quality and health benefits. In order to characterize the biological functions of genes in tea plants, previous research has utilized a large-scale SRA data downloaded from NCBI to construct a gene co-expression network database known as TeaCoN ( http://teacon.wchoda.com ) [ 9 ].
However, when conducting co-expression analysis, more samples does not necessarily mean better results [ 10 ]. Researchers analyzed a dataset of Escherichia coli microarray data and found that subsets of the dataset performed better in inferring transcriptional regulatory networks [ 41 ]. The poor performance of the global network was attributed to increased multidimensional noise [ 11 ]. However, this issue can be mitigated by determining the optimal number of effective samples, for example, through a downsampling method that automatically groups samples using k-means clustering [ 12 , 13 ].
In this study, we observed that the metadata entries (experimental treatments, tissues, and cultivars) of the SRA samples downloaded from NCBI were imbalanced (Fig. 1 ). This phenomenon has also been observed in other large-scale co-expression analysis studies [ 9 ]. The imbalanced sampling of global samples makes it difficult to represent specific research questions that require specific experimental conditions [ 42 ]. Therefore, in this study, a k-means clustering method was employed to automatically classify and organize all samples based on their gene expression patterns, forming distinct clusters (Figure S 1 ; Fig. 2 AB). By annotating these clusters, each cluster can represent specific conditions (Table 1 ).
Based on the comparative analysis from two perspectives, we observed significant differences between the global module and the cluster-specific modules in terms of gene composition (Fig. 2 C). Furthermore, compared to the co-expression modules obtained from the global samples, the co-expression modules corresponding to the clustered samples indeed showed a significant improvement in accuracy (Fig. 2 D). Specifically, under specific conditions, there was a higher similarity between the gene expression profiles and the average expression profiles of the modules they belonged to (Fig. 2 D). Additionally, we found that the Cluster 2 specific module has the most unique gene composition and the most concentrated biological functions compared to the global module, which warrants further investigation (Fig. 2 CD).
Although the co-expression analysis of the clustered samples has higher accuracy, it does not mean that the analysis of the global samples becomes meaningless. On the contrary, by combining the co-expression analysis of the clustered samples with that of the global samples, we can obtain more valuable information. In this study, a correlation difference value (CDV) was proposed to explain the condition specificity of a gene by comparing the correlation between the gene expression profile and the average expression profile of the cluster-specific module, and the correlation between the gene expression profile and the average expression profile of the global module under specific conditions. CDV has been demonstrated in this paper to reflect the impact of a gene on the similarity between the cluster-specific module and the global module (Fig. 3 AB). Genes with higher CDV values exhibit higher condition specificity and are worth further investigation.
In this study, through the investigation of the specific condition Cluster 2, we identified a co-expression module “purple” highly associated with cold stress. In its gene regulatory network, a series of genes encoding high-CDV transcription factors were significantly upregulated in the continuously cold-treated tea plant leaves and buds (Fig. 5 A). These transcription factor-encoding genes include AP2/ERF-ERF, C3H, SET, IWS1, C2H2, GRAS, TUB, HSF, and MYB-related factors, most of which have been extensively linked to cold stress response in tea plants in numerous studies [ 43 , 44 , 45 , 46 ].
Researchers have found in past studies that GST and HSF interact to some extent in cellular antioxidant stress responses and coping with external pressures [ 47 ]. In this study, we observed that a glutathione S-transferase (GST) encoding gene, CSS0018941.1 , with a high CDV (0.7153), is regulated by a heat shock factor (HSF) encoding gene, CSS0013166.1 , with a high CDV (0.5926), implying the involvement of GST and HSF interaction in the antioxidant defense system of tea plants under sustained cold stress, aiding in the clearance of harmful compounds and oxidative stress products within cells. Heatmaps of the expression profiles of CSS0013166.1, a homologous gene AT1G67970.1 in Arabidopsis (E-value = 1e−26), and CSS0018941.1 , a homologous gene AT1G10370.1 in Arabidopsis (E-value = 4e−04), were plotted in ePlant ( https://bar.utoronto.ca/eplant/ .) [ 48 ]. We found that both AT1G67970.1 and AT1G10370.1 exhibited an upregulation trend under various abiotic persistent stresses, including sustained cold treatment, further confirming the findings in this study (Figure S 3 ).
Availability of data and materials
The raw RNA sequencing data used in this study are available from the NCBI Sequence Read Archive (SRA) under the accession numbers listed in Table S 1 . No sequencing data were generated during this study.
Abbreviations
weighted gene co-expression network analysis
Correlationdifference value
Coding sequences
Transcripts per million
False discovery rate
Fowlkes-Mallows score
Adjusted mutualinformation score
Gene-module consistency coefficient
PEARSONcorrelation coefficient
t-Distributed Stochastic Neighbor Embedding
Wang C, Han J, Pu Y, et al. Tea (Camellia sinensis): a review of nutritional composition, potential applications, and Omics Research. Appl Sci. 2022;12(12):5874.
Article CAS Google Scholar
Chen L, Zhou ZX, Yang YJ. Genetic improvement and breeding of tea plant (Camellia sinensis) in China: from individual selection to hybridization and molecular breeding. Euphytica. 2007;154:239–48.
Chen L, Apostolides Z, Chen ZM, et al. Tea germplasm and breeding in China. In: Chen, Z.M., (Ed.), Global Tea Breeding. Berlin: Springer; 2012. p. 13–58.
Zhao S, Cheng H, Xu P, et al. Regulation of biosynthesis of the main flavor-contributing metabolites in tea plant ( Camellia sinensis ): a review. Crit Rev Food Sci Nutr. 2023; 63(30):10520–35.
Liao Y, Zhou X, Zeng L. How does tea (Camellia sinensis) produce specialized metabolites which determine its unique quality and function: a review. Crit Rev Food Sci Nutr. 2022;62(14):3751–67.
Article PubMed Google Scholar
Tai Y, Liu C, Yu S, et al. Gene co-expression network analysis reveals coordinated regulation of three characteristic secondary biosynthetic pathways in tea plant (Camellia sinensis). BMC Genomics. 2018;19:1–13.
Article Google Scholar
Xia EH, Tong W, Wu Q, et al. Tea plant genomics: achievements, challenges and perspectives. Hortic Res. 2020;7:7.
Article CAS PubMed PubMed Central Google Scholar
Zhao Z, Ma D. Genome-wide identification, characterization and function analysis of lineage-specific genes in the tea plant Camellia sinensis. Front Genet. 2021;12:770570.
Zhang R, Ma Y, Hu X, et al. TeaCoN: a database of gene co-expression network for tea plant (Camellia sinensis). BMC Genomics. 2020;21(1):1–9.
Google Scholar
He F, Maslov S. Pan-and core-network analysis of co-expression genes in a model plant. Sci Rep. 2016;6(1):38956.
Liesecke F, De Craene JO, Besseau S, et al. Improved gene co-expression network quality through expression dataset down-sampling and network aggregation. Sci Rep. 2019;9(1):14431.
Article PubMed PubMed Central Google Scholar
Feltus FA, Ficklin SP, Gibson SM, et al. Maximizing capture of gene co-expression relationships through pre-clustering of input expression samples: an Arabidopsis case study. BMC Syst Biol. 2013;7:1–12.
Gibson S 3M, Ficklin SP, Isaacson S, et al. Massive-scale gene co-expression network construction and robustness testing using random matrix theory. PLoS One. 2013;8(2).
Xiao X, Moreno-Moral A, Rotival M, et al. Multi-tissue analysis of co-expression networks by higher-order generalized singular value decomposition identifies functionally coherent transcriptional modules. PLoS Genet. 2014;10(1):e1004006.
de la Fuente A. From ‘differential expression’to ‘differential networking’–identification of dysfunctional regulatory networks in diseases. Trends Genet. 2010;26(7):326–33.
Roguev A, Bandyopadhyay S, Zofall M, et al. Conservation and rewiring of functional modules revealed by an epistasis map in fission yeast. Science. 2008;322(5900):405–10.
Bandyopadhyay S, Mehta M, Kuo D, et al. Rewiring of genetic networks in response to DNA damage. Science. 2010;330(6009):1385–9.
Choi JK, Yu U, Yoo OJ, et al. Differential coexpression analysis using microarray data and its application to human cancer. Bioinformatics. 2005;21(24):4348–55.
Article CAS PubMed Google Scholar
Ideker T, Krogan NJ. Differential network biology. Mol Syst Biol. 2012;8(1):565.
Amar D, Safer H, Shamir R. Dissection of regulatory networks that are altered in disease via differential co-expression. PLoS Comput Biol. 2013;9(3):e1002955.
Guénolé A, Srivas R, Vreeken K, et al. Dissection of DNA damage responses using multiconditional genetic interaction maps. Mol Cell. 2013;49(2):346–58.
Southworth LK, Owen AB, Kim SK. Aging mice show a decreasing correlation of gene expression within genetic modules [J]. PLoS Genet. 2009;5(12):e1000776.
Hudson NJ, Reverter A, Dalrymple BP. A differential wiring analysis of expression data correctly identifies the gene containing the causal mutation. PLoS Comput Biol. 2009;5(5):e1000382.
Anglani R, Creanza TM, Liuzzi VC, et al. Loss of connectivity in cancer co-expression networks. PLoS One. 2014;9(1):e87075.
Chen S, Zhou Y, Chen Y, et al. Fastp: an ultra-fast all-in-one FASTQ preprocessor. Bioinformatics. 2018;34(17):i884–90.
Xia EH, Li FD, Tong W, et al. Tea plant information archive: a comprehensive genomics and bioinformatics platform for tea plant. Plant Biotechnol J. 2019;17(10):1938–53.
Bray NL, Pimentel H, Melsted P, et al. Near-optimal probabilistic RNA-seq quantification. Nat Biotechnol. 2016;34(5):525–7.
Lohse M, Nagel A, Herter T, et al. M ercator: a fast and simple web server for genome scale functional annotation of plant sequence data. Plant Cell Environ. 2014;37(5):1250–8.
Tavazoie S, Hughes JD, Campbell MJ, et al. Systematic determination of genetic network architecture. Nat Genet. 1999;22(3):281–5.
Shahapure KR, Nicholas C. Cluster quality analysis using silhouette score. In Proceedings of the 2020 IEEE 7th International Conference on Data Science and Advanced Analytics (DSAA). Sydney: 2020. p. 747.
Van der Maaten L, Hinton G. Visualizing data using t-SNE. J Mach Learn Res. 2008;9(11):2579–2605.
Hahne F, Huber W, Gentleman R, et al. Hypergeometric testing used for gene set enrichment analysis. In: Bioconductor case studies. New York: Springer New York; 2008. p. 207–220.
Benjamini Y, Hochberg Y. Controlling the false discovery rate: a practical and powerful approach to multiple testing. J Roy Stat Soc Ser B Methodol. 1995;57(1):289–300.
Langfelder P, Horvath S. WGCNA: an R package for weighted correlation network analysis. BMC Bioinformatics. 2008;9(1):1–13.
Zhang B, Horvath S. A general framework for weighted gene co-expression network analysis. Stat Appl Genet Mol Biol. 2005;4(1):Article17.
Fowlkes EB, Mallows CL. A method for comparing two hierarchical clusterings. J Am Stat Assoc. 1983;78:553–69.
Amelio A, Pizzuti C. Correction for closeness: adjusting normalized mutual information measure for clustering comparison [J]. Comput Intell. 2017;33(3):579–601.
Cohen I, Huang Y, Chen J, et al. Pearson correlation coefficient. In: Noise reduction in speech processing. Heidelberg: Springer; 2009. p. 1–4.
Huynh-Thu VA, Irrthum A, Wehenkel L, et al. Inferring regulatory networks from expression data using tree-based methods. PLoS One. 2010;5(9):e12776.
Shannon P, Markiel A, Ozier O, et al. Cytoscape: a software environment for integrated models of biomolecular interaction networks. Genome Res. 2003;13(11):2498–504.
Cosgrove EJ, Gardner TS, Kolaczyk ED. On the choice and number of microarrays for transcriptional regulatory network inference. BMC Bioinformatics. 2010;11:1–16.
Liu W, Lin L, Zhang Z, et al. Gene co-expression network analysis identifies trait-related modules in Arabidopsis thaliana. Planta. 2019;249:1487–501.
Liu ZW, Wu ZJ, Li XH, et al. Identification, classification, and expression profiles of heat shock transcription factors in tea plant (Camellia sinensis) under temperature stress. Gene. 2016;576(1):52–9.
Wu L, Li J, Li Z, et al. Transcriptomic analyses of Camellia oleifera ‘Huaxin’ leaf reveal candidate genes related to long-term cold stress. Int J Mol Sci. 2020;21(3):846.
Zhang S, Liu J, Zhong G, et al. Genome-wide identification and expression patterns of the C2H2-zinc finger gene family related to stress responses and catechins accumulation in Camellia sinensis [L.] O. Kuntze. Int J Mol Sci. 2021;22(8):4197.
Wang YJ, Wu LL, Sun M, et al. Transcriptomic and metabolomic insights on the molecular mechanisms of flower buds in responses to cold stress in two Camellia oleifera cultivars. Front Plant Sci. 2023;14:1126660.
Xie DL, Huang HM, Zhou CY, et al. HsfA1a confers pollen thermotolerance through upregulating antioxidant capacity, protein repair, and degradation in Solanum lycopersicum L. Hortic Res. 2022;9:uhac163.
Waese J, Fan J, Pasha A, et al. ePlant: visualizing and exploring multiple levels of data for hypothesis generation in plant biology. Plant Cell. 2017;29(8):1806–21.
Download references
Acknowledgements
X.Z. is sponsored by a China Scholarship Council fellowship.
This project is funded by the “Pioneer” and “Leading Goose” R&D Program of Zhejiang (2023C02041).
Author information
Authors and affiliations.
Tea Research Institute, Zhejiang University, Hangzhou, 310058, Zhejiang, China
Xinghai Zheng & Yuefei Wang
School of Biological Sciences, Nanyang Technological University, 60 Nanyang Drive, Singapore, 637551, Singapore
Xinghai Zheng, Peng Ken Lim & Marek Mutwil
You can also search for this author in PubMed Google Scholar
Contributions
X.Z. led the main work of this study, including project conception, data annotation, data analysis, and paper writing. P.K.L. contributed suggestions on using K-means clustering analysis to address sample imbalance issues in co-expression analysis. M.M. and Y.W. co-supervised X.Z. in completing this project. M.M. and P.K.L. both participated in the revision of the paper. The authors thank all members of the Mutwil Lab for their suggestions and assistance with this manuscript.
Corresponding authors
Correspondence to Xinghai Zheng , Marek Mutwil or Yuefei Wang .
Ethics declarations
Ethics approval and consent to participate.
Not applicable.
Consent for publication
Competing interests.
The authors declare no competing interests.
Additional information
Publisher’s note.
Springer Nature remains neutral with regard to jurisdictional claims in published maps and institutional affiliations.
Supplementary Information
Supplementary material 1., supplementary material 2., supplementary material 3., supplementary material 4., supplementary material 5., supplementary material 6., supplementary material 7., supplementary material 8., supplementary material 9., rights and permissions.
Open Access This article is licensed under a Creative Commons Attribution 4.0 International License, which permits use, sharing, adaptation, distribution and reproduction in any medium or format, as long as you give appropriate credit to the original author(s) and the source, provide a link to the Creative Commons licence, and indicate if changes were made. The images or other third party material in this article are included in the article's Creative Commons licence, unless indicated otherwise in a credit line to the material. If material is not included in the article's Creative Commons licence and your intended use is not permitted by statutory regulation or exceeds the permitted use, you will need to obtain permission directly from the copyright holder. To view a copy of this licence, visit http://creativecommons.org/licenses/by/4.0/ . The Creative Commons Public Domain Dedication waiver ( http://creativecommons.org/publicdomain/zero/1.0/ ) applies to the data made available in this article, unless otherwise stated in a credit line to the data.
Reprints and permissions
About this article
Cite this article.
Zheng, X., Lim, P.K., Mutwil, M. et al. A method for mining condition-specific co-expressed genes in Camellia sinensis based on k-means clustering. BMC Plant Biol 24 , 373 (2024). https://doi.org/10.1186/s12870-024-05086-5
Download citation
Received : 27 January 2024
Accepted : 30 April 2024
Published : 08 May 2024
DOI : https://doi.org/10.1186/s12870-024-05086-5
Share this article
Anyone you share the following link with will be able to read this content:
Sorry, a shareable link is not currently available for this article.
Provided by the Springer Nature SharedIt content-sharing initiative
- Condition-specific gene interactions
- Gene co-expression network analysis
- K-means clustering
- Correlation difference value
- Sustained cold stress
BMC Plant Biology
ISSN: 1471-2229
- General enquiries: [email protected]
Advancing social justice, promoting decent work ILO is a specialized agency of the United Nations
Migrated Content
The country briefs map the key legal provisions dealing with migrant workers in eight Arab countries, summarizing the legal rules about who pays for recruitment, whether passport confiscation is prohibited by law, minimum working conditions including wages, working hours and rest periods, how to lodge grievances, and brief details of each country’s sponsorship regime.
Factsheets:
- Bahrain: Regulatory framework governing migrant workers
- Jordan: Regulatory framework governing migrant workers
- Saudi Arabia: Regulatory framework governing migrant workers
- Kuwait: Regulatory framework governing migrant workers
- Lebanon: Regulatory framework governing migrant workers
- Oman: Regulatory framework governing migrant workers
- Qatar: Regulatory framework governing migrant workers
- United Arab Emirates: Regulatory framework governing migrant workers

The FAIRWAY Programme
IMAGES
VIDEO
COMMENTS
When to use secondary research. Secondary research is a very common research method, used in lieu of collecting your own primary data. It is often used in research designs or as a way to start your research process if you plan to conduct primary research later on.. Since it is often inexpensive or free to access, secondary research is a low-stakes way to determine if further primary research ...
Types of secondary data are as follows: Published data: Published data refers to data that has been published in books, magazines, newspapers, and other print media. Examples include statistical reports, market research reports, and scholarly articles. Government data: Government data refers to data collected by government agencies and departments.
Using secondary data can connect the researcher with valuable data, but secondary research should have its own requirements and quality criteria to ensure rigor of the research. ... (2018) of diversity, equity, and autonomy, we developed a new hybrid secondary research methodology combining pragmatic qualitative research approach, discursive ...
Secondary research, also known as desk research, is a research method that involves compiling existing data sourced from a variety of channels. This includes internal sources (e.g.in-house research) or, more commonly, external sources (such as government statistics, organizational bodies, and the internet).
Secondary research is a method by which the researcher finds existing data, filters it to meet the context of their research question, analyzes it, and then summarizes it to come up with valid research conclusions. This research method involves searching for information, often via the internet, using keywords or search terms relevant to the ...
So, rightly secondary research is also termed " desk research ", as data can be retrieved from sitting behind a desk. The following are popularly used secondary research methods and examples: 1. Data Available on The Internet. One of the most popular ways to collect secondary data is the internet.
Introduction. Secondary data analysis is a valuable research approach that can be used to advance knowledge across many disciplines through the use of quantitative, qualitative, or mixed methods data to answer new research questions (Polit & Beck, 2021).This research method dates to the 1960s and involves the utilization of existing or primary data, originally collected for a variety, diverse ...
Secondary research methods focus on analyzing existing data rather than collecting primary data. Common examples of secondary research methods include: Literature review. Researchers analyze and synthesize existing literature (e.g., white papers, research papers, articles) to find knowledge gaps and build on current findings. Content analysis.
A real-world case description illustrates key steps: (1) define your research topic and question; (2) select a dataset; (3) get to know your dataset; and (4) structure your analysis and presentation of findings in a way that is clinically meaningful. Secondary dataset analysis is a well-established methodology.
Example of a Secondary Data Analysis. An example highlighting this method of reusing one's own data is Winters-Stone and colleagues' SDA of data from four previous primary studies they performed at one institution, published in the Journal of Clinical Oncology (JCO) in 2017. Their pooled sample was 512 breast cancer survivors (age 63 ± 6 years) who had been diagnosed and treated for ...
Secondary Research. Data Source: Involves utilizing existing data and information collected by others. Data Collection: Researchers search, select, and analyze data from published sources, reports, and databases. Time and Resources: Generally more time-efficient and cost-effective as data is already available.
Step 3: Design your research process. After defining your statement of purpose, the next step is to design the research process. For primary data, this involves determining the types of data you want to collect (e.g. quantitative, qualitative, or both) and a methodology for gathering them. For secondary data analysis, however, your research ...
Secondary Data Research Methods The methods for conducting secondary data research typically involve finding and studying published research. There are several ways you can do this, including: Finding the data online: Many market research websites exist, as do blogs and other data analysis websites. Some are free, though some charge fees.
The quantitative method of secondary data analysis is used on numerical data and is analyzed mathematically. The qualitative method uses words to provide in-depth information about data. ... Identifying secondary data: Using the research questions as a guide, researchers will then begin to identify relevant data from the sources provided. If ...
Sources of Secondary Data. Sources of secondary data include books, personal sources, journals, newspapers, websitess, government records etc. Secondary data are known to be readily available compared to that of primary data. It requires very little research and needs for manpower to use these sources.
SDA involves investigations where data collected for a previous study is analyzed - either by the same researcher(s) or different researcher(s) - to explore new questions or use different analysis strategies that were not a part of the primary analysis (Szabo and Strang, 1997).For research involving quantitative data, SDA, and the process of sharing data for the purpose of SDA, has become ...
Secondary Data. While sociologists often engage in original research studies, they also contribute knowledge to the discipline through secondary data analysis. Secondary data do not result from firsthand research collected from primary sources, but are the already completed work of other researchers. Sociologists might study works written by ...
This research employs mixed qualitative and quantitative methods (Onwuegbuzie and Johnson, 2006), and it is strongly based on secondary data (Martins et al., 2018). In order to obtain data from ...
Background: The use of secondary data, such as claims or administrative data, in comparative effectiveness research has grown tremendously in recent years. Purpose: We believe that the current review can help investigators relying on secondary data to (1) gain insight into both the methodologies and statistical methods, (2) better understand the necessity of a rigorous planning before ...
Reliable databases for secondary sources include Government Sources, Business Source Complete, ABI, IBISWorld, Statista, and CBCA Complete. This data is generated by others but can be considered useful when conducting research into a new scope of the study. It also means less work for a non-for-profit organization as they would not have to ...
Introduction. Secondary data analysis has the potential to provide answers to science and society's most pressing questions. An abundance of secondary data exists—cohort studies, surveys, administrative data (e.g., health records, crime records, census data), financial data, and environmental data—that can be analysed by researchers in academia, industry, third-sector organisations, and ...
Objective: This study aims to assess the application and characteristics of PRO instruments as primary or secondary outcomes in adult randomized clinical trials related to tumors in China. Methods: This cross-sectional study identified tumor-focused randomized clinical trials conducted in China between January 1, 2010, and June 30, 2022.
We are the statutory custodian for health and care data for England, serving stakeholders across the UK. We enable the health and social care system to make best use of its data to improve healthcare outcomes, efficiency of services and the impact of research, while safeguarding the privacy of the people whose data we hold.
Introduction. This study utilizes data from research investigating New South Wales (NSW) secondary deputy principals across three education systems: the government, Catholic and independent systems (Leaf, Citation 2023).Across Australia, all three education systems are regulated by federal and state governments; the government system is the largest Australian education system, the NSW ...
Qualitative secondary analysis (QSA) is the use of qualitative data collected by someone else or to answer a different research question. Secondary analysis of qualitative data provides an opportunity to maximize data utility particularly with difficult to reach patient populations. However, QSA methods require careful consideration and ...
Implementation science identifies and addresses contextual factors to help promote its use," said Krupp.Krupp and Dunn Lopez suspect the results of the study will influence a "pragmatic way of accelerating the use of patient data with guideline recommendations at the point of care to support ICU clinicians in delivering evidence-based care ...
Background As one of the world's most important beverage crops, tea plants (Camellia sinensis) are renowned for their unique flavors and numerous beneficial secondary metabolites, attracting researchers to investigate the formation of tea quality. With the increasing availability of transcriptome data on tea plants in public databases, conducting large-scale co-expression analyses has become ...
Secondary data analysis. Secondary analysis refers to the use of existing research data to find answer to a question that was different from the original work ( 2 ). Secondary data can be large scale surveys or data collected as part of personal research. Although there is general agreement about sharing the results of large scale surveys, but ...
By outlining both the provisions that apply in the private sector (where most migrant workers are employed) as well as those relating to domestic workers specifically, the factsheets are intended to be a useful summary of relevant legislation, for use by labour attaches, trade unions and other organizations seeking to support migrant workers from an advocacy or case-work perspective.