Geography Notes
Essay on weather and climate: top 6 essays | climatology | geography.
ADVERTISEMENTS:
Here is a compilation of essays on ‘Weather and Climate’ for class 6, 7, 8, 9 and 10. Find paragraphs, long and short essays on ‘Weather and Climate’ especially written for school students.

Essay on Weather and Climate
Essay Contents:
- Essay on Variation in Climate and Weather
Essay # 1. Meaning of Weather and Climate:
Weather is the day-to-day state of atmosphere and pertains to short term changes in conditions of heat, moisture and air movement. Weather results from processes that attempt to equalise the differences in the distribution of net radiant energy from sun. In other words, the instantaneous state of atmosphere can be called as weather. It is usually expressed as fine, fair, foggy, cloudy, rainy, sunny or windy weather.
The process of exchange of heat and moisture between earth and atmosphere over a long period of time (month, season, and year) related to large areas (zone, state, country, continent) results in conditions what we call climate.
It is aggregate of atmospheric conditions involving heat, moisture and air movement. In other words, the totality of weather over a large area is known as climate. It is expressed as marine, continental, arid, semiarid, humid or desert climate.
ADVERTISEMENTS: (adsbygoogle = window.adsbygoogle || []).push({}); Essay # 2. Elements of Weather and Climate :
Weather refers to the sum total of the atmospheric conditions in terms of temperature, pressure, wind, moisture, cloudiness, precipitation and visibility of a particular place at any given time. In fact, weather denotes short-term variations of atmospheric conditions and it is highly variable.
On the other hand, climate is defined as aggregate weather conditions of any region in long-term perspective. According to Trewartha ‘climate represents a composite of day to day weather conditions, and of the atmospheric elements, within a specified area over a long period of time.’ According to Critchfield ‘climate is more than a statistical average; it is the aggregate of atmospheric conditions involving heat, moisture, and air movement. Extremes must always be considered in any climatic description in addition to means, trends, and probabilities.’
According to Koeppen and De Long ‘climate is a summary, a composite of weather conditions over a long period of time; truly portrayed, it includes details of variations-extremes, frequencies, sequences-of the weather elements which occur from year to year, particularly in temperature and precipitation. Climate is the aggregate of the weather.’
G.F. Taylor has maintained that ‘climate is the integration of weather, and weather is the differentiation of climate. The distinction between weather and climate is, therefore, mainly one of time.’ Temperature, pressure, wind, humidity, precipitation, cloudiness etc. are elements of weather and climate.
ADVERTISEMENTS: (adsbygoogle = window.adsbygoogle || []).push({}); Essay # 3. Importance of Weather and Climate :
Weather and climate are the most pervasive factors of crop environment.
Knowledge of agrometeorology is useful in several aspects of practical agriculture as indicated below:
1. It has practical utility in timing of agricultural operations so as to make the best use of favourable weather conditions and make adjustments for adverse weather.
2. The dangers of crop production due to pest and disease incidence, occurrence of prolonged drought, soil erosion, frost and weather hazards can be minimised.
3. Weather support also provides guidelines for long range or seasonal planning of crops and cultivars most suited to anticipated climatic conditions.
4. Agrometeorological information can be used in land use planning, risk analysis of climatic hazards, production and harvest forecasts and linking similar crop environments for crop adaptability and productivity.
Weather Elements :
Weather is a phase of climate representing atmospheric condition at a given place and at a given instant of time as against climate, representing atmospheric condition for longer period of time over a larger area.
Components of weather and climate or simply weather elements include:
a. Temperature.
b. Solar radiation.
c. Humidity.
e. Pressure.
g. Precipitation.
The influence of weather and climate on crop growth and development and final yield is complicated by complexity of interactions associated with crops and the environment during the crop season.
The influence of weather and climate on crop productivity can be summarised as indicated below:
Weather parameters with favourable influence :
1. Weather and climate are the important factors to determining the success or failure of agriculture.
2. All the agricultural operations from sowing to harvest of crops depend on the mercy of weather.
3. Climate determines suitability of a crop to a particular region while weather plays a major role in the productivity of a crop in the region.
4. The excess or shortage of elements of weather and climate exerts a negative influence on crop growth, development and final yield.
5. The effect of weather and climate is complex as elements of climate operate simultaneously in nature.
6. Due to complexity of environment in which a crop is grown, it is difficult to assign an, optimum value of a climatic element for maximum crop productivity.
Weather parameters with negative influence :
1. Excessive and untimely rains.
2. Scanty rains with prolonged dry spells.
3. Heat and cold waves.
4. Dust-storms, thunderstorms and hailstorms.
5. High winds.
Weather variables having both positive and negative effects on crop productivity :
1. Solar radiation (UV, light and infrared).
2. Temperature (air and soil).
3. Humidity,
5. Precipitation.
Essay # 4. Difference between Weather and Climate:
The differences between weather and climate are:
1. Pertains to the day-to-day state of the atmosphere at a particular place.
2. Refers to specific instant of time and place.
3. It is always changing and differs from time to time.
1. Pertains to the atmosphere over a given region,
2. Refers to a large region and for a long period of time.
3. It is more or less stable and differs from region to region.
Essay # 5. Factors Controlling Weather and Climate :
Geographical factors influencing weather and climate are referred to as climatic controls .
a. Latitude.
b. Altitude.
c. Land and water bodies.
d. Mountains.
e. Topography.
The distance from the equator (latitude), either from south or north, largely creates variation in climate. Based on latitude, the climate has been classified as tropical, subtropical, temperate and polar climates. The height from mean sea level (altitude/elevation) adds to variation in climate.
Temperature and pressure decreases with increasing height from mean sea level. Based on altitude, the climate is described as mountainous and valley/plateau climates. Nearness to large bodies of water also causes variation in climate. The climates are referred to as continental and maritime.
Instruments for Measuring Weather Parameters :
Different instruments are used for measuring weather parameters in observatories and laboratories. Depending on the level of accuracy required and the cost, instruments are used for recording the weather data.
Irrespective of whether it is an observatory or a lab. Table 2.1 gives a list or of instruments and weather parameter measured:
Essay # 6. Variation in Climate and Weather :
Climatic parameters are determined, primarily, by geographic factors such as:
1. Latitude.
2. Altitude.
3. Distance from large water bodies.
4. Ocean currents.
5. Intensity of wind.
All the above climatic parameters influence the wind. Three geographic factors—altitude, latitude and longitude are important for crop production. These are embodied in Hopkin Bioclimatic Law. It states that crop production activities (planting to harvest) and specific morphological developments are delayed by 4 days for each 1° latitude, 5° longitude and 12 m (40 ft) of altitude as one move northward and upward, respectively.
Intensity, velocity and direction of wind vary with three geographic factors leading to variation in climate and weather.
Geographic surface features such as large bodies of water and mountain ranges modify the wind characteristics and hence the meteorological parameters. A mountain range in the path of prevailing wind creates moist conditions on the windward side and dry conditions on the leeward side. Air cools adiabatically to the dew point as it rises up the mountains.
The air that is forced upward by the mountain range loses its moisture and becomes a dry mass when it goes over the top. This is called the orographic effect (relief effect), which is different from the usual rainfall without mountains. Topography influences weather and microclimate through variation in temperature and wind.
Water is normally warmer than the surrounding land. When wind blows over a large body of water, it picks up moisture, thus creating a more moderate leeward condition. The leeward side of the body of water is subjected to less temperature fluctuations (relatively stable weather) compared to windward side. Windward side is suitable for drought tolerant crops and leeward side to relatively drought sensitive crops. North facing and south facing slopes may differ in climate and natural vegetation. These sites differ in crops that can be grown.
World climate is not static but is subjected to changes caused by factors such as systematic changes in solar activity, sea level, atmospheric carbon dioxide and continental drift. Continental drift gradually changes the latitudinal position of the land masses and the sea level. Volcanic explosions discharge large amounts of dust and gases into the atmosphere. This may cause a decline in temperature (reverse of greenhouse effect).
Accumulation of greenhouse gases is responsible for global warming (gradual increasing trend in global average temperature largely due to greenhouse effect). In spite of technological advances in modern crop production, crop production is still subject to the vagaries of the weather that are manifested in three main ways— moisture stress, temperature stress and natural disasters.
Related Articles:
- Essay on Humidity: Top 5 Essays on Humidity| Climatology | Geography
- Savanna Climate: Location, Rainfall and Vegetation | Climatology | Geography
- Essay on Precipitation: Top 5 Essays | Process | Earth | Geography
- Essay on Fog: Top 4 Essays on Fog | Climatology | Geography
Climatology , Essay , Geography , Weather and Climate
Privacy Overview
An official website of the United States government
Official websites use .gov A .gov website belongs to an official government organization in the United States.
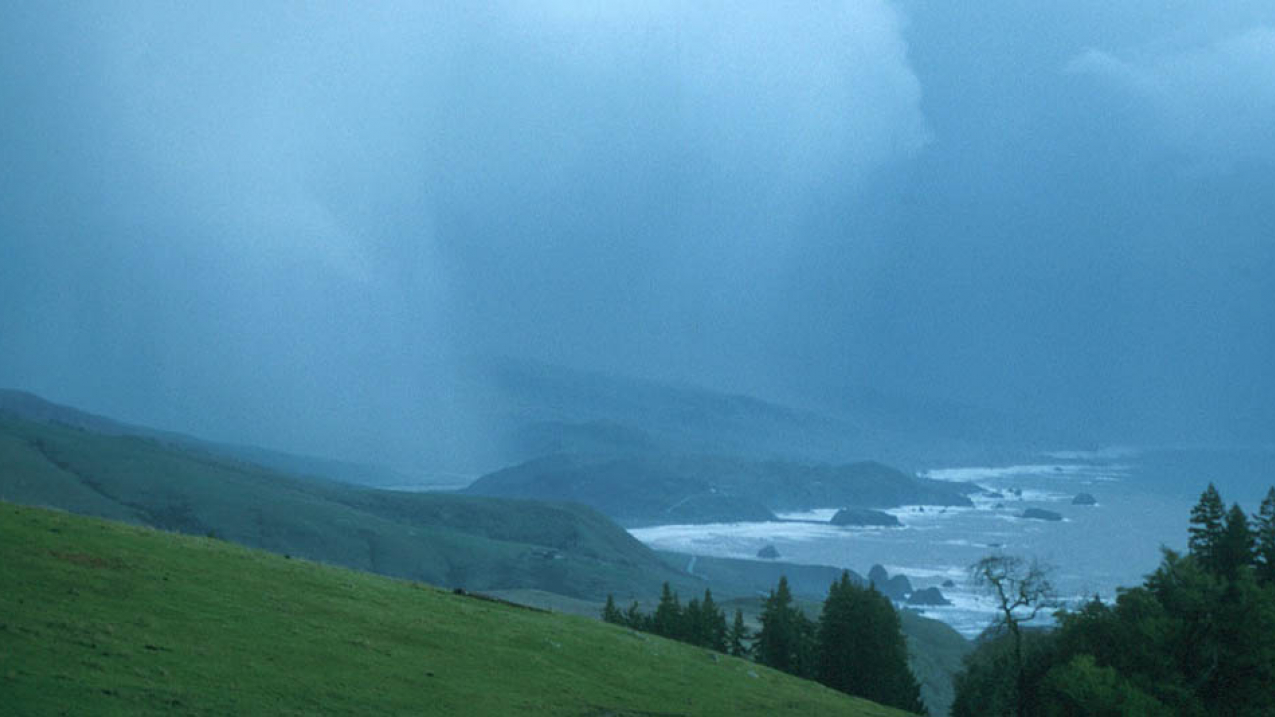
A storm darkens the sky at the mouth of the Russian River, north of Bodega Bay, Calif. Weather can change from minute-to-minute, hour-to-hour, day-to-day, and season-to-season. Climate, is the average of weather over time and space. (Image credit: NOAA)
What’s the difference between climate and weather?
How is weather different from climate, how does weather data become climate data, what is the difference between climate change and global warming.
Weather is what you experience when you step outside on any given day. In other words, it is the state of the atmosphere at a particular location over the short-term. Climate is the average of the weather patterns in a location over a longer period of time, usually 30 years or more.
If you’ve ever heard your local weathercaster say, “We just hit a record high for this day,” he or she is comparing the day’s weather with your location’s climate.
Death Valley, Calif. hits 134 degrees F in 1913, setting U.S. record
Weather can change quickly, from one moment to the next and over short distances. It can be raining one minute, and snowing the next. It can be pouring on one side of town and sunny on the other.
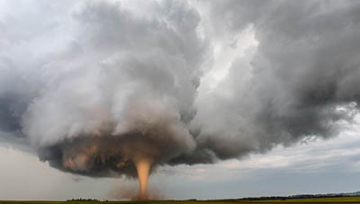
Climate, on the other hand, changes more slowly. That’s why we come to expect, for example, that the Northeast will be cold and snowy in January and that the South will be hot and humid in July. Also, climate generally doesn’t vary much over short distances, except in the mountains.
Part of NOAA’s mission is to build a Weather-Ready Nation —ensuring communities and businesses are prepared to for extreme weather, water, and climate-related events.
Whether it’s a hurricane, a crippling snowstorm, or a multi-year drought, weather and climate affect communities and businesses across the United States. NOAA’s National Weather Service is the nation’s lead forecasting agency, its first line of defense to ensure Americans can take steps to protect life and property.
NOAA’s NWS provides around-the-clock service to every American through our network of 122 local weather forecast offices and numerous regional centers that keep tabs on weather, fire, river, coast and ocean conditions. Our forecasters rely on a network of radars, satellites, ocean buoys, weather balloons, other observations, and supercomputers to provide timely, accurate, and reliable forecasts. They also issue critical watches and warnings before extreme weather strikes.
Dating back to the last centuries, NOAA and other scientific organizations have established networks of weather-observing stations across the country and around the world.
Climate is about the long term. It’s about using the weather data we collected in the past to look for long-term trends of 30 years or more. It also about applying the best science we have today to predict changes that may occur in the ocean and atmosphere in the future.
Climate is what you expect, weather is what you get
Worldwide, scientists observe weather conditions at thousands of stations every day of the year. Some observations are made hourly, others just once a day. Over time, these observations allow us to define what’s normal at each location. Scientists calculate averages of daily weather conditions, such as average temperature, precipitation, humidity, and wind speed, to describe climate.
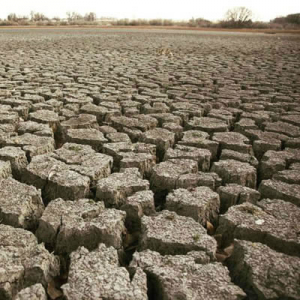
When scientists talk about climate, they’re talking about the averages of measureable things like land or sea temperature, amount of rainfall, date of the first frost, amount of sea ice melt, or sea level, etc. often over long timespans of 30 years or more.
In many locations around the United States, weather and climate records have been kept for more than 140 years. NOAA is involved in a long-term effort to collect, quality control, and organize data to make it available to the public online. These long-term records enable scientists to detect climate patterns and trends.
Climate datasets also allow scientists to generate climate data products, including graphics, maps, and reports such as the monthly or annual State of the Climate reports . These data also serve as input for computer models to help generate climate outlooks and weather forecasts.
The terms climate change and global warming are often used interchangeably. Is there a difference between the two? To scientists there is, but in general, everyday conversation, people use both.
2015 was the warmest year on record for Earth, a record that dates back to 1880.
Climate change refers to any significant change in the measures of climate for extended periods of time, usually over decades or longer. This includes major, long-term changes in temperature, precipitation, humidity, ocean heat, wind patterns, sea level, sea ice extent, and other factors, and how these changes affect life on Earth.
Climate change results from both human activities and natural causes. Human activities include the emission of heat-trapping greenhouse gases, such as carbon dioxide, into the atmosphere and changes in land-use patterns, such as agriculture and urbanization. Natural causes range from regular pattern shifts in the dynamics of our oceans and atmosphere, such as El Niño/ La Niña , to volcanic eruptions that emit various gasses and aerosols in the atmosphere, to long-term changes in the Earth’s orbit around the sun, to variations in the amount of energy from the Sun that reaches Earth.
Global warming is one aspect of climate change. Specifically, it relates to the recent and ongoing rise in global average temperatures near Earth’s surface (land, ocean or both). Over the last 50 years, global warming has primarily been due to the increase of heat-trapping pollutants, called greenhouse gases, that humans are adding to the atmosphere primarily by burning fossil fuels. The current increase in global average temperature appears to be occurring much faster than at any point in the last 11,000 years. Global warming is causing climate patterns to change. However, it is only one aspect of climate change.
Generally, when scientists talk about global warming, they almost always mean human-caused warming: warming due to the rapid increase of carbon dioxide and other heat-trapping gases in the atmosphere from people burning coal, oil, and gas, and from land uses, such as agriculture or urbanization.
Today’s global warming is an unprecedented type of climate change and is causing a number of side effects to our planet. These changes, from sea level rise to melting mountain glaciers to prolonged droughts, will likely have a much greater impact on society as a whole than temperature change alone.
For more information, see the Climate.gov post “ What’s the difference between global warming and climate change? ”
To learn more about climate change in the United States, visit the latest National Climate Assessment . Browse the U.S. Climate Resilience Toolkit to learn how to understand and address climate issues that impact people and their communities.

American Geosciences Institute
- Policy & Critical Issues
- Advisory Committees
- Coalitions & Working Groups
Explore the Geosciences
- Mineral Resources
- Frequently Asked Questions
- Geoscience In Your State
- Policy News & Monthly Review
- Policy Annual Review
- Federal Geoscience Funding
Policy Positions
- Codes of Ethics
- Critical Needs
- Letters and Statements
- Policy Recommendations
- Position Statements
- Case Studies
- Geoscience in Your State
- GOLI Online Courses
- Maps & Visualizations
- Petroleum and the Environment
- Policy Publications
- Research Database
- Congressional Briefings
- Congressional Visits Days
Get Involved
- Communicating with Congress
- Fellowships
- Internships
External Resources
- U.S. Congress
- Federal Agencies
- State & Local Agencies
What is the difference between weather and climate?
A simple answer to this question is “climate is what you expect, weather is what you get.” [1]
Both weather and climate refer to local conditions (temperature, rainfall, wind strength, etc.) in a particular location or region, but the main difference between them is a matter of time. “Weather” refers to local conditions on the scale of minutes, hours, days, and even months to years: you can have a particularly wet month, warm winter, or rainy decade. [2,3] “Climate” is an average of weather conditions over 30 years or more, and can be assessed for a single location, large area, or globally. [2,3] While weather can change dramatically in a single location from day to day (for example, cold and rainy one day, followed by hot, dry conditions the next day), climate generally changes less quickly because it represents the average of weather conditions over a longer period of time. [1,2,3]
In the United States, weather has been measured directly by people for over 140 years [1] , meaning that sufficiently long records exist to also track modern climate in detail over the same time period. To track both weather and modern climate, geoscientists measure temperature over land and in the ocean, air pressure, humidity, rainfall and snowfall, wind speed, sunshine, and many other factors. [4] Additional helpful information to track climate can include the frequency of record-breaking temperatures or rainfall events, the length of growing seasons, size of Arctic and Antarctic sea ice, trends in monthly weather averages over several decades, and many other aspects of the Earth system. Geoscientists also estimate past climate during times before direct weather measurements by analyzing data from tree rings, coral reefs, ice cores, and many other parts of the geologic record. [4,5,6]
The reason that climate is usually measured by averaging weather conditions over 30 years or more is because many things can influence weather conditions on shorter timescales. [7,8] There are regular patterns in atmospheric and ocean conditions at annual to decadal scales that can lead to particularly hot, cold, wet, or dry years – or even wet or dry decades – all over the globe but which do not necessarily mean that the overall climate is changing. [9] For example, when El Niño conditions are established in the tropical Pacific Ocean, the southern United States tends to be wetter , whereas the southern United States is dryer under La Nina conditions. In order to understand potential changes in climate, geoscientists need to measure and account for weather patterns like these over periods of several decades.
1 What’s the difference between climate and weather? National Oceanographic and Atmospheric Administration 2 What’s the difference between weather and climate? National Aeronautics and Space Administration 3 Climate vs. Weather National Snow & Ice Data Center 4 How do we observe today's climate? National Oceanographic and Atmospheric Administration 5 Past Climate Primer National Oceanographic and Atmospheric Administration 6 Paleoclimatology Data National Centers for Environmental Information 7 Understanding Climate National Academy of Sciences 8 Teleconnection Introduction National Weather Service 9 Teleconnections National Centers for Environmental Information
Learn more:
- Climate vs. Weather (Video) National Academy of Sciences Short video explaining the difference between climate (trend) and weather (variation)
- How do weather observations become climate data? (Webpage) National Oceanic and Atmospheric Administration Webpage explaining how weather data are collected and processed to become climate data products
- U.S. Statistical Weather and Climate Information (Website) National Centers for Environmental Information Website providing a large amount of downloadable historical weather and climate information, which may also be plotted by users on graphs and maps
- National Climate Assessment (Website) U.S. Global Change Research Program Website of the latest National Climate Assessment report, which summarizes the recent and future status of climate in the United States
- Present Day Climate Change (Factsheet), American Geosciences Institute Factsheet summarizing how Earth's climate is monitored, influences on the climate, and evidence for present-day climate change.
Related Frequently Asked Questions
- Board of Directors
- AGI Connections Newsletter
- Nominations
- News and Announcements
- Membership Benefits
- Strategic Plan
- Annual Report
- Member Societies
- Member Society Council
- International Associates
- Trade Associates
- Academic Associates
- Regional Associates
- Liaison Organizations
- Community Documents
- Geoscience Calendar
- Center for Geoscience & Society
- Education & Outreach
- Diversity Activities
- Scholarly Information
- Geoscience Profession
- Earth Science Week
- Publication Store
- Glossary of Geology
- Earth Science Week Toolkit
- I'm a Geoscientist
- Free Geoscience Resources
- AGI Connections
- Be a Visiting Geoscientist
- Use Our Workspace

News | June 24, 2010
Just 5 questions: weather vs. climate.
Weather and climate are easily confused but they're not the same ... they operate on different timescales.
Interview by Erik Conway, NASA Jet Propulsion Laboratory
We all know smokers who live into their eighties, and health nuts who drop dead in their forties. Most people understand and accept anomalies in fields like health care and economics, and we need to do the same with climate issues. - Dr. Eric Fetzer
Dr. Eric Fetzer is a scientist at NASA’s Jet Propulsion Laboratory. He works on NASA’s AIRS mission, recently named the “best new tool for climate science.” Since its launch in 2002, AIRS has made pioneering new greenhouse gas measurements and improved weather forecasts and hurricane predictions.
1. What’s the difference between climate and weather?
There’s no clear difference, but the generally accepted distinction is made on monthly timescales. Weather describes how the atmosphere behaves over weeks or less. Climate is how it behaves over time periods of about a month or longer. So climate refers to seasonal and longer periods, out to centuries and millennia.
2. This past winter was an especially cold and snowy one for parts of the US, Europe and elsewhere. Surely such cold weather flies in the face of global warming?
The important thing to remember is that global warming is a fairly small effect on top of large temperature variability across the world. Let’s say we expect a 1°F (0.6°C) warming. The temperature on the East Coast of the United States varies by up to 20°F (11°C) over a year. So typical weather events can easily overwhelm the slow, small signature of global warming.
Also, global warming is expected to cause more extreme weather events, and that includes cold ones. A simple example is in South Florida. The mangrove line there has retreated southward by about 100 miles (160 kilometers) since the mid-1970s. Mangrove trees don’t tolerate frost, and the number of very cold events in Florida has been increasing. Last winter Florida experienced one of the worst cold snaps on record. Yet we know, from the data, that the Earth has warmed on average since the mid-1970s.
We all know smokers who live into their eighties, and health nuts who drop dead in their forties, but these examples are not taken seriously in discussion of health issues. Most people understand and accept anomalies in fields like health care and economics, and we need to do the same with climate issues.
3. In your view, what’s the most compelling piece of evidence for global warming?
The strongest evidence, I believe, is in the ocean. We know that the sea level has risen. Part of that sea level rise is from melting ice caps and part of it is from thermal expansion [when seawater heats up, it expands and takes up more space]. The ocean is a giant heat ”sink”, or absorber, and what we’re seeing is a slow increase in the heat content of the ocean. It’s literally a measure of the amount of heat the climate system holds. These changes in ocean heat content are unprecedented in the past ten thousand years. At the same time, climate warming from greenhouse gases is at its highest levels in [at least] 800,000 years.
4. How is climate change affecting the weather, and why?
The largest weather changes are being seen in precipitation patterns, especially at very high latitudes. Alaska has been experiencing winter rainfall where it has never been recorded before. Similarly, the lowest temperatures at high latitudes are increasing. Such weather changes are expected from basic atmospheric physics, and provide one of many lines of evidence showing that increased carbon dioxide and other greenhouse gases in the atmosphere are warming our climate.
5. Will it be hotter or colder in the future? More wet or more dry?
On average, it’ll be warmer. For those of us living in Los Angeles, our climate will become like that of northern Baja California in Mexico. The wet/dry question is more difficult. The expectation is that Los Angeles will become more like Ensenada in Baja California, which is drier. Overall, dry parts of the tropics and subtropics are expected to become drier. But other places will become wetter, notably at higher latitudes. For example, areas such as Buffalo in New York will see an increase in “lake-effect snow” — a winter scenario where cold air moves over a lake of warmer water, causing clouds to build over the lake that then turn into intense local snowstorms as they move downwind. More lake-effect snow will mean Buffalo becomes ‘wetter’ even though much of what falls won’t melt until spring.
If you want to invest in global warming, buy wheat futures in southern Canada or southern Russia. That’s where it will become warmer and wetter. It will be better wheat country than it is today.
- What's the Difference Between Weather and Climate?
- NASA Helps Take "Whether" Out Of Weather Prediction

1. Introduction
A) the scientific process.
Climate scientists, like other scientists, use a cyclical process to advance their understanding. Usually it starts with a question, a lack of understanding. They form hypotheses based on previous knowledge or experience. Formulating a good hypothesis is usually not trivial. A useful hypothesis must be testable. That is, there must be the possibility to obtain evidence that confirms or falsifies the hypothesis. In climate science the evidence is most often quantitative data based on measurements (observations) or model simulations. The data is then analyzed to test the hypotheses. Once a hypothesis is falsified a different hypothesis may be formulated and tested. A hypothesis that has been confirmed by many different studies becomes a well-established theory.
Practically, after a considerable amount of time gathering and analyzing data the results of a study are written up into a manuscript, which is submitted to a scientific journal. The journal editor sends the manuscript to other researchers who are experts in the topic, who will read the manuscript and provide the editor with a critical assessment. Typically, the editor wants to know if the evidence provided in the manuscript supports the conclusions drawn by the authors. In most cases the manuscript will be changed by the authors considering the reviewers comments. Once a revised manuscript has been send back to the journal, the editor may send it back to the reviewers to make sure their comments were adequately addressed. This process can repeat itself several times. Once all the reviewers and the editor are happy with the manuscript it will be accepted for publication and ultimately published. This peer-review process can take a long time, several months to a year or more, but it improves the quality of the published articles.
b) Weather and Climate
Weather and climate are related but they differ in the time scales of changes and their predictability. They can be defined as follows.
Weather is the instantaneous state of the atmosphere around us. It consists of short-term variations over minutes to days of variables such as temperature, precipitation, humidity, air pressure, cloudiness, radiation, wind, and visibility. Due to the non-linear, chaotic nature of its governing equations, weather predictability is limited to days.
Climate is the statistics of weather over a longer period. It can be thought of as the average weather that varies slowly over periods of months, or longer. It does, however, also include other statistics such as probabilities or frequencies of extreme events . Climate is potentially predictable if the forcing is known because Earth’s average temperature is controlled by energy conservation. For climate, not only the state of the atmosphere is important but also that of the ocean, ice, land surface, and biosphere.
In short: ‘Climate is what you expect. Weather is what you get.’
c) The Climate System
Earth’s climate system consists of interacting components (Fig. 1). The atmosphere , which is the air and clouds above the surface, is about 10 km thick (more than two thirds of its mass is contained below that height). The ocean covers more than two thirds of Earth’s surface and has an average depth of roughly 4 km. Contrast those numbers with Earth’s radius which is approximately 6,400 km and you’ll find that Earth’s atmosphere and ocean are very thin layers compared to the size of the planet itself. In fact, they are about 1,000 times thinner. They are comparable perhaps to the outer layer of an onion or the water on a wet soccer ball. Yet all life is constrained to these thin layers. The major ocean basins are the Pacific, the Atlantic, the Indian, and the Southern Ocean. Ice and snow comprises the cryosphere , which includes sea ice, mountain glaciers and ice sheets on land. Sea ice is frozen sea water, up to several meters thick, floating on the ocean. Ice sheets on land, made out of compressed snow, can be several kilometers thick. The biosphere includes all living things on land and in the sea from the smallest microbes to trees and whales. The lithosphere , which is the solid Earth (upper crust and mantle), could also be considered an active part of Earth’s climate sytem because it responds to ice load [1] and impacts atmospheric carbon dioxide (CO 2 ) concentrations and climate on long timescales through the movements of the continents.
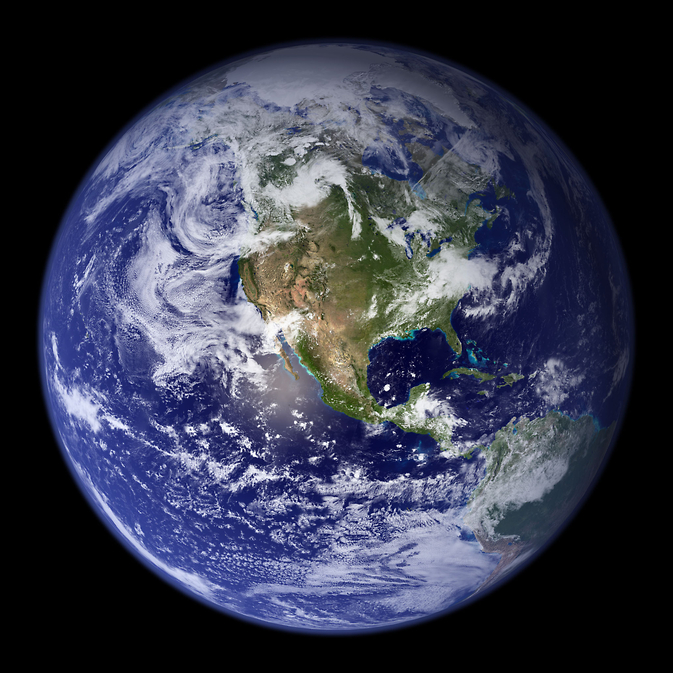
The components interact with each other by exchanging energy, water, momentum, and carbon thus creating a deliciously complex coupled system. Imagine water evaporating from the tropical ocean heated by the sun (Fig. 1). The air containing that water rises and cools. The water condenses into a cloud. The cloud is carried by winds over land where it rains. The rain sustains a forest. Trees are dark, having a low albedo . This influences the amount of sunlight absorbed by the Earth. Dark surfaces absorb more sunlight and get warmer compared to bright surfaces such as desert sand or snow. Air warmed by the surface rises and affects the wind.
d) Processes
Fig. 2 illustrates some of the important processes that contribute to the complex interactions within the climate system. Earth’s energy source is the sun. Both solar and terrestrial radiation are affected by gases, aerosols , and clouds in the atmosphere. Thus, the atmospheric composition affects the heating and cooling of the earth. Heating and cooling affect the temperature and circulation of the atmosphere and oceans. Circulations of the air and sea affect temperatures and precipitation over both ocean and land, which impact the biosphere and cryosphere. Atmosphere and oceans exchange heat, water (evaporation and precipitation), and momentum. Wind blowing over the ocean pushes the surface water ahead. Air temperatures and snow fall affect the growth and melting of glaciers and ice sheets. Water from melting ice flows through rivers into the ocean affecting its salinity, its density and movement. Variations in solar irradiance can cause global climate to change. Volcanoes can eject large amounts of aerosol into the atmosphere with climatic implications. Humans are influencing the climate system through emissions of greenhouse gases , aerosols , and land use changes .

The complexity makes studying the climate system challenging. Scientists from many disciplines contribute such as physicists, chemists, biologists, geologists, oceanographers, atmospheric scientists, paleoclimatologists, mathematicians, statisticians, and computer scientists. To me, the challenges and interdisciplinary nature of climate science are fascinating and fun. I learn something new about it every day.
Recorded Lectures
Weather and Climate
Le Treut, H., R. Somerville, U. Cubasch, Y. Ding, C. Mauritzen, A. Mokssit, T. Peterson and M. Prather, 2007: Historical Overview of Climate Change. In: Climate Change 2007: The Physical Science Basis. Contribution of Working Group I to the Fourth Assessment Report of the Intergovernmental Panel on Climate Change [Solomon, S., D. Qin, M. Manning, Z. Chen, M. Marquis, K.B. Averyt, M. Tignor and H.L. Miller (eds.)]. Cambridge University Press, Cambridge, United Kingdom and New York, NY, USA.
- What are the two main differences between weather and climate?
- How big is Earth? How thick is the atmosphere, how deep the ocean?
- What are the components of Earth’s climate system?
- List processes that cause interactions between the components: atmosphere-ocean, atmosphere-biosphere, atmosphere-cryosphere, ocean-biosphere, ocean-cryosphere.
- Name three processes ( forcings ) that can cause global climate to change.
Go to one of the following websites and explore temporal variations of surface temperature observations in a location of your interest. Plot today’s data, yesterday’s, last week’s, last month’s, last year’s, the last decade’s, as far back as you can and make some notes on what you observe. Note regular, predictable cycles such as the diurnal and annual cycle in contrast with irregular, unpredictable variations such as day-to-day and year-to-year fluctuations. What causes the regular cycles? Try to order the variations with respect to their amplitude (strength). Discuss with fellow students and instructor.
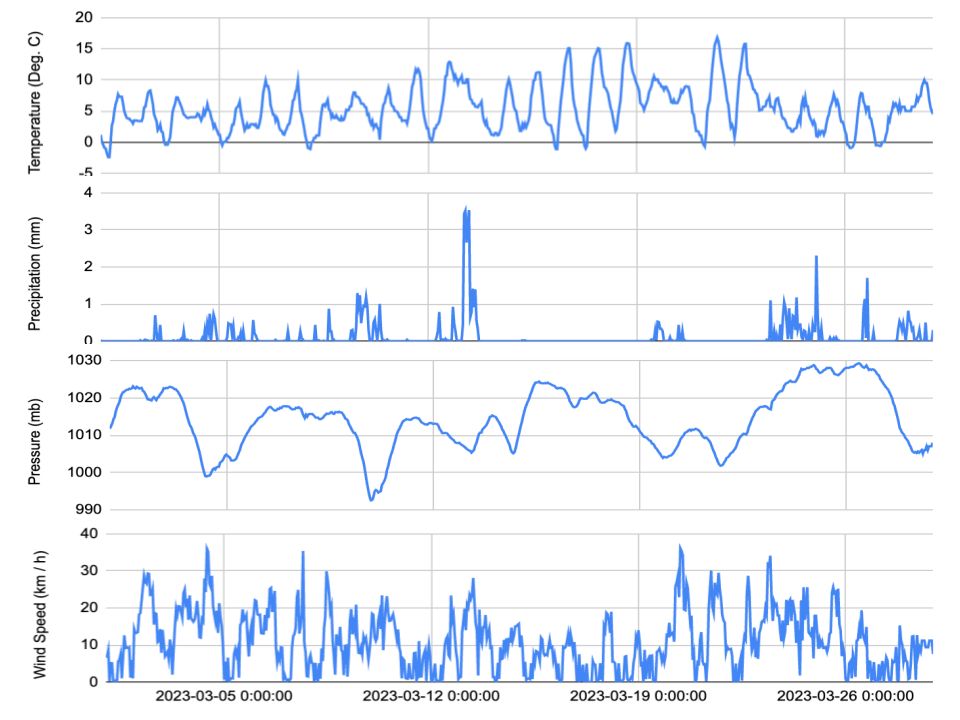
Hourly and daily data are available at visualcrossing.com . Enter a location of your interest and select “history” to get recent data. At the next step you can select different time periods. Unfortunately, hourly data are not shown for periods longer than 3 days, but you can sign up and download the data and plot them yourself. This is what I did below in Figure 3. I plotted them using Google Sheets . Are you able to identify diurnal (daily) cycles in temperature? Although some nights can be warmer than some days and sometimes days and nights have similar temperatures, on average days are warmer than nights. Thus the average diurnal cycle is part of climate. It is forced by the diurnal cycle of solar irradiance. Does pressure have a diurnal cycle? Answer: no . What is the typical timescale of pressure variations? Often it is about a week or so. This timescale is associated with the transition of weather systems (high and low pressure systems) passing by.
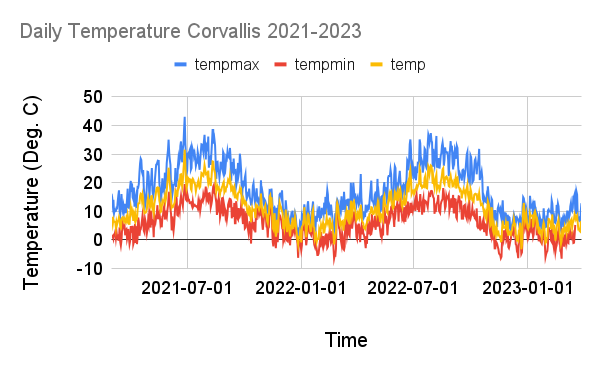
Daily temperature data are usually reported as a daily maximum, a daily minimum and an average. An example for Corvallis is shown in Fig. 4. It shows a clear seasonal cycle with temperatures in winter colder than in summer (duh).
Averaging many years of these weather data yields a climatology. For Corvallis it shows average temperatures around 40°F (4°C) in winter and 65°F (18°C) in summer (Fig. 5). It also shows a larger diurnal cycle in summer than in winter. What could be the reason for th at? Answer: less cloud cover in summer. Clouds lead to cooler days and warmer nights, thus decreasing the diurnal cycle. Curves are smooth in the climatology. In contrast to Fig. 4 the weather variations have been averaged out.
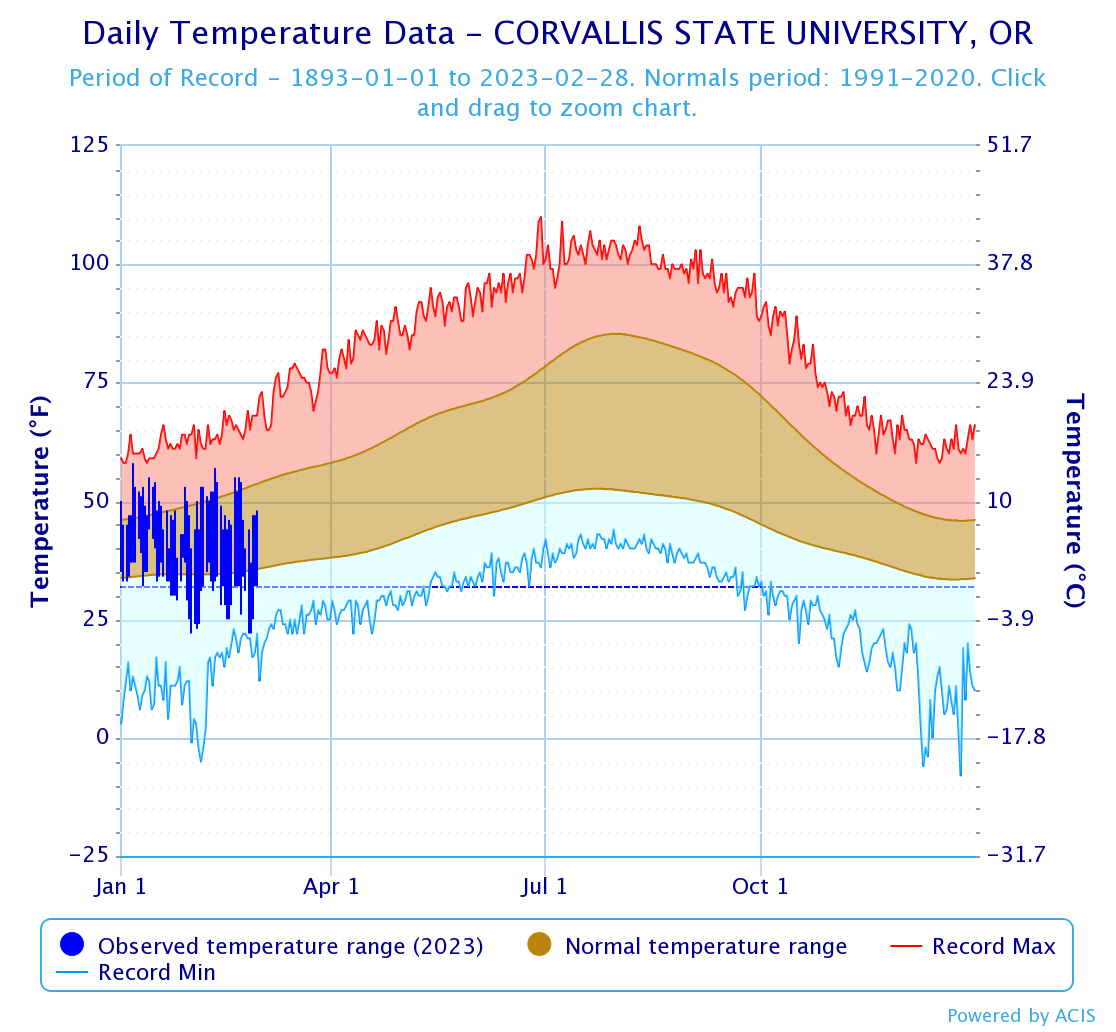
Now try a forecast of temperature for next August and next January. What is your gues s? Answer: a good guess would be the climatology, i.e. 65°F for August and 40°F for January. Thus the average seasonal cycle is climate and it is predictable because it is forced by the seasonal cycle of solar radiation. However, deviations from the climatology for a certain day next year are unpredictable weather.
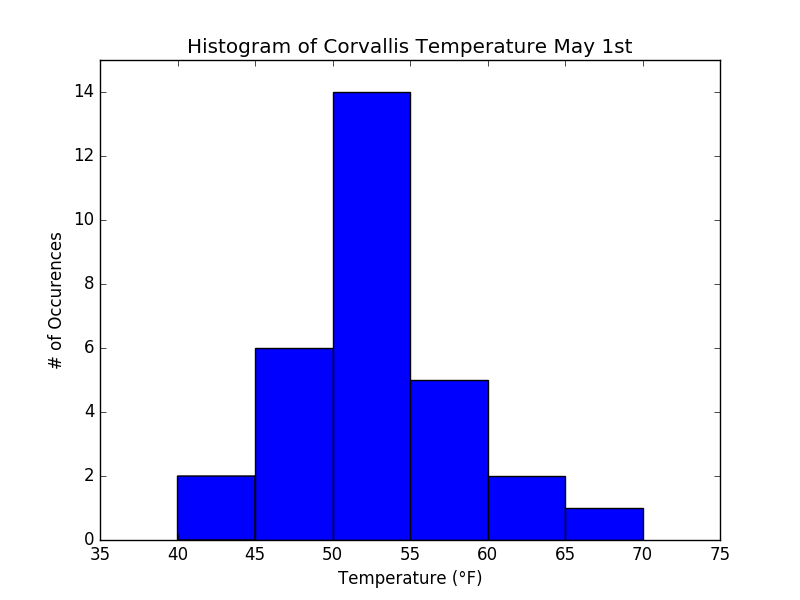
Statistical properties of climate can be summarized in a frequency histogram. Let’s explore those with an example. I have downloaded daily average temperature data from May 1st from 1985 to 2016. The following list (or vector mathematically speaking) of 30 years (N=30) of temperature data T = ( T 1, T 2, … , T N) = (52, 52, 44, 52, 52, 54, 48, 52, 50, 56, 59, 46, 64, 58, 55, 48, 54, 54, 63, 54, 51, 54, 42, 52, 52, 48, 48, 48, 66, 56). Here N = 1 corresponds to 1985, N = 2 to 1986 and so on. In order to construct the frequency histogram we first need to choose bin sizes. I propose to choose 6 bins: 40-44, 45-49, 50-54, 55-59, 60-64, and 65-70. Now simply count how many years fall into each bin. I get 2, 6, 14, 6, 2, 1. Using python I produced the following graph (Fig. 6).
Climate change can be expressed as a change in the mean, which would correspond simply to a shift of the whole histogram to warmer or colder temperatures. However, it can also change the shape of the histogram. For example by making the distribution wider or narrower. This would increase or decrease the occurrences of extreme events. And, of course, it can both change the mean and the width. Most of the time, including in this text, discussions of climate change consider only changes in the mean. But we should keep in mind that changes to the tails of the distribution may be equally important because it is those tails that can have large impacts (heat waves, cold spells, droughts, floods, etc).
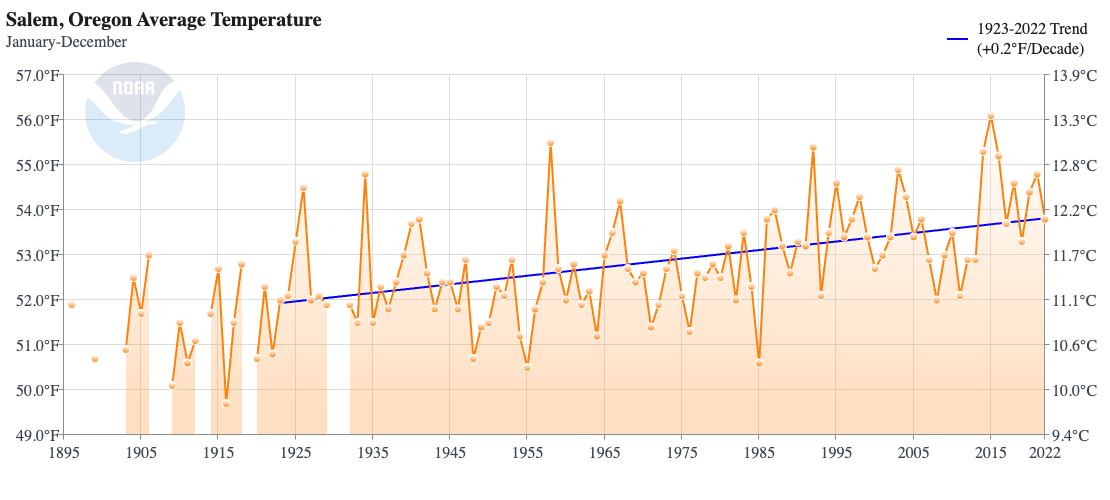
Now let’s explore effects of spatial scales on climate variations. Go to NOAA’s Climate-At-A-Glance website and start with the city tab selection. We want to compare the annual average temperature change in a city of your choice (e.g. Salem in Oregon), averaged over the larger region of a state, for the U.S. as a whole, and the globe. Use the “City Mapping” tab to select a city. For “Timescale” select “Annual”. Check the “Display Trend” box. This will include a trend line on the graph. Compare the trends and year-to-year variations. Are the trends larger for the global ocean or for the global land?
Compare the year-to-year variations and trends in regionally and globally averaged temperatures (Figs. 7-12) to the local diurnal cycle, day-to-day weather fluctuations (Fig. 3), and to the seasonal cycle (Figs. 4-5). Even though the global temperature trends (~0.1°C/decade) are much smaller than diurnal, day-to-day or seasonal fluctuations, which can be 10°C or more, we will see in the remainder of this course that global temperature changes of a few degrees C will have important impacts on natural systems and human societies.
- The weight of the ice depresses the lithosphere, which provides a feedback to the ice by lowering its surface elevation. Traditionally it has been thought that this feedback acts on long (millennial and longer) timescales, but recent research indicates that in certain regions such as West Antarctica, where the lithosphere is thin and the mantle viscosity is low the lithosphere can respond on much shorter (decadal to centennial) timescales. ↵
Rare weather or climate events such as hurricanes, typhoons, floods, droughts, and tornadoes that can often be damaging.
Reflectivity. Snow, ice, clouds and other bright surfaces have a high albedo, which leads to most sunlight being reflected to space. Ocean and vegetation on land have low albedos. They absorb lots of the suns radiation, which leads to warming.
Small particles in the air. Aerosols reflect sunlight back to space and therefore lead to cooling of the surface (negative forcing). Aerosols originate from natural (dust, ash from volcanic eruptions, wave breaking) and anthropogenic (smoke) sources.
Greenhouse gases are molecules that are able to absorb and emit electromagnetic radiation in the infrared part of the spectrum (longwave). Water vapor (H2O), carbon dioxide (CO2), methane (CH4), and nitrous oxide (N2O) are Earth’s most important greenhouse gases.
Humans' effects on the climate system through modifications of the land surface e.g. through deforestation and agriculture.
Radiative forcing (ΔF) is a change in energy fluxes F (in W/m2) at the top-of-the-atmosphere that causes climate change. It is defined as positive (negative) if it leads to warming (cooling). The radiative forcing for a doubling of CO2 is ΔF2xCO2 = 3.7 W/m2. Other examples are increased solar radiation (positive), increased aerosols (negative) or increased surface albedo (negative), e.g. due to land use changes.
Introduction to Climate Science Copyright © 2019 by Andreas Schmittner is licensed under a Creative Commons Attribution-NonCommercial 4.0 International License , except where otherwise noted.
What is the difference between weather and climate?
Weather reflects short-term conditions of the atmosphere while climate is the average daily weather for an extended period of time at a certain location..
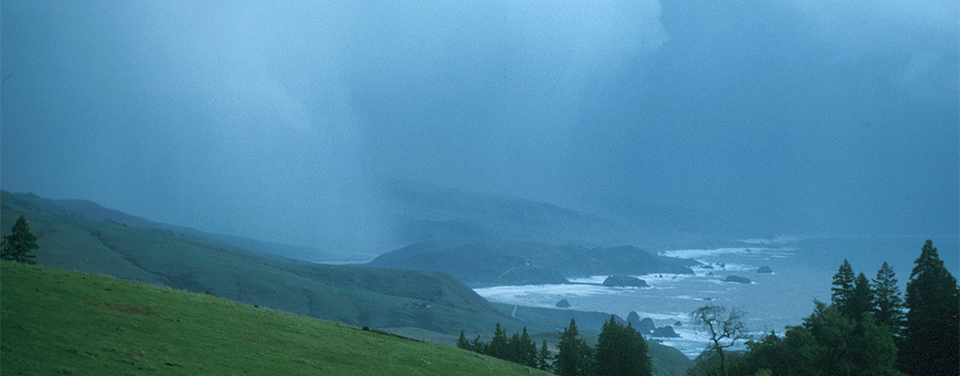
A storm darkens the sky at the mouth of the Russian River, north of Bodega Bay, Calif. Weather can change from minute-to-minute, hour-to-hour, day-to-day, and season-to-season. Climate, is the average of weather over time and space.
We hear about weather and climate all of the time. Most of us check the local weather forecast to plan our days. And climate change is certainly a “hot” topic in the news. There is, however, still a lot of confusion over the difference between the two.
Think about it this way: Climate is what you expect, weather is what you get.
Weather is what you see outside on any particular day. So, for example, it may be 75° degrees and sunny or it could be 20° degrees with heavy snow. That’s the weather.
Climate is the average of that weather. For example, you can expect snow in the Northeast in January or for it to be hot and humid in the Southeast in July. This is climate. The climate record also includes extreme values such as record high temperatures or record amounts of rainfall. If you’ve ever heard your local weather person say “today we hit a record high for this day,” she is talking about climate records.
So when we are talking about climate change, we are talking about changes in long-term averages of daily weather. In most places, weather can change from minute-to-minute, hour-to-hour, day-to-day, and season-to-season. Climate, however, is the average of weather over time and space.
More Information
- National Weather Service
- Climate.gov
- Coastal Climate Adaptation Resources
Last updated: 01/18/24 Author: NOAA How to cite this article
Climate vs. Weather

Weather is the day-to-day state of the atmosphere in a region and its short-term (minutes to weeks) variations, whereas climate is defined as statistical weather information that describes the variation of weather at a given place for a specified interval. They are both used interchangeably sometimes but differ in terms of the length of time they measure and what trends affect them.
Weather is the combination of temperature, humidity, precipitation, cloudiness, visibility, and wind. In popular usage, climate represents the synthesis of weather; more formally, it is the weather of a locality averaged over some period (usually 30 years), plus statistics of weather extremes.
In a 2012 survey, a majority of Americans blamed global warming (or "climate change") for erratic weather patterns in the country, especially heat waves. [1]
Comparison chart
Time factor in climate and weather.
The difference between weather and climate is a measure of time. Weather refers to the atmospheric conditions of a specific place over a short period of time, usually 24 hours. Climate refers to the average atmospheric conditions over relatively long periods of time, usually 30 years. In other words, when one talks about the climate, then they're talking about the pattern over a long term while when weather is referred to then the conditions of short term are being spoken of.
Components of weather and climate
There are several aspects to weather. Weather includes sunshine , rain, cloud cover, winds, hail, snow, sleet, freezing rain, flooding, blizzards , ice storms, thunderstorms , steady rains from a cold front or warm front, excessive heat, heat waves and more. Climate may include precipitation, temperature, humidity, sunshine, wind velocity, phenomena such as fog , frost , and hail storms over a long period of time.
Changes in climate vs. weather
Weather may change from minute-to-minute, hour-to-hour, day-to-day, and season-to-season. Climate, however, is the average of weather over time and space and changes in overall climate tend to be gradual.
Forecast and Measurement
Weather forecasts are made by collecting data that describe the current state of the atmosphere (particularly the temperature, humidity and wind) and using physically-based mathematical models to determine how the atmosphere is expected to change in the future. The chaotic nature of the atmosphere means that perfect forecasts are impossible, and that forecasts become less accurate as the range of the forecast increases. Climate is measured based on the weather statistics. A general period of 30 years is taken to forecast climate of an area as patterns over a period of time have to be observed. The standard classification of the earth's climatic zones is mainly based on the annual cycles of temperature and rainfall. The time frame makes it possible for weather forecasts to usually be easier and more accurate than forecasts about climate change.
Human impact and changes on climate and weather
There is extensive evidence that human activity such as agriculture and industry results in inadvertent weather modification. Acid rain , caused by industrial emission of sulfur dioxide and nitrogen oxides into the atmosphere, adversely affects freshwater lakes, vegetation, and structures. Anthropogenic pollutants reduce air quality and visibility. The effects of inadvertent weather modification over the long term may pose serious threats to many aspects of civilization, including ecosystems , natural resources, food and fiber production, economic development, and human health. Climate change caused by human activities that emit greenhouse gases into the air is expected to affect the frequency of extreme weather events such as drought, extreme temperatures, flooding, high winds, global warming and severe storms. Global Warming is often euphemistically referred to as “Climate Change”.
Study of climate vs. study of weather
Climatology is the study of climate, scientifically defined as weather conditions averaged over a period of time and is a branch of the atmospheric sciences. Meteorology (from Greek: μετέωρον, meteoron, "high in the sky"; and λόγος, logos, "knowledge") is the interdisciplinary scientific study of the atmosphere that focuses on weather processes and forecasting.
- http://www.nasa.gov/mission_pages/noaa-n/climate/climate_weather.html
- http://nsidc.org/arcticmet/basics/weather_vs_climate.html
- http://www.mpimet.mpg.de/en/presse/faq-s/was-ist-der-unterschied-zwischen-wetter-und-klima.html
- http://en.wikipedia.org/wiki/Weather#Weather_modification_and_human_impact
- http://en.wikipedia.org/wiki/Climate#Climate_change
Related Comparisons

Share this comparison via:
If you read this far, you should follow us:
"Climate vs Weather." Diffen.com. Diffen LLC, n.d. Web. 10 Mar 2024. < >
Comments: Climate vs Weather
- Difference between partly sunny and partly cloudy skies
- Celsius vs Fahrenheit
- Heat vs Temperature
- Celsius vs Kelvin
- Mercalli Scale vs Richter Scale
Edit or create new comparisons in your area of expertise.
Stay connected
© All rights reserved.
What Is Climate?
PBS Learning Media

This video provides entertaining animations about the similarities and differences between weather and climate. It is very simple and fast. References are provided at the end of the video.
Notes from our reviewers
The CLEAN collection is hand-picked and rigorously reviewed for scientific accuracy and classroom effectiveness. Read what our review team had to say about this resource below or learn more about how CLEAN reviews teaching materials .
- Teaching Tips Unpacking this short video could easily take a full class period. Comparing the weather and climate in multiple places instead of just two would help better establish these concepts with students. Consider having students research two places in pairs and then discuss findings in small groups or as a class.
- About the Science Students learn that weather is what's happening now, and that climate is based on a longer trend of weather patterns. While short, this video includes many complex topics. The science is accurate, but many concepts may need more explanation. Passed initial science review - expert science review pending.
- About the Pedagogy This one-minute video contains a lot of information. Using the teaching tips, background essay, and supportive materials will help teachers work through this content with students. The video compares Utah to Thailand very quickly (in about 20 seconds). Unpacking this comparison through a deeper discussion of comparative weather and climate may be helpful. The animations represent the learning outcomes well.
- Technical Details/Ease of Use Teachers need to have an account with PBS to access the additional materials associated with the video.

An official website of the United States government
Here's how you know
The .gov means it’s official. Federal government websites often end in .gov or .mil. Before sharing sensitive information, make sure you’re on a federal government site.
The site is secure. The https:// ensures that you are connecting to the official website and that any information you provide is encrypted and transmitted securely.
What’s the Difference Between Weather and Climate?
Climate is what you expect, weather is what you get.
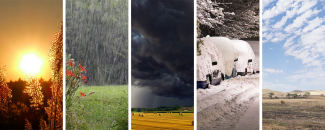
Take a moment and think about the weather today where you are. Is it normal or typical? Is it what you’d expect? If it’s been cool the past few days but the temperature is climbing today, is that weather or climate? Are weather and climate the same thing? Though they are closely related, weather and climate aren’t the same thing. Climate is what you expect. Weather is what actually happens.
What exactly is weather?
More specifically, weather is the mix of events that happen each day in our atmosphere . Even though there’s only one atmosphere on Earth, the weather isn’t the same all around the world. Weather is different in different parts of the world and changes over minutes, hours, days, and weeks.
Most weather happens in the part of Earth’s atmosphere that is closest to the ground—called the troposphere. And, there are many different factors that can change the atmosphere in a certain area like air pressure , temperature, humidity, wind speed and direction, and lots of other things. Together, they determine what the weather is like at a given time and location.
What exactly is climate?
Whereas weather refers to short-term changes in the atmosphere, climate describes what the weather is like over a long period of time in a specific area. Different regions can have different climates. To describe the climate of a place, we might say what the temperatures are like during different seasons , how windy it usually is, or how much rain or snow typically falls.
When scientists talk about climate, they're often looking at averages of precipitation, temperature, humidity, sunshine, wind, and other measures of weather that occur over a long period in a particular place. In some instances, they might look at these averages over 30 years. And, we refer to these three-decade averages of weather observations as Climate Normals .
Looking at Climate Normals can help us describe whether the summers are hot and humid and whether the winters are cold and snowy at a particular place. They can also tell us when we might expect the warmest day of the year or the coldest day of the year at that location. But, while descriptions of an area’s climate provide a sense of what to expect, they don't provide any specific details about what the weather will be on any given day.
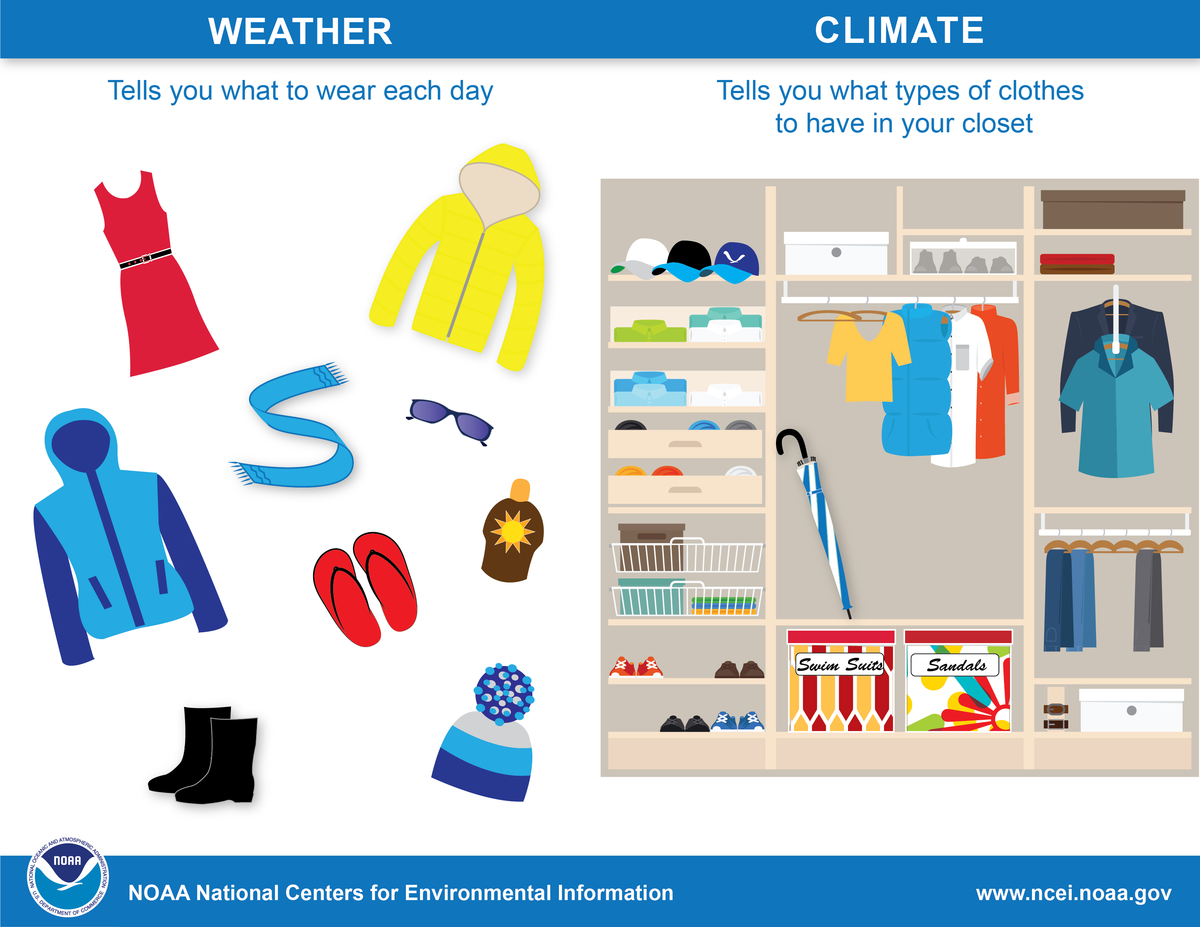
Here’s one way to visualize it. Weather tells you what to wear each day. Climate tells you what types of clothes to have in your closet.
How do weather observations become climate data?
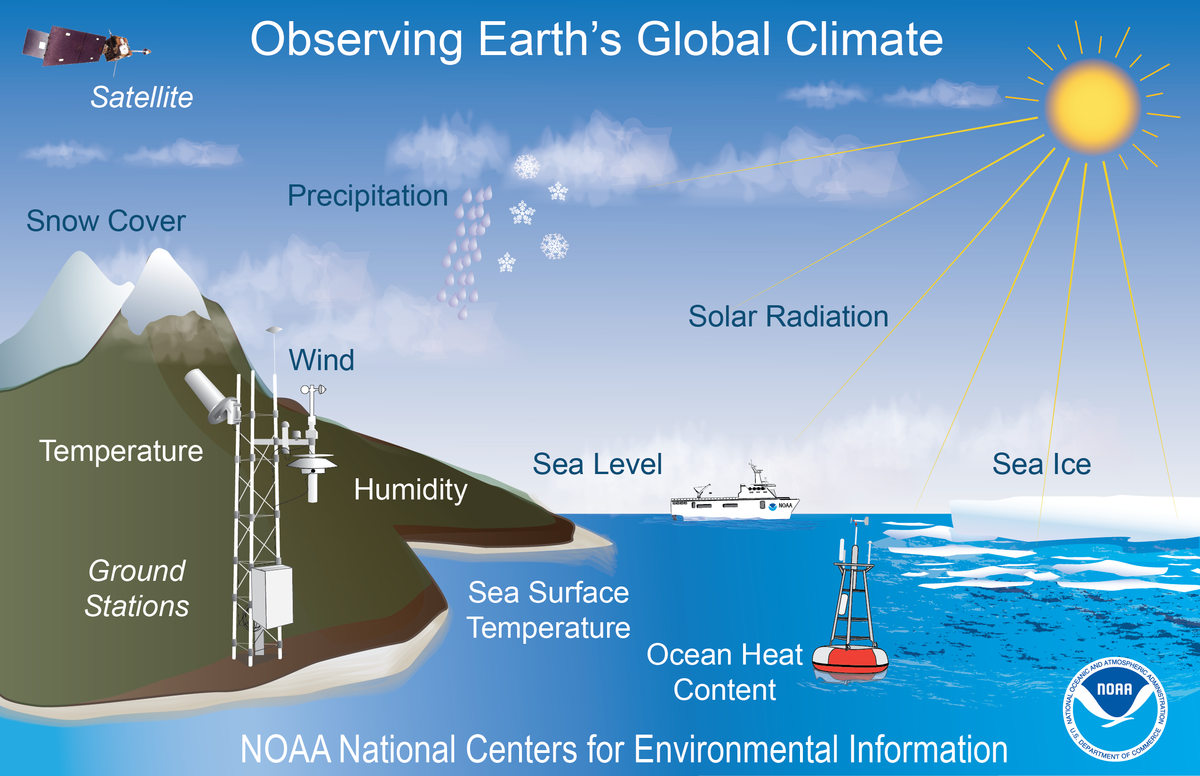
Across the globe, observers and automated stations measure weather conditions at thousands of locations every day of the year. Some observations are made hourly, others just once a day. Over time, these weather observations allow us to quantify long-term average conditions, which provide insight into an area’s climate.
In many locations around the United States , systematic weather records have been kept for over 140 years. With these long-term records, we can detect patterns and trends. And, as the Nation’s official archive for environmental data, it’s our job to collect, quality control, and organize these data and make them available online for scientists, decision makers, and you.
Are regional climates different from the global climate?
Like the United States, different regions of the world have varying climates. But, we can also describe the climate of an entire planet—referred to as the global climate . Global climate is a description of the climate of a planet as a whole, with all the regional differences averaged . Overall, global climate depends on the amount of energy received by the sun and the amount of energy that is trapped in the system. And, these amounts are different for different planets. Scientists who study Earth’s climate look at the factors that affect our planet as a whole.
How does the climate change?
While the weather can change in just a few minutes or hours, climate changes over longer time frames. Climate events, like El Niño , happen over several years, with larger fluctuations happening over decades. And, even larger climate changes happen over hundreds and thousands of years.
Today, climates are changing. Our Earth is warming more quickly than it has in the past according to the research of scientists . Hot summer days may be quite typical of climates in many regions of the world, but warming is causing Earth's average global temperature to increase . The amount of solar radiation, the chemistry of the atmosphere, clouds, and the biosphere all affect Earth's climate.
As global climate changes, weather patterns are changing as well. While it’s impossible to say whether a particular day’s weather was affected by climate change, it is possible to predict how patterns might change. For example, scientists predict more extreme weather events as Earth’s climate warms.
Why do we study climate?
Climate, climate change, and their impacts on weather events affect people all around the world. Rising global temperatures are expected to further raise sea levels and change precipitation patterns and other local climate conditions. Changing regional climates could alter forests, crop yields, and water supplies. They could also affect human health , animals, and many types of ecosystems . Deserts may expand into existing rangelands, and features of some of our National Parks and National Forests may be permanently altered.
Link added to video
Related Links
Article tags, related news.
March 20, 2024
NASA DEVELOP Welcomes Spring 2024 Interns
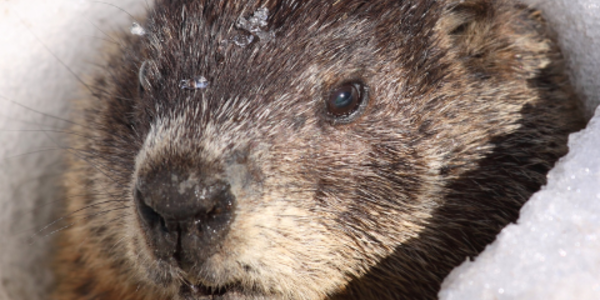
February 2, 2024
Groundhog Day Forecasts and Climate History

January 18, 2024
Participating in the 2024 AMS Annual Meeting
All About Climate
Climate is the long-term pattern of weather in a particular area.
Earth Science, Meteorology, Geography, Physical Geography
Loading ...

Learning materials
Instructional links.
- National Geographic Education: What is the Future of Earth's Climate?
Climate is the long-term pattern of weather in a particular area. Weather can change from hour-to-hour, day-to-day, month-to-month or even year-to-year. A region ’s weather patterns , usually tracked for at least 30 years, are considered its climate . Climate System Different parts of the world have different climates . Some parts of the world are hot and rainy nearly every day. They have a tropical wet climate . Others are cold and snow-covered most of the year. They have a polar climate . Between the icy poles and the steamy tropics are many other climates that contribute to Earth’s biodiversity and geologic heritage . Climate is determined by a region ’s climate system. A climate system has five major components: the atmosphere , the hydrosphere , the cryosphere , the land surface, and the biosphere . The atmosphere is the most variable part of the climate system. The composition and movement of gases surrounding the Earth can change radically, influenced by natural and human-made factors. Changes to the hydrosphere , which include variations in temperature and salinity , occur at much slower rates than changes to the atmosphere . The cryosphere is another generally consistent part of the climate system. Ice sheets and glaciers reflect sunlight, and the thermal conductivity of ice and permafrost profoundly influences temperature . The cryosphere also helps regulate thermohaline circulation . This “ocean conveyor belt” has an enormous influence on marine ecosystems and biodiversity . Topography
Topography and vegetation influence climate by helping determine how the Sun’s energy is used on Earth. The abundance of plants and the type of land cover (such as soil , sand , or asphalt ) impacts evaporation and ambient temperature . The biosphere , the sum total of living things on Earth, profoundly influences climate . Through photosynthesis , plants help regulate the flow of greenhouse gases in the atmosphere . Forests and oceans serve as “ carbon sinks ” that have a cooling impact on climate . Living organisms alter the landscape , through both natural growth and created structures such as burrows , dams , and mounds . These altered landscapes can influence weather patterns such as wind , erosion , and even temperature . Climate Features The most familiar features of a region ’s climate are probably average temperature and precipitation . Changes in day-to-day, day-to-night, and seasonal variations also help determine specific climates . For example, San Francisco, California, and Beijing, China, have similar yearly temperatures and precipitation . However, the daily and seasonal changes make San Francisco and Beijing very different. San Francisco’s winters are not much cooler than its summers, while Beijing is hot in summer and cold in winter. San Francisco’s summers are dry and its winters are wet. Wet and dry seasons are reversed in Beijing—it has rainy summers and dry winters. Climate features also include windiness , humidity , cloud cover , atmospheric pressure , and fogginess . Latitude plays a huge factor in determining climate . Landscape can also help define regional climate . A region ’s elevation , proximity to the ocean or freshwater , and land-use patterns can all impact climate . All climates are the product of many factors, including latitude , elevation , topography , distance from the ocean, and location on a continent . The rainy, tropical climate of West Africa, for example, is influenced by the region ’s location near the Equator ( latitude ) and its position on the western side of the continent . The area receives direct sunlight year-round, and sits at an area called the intertropical convergence zone (ITCZ, pronounced “itch”), where moist trade winds meet. As a result, the region ’s climate is warm and rainy. Microclimates Of course, no climate is uniform . Small variations , called micro climates , exist in every climate region . Micro climates are largely influenced by topographic features such as lakes, vegetation , and cities. In large urban areas , for example, streets and buildings absorb heat from the Sun, raising the average temperature of the city higher than average temperatures of more open areas nearby. This is known as the “ urban heat island effect.” Large bodies of water, such as the Great Lakes in the United States and Canada, can also have micro climates . Cities on the southern side of Lake Ontario, for example, are cloudier and receive much more snow than cities on the northern shore. This “ lake effect ” is a result of cold winds blowing across warmer lake water. Climate Classification In 1948, American climatologist Charles Thornthwaite developed a climate classification system that scientists still use today. Thornthwaite’s system relies on a region ’s water budget and potential evapotranspiration . Potential evapotranspiration describes the amount of water evaporated from a vegetated piece of land. Indices such as humidity and precipitation help determine a region ’s moisture index . The lower its moisture index value, the more arid a region ’s climate . The major classifications in Thornthwaite’s climate classification are microthermal , mesothermal , and megathermal . Microthermal climates are characterized by cold winters and low potential evapotranspiration . Most geographers apply the term exclusively to the northern latitudes of North America, Europe, and Asia. A microthermal climate may include the temperate climate of Boston, Massachusetts; the coniferous forests of southern Scandinavia ; and the boreal ecosystem of northern Siberia . Mesothermal regions have moderate climates . They are not cold enough to sustain a layer of winter snow, but are also not remain warm enough to support flowering plants (and, thus, evapotranspiration ) all year. Mesothermal climates include the Mediterranean Basin , most of coastal Australia, and the Pampas region of South America. Megathermal climates are hot and humid. These regions have a high moisture index and support rich vegetation all year. Megathermal climates include the Amazon Basin ; many islands in Southeast Asia, such as New Guinea and the Philippines; and the Congo Basin in Africa. Köppen Classification System Although many climatologists think the Thornthwaite system is an efficient , rigorous way of classifying climate , it is complex and mapping it is difficult. The system is rarely used outside scientific publishing. The most popular system of classifying climates was proposed in 1900 by Russian-German scientist Wladimir Köppen. Köppen observed that the type of vegetation in a region depended largely on climate . Studying vegetation , temperature , and precipitation data , he and other scientists developed a system for naming climate regions . According to the Köppen climate classification system, there are five climate groups : tropical, dry , mild, continental , and polar . These climate groups are further divided into climate types . The following list shows the climate groups and their types: Tropical
- Wet ( rainforest )
- Wet and dry ( savanna )
- Mediterranean
- Humid subtropical
Continental
- Warm summer
- Cool summer
- Sub arctic (boreal)
Tropical Climates There are three climate types in the tropical group: tropical wet; tropical monsoon; and tropical wet and dry. Tropical Wet: Rainforests Places with a tropical wet climate are also known as rain forests . These equatorial regions have the most predictable weather on Earth, with warm temperatures and regular rainfall. Annual rainfall exceeds 150 centimeters (59 inches), and the temperature varies more during a day than it does over a year. The coolest temperatures , about 20° to 23° Celsius (68°-73° Fahrenheit), occurs just before dawn. Afternoon temperatures usually reach 30° to 33° Celsius (86°-91° Fahrenheit). Rain forests experience very little seasonal change, meaning average monthly temperatures remain fairly constant throughout the year. Tropical wet climates exist in a band extending about 10° of latitude on either side of the Equator . This part of the globe is always under the influence of the intertropical convergence zone. The ITCZ follows a pendulum -like path during the course of a year, moving back and forth across the Equator with the seasons. It moves north during summer in the Northern Hemisphere, and south during the northern winter. Some tropical wet climates are wet throughout the year. Others experience more rainfall during the summer or winter, but they never have especially dry seasons . The U.S. state of Hawaii; Kuala Lumpur, Malaysia; and Belém, Brazil, are examples of areas with tropical wet climates . Tropical Monsoon Tropical monsoon climates are most found in southern Asia and West Africa. A monsoon is a wind system that reverses its direction every six months. Monsoons usually flow from sea to land in the summer, and from land to sea in the winter. Summer monsoons bring large amounts of rainfall to tropical monsoon regions . People living in these regions depend on the seasonal rains to bring water to their crops . India and Bangladesh are famous for their monsoon climate patterns. Tropical Wet and Dry: Savanna Tropical wet and dry climates are sometimes called “ savanna ” climates after the grassland ecosystem defined by wet and dry periods. Tropical wet and dry climates sit just outside the ITCZ, near the Equator . They have three seasons. One season is cool and dry —when the warm, moist ITCZ is in the opposite hemisphere. Another season is hot and dry as the ITCZ approaches. The last season is hot and wet as the ITCZ arrives and the region experiences months as a tropical wet climate . Life in these tropical wet and dry regions depends on the wet season’s rains. During years when rains are light, people and animals suffer through drought . During especially rainy years, regions may experience flooding . Havana, Cuba; Kolkata, India; and Africa’s vast Serengeti Plain are in the wet and dry tropics . Dry Climates Regions lying within the dry climate group occur where precipitation is low. There are two dry climate types : arid and semi arid . Most arid climates receive 10 to 30 centimeters (four to 12 inches) of rain each year, and semiarid climates receive enough to support extensive grasslands . Temperatures in both arid and semi arid climates show large daily and seasonal variations . The hottest spots in the world are in arid climates . The temperature in the arid Death Valley National Park, California, U.S., reached 56.7° Celsius (134° Fahrenheit) on July 10, 1913—the highest temperature ever recorded. Although rainfall is limited in all dry climates , there are a few parts of the world where it never rains. One of the driest places on Earth is the Atacama Desert of Chile, on the west coast of South America. Stretches of the Atacama may have never received rain in recorded history. Semi arid regions , such as the Australian outback , usually receive between 25 and 50 centimeters (10-20 inches) of rainfall every year. They are often located between arid and tropical climate regions . Arid and semi arid climates can occur where the movement of warm, moist air is blocked by mountains. Denver, Colorado, just east of the U.S. section of the Rocky Mountains, has this type of dry climate , known as a “ rain shadow .” Mild Climates Regions with mild and continental climates are also called temperate regions . Both climate types have distinct cold seasons. In these parts of the world, climate is influenced mostly by latitude and a region ’s position on the continent . Mediterranean Mediterranean climates have warm summers and short, mild, rainy winters. Mediterranean climates are found on the west coasts of continents between 30° and 40° latitude , and along the shores of the Mediterranean Sea. Mediterranean summers feature clear skies, cool nights, and little rain. Humid Subtropical Humid subtropical climates are usually found on the eastern sides of continents . In cities such as Savannah , Georgia, in the U.S.; Shanghai, China; and Sydney, Australia, summers are hot and humid. Winter can be severely cold. Precipitation is spread evenly through the year and totals 76 to 165 centimeters (30-65 inches). Hurricanes and other violent storms are common in these regions . Marine West Coast Weather on both sides of a continent generally becomes cooler as latitude increases. The marine west coast climate , a type of mild climate typical of cities such as Seattle, Washington, in the U.S. and Wellington, New Zealand, has a longer, cooler winter than the Mediterranean climate . Drizzle falls about two-thirds of winter days, and temperatures average about 5° Celsius (41° Fahrenheit). Continental Climates Areas with continental climates have colder winters, longer-lasting snow, and shorter growing seasons . They are the transition zones between mild and polar climates . Continental climates experience extreme seasonal changes. The range of weather in continental climate regions makes them among the most spectacular sites for weather phenomena . In autumn, for instance, vast forests put on their annual show of brilliant color before shedding their leaves as winter approaches. Thunderstorms and tornadoes , among the most powerful forces in nature, form mostly in continental climates . There are three types of continental climate —warm summer, cool summer, and sub arctic . All these climates exist only in the Northern Hemisphere. Usually, continental climates are found in the interior of continents . Warm Summer Warm summer climate regions often have wet summer seasons, similar to monsoon climates . For this reason, this climate type is also called humid continental . Most of Eastern Europe, including Romania and Georgia, has warm summer climates . Cool Summer Cool summer climates have winters with low temperatures and snow. Cold winds , sweeping in from the Arctic , dominate winter weather . People living in these climates have grown accustomed to the harsh weather , but those unprepared for such cold may suffer. Many of French Emperor Na poleon Bonaparte’s soldiers, for example, were used to the mild Mediterranean climates of France. Thou sands died in bitter cold as they retreated from Russia’s cool summer climate in the winter of 1812. Subarctic North of regions with cool summer climates are regions with subarctic climates . These regions , including northern Scandinavia and Siberia , experience very long, cold winters with little precipitation . Sub arctic climates are also called boreal climates or taiga . Polar Climates The two polar climate types, tundra and ice cap, lie within the Arctic and Antarctic Circles near the North and South Poles. Tundra In tundra climates , summers are short, but plants and animals are plentiful. Temperatures can average as high as 10° Celsius (50° Fahrenheit) in July. Wildflowers dot the landscape , and flocks of migratory birds feed on insects and fish. Whales feed on microscopic creatures in the region ’s cold, nutrient -rich waters. People have adapted to life on the tundra for thou sands of years. Ice Cap Few organisms survive in the ice cap climates of the Arctic and Ant arctic . Temperatures rarely rise above freezing, even in summer. The ever-present ice helps keep the weather cold by reflecting most of the Sun’s energy back into the atmosphere . Skies are mostly clear and precipitation is low. In fact, Ant arctica , covered by an ice cap 1.6-kilometers (one-mile) thick, is one of the largest, driest deserts on Earth. High Elevation Climates Many geographers and climatologists have modified the Köppen classification system over the years, including geographer Glen Trewartha, who added a category for high-elevation climates . There are two high elevation climate types : upland and highland. Both highland and upland climates are marked by very different temperatures and levels of precipitation . Climbing a lofty mountain or reaching a plateau can be like moving toward the poles . On some mountains, such as Mount Kilimanjaro, Tanzania, the climate is tropical at the base and polar at the summit. Often, high- elevation climate differs from one side of the mountain to the other. Influence of Climate The enormous variety of life on Earth is largely due to the variety of climates that exist and the climate changes that have occurred in the past. Climate has influenced the development of cultures and civilizations . People everywhere have adapted in various ways to the climates in which they live. Clothing Clothing, for example, is influenced by climate . Indigenous Arctic cultures of Europe, Asia, and North America, for example, developed warm, durable , fur and animal-skin clothing. This clothing was necessary for survival in the icy climate near the North Pole . Many parkas worn by Arctic peoples are not only insulated , but waterproof. This combats both the frigid temperatures and precipitation found in polar climates . Lightweight, papery tapa cloth , on the other hand, is part of many cultures in the warm, humid climates of Polynesia , in the South Pacific. Tapa cloth was traditionally made from dried leaves, coconut fibers, and breadfruit bark. Tapa cloth is delicate and loses strength when wet, which would be deadly near the poles but only inconvenient near the Equator . Shelter Climate also influences how civilizations construct housing. For instance, the ancient Anasazi people of southern North America built apartments into tall cliffs . The sheltered, shady area kept residents cool in the hot, dry desert climate . The yurt is a part of the identity of many cultures across the windy , semi arid steppe of Central Asia. Yurts are a type of original “mobile home,” a portable , circular dwelling made of a lattice of flexible poles and covered in felt or other fabric. Yurts protect residents from fierce winds , and their portability makes them an ideal structure for nomadic and seminomadic herding cultures on the grassland . Agriculture The development of agri culture was very dependent on climate . Ancient agricultural civilizations , such as those in Mesopotamia and India, flourished where the climate was mild. Communities could grow crops every season, and experiment with different types of crops , livestock , and farming techniques . The mild, Mediterranean climate in which the Roman Empire developed, for instance, allowed farmers to cultivate crops , such as wheat, olives, grapes, barley, and figs. Livestock included cattle, sheep, goats, pigs, and even honeybees. Like the ancient Romans, ancient cultures of the Amazon Basin in South America were also able to develop agricultural practices. The chief domesticated trees in the Amazon were mostly harvested for food and medicine : Brazil nuts, Inga ynga fruit (commonly known as “ice-cream beans”), Amazon tree grapes, abiu (another tropical fruit), and cacao fruits (whose seeds are known as cocoa beans). Today, farmers are still in tune with the climate . They plant certain crops according to the expected amount of rainfall and the length of the growing season . When the weather does not follow the typical climate pattern, it can mean hard times for farmers and higher food costs for consumers. Climate Change Climate does not change from day to day like weather , but it does change over time. The study of historic climate change is called paleoclimatology . Climate changes happen slowly over hundreds or even thou sands of years. For example, periodic glacial periods have covered large portions of Earth with ice caps. Some paleoclimatology evidence shows that the Sahara Desert was once covered by plants and lakes during a warm “wet age.” Climate change can happen for many reasons. The movement of tectonic plates , volcanic activity, and the tilt of Earth’s axis all have effects on climate . For example, after the eruption of the island volcano of Krakatoa, Indonesia, in 1883, winters and even summers in Asia and Europe were colder and darker. Volcanic ash blocked the sun. Farmers had to adjust to shorter, weaker growing seasons . Climates around the world were changed for years. The so-called “ Little Ice Age ” was a period of climate change extending from the 12th through the 19th centuries. The Little Ice Age was not a true glacial period , but describes colder climates around the world. In Europe, canals in Great Britain and the Netherlands were often frozen solid, allowing for ice skating. In North America, European colonists reported especially harsh winters. Global Warming Since the Industrial Revolution of the 19th century, human activity has begun to impact climate . The current period of climate change is sometimes called “ global warming .” Global warming is often associated with a runaway “ greenhouse effect .” The greenhouse effect describes the process of certain gases (including carbon dioxide (CO2), methane, nitrous oxide (N2O), fluorinated gases , and ozone) trapping solar radiation in a planet's lower atmosphere . Greenhouse gases let the sun’s light shine onto Earth’s surface, but they trap the heat that reflects back up into the atmosphere . In this way, they act like the glass walls of a greenhouse. The greenhouse effect is a natural phenomenon and keeps Earth warm enough to sustain life. However, human activities that include burning fossil fuels and cutting down forests release greenhouse gases into the atmosphere at an unprecedented rate. The current period of climate change has been documented by rising temperatures , melting glaciers , and more intense weather phenomena . Our planet’s temperature has risen about 1.1° C (2° F) since the late 19th century. Sixteen of the last 17 warmest years on record have occurred in the 21st century. According to NASA, not only was 2016 the warmest year on record, but eight of the 12 months that make up the year were the warmest on record for those respective months. The current period of climate change is also associated with the massive retreat of glaciers , ice sheets , and sea ice. Warmer temperatures have reduced the number of glaciers of Montana’s Glacier National Park from 150 in 1850 to just 26 today. In 2017, one of the largest icebergs ever recorded entered the ocean as a huge chunk of the Larsen C ice shelf broke off the Ant arctic Peninsula. Warmer ocean temperatures and warmer ambient air temperatures likely contributed to the fracturing of the ice shelf and the massive Ant arctic ice sheet associated with it. Finally, both the extent and thickness of Arctic sea ice has declined rapidly during the past several decades. The famed Northwest Passage , the treacherous route connecting the North Atlantic and North Pacific ocean basins , is now habitually free of ice and safe enough for cruise ships to navigate . Melting glaciers and ice sheets , as well as expansion of seawater as it warms, have contributed to unprecedented sea level rise . Sea level rises at about 2.3 millimeters (0.2 inch) every year, contributing to up to 900% more frequent flooding in coastal areas. Increasing temperatures can change the climate impacts and even the classification of a region . For instance, low-lying islands may be flooded as seawater rises. The populations of island nations, such as Maldives or Comoros, have been forced to contemplate becoming “ climate refugees ”—people forced to leave their homes and migrate to a different region . Heat in the atmosphere may increase the interaction of diverse weather systems . Unusually arid climates in a semi arid region may prolong droughts , for instance. In regions with mild climates , the increased atmospheric moisture associated with humid climates may increase the likelihood of hurricanes and typhoons . Climate change is also impacting organisms and species range . Organisms that have adapted to one climate may have to migrate or adapt to warmer temperatures . Manatees, for instance, are marine mammals native to tropical waters. As temperatures increase, manatees have been migrating as far north as New York City, New York. Polar bear populations, on the other hand, are venturing farther south as Arctic sea ice becomes more scarce . Climate change can be mitigated through reducing greenhouse- gas emissions . This can mean investing in new technologies, relying more on renewable energy sources, making older equipment more energy- efficient , or changing consumer behavior.
The Big Chill Antarctica’s frigid climate makes it the only continent on Earth with no permanent human residents. The coldest temperature ever recorded at ground level on Earth—-89.2° Celsius (-128.5°Fahrenheit)—was at Vostok Station, Antarctica.
Climograph A climograph depicts the highs and lows of temperature and precipitation over a set period of time. Climographs can summarize daily, monthly, yearly, or decades-long weather patterns to help climatologists identify a region’s climate.
Did the Language You Speak Evolve Due to Heat? Some research indicates that the concentration of a language’s vowels and consonants may be due in some part to the climate of the language’s region. Vowel-heavy languages, such as Hawaiian, may have been influenced by pockets of warm air that can “punch into a sound wave”, making it harder to distinguish consonants such as “k” and “ch.”
Geographic Perspective British geographer Andrew John Herbertson described climate like this: "Climate is what we expect, weather is what we get."
Articles & Profiles
Media credits.
The audio, illustrations, photos, and videos are credited beneath the media asset, except for promotional images, which generally link to another page that contains the media credit. The Rights Holder for media is the person or group credited.

Production Managers
Program specialists, last updated.
January 4, 2024
User Permissions
For information on user permissions, please read our Terms of Service. If you have questions about how to cite anything on our website in your project or classroom presentation, please contact your teacher. They will best know the preferred format. When you reach out to them, you will need the page title, URL, and the date you accessed the resource.
If a media asset is downloadable, a download button appears in the corner of the media viewer. If no button appears, you cannot download or save the media.
Text on this page is printable and can be used according to our Terms of Service .
Interactives
Any interactives on this page can only be played while you are visiting our website. You cannot download interactives.
Related Resources
- Environmental Science
Weather vs. Climate: What's the Difference?
23 Nov 2022
Format: APA
Academic level: High School
Paper type: Essay (Any Type)
Downloads: 0
- Climate Change Essays
Climate change has affected people in several ways. It has affected people's health, and agriculture leading to food insecurity, and the supply of water and ecosystems have been disrupted. Due to the extreme weather conditions, the air quality people use to breathe has decreased as a result of wildfires. According to the United States Environmental Protection report in 2017, climate change impacts people's health, infrastructure, transport systems, food, energy, and the supply of water (Pecl et al., 2017). Thus, climate change affects people's way of life in all aspects. Whereas weather is the information on the atmospheric condition changes of a certain place, the climate is the statistical weather conditions information that indicates the average conditions of weather over a long period. The weather of a certain place is determined by the temperatures, humidity, rain, and wind, among other factors within a day or a short period (The National Academy of Sciences & Royal Society, 2020). On the other hand, the climate is determined by the weather conditions over a long period in a certain place. The weather is observed daily; thus, it affects people's daily activities while the climate impacts agriculture and people's lifestyle. Climate has been changing from one century to another, and the globe has heavily felt its effects. Some of the important factors that cause climate change are greenhouse gases, nature, and human activities. According to the Royal Society and the US National Academy of Sciences'2020 report, human activities have increased Carbon (IV) Oxide's concentration in the atmosphere by more than 40% since 1970. The carbon (IV) Oxide increase has led to more heat being trapped, leading to global warming. Nature also contributes to climate change. Volcanos, for instance, emit carbon (IV) Oxide to the atmosphere but at a relatively lower rate compared to that emitted by human activities (Kaddo, 2016). Natural fires also contribute to climate change, but human activities are mainly the major cause of climate change. Looking at the already felt effects of climate change, if climate change increases, the planet earth will be uninhabitable. Extreme weather conditions will lead to the complete destruction of the ozone layer; thus, the earth's radiated heat will not be regulated. The ecosystems will be destroyed; thus, it will no longer sustain life.
References
Kaddo, J. (2016). Climate Change: Causes, Effects, and Solutions. A with Honors Projects. 164. https://spark.parkland.edu/ah/164
Delegate your assignment to our experts and they will do the rest.
The National Academy of Sciences & Royal Society (2020). Climate Change Evidence and causes. https://royalsociety.org/topics-policy//projects/climate-change-evidence-causes/&ved=2ahUKEwi9g7X_3vrrAhUSDxQKHcCDCQAQFjABegQIBRAB&usg=AOvVaw3Fmli9qCbSEHVY-D_gtjtB
Pecl, G. T., Araújo, M. B., Bell, J. D., Blanchard, J., Bonebrake, T. C., Chen, I. C., ... & Falconi, L. (2017). Biodiversity redistribution under climate change: Impacts on ecosystems and human well-being. Science , 355 (6332).
- Inuit Qauijimajatuqangit: Form of Oral History
- Reforestation: Scientific Background, Methods, and Results
Select style:
StudyBounty. (2023, September 14). Weather vs. Climate: What's the Difference? . https://studybounty.com/weather-vs-climate-whats-the-difference-essay
Hire an expert to write you a 100% unique paper aligned to your needs.
Related essays
We post free essay examples for college on a regular basis. Stay in the know!
HACCP: A Systematic Approach to Food Safety
Sampling: the selection of a particular sample or group to represent an entire population, gis uses in national wildlife refuge management, factors that least affect the global environment.
Words: 1188
Restoration of the Chesapeake Bay
Hazard analysis techniques for system safety, running out of time .
Entrust your assignment to proficient writers and receive TOP-quality paper before the deadline is over.
What is the difference between weather and climate?
Part of Geography The natural world Year 3 Year 4
Watch: Weather and climate
This video can not be played
To play this video you need to enable JavaScript in your browser.
Video transcript video transcript.
I’m on my summer holidays and although I love Scotland, sometimes it’s nice to go somewhere with a warmer climate.
We work out what the climate in a place is by looking at the average weather for about 30 years, and seeing how warm or cold, rainy and windy it is during that time.
The climate is different depending on where you are in the world.
In Nigeria it’s usually very hot.
In Siberia it’s usually very cold.
In parts of New Zealand it’s very windy.
And in parts of India it’s very wet.
The climate across the world has always changed over hundreds, thousands, even millions of years.
600,000 years ago, parts of Britain used to be so warm, palm trees grew and hippos swam in the River Thames.
And 20,000 years ago, Britain was going through an ice age and woolly mammoths roamed the land.
These changes occurred naturally.
There are all sorts of reasons why the environment causes climate change. This is called a natural climate cycle.
But these days some of the change is because of the way humans have been burning fossil fuels to power our homes, factories and vehicles, which has caused lots of carbon dioxide to enter the atmosphere.
The carbon dioxide traps heat and is warming the planet faster than before.
This is called the greenhouse effect.
So maybe this year I’ll think a little more about the fuel I use and where I travel and stay in Scotland instead!
What is weather?

Hot, sunny weather at a beach.
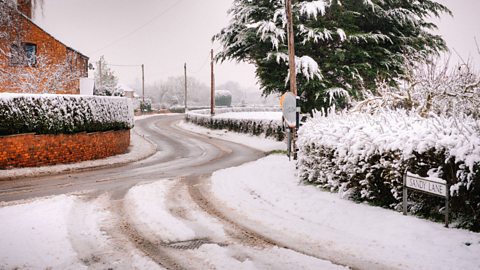
Cold, snowy weather.
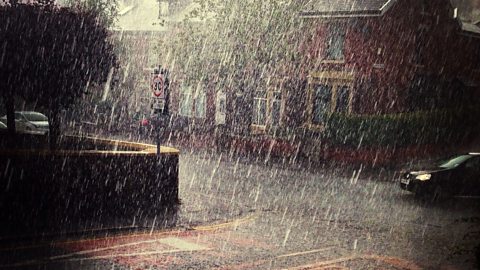
Wet, rainy weather.
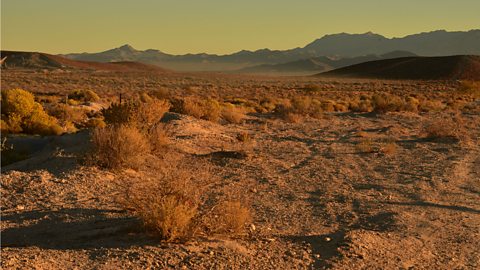
Dry weather with hills in the distance.
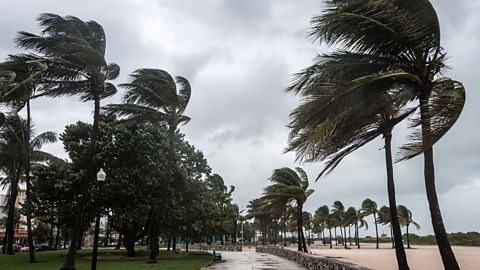
Very windy weather by the coast.

Calm, sunny weather in the countryside.
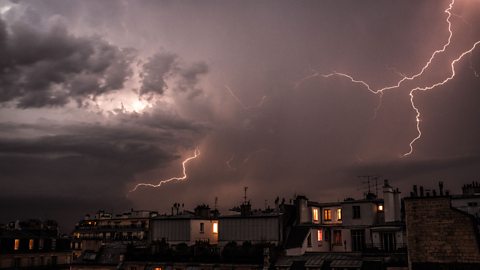
Stormy weather in a city.
Activity: Quiz – Weather and climate
Sign up to our newsletter. External Link Sign up to our newsletter
Find out how Bitesize can support students' learning and more in our free newsletter for teachers.

More on The natural world
Find out more by working through a topic
What are biomes?
- count 10 of 16
What are mountains?
- count 11 of 16
What are volcanoes?
- count 12 of 16
What are earthquakes?
- count 13 of 16
Talk to our experts
1800-120-456-456
Difference Between Weather and Climate
Introduction.
In the present era, one of the major concerns for every individual on this planet is global warming. This drastic change in the earth’s temperature is affecting all living organisms on it. This problem has been increasing over the past few decades. Thus, now is the right time to unfold this matter and take proper measures to correct it.
To understand the changing climate condition better, here is how to distinguish between weather and climate.
Definition of Climate
Climate is the atmospheric condition of a particular location over a long-term period. The average summation of the atmospheric elements of a place is considered as the climate of that particular region.
These atmospheric elements include temperature, solar radiation, precipitation, humidity, wind, and atmospheric pressure. Depending on these elements and their variants, respective centers of a specific zone maintain climate records.
These records, like the amount of rainfall, the hottest day, the coldest day, etc. are helpful in forecasting the upcoming climate which is done by analyzing previously accumulated data. Based on the observation of these atmospheric elements’ records of above 30 years, the climate is deduced.
The Causes of climate change:
Many natural processes have contributed to this, including fluctuations in the sun, volcanic eruptions, variances in Earth's orbit, and co₂ concentration (CO₂).
Climate warming has often taken thousands or millions of years to occur. However, research indicates that the current climate is changing at a faster rate than previously thought based on geological data.
Since the Industrial Revolution, human activity has raised greenhouse gas levels in the atmosphere, resulting in higher heat absorption and higher surface temperatures. Air pollutants in the atmosphere affect climate through scattering and absorbing solar and infrared energy, as well as changing cloud microphysical and chemical properties. Finally, changes in land use, such as deforestation, have affected the amount of sunlight reflected back into space.
Definition of Weather
Weather is the daily atmospheric conditions of a specific place. The study of weather is necessary to understand its effects on the everyday life and activities of humans. The atmospheric conditions like the brightness of sun, wind, visibility, humidity, cloudiness, temperature, etc. measure the weather of a particular day and time.
Weather can change within minutes, or hours, or even as per seasons. These changes mostly happen in the closest atmospheric layer to the ground called the troposphere. Nowadays, due to satellite observation, weather prediction has become easy.
The effects of weather change:
Many crops farmed around the world will be affected by weather changes. Wheat and rice thrive in hot regions, whereas maize and sugarcane prefer cooler conditions. Changes in rainfall patterns will have an impact on the growth of plants and crops. The impact of changing weather on plant development could lead to food shortages in some regions. Brazil, sections of Africa, Southeast Asia, and China will be the hardest hit, with many people facing starvation.
Difference between Weather and Climate in Points:
Even though both weather and climate include some similar atmospheric elements, there are some prominent differences between these two. Here are some differences between weather and climate in tabular form-
Difference Between Climate and Season
Similar to the climate weather difference, the season is different from the climate. The season is determined by the changes in weather during a specific time of the year. Contrastingly, the climate is the behavior of the atmosphere over a longer timeline. Thus, the prime difference between season and climate is also the measure of duration.
FAQs on Difference Between Weather and Climate
1. What are the types of climate?
Global climates can be categorised into 5 types. They are dry, cold, temperate, tropical, and polar.
2. What are the 4 climate zones?
The earth is divided into 4 different climate zones, namely temperate, tropical, subtropical, and arctic.
3. What is the root of global warming?
Climate change is caused primarily by human activity. People use fossil fuels and turn forestland into agricultural land. Carbon dioxide, a greenhouse gas, is created when fossil fuels are burned. The "greenhouse effect" is why it's termed a greenhouse gas.
4. What factors have an impact on the weather?
Solar radiation, the quantity of which varies with Earth's tilt, orbital distance from the sun, and latitude, temperature, air pressure, and the abundance of water are the four basic elements that determine weather.
Biology • Class 9
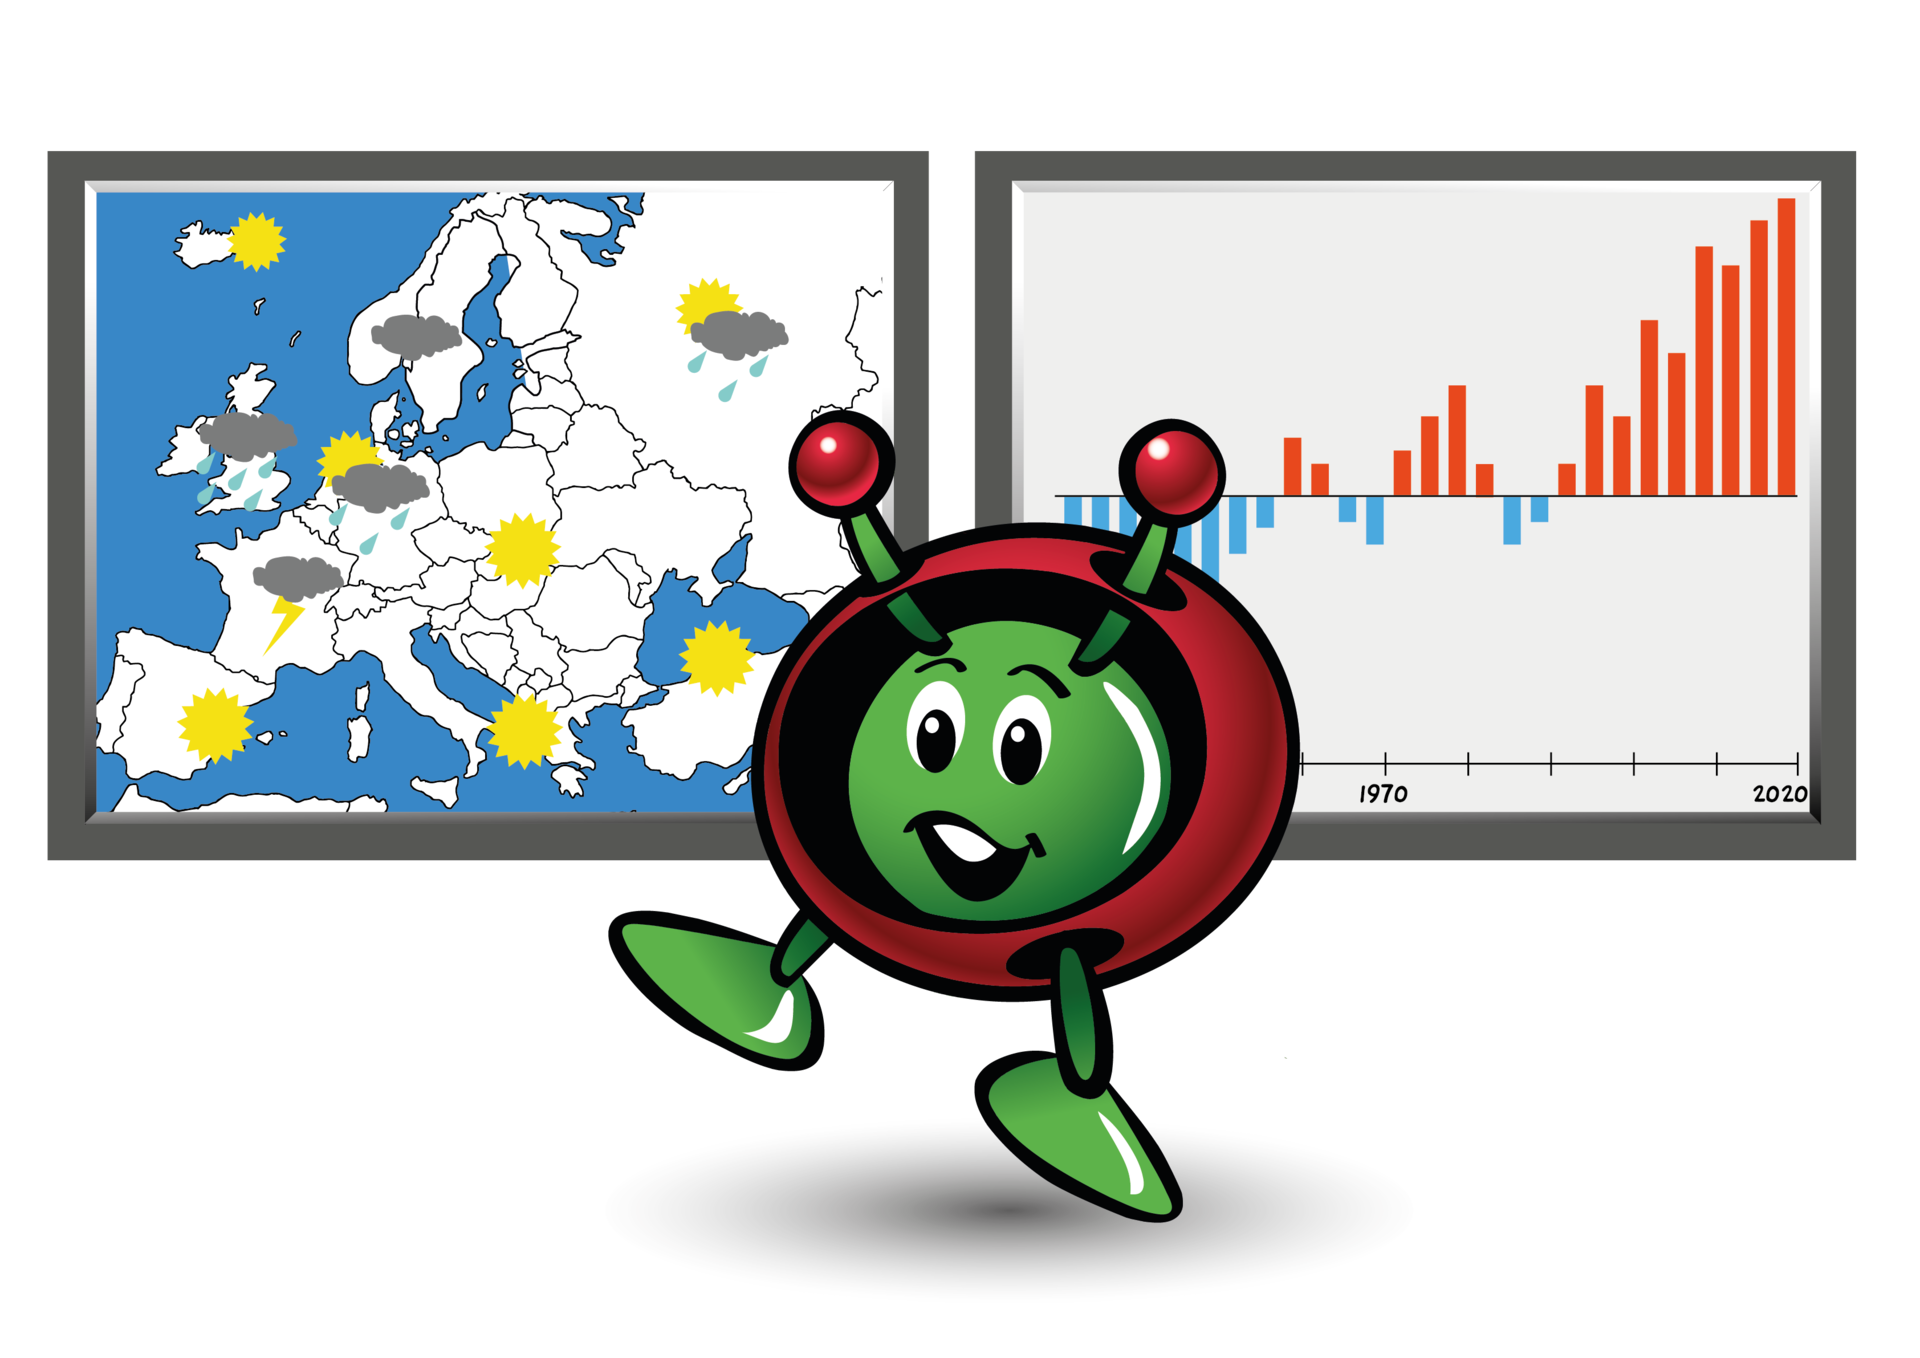
Weather vs Climate - Understanding the difference between weather and climate
Teach with space pr54.

French , Italian , Portuguese , German ( teacher guide + student guide )
The concepts of weather and climate are often thought to be the same thing. In this set of activities pupils will learn the difference between weather and climate by analysing different statements, by collecting and analysing their own air temperature data and in the end they will write a short climate report for the year 2050. Pupils will learn about data collection, different weather and climate scenarios, and their significance to the Earth.
This classroom resource is part of a set of resources developed by ESA’s Education Office in collaboration with ESEROs to support the Climate Detectives project.
Learn more about the concepts of weather and climate and the role of space in studying changes to our planet in real-time and in the future in this episode of Meet The Experts with Andrew Shepherd of the University of Leeds, a leading climate scientist working with ESA and NASA.
Thank you for liking
You have already liked this page, you can only like it once!

The Effects of Climate Change
The effects of human-caused global warming are happening now, are irreversible for people alive today, and will worsen as long as humans add greenhouse gases to the atmosphere.
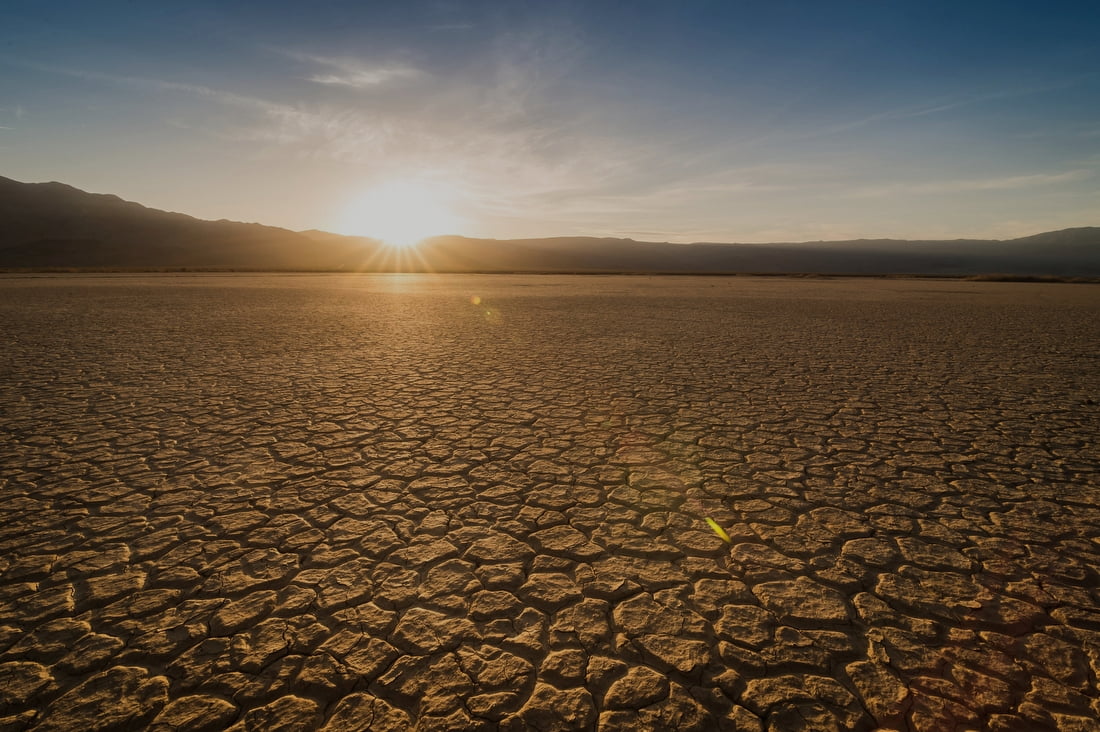
- We already see effects scientists predicted, such as the loss of sea ice, melting glaciers and ice sheets, sea level rise, and more intense heat waves.
- Scientists predict global temperature increases from human-made greenhouse gases will continue. Severe weather damage will also increase and intensify.
Earth Will Continue to Warm and the Effects Will Be Profound
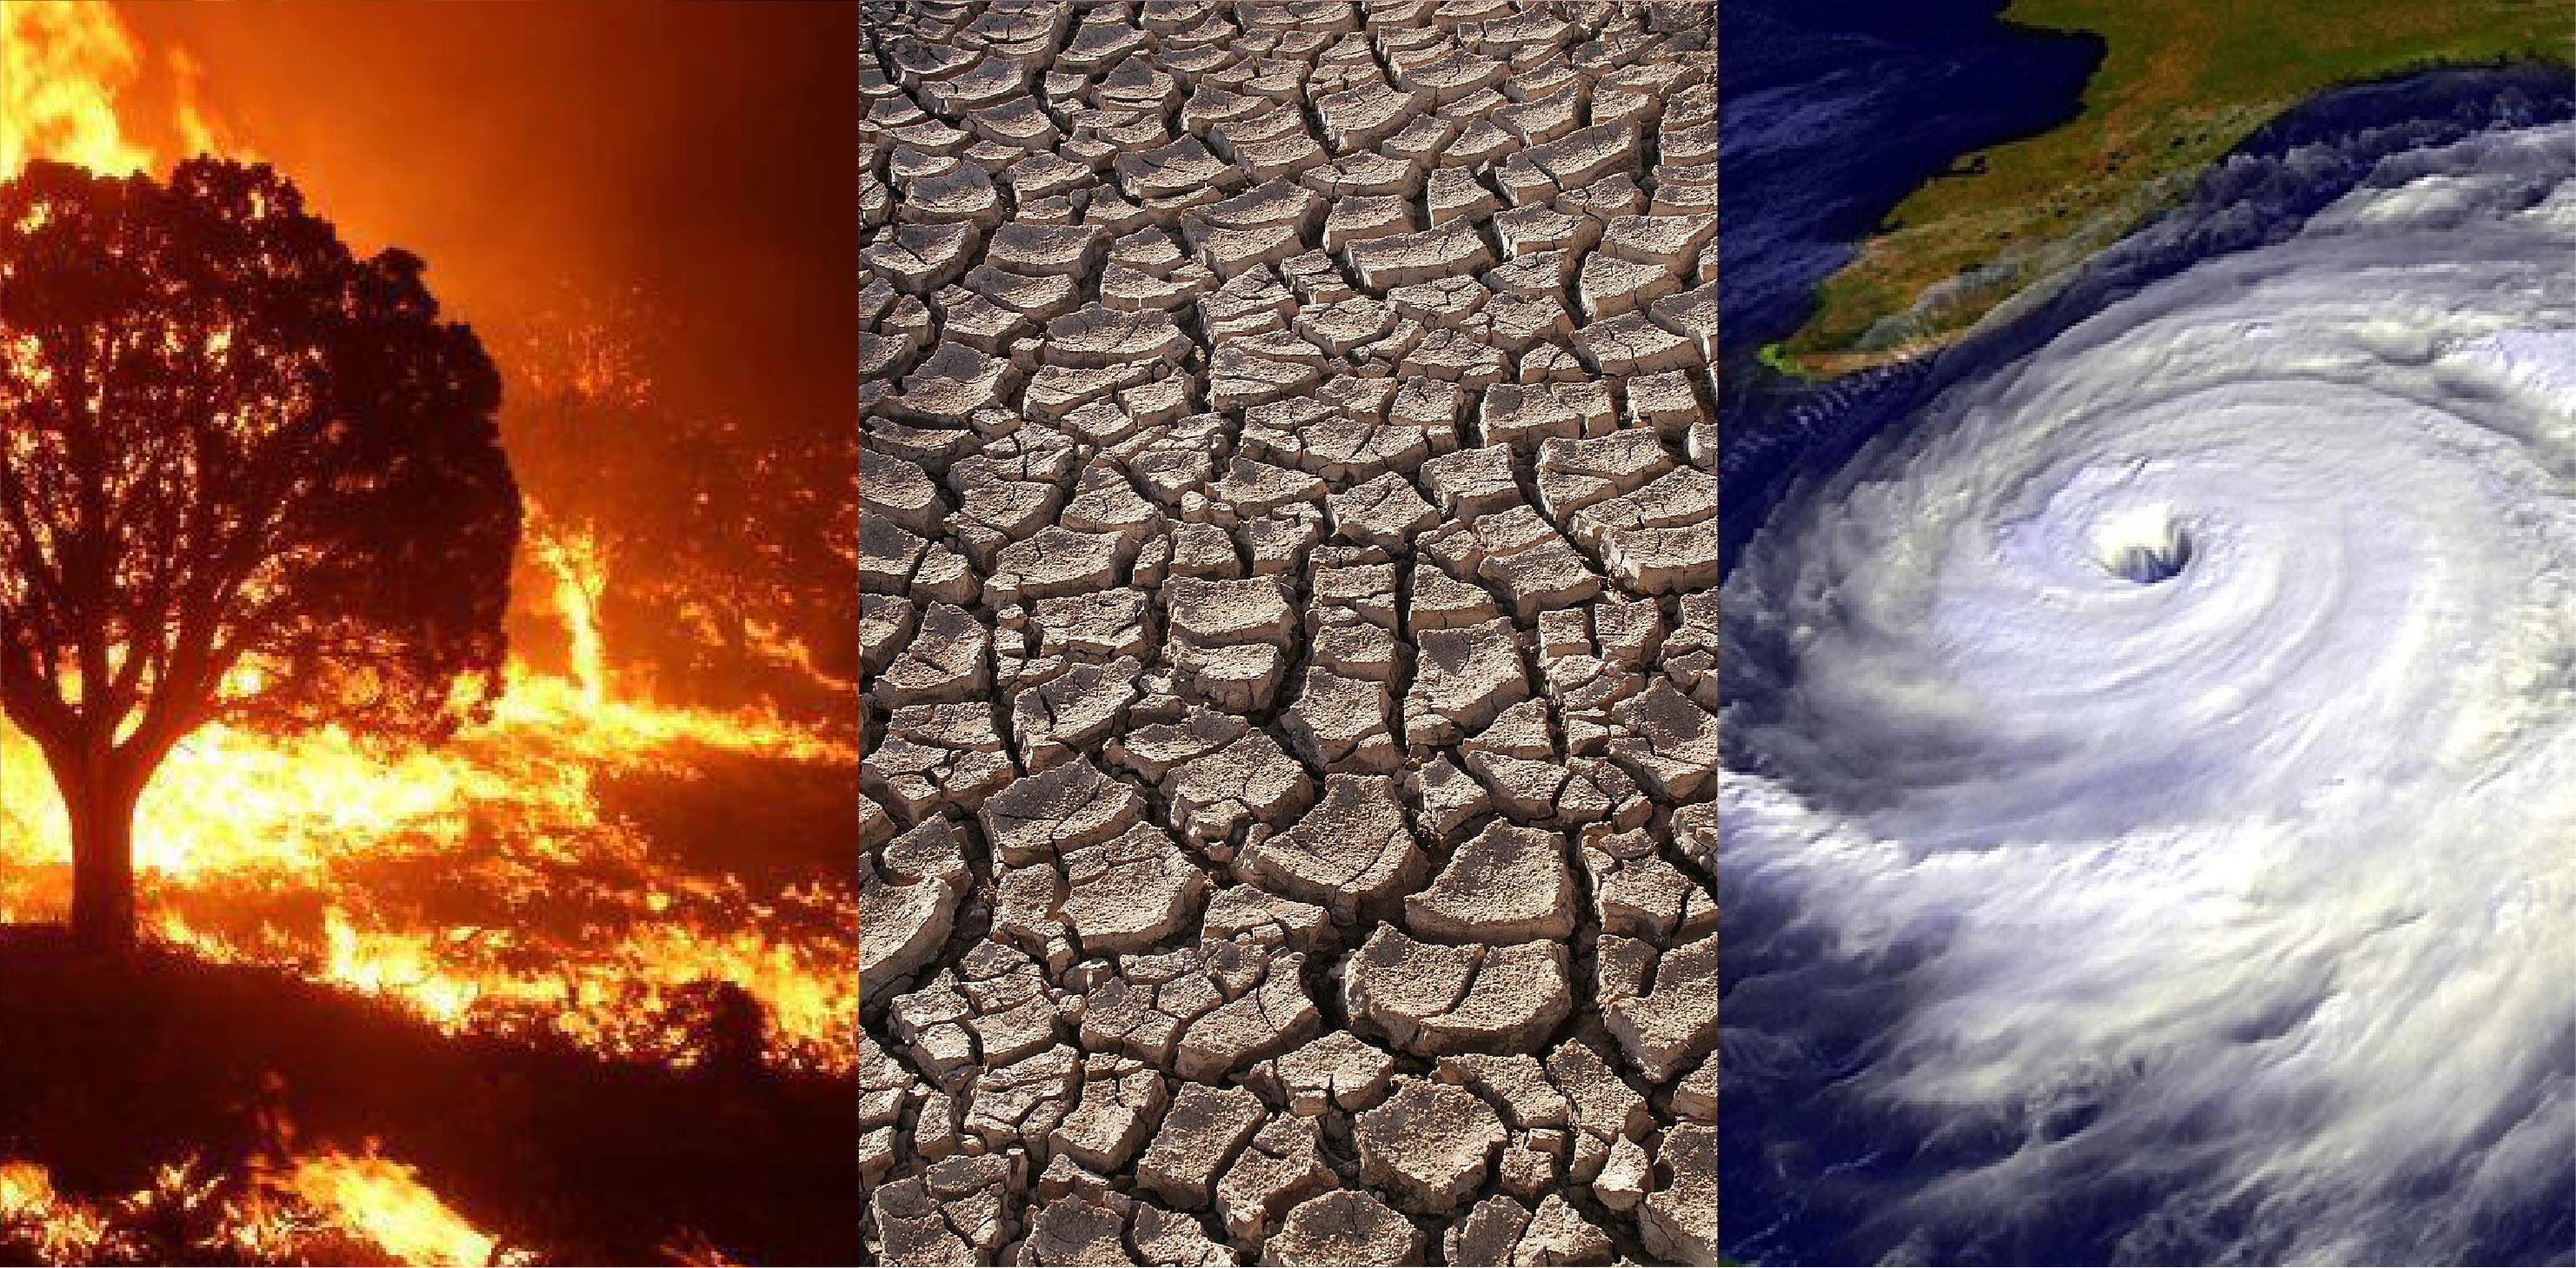
Global climate change is not a future problem. Changes to Earth’s climate driven by increased human emissions of heat-trapping greenhouse gases are already having widespread effects on the environment: glaciers and ice sheets are shrinking, river and lake ice is breaking up earlier, plant and animal geographic ranges are shifting, and plants and trees are blooming sooner.
Effects that scientists had long predicted would result from global climate change are now occurring, such as sea ice loss, accelerated sea level rise, and longer, more intense heat waves.
The magnitude and rate of climate change and associated risks depend strongly on near-term mitigation and adaptation actions, and projected adverse impacts and related losses and damages escalate with every increment of global warming.

Intergovernmental Panel on Climate Change
Some changes (such as droughts, wildfires, and extreme rainfall) are happening faster than scientists previously assessed. In fact, according to the Intergovernmental Panel on Climate Change (IPCC) — the United Nations body established to assess the science related to climate change — modern humans have never before seen the observed changes in our global climate, and some of these changes are irreversible over the next hundreds to thousands of years.
Scientists have high confidence that global temperatures will continue to rise for many decades, mainly due to greenhouse gases produced by human activities.
The IPCC’s Sixth Assessment report, published in 2021, found that human emissions of heat-trapping gases have already warmed the climate by nearly 2 degrees Fahrenheit (1.1 degrees Celsius) since 1850-1900. 1 The global average temperature is expected to reach or exceed 1.5 degrees C (about 3 degrees F) within the next few decades. These changes will affect all regions of Earth.
The severity of effects caused by climate change will depend on the path of future human activities. More greenhouse gas emissions will lead to more climate extremes and widespread damaging effects across our planet. However, those future effects depend on the total amount of carbon dioxide we emit. So, if we can reduce emissions, we may avoid some of the worst effects.
The scientific evidence is unequivocal: climate change is a threat to human wellbeing and the health of the planet. Any further delay in concerted global action will miss the brief, rapidly closing window to secure a liveable future.
Here are some of the expected effects of global climate change on the United States, according to the Third and Fourth National Climate Assessment Reports:
Future effects of global climate change in the United States:
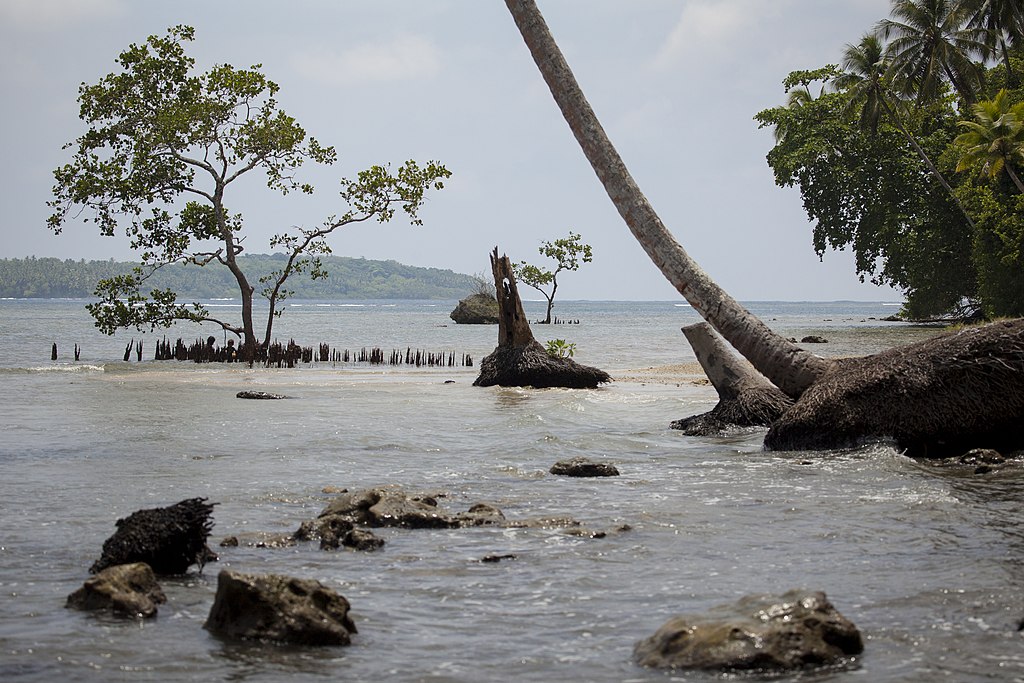
U.S. Sea Level Likely to Rise 1 to 6.6 Feet by 2100
Global sea level has risen about 8 inches (0.2 meters) since reliable record-keeping began in 1880. By 2100, scientists project that it will rise at least another foot (0.3 meters), but possibly as high as 6.6 feet (2 meters) in a high-emissions scenario. Sea level is rising because of added water from melting land ice and the expansion of seawater as it warms. Image credit: Creative Commons Attribution-Share Alike 4.0
Climate Changes Will Continue Through This Century and Beyond
Global climate is projected to continue warming over this century and beyond. Image credit: Khagani Hasanov, Creative Commons Attribution-Share Alike 3.0
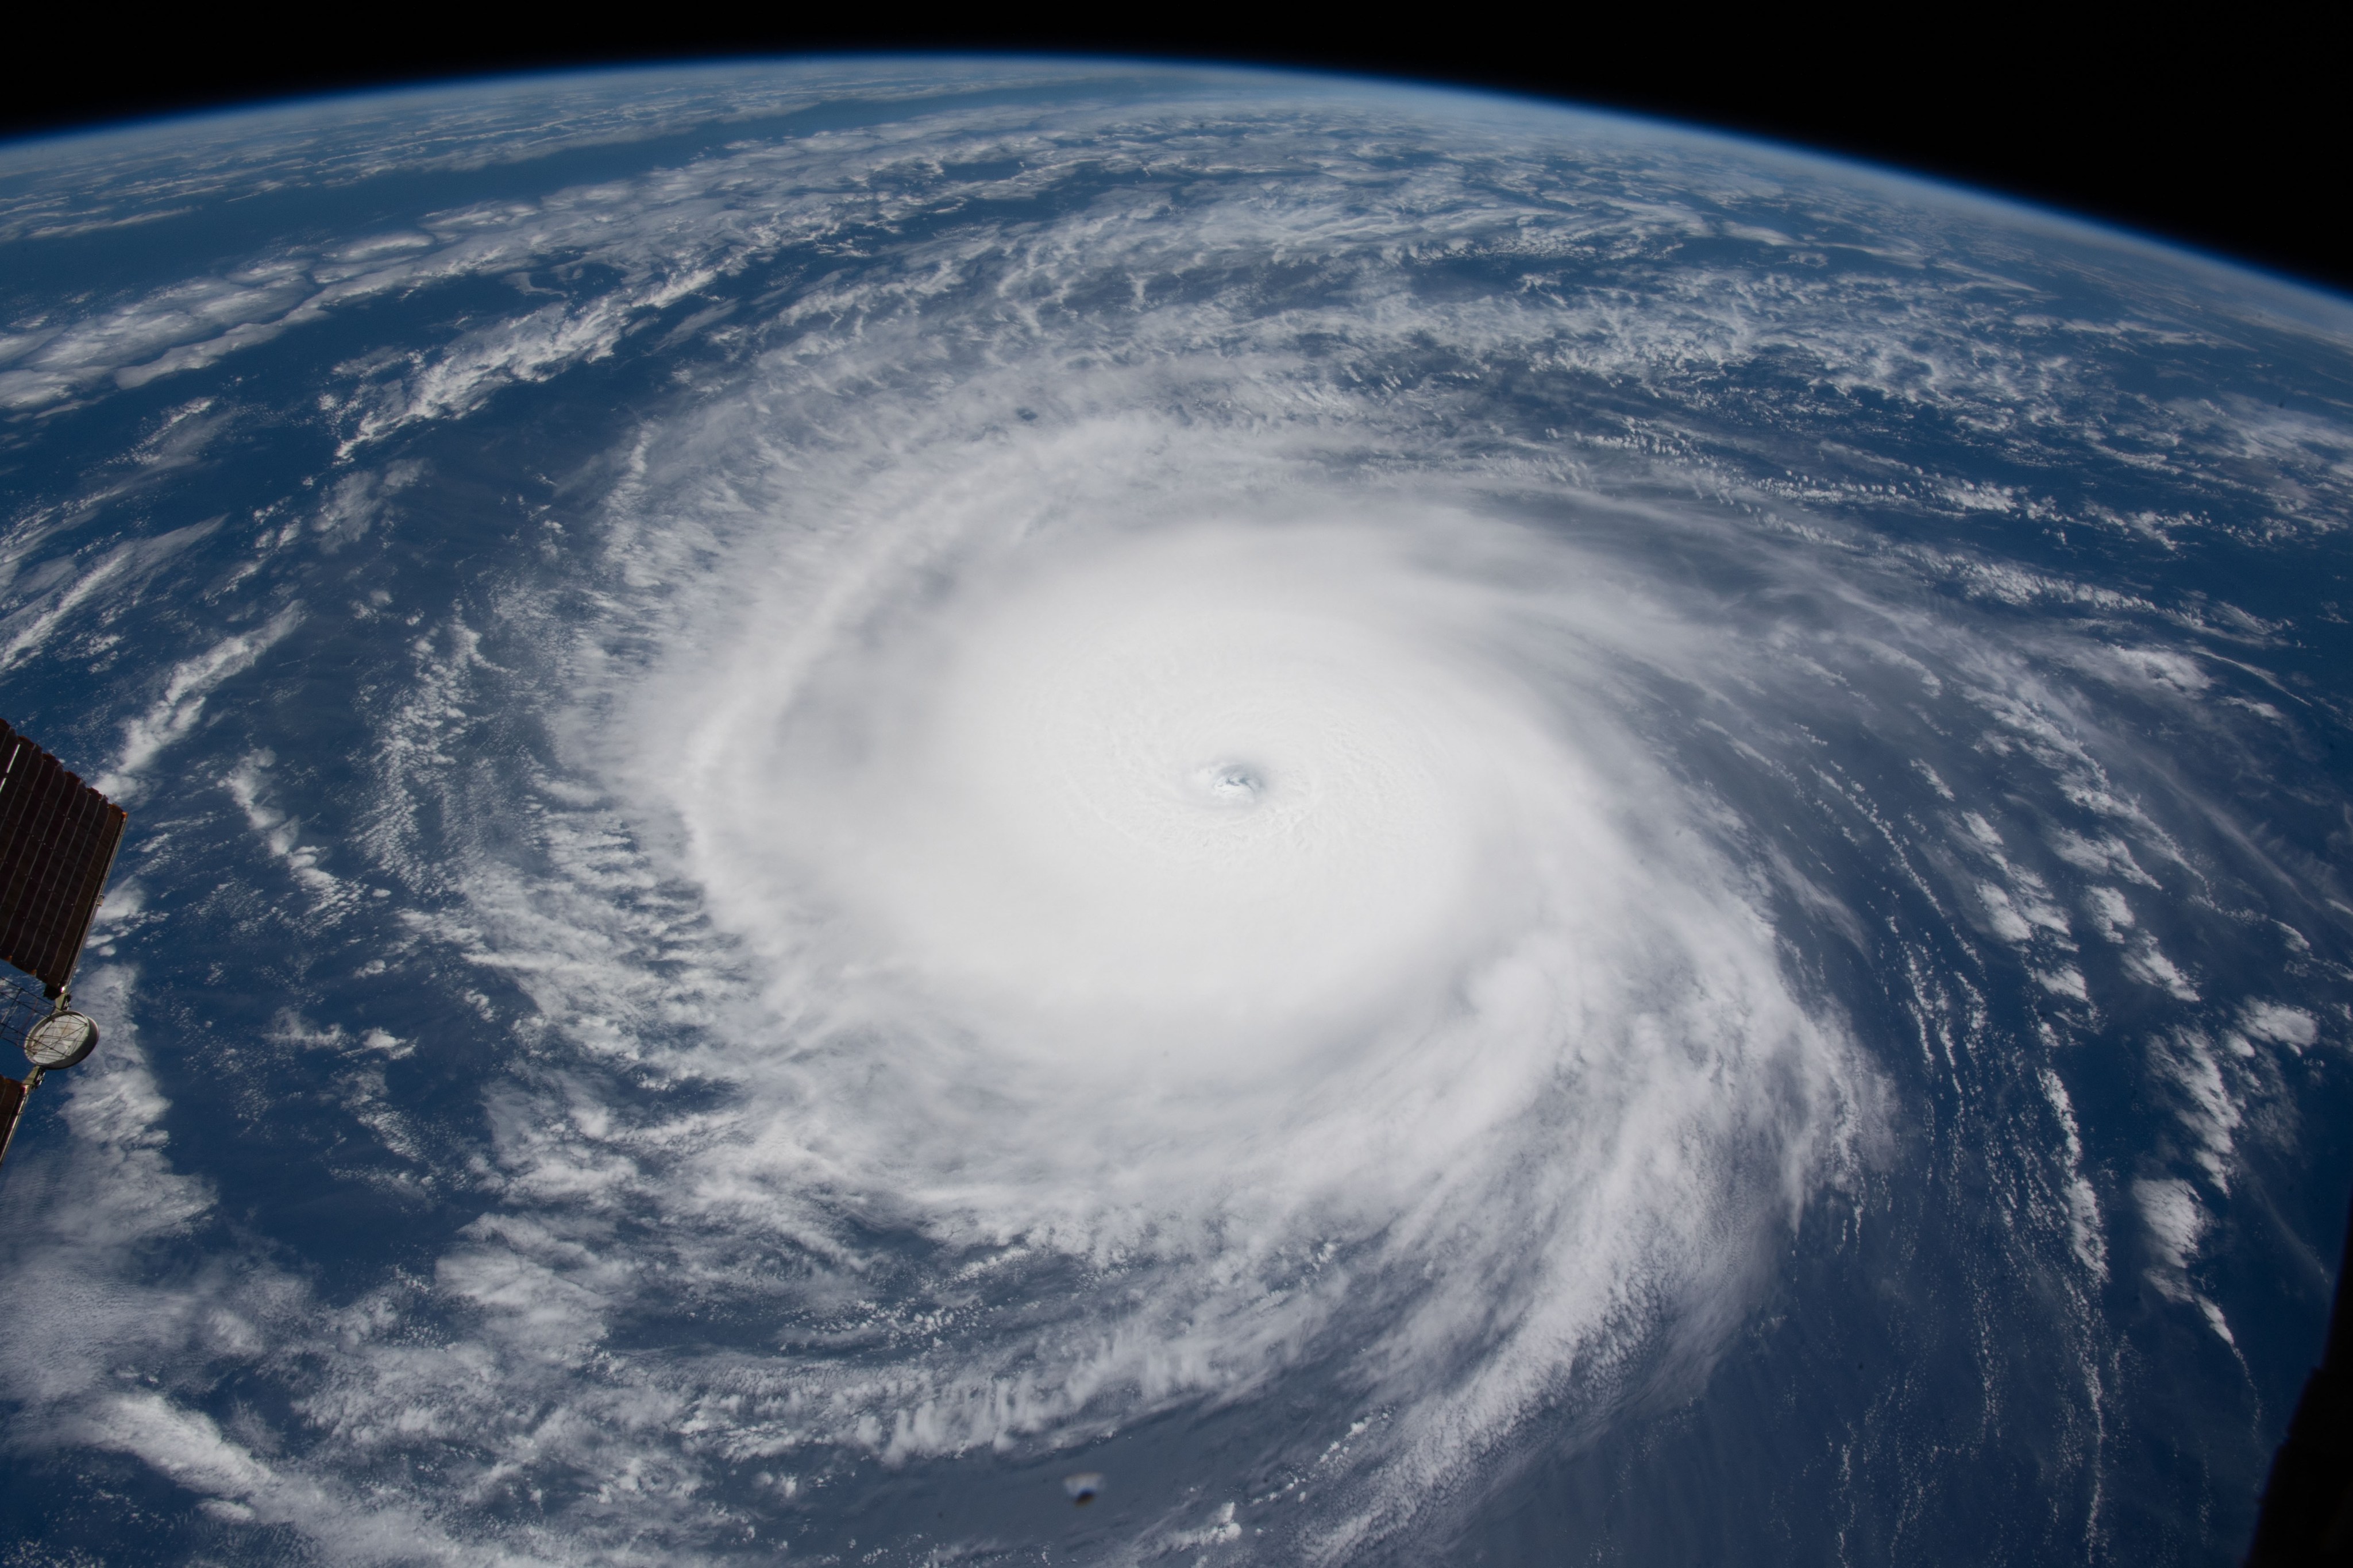
Hurricanes Will Become Stronger and More Intense
Scientists project that hurricane-associated storm intensity and rainfall rates will increase as the climate continues to warm. Image credit: NASA
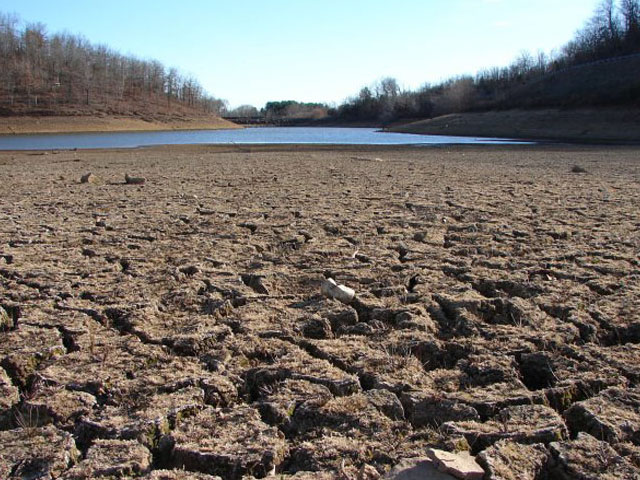
More Droughts and Heat Waves
Droughts in the Southwest and heat waves (periods of abnormally hot weather lasting days to weeks) are projected to become more intense, and cold waves less intense and less frequent. Image credit: NOAA
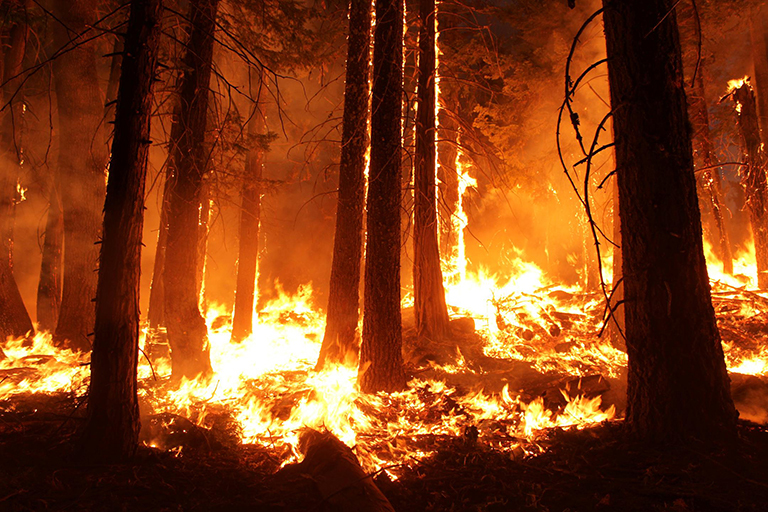
Longer Wildfire Season
Warming temperatures have extended and intensified wildfire season in the West, where long-term drought in the region has heightened the risk of fires. Scientists estimate that human-caused climate change has already doubled the area of forest burned in recent decades. By around 2050, the amount of land consumed by wildfires in Western states is projected to further increase by two to six times. Even in traditionally rainy regions like the Southeast, wildfires are projected to increase by about 30%.
Changes in Precipitation Patterns
Climate change is having an uneven effect on precipitation (rain and snow) in the United States, with some locations experiencing increased precipitation and flooding, while others suffer from drought. On average, more winter and spring precipitation is projected for the northern United States, and less for the Southwest, over this century. Image credit: Marvin Nauman/FEMA
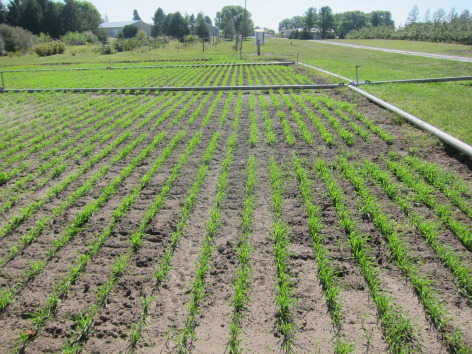
Frost-Free Season (and Growing Season) will Lengthen
The length of the frost-free season, and the corresponding growing season, has been increasing since the 1980s, with the largest increases occurring in the western United States. Across the United States, the growing season is projected to continue to lengthen, which will affect ecosystems and agriculture.
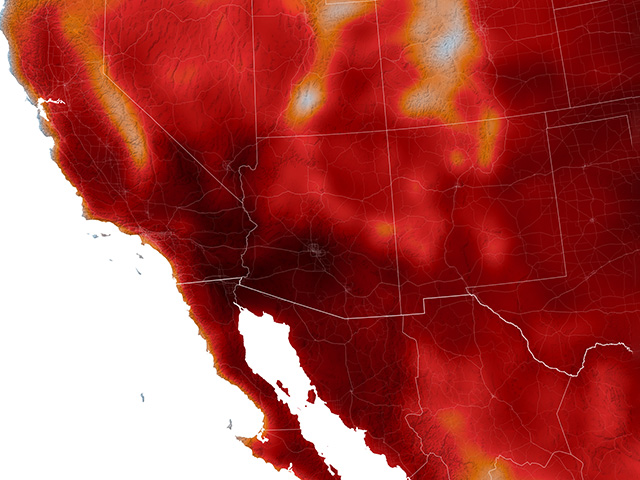
Global Temperatures Will Continue to Rise
Summer of 2023 was Earth's hottest summer on record, 0.41 degrees Fahrenheit (F) (0.23 degrees Celsius (C)) warmer than any other summer in NASA’s record and 2.1 degrees F (1.2 C) warmer than the average summer between 1951 and 1980. Image credit: NASA
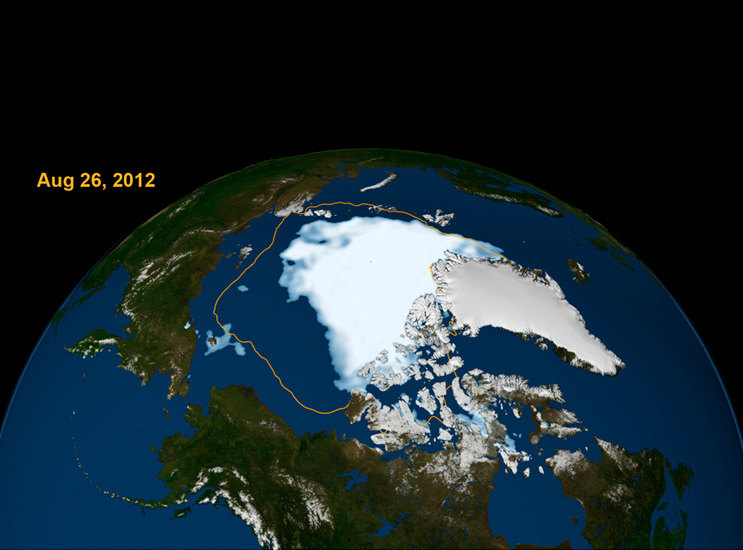
Arctic Is Very Likely to Become Ice-Free
Sea ice cover in the Arctic Ocean is expected to continue decreasing, and the Arctic Ocean will very likely become essentially ice-free in late summer if current projections hold. This change is expected to occur before mid-century.
U.S. Regional Effects
Climate change is bringing different types of challenges to each region of the country. Some of the current and future impacts are summarized below. These findings are from the Third 3 and Fourth 4 National Climate Assessment Reports, released by the U.S. Global Change Research Program .
- Northeast. Heat waves, heavy downpours, and sea level rise pose increasing challenges to many aspects of life in the Northeast. Infrastructure, agriculture, fisheries, and ecosystems will be increasingly compromised. Farmers can explore new crop options, but these adaptations are not cost- or risk-free. Moreover, adaptive capacity , which varies throughout the region, could be overwhelmed by a changing climate. Many states and cities are beginning to incorporate climate change into their planning.
- Northwest. Changes in the timing of peak flows in rivers and streams are reducing water supplies and worsening competing demands for water. Sea level rise, erosion, flooding, risks to infrastructure, and increasing ocean acidity pose major threats. Increasing wildfire incidence and severity, heat waves, insect outbreaks, and tree diseases are causing widespread forest die-off.
- Southeast. Sea level rise poses widespread and continuing threats to the region’s economy and environment. Extreme heat will affect health, energy, agriculture, and more. Decreased water availability will have economic and environmental impacts.
- Midwest. Extreme heat, heavy downpours, and flooding will affect infrastructure, health, agriculture, forestry, transportation, air and water quality, and more. Climate change will also worsen a range of risks to the Great Lakes.
- Southwest. Climate change has caused increased heat, drought, and insect outbreaks. In turn, these changes have made wildfires more numerous and severe. The warming climate has also caused a decline in water supplies, reduced agricultural yields, and triggered heat-related health impacts in cities. In coastal areas, flooding and erosion are additional concerns.
1. IPCC 2021, Climate Change 2021: The Physical Science Basis , the Working Group I contribution to the Sixth Assessment Report, Cambridge University Press, Cambridge, UK.
2. IPCC, 2013: Summary for Policymakers. In: Climate Change 2013: The Physical Science Basis. Contribution of Working Group I to the Fifth Assessment Report of the Intergovernmental Panel on Climate Change [Stocker, T.F., D. Qin, G.-K. Plattner, M. Tignor, S.K. Allen, J. Boschung, A. Nauels, Y. Xia, V. Bex and P.M. Midgley (eds.)]. Cambridge University Press, Cambridge, United Kingdom and New York, NY, USA.
3. USGCRP 2014, Third Climate Assessment .
4. USGCRP 2017, Fourth Climate Assessment .
Related Resources
A Degree of Difference
So, the Earth's average temperature has increased about 2 degrees Fahrenheit during the 20th century. What's the big deal?
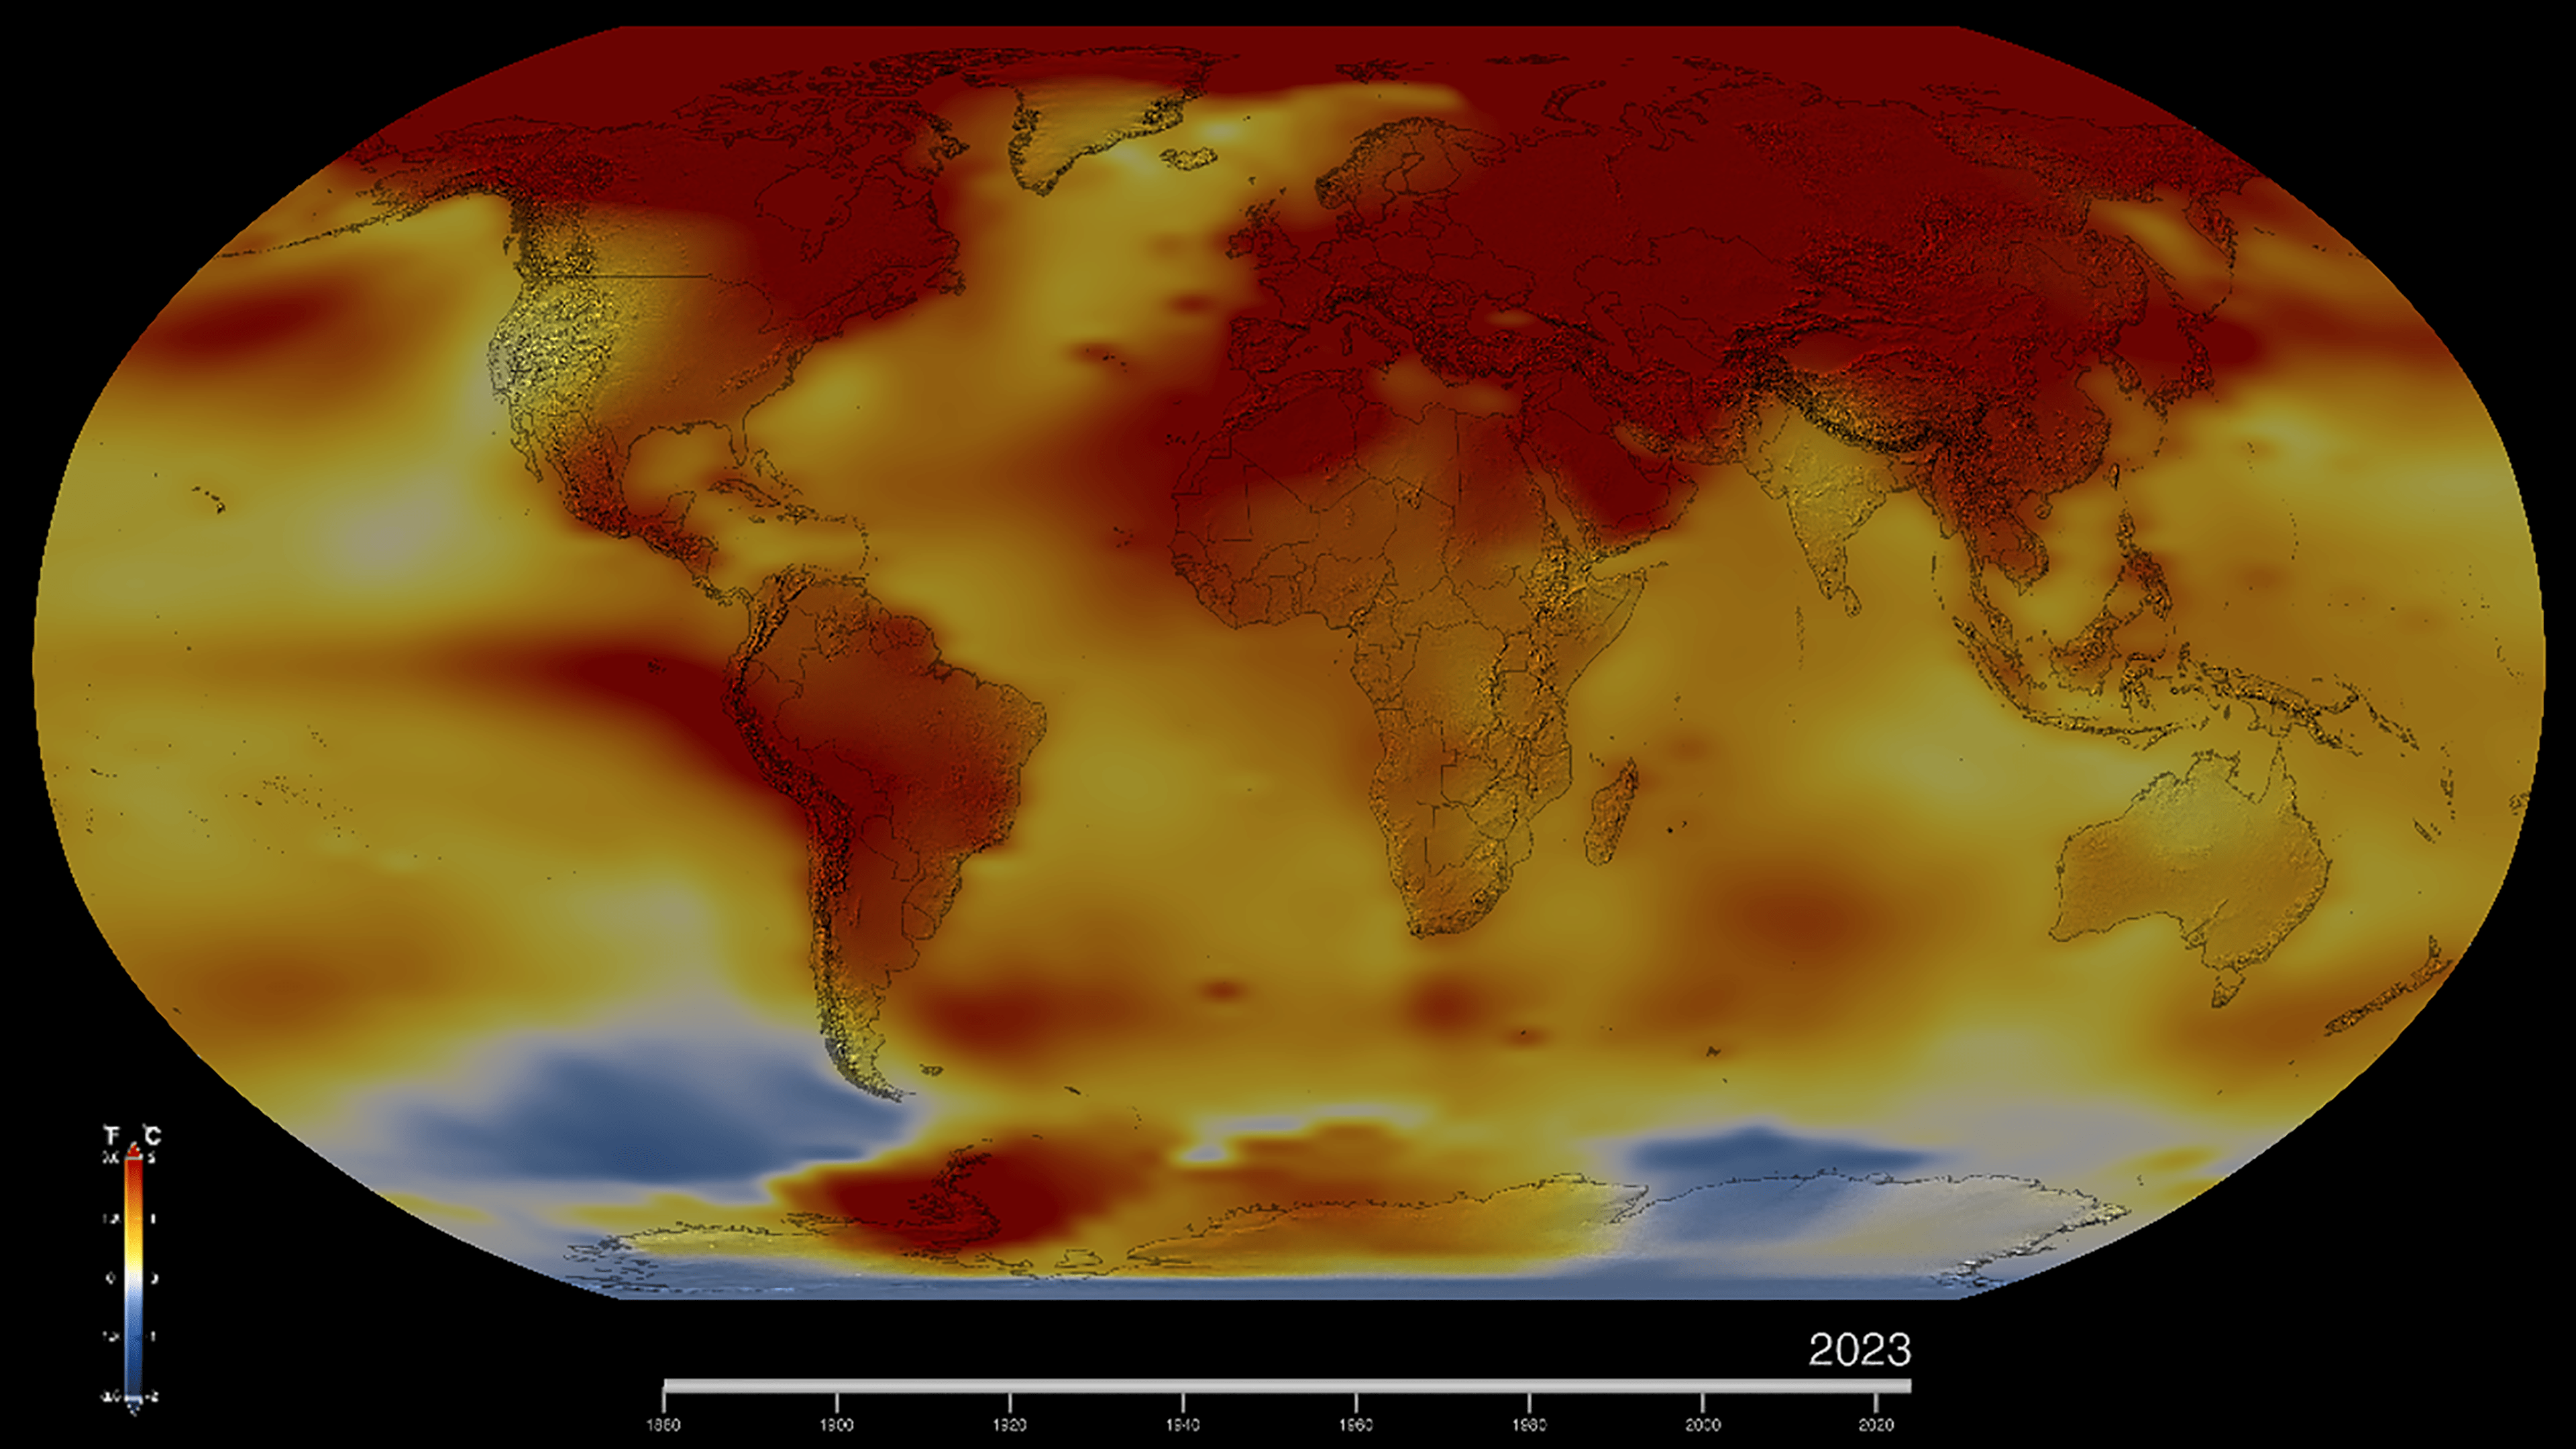
What’s the difference between climate change and global warming?
“Global warming” refers to the long-term warming of the planet. “Climate change” encompasses global warming, but refers to the broader range of changes that are happening to our planet, including rising sea levels; shrinking mountain glaciers; accelerating ice melt in Greenland, Antarctica and the Arctic; and shifts in flower/plant blooming times.

Is it too late to prevent climate change?
Humans have caused major climate changes to happen already, and we have set in motion more changes still. However, if we stopped emitting greenhouse gases today, the rise in global temperatures would begin to flatten within a few years. Temperatures would then plateau but remain well-elevated for many, many centuries.
Discover More Topics From NASA
Explore Earth Science

Earth Science in Action

Earth Science Data
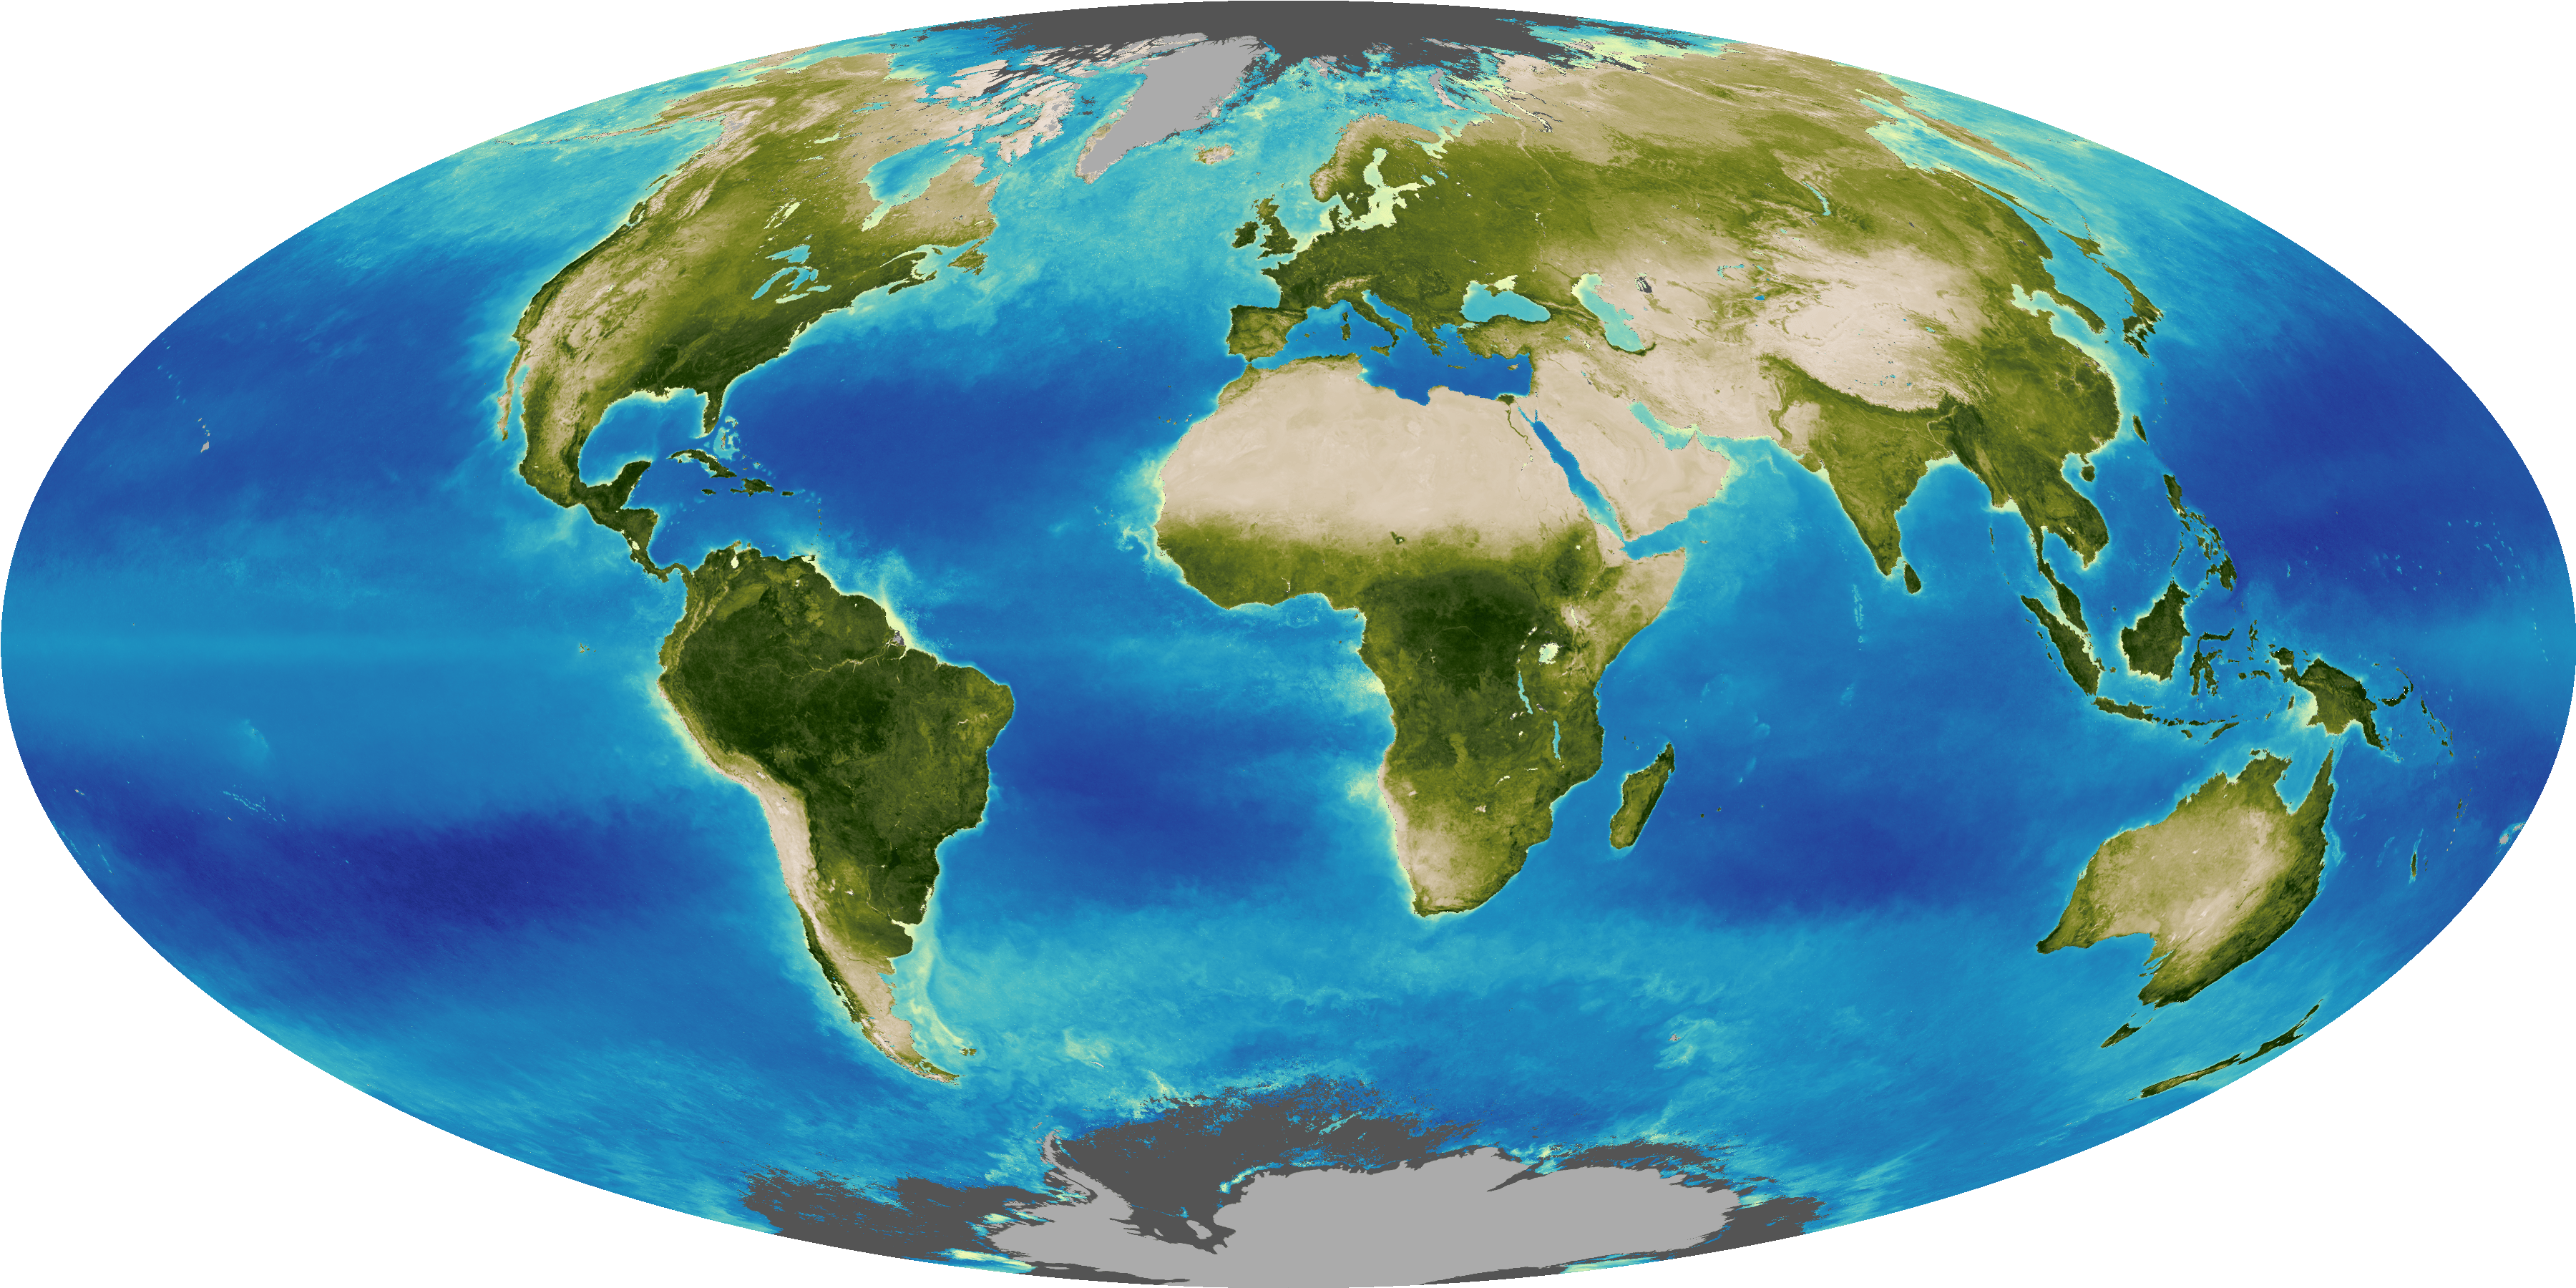
Facts About Earth


Weather forecasts have become much more accurate; we now need to make them available to everyone
A four-day forecast today is as accurate as a one-day forecast 30 years ago..
Weather forecasts are often seen as just a nice thing to have. Useful when planning a Sunday barbecue, or when we want to know if we’ll need an umbrella for the day. But in many ways weather forecasts are absolutely crucial: they can be a matter of life and death.
Accurate forecasts can save lives by giving early warnings of storms, heat waves, and disasters. Farmers use them for agricultural management, which can make the difference between a lost harvest or a harvest of plenty. Grid operators rely on accurate forecasts of temperatures for heating and cooling demand, and how much energy they’ll get from wind and solar farms. Pilots and sailors need them to carry people across oceans safely. Accurate information about future weather is often absolutely vital.
In this article, I look at improvements over time and the global inequalities that need to be closed to protect lives and livelihoods around the world.
Weather forecasts have improved a lot
Weather forecasting has come a long way. In 650 B.C. the Babylonians would try to predict weather patterns based on cloud patterns and movements. Three centuries later, Aristotle wrote Meteorologica , discussing how phenomena such as rain, hail, hurricanes, and lightning formed. Much of it turned out to be wrong, but it represents one of the first attempts to explain how the weather works in detail.
It wasn’t until 1859 that the UK’s Meteorological Service (the Met Office) issued its first weather forecast for shipping. Two years later, it broadcasted its first public weather forecast. While meteorological measurements improved over time, the massive step-change in predictions came with the use of computerized numerical modeling. This didn’t start until a century later, in the 1960s.
Forecasts have improved a lot since then. We can see this across a range of measurements, and different national meteorological organizations.
The Met Office says its four-day forecasts are now as accurate as its one-day forecasts were 30 years ago.
Predictions have gotten much better in the United States, too. We can see this in some of the most important forecasts: the prediction of hurricanes.
The National Hurricane Center publishes data on the “track error” of hurricanes and cyclones — the error in where the hurricane hits. This is shown in the chart below, from the 1960s onwards.
Each line represents the error of forecasts for different time periods in advance. For example, 12 hours before it hits, all the way up to 120 hours (or 5 days) before.
We can see that this track error — especially for longer-term forecasts — has decreased a lot over time. In the 1970s, a 48-hour forecast had an error between 200 and 400 nautical miles; today this is around 50 nautical miles.
We can show the same data another way. In the chart below, each line represents the average error for each decade. On the horizontal axis we have the forecast period, again extending from 0 to 120 hours.
The 72-hour error in the 1960s and 70s was over 400 nautical miles. Today, it’s less than 80 miles.
Meteorologists can now make pretty accurate predictions of where a hurricane will hit three or four days in advance, which lets cities and communities prepare while preventing unnecessary evacuations that might have been implemented in the past.
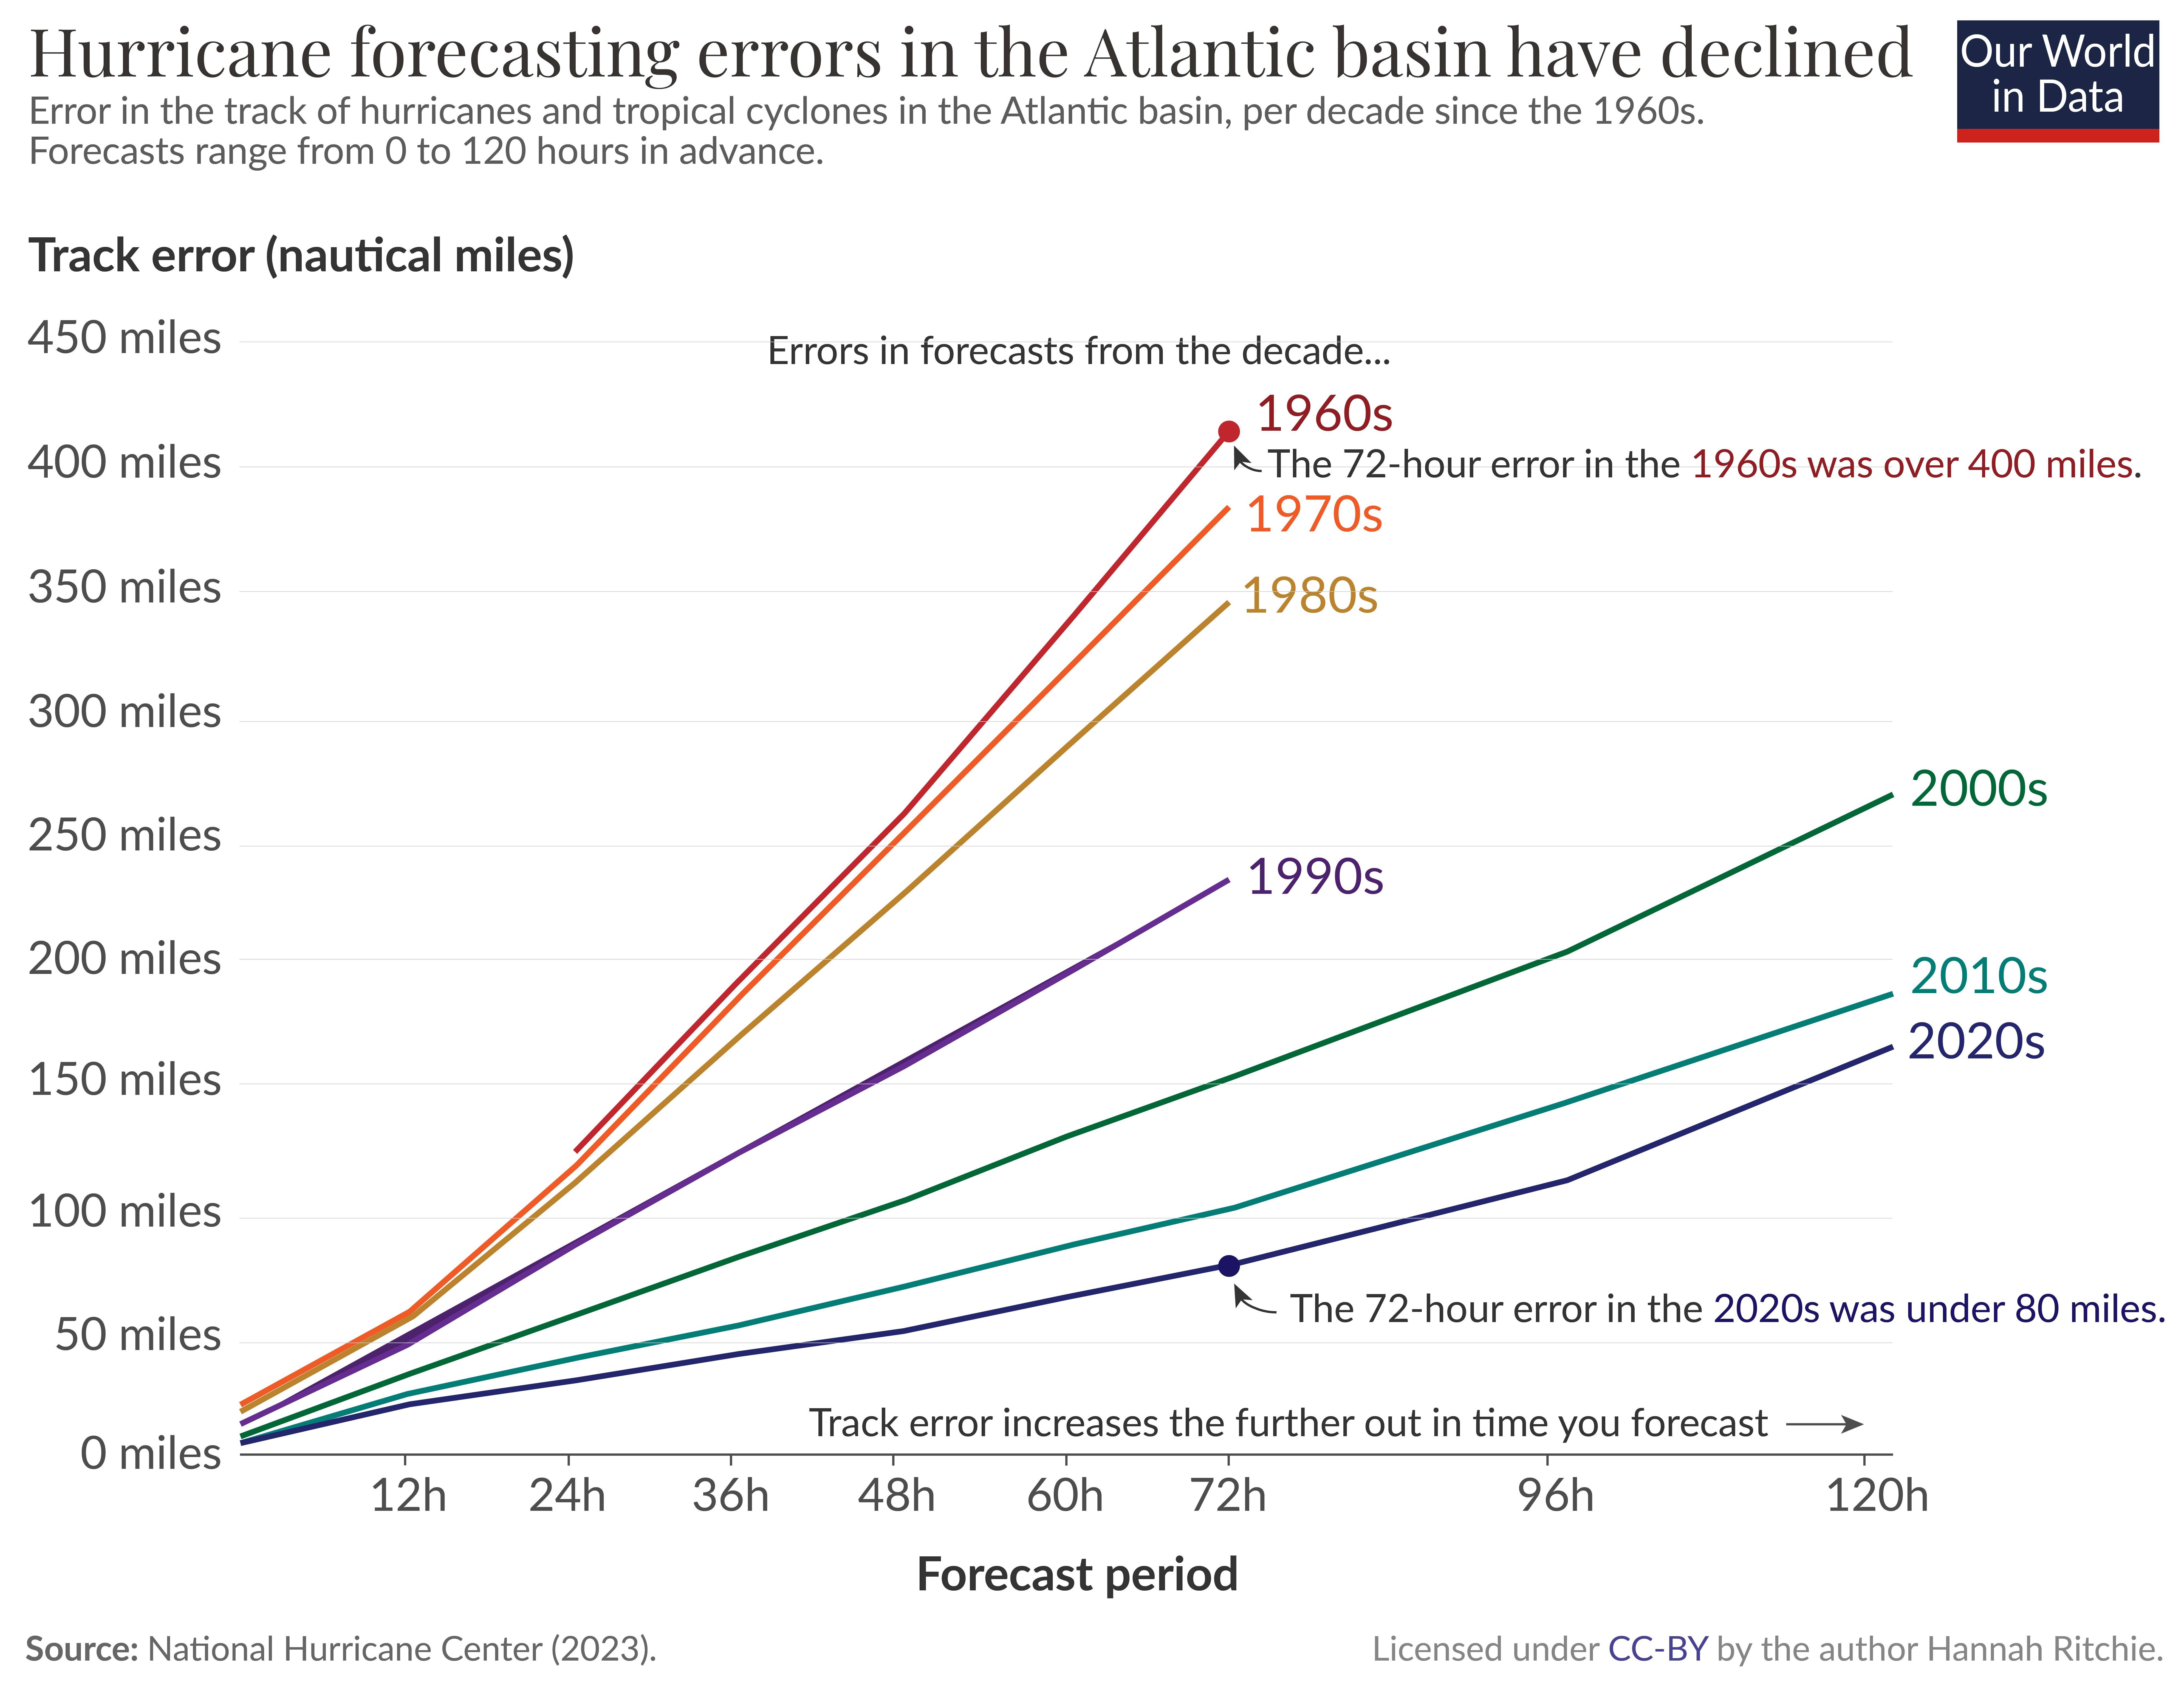
The European Centre for Medium-Range Weather Forecasts (ECMWF) produces global numerical weather models. While national weather agencies use much higher-resolution processing to get local forecasts, these global models provide a crucial input into these systems.
The ECMWF publishes analyses of its errors over time. This is shown in the chart below. 1 It shows the difference between the forecast and the actual weather outcome for forecasts 3, 5, 7, and 10 days in advance. The metric used here is the “ 500 hPa geopotential height ”, a commonly used meteorological measure of air pressure (which dictates weather patterns).
The solid line is for the Northern Hemisphere, and the dashed line is for the Southern.
Three-day forecasts — shown in blue — have been pretty accurate since the 1980s, and have still gotten a lot better over time. Today the accuracy is around 97%.
The biggest improvements we’ve seen are for longer timeframes. By the early 2000s, 5-day forecasts were “highly accurate” and 7-day forecasts are reaching that threshold today. 10-day forecasts aren’t quite there yet but are getting better.
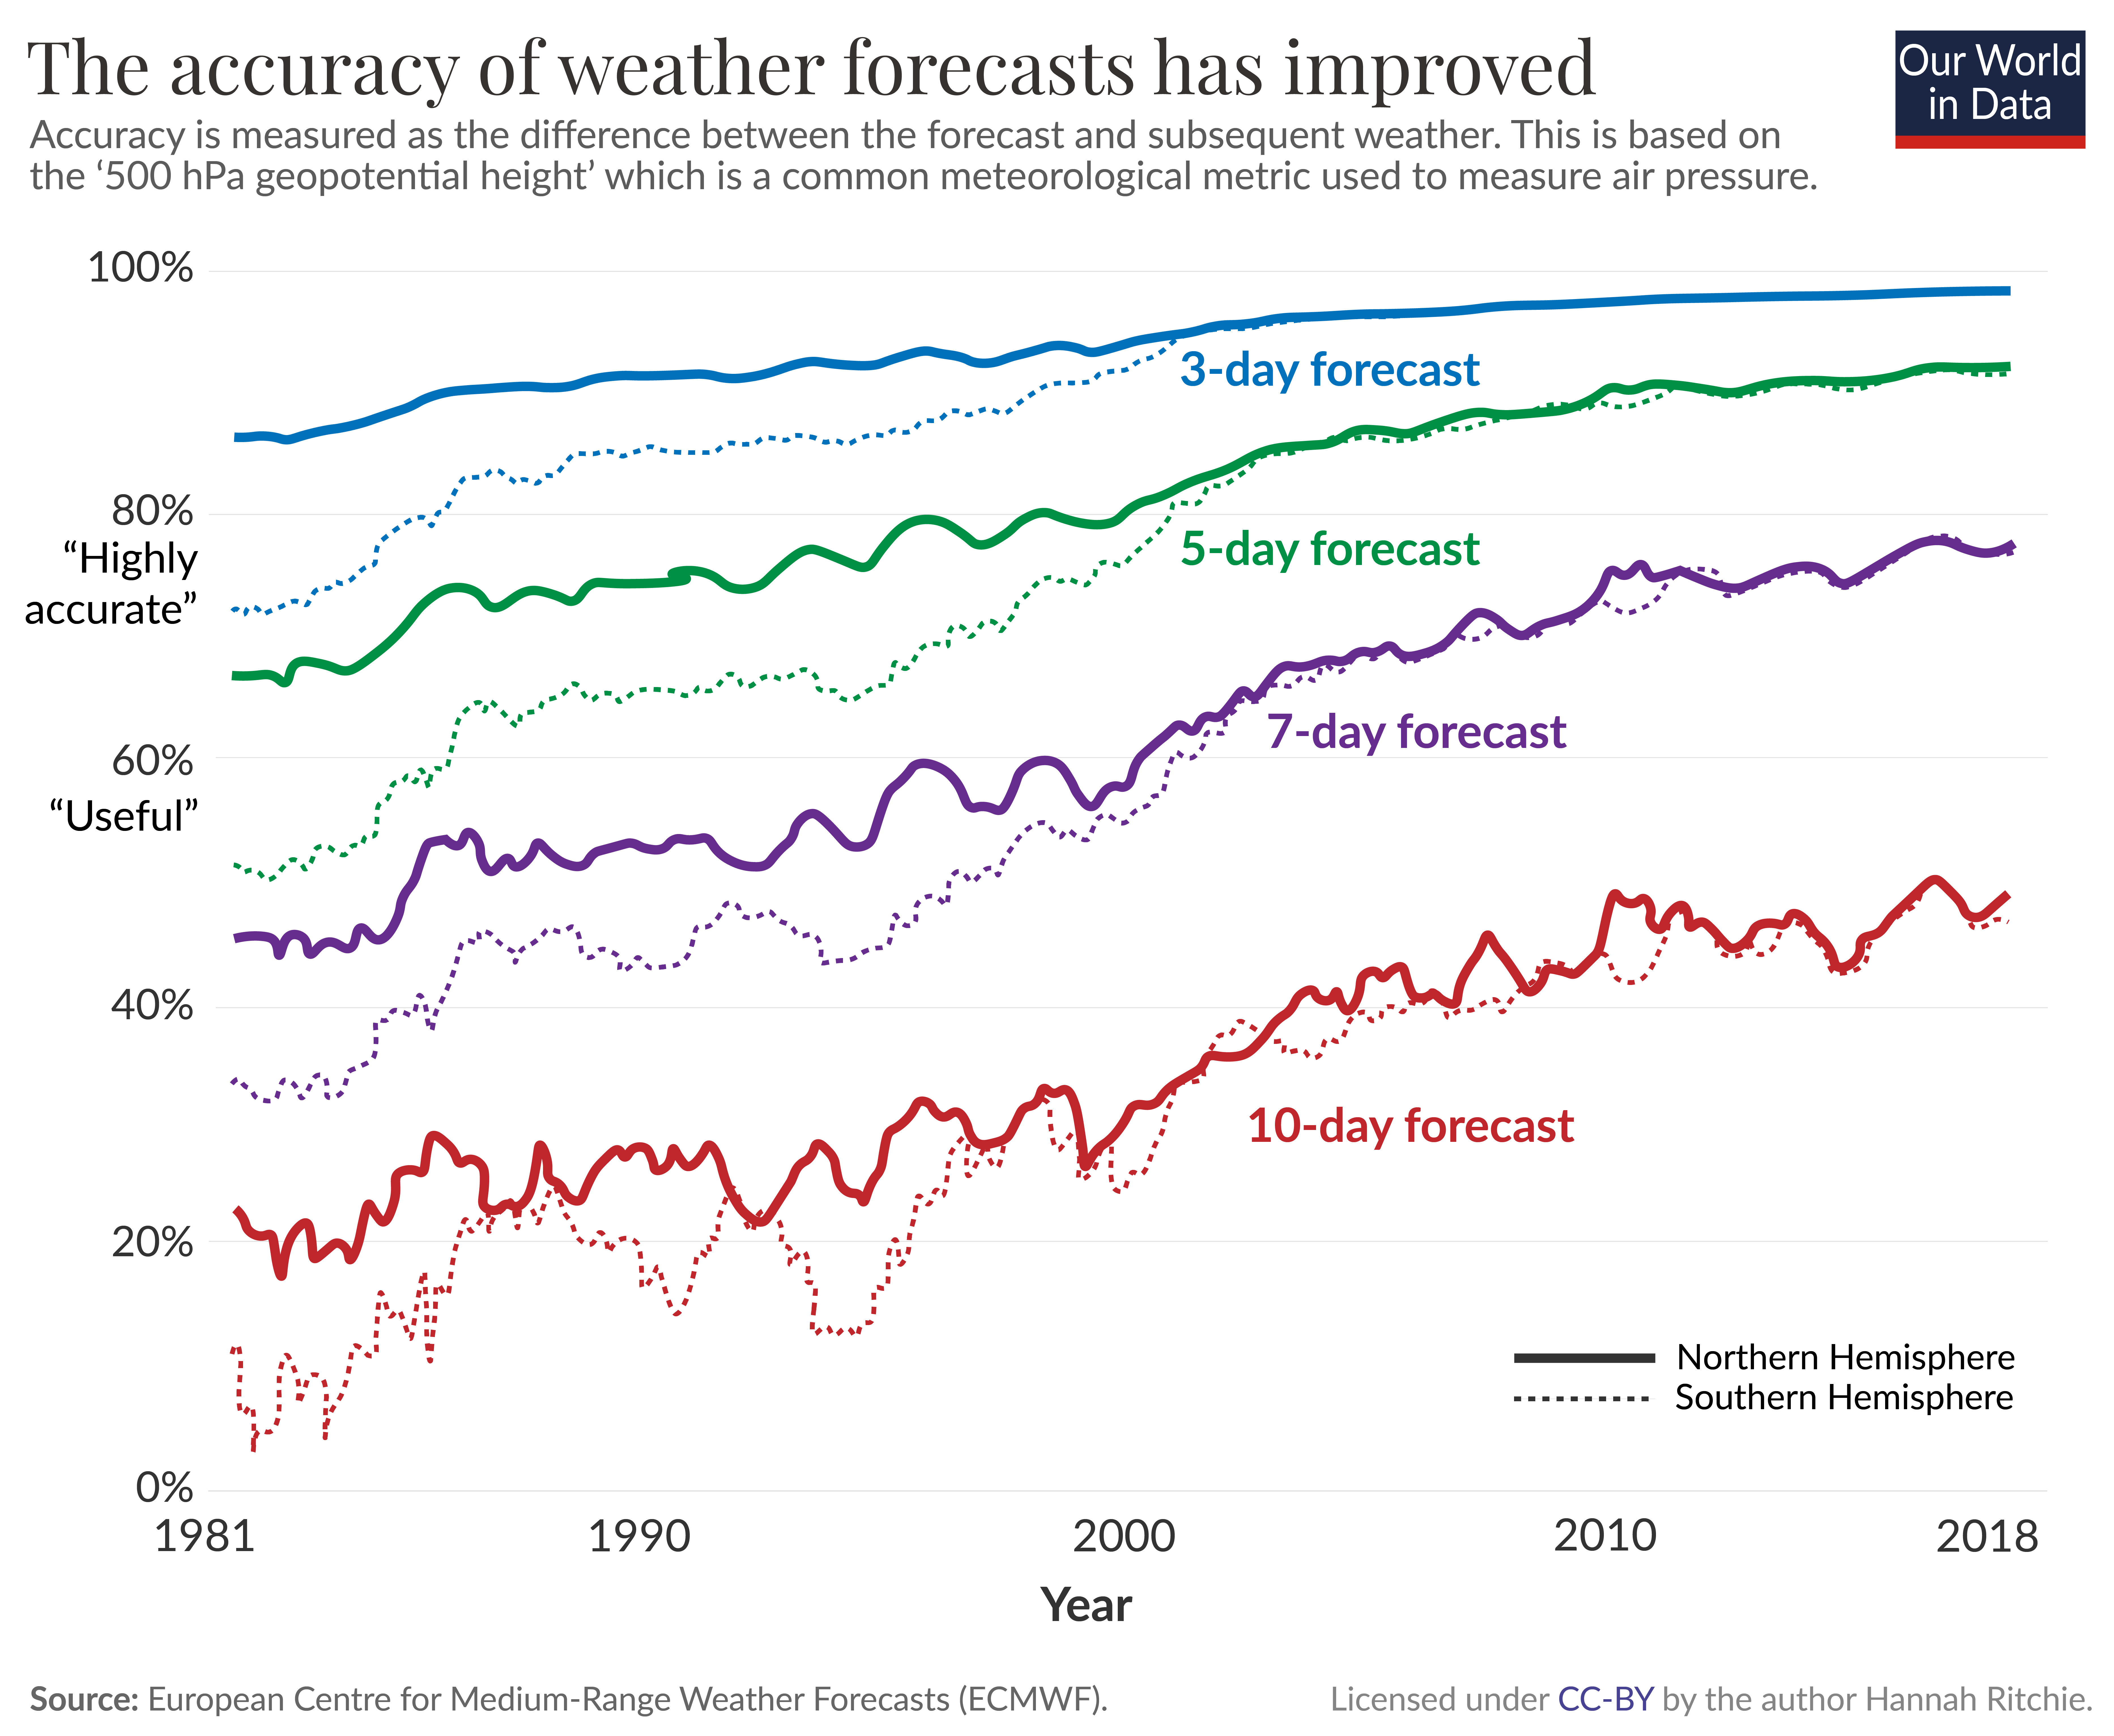
Why have weather forecasts improved?
A few key developments explain these improvements . 2
The first big change is that the data has improved. More extensive and higher-resolution observations can be used as inputs into the weather models. This is because we have more and better satellite data, and because land-based stations are covering many more areas around the globe, and at a higher density. The precision of these instruments has improved, too.
These observations are then fed into numerical prediction models to forecast the weather. That brings us to the next two developments. The computers on which these models are run have gotten much faster. Faster speeds are crucial: the Met Office now chunks the world into grids of smaller and smaller squares. While they once modeled the world in 90-kilometer-wide squares, they are now down to a grid of 1.5-kilometer squares. That means many more calculations need to be run to get this high-resolution map. The methods to turn the observations into model outputs have also improved. We’ve gone from very simple visions of the world to methods that can capture the complexity of these systems in detail.
The final crucial factor is how these forecasts are communicated. Not long ago, you could only get daily updates in the daily newspaper. With the rise of radio and TV, you could get a few notices per day. Now, we can get minute-by-minute updates online or on our smartphones.
Low-income countries have much worse forecasts, and often no early warning systems
At home in Scotland, I can open an app on my phone and get a pretty accurate 5-day forecast within seconds. Unfortunately, this quality of information isn’t available to everyone. There are large differences in weather forecasts across the world, with a large gap between rich and poor.
As the researchers Manuel Linsenmeier and Jeffrey Shrader report in a recent paper , a 7-day forecast in a rich country can be more accurate than a one-day forecast in some low-income ones. 3
While national forecasts have improved over time across all income levels, the quality gap today is almost as wide as it was in the 1980s.
There are a few reasons for this. First, far fewer land-based instruments and radiosondes measure meteorological data in poorer countries. Second, the frequency of reporting is much lower.
This is unsurprising when we look at the amount of money spent on weather and climate information. In a paper published in Science , Lucian Georgeson, Mark Maslin, and Martyn Poessinouw looked at differences in spending across income groups. 4 This includes private and public spending on commercial products that fall within the definition of “weather and climate information services”.
This is shown as the spending per person , and the spending as a share of gross domestic product (GDP) in the chart below.
Low-income countries spend 15 to 20 times less per person than high-income countries. But given the size of their economies, they actually spend more as a share of GDP.
This gap is a problem. 60% of workers in low-income countries are employed in agriculture , arguably the most weather-dependent sector. Most are small-scale farmers , who are often extremely poor.
Having accurate weather forecasts can help farmers make better decisions. They can get information on the best time to plant their crops. They know in advance when irrigation will be most needed, or when fertilizers might be at risk of being washed away. They can receive alerts about pest and disease outbreaks so they can either protect their crops when an attack is coming or save pesticides when the risk is low. That means they can use precious resources most efficiently if they have access to accurate weather forecasts. Good weather forecasts are most crucial for the poorest people in the world.
They’re also crucial for protecting against cyclones, heat waves, flooding, and storm surges. Having accurate forecasts several days in advance allows cities and communities to prepare. Housing can be protected, and emergency services can be on standby to help with the recovery.
But accurate forecasts alone don’t solve the problem: they’re only useful if they are disseminated to people so they can respond. Many of the deadliest disasters over the last few decades were accurately forecasted ahead of time. The common failure was poor communication. 5
Improving forecasts is the foundation. But these also need to be incorporated into effective early warning systems. The World Meteorological Organization estimates that around one-third of the world — predominantly the poorest countries — do not have them.
Improving forecasts — especially in low-income countries — is underrated
After the big progress in recent decades, we take good weather forecasting and dissemination for granted in large parts of the world. Making this available to everyone would make a difference.
This will be even more important as climate change increases the risks of weather-related disasters. It is ultimately the poorest, who are the more vulnerable, who will suffer the worst consequences. Better forecasts are key to good climate change adaptation.
Proper investment and financial support will be essential to close the gaps.
There also emerging technologies that could accelerate this. A recent paper published in Nature documented a new artificial intelligence (AI) system — Pangu-Weather — that can perform forecasts as accurately (or better) than leading meteorological agencies up to 10,000 times faster. 6 It was trained on 39 years of historical data. The speed of these forecasts would make them much cheaper to run and could provide much better results for countries with limited budgets.
Faster and more efficient technologies can also fill the gaps where land-based weather stations aren’t available. Sensor-carrying drones can run surveys over specific areas to build higher-resolution maps. With lower-cost and more efficient ways of turning that into forecasts, mobile technologies can disseminate this information quickly. Some companies are already sending messages to farmers in low-income countries to advise them on the best time to plant their crops.
This innovation is crucial to making countries more resilient to weather today. But it’s also essential in a world where weather is likely to get more extreme.
Acknowledgements
Many thanks to Max Roser and Edouard Mathieu for their valuable feedback and comments on this article.
These charts are sourced from the following sources: Alley, R. B., Emanuel, K. A., & Zhang, F. (2019). Advances in weather prediction. Science, 363(6425), 342-344.
The Economist (2023). The high-tech race to improve weather forecasting.
Alley, R. B., Emanuel, K. A., & Zhang, F. (2019). Advances in weather prediction. Science, 363(6425), 342-344.
Linsenmeier, Manuel & Shrader, Jeffrey G., 2023. "Global inequalities in weather forecasts," SocArXiv 7e2jf, Center for Open Science.
You might wonder how this can be true when the ECMWF forecasts have so quickly improved in both the Northern and Southern Hemisphere. This is because most countries need to develop their own forecasts to get more high-resolution predictions.
Georgeson, L., Maslin, M., & Poessinouw, M. (2017). Global disparity in the supply of commercial weather and climate information services. Science Advances, 3(5), e1602632.
De Perez, E. C., Berse, K. B., Depante, L. A. C., Easton-Calabria, E., Evidente, E. P. R., Ezike, T., ... & Van Sant, C. (2022). Learning from the past in moving to the future: Invest in communication and response to weather early warnings to reduce death and damage. Climate Risk Management, 38, 100461.
Bi, K., Xie, L., Zhang, H. et al. Accurate medium-range global weather forecasting with 3D neural networks. Nature 619, 533–538 (2023).
Cite this work
Our articles and data visualizations rely on work from many different people and organizations. When citing this article, please also cite the underlying data sources. This article can be cited as:
BibTeX citation
Reuse this work freely
All visualizations, data, and code produced by Our World in Data are completely open access under the Creative Commons BY license . You have the permission to use, distribute, and reproduce these in any medium, provided the source and authors are credited.
The data produced by third parties and made available by Our World in Data is subject to the license terms from the original third-party authors. We will always indicate the original source of the data in our documentation, so you should always check the license of any such third-party data before use and redistribution.
All of our charts can be embedded in any site.
Our World in Data is free and accessible for everyone.
Help us do this work by making a donation.
We make lives simpler, safer, and better for more than 1.5 billion people.
Turn accurate weather data into actionable business insights.
Our services help you make weather-related business decisions.
AccuWeather is global weather and digital media leader.
Elevate your ad strategy with superior reach and results.
Need specs and guidelines for your AccuWeather ad?
Access the latest resources from AccuWeather.
2019 ForecastWatch Report on Global Temperature Forecasts
October 31, 2019 • 10 min read
Winter weather forecast and disruption index overview
October 31, 2019 • 1.5 hours
Get the latest updates from AccuWeather.
AccuWeather meteorologists are available 24/7 to provide further insights and updates on evolving weather conditions. Please contact [email protected] during regular business hours, or [email protected] or call AccuWeather’s Media Hotline at (814)-235-8710 at any time to arrange interviews with AccuWeather experts or to request the most updated graphics for print or broadcast.
Risk of Numerous Severe Storms With Hail, Flooding, And Tornadoes In Central U.S.
March 30, 2024
In-App Purchases
Configure Your Subscription Product Here

AccuWeather Global Weather Center – March 30, 2024
“The main threat of severe weather on Sunday will stem from significant hail,” said AccuWeather Meteorologist Joseph Bauer. Golf ball-sized hail is possible in some of the storms on Easter Sunday.
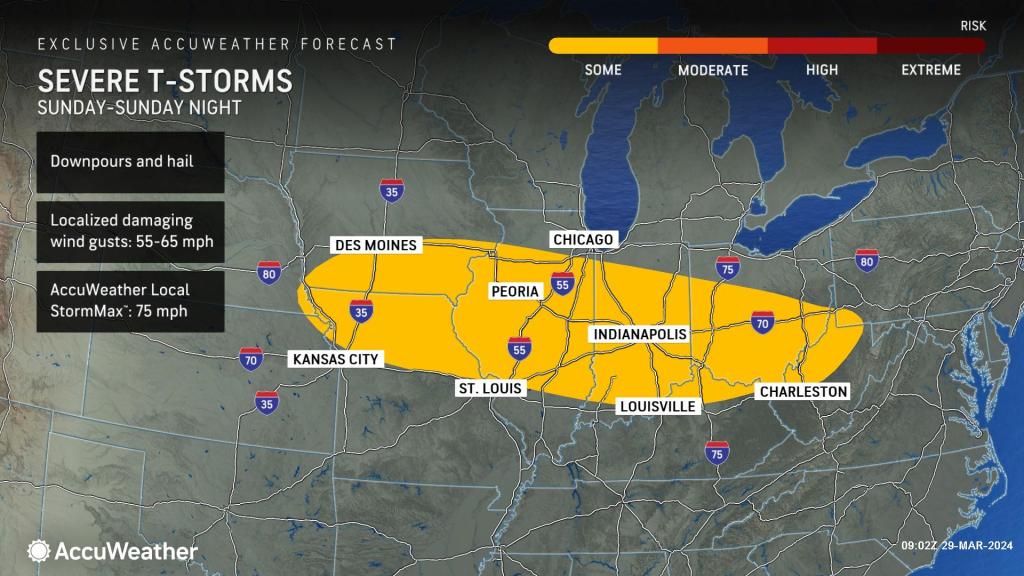
AccuWeather expert meteorologists say the severe weather threat will ramp up farther to the southwest on Monday, which could impact millions of people traveling after the holiday weekend.
The main risk of severe thunderstorms on Monday is forecast to extend from Texas to portions of Oklahoma, Louisiana, Arkansas, Mississippi, Kansas, Missouri, Tennessee, Iowa, Illinois, Indiana, and Kentucky.
Should the threat evolve to its full potential, there could be a significant severe weather outbreak on Monday with the risk of multiple, strong tornadoes.

“All modes of severe weather are possible on Monday, ranging from high winds and large hail to flash flooding and tornadoes,” said AccuWeather Chief On-Air Meteorologist Bernie Rayno. “Some of the factors favoring the eruption of severe weather on Monday include a surge of moisture from the Gulf of Mexico and stiff winds in the lower part of the atmosphere. Warm and moist air will already be in place.”
AccuWeather expert meteorologists say there is a chance that cloud cover could limit the amount of severe thunderstorms that are possible on Monday. If the region sees clear skies, or a break in the cloud cover early in the day, the risk of a severe weather outbreak is more likely.
The severe weather threat will shift eastward on Tuesday, extending from parts of Mississippi to Alabama, Georgia, Tennessee, Kentucky, Indiana, Ohio, Pennsylvania, South Carolina, North Carolina, Virginia, and Maryland.
The Atlanta, Nashville, Washington D.C., and Baltimore metro areas could be impacted by storms with damaging wind gusts and hail on Tuesday.
AccuWeather’s team of expert meteorologists is urging families and businesses, especially people traveling over the holiday weekend, to have multiple ways to receive severe weather alerts, including the AccuWeather app .
In addition to the threat of severe storms, heavy downpours could spoil outdoor plans for religious services, Easter egg hunts, barbeques, and baseball games. Flash flooding in streams, creeks, and urban areas is possible as well.
Despite the risk of flooding and severe weather impacts, AccuWeather expert meteorologists say the rain will be beneficial in parts of the Midwest. Northeast Iowa is currently experiencing extreme drought conditions.
Additional AccuWeather Resources:
The difference between tornado watches and warnings
How to protect your car from hail, this map may help save your life when there's a tornado threat.
Related Posts

Press Release
AccuWeather® and Ambient Weather® Launch the Exclusive AccuWeather Ambient Weather Station Product Line
Introducing the Official Weather Stations of AccuWeather - The Pinnacle of Hyperlocal Weather Reporting

AccuWeather Appoints Rushelle Y. Bailey As General Counsel
AccuWeather, Inc., the global leader in weather forecasting services, has appointed Rushelle Y. Bailey Esq. as General Counsel

AccuWeather Highlights AI, Risk Comms, Hyperlocal Reporting, Climate Change at AMS Annual Meeting
AccuWeather Global Weather Center - January 29 2024 - AccuWeather expert meteorologists will lead and participate in discussions on a variety of important topics related to this year's meeting theme, "Living in a Changing Environment," including combining the best elements of human expertise, AI, and machine learning in the quest for the perfect forecast; leveraging weather...

IMAGES
VIDEO
COMMENTS
Essay # 4. Difference between Weather and Climate: The differences between weather and climate are: Weather: 1. Pertains to the day-to-day state of the atmosphere at a particular place. 2. Refers to specific instant of time and place. 3. It is always changing and differs from time to time. Climate: 1. Pertains to the atmosphere over a given ...
Understanding Climate. While weather refers to short-term changes in the atmosphere, climate refers to atmospheric changes over longer periods of time, usually defined as 30 years or more. This is why it is possible to have an especially cold spell even though, on average, global temperatures are rising. The former is a weather event that takes ...
The main difference between weather and climate is duration. Weather and climate relate to one another in much the same way that an inning in a baseball game compares with the whole game. The weather is the set of conditions in the atmosphere in one location for a limited period of time—such as throughout the day, at night, or at any ...
Share: Weather is what you experience when you step outside on any given day. In other words, it is the state of the atmosphere at a particular location over the short-term. Climate is the average of the weather patterns in a location over a longer period of time, usually 30 years or more. If you've ever heard your local weathercaster say ...
Some people have come up with sayings to help explain the difference between weather and climate. Here are a few: Climate is what you expect; weather is what you get. Weather tells you what to wear each day; climate tells you what to have in your closet. Weather is the chocolate caramel truffle, climate is the whole box of chocolates.
A simple answer to this question is "climate is what you expect, weather is what you get."[1] Both weather and climate refer to local conditions (temperature, rainfall, wind strength, etc.) in a particular location or region, but the main difference between them is a matter of time.
Weather describes how the atmosphere behaves over weeks or less. Climate is how it behaves over time periods of about a month or longer. So climate refers to seasonal and longer periods, out to centuries and millennia. 2. This past winter was an especially cold and snowy one for parts of the US, Europe and elsewhere.
For climate, not only the state of the atmosphere is important but also that of the ocean, ice, land surface, and biosphere. In short: 'Climate is what you expect. Weather is what you get.' c) The Climate System. Earth's climate system consists of interacting components (Fig. 1).
Think about it this way: Climate is what you expect, weather is what you get. Weather is what you see outside on any particular day. So, for example, it may be 75° degrees and sunny or it could be 20° degrees with heavy snow. That's the weather. Climate is the average of that weather. For example, you can expect snow in the Northeast in ...
Weather forecasts are very important. They warn people of dangerous weather conditions, like big storms, which can cause flash flooding, or dry winds, which can whip up forest fires. Climate Refers to Atmospheric Conditions While weather refers to short-term changes in the lower atmosphere, climate refers to atmospheric conditions over longer ...
The difference between weather and climate is a measure of time. Weather refers to the atmospheric conditions of a specific place over a short period of time, usually 24 hours. Climate refers to the average atmospheric conditions over relatively long periods of time, usually 30 years. In other words, when one talks about the climate, then they ...
This video provides entertaining animations about the similarities and differences between weather and climate. It is very simple and fast. References are provided at the end of the video. ... Using the teaching tips, background essay, and supportive materials will help teachers work through this content with students. The video compares Utah ...
thing. The difference between weather and climate is time. Weather is what is happening right now, and climate is what you typically expect the weather in a specific location to be like for this time of year. Weather is the condition of Earth's atmosphere at a particular time and place.
Though they are closely related, weather and climate aren't the same thing. Climate is what you expect. Weather is what actually happens. What exactly is weather? More specifically, weather is the mix of events that happen each day in our atmosphere. Even though there's only one atmosphere on Earth, the weather isn't the same all around ...
Climate is the long-term pattern of weather in a particular area. Weather can change from hour-to-hour, day-to-day, month-to-month or even year-to-year. A region 's weather patterns, usually tracked for at least 30 years, are considered its climate. Climate System Different parts of the world have different climates.Some parts of the world are hot and rainy nearly every day.
What's the difference between weather and climate? Weather Weather is only temporary. For example, a blizzard can turn into a flood after just a few warm spring days. Climate, on the other hand, is more than just a few warm or cool days. Climate describes the typical weather conditions in an entire region for a very long time—30 years or more.
Climate is the average weather conditions - temperature, pressure, precipitation and humidity - expected for a certain place. Climate is based on the average weather experienced over 30 years or more. Climate refers to what is expected to happen in the atmosphere rather than the actual conditions.
Earth Science in Action. "Weather" refers to the more local changes in the climate we see around us, on short timescales from minutes to hours, to days to weeks. Examples are familiar - rain, snow, clouds, winds, thunderstorms, sleet, and hail. "Climate" refers to longer-term averages (which may be regional or global) and can be ...
The weather is observed daily; thus, it affects people's daily activities while the climate impacts agriculture and people's lifestyle. Climate has been changing from one century to another, and the globe has heavily felt its effects. Some of the important factors that cause climate change are greenhouse gases, nature, and human activities.
Understanding the difference between weather and climate can help you understand the broader patterns and changes that occur in our environment, and why they matter. What Weather Means. The term "weather" refers to the day-to-day conditions that we experience, such as daily high and low temperatures, precipitation and storm events, or humidity.
Climate is a description of the average weather conditions in a certain place for the past 30 or so years. Different areas of the world have different climates. We call these climate zones ...
Weather. Climate. 1. The day-to-day information of atmospheric changes of a particular area at a specific time is called weather. Climate is the statistical information of the average weather condition of a specific region for more than 30 years. 2. The weather of a place includes the short-term atmospheric condition.
The concepts of weather and climate are often thought to be the same thing. In this set of activities pupils will learn the difference between weather and climate by analysing different statements, by collecting and analysing their own air temperature data and in the end they will write a short climate report for the year 2050.
Climate. 1. Refers to the conditions of the atmosphere at a particular time and place. Refers to the long-term average weather patterns of a region. 2. Can change from day to day or even within hours. Changes over a longer period, typically years to centuries. 3. Describes the current state of the atmosphere.
Global climate change is not a future problem. Changes to Earth's climate driven by increased human emissions of heat-trapping greenhouse gases are already having widespread effects on the environment: glaciers and ice sheets are shrinking, river and lake ice is breaking up earlier, plant and animal geographic ranges are shifting, and plants and trees are blooming sooner.
This is shown in the chart below. 1 It shows the difference between the forecast and the actual weather outcome for forecasts 3, 5, 7, and 10 days in advance. The metric used here is the " 500 hPa geopotential height ", a commonly used meteorological measure of air pressure (which dictates weather patterns).
AccuWeather Global Weather Center - January 29 2024 - AccuWeather expert meteorologists will lead and participate in discussions on a variety of important topics related to this year's meeting theme, "Living in a Changing Environment," including combining the best elements of human expertise, AI, and machine learning in the quest for the ...
The debate over the color of Jesus' skin is one of the oldest running arguments in religion. But this Easter, the question is a serious one — for several reasons.