Before you go, check this out!
We have lots more on the site to show you. You've only seen one page. Check out this post which is one of the most popular of all time.

Data Analytic Tools That PhDs Actually Like
Graduate and doctoral students, as well as academics, should demonstrate competency in using data analysis software to conduct quantitative or qualitative studies. The use of data analytics software and platforms by students and academics to perform predictive analytics functions also has become more common. This blog post looks at some of the best data analytics software for students and academics.
This post was written by Rachel Simmons, BA (freelance writer) and Dr. Stephanie A. Bosco-Ruggiero (PhD in Social Work) on behalf of Dr. Dave Maslach for the R3ciprocity project (check out the YouTube Channel or the writing feedback software ). R3ciprocity helps students, faculty, and researchers by providing an authentic look into PhD and academic life and how to be a successful researcher. For over four years the project has been offering advice, community, and encouragement to students and researchers around the world.
When deciding which analytics software to use for analyzing quantitative or qualitative research data, you may become overwhelmed by all of the options available. Depending on the type of research and data you are collecting you will have many options. For even more tips and recommendations about software, apps, and other helpful programs for academics and students check out this recent blog at blog.r3ciprocity.com.
What is data analysis software?
Data analysis software and tools enable researchers to enter data from surveys or other data gathering tools, clean the data, analyze the data, create charts and graphics, and more. Data analysis software can be geared toward analyzing quantitative data or qualitative data. Software can be downloaded to your computer or, with some programs, used in the cloud.
Some data analytics tools are more like apps or smaller software systems. One example is GPower which can help you figure out what sample size you need to attain a certain level of power for different statistical tests. Do some research and you will find some handy apps to use in conjunction with software programs, but probably not in lieu of them.
Do students use data analysis software?
Most social science, business, life sciences, and other academic programs require students to take a research course sequence that includes an introduction to research and analysis, and more advanced use of data analytics platforms. In fact, a good graduate or doctoral program will require you to take at least two research courses and require you to learn a data analysis software program or two.
The reason this is so important is because knowing research and how to use one or more of these platforms will make you much more marketable. This is especially true in fields where some students and professionals shy away from research and research platforms. We all have a colleague or classmate, or we are this person, who dreads taking the research courses, performing statistical analyses, or even using common software. Let go of your fear, learn a platform, and break out of the pack.
It is important for all students to overcome their fears of data analytics and data analysis platforms. If you are a doctoral student, you should be confident in your ability to use a variety of tools and platforms to analyze your data, especially quantitative data. Quantitative analysis tools help us look at data that is measured in numbers and can be analyzed using statistics. Qualitative platforms help us analyze data that comes from interviews, focus groups, or other content composed of words – such as the pages of books.
What are predictive analytics ?
In the world of business and beyond the need for and use of predictive analytics tools has grown. Predictive analytics can be used in business forecasting such as examining mass stores of data and to predict trends in markets. It can also be used in business to facilitate organizational learning and help businesses plan for their future. Predictive analytics are also used in product development, marketing, finance, and equities trading. Predictive analytics employ algorithms, machine modeling, and statistics to predict future occurrences and trends.
In this vlog Dave talks about business intelligence and analytics, its origins, and what it is:
What Is Business Intell igence And Analytics? What Are Some Advantages & Disadvantages Of BI?
In the social sciences, predictive analytics can be used to predict the likelihood of certain events occurring in society or to families or individuals. For example, social work researchers or child welfare quality assurance professionals may use data analytics to predict which children and families are most at risk for welfare system involvement in the future. Data analytics may also be used in government to predict migration or in cyber security.
Predictive analytics involves mapping out and examining data to make decisions at different branches of a decision process. It is important to the process of using data analytics tools to make a hypothesis, figure out what the components of your model will be, and what exactly you are looking for. Check out this vlog where Dave talks more about data analytics, its limitations, and its use in business forecasting.
Predictive Analytics: Limitations & Importance Of Business Forecasting – Small Business Saturdays
Which software should I use for predictive analytics?
There are several software products on the market that can be used by students and academics to perform predictive analytics operations. For example, SAS is a predictive analytics software that includes features such as “optimization and simulation, text analytics, forecasting and econometrics, high-performance data mining, a model manager, and a scoring accelerator.” One of the most interesting capabilities of this software is the data mining tool which enables you to create highly accurate predictive models based on large quantities of data.
Additionally, the text analytics feature allows students and researchers to incorporate qualitative data into models and graphics. This is one of the best platforms, arguably, for analyzing data for mixed methods research projects. Utilizing SAS helps students, educators and researchers ask important questions and make predictions about impactful or even world changing events and phenomena.
Is it difficult to learn and use data analysis software?
The difficulty can vary, but the short answer is no it is not too difficult for any students who has been admitted to a graduate or doctoral program to learn a data analysis program. You may be intimidated and convince yourself you can’t do the “math’ or will not understand why you get the results that you do, but you will learn through the help of a good professor and/or lab instructor. Some of the programs are easier than others to learn because they use a point and click menu rather than depend mainly on code; but everyone learns differently and will prefer one program over another based on a number of factors.
One thing to keep in mind is that these programs are continually updated, and once you’ve been trained that training may become outdated in a few years. Check out our blog post about how to become a more productive student researcher . Trust us, use the technology you have access to and your life as a researcher will be easier and more efficient.
What are some of the most commonly used quantitative data analysis software programs?
There are many quantitative data analysis tools – too many to list here- but here are a few that are commonly used in courses, in universities, and by researchers.
IBM SPSS Statistics
SPSS employees point and click functionality, as well as syntax that allows the user to enter code, to conduct statistical analyses. Its versatile and advanced packages have many statistical analyses and operations to choose from. It is expensive however. Often universities or departments purchase a license to allow their students to use the program for free on site at the university.
If students want to use the software at home they can purchase a short-term license for a few months to a few years (see studentdiscounts.com). There are Base versions of the software and more advanced versions, and IBM continually updates the software so there is a new version almost every year. Here is a list of the statistical tests and operations available at different levels (and costs) of the program:
- Basic hypothesis testing
- Bootstrapping
- Cluster analysis
- Data access and management
- Nonparametric tests
- One-way ANOVA
- Output management
- Programmability extension
- ROC analysis
- Support for R/Python
- 2-stage least squares regression
- Bayesian statistics
- Generalized linear mixed models (GLMM)
- Generalized linear modeling (GLM)
- Loglinear analysis
- Multivariate analysis
- Nested tables
- Probit response analysis
- Quantile regression
- Repeated measures analysis
- Survival analysis
- Weighted least squares regression
- Categorical principal components analysis
- Conjoint analysis
- Decision trees
- Exact tests
- Missing values
- Multidimensional scaling and unfolding
- Multiple correspondence analysis
- Neural networks
- Regressions with optimal scaling including lasso and elastic net
- Time-series analysis
- ARIMA modeling
- CHAID & Exhaustive CHAID
- Direct marketing analysis
- Multilayer perception
- Radial basis function
- Seasonal decomposition
- Spectral analysis
- Temporal causal modeling
R Analytics
R has been gaining popularity due to the fact that it is a free and open source system that can be used on Mac, Windows, & Linux. It has many of the same capabilities as SPSS but no point and click menu. The user has to learn some code to use R and learn about what are called packages that enable the user to perform different sets of statistical tests.
R can be downloaded to your computer or you can use a cloud based version (see link above). In Stephanie’s opinion the downloadable version is a bit easier to use. Here are just a few of the operations that can be performed using R:
- Transposing data
- Pivoting/melting tables
- Creating new variables
- Recoding variables
- Bivariate linear regression
- Multivariate linear regression
- T tests (dependent/independent)
- Statistical significance
- Tables
Excel itself has become more helpful and user friendly in terms of performing statistical analyses and creating graphics, but check out XLSTAT for more advanced operations. XLSTAT is an excel add-on that can be used on Macs or PCs. It employs a point and click menu and can be integrated into Excel. XLSTAT can do as much if not more than R and SPSS including bivariate and multivariate statistics. it also offers machine modeling, predictive analytics, and risk analysis. There are different packages geared toward different fields as well, such as finance or life sciences. It is easy to export tables and graphics into Word and other Microsoft Office products using XLSTAT. Like SPSS, XLSTAT comes in different sized packages with the least expensive costing $295 and the largest at $1495 year for all specialized packages and functionalities.
Stata is another popular, mainly quantitative, data analytics program. Very popular among those in business and finance, Stata offers some unique features such as Python (programming language) and JAVA integration, and community contributed features. It provides a number of Bayesian analyses that may be more difficult to perform with other analytics software. Stata graphics and tables are very high quality. The most basic annual plan for students costs under $100. The basic packages have some limitations on numbers of variables and cases, but should be sufficient for most students’ needs.
What about qualitative data analysis software?
Qualitative analytics programs enable a user to analyze qualitative data which includes data from focus groups, interviews, texts, and other content that includes words that you want to analyze for patterns, trends, to develop a theory, track changes in a phenomena, and the list goes on. Here are a few of the best known and commonly used platforms:
- Lease a personalized single-user license for $250 or buy for $750 (teaching and research at an institution/university)
- Student license price — $99 for two years or $51 for six months
- Supports collaborative work
- Import data or surveys from Evernote or Twitter
- Offers different media types (audio, photos)
- Object Managers, the Project Explorer, and the Co-occurrence Explorer let you browse and navigate through your project data
- Visualize your findings and interpretations in a digital mind map as you go
- The interactive margin area is a unique work space in ATLAS.ti to digitally transfer data
- Data visualization tools
Nvivo
- Cost: Student price is $99 (Windows) or $85 (Mac) for twelve months
- Centralize difference formats of data by importing from various sources including social media
- Collaboration
- Transcription
- Reference management and note taking
- Coding organization
- Data visualization (frequency charts, word clouds & comparison diagrams etc.)
The bottom line
There are many other analytics software programs and tools that you can explore as well such as Tableau, Qlik (for data mining), and Provalis (qualitative). Read up on a bunch of software programs and apps, read the reviews, sign up for a free trial, and see which are best for you. Of course there are tons of books out there to help you become a pro at any of these programs, but nothing can substitute for a great lab instructor. So don’t shy away from taking that statistics class, even if you don’t have to, because these programs do it all for you – math wizardry not needed!
R3ciprocity_Team
Recent Posts
What is Operationalization in Research?
In the sciences, often we are faced with the difficult problem of not being able to explicitly measure what we theorize about. For example, it is impossible to measure things like ‘love,’...
Software, Tools, and Apps that PhDs Must Have
We often are asked to recommend some of the must have software programs, tools, and apps for PhD students, professors, and academics, so we have put together a comprehensive list. These selections...
NYU Center for Data Science
Harnessing Data’s Potential for the World
PhD in Data Science
An NRT-sponsored program in Data Science
- Areas & Faculty
- Admission Requirements
- Medical School Track
- NRT FUTURE Program
Advances in computational speed and data availability, and the development of novel data analysis methods, have birthed a new field: data science. This new field requires a new type of researcher and actor: the rigorously trained, cross-disciplinary, and ethically responsible data scientist. Launched in Fall 2017, the pioneering CDS PhD Data Science program seeks to produce such researchers who are fluent in the emerging field of data science, and to develop a native environment for their education and training. The CDS PhD Data Science program has rapidly received widespread recognition and is considered among the top and most selective data science doctoral programs in the world. It has recently been recognized by the NSF through an NRT training grant.
The CDS PhD program model rigorously trains data scientists of the future who (1) develop methodology and harness statistical tools to find answers to questions that transcend the boundaries of traditional academic disciplines; (2) clearly communicate to extract crisp questions from big, heterogeneous, uncertain data; (3) effectively translate fundamental research insights into data science practice in the sciences, medicine, industry, and government; and (4) are aware of the ethical implications of their work.
Our programmatic mission is to nurture this new generation of data scientists, by designing and building a data science environment where methodological innovations are developed and translated successfully to domain applications, both scientific and social. Our vision is that combining fundamental research on the principles of data science with translational projects involving domain experts creates a virtuous cycle: Advances in data science methodology transform the process of discovery in the sciences, and enable effective data-driven governance in the public sector. At the same time, the demands of real-world translational projects will catalyze the creation of new data science methodologies. An essential ingredient of such methodologies is that they embed ethics and responsibility by design.
These objectives will be achieved by a combination of an innovative core curriculum, a novel data assistantship mechanism that provides training of skills transfer through rotations and internships, and communication and entrepreneurship modules. Students will be exposed to a wider range of fields than in more standard PhD programs while working with our interdisciplinary faculty. In particular, we are proud to offer a medical track for students eager to explore data science as applied to healthcare or to develop novel theoretical models stemming from medical questions.
In short, the CDS PhD Data Science program prepares students to become leaders in data science research and prepares them for outstanding careers in academia or industry. Successful candidates are guaranteed financial support in the form of tuition and a competitive stipend in the fall and spring semesters for up to five years.* We invite you to learn more through our webpage or by contacting [email protected] .
*The Ph.D. program also offers students the opportunity to pursue their study and research with Data Science faculty based at NYU Shanghai. With this opportunity, students generally complete their coursework in New York City before moving full-time to Shanghai for their research. For more information, please visit the NYU Shanghai Ph.D. page .
DiscoverDataScience.org
PhD in Data Science – Your Guide to Choosing a Doctorate Degree Program

Created by aasif.faizal
Professional opportunities in data science are growing incredibly fast. That’s great news for students looking to pursue a career as a data scientist. But it also means that there are a lot more options out there to investigate and understand before developing the best educational path for you.
A PhD is the most advanced data science degree you can get, reflecting a depth of knowledge and technical expertise that will put you at the top of your field.

This means that PhD programs are the most time-intensive degree option out there, typically requiring that students complete dissertations involving rigorous research. This means that PhDs are not for everyone. Indeed, many who work in the world of big data hold master’s degrees rather than PhDs, which tend to involve the same coursework as PhD programs without a dissertation component. However, for the right candidate, a PhD program is the perfect choice to become a true expert on your area of focus.
If you’ve concluded that a data science PhD is the right path for you, this guide is intended to help you choose the best program to suit your needs. It will walk through some of the key considerations while picking graduate data science programs and some of the nuts and bolts (like course load and tuition costs) that are part of the data science PhD decision-making process.
Data Science PhD vs. Masters: Choosing the right option for you
If you’re considering pursuing a data science PhD, it’s worth knowing that such an advanced degree isn’t strictly necessary in order to get good work opportunities. Many who work in the field of big data only hold master’s degrees, which is the level of education expected to be a competitive candidate for data science positions.
So why pursue a data science PhD?
Simply put, a PhD in data science will leave you qualified to enter the big data industry at a high level from the outset.
You’ll be eligible for advanced positions within companies, holding greater responsibilities, keeping more direct communication with leadership, and having more influence on important data-driven decisions. You’re also likely to receive greater compensation to match your rank.
However, PhDs are not for everyone. Dissertations require a great deal of time and an interest in intensive research. If you are eager to jumpstart a career quickly, a master’s program will give you the preparation you need to hit the ground running. PhDs are appropriate for those who want to commit their time and effort to schooling as a long-term investment in their professional trajectory.
For more information on the difference between data science PhD’s and master’s programs, take a look at our guide here.
Topics include:
- Can I get an Online Ph.D in Data Science?
- Overview of Ph.d Coursework
Preparing for a Doctorate Program
Building a solid track record of professional experience, things to consider when choosing a school.
- What Does it Cost to Get a Ph.D in Data Science?
- School Listings

Data Science PhD Programs, Historically
Historically, data science PhD programs were one of the main avenues to get a good data-related position in academia or industry. But, PhD programs are heavily research oriented and require a somewhat long term investment of time, money, and energy to obtain. The issue that some data science PhD holders are reporting, especially in industry settings, is that that the state of the art is moving so quickly, and that the data science industry is evolving so rapidly, that an abundance of research oriented expertise is not always what’s heavily sought after.
Instead, many companies are looking for candidates who are up to date with the latest data science techniques and technologies, and are willing to pivot to match emerging trends and practices.
One recent development that is making the data science graduate school decisions more complex is the introduction of specialty master’s degrees, that focus on rigorous but compact, professional training. Both students and companies are realizing the value of an intensive, more industry-focused degree that can provide sufficient enough training to manage complex projects and that are more client oriented, opposed to research oriented.
However, not all prospective data science PhD students are looking for jobs in industry. There are some pretty amazing research opportunities opening up across a variety of academic fields that are making use of new data collection and analysis tools. Experts that understand how to leverage data systems including statistics and computer science to analyze trends and build models will be in high demand.
Can You Get a PhD in Data Science Online?
While it is not common to get a data science Ph.D. online, there are currently two options for those looking to take advantage of the flexibility of an online program.
Indiana University Bloomington and Northcentral University both offer online Ph.D. programs with either a minor or specialization in data science.
Given the trend for schools to continue increasing online offerings, expect to see additional schools adding this option in the near future.

Overview of PhD Coursework
A PhD requires a lot of academic work, which generally requires between four and five years (sometimes longer) to complete.
Here are some of the high level factors to consider and evaluate when comparing data science graduate programs.
How many credits are required for a PhD in data science?
On average, it takes 71 credits to graduate with a PhD in data science — far longer (almost double) than traditional master’s degree programs. In addition to coursework, most PhD students also have research and teaching responsibilities that can be simultaneously demanding and really great career preparation.
What’s the core curriculum like?
In a data science doctoral program, you’ll be expected to learn many skills and also how to apply them across domains and disciplines. Core curriculums will vary from program to program, but almost all will have a core foundation of statistics.
All PhD candidates will have to take a qualifying exam. This can vary from university to university, but to give you some insight, it is broken up into three phases at Yale. They have a practical exam, a theory exam and an oral exam. The goal is to make sure doctoral students are developing the appropriate level of expertise.
Dissertation
One of the final steps of a PhD program involves presenting original research findings in a formal document called a dissertation. These will provide background and context, as well as findings and analysis, and can contribute to the understanding and evolution of data science. A dissertation idea most often provides the framework for how a PhD candidate’s graduate school experience will unfold, so it’s important to be thoughtful and deliberate while considering research opportunities.
Since data science is such a rapidly evolving field and because choosing the right PhD program is such an important factor in developing a successful career path, there are some steps that prospective doctoral students can take in advance to find the best-fitting opportunity.
Join professional associations
Even before being fully credentials, joining professional associations and organizations such as the Data Science Association and the American Association of Big Data Professionals is a good way to get exposure to the field. Many professional societies are welcoming to new members and even encourage student participation with things like discounted membership fees and awards and contest categories for student researchers. One of the biggest advantages to joining is that these professional associations bring together other data scientists for conference events, research-sharing opportunities, networking and continuing education opportunities.
Leverage your social network
Be on the lookout to make professional connections with professors, peers, and members of industry. There are a number of LinkedIn groups dedicated to data science. A well-maintained professional network is always useful to have when looking for advice or letters of recommendation while applying to graduate school and then later while applying for jobs and other career-related opportunities.
Kaggle competitions
Kaggle competitions provide the opportunity to solve real-world data science problems and win prizes. A list of data science problems can be found at Kaggle.com . Winning one of these competitions is a good way to demonstrate professional interest and experience.
Internships
Internships are a great way to get real-world experience in data science while also getting to work for top names in the world of business. For example, IBM offers a data science internship which would also help to stand out when applying for PhD programs, as well as in seeking employment in the future.
Demonstrating professional experience is not only important when looking for jobs, but it can also help while applying for graduate school. There are a number of ways for prospective students to gain exposure to the field and explore different facets of data science careers.
Get certified
There are a number of data-related certificate programs that are open to people with a variety of academic and professional experience. DeZyre has an excellent guide to different certifications, some of which might help provide good background for graduate school applications.
Conferences
Conferences are a great place to meet people presenting new and exciting research in the data science field and bounce ideas off of newfound connections. Like professional societies and organizations, discounted student rates are available to encourage student participation. In addition, some conferences will waive fees if you are presenting a poster or research at the conference, which is an extra incentive to present.

It can be hard to quantify what makes a good-fit when it comes to data science graduate school programs. There are easy to evaluate factors, such as cost and location, and then there are harder to evaluate criteria such as networking opportunities, accessibility to professors, and the up-to-dateness of the program’s curriculum.
Nevertheless, there are some key relevant considerations when applying to almost any data science graduate program.
What most schools will require when applying:
- All undergraduate and graduate transcripts
- A statement of intent for the program (reason for applying and future plans)
- Letters of reference
- Application fee
- Online application
- A curriculum vitae (outlining all of your academic and professional accomplishments)
What Does it Cost to Get a PhD in Data Science?
The great news is that many PhD data science programs are supported by fellowships and stipends. Some are completely funded, meaning the school will pay tuition and basic living expenses. Here are several examples of fully funded programs:
- University of Southern California
- University of Nevada, Reno
- Kennesaw State University
- Worcester Polytechnic Institute
- University of Maryland
For all other programs, the average range of tuition, depending on the school can range anywhere from $1,300 per credit hour to $2,000 amount per credit hour. Remember, typical PhD programs in data science are between 60 and 75 credit hours, meaning you could spend up to $150,000 over several years.
That’s why the financial aspects are so important to evaluate when assessing PhD programs, because some schools offer full stipends so that you are able to attend without having to find supplemental scholarships or tuition assistance.
Can I become a professor of data science with a PhD.? Yes! If you are interested in teaching at the college or graduate level, a PhD is the degree needed to establish the full expertise expected to be a professor. Some data scientists who hold PhDs start by entering the field of big data and pivot over to teaching after gaining a significant amount of work experience. If you’re driven to teach others or to pursue advanced research in data science, a PhD is the right degree for you.
Do I need a master’s in order to pursue a PhD.? No. Many who pursue PhDs in Data Science do not already hold advanced degrees, and many PhD programs include all the coursework of a master’s program in the first two years of school. For many students, this is the most time-effective option, allowing you to complete your education in a single pass rather than interrupting your studies after your master’s program.
Can I choose to pursue a PhD after already receiving my master’s? Yes. A master’s program can be an opportunity to get the lay of the land and determine the specific career path you’d like to forge in the world of big data. Some schools may allow you to simply extend your academic timeline after receiving your master’s degree, and it is also possible to return to school to receive a PhD if you have been working in the field for some time.
If a PhD. isn’t necessary, is it a waste of time? While not all students are candidates for PhDs, for the right students – who are keen on doing in-depth research, have the time to devote to many years of school, and potentially have an interest in continuing to work in academia – a PhD is a great choice. For more information on this question, take a look at our article Is a Data Science PhD. Worth It?
Complete List of Data Science PhD Programs
Below you will find the most comprehensive list of schools offering a doctorate in data science. Each school listing contains a link to the program specific page, GRE or a master’s degree requirements, and a link to a page with detailed course information.
Note that the listing only contains true data science programs. Other similar programs are often lumped together on other sites, but we have chosen to list programs such as data analytics and business intelligence on a separate section of the website.
Boise State University – Boise, Idaho PhD in Computing – Data Science Concentration
The Data Science emphasis focuses on the development of mathematical and statistical algorithms, software, and computing systems to extract knowledge or insights from data.
In 60 credits, students complete an Introduction to Graduate Studies, 12 credits of core courses, 6 credits of data science elective courses, 10 credits of other elective courses, a Doctoral Comprehensive Examination worth 1 credit, and a 30-credit dissertation.
Electives can be taken in focus areas such as Anthropology, Biometry, Ecology/Evolution and Behavior, Econometrics, Electrical Engineering, Earth Dynamics and Informatics, Geoscience, Geostatistics, Hydrology and Hydrogeology, Materials Science, and Transportation Science.
Delivery Method: Campus GRE: Required 2022-2023 Tuition: $7,236 total (Resident), $24,573 total (Non-resident)
View Course Offerings
Bowling Green State University – Bowling Green, Ohio Ph.D. in Data Science
Data Science students at Bowling Green intertwine knowledge of computer science with statistics.
Students learn techniques in analyzing structured, unstructured, and dynamic datasets.
Courses train students to understand the principles of analytic methods and articulating the strengths and limitations of analytical methods.
The program requires 60 credit hours in the studies of Computer Science (6 credit hours), Statistics (6 credit hours), Data Science Exploration and Communication, Ethical Issues, Advanced Data Mining, and Applied Data Science Experience.
Students must also complete 21 credit hours of elective courses, a qualifying exam, a preliminary exam, and a dissertation.
Delivery Method: Campus GRE: Required 2022-2023 Tuition: $8,418 (Resident), $14,410 (Non-resident)
Brown University – Providence, Rhode Island PhD in Computer Science – Concentration in Data Science
Brown University’s database group is a world leader in systems-oriented database research; they seek PhD candidates with strong system-building skills who are interested in researching TupleWare, MLbase, MDCC, Crowd DB, or PIQL.
In order to gain entrance, applicants should consider first doing a research internship at Brown with this group. Other ways to boost an application are to take and do well at massive open online courses, do an internship at a large company, and get involved in a large open-source software project.
Coding well in C++ is preferred.
Delivery Method: Campus GRE: Required 2022-2023 Tuition: $62,680 total
Chapman University – Irvine, California Doctorate in Computational and Data Sciences
Candidates for the doctorate in computational and data science at Chapman University begin by completing 13 core credits in basic methodologies and techniques of computational science.
Students complete 45 credits of electives, which are personalized to match the specific interests and research topics of the student.
Finally, students complete up to 12 credits in dissertation research.
Applicants must have completed courses in differential equations, data structures, and probability and statistics, or take specific foundation courses, before beginning coursework toward the PhD.
Delivery Method: Campus GRE: Required 2022-2023 Tuition: $37,538 per year
Clemson University / Medical University of South Carolina (MUSC) – Joint Program – Clemson, South Carolina & Charleston, South Carolina Doctor of Philosophy in Biomedical Data Science and Informatics – Clemson
The PhD in biomedical data science and informatics is a joint program co-authored by Clemson University and the Medical University of South Carolina (MUSC).
Students choose one of three tracks to pursue: precision medicine, population health, and clinical and translational informatics. Students complete 65-68 credit hours, and take courses in each of 5 areas: biomedical informatics foundations and applications; computing/math/statistics/engineering; population health, health systems, and policy; biomedical/medical domain; and lab rotations, seminars, and doctoral research.
Applicants must have a bachelor’s in health science, computing, mathematics, statistics, engineering, or a related field, and it is recommended to also have competency in a second of these areas.
Program requirements include a year of calculus and college biology, as well as experience in computer programming.
Delivery Method: Campus GRE: Required 2022-2023 Tuition: $10,858 total (South Carolina Resident), $22,566 total (Non-resident)
View Course Offerings – Clemson
George Mason University – Fairfax, Virginia Doctor of Philosophy in Computational Sciences and Informatics – Emphasis in Data Science
George Mason’s PhD in computational sciences and informatics requires a minimum of 72 credit hours, though this can be reduced if a student has already completed a master’s. 48 credits are toward graduate coursework, and an additional 24 are for dissertation research.
Students choose an area of emphasis—either computer modeling and simulation or data science—and completed 18 credits of the coursework in this area. Students are expected to completed the coursework in 4-5 years.
Applicants to this program must have a bachelor’s degree in a natural science, mathematics, engineering, or computer science, and must have knowledge and experience with differential equations and computer programming.
Delivery Method: Campus GRE: Required 2022-2023 Tuition: $13,426 total (Virginia Resident), $35,377 total (Non-resident)
Harrisburg University of Science and Technology – Harrisburg, Pennsylvania Doctor of Philosophy in Data Sciences
Harrisburg University’s PhD in data science is a 4-5 year program, the first 2 of which make up the Harrisburg master’s in analytics.
Beyond this, PhD candidates complete six milestones to obtain the degree, including 18 semester hours in doctoral-level courses, such as multivariate data analysis, graph theory, machine learning.
Following the completion of ANLY 760 Doctoral Research Seminar, students in the program complete their 12 hours of dissertation research bringing the total program hours to 36.
Delivery Method: Campus GRE: Required 2022-2023 Tuition: $14,940 total
Icahn School of Medicine at Mount Sinai – New York, New York Genetics and Data Science, PhD
As part of the Biomedical Science PhD program, the Genetics and Data Science multidisciplinary training offers research opportunities that expand on genetic research and modern genomics. The training also integrates several disciplines of biomedical sciences with machine learning, network modeling, and big data analysis.
Students in the Genetics and Data Science program complete a predetermined course schedule with a total of 64 credits and 3 years of study.
Additional course requirements and electives include laboratory rotations, a thesis proposal exam and thesis defense, Computer Systems, Intro to Algorithms, Machine Learning for Biomedical Data Science, Translational Genomics, and Practical Analysis of a Personal Genome.
Delivery Method: Campus GRE: Not Required 2022-2023 Tuition: $31,303 total
Indiana University-Purdue University Indianapolis – Indianapolis, Indiana PhD in Data Science PhD Minor in Applied Data Science
Doctoral candidates pursuing the PhD in data science at Indiana University-Purdue must display competency in research, data analytics, and at management and infrastructure to earn the degree.
The PhD is comprised of 24 credits of a data science core, 18 credits of methods courses, 18 credits of a specialization, written and oral qualifying exams, and 30 credits of dissertation research. All requirements must be completed within 7 years.
Applicants are generally expected to have a master’s in social science, health, data science, or computer science.
Currently a majority of the PhD students at IUPUI are funded by faculty grants and two are funded by the federal government. None of the students are self funded.
IUPUI also offers a PhD Minor in Applied Data Science that is 12-18 credits. The minor is open to students enrolled at IUPUI or IU Bloomington in a doctoral program other than Data Science.
Delivery Method: Campus GRE: Required 2022-2023 Tuition: $9,228 per year (Indiana Resident), $25,368 per year (Non-resident)
Jackson State University – Jackson, Mississippi PhD Computational and Data-Enabled Science and Engineering
Jackson State University offers a PhD in computational and data-enabled science and engineering with 5 concentration areas: computational biology and bioinformatics, computational science and engineering, computational physical science, computation public health, and computational mathematics and social science.
Students complete 12 credits of common core courses, 12 credits in the specialization, 24 credits of electives, and 24 credits in dissertation research.
Students may complete the doctoral program in as little as 5 years and no more than 8 years.
Delivery Method: Campus GRE: Required 2022-2023 Tuition: $8,270 total
Kennesaw State University – Kennesaw, Georgia PhD in Analytics and Data Science
Students pursuing a PhD in analytics and data science at Kennesaw State University must complete 78 credit hours: 48 course hours and 6 electives (spread over 4 years of study), a minimum 12 credit hours for dissertation research, and a minimum 12 credit-hour internship.
Prior to dissertation research, the comprehensive examination will cover material from the three areas of study: computer science, mathematics, and statistics.
Successful applicants will have a master’s degree in a computational field, calculus I and II, programming experience, modeling experience, and are encouraged to have a base SAS certification.
Delivery Method: Campus GRE: Required 2022-2023 Tuition: $5,328 total (Georgia Resident), $19,188 total (Non-resident)
New Jersey Institute of Technology – Newark, New Jersey PhD in Business Data Science
Students may enter the PhD program in business data science at the New Jersey Institute of Technology with either a relevant bachelor’s or master’s degree. Students with bachelor’s degrees begin with 36 credits of advanced courses, and those with master’s take 18 credits before moving on to credits in dissertation research.
Core courses include business research methods, data mining and analysis, data management system design, statistical computing with SAS and R, and regression analysis.
Students take qualifying examinations at the end of years 1 and 2, and must defend their dissertations successfully by the end of year 6.
Delivery Method: Campus GRE: Required 2022-2023 Tuition: $21,932 total (New Jersey Resident), $32,426 total (Non-resident)
New York University – New York, New York PhD in Data Science
Doctoral candidates in data science at New York University must complete 72 credit hours, pass a comprehensive and qualifying exam, and defend a dissertation with 10 years of entering the program.
Required courses include an introduction to data science, probability and statistics for data science, machine learning and computational statistics, big data, and inference and representation.
Applicants must have an undergraduate or master’s degree in fields such as mathematics, statistics, computer science, engineering, or other scientific disciplines. Experience with calculus, probability, statistics, and computer programming is also required.
Delivery Method: Campus GRE: Required 2022-2023 Tuition: $37,332 per year
View Course Offering
Northcentral University – San Diego, California PhD in Data Science-TIM
Northcentral University offers a PhD in technology and innovation management with a specialization in data science.
The program requires 60 credit hours, including 6-7 core courses, 3 in research, a PhD portfolio, and 4 dissertation courses.
The data science specialization requires 6 courses: data mining, knowledge management, quantitative methods for data analytics and business intelligence, data visualization, predicting the future, and big data integration.
Applicants must have a master’s already.
Delivery Method: Online GRE: Required 2022-2023 Tuition: $16,794 total
Stevens Institute of Technology – Hoboken, New Jersey Ph.D. in Data Science
Stevens Institute of Technology has developed a data science Ph.D. program geared to help graduates become innovators in the space.
The rigorous curriculum emphasizes mathematical and statistical modeling, machine learning, computational systems and data management.
The program is directed by Dr. Ted Stohr, a recognized thought leader in the information systems, operations and business process management arenas.
Delivery Method: Campus GRE: Required 2022-2023 Tuition: $39,408 per year
University at Buffalo – Buffalo, New York PhD Computational and Data-Enabled Science and Engineering
The curriculum for the University of Buffalo’s PhD in computational and data-enabled science and engineering centers around three areas: data science, applied mathematics and numerical methods, and high performance and data intensive computing. 9 credit course of courses must be completed in each of these three areas. Altogether, the program consists of 72 credit hours, and should be completed in 4-5 years. A master’s degree is required for admission; courses taken during the master’s may be able to count toward some of the core coursework requirements.
Delivery Method: Campus GRE: Required 2022-2023 Tuition: $11,310 per year (New York Resident), $23,100 per year (Non-resident)
University of Colorado Denver – Denver, Colorado PhD in Big Data Science and Engineering
The University of Colorado – Denver offers a unique program for those students who have already received admission to the computer science and information systems PhD program.
The Big Data Science and Engineering (BDSE) program is a PhD fellowship program that allows selected students to pursue research in the area of big data science and engineering. This new fellowship program was created to train more computer scientists in data science application fields such as health informatics, geosciences, precision and personalized medicine, business analytics, and smart cities and cybersecurity.
Students in the doctoral program must complete 30 credit hours of computer science classes beyond a master’s level, and 30 credit hours of dissertation research.
The BDSE fellowship requires students to have an advisor both in the core disciplines (either computer science or mathematics and statistics) as well as an advisor in the application discipline (medicine and public health, business, or geosciences).
In addition, the fellowship covers full stipend, tuition, and fees up to ~50k for BDSE fellows annually. Important eligibility requirements can be found here.
Delivery Method: Campus GRE: Required 2022-2023 Tuition: $55,260 total
University of Marylan d – College Park, Maryland PhD in Information Studies
Data science is a potential research area for doctoral candidates in information studies at the University of Maryland – College Park. This includes big data, data analytics, and data mining.
Applicants for the PhD must have taken the following courses in undergraduate studies: programming languages, data structures, design and analysis of computer algorithms, calculus I and II, and linear algebra.
Students must complete 6 qualifying courses, 2 elective graduate courses, and at least 12 credit hours of dissertation research.
Delivery Method: Campus GRE: Required 2022-2023 Tuition: $16,238 total (Maryland Resident), $35,388 total (Non-resident)
University of Massachusetts Boston – Boston, Massachusetts PhD in Business Administration – Information Systems for Data Science Track
The University of Massachusetts – Boston offers a PhD in information systems for data science. As this is a business degree, students must complete coursework in their first two years with a focus on data for business; for example, taking courses such as business in context: markets, technologies, and societies.
Students must take and pass qualifying exams at the end of year 1, comprehensive exams at the end of year 2, and defend their theses at the end of year 4.
Those with a degree in statistics, economics, math, computer science, management sciences, information systems, and other related fields are especially encouraged, though a quantitative degree is not necessary.
Students accepted by the program are ordinarily offered full tuition credits and a stipend ($25,000 per year) to cover educational expenses and help defray living costs for up to three years of study.
During the first two years of coursework, they are assigned to a faculty member as a research assistant; for the third year students will be engaged in instructional activities. Funding for the fourth year is merit-based from a limited pool of program funds
Delivery Method: Campus GRE: Required 2022-2023 Tuition: $18,894 total (in-state), $36,879 (out-of-state)
University of Nevada Reno – Reno, Nevada PhD in Statistics and Data Science
The University of Nevada – Reno’s doctoral program in statistics and data science is comprised of 72 credit hours to be completed over the course of 4-5 years. Coursework is all within the scope of statistics, with titles such as statistical theory, probability theory, linear models, multivariate analysis, statistical learning, statistical computing, time series analysis.
The completion of a Master’s degree in mathematics or statistics prior to enrollment in the doctoral program is strongly recommended, but not required.
Delivery Method: Campus GRE: Required 2022-2023 Tuition: $5,814 total (in-state), $22,356 (out-of-state)
University of Southern California – Los Angles, California PhD in Data Sciences & Operations
USC Marshall School of Business offers a PhD in data sciences and operations to be completed in 5 years.
Students can choose either a track in operations management or in statistics. Both tracks require 4 courses in fall and spring of the first 2 years, as well as a research paper and courses during the summers. Year 3 is devoted to dissertation preparation and year 4 and/or 5 to dissertation defense.
A bachelor’s degree is necessary for application, but no field or further experience is required.
Students should complete 60 units of coursework. If the students are admitted with Advanced Standing (e.g., Master’s Degree in appropriate field), this requirement may be reduced to 40 credits.
Delivery Method: Campus GRE: Required 2022-2023 Tuition: $63,468 total
University of Tennessee-Knoxville – Knoxville, Tennessee The Data Science and Engineering PhD
The data science and engineering PhD at the University of Tennessee – Knoxville requires 36 hours of coursework and 36 hours of dissertation research. For those entering with an MS degree, only 24 hours of course work is required.
The core curriculum includes work in statistics, machine learning, and scripting languages and is enhanced by 6 hours in courses that focus either on policy issues related to data, or technology entrepreneurship.
Students must also choose a knowledge specialization in one of these fields: health and biological sciences, advanced manufacturing, materials science, environmental and climate science, transportation science, national security, urban systems science, and advanced data science.
Applicants must have a bachelor’s or master’s degree in engineering or a scientific field.
All students that are admitted will be supported by a research fellowship and tuition will be included.
Many students will perform research with scientists from Oak Ridge national lab, which is located about 30 minutes drive from campus.
Delivery Method: Campus GRE: Required 2022-2023 Tuition: $11,468 total (Tennessee Resident), $29,656 total (Non-resident)
University of Vermont – Burlington, Vermont Complex Systems and Data Science (CSDS), PhD
Through the College of Engineering and Mathematical Sciences, the Complex Systems and Data Science (CSDS) PhD program is pan-disciplinary and provides computational and theoretical training. Students may customize the program depending on their chosen area of focus.
Students in this program work in research groups across campus.
Core courses include Data Science, Principles of Complex Systems and Modeling Complex Systems. Elective courses include Machine Learning, Complex Networks, Evolutionary Computation, Human/Computer Interaction, and Data Mining.
The program requires at least 75 credits to graduate with approval by the student graduate studies committee.
Delivery Method: Campus GRE: Not Required 2022-2023 Tuition: $12,204 total (Vermont Resident), $30,960 total (Non-resident)
University of Washington Seattle Campus – Seattle, Washington PhD in Big Data and Data Science
The University of Washington’s PhD program in data science has 2 key goals: training of new data scientists and cyberinfrastructure development, i.e., development of open-source tools and services that scientists around the world can use for big data analysis.
Students must take core courses in data management, machine learning, data visualization, and statistics.
Students are also required to complete at least one internship that covers practical work in big data.
Delivery Method: Campus GRE: Required 2022-2023 Tuition: $17,004 per year (Washington resident), $30,477 (non-resident)
University of Wisconsin-Madison – Madison, Wisconsin PhD in Biomedical Data Science
The PhD program in Biomedical Data Science offered by the Department of Biostatistics and Medical Informatics at UW-Madison is unique, in blending the best of statistics and computer science, biostatistics and biomedical informatics.
Students complete three year-long course sequences in biostatistics theory and methods, computer science/informatics, and a specialized sequence to fit their interests.
Students also complete three research rotations within their first two years in the program, to both expand their breadth of knowledge and assist in identifying a research advisor.
Delivery Method: Campus GRE: Required 2022-2023 Tuition: $10,728 total (in-state), $24,054 total (out-of-state)
Vanderbilt University – Nashville, Tennessee Data Science Track of the BMI PhD Program
The PhD in biomedical informatics at Vanderbilt has the option of a data science track.
Students complete courses in the areas of biomedical informatics (3 courses), computer science (4 courses), statistical methods (4 courses), and biomedical science (2 courses). Students are expected to complete core courses and defend their dissertations within 5 years of beginning the program.
Applicants must have a bachelor’s degree in computer science, engineering, biology, biochemistry, nursing, mathematics, statistics, physics, information management, or some other health-related field.
Delivery Method: Campus GRE: Required 2022-2023 Tuition: $53,160 per year
Washington University in St. Louis – St. Louis, Missouri Doctorate in Computational & Data Sciences
Washington University now offers an interdisciplinary Ph.D. in Computational & Data Sciences where students can choose from one of four tracks (Computational Methodologies, Political Science, Psychological & Brain Sciences, or Social Work & Public Health).
Students are fully funded and will receive a stipend for at least five years contingent on making sufficient progress in the program.
Delivery Method: Campus GRE: Required 2022-2023 Tuition: $59,420 total
Worcester Polytechnic Institute – Worcester, Massachusetts PhD in Data Science
The PhD in data science at Worcester Polytechnic Institute focuses on 5 areas: integrative data science, business intelligence and case studies, data access and management, data analytics and mining, and mathematical analysis.
Students first complete a master’s in data science, and then complete 60 credit hours beyond the master’s, including 30 credit hours of research.
Delivery Method: Campus GRE: Required 2022-2023 Tuition: $28,980 per year
Yale University – New Haven, Connecticut PhD Program – Department of Stats and Data Science
The PhD in statistics and data science at Yale University offers broad training in the areas of statistical theory, probability theory, stochastic processes, asymptotics, information theory, machine learning, data analysis, statistical computing, and graphical methods. Students complete 12 courses in the first year in these topics.
Students are required to teach one course each semester of their third and fourth years.
Most students complete and defend their dissertations in their fifth year.
Applicants should have an educational background in statistics, with an undergraduate major in statistics, mathematics, computer science, or similar field.
Delivery Method: Campus GRE: Required 2022-2023 Tuition: $46,900 total
- Related Programs

- Skip to content
AnalyticsDegrees.org
PhD in Data Analytics Programs

On This Page:
You’re an analytics professional with a talent for research. You’re considering a PhD in Data Analytics as the next logical step in your career, but you’d like to know more about the practicals. Explore different types of analytics doctorates . Dig into details on timelines , coursework , and the dissertation process . Learn about admissions requirements and funding options , including fully-funded doctorates. Find answers to questions about online degrees and employment avenues after graduation. Or skip ahead to our listings of all the PhD in Data Analytics programs in the country.
What Are PhD in Data Analytics Programs?
A PhD in Data Analytics or a closely related field is an interdisciplinary doctorate that focuses on cutting-edge research in the realms of advanced analytics, statistical computing, big data, and data science. Doctoral students in analytics:
- Push the boundaries of analytics in order to solve complex societal & organizational problems and transform decision-making
- Train to be expert practitioners in big data technologies, newly developed statistical methods, and “out of the box” analytical thinking
- Become analytics & data science professors at universities, senior analytics consultants in industry, and government advisors
Can You Earn a PhD in Data Analytics?
Yes. Doctoral programs in data analytics are available, but they are rare. The most popular title for a degree in the realm of data is the PhD in Data Science . Data science is a highly inventive field that builds on analytical foundations, so it makes sense to consider a doctoral program that focuses on innovation & self-guided discoveries.
When you do find a PhD with the word “analytics” in the title , you’re still going to be looking at a doctorate that intersects with the field of data science. Massive data sets, complicated analytics processes, sophisticated predictive models—doctoral students in analytics are schooled in all of these areas (and more).
Note: PhD programs are focused on original research and high-level thinking. If you want a workplace qualification, consider a Master’s in Data Analytics .
Types of Data Analytics Doctorate Programs
We’ve listed some common titles for doctorates in analytics, but we recommend you check the curriculum links in our listings and learn which department/s are offering the program. You should also look up the faculty’s research interests to see if they align with your own ideas for PhD projects. For example:
- If the degree is offered by the Department of Computer Science, a PhD in Data Analytics might be heavy on research into ethics, bias, AI, and building intelligent systems.
- If the degree is offered in partnership with the School of Business, a PhD in Data Analytics could be preoccupied with Machine Learning (ML), risk analysis, and econometrics.
The title of the PhD plays second fiddle to the department.
PhD in Analytics
A PhD in Analytics can often cut across multiple data-driven domains. Think of fields like Business Analytics, Data Science, Operations Research, and more. For instance, at the University of Notre Dame , doctoral students in analytics are able to access a large number of analytics research labs (e.g. gaming, human behavior, data & society, business, etc.) and collaborate with all kinds of partners.
PhD in Big Data Analytics
Doctorates in Big Data Analytics tend to focus on advanced systems & technologies that deal with processing big data (e.g. statistical computing, data mining, etc.), as well as their applications to real-world problems. Some universities, like the University of South Florida , are also interested in examining the human & social implications of analytics (e.g. ethical usage).
PhD in Analytics & Data Science
A PhD in Analytics and Data Science or a PhD in Data Science, Analytics & Engineering is a way for universities to combine data expertise from multiple departments. Yes, advanced analytics & big data processes will be addressed in the curriculum. But you’ll also find a strong emphasis on programming, algorithm creation, and systems development.
PhD in Data Science
Doctoral programs in data science may have more of a “design & develop” feel than analytics doctorates. In addition to exploring advanced analytics & big data applications, PhD in Data Science students are often interested in designing new information systems & tools (e.g. dashboards), creating their own algorithms & models, and exploring the boundaries of AI & Machine Learning (ML).
Note: Interested in industry & corporate analytics applications? Check out the guide to the PhD in Business Analytics .
How Doctorates in Data Analytics Work: Curriculum & Dissertation
Degree structure.
PhD programs in data analytics contain 6 key elements that take 4-5 years to complete on a full-time schedule. You will have to tackle each stage (e.g. core coursework) before you can proceed to the next one (e.g. qualifying exam).
Core Coursework
Qualifying/comprehensive exam, dissertation proposal, dissertation, dissertation defense.
- Year 1: Core coursework and first-year research papers. Assignment of a faculty mentor.
- Year 2: Core coursework, electives, second-year research papers, and the qualifying exam.
- Year 3: Any remaining coursework. Preparing research projects for publication. Dissertation proposal.
- Year 4: Dissertation work under the guidance of a dissertation advisor and advisory committee.
- Year 5: Dissertation work. Research papers & conference submissions. Dissertation defense.
Sample Curriculum
A PhD in Data Analytics or a closely related field will always contain a set of courses in advanced analytics & data science subjects. These courses can come from multiple departments (e.g. Computer Science, Mathematics & Statistics, Industrial Engineering, Psychology, etc.). Examples include:
- Big Data Analytics
- Data Mining
- Theoretical Statistics
- Statistical Computing
- Machine Learning
- Database Systems
- Information Assurance & Security
These are just a few sample course titles! Use the curriculum links in our listings to get a feel for each program’s unique flavor.
Once you’ve tackled the fundamentals of core coursework , you’ll usually be able to choose high-level electives in your particular research interests. For instance, the University of Central Florida offers electives in:
- Advanced computing (e.g. Parallel & Cloud Computation)
- Sophisticated analytics applications (e.g. Interactive Data Visualization)
- Industries (e.g. Industrial Engineering Analytics for Healthcare)
With some programs, you can customize your doctorate to a remarkable extent.
A qualifying exam is designed to test your knowledge of core coursework . It might take the form of a traditional exam, a paper and/or a project. For example, at the University of South Florida , PhD students are required to report on the results of a real-world, big data analytics project and include codes & systems that were developed in the process.
You’ll be required to develop an original idea for a research- or project-based dissertation and present your dissertation proposal to a dissertation advisory committee—experienced faculty members and (occasionally) outside experts who are interested in your area of work.
- A research-based dissertation will explore new realms of analytics research and potential applications.
- A project-based dissertation will involve work on a real-life project—this may be created at a research center or be suggested by an industry partner.
The dissertation proposal often takes the form of a written outline and an oral defense/presentation. If the committee accepts your proposal, you can get to work on your dissertation.
A PhD dissertation is a piece of original research that makes a significant contribution to the theory & practice of a field. In the world of data analytics & data science, dissertations can be research-based or project-based.
Dissertation Titles
Examples of real-life PhD in Data Analytics & Data Science dissertation titles include:
- A Credit Analysis of the Unbanked and Underbanked: An Argument for Alternative Data
- Novel Statistical and Machine Learning Methods for the Forecasting and Analysis of Major League Baseball Player Performance
- Optimal Analytical Methods for High Accuracy Cardiac Disease Classification and Treatment Based on ECG Data
- The Intelligent Management of Crowd-Powered Machine Learning
- Forecasting the Prices of Cryptocurrencies using a Novel Parameter Optimization of VARIMA Models
- Classification with Large Sparse Datasets: Convergence Analysis and Scalable Algorithms
While you are writing up your dissertation, many universities will also expect you to be submitting related research papers to peer-reviewed journals & industry conferences.
The final step in the PhD process is the dissertation defense. You’ll be required to present your dissertation findings to your dissertation advisory committee and defend your research ideas in an oral & visual presentation. This will be followed by questions and a discussion.
It’s not as intimidating as it sounds. By this stage in your education, you will know your research inside-out and will have brainstormed many of the potential questions with your dissertation advisor. You can prepare for a defense by observing other student defenses, practicing with mock presentations, and reading up on the work of committee members.
PhD in Data Analytics: Admissions
Doctorate in data analytics: what it takes to get in.
Every PhD program in data analytics is going to have a unique set of admissions requirements! When you’re putting together a shortlist of doctorates, use the admissions links in our listings to save yourself time & trouble. You can decide if the program suits your level of expertise and education.
Doctoral programs in tech-driven disciplines—especially ones that are fully funded —are extremely competitive. You can stand out from the crowd by:
- Examining your entire application to see if you can make up for weaknesses (e.g. lower grades) with strengths (e.g. real-world projects)
- Matching your research interests to the university, department & research labs offering the program
- Collaborating with experienced analytics practitioners to co-author papers & publications
- Attending industry events and making connections that will help in your research
- Earning professional certificates to fill in any skills gaps
Degree Requirements
Your degree should be in a discipline that’s relevant to your area of research interest in the PhD. For a data analytics doctorate, that might mean a degree in statistics, data analytics, computer science, economics, or similar. The standard GPA requirement is 3.0 GPA or higher.
- Bachelor’s Degree Entry: Some doctoral programs in data analytics & data science are willing to consider applicants with a bachelor’s degree.
- Master’s Degree Entry: Some doctoral programs are only looking for candidates with a master’s degree.
If you’re an undergraduate and you like the look of a PhD that only accepts master’s candidates, ask the program coordinator if you can earn an MS through the same university. Most doctoral programs have a “Master’s Along the Way” option.
Skills & Proficiencies
PhD candidates in analytics must be ready to tackle advanced coursework and high-level research. So universities will usually want to see evidence of proficiency/course credits in:
- Statistics, calculus & linear algebra
- Common analytical programming languages (e.g. R, Python, SAS, etc.)
- Analytics fundamentals (e.g. database management systems)
If you don’t have an undergraduate or master’s degree in analytics or a closely related field, universities will be poring over your transcripts & résumé to make sure you can handle any technical coursework.
General Requirements
In addition to your degree transcripts, almost all PhD programs in data analytics & data science fields will want to see:
- GRE or GMAT scores
- Letters of recommendation
- Statement of purpose
- TOEFL scores for non-English speaking international applicants
PhD in Data Analytics: Tuition & Funding
How to fund the phd.
Doctoral programs in data analytics & data science fall into 2 broad categories:
- Fully funded PhD programs
- Tuition-driven PhD programs
As you might expect, fully funded doctorate programs at strong universities are hard to get into!
Fully Funded PhD Programs
A number of STEM doctorates at research universities are fully funded. The university will waive all tuition costs and provide you with a living stipend as compensation for teaching & research activities. Many PhD students work as Teaching Assistants (TAs) and Research Assistant (RAs) during their doctoral studies.
Talk to the PhD program coordinator and check the fine print when you’re considering these programs.
- You may (or may not) qualify for on-campus housing and university health insurance.
- You may (or may not) qualify for conference stipends, overseas internships, and other perks.
- You may (or may not) be expected to pay for miscellaneous university fees.
- You may receive funding for Years 1-4 of your degree, but Year 5 support could be conditional on strong academic performance.
Tuition-Driven PhD Programs
You’ll also find doctoral programs in analytics & data science that do not offer any funding. They’ll expect you to pay for the degree out of your own pocket. At a private university, a PhD could cost upwards of $60,000-$80,000 in tuition alone.
So tread carefully! If you don’t qualify for fully funded PhD programs and you believe that a doctorate is essential for your career goals, consider applying to a PhD program at a public university in your state—UCF’s in-state tuition for a PhD in Big Data Analytics is very reasonable.
You will also need to look into postgraduate loans, private scholarships & fellowships, employer reimbursement, and teaching & research job opportunities to offset your costs.
Online PhD in Data Analytics Programs
Can you earn an online phd in data analytics.
Yes—but we would caution against them. There are a few universities that offer online doctorates in data analytics, but they tend to be for-profit (e.g. Colorado Tech) or focused on executive-level training instead of research (e.g. DBA in Data Analytics from the University of the Southwest).
You’ll have a little more luck in finding online doctorates in data science, but they still won’t be offered by top-tier universities.
Why Are Online PhD Programs in Analytics Hard to Find?
Prestigious research universities & high-ranking schools are very cautious about maintaining their reputation for quality. They want doctoral students in data analytics & data science to:
- Attend classes in advanced topics, ask questions, and follow-up with faculty
- Have unfettered access to the university’s research centers, labs, and technical facilities
- Be able to teach undergraduates and conduct research in-person
- Meet with their dissertation advisor on a regular basis
- Network with visiting experts and fellow students
We agree with them. At this level, we highly recommend you choose an on-campus doctoral degree.
Career Prospects for PhD in Data Analytics Graduates
A PhD in Data Analytics or a closely related field is a super-specialized degree. You don’t need a doctorate to pursue a career in analytics & data science. Many senior-level practitioners simply have a degree like a Master’s in Data Analytics (or a similar title) and a lot of on-the-job experience.
However, a doctorate in analytics is an excellent choice for aspiring:
- University Professors: If you wish to teach analytics & data science at a college or university, you will probably need a research-focused doctorate. At the University of Notre Dame, 80% of its PhD in Analytics graduates go into academia.
- High-Level Researchers: PhD graduates work in think tanks, industry research labs, and university research centers where exciting discoveries are taking place.
- Data Science & Analytics Consultants: You may wish to act in an advisory capacity for Wall Street, Silicon Valley, and other major centers of industry.
- Senior Research Positions: Some jobs in major tech companies, data-intensive businesses & financial companies (e.g. Senior Statistician) will require top-level research skills.
PhD Data Analytics FAQs
What should i look for in a data analytics doctoral program.
When you’re starting to put together a shortlist of doctoral programs, consider the following aspects:
- Funding Options: The best choice is going to be a fully funded PhD from a highly ranked & highly regarded university that includes teaching & research assistantships.
- Departmental Reputation: Which schools & departments are offering the degree? What kinds of unique benefits do they offer students? How much research funding do they receive?
- Faculty Expertise: Faculty profiles will be posted on the PhD program website. Read their bios, meet them for a virtual coffee, and learn more about their research & industry work. These people will become your advisors & mentors.
- Access to Resources: Will you have access to top-of-the-line analytics tools, commercial resources, and large-scale infrastructures? Can you work on projects within a major analytics research lab or center?
- Career Preparation: A strong PhD program will prepare you for the job market after graduation. Does the curriculum include opportunities for you to submit research papers to peer-reviewed journals? Does it offer stipends for conference travel? Does it bring in visiting experts for seminars?
What is a STEM Doctorate?
STEM stands for Science, Technology, Engineering & Mathematics. A STEM doctorate is any PhD—including the PhD in Data Analytics and the PhD in Data Science—that contains at least 50% of coursework in these fields.
- Are you an international student? Ask if the doctoral program has a “STEM designation” from the U.S. Department of Homeland Security (DHS). Students on an F-1 Visa can apply for Optional Practical Training (OPT) /temporary employment after graduation. Having a STEM-designated degree extends the OPT period from 12 months to 36 months.
- STEM programs often receive a fair amount of funding from the government and private industries. That means universities may be able to offer fully funded PhD programs to multiple students.
Is a PhD in Data Analytics Worth It?
Only if you have a specific career goal in mind. A PhD in Data Analytics or a closely related field is going to be time-consuming, challenging, and heavy on research. At least 4-5 years of your life will be devoted to earning it, so you and your family need to be prepared for the journey.
Unsure about your decision? Talk to analytics professionals who have already gone through the PhD gauntlet. You’ll find doctoral graduates on LinkedIn, at industry conferences , and within faculty directories on university websites. Be prepared to talk to them about your research interests and your goals.
All Phd in Data Analytics Programs
Arizona state university.
School of Computing and Augmented Intelligence
Tempe, Arizona
PhD in Data Science, Analytics, and Engineering
University of arizona.
Department of Biosystems Engineering
Tucson, Arizona
PhD in Biosystems Analytics & Technology
University of central florida.
College of Sciences
Orlando, Florida
University of South Florida-Main Campus
Muma College of Business
Tampa, Florida
Georgia State University
Robinson College of Business
Atlanta, Georgia
PhD in Business Administration & Digital Innovation - Data Science & Analytics
Kennesaw state university.
School of Data Science and Analytics
Kennesaw, Georgia
Doctor of Philosophy in Analytics and Data Science
University of notre dame.
Mendoza College of Business
Notre Dame, Indiana
University of Kansas
School of Business
Lawrence, Kansas
PhD in Analytics and Operations
Central michigan university.
College of Science and Engineering
Mount Pleasant, Michigan
PhD in Statistics and Analytics
North carolina, north carolina state university at raleigh.
Center for Geospatial Analytics
Raleigh, North Carolina
PhD in Geospatial Analytics
Pennsylvania, pennsylvania state university-main campus.
College of the Liberal Arts
University Park, Pennsylvania
PhD in Human Development and Family Studies and Social Data Analytics
Phd in informatics and social data analytics, phd in political science and social data analytics, phd in psychology and social data analytics, phd in social data analytics, phd in sociology and social data analytics, phd in statistics and social data analytics.
DEPARTMENT OF STATISTICS AND DATA SCIENCE
Phd program, phd program overview.
The doctoral program in Statistics and Data Science is designed to provide students with comprehensive training in theory and methodology in statistics and data science, and their applications to problems in a wide range of fields. The program is flexible and may be arranged to reflect students' interests and career goals. Cross-disciplinary work is encouraged. The PhD program prepares students for careers as university teachers and researchers and as research statisticians or data scientists in industry, government and the non-profit sector.
Requirements
Students are required to fulfill the Department requirements in addition to those specified by The Graduate School (TGS).
From the Graduate School’s webpage outlining the general requirements for a PhD :
In order to receive a doctoral degree, students must:
- Complete all required coursework. .
- Gain admittance to candidacy.
- Submit a prospectus to be approved by a faculty committee.
- Present a dissertation with original research. Review the Dissertation Publication page for more information.
- Complete the necessary teaching requirement
- Submit necessary forms to file for graduation
- Complete degree requirements within the approved timeline
PhD degrees must be approved by the student's academic program. Consult with your program directly regarding specific degree requirements.
The Department requires that students in the Statistics and Data Science PhD program:
- Meet the department minimum residency requirement of 2 years
- STAT 344-0 Statistical Computing
- STAT 350-0 Regression Analysis
- STAT 353-0 Advanced Regression (new 2021-22)
- STAT 415-0 I ntroduction to Machine Learning
- STAT 420-1,2,3 Introduction to Statistical Theory and Methodology 1, 2, 3
- STAT 430-1, STAT 430-2, STAT 440 (new courses in 2022-23 on probability and stochastic processes for statistics students)
- STAT 457-0 Applied Bayesian Inference
Students generally complete the required coursework during their first two years in the PhD program. *note that required courses changed in the 2021-22 academic year, previous required courses can be found at the end of this page.
- Pass the Qualifying Exam. This comprehensive examination covers basic topics in statistics and is typically taken in fall quarter of the second year.
Pass the Prospectus presentation/examination and be admitted for PhD candidacy by the end of year 3 . The statistics department requires that students must complete their Prospectus (proposal of dissertation topic) before the end of year 3, which is earlier than The Graduate School deadline of the end of year 4. The prospectus must be approved by a faculty committee comprised of a committee chair and a minimum of 2 other faculty members. Students usually first find an adviser through independent studies who will then typically serve as the committee chair. When necessary, exceptions may be made upon the approval of the committee chair and the director of graduate studies, to extend the due date of the prospectus exam until the end of year 4.
- Successfully complete and defend a doctoral dissertation. After the prospectus is approved, students begin work on the doctoral dissertation, which must demonstrate an original contribution to a chosen area of specialization. A final examination (thesis defense) is given based on the dissertation. Students typically complete the PhD program in 5 years.
- Attend all seminars in the department and participate in other research activities . In addition to these academic requirements, students are expected to participate in other research activities and attend all department seminars every year they are in the program.
Optional MS degree en route to PhD
Students admitted to the Statistics and Data Science PhD program can obtain an optional MS (Master of Science) degree en route to their PhD. The MS degree requires 12 courses: STAT 350-0 Regression Analysis, STAT 353 Advanced Regression, STAT 420-1,2,3 Introduction to Statistical Theory and Methodology 1, 2, 3, STAT 415-0 I ntroduction to Machine Learning , and at least 6 more courses approved by the department of which two must be 400 level STAT elective courses, no more than 3 can be non-STAT courses. For the optional MS degree, students must also pass the qualifying exam offered at the beginning of the second year at the MS level.
*Prior to 2021-2022, the course requirements for the PhD were:
- STAT 351-0 Design and Analysis of Experiments
- STAT 425 Sampling Theory and Applications
- MATH 450-1,2 Probability 1, 2 or MATH 450-1 Probability 1 and IEMS 460-1,2 Stochastic Processes 1, 2
- Six additional 300/400 graduate-level Statistics courses, at least two must be 400 -level
- Skip to primary navigation
- Skip to main content
- Skip to primary sidebar
PhD in Data Analytics Programs
A PhD in data analytics prepares professionals to work in data-driven fields, including research, business, healthcare, and government.
The most common reason people pursue a PhD in a data-related field is that they are passionate about data and would like to have a career that involves research and making discoveries, usually within a sub-field.
Data analytics PhD programs allow students to get an in-depth knowledge of research methods and topics they will use throughout their careers. Like other research-oriented doctoral degrees, a PhD in analytics is most often pursued by people interested in academic careers.
Ad techguide.org is an advertising-supported site. Clicking in this box will show you programs related to your search from schools that compensate us. This compensation does not influence our school rankings, resource guides, or other information published on this site. Got it! Featured Data Analytics Doctorate
Although, increasingly, data analytics PhDs are also employed by technology companies to help improve products, services, or business opportunities.
If you are curious to know more about research in the field of data and analytics, these research interests can be divided majorly into two different areas — methods and applications.
Applications of a PhD in Analytics
Examples of research that improves methods and techniques of data utilization.
Method-based data analytics PhD research focuses on gaining a deeper understanding of algorithms used in analytics. This method of research can involve any of the following:
- Research involving understanding algorithms has led to tremendous growth in analytical tools with improved deep-learning performances on large-scale data.
- Researchers have also been investing their time in understanding methods to collect data with a low signal-to-noise ratio, working with incomplete data, or generating synthetic data to understand natural phenomena where data is not readily available or rare. Few others involve researching methods of combining data from sources that aren’t of the same type, e.g., voice data with self-reported psychiatric questionnaires to understand mood and emotions.
- As people and organizations are highly aware of how crucial data can be, there have been increasing reports of data thefts and fraud, which leaves vulnerable people at a loss. One area of research crucial in the data world is ethics and data privacy.
- With the explosive growth of data, ongoing research has made tremendous growth in developing storage systems to improve data availability with consistency in real-time analysis.
Examples of research that utilize data-related techniques to improve or create applications in a given field
Another common data analytics PhD research area involves understanding how other scientists, researchers, and practitioners apply data analytics to other fields. These areas of applications range widely, not just limited to finance or medicine but also “social good” projects.
Examples of research in social good projects solve specific crisis-related challenges, such as responses to natural and human-made disasters in search and rescue missions and the outbreak of disease. Other examples include using analytics to solve environmental challenges, education, criminal justice, etc.
Best PhD in Data Analytics Degree Programs for 2024
Florida atlantic university, grand canyon university, kennesaw state university, university of central florida, university of massachusetts boston, university of south florida, university of the southwest.
These rankings were compiled from data accessed in December 2023 from Integrated Post-Secondary Education Data System (IPEDS) and College Navigator (both services National Center for Education Statistics). Tuition data was pulled from individual university websites and is current as of December 2023. If available, we also use additional criteria such as accreditation or designations by outside organizations or agencies.
PhD in Data Analytics Curriculum
A PhD in data analytics has an intensive academic workload, generally completed between four and five years. Since the data industry has emerged only in the last decade, institutions that provide Ph.D. solely in data analytics are hard to find. Data analytics-related specialization is tied to either STEM or business-related research programs.
Components of PhD in Data Analytics
Here is a general overview of the requirements that are needed to complete this degree program:
Credit Requirements
Every PhD program has requirements to complete a certain amount of credits. These credits could be related to foundational or advanced-level qualitative and quantitative methods in statistics.
Based on your interest and flexibility in the program, the institution may offer you an option of cognate courses. The course curriculum is similar to the master’s-level program with few additions of research-related classes.
Pre-Candidacy Research Projects
The first one or two years in the program prepare you for admission to candidacy by working on research projects. These research projects also help you develop the skills necessary to frame questions and solve real-world data problems.
Preliminary or Qualifying Examination
Every PhD program requires its students to go through a qualifying exam. These exams test their skills to meet candidacy requirements. These pre-candidacy exams assist in fulfilling the requirement of having the theoretical and practical knowledge needed to work on your research project.
Teaching Requirement
Almost all PhD programs require the students to teach undergraduate-level courses or assist the professor in their teaching classes. These opportunities and experiences prepare you for an academic career.
Dissertation Proposal
The dissertation proposal contains the hypothesis of your research that should meet the standards of publications in data analytics. The proposal needs to be approved by the committee of faculty members before any proceedings to work on it.
Successful Dissertation Defense
Students are expected to present their original work on the dissertation proposal. They are expected to be experts in their data-related dissertation topic and defend their analysis. This is an important aspect of your PhD in analytics as it signifies that the student has successfully grasped all the necessary skills required to conduct their own independent research post-degree completion.
Optional Requirements
A Ph.D. is not just about taking credits and completing qualifying exams. During this program, there are many opportunities that a student is likely to benefit from. Attending data analytics conferences and getting internships during school breaks help students exchange research knowledge and form social connections necessary for job search.
Since the data field evolves at a much faster rate, it keeps students abreast of the latest trends in the data industry. Conferences are likely to provide students with discounted academic prices to attend them. Online platforms like Kaggle give opportunities to network, form teams, and participate in online challenges to showcase your skills.
Some institutions can provide you with a data analytics master’s degree if you can complete more than two years of your program but cannot continue further.
PhD in Data Analytics Online
There are many online educational opportunities available, especially in higher education. Like a PhD in data analytics online, online degrees offer a wide range of flexibility in terms of timing, workflow, and geographic location.
Leading universities offer programs that can bring the best of their faculty research to the masses. Many great data analytics master’s programs are now entirely online.
But, there are fewer than 100 percent PhD in data analytics programs online (although more are being created and launched to meet the uptick in demand and because educational formats are changing rapidly).
One of the main reasons doctoral programs are still taught mainly in traditional settings is that they require much collaborative research. Most data analytics PhD programs also require some teaching component, which is not primarily handled in person.
But the world is changing fast, and colleges and universities are adapting quickly to both the needs of students and the needs of an evolving workforce. So stay tuned, and keep track of updates to your favorite data analytics programs. Be sure to ask about remote or online options and possibilities when contacting traditional in-person programs.
PhD in Big Data Analytics
Big data is a term that was popularized in the last decade and refers to the classification and organization of massive data sets.
The reason experts or PhDs can wrangle big data is that the world continues to produce new data at an exponential rate.
By way of illustration, consider this statistic about creating new data; according to the site Statista , “The total amount of data created, captured, copied, and consumed globally is forecast to increase rapidly, reaching 64.2 zettabytes in 2020.
Over the next five years up to 2025, global data creation is projected to grow to more than 180 zettabytes. In 2020, the amount of data created and replicated reached a new high.” For reference, the amount of data collected worldwide in 2010 was estimated to be two zettabytes.
There is a lot of enthusiasm about the trends and patterns found within massive data sets. Researchers in healthcare and agriculture are working with big data to find answers to questions ranging from cancer outcomes to crop outputs.
Given the new research opportunities made possible by big data, it makes sense that a specialty Ph.D. in big data analytics is emerging in university analytics graduate programs.
Career Paths for Data Analytics PhDs
As we mentioned initially, there are many potential career pathways for data analytics PhDs. This kind of degree often has a home in academia, but businesses and organizations are increasingly looking for researchers and practitioners of data analytics.
Academic Positions
- Appointed to the research staff, whose primary goals are to extend their education and experience. Although they hold a doctoral degree, they are not considered independent researchers and cannot serve as principal investigators. Some teaching duties may also be required. Positions are often for a fixed term ranging from six months to three years.
- Average Salary: $85,959
- Typically the first step to tenure and conducting independent research. Once they complete tenure, they may be given the title of a professor. The tenure track is often a long journey of evaluating an associate professor’s publications, research, and teaching. The tenure track lasts somewhere between five to seven years.
- Average Salary: $80,057
Industry Positions
- By wrangling with data to develop meaningful insights, data scientists help organizations find and solve problems related to products or services. Combining computer science, statistics, and business knowledge, data scientists assist organizations in making objective decisions using data-driven strategies.
- Average Salary: $122,738
- Unlike data scientists or data engineers, research scientists don’t work on product development. Instead, they design and conduct experiments by developing hypotheses and measuring the outcome of their experiments.
- Average Salary: $119,165
- A chief analytics officer leads an organization’s data analytics strategy, driving data-related business changes and working with data scientists in developing data-related products.
- Average Salary: $151,203
Frequently Asked Questions
Many top-tier universities require professors, researchers, and principal investigators to have a doctoral degree. A PhD is relevant if you are looking for a career in academia. However, it is not necessary to have a PhD to gain entry into data analytics unless you are looking into specific research roles in the industry. There is a minimal difference in the salary outcome of an individual getting a PhD versus someone who has a master’s degree in analytics.
If the institution cannot fund your PhD program, checking out external funding sources and scholarships before admission is highly recommended.
Most institutions need you to have a bachelor’s degree in a quantitative field. Work experience may also be preferred by not necessary. Strong research interest is recommended to gain admission.
Since PhD degree programs are research-oriented, an applicant’s GPA does play an essential role in the admissions process. Some universities have a minimum GPA cutoff, while others request that applicants complete undergraduate-level mathematics and statistics courses with a minimum grade.
This question is tricky to answer. Some universities encourage getting in touch with the professor to see if they are open to admitting new PhD students for the upcoming academic year. Other university programs clearly state that contacting professors during the admissions process is unnecessary. You can still express your desire to work with a specific professor in your statement of purpose during the application process if contacting professors directly is not allowed.
Related Resources
- Data Science PhD Programs
- PhD Programs in Business Analytics
- Find a Degree, Certification, Bootcamp, or a Career in Analytics
- Tech Degrees
- PhD in Information Technology Programs
PhD Assistance
Explain the skills needed for phd data analysis. and explain how this activity enriches the researcher’s experience.
- Data analysis is the critical part of any research. Data analysis summarizes already collected data.
- It is the process that involves the interpretation of data gathered through the use of analytical and logical reasoning to determine the patterns, relationships and trends on the research topic selected.
- Each field, in PhD Statistical Data Analysis , has its specialist skills. Besides, there are a handful of key skills which are essential to successful research.
Project Management skill
Every Research requires project management skill, the five major phase of project management include conception and initiation, planning, execution, performance/monitoring, and project close. It is the process of high-quality planning before beginning the project. This step is nothing but making a step by step plan on how you intend to reach the final goal for your research.
Tasks as a project manager are likely the following: Gathering required information, deliverables, and timeframes from completion of work Planning your resources. You set achievable aims, realistic techniques to achieve the goals and identify other necessary resources such as human resources and finances.
It is a crucial phase; you need to complete research work to receive external funding and to get your project off the ground. PhD Data Analytics Consultant asks for history, observe, ask questions and learn as much as possible before the starting to give a quality result.
Handling Budgets
Next critical skill is learning how to manage your budget effectively. If applying for research funding, you must say about the plan and how spending money on this project will help you to answer your research question. So developing the budget is the perfect start to plan your project. Best PhD Data Analytics Consultant helps in framing a reasonable budget that shows the assessors to have thought about your research in-depth to frame and, if it is over well, it can serve as an excellent, convincing overview of the project.
It would be a useless task if you did not do this step with in-depth research. If it is so gain some further knowledge of handling budgets or else make use of PhD Data Analytics Services expertise to lead your research project.
Simple steps to create a budget for research
List your activities:
Prepare a list of procedures that you planned to do in your research, how you are going to achieve it. To make a list, put a flowchart of methodology and make a list of methodology name and its allowance. The plan must be something like points that provides all the needed information for funding.
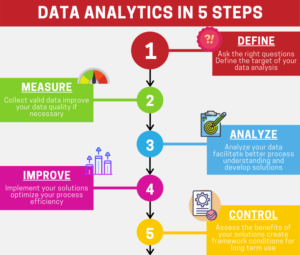
Recheck the rules:
Once you’ve listed everything you want to research, go back and recheck the specific rules for budgets. What is allowed? And what isn’t? The funding scheme won’t pay for equipment usage– you’ll need to fund. Some schemes won’t invest people. Others won’t fund travel. So, It is essential to check what you need for your project. It is just an important part to know what you can include in the application that you are writing right now.
Cost each item:
Give the cost list of every item included in the plan. Find a reasonable cost. Are you going to conduct an interview with the people and do the statistical analysis on your own? If so, How much time? What is the plan for teaching? What is your salary for that period, or how much will it cost to hire a replacement source? PhD Data Thesis Statistics Help work out what level is required to employ them, and find out how much that costs.
If you are going to work with the research assistant from Dissertation Consulting for PhD Students, Know how long you need a research assistant to work for your project.
Justify it:
For each item in the budget section, you should justify the reason for money and justifying how that process will effectively increase the value of research. The budget justification links budget to your project and plans again and again. Best PhD Programmers in Data Analysis pick each item used in your budget justification to get a clearer view.
Team Leading/Managing:
Providing full strength is difficult in the academic world. However, the research project requires support from others to lead the project. There are two things to consider to manage research, how to get the best out of the study and how to take the practical application out of the research. PhD Data Analytics Consultant Services assess current needs and vulnerabilities that are needed to lead the research successfully.
Handling Data:
Handling the data is depends on the result you gain from the project, which includes lab experiments, statistical evidence and interview. Whatever may be the result, you should handle a large amount of data. Without sufficient data skill, you will never get the existing stage of analyzing your research. Start with organizing the paper-based data storage system. Organize store your hard copies of raw materials. Keep records of who is involved in collecting the data.
If you on go Quantitative Research or a Qualitative type of Research , it is challenging to analyze your gathered data accurately. If there is a need to publish your paper in a reputed journal, then must consult expert service to guide in various stages of writing to get a quality article. You can feel tension free when we are supporting you. Now you can leave data analysis trouble to PhD Statistical Consulting & Data Analysis to get a solution for the problem related to your academic writing.
References:
- Assarroudi, A., Heshmati Nabavi, F., Armat, M. R., Ebadi, A., & Vaismoradi, M. (2018). Directed qualitative content analysis: the description and elaboration of its underpinning methods and data analysis process, 23(1), 42-55.
- Murdoch-Eaton, D., Drewery, S., Elton, S., Emmerson, C., Marshall, M., Smith, J. A., … & Whittle, S. (2010). What do medical researchers understand by research and research skills? Identifying research opportunities within undergraduate projects. Medical Teacher, 32(3), e152-e160.
- Bazeley, P. (2013). Qualitative data analysis: Practical strategies. Sage.
Quick Contact

- Adversial Attacks
- Artificial Intelligence
- Artificial Intelligence (AI) and ML ( Machine Learning )
- Big Data Analysis
- Business and Management
- Categories of Research methodology – PhDAssistance
- Category of Research Proposal Services
- coding & algorithm
- Computer Data Science
- Category of Machine Learning – PhDassistance
- Computer Science/Research writing/Manuscript
- Course Work Service
- Data Analytics
- Data Processing
- Deep Networks
- Dissertation Statistics
- economics dissertation
- Editing Services
- Electrical Engineering Category
- Engineering & Technology
- finance dissertation writing
- Gap Identification
- Healthcare Dissertation Writing
- Intrusion-detection-system
- journals publishing
- Life Science Dissertation writing services
- literature review service
- Machine Learning
- medical thesis writing
- Peer review
- PhD Computer Programming
- PhD Dissertation
- Phd Journal Manuscript
- Annotated Bibliography
- PhD Publication Support
- Phd thesis writing services
- Phd Topic Selection
- Categories of PhdAssistance Dissertation
- Power Safety
- problem identification
- Quantitative Analysis
- quantitative research
- Recent Trends
- Referencing and Formatting
- Research Gap
- research journals
- Research Methodology
- research paper
- Research Proposal Service
- secondary Data collection
- Statistical Consulting Services
- Uncategorized
PhD Assistance | Blog
Cornell University does not offer a separate Masters of Science (MS) degree program in the field of Statistics. Applicants interested in obtaining a masters-level degree in statistics should consider applying to Cornell's MPS Program in Applied Statistics.
Choosing a Field of Study
There are many graduate fields of study at Cornell University. The best choice of graduate field in which to pursue a degree depends on your major interests. Statistics is a subject that lies at the interface of theory, applications, and computing. Statisticians must therefore possess a broad spectrum of skills, including expertise in statistical theory, study design, data analysis, probability, computing, and mathematics. Statisticians must also be expert communicators, with the ability to formulate complex research questions in appropriate statistical terms, explain statistical concepts and methods to their collaborators, and assist them in properly communicating their results. If the study of statistics is your major interest then you should seriously consider applying to the Field of Statistics.
There are also several related fields that may fit even better with your interests and career goals. For example, if you are mainly interested in mathematics and computation as they relate to modeling genetics and other biological processes (e.g, protein structure and function, computational neuroscience, biomechanics, population genetics, high throughput genetic scanning), you might consider the Field of Computational Biology . You may wish to consider applying to the Field of Electrical and Computer Engineering if you are interested in the applications of probability and statistics to signal processing, data compression, information theory, and image processing. Those with a background in the social sciences might wish to consider the Field of Industrial and Labor Relations with a major or minor in the subject of Economic and Social Statistics. Strong interest and training in mathematics or probability might lead you to choose the Field of Mathematics . Lastly, if you have a strong mathematics background and an interest in general problem-solving techniques (e.g., optimization and simulation) or applied stochastic processes (e.g., mathematical finance, queuing theory, traffic theory, and inventory theory) you should consider the Field of Operations Research .
Residency Requirements
Students admitted to PhD program must be "in residence" for at least four semesters, although it is generally expected that a PhD will require between 8 and 10 semesters to complete. The chair of your Special Committee awards one residence unit after the satisfactory completion of each semester of full-time study. Fractional units may be awarded for unsatisfactory progress.
Your Advisor and Special Committee
The Director of Graduate Studies is in charge of general issues pertaining to graduate students in the field of Statistics. Upon arrival, a temporary Special Committee is also declared for you, consisting of the Director of Graduate Studies (chair) and two other faculty members in the field of Statistics. This temporary committee shall remain in place until you form your own Special Committee for the purposes of writing your doctoral dissertation. The chair of your Special Committee serves as your primary academic advisor; however, you should always feel free to contact and/or chat with any of the graduate faculty in the field of Statistics.
The formation of a Special Committee for your dissertation research should serve your objective of writing the best possible dissertation. The Graduate School requires that this committee contain at least three members that simultaneously represent a certain combination of subjects and concentrations. The chair of the committee is your principal dissertation advisor and always represents a specified concentration within the subject & field of Statistics. The Graduate School additionally requires PhD students to have at least two minor subjects represented on your special committee. For students in the field of Statistics, these remaining two members must either represent (i) a second concentration within the subject of Statistics, and one external minor subject; or, (ii) two external minor subjects. Each minor advisor must agree to serve on your special committee; as a result, the identification of these minor members should occur at least 6 months prior to your A examination.
Some examples of external minors include Computational Biology, Demography, Computer Science, Economics, Epidemiology, Mathematics, Applied Mathematics and Operations Research. The declaration of an external minor entails selecting (i) a field other than Statistics in which to minor; (ii) a subject & concentration within the specified field; and, (iii) a minor advisor representing this field/subject/concentration that will work with you in setting the minor requirements. Typically, external minors involve gaining knowledge in 3-5 graduate courses in the specified field/subject, though expectations can vary by field and even by the choice of advisor. While any choice of external minor subject is technically acceptable, the requirement that the minor representative serve on your Special Committee strongly suggests that the ideal choice(s) should share some natural connection with your choice of dissertation topic.
The fields, subjects and concentrations represented on your committee must be officially recognized by the Graduate School ; the Degrees, Subjects & Concentrations tab listed under each field of study provides this information. Information on the concentrations available for committee members chosen to represent the subject of Statistics can be found on the Graduate School webpage .
Statistics PhD Travel Support
The Department of Statistics and Data Science has established a fund for professional travel for graduate students. The intent of the Department is to encourage travel that enhances the Statistics community at Cornell by providing funding for graduate students in statistics that will be presenting at conferences. Please review the Graduate Student Travel Award Policy website for more information.
Completion of the PhD Degree
In addition to the specified residency requirements, students must meet all program requirements as outlined in Program Course Requirements and Timetables and Evaluations and Examinations, as well as complete a doctoral dissertation approved by your Special Committee. The target time to PhD completion is between 4 and 5 years; the actual time to completion varies by student.
Students should consult both the Guide to Graduate Study and Code of Legislation of the Graduate Faculty (available at www.gradschool.cornell.edu ) for further information on all academic and procedural matters pertinent to pursuing a graduate degree at Cornell University.

Thank you for visiting nature.com. You are using a browser version with limited support for CSS. To obtain the best experience, we recommend you use a more up to date browser (or turn off compatibility mode in Internet Explorer). In the meantime, to ensure continued support, we are displaying the site without styles and JavaScript.
- View all journals
- Explore content
- About the journal
- Publish with us
- Sign up for alerts
- 12 March 2024
Bring PhD assessment into the twenty-first century
You have full access to this article via your institution.

Innovation in PhD education has not reached how doctoral degrees are assessed. Credit: Dan Dunkley/Science Photo Library
Research and teaching in today’s universities are unrecognizable compared with what they were in the early nineteenth century, when Germany and later France gave the world the modern research doctorate. And yet significant aspects of the process of acquiring and assessing a doctorate have remained remarkably constant. A minimum of three years of independent study mentored by a single individual culminates in the production of the doctoral thesis — often a magisterial, book-length piece of work that is assessed in an oral examination by a few senior academic researchers. In an age in which there is much research-informed innovation in teaching and learning, the assessment of the doctoral thesis represents a curious throwback that is seemingly impervious to meaningful reform.
But reform is needed. Some doctoral candidates perceive the current assessment system to lack transparency, and examiners report concerns of falling standards ( G. Houston A Study of the PhD Examination: Process, Attributes and Outcomes . PhD thesis, Oxford Univ.; 2018 ). Making the qualification more structured would help — and, equally importantly, would bring the assessment of PhD education in line with education across the board. PhD candidates with experience of modern assessment methods will become better researchers, wherever they work. Indeed, most will not be working in universities: the majority of PhD holders find employment outside academia.

Collection: Career resources for PhD students
It’s not that PhD training is completely stuck in the nineteenth century. Today’s doctoral candidates can choose from a range of pathways. Professional doctorates, often used in engineering, are jointly supervised by an employer and an academic, and are aimed at solving industry-based problems. Another innovation is PhD by publication, in which, instead of a final thesis on one or more research questions, the criterion for an award is a minimum number of papers published or accepted for publication. In some countries, doctoral students are increasingly being trained in cohorts, with the aim of providing a less isolating experience than that offered by the conventional supervisor–student relationship. PhD candidates are also encouraged to acquire transferable skills — for example, in data analysis, public engagement, project management or business, economics and finance. The value of such training would be even greater if these skills were to be formally assessed alongside a dissertation rather than seen as optional.
And yet, most PhDs are still assessed after the production of a final dissertation, according to a format that, at its core, has not changed for at least half a century, as speakers and delegates noted at an event in London last month on PhD assessment, organized by the Society for Research in Higher Educatio n. Innovations in assessment that are common at other levels of education are struggling to find their way into the conventional doctoral programme.
Take the concept of learning objectives. Intended to aid consistency, fairness and transparency, learning objectives are a summary of what a student is expected to know and how they will be assessed, and are given at the start of a course of study. Part of the ambition is also to help tutors to keep track of their students’ learning and take remedial action before it is too late.

PhD training is no longer fit for purpose — it needs reform now
Formative assessment is another practice that has yet to find its way into PhD assessment consistently. Here, a tutor evaluates a student’s progress at the mid-point of a course and gives feedback or guidance on what students need to do to improve ahead of their final, or summative, assessment. It is not that these methods are absent from modern PhDs; a conscientious supervisor will not leave candidates to sink or swim until the last day. But at many institutions, such approaches are not required of PhD supervisors.
Part of the difficulty is that PhD training is carried out in research departments by people who do not need to have teaching qualifications or awareness of innovations based on education research. Supervisors shouldn’t just be experts in their field, they should also know how best to convey that subject knowledge — along with knowledge of research methods — to their students.
It is probably not possible for universities to require all doctoral supervisors to have teaching qualifications. But there are smaller changes that can be made. At a minimum, doctoral supervisors should take the time to engage with the research that exists in the field of PhD education, and how it can apply to their interactions with students.
There can be no one-size-fits-all solution to improving how a PhD is assessed, because different subjects often have bespoke needs and practices ( P. Denicolo Qual. Assur. Educ. 11 , 84–91; 2003 ). But supervisors and representatives of individual subject communities must continue to discuss what is most appropriate for their disciplines.
All things considered, there is benefit to adopting a more structured approach to PhD assessment. It is high time that PhD education caught up with changes that are now mainstream at most other levels of education. That must start with a closer partnership between education researchers, PhD supervisors and organizers of doctoral-training programmes in universities. This partnership will benefit everyone — PhD supervisors and doctoral students coming into the research workforce, whether in universities or elsewhere.
Education and training in research has entered many secondary schools, along with undergraduate teaching, which is a good thing. In the spirit of mutual learning, research doctoral supervisors, too, will benefit by going back to school.
Nature 627 , 244 (2024)
doi: https://doi.org/10.1038/d41586-024-00718-0
Reprints and permissions
Related Articles

- Scientific community

Londoners see what a scientist looks like up close in 50 photographs
Career News 18 APR 24

Deadly diseases and inflatable suits: how I found my niche in virology research
Spotlight 17 APR 24

How young people benefit from Swiss apprenticeships

We must protect the global plastics treaty from corporate interference
World View 17 APR 24

UN plastics treaty: don’t let lobbyists drown out researchers
Editorial 17 APR 24

Smoking bans are coming: what does the evidence say?
News 17 APR 24

Researchers want a ‘nutrition label’ for academic-paper facts
Nature Index 17 APR 24
Postdoctoral Position
We are seeking highly motivated and skilled candidates for postdoctoral fellow positions
Boston, Massachusetts (US)
Boston Children's Hospital (BCH)
Qiushi Chair Professor
Distinguished scholars with notable achievements and extensive international influence.
Hangzhou, Zhejiang, China
Zhejiang University
ZJU 100 Young Professor
Promising young scholars who can independently establish and develop a research direction.
Head of the Thrust of Robotics and Autonomous Systems
Reporting to the Dean of Systems Hub, the Head of ROAS is an executive assuming overall responsibility for the academic, student, human resources...
Guangzhou, Guangdong, China
The Hong Kong University of Science and Technology (Guangzhou)
Head of Biology, Bio-island
Head of Biology to lead the discovery biology group.
BeiGene Ltd.
Sign up for the Nature Briefing newsletter — what matters in science, free to your inbox daily.
Quick links
- Explore articles by subject
- Guide to authors
- Editorial policies
- Doing a PhD in Data Science
What Is a PhD in Data Science?
If you have always been fascinated by science, especially if you are interested in statistics and the scientific method, then a PhD in Data Science might be for you.
Data science is a field of study dedicated to applying the science of statistics to the problem areas of data visualisation, data science and machine learning. In this field, the challenge is to use data analysis and mathematical formulas to predict data patterns and draw conclusions from them.
Data science has become popular because it covers a wide range of topics, including the use of statistical methods for analysing and interpreting data. The primary goal of the discipline is to explain the way data enters the scientific community and influences decisions. Data is analysed to find patterns and connections, and then possible solutions are explored. With big data and new statistical computing methods, patterns can be uncovered, and relationships can be tested.
As more and more industries rely on information generated by computers, data science will be one of the key players in the future.
Browse PhDs in Data Science
Application of artificial intelligence to multiphysics problems in materials design, study of the human-vehicle interactions by a high-end dynamic driving simulator, physical layer algorithm design in 6g non-terrestrial communications, machine learning for autonomous robot exploration, detecting subtle but clinically significant cognitive change in an ageing population, what does a phd in data science focus on.
The primary focus for a PhD in Data Science is statistical methods. This means that you would study statistics in all its forms at the macroscopic and microscopic level, including statistical computer science, theory and applied mathematics. The advantage is that you get an insight into how large-scale data works. Thus, a position in a company where you are analysing large amounts of project data can be made available through a PhD.
PhD programs in data science provide university students with a thorough grounding in the theoretical aspects , but they are also taught the practical aspects of the discipline. PhD students are taught how to conduct proper experiments and interpret the results of scientific studies.
The importance of data and its interpretation is of paramount importance in all fields, and a PhD programme in data science addresses this topic, with some institutions also offering taught modules that doctoral students can use to deepen their knowledge.
Within a data science field, there are several areas of focus. One of them is the analysis of large databases and their effective interpretation. With this doctoral qualification, you could conduct statistical analysis, research studies and even exploratory data analysis. You could see what kinds of relationships exist between variables. You can explore areas such as Databases, Human Resource Management Machine Learning, or Information Technology during your studies.
Entry Requirements for A PhD in Data Science
A PhD in Data Science involves conducting original research in this area; therefore, applicants must have a good knowledge of statistical methods, computing, probability calculation, statistics and other related topics.
Basic requirements are typically a strong Master’s degree in mathematics, computer science or statistics from an accredited university. International students will also need to meet several minimum English language requirements set by the university, usually as part of a TOEFL or IELTS exam.
Although there are many advantages to obtaining a PhD in Data Science, it requires hard work and perseverance to master the techniques of analysis; to become an effective researcher, you will need strong mathematical and logical skills.
If you are interested in a PhD in Data Science but are unsure whether you have the background or resources available, consider taking a Master’s degree in this subject, or if you are a prospective student, contact the department you are interested in to see if they have any advice for you.
Duration and Programme Types
You can earn a PhD in data science in as little as 3 years full-time or 6 years part-time at a leading university. There are also online courses; many universities offer online PhD programmes which allow you to complete your entire doctoral programme from home. You still need to meet your course requirements by attending lectures and doing laboratory work, but your work can be completed at your own pace and off-campus.
Costs and Funding
The cost of a PhD in Data Science will depend on the university you study with, but average tuition fee is £4000-£6000 per academic year for UK/EU students and £16,000-£19,000 per academic year for international students.
Due to the popularity of Data Science PhD projects and the increasing demand for individuals who can elaborately analyse large data sets , it is not difficult to obtain PhD funding in this area. In many cases, funding for full-time research can be obtained from the university’s Centre for Doctoral Training (CDT), covering tuition fees and living costs.
Available Career Paths
A PhD in Data Science will enhance your data analysis skills and allow you to specialise in areas not available to others. A PhD offers many opportunities for those interested in statistics; you could become an engineer, statistician, consultant or academic lecturer. There are even PhDs in Data Science that offer internships in financial institutions or government agencies. Upon completing your doctorate, you can enter the workforce in many areas depending on your aptitude and experience.

A PhD in Data Science can lead to a wide range of jobs in many fields. If you are interested in working for a company that uses data one way or another, a PhD would be the perfect choice for you. If you are interested in independent research and studying various scientific methods and data, you will do well with a PhD. You could also spend your time teaching or doing your own research.
A person who has a PhD in data science can work in many industry-related positions. For example, you may work in the financial industry as an analyst for mergers and acquisitions, in healthcare, as a statistician, or as an information systems administrator. You can even get a job as an IT analyst, project manager, and software designer.
You can use your knowledge in the workplace to start up your own small business. Many small businesses today are founded on the back of a PhD. In fact, many Fortune 500 companies started as a result of a doctor trying to solve a problem or answer a long-standing question plaguing their industry.
Browse PhDs Now
Join thousands of students.
Join thousands of other students and stay up to date with the latest PhD programmes, funding opportunities and advice.
Table of Contents
What is a phd in data analytics, phd in data science vs. phd in data analytics, a doctorate vs master’s degree in data analytics, why earn a phd in data analytics, phd in data analytics benefits, phd in data analytics disadvantages, careers for data analytics phd holders, phd in data analytics curriculum, considerations when choosing a phd program or college, phd in data analytics preparation courses, how much does a phd in data analytics cost, phd in data analytics - everything you need to know.

New technologies are constantly being developed in the field of data analysis. Data analysts have a variety of job opportunities. These people might operate in many different industries. Technical know-how is needed for this vocation to evaluate and interpret data to enhance business performance. Getting a PhD in Data Analytics can be really beneficial in such cases.
This article discusses everything you need to know about PhD in Data Analytics.
PhD in data analytics allows students to learn in-depth methodological approaches and subjects that will be useful to them during their careers. A PhD in analytics is typically pursued by those involved in academic jobs, similar to other research-focused doctoral degrees.
Data science and data analytics has been a source of confusion for many people. When considering getting a doctorate, which field should you choose?
- Data analysis involves analyzing large data sets and interpreting them to make strategic choices. When pursuing PhD, you will learn about the techniques and tools involved in data analysis. You will also have to research the same and develop new suggestions.
- Whereas data science uses the analyzed data to create solutions for business problems.
Someone who is interested in learning more about analytical techniques should pursue a Ph.D. in data analytics. The PhD in Data Science is the program of choice for professionals who enjoy understanding the ins and outs of intricate machine learning and big data methodologies.
The general distinctions between PhD in Data Analytics and a Master’s degree are:
PhD in Data Analytics: A doctorate program is the highest form of qualification an institute offers. This degree can take up to 4-5 years. A PhD is extremely based on deep research for a specific field.
Master’s: A master’s degree is a degree that a student needs to complete before applying for PhD. This program usually takes up 1-2 academic years.
Those who are enthusiastic about data and want to have a profession that involves the study and creation of discoveries, typically within a subfield, are the most likely candidates for a PhD in a topic linked to data. A PhD in data analytics can help anyone upgrade their status in data science and analysis.
There are many advantages to earning a PhD in data analytics.
- You can contribute significantly to the field with a PhD in data analytics.
- You will be able to carry out original research as opposed to just reiterating previously published material.
- You'll be able to explore other areas of study thanks to it as well.
- In addition to exploring new academic fields, you will be able to broaden your knowledge outside of data analytics.
The following are some disadvantages of pursuing a PhD in data analytics.
- A Doctorate can be a solitary endeavor.
- You can miss out on an important professional experience.
Become a Data Science & Business Analytics Professional
- 11.5 M Expected New Jobs For Data Science And Analytics
- 28% Annual Job Growth By 2026
- $46K-$100K Average Annual Salary
Post Graduate Program in Data Analytics
- Post Graduate Program certificate and Alumni Association membership
- Exclusive hackathons and Ask me Anything sessions by IBM
Data Analyst
- Industry-recognized Data Analyst Master’s certificate from Simplilearn
- Dedicated live sessions by faculty of industry experts
Here's what learners are saying regarding our programs:
Felix Chong
Project manage , codethink.
After completing this course, I landed a new job & a salary hike of 30%. I now work with Zuhlke Group as a Project Manager.
Gayathri Ramesh
Associate data engineer , publicis sapient.
The course was well structured and curated. The live classes were extremely helpful. They made learning more productive and interactive. The program helped me change my domain from a data analyst to an Associate Data Engineer.
Career options for PhD in Data Science holders:
- Senior Data Scientist
- Chief Data Officer
- Market Research Analyst
- Senior Data Analyst
- Data Engineer
- Business Intelligence Developer
A general PhD in Data Analytics curriculum looks like this:
- Each PhD program has a minimum number of credits that must be earned.
- A qualifying exam is a requirement for enrollment in any PhD program.
- The majority of PhD courses call for students to instruct undergraduate courses or help the professor in instructing classes.
- Before any steps are taken to begin working on the plan, the panel of academic staff must approve it.
When applying for PhD in Data Analytics, you might want to take into account the following factors.
- Faculty: Look over the teachers and see their professional and academic backgrounds.
- Flexibility: Several PhD schools allow part-time enrollment, but many prefer full-time students.
- Fund: It is crucial to start planning how you will pay for your research as soon as feasible.
- Department: Finding departments that specialize in your field of study is extremely crucial.
- Eligibility: You must hold a master’s degree before you apply for a Doctorate.
Before deciding to get a PhD in Data Science, consider doing a certificate course to build skills that will help you in your research.
- Data Analyst Course by Simplilearn : You will become a data analytics specialist after taking this course on data analysis, which was created in partnership with IBM. You will discover the most recent analytics tools and methods in this course on data analytics.
- Google Data Analytics Professional Certificate: The participants in their data analytics course are beginners with no prior knowledge of data analytics or similar technical domains.
- CCA Data Analyst Exam: The exam establishes a benchmark that makes it simple for future employers to verify and evaluate your real-world data analysis abilities.
A yearly cost of between $35,000 to $50000 is typical for a PhD in data analytics. Students pursuing doctorates frequently receive financial aid. Programs frequently provide financial assistance and tuition breaks in exchange for conducting research or teaching.
PhD in data analytics is the right choice if you want to enhance your career mark in the field. If you want to prepare for a PhD or are in quest of enhancing analysis skills, consider doing Simplilearn’s Professional Certificate Program In Data Analytics .
1. Is a PhD in data analytics worth it?
You may master all the skills and knowledge required to succeed in data analysis by earning a PhD in data analytics.
2. How long does a PhD in data analytics take?
It usually requires 4-5 years to finish courses, fieldwork, and a dissertation for a Ph. D. in data analytics.
3. Can I do PhD in data science after an MBA?
You can apply for a PhD in data analytics after earning your MBA. Ensure that you get your MBA degree from a reputed college. Getting MBA in Business Management might help you while pursuing PhD in data analytics.
4. Which PhD is most in demand?
The in-demand PhD degrees include data science and data analytics since data is the new truth of the world. Companies produce a lot of data, and they need scholars who have education in data science or data analytics field.
5. Do PhD students get paid enough?
PhD in data analytics can help you land a job that pays you well. An average salary of $115,428 per year can be earned by a senior data analyst, according to Glassdoor.
Data Science & Business Analytics Courses Duration and Fees
Data Science & Business Analytics programs typically range from a few weeks to several months, with fees varying based on program and institution.
Learn from Industry Experts with free Masterclasses
Data science & business analytics.
How Can You Master the Art of Data Analysis: Uncover the Path to Career Advancement
Develop Your Career in Data Analytics with Purdue University Professional Certificate
Career Masterclass: How to Get Qualified for a Data Analytics Career
Recommended Reads
Data Analytics Basics: A Beginner’s Guide
Data Science vs. Big Data vs. Data Analytics
What is Data Analytics and its Future Scope in 2024
Data Analytics in 2021: A Comprehensive Trend Report
What’s the Difference Between Data Analytics and Business Analytics
Data Analytics with Python: Use Case Demo
Get Affiliated Certifications with Live Class programs
- PMP, PMI, PMBOK, CAPM, PgMP, PfMP, ACP, PBA, RMP, SP, and OPM3 are registered marks of the Project Management Institute, Inc.
- Current Students
- Online Only Students
- Faculty & Staff
- Parents & Family
- Alumni & Friends
- Community & Business
- Student Life
- College of Computing and Software Engineering
- Executive Advisory Board
- CCSE Job Openings
- Academic Advising
- Student Resources
- Faculty Resources
- School of Data Science and Analytics
- Department of Computer Science
- Department of Information Technology
- Department of Software Engineering and Game Development
- Undergraduate
- Why Partner?
- Ways to Engage
- Friends & Corporate Affiliates
- K-12 outreach
- Internship Networking

PhD in Data Science and Analytics
Degrees & Programs
- Doctoral Degree in Data Science and Analytics
- Certificates
We launched the first formal PhD program in Data Science in 2015. Our program sits at the intersection ofcomputer science, statistics, mathematics, and business. Our students engage in relevant research with faculty from across our eleven colleges. As one of the institutions on the forefront of the development of data science as an academic discipline, we are committed to developing the next generation of Data Science leaders, researchers, and educators. Culturally, we are committed to the discipline of Data Science, through ethical practices, attention to fairness, to a diverse student body, to academic excellence, and research which makes positive contributions to our local, regional, and global community.
Herman Ray , Director, Ph.D. in Data Science and Analytics

About the Doctoral Degree in Data Science and Analytics
This degree will train individuals to translate and facilitate new innovative research, structured and unstructured, complex data into information to improve decision making. This curriculum includes heavy emphasis on programming, data mining, statistical modeling, and the mathematical foundations to support these concepts. Importantly, the program also emphasizes communication skills – both oral and written – as well as application and tying results to business and research problems.
Because this degree is a Ph.D., it creates flexibility. Graduates can either pursue a position in the private or public sector as a "practicing" Data Scientist – where continued demand is expected to greatly outpace the supply - or pursue a position within academia, where they would be uniquely qualified to teach these skills to the next generation.
Information Sessions for Fall 2025 Admission
To be announced
Data Science and Analytics PhD Curriculum
Stage One: Pre-Program Requirements
- Successful applicants will have completed a masters degree in a computational field (e.g., engineering, computer science, statistics, economics, finance, etc.)
- Applicants are expected to have deep proficiency in at least one analytical programming language (e.g., SAS, R, Python). SQL and Java are helpful but not required.
- Interested applicants who have earned an undergraduate degree are encouraged to apply to the Ph.D. Program with the embedded MS in Computer Science or with the MS in Applied Statistics.
Stage Two: Coursework
The Ph.D. in Data Science and Analytics requires 78 total credit hours spread over four years of study. Example Program of Study:
- CS 8265 - Big Data Analytics
- CS 8267 - Machine Learning
- MATH 8010 - Theory of Linear Models (optional)
- MATH 8020 - Graph Theory
- MATH 8030 - Applied Discrete and Combinatorial Mathematics
- STAT 8240 - Data Mining I
- STAT 8250 - Data Mining II
- Comprehensive Exam
- 21 credit hours of electives in computer science, statistics, mathematics, information technology, or other area by permission.
- Research Proposal
- DS 9700 Doctoral Internship/Research Lab
- DS 9900 Dissertation
- Dissertation Proposal Defense
- DS 9900 DissertationFinal Dissertation Defense
Stage Three: Project Engagement and Research/Dissertation
Relevant, interdisciplinary research forms the foundation of the Ph.D. in Data Science and Analytics. While students are encouraged to engage in research from their first semester, the last two years of the program are structured to help students transition into becoming independent, lead researchers. In this last stage of the program, students will work with research faculty, including their advisor, in one of our data science research labs.
Program Student Learning Outcomes
At the end of the program, students will be able to:
- Demonstrate their understanding of the research process
- Demonstrate mastery of core concepts relevant to three key areas in mathematics, statistics and computer science
- Develop themselves as professionals prepared for work as a doctoral-educated individual beyond graduation
Admission Requirements and Application
Frequently Asked Questions (FAQ)
How long will the program take?
How much does the program cost?
Who would be successful in the program?
Where do these graduates work after graduation?
What are the publication/research requirements?
What did Science Doctoral Students Study?
- Applied Computer Science
- Applied Economics and Statistics
- Applied Statistics
- Applied Mathematics
- Bioinformatics
- Business Analytics
- Chemical Biology
- Computer Science
- Data Science
- Forecasting & Strategic Management
- Integrative Biology
- Public Admin in Economic Policy Mgmt
- Mathematics
- Mechanical Engineering
- Software Engineering
What is the Project Engagement requirement?
Can I pursue the program part- time while I am working full-time?
Can I live on campus?
Are the courses online?
Do I have to have a masters degree to apply?
Where did Data Doctoral Students Study?
- Ajou University, South Korea
- Albert-Ludwigs University of Freiburg
- Auburn University
- Bowling Green State University
- Clemson University
- Columbia University
- Columbus State University
- Florida State University
- Georgia Southern University
- Georgia State
- Georgia Tech
- Iran University of Science and Technology
- Kennesaw State University
- Marshall University
- Michigan State University
- Murray State University
- North Carolina State University
- St. Petersburg State University, Russia
- University of KwaZulu-Natal, South Africa
- University of Michigan
- University of North Carolina
- University of Toledo
Ph.D. in Data Science and Analytics Student Cohorts

Royce Alfred
Bachelor's Degree: Psychology, Kennesaw State University
Master's Degree: Applied Statistics and Analytics, Kennesaw State University
Work History: 4 years as a Data Scientist at Equifax
Professional Objective: Work as a research data scientist in the corporate environment

Venkata Abhiram Chitty
Bachelor's Degree: Mathematics, Statistics and Computer Science, Osmania University, Telangana, India
Master's Degree: Data Science, VIT-AP University, Amaravati, Andhra Pradesh, India
Professional Objective: To apply my Data Science skills in public health domain and help the society

Caleb Greski
Bachelor's Degree:
Master's Degree:
Work History:
Courses Taught:
Publications:
Professional Objective:

Moukthika Kadaparthi
Bachelor's Degree: Electrical and Electronics Engineering, SASTRA Deemed University
Master's Degree: Computers and Information Science, Cleveland State University
Work History:
- Business Intelligence Analyst, Philips Healthcare, Georgia
- Graduate Research Assistant, Cleveland State University, Ohio
Professional Objective: My objective is to enter academia with the aim of sharing the practical applications of data science in diverse domains and its potential positive impacts. With my unique blend of academic rigor and industry experience, I am driven to analyze complex data sets using cutting-edge data science techniques, to provide actionable insights and support data-driven decision-making.

Bachelor's Degree: Civil Engineering, Huazhong University of Science and Technology, China
Master's Degree: Business Analytics, Syracuse University
- Credit Modeling Analyst, Agricultural Development Bank of China
- Research Assistant, Changjiang Securities
- Graduate Assistant, Syracuse University
Courses Taught: Calculus I, Marketing Analytics, Data Mining
Awards: Merit-Based Scholarship, Syracuse University
Professional Objective: To secure a challenging position in a reputable organization to expand myself within the field of Artificial Intelligence.

Kausar Perveen
Bachelor's Degree: Bachelor in Engineering Software Engineering, National University of Sciences and Technology, Pakistan
Master's Degree: Masters in Data Science, Illinois Institute of Technology, Chicago
- Fullstack Developer at ItRunsInMyFamily, Charleston, South Carolina
- Software Engineer II , Xgrid Pakistan
- Senior Research Coordinator, Aga Khan University Pakistan
- Machine Learning Engineer, Agoda Thailand
Publications: National cervical cancer burden estimation through systematic review and analysis of publicly available data in Pakistan
Service and Awards:
- Fulbright Scholarship award for Master’s degree in Data Science
- Aga Khan Education Service Pakistan, merit cumulative need based scholarship for Bachelors in Software Engineering
Professional Objective: My main motivation behind getting a degree in Data Science is to receive and perform qualified research experience in Data Science and public health

Bachelor's Degree: Statistics, University of Dhaka, Dhaka, Bangladesh
Master's Degree: Mathematics (Statistics Concentration), University of Toledo, Ohio
- Analytics Engineer Intern, Cooper Smith, Toledo, Ohio
- Business AnalystAkij Food and Beverage Limited, Dhaka, Bangladesh
Courses Taught: Introduction to Statistics
Professional Objective: I am interested to work as a data scientist in the industry

Ayomide Isaac Afolabi
Bachelor's Degree: Chemical Engineering, Ladoke Akintola University of Technology
Master's Degree: Data Science, Auburn University
Work History: Graduate Research Assistant, Auburn University
Courses Taught: Python Programming
Publications: Larson EA, Afolabi A, Zheng J, Ojeda AS. Sterols and sterol ratios to trace fecal contamination: pitfalls and potential solutions. Environ Sci Pollut Res Int. 2022 Jul;29(35):53395-53402. doi: 10.1007/s11356-022-19611-2 . Epub 2022 Mar 14. PMID: 35287190
Professional Objective: To work as a research data scientist in the industry

Dinesh Chowdary Attota
Bachelor's Degree: Computer Science, Jawaharlal Nehru Technological University Kakinada (JNTUK), India
Master's Degree: Computer Science, Kennesaw State University
Work History: Associate Consultant, SL Techknow Solutions India Pvt Ltd, India 2018 - 2020
Publications:
- An Ensemble Multi-View Federated Learning Intrusion Detection for IoT
- A Conversational Recommender System for Exploring Pedagogical Design Patterns
- An Ensembled Method For Diabetic Retinopathy Classification using Transfer Learning
Professional Objective: I'd like to be a faculty member at a university so that I can continue to do research.

Nzubechukwu Ohalete
Bachelor's Degree: Mathematics,University of Nigeria, Nsukka
Master's Degree: Applied Statistics, Bowling Green State University
Work History: Graduate Assistant/Data Analyst, Federal University of Technology, Owerri - Mathematics Department
Courses Taught: Elementary Mathematics, Mathematical Methods
Awards: James A. Sullivan Outstanding Graduate Student Award, Applied Statistics and Operations Research Department, April 2022
Professional Objective: To use data science techniques to solve problems which makes our lives better and also makes our world a better place

Ryan Parker
Bachelor's Degree: Microbiology, University of Tennessee - Knoxville
Master's Degree: Integrative Biology, Kennesaw State University
Work History: Instructor of Biology, Kennesaw State University
Courses Taught: Nursing Microbiology Lectures and Labs, Introductory Biology Labs, Biotechnology Lectures and Labs
- Parker RA, Gabriel KT, Graham K, Cornelison CT. Validation of methylene blue viability staining with the emerging pathogen Candida auris. J Microbiol Methods. 2020 Feb;169:105829. doi: 10.1016/j.mimet.2019.105829 . Epub 2019 Dec 27. PMID: 31884053.
- Parker RA, Gabriel KT, Graham KD, Butts BK, Cornelison CT. Antifungal Activity of Select Essential Oils against Candida auris and Their Interactions with Antifungal Drugs. Pathogens. 2022 Jul 22;11(8):821. doi: 10.3390/pathogens11080821 . PMID: 35894044; PMCID: PMC9331469.
Awards: Best Graduate Poster: Symposium for Student Scholars hosted by Kennesaw State University (Fall 2018) for Poster: "Antifungal Activity of Select Essential Oils and Synergism with Antifungal Drugs against Candida auris"
Professional Objective : To apply Data Science techniques to large scientific datasets, such as genomic and astronomical data, and to help bridge the gap between disparate fields by working in an interdisciplinary space to offer integrative and data-driven solutions to the increasingly complex problems presented to the traditional Sciences.

Askhat Yktybaev
Bachelor's Degree: Forecasting and Strategic Management, Saint-Petersburg State University of Economics and Finance, Russia
Master's Degree: Forecasting and Strategic Management, Saint-Petersburg State University of Economics and Finance, Russia; Public Administration in Economic Policy Management, School of International and Public Affairs, Columbia University
Work History:
- from Data Analyst to Head of Research Unit, Central Bank of Kyrgyz Republic
- Sr. Data Scientist in OJSC, Aiyl Bank, Kyrgyzstan
- Consultant, The World Bank, Washington D.C.
Courses Taught: Financial Programing in the Central Bank, Monetary Policy Transmission Mechanism
Service and Awards: Winner of the Joint Japan/World Bank Graduate Scholarship Program, National Bank Silver Medal for Best Forecast
Professional Objective: I want to found a successful Fintech startup one day.

Sanad Biswas
Bachelor's Degree: Statistics, Biostatistics and Informatics, University of Dhaka, Bangladesh
Master's Degree: Statistics, University of Toledo, OH
- Research Assistant: US Army Research Lab, Kennesaw State University
- Consultant, Statistical Consulting Service, University of Toledo
- Graduate Teaching Assistant, University of Toledo
Courses Taught: Calculus and Business Calculus, Facilitated students’ study of Statistics courses at the University of Toledo.
Professional Objective: To work as a researcher in the industry or as a faculty. I am primarily interested in the application of machine learning in different fields.

Mallika Boyapati
Bachelor's Degree: Electronics and Computer Engineering, K L University, India
Master's Degree: Applied Computer Science, Columbus State University
- T-Mobile, Seattle, WA, USA: Sr. Data analyst, 2018- 2021
- UITS, Columbus State University, Columbus, GA, USA: Data Analyst -Graduate assistant, 2016-2018
- Menlo Technologies, India: Jr. Data Analyst, Intern, 2014- 2016
Courses Taught: DATA 4310 - Statistical Data Mining
Publications:
- Anti-Phishing Approaches in the Era of the Internet of Things. In: Pathan, AS.K. (eds) Towards a Wireless Connected World: Achievements and New Technologies. Springer, Cham - https://doi.org/10.1007/978-3-031-04321-5_3
- An empirical analysis of image augmentation against model inversion attack in federated learning - https://doi.org/10.1007/s10586-022-03596-1
- M. Boyapati and R. Aygun, "Phishing Web Page Detection using Web Scraping," SoutheastCon 2023, Orlando, FL, USA, 2023, pp. 167-174, doi: 10.1109/SoutheastCon51012.2023.10115148.
- M. Boyapati and R. Aygun, "Default Prediction on Commercial Credit Big Data Using Graph-based Variable Clustering," 2023 IEEE 17th International Conference on Semantic Computing (ICSC), Laguna Hills, CA, USA, 2023, pp. 139-142, doi: 10.1109/ICSC56153.2023.00029.
- Boyapati, M., Aygun, R. (2023) Explainable Machine Learning for Default Prediction on Commercial Credit Big Data Using Graph-based Variable Clustering. In Encyclopedia with Semantic Computing and Robotic Intelligence VOL. 0 https://doi.org/10.1142/S2529737623500119
- Winners of Dataiku March Madness Bracket-thon, 2021 in predicting the NBA bracket
- Winners of 2021 Analytics Day Ph.D. level research poster presentation
Professional Objective: To leverage strong analytical and technical abilities to research and develop effective data models, visualize data, and uncover insights that makes an impact in field of data science

Nina Grundlingh
Bachelor's Degree: Applied Mathematics and Statistics, University of KwaZulu-Natal, South Africa
Master's Degree: Statistics, University of KwaZulu-Natal, South Africa
Courses Taught: Introduction to Statistics, University of KwaZulu-Natal
- Grundlingh, N., Zewotir, T., Roberts, D. & Manda, S. Modelling diabetes in South Africa. The 61st conference of the South African Statistical Association, 27-29 November 2019, Nelson Mandela University, South Africa.
- Grundlingh, N., Zewotir, T., Roberts, D. & Manda, S. Modelling diabetes in the South African population. College of Agriculture, Engineering and Science Postgraduate Research & Innovation Symposium 2019, 17 October 2019, University of KwaZulu-Natal, Westville, South Africa (the award for best MSc presentation was also received for this).
- Grundlingh, N., Zewotir, T., Roberts, D. & Manda, S. Modelling risk factors of diabetes and pre-diabetes in South Africa. IBS SUSAN-SSACAB 2019 Conference, 8-11 September 2019, Cape Town, South Africa.
- University of KwaZulu-Natal Postgraduate Research & Innovation Symposium 2019 – Best Masters oral presentation
- South African Statistical Association Honours Project Competition 2018/2019 – 2nd place and special prize for best use of SAS
Professional Objective: To work in a teaching position – sharing how data science can be applied to different fields and the positive impact it could have. I would like to use my theological background and passion to bring insight, clarity, and wisdom to data science problems.

Namazbai Ishmakhametov
Bachelor's Degree: Specialist in Mathematical Methods in Economics, Kyrgyz-Russian Slavic University
Master's Degree: Analytics, Institute for Advanced Analytics at North Carolina State University
- Expert at the Centre for Economic Research, National bank of the Kyrgyz Republic
- Consultant in World Bank project dedicated to strengthening the regulatory practices in Kyrgyz Republic
- Consultant at Deloitte Consulting LLP, Science Based Services group, Analytics & Cognitive offering
- Macroeconomic modeling expert in the Economic Department, National bank of the Kyrgyz Republic
Courses Taught: Introductory statistics and econometrics (cross-sections, times series and panels) lecturer at Ata-Turk Alatoo International University, Kyrgyzstan
- Ishmakhametov Namazbai, Abdygulov Tolkunbek, Jenish Nurbek. 2020. “ Impact of 2014-2015 shocks on economic behavior of the households in the Kyrgyz Republic ". Working Paper of the National Bank of the Kyrgyz Republic
- Sherrill W. Hayes, Jennifer L. Priestley, Namazbai Ishmakhametov, Herman E. Ray. 2020. “ I’m not Working from Home, I’m Living at Work ”: Perceived Stress and Work-Related Burnout before and during COVID-19”. PsyArxiv Preprints
- Ishmakhametov Namazbai, Arykov Ruslan. 2016. “ Credit Risk Model on the Example of the Commercial Banks of the Kyrgyz Republic ”. Working Paper of the National Bank of the Kyrgyz Republic
- Namazbai Ishmakhametov, Anvar Muratkhanov.2015. “Modeling strategy of the Bank of the Kyrgyz Republic”. National bank of Poland – Swiss National bank joint seminar. Zurich, Switzerland
Professional Objective: To apply my quantitative skills in the field of biotech either in corporate or government sector

Symon Kimitei
Bachelor's Degrees: Mathematics, Kennesaw State University, and Computer Science, Kennesaw State University
Master's Degree: Mathematics (Scientific Computing Concentration), Georgia State University
Work History: Senior Lecturer and Math Department Coordinator of Supplemental Instruction, Kennesaw State University
Courses Taught: Calculus 1, Precalculus, Applied Calculus & College Algebra
- Haskin, S., Kimitei, S., Chowdhury, M., Rahman, F., Longitudinal Predictive Curves of Health-Risk Factors for American Adolescent Girls. Journal of Adolescent Health. JAH-2021-00601R1
- Symon K Kimitei, Algorithms for Toeplitz Matrices with Applications to Image Deblurring . 2008. Georgia State University, Masters thesis. ScholarWorks
Poster Presentations:
- Kimitei, Symon & Sammie Haskin. "Nadaraya-Watson Kernel Regression Longitudinal Analysis of Healthcare Risk Factors of African American and Caucasian American Girls." Kennesaw State University R Day Presentation. 11 Nov. 2019. Poster presentation.
- Kimitei, Symon. " Social Network Analysis in Supreme Court Case Rulings by Precedence Using SAS Optgraph/Python." 23rd Annual Symposium of Scholars. Kennesaw State University. 19 April. 2018. Poster presentation.
Professional Objective: As a Ph.D. student in Analytics & Data Science, I hope to gain skills in the program that will propel me into a Data Scientist / Machine Learning Engineer with a specialization in the design and implementation of deep learning & machine learning algorithms.

Jitendra Sai Kota
Bachelor's Degree: Computer Science & Engineering, Amrita Vishwa Vidyapeetham, India
Master's Degree: Computer Science, Florida State University
Work History: Teaching Assistant Professor in Computer Science at an Engineering College in India
Courses Taught: Problem Solving & Program Design through C, Artificial Intelligence, Data Mining
Publications: Kota, Jitendra Sai, Vayelapelli, Mamatha. 2020. "Predicting the Outcome of a T20 Cricket Game Based on the Players' Abilities to Perform Under Pressure". IEIE Transactions on Smart Processing and Computing 9(3):230-237. DOI: 10.5573/IEIESPC.2020.9.3.230
Professional Objective: to work in Data Science in a Corporate Environment
ResearchGate

Catrice Taylor
Bachelor's Degree: Economics, Clemson University
Master's Degrees: Applied Economics and Statistics, Clemson University, and Applied Statistics, Kennesaw State University
Professional Objective: To work as an industry data scientist in a corporate environment

Sahar Yarmohammadtoosky
Bachelor's Degree: Applied Mathematics, Sheikh Bahaei University, Isfahan, Iran
Master's Degree: Applied Mathematics, Iran University of Science & Technology, Tehran, Iran
Courses Taught: Numerical Analysis and Linear Algebra, Iran University of Science & Technology
Publications: Noah, G., Sahar, Y., Anthony P. & Hung, C.C. "ISODS: An ISODATA-Based Initial Centroid Algorithm". Accepted to: 10th International Conference on Information, March 6 - 8, 2021, Hosei University, Tokyo, Japan
Professional Objective: My goal is to become a competent Data Science specialist capable of using my skills to bring meaning to data, getting a faculty position at a university

Martin Brown
Bachelor's Degree: Mathematics, Swansea University, United Kingdom
Master's Degree: Mathematics, Murray State University
- Graduate Research Assistant, Kennesaw State University, August 2020 to present
- Graduate Teaching Assistant, Murray State University, August 2018 to May 2020
Course Taught: Problem Solving in Mathematics
Publications: Brown, Martin K. W. "Evaluating an Ordinal Output using Data Modeling, Algorithmic Modeling, and Numerical Analysis" (2020). Murray State Thesis and Dissertations 168 .
Awards: David Pryce History of Mathematics Prize 2017-2018
Professional Objective: To pursue a career in data science, machine learning, and predictive analytics to solve real-world issues

Inchan Hwang
Bachelor’s Degree: Computer Science, Georgia Southwestern State University
Master’s Degree: Software Engineering, Ajou University, South Korea
Courses Tutored: Precalculus, College Algebra, Calculus I at Georgia Southwestern State University
Tutoring College Algebra, Calculus I and II at Academic Skills Center, Georgia Southwestern State University Research Assistant at Intelligence of HyperConnected Systems Lab of Ajou University Fullstack web developer, windows system programmer in the cybersecurity industry Professional Objective: To work in big data analytics, and research and development of machine learning in engineering, and security

Duleep Prasanna Rathgamage Don
Bachelor's degree: Physics and Mathematics, The Open University of Sri Lanka
Master's degree: Mathematics, Georgia Southern University
- Graduate Teaching Assistant, Georgia Southern University, 2016 - 2018
- Graduate Teaching Assistant, University of Wyoming, 2019 - 2020
Courses Taught: Trigonometry, and Calculus I & II
Publications/Presentations:
- Don, R. D. and Iacob, I. E., ‘DCSVM: Fast Multi-class Classification using Support Vector Machines’, International Journal of Machine Learning and Cybernetics .
- Rathgamage Don, D., Iacob, E., ‘Divide and Conquer Support Vector Machine for Multiclass Classification’, Research Symposium (2018), Georgia Southern University.
- Rathgamage Don, D., Iacob, E., ‘Multiclass Classification using Support Vector Machines’, MAA Southeastern Section Meeting (2018), Clemson University.
Professional Objective: To work in big data analytics, and research and development of machine learning in engineering, and medicine

Linglin Zhang
Bachelor’s Degree: Biological Sciences, Hubei University, China
Master’s Degree: Chemical Biology, University of Michigan and Bioinformatics, Georgia Institute of Technology
Selected Publications: Rebecca Shen, Zhi Li, Linglin Zhang, Yingqi Hua, Min Mao, Zhicong Li, Zhengdong Cai, Yunping Qiu, Jonathan Gryak, Kayvan Najarian. (2018). Osteosarcoma Patients Classification Using Plain X-Rays and Metabolomic Data. 40th Annual International Conference of the IEEE Engineering in Medicine and Biology Society (EMBC). 690-693, 2018.
Professional Objective: To become a researcher in industry or academia. My background in Biology and Bioinformatics could provide me strong theoretical support on a research role in the health industry. The experience of doing an internship at Equifax equipped me of certain knowledge on business cases.

Yihong Zhang
Bachelor’s Degree: Psychology Mathematics Interdisciplinary, Chatham University
Master’s Degree: Mathematics and Statistics Allied with Computer Science, Georgia State University
- Research Assistant - Collaborated with biomedical department to analyze and visualize microarray gene expression data, Facilitated in data pre-processing and machine learning modeling of clinical liver cirrhosis image data, Assisted in feature engineering of image analysis in deep learning for pathology diagnosis with Mayo Clinic’s pilot project.
- Graduate Lab Assistant - Tutored students with statistics and math subjects.
Professional Objective: Make better use of data in healthcare and bioinformatic industry as a data scientist.
2019 - 2020

Trent Geisler
Graduation Date: Summer 2022
Dissertation: Novel Instance-Level Weighted Loss Function for Imbalanced Learning
Dissertation Advisor: Dr. Herman Ray
Current Position: Assistant Professor, Department of Systems Engineering, United States Military Academy West Point

Srivatsa Mallapragada
Bachelor’s Degree: Mechanical Engineering, Andhra University College of Engineering, India
Master’s Degree: Mechanical Engineering, University of North Carolina at Charlotte
Continuous Improvement Intern, Daimler Trucks North America at Cleveland, North Carolina, USA Computational Fluid Dynamics (CFD) Graduate Research Assistant, NC Motorsports and Research Laboratory Manufacturing Intern, Caterpillar India Pvt Ltd, Sriperambudur, India Selected Publications/Presentations:
Mallapragada, S. (2017). Computational Investigations on the Aerodynamics of a Generic Car Model in Proximity to a Side Wall (Master’s thesis, The University of North Carolina at Charlotte). Uddin, M., Mallapragada, S., & Misar, A. (2018). Computational Investigations on the Aerodynamics of a Generic Car Model in Proximity to a Side-Wall (No. 2018-01-0704). SAE Technical Paper. Dimensionality Reduction of Hyperspectral Images for Classification, Srivatsa, M., Michael, W. & Hung, C. C. Ninth International Conference on Information ISSN: 1343-4500 Bounds, C., Mallapragada, S., and Uddin, M., "Overset Mesh-Based Computational Investigations on the Aerodynamics of a Generic Car Model in Proximity to a Side-Wall," SAE Int. J. Passeng. Cars - Mech. Syst. 12(3):211-223, 2019, https://doi.org/10.4271/06-12-03-0015. Service and Awards: Base SAS Programmer V9 Professional Objectives: I am currently working in unsupervised pattern recognition in high dimensional data sets. After I graduate, I would like to pursue a career in Data Science and Machine Learning in the corporate environment.

Sudhashree Sayenju
Graduation Date: Spring 2023
Dissertation: Quantification and Mitigation of Various Types of Biases in Deep NLP Models
Dissertation Advisor: Dr. Ramazan Aygun

Christina Stradwick
Bachelor’s Degree: Music Performance and Mathematics, Marshall University
Master’s Degree: Mathematics with Emphasis in Statistics, Marshall University
Courses Taught: Prep for College Algebra at Marshall University
Selected Presentations:
- Stradwick, C. Exploring the Variance of the Sample Variance. Spring Meeting of the Mathematical Association of America Ohio Section, University of Akron, 2019.
- Stradwick, C., Vaughn, L., Hanan Khan, A. Data Modeling on Insurance Beneficiary Dataset. College of Science Research Expo 2018, Marshall University, 2018. Poster Presentation.
- Stradwick, C. Disease modeling on networks. The 13th Annual UNCG Regional Mathematics and Statistics Conference, University of North Carolina at Greensboro, 2017. Poster Presentation.
Professional Objectives: To work as a researcher in industry or in a laboratory setting. I would like to use my background in mathematics and statistics to develop novel solutions that address limitations in current data science techniques and to apply known data science methods to solve real-world problems.
2018 - 2019

Md Shafiul Alam
Graduation Date: Fall 2022
Dissertation: Appley: App roximate Shap ley Values for Model Explainability in Linear Time
Dissertation Advisor: Dr. Ying Xie
Current Position: AI Framework Engineer, Intel Corporation

Jonathan Boardman
Dissertation: Ethical Analytics: A Framework for a Practically-Oriented Sub-Discipline of AI Ethics
Current Position: Data Scientist, Equifax

Tejaswini Mallavarapu
Bachelor’s Degree: Pharmacy, Acharya Nagarjuna University, India
Master’s Degree: Computer Science, Kennesaw State University
- Graduate Research Assistant, Kennesaw State University, 2017-present
- Research Analyst, Divis Laboratories, 2013-2014
Selected Publications:
- T. Mallavarapu, Y. Kim, J.H. Oh, and M. Kang, "R-PathCluster: Identifying Cancer Subtype of Glioblastoma Multiforme Using Pathway-Based Restricted Boltzmann Machine," Proceedings of IEEE International Conference on Bioinformatics & Biomedicine (IEEE BIBM 2017), International Workshop on Deep Learning in Bioinformatics, Biomedicine, and Healthcare Informatics, Accepted, 2017.
- M.R. Shivalingam, K.S.G. Arul Kumaran, D. Jeslin, Ch. MadhusudhanaRao, M. Tejaswini, "Design and Evaluation of Binding Properties of Cassia roxburghii Seed Galacto mannan and Moringa oleifera Gum in the Formulation of Paracetamol Tablets," Research Journal of Pharmacy and Technology(RJPT). 3(1): Jan.-Mar. 2010; Page 254-256.
- M.R. Shivalingam, K.S.G. Arul Kumaran, D. Jeslin, Y.V. Kishore Reddy, M. Tejaswini, Ch. MadhusudhanaRao, V. Tejopavan, "Cassia roxburghii Seed Galacto manna— a potential binding agent in the tablet formulation," Journal of Biomedical Science and Research(JBSR), Vol 2 (1), 2010, 18-22
Professional Objective: To be a data scientist in the field of health care or bioinformatics where I can leverage my analytical skills and knowledge towards the advancement of the research field.

Seema Sangari
Dissertation: Debiasing Cyber Incidents - Correcting for Reporting Delays and Under-reporting
Dissertation Advisor: Dr. Michael Whitman
Current Position: Principal Modeler, HSB

Srivarna Settisara Janney
Bachelor’s Degree: Mechanical Engineering, Visveswaraiah Technological University, India
- Graduate Research Assistant, Kennesaw State University, 2016-2018
- Senior Software Engineer, Torry Harris Business Solutions (THBS), United Kingdom, 2010-2012 and India, 2012-2014
- Software Engineer, Torry Harris Business Solutions (THBS), India, 2007-2010
Selected Publications/Presentations:
- S.S. Janney, S. Chakravarty, “New Algorithms for CS – MRI: WTWTS, DWTS, WDWTS”, One-page research paper, 40th International Conference of IEEE Engineering in Medicine and Biology Society (IEEE EMBC), Jul 2018
- Master thesis presented at Southeast Symposium on Contemporary Engineering Topics (SSCET), UAH Engineering Forum, Alabama, Aug 2018
- Master thesis poster is accepted to be presented at Biomedical Engineering Society (BMES) 2018 Annual Meeting, Oct 2018
- Submitted draft copy for book chapter contribution on “Bioelectronics and Medical Devices”, Elsevier Publisher, May 2018
- Showcased 3MT, Georgia Council of Graduate Schools (GCGS), Apr 2018
- Master thesis presented in workshop for “Medical Signal and Image Processing” at Department of Biotechnology & Medical Engineering, NIT Rourkella, Feb 2018
- S.S. Janney, I. Karim, J. Yang, C.C Hung, Y. Wang, “Monitoring and Assessing Traffic Safety Using Live Video Images”, GDOT project showcase, 4th Annual Transportation Research Expo, Sept 2016
- 1st Place Winner, Graduate Research Project, C-day Poster Presentation, Kennesaw State University, Spring 2018
- People's Choice Award, 3 Minute Thesis (3MT), Apr 2018
- CCSE Dean’s 4.0 Club, Jan 2018
- 3rd Place Winner, Hackathon 2017 - HPCC Systems Big Data
- Foundation of Computer Science, Certified by Kennesaw State University, Jun 2016
- Fundamental of RESTful API Design, Certified by APIGEE, Nov 2014
- Member of HandsOnAtlanta, since 2014
- SOA Associate, Certified by IBM, Jun 2008
Professional Objective: I would like to be a researcher in Data Science and Analytics in medical imaging technologies contributing to advancements that would help medical and healthcare professionals provide value-based and personalized health care. I would like to look at career opportunities in industry and academia that fuel my interest in research.
2017 - 2018

Graduation Date: Summer 2021
Dissertation: Incentive-based Data Sharing and Exchanging Mechanism Design
Dissertation Advisor: Dr. Meng Han
Current Position: Assistant Professor, Saint Joseph's University - Erivan K. Haub School of Business

Mohammad Masum
Dissertation: Integrated Machine Learning Approaches to Improve Classification Performance and Feature Extraction Process for EEG Dataset
Dissertation Advisor: Dr. Hossain Shahriar
Current Position: Assistant Professor, San Jose State University

Lauren Staples
Graduation Date: Fall 2021
Dissertation: A Distance-Based Clustering Framework for Categorical Time Series: A Case Study in the Episodes of Care Healthcare Delivery System
Dissertation Advisor: Dr. Joseph DeMaio
Current Position: Senior Data Scientist, Microsoft
2016 - 2017

Shashank Hebbar
Dissertation: Tree-BERT - Advanced Representation Learning for Relation Extraction
Dissertation Advisor: Dr. Ying Xie
Current Position: Data Scientist, Credigy

Jessica Rudd
Graduation Date: Summer 2020
Dissertation: Quantitatively Motivated Model Development Framework: Downstream Analysis Effects of Normalization Strategies
Dissertation Advisor: Dr. Herman Ray
Current Position: Senior Data Engineer, Intuit Mailchimp

Graduation Date: Spring 2020
Dissertation: Data-driven Investment Decisions in P2P Lending: Strategies of Integrating Credit Scoring and Profit Scoring
Dissertation Advisor: Dr. Sherry NI
Current Position: Applied Scientist II, Amazon

Dissertation: A Novel Penalized Log-likelihood Function for Class Imbalance Problem
Current Position: Data Scientist/Research Engineer, Hewlett Packard Enterprise

Dissertation: Attack and Defense in Security Analytics
Dissertation Advisor: Dr. Selena He
Current Position: NLP Data Scientist, NBME
2015 - 2016

Edwin Baidoo
Graduation Date: Spring 2020
Dissertation: A Credit Analysis of the Unbanked and Underbanked: An Argument for Alternative Data
Dissertation Advisor: Dr. Stefano Mazzotta
Current Position: Assistant Professor, Business Analytics, Tennessee Technological University

Bogdan Gadidov
Graduation Date: Summer 2019
Dissertation: One- and Two-Step Estimation of Time Variant Parameters and Nonparametric Quantiles
Dissertation Advisor: Dr. Mohammed Chowdhury
Current Position: Data Scientist, Variant

Dissertation: Biologically Interpretable, Integrative Deep Learning for Cancer Survival Analysis
Dissertation Advisor: Dr. Mingon Kang
Current Position: Assistant Professor, Chinese Academy of Medical Sciences, Peking Union Medical College

Graduation Date: Spring 2019
Dissertation: Deep Embedding Kernel
Current Position: Assistant Professor, Information Technology, Kennesaw State University

Bob Venderheyden
Graduation Date: Fall 2019
Dissertation: Ordinal Hyperplane Loss
Dissertation Advisor: Dr. Ying Xie
Current Position: Principal Data Scientist, Microsoft
Contact Info
Kennesaw Campus 1000 Chastain Road Kennesaw, GA 30144
Marietta Campus 1100 South Marietta Pkwy Marietta, GA 30060
Campus Maps
Phone 470-KSU-INFO (470-578-4636)
kennesaw.edu/info
Media Resources
Resources For
Related Links
- Financial Aid
- Degrees, Majors & Programs
- Job Opportunities
- Campus Security
- Global Education
- Sustainability
- Accessibility
470-KSU-INFO (470-578-4636)
© 2024 Kennesaw State University. All Rights Reserved.
- Privacy Statement
- Accreditation
- Emergency Information
- Reporting Hotline
- Open Records
- Human Trafficking Notice
- Program Finder
- Admissions Services
- Course Directory
- Academic Calendar
- Hybrid Campus
- Lecture Series
- Convocation
- Strategy and Development
- Implementation and Impact
- Integrity and Oversight
- In the School
- In the Field
- In Baltimore
- Resources for Practitioners
- Articles & News Releases
- In The News
- Statements & Announcements
- At a Glance
- Student Life
- Strategic Priorities
- Inclusion, Diversity, Anti-Racism, and Equity (IDARE)
- What is Public Health?
Data Analysis Workshop I
- MAS Application Fee Waiver Requirements
- Master of Arts (MA) in Geography and Environmental Engineering
- Master of Arts and Master of Science in Public Health (MA/MSPH)
- Master of Arts in Public Health Biology (MAPHB)
- Master of Bioethics (MBE)
- MHA Frequently Asked Questions
- Mission, Vision, and Values
- MHA Executive in Residence and Alumni
- Student Experience
- Program Outcomes
- Bachelor's/MHA Program
- Master of Health Science (MHS) - Department of Biochemistry and Molecular Biology
- Master of Health Science (MHS) - Department of Epidemiology
- Alumni Update
- MHS Combined with a Certificate Program
- Master of Health Science (MHS) - Department of Molecular Microbiology and Immunology
- Alumni Highlights
- Post-Baccalaureate Program in Environmental Health for Pre-Medicine Students
- Bachelor's/MHS in Health Economics and Outcomes Research
- MHS HEOR Careers
- Frequently Asked Questions
- Master of Health Science (MHS)
- Concurrent School-Wide Master of Health Science Program in Biostatistics
- Master of Health Science - Department of Population, Family and Reproductive Health
- Master of Health Science Online (MHS) - Department of Population, Family and Reproductive Health
- Careers in Health Economics
- Core Competencies
- Meet the Director
- What is Health Economics
- MPH Capstone Schedule
- Concentrations
- Online/Part-Time Format
- Requirements
- Tuition and Funding
- Executive Board Faculty
- Master of Science (MS) in Geography and Environmental Engineering
- Independent Professional Project and Final Essay
- Program Objectives and Outcomes
- Internships
- Master of Science (ScM) - Department of Biochemistry and Molecular Biology
- Master of Science (ScM) - Department of Biostatistics
- Master of Science (ScM) - Department of Epidemiology
- Master of Science (ScM) - Department of Molecular Microbiology and Immunology
- ScM Faculty Advisers
- Master of Science in Engineering (MSE) in Geography and Environmental Engineering
- Bachelor's/MSPH in Health Policy
- FAQ for MSPH in Health Policy
- Field Placement Experience
- MSPH Capstone
- MSPH Practicum
- Required and Elective Courses
- Student Timeline
- Career Opportunities
- 38-Week Dietetics Practicum
- Completion Requirements
- MSPH/RD Program FAQ
- Program Goals
- Master's Essay Titles
- Application Fee Waiver Requirements
- Doctor of Philosophy (PhD) - Department of Biostatistics
- Doctor of Philosophy (PhD) - Department of Epidemiology
- Program Goals and Expectations
- Doctor of Philosophy (PhD) - Department of Molecular Microbiology and Immunology
- Doctor of Philosophy (PhD) - Department of Population, Family and Reproductive Health
- Doctor of Philosophy (PhD) in Clinical Investigation
- Track in Environmental Sustainability, Resilience, and Health
- Track in Exposure Sciences and Environmental Epidemiology
- Track in Health Security
- Track in Toxicology, Physiology and Molecular Mechanisms
- PhD in Geography and Environmental Engineering Faculty Advisers
- Recent Graduates and Dissertation Titles
- PhD Funding
- PhD TA Requirement
- Recent Dissertation Titles
- JHU-Tsinghua Doctor of Public Health
- Core Course Requirements
- Concentration in Women’s and Reproductive Health
- Custom Track
- Concentration in Environmental Health
- Concentration in Global Health: Policy and Evaluation
- Concentration in Health Equity and Social Justice
- Concentration in Health Policy and Management
- Concentration in Implementation Science
- Meet Current Students
- Combined Bachelor's / Master's Programs
- Concurrent MHS Option for BSPH Doctoral Students
- Concurrent MSPH Option for JHSPH Doctoral students
- Doctor of Medicine and Doctor of Philosophy (MD/PhD)
- Adolescent Health Certificate Program
- Bioethics Certificate Program
- Climate and Health Certificate Program
- Clinical Trials Certificate Program
- Community- Based Public Health Certificate Program
- Demographic Methods Certificate Program
- Environmental and Occupational Health Certificate Program
- Epidemiology for Public Health Professionals Certificate Program
- Evaluation: International Health Programs Certificate Program
- Food Systems, the Environment and Public Health Certificate Program
- Frequently Asked Questions for Certificate Programs
- Gender and Health Certificate Program
- Gerontology Certificate Program
- Global Digital Health Certificate Program
- Global Health Certificate Program
- Global Health Practice Certificate Program
- Health Communication Certificate Program
- Health Disparities and Health Inequality Certificate Program
- Health Education Certificate Program
- Health Finance and Management Certificate Program
- Health and Human Rights Certificate Program
- Healthcare Epidemiology and Infection Prevention and Control Certificate Program
- Humane Sciences and Toxicology Policy Certificate Program
- Humanitarian Health Certificate Program
- Implementation Science and Research Practice Certificate Program
- Injury and Violence Prevention Certificate Program
- International Healthcare Management and Leadership Certificate Program
- Leadership for Public Health and Healthcare Certificate Program
- Lesbian, Gay, Bisexual, Transgender, and Queer (LGBTQ) Public Health Certificate Program
- Maternal and Child Health Certificate Program
- Mental Health Policy, Economics and Services Certificate Program
- Non-Degree Students General Admissions Info
- Pharmacoepidemiology and Drug Safety Certificate Program
- Population Health Management Certificate Program
- Population and Health Certificate Program
- Product Stewardship for Sustainability Certificate Program
- Public Health Advocacy Certificate Program
- Public Health Economics Certificate Program
- Public Health Informatics Certificate Program
- Public Health Practice Certificate Program
- Declaration of Intent - Public Health Preparedness
- Public Health Training Certificate for American Indian Health Professionals
- Public Mental Health Research Certificate Program
- Quality, Patient Safety and Outcomes Research Certificate Program
- Quantitative Methods in Public Health Certificate Program
- Requirements for Successful Completion of a Certificate Program
- Rigor, Reproducibility, and Responsibility in Scientific Practice Certificate Program
- Risk Sciences and Public Policy Certificate Program
- Spatial Analysis for Public Health Certificate Program
- Training Certificate in Public Health
- Tropical Medicine Certificate Program
- Tuition for Certificate Programs
- Vaccine Science and Policy Certificate Program
- Online Student Experience
- Online Programs for Applied Learning
- Barcelona Information
- Fall Institute Housing Accommodations
- Participating Centers
- Registration, Tuition, and Fees
- Agency Scholarship Application
- General Scholarship Application
- UPF Scholarship Application
- Course Evaluations
- Online Courses
- Registration
- General Institute Tuition Information
- International Students
- Directions to the Bloomberg School
- All Courses
- Important Guidance for ONSITE Students
- D.C. Courses
- Registration and Fees
- Cancellation and Closure Policies
- Application Procedures
- Career Search
- Current Activities
- Current Trainees
- Related Links
- Process for Appointing Postdoctoral Fellows
- Message from the Director
- Program Details
- Admissions FAQ
- Current Residents
- Elective Opportunities for Visiting Trainees
- What is Occupational and Environmental Medicine?
- Admissions Info
- Graduates by Year
- Compensation and Benefits
- How to Apply
- Academic Committee
- Course Details and Registration
- Tuition and Fees
- ONLINE SOCI PROGRAM
- Principal Faculty
- Johns Hopkins RAPID Psychological First Aid
- General Application
- JHHS Application
- Areas of Study
- Important Dates
- Our Faculty
- Welcome Letter
- Descripción los Cursos
- Programa en Epidemiología para Gestores de Salud, Basado en Internet
- Consultants
- Britt Dahlberg, PhD
- Joke Bradt, PhD, MT-BC
- Mark R. Luborsky, PhD
- Marsha Wittink, PhD
- Rebekka Lee, ScD
- Su Yeon Lee-Tauler, PhD
- Theresa Hoeft, PhD
- Vicki L. Plano Clark, PhD
- Program Retreat
- Mixed Methods Applications: Illustrations
- Announcements
- 2023 Call for Applications
- Jennifer I Manuel, PhD, MSW
- Joke Bradt, PhD
- Josiemer Mattei, PhD, MPH
- Justin Sanders, MD, MSc
- Linda Charmaran, PhD
- Nao Hagiwara, PhD
- Nynikka R. A. Palmer, DrPH, MPH
- Olayinka O. Shiyanbola, BPharm, PhD
- Sarah Ronis, MD, MPH
- Susan D. Brown, PhD
- Tara Lagu, MD, MPH
- Theresa Hoft, PhD
- Wynne E. Norton, PhD
- Yvonne Mensa-Wilmot, PhD, MPH
- A. Susana Ramírez, PhD, MPH
- Animesh Sabnis, MD, MSHS
- Autumn Kieber-Emmons, MD, MPH
- Benjamin Han, MD, MPH
- Brooke A. Levandowski, PhD, MPA
- Camille R. Quinn, PhD, AM, LCSW
- Justine Wu, MD, MPH
- Kelly Aschbrenner, PhD
- Kim N. Danforth, ScD, MPH
- Loreto Leiva, PhD
- Marie Brault, PhD
- Mary E. Cooley, PhD, RN, FAAN
- Meganne K. Masko, PhD, MT-BC/L
- PhuongThao D. Le, PhD, MPH
- Rebecca Lobb, ScD, MPH
- Allegra R. Gordon, ScD MPH
- Anita Misra-Hebert, MD MPH FACP
- Arden M. Morris, MD, MPH
- Caroline Silva, PhD
- Danielle Davidov, PhD
- Hans Oh, PhD
- J. Nicholas Dionne-Odom, PhD RN ACHPN
- Jacqueline Mogle, PhD
- Jammie Hopkins, DrPH, MS
- Joe Glass, PhD MSW
- Karen Whiteman, PhD MSW
- Katie Schultz, PhD MSW
- Rose Molina, MD
- Uriyoán Colón-Ramos, ScD MPA
- Andrew Riley, PhD
- Byron J. Powell, PhD, LCSW
- Carrie Nieman MD, MPH
- Charles R. Rogers, PhD, MPH, MS, CHES®
- Emily E. Haroz, PhD
- Jennifer Tsui, Ph.D., M.P.H.
- Jessica Magidson, PhD
- Katherine Sanchez, PhD, LCSW
- Kelly Doran, MD, MHS
- Kiara Alvarez, PhD
- LaPrincess C. Brewer, MD, MPH
- Melissa Radey, PhD, MA, MSSW
- Sophia L. Johnson, PharmD, MPH, PhD
- Supriya Gupta Mohile, MD, MS
- Virginia McKay, PhD
- Andrew Cohen, MD, PhD
- Angela Chen, PhD, PMHNP-BC, RN
- Christopher Salas-Wright, PhD, MSW
- Eliza Park MD, MS
- Jaime M. Hughes, PhD, MPH, MSW
- Johanne Eliacin, PhD, HSPP
- Lingrui Liu ScD MS
- Meaghan Kennedy, MD
- Nicole Stadnick, PhD, MPH
- Paula Aristizabal, MD
- Radhika Sundararajan, MD
- Sara Mamo, AuD, PhD
- Tullika Garg, MD MPH FACS
- Allison Magnuson, DO
- Ariel Williamson PhD, DBSM
- Benita Bamgbade, PharmD, PhD
- Christopher Woodrell MD
- Hung-Jui (Ray) Tan, MD, MSHPM
- Jasmine Abrams, PhD
- Jose Alejandro Rauh-Hain, MD
- Karen Flórez, DrPH, MPH
- Lavanya Vasudevan, PhD, MPH, CPH
- Maria Garcia, MD, MPH
- Robert Brady, PhD
- Saria Hassan, MD
- Scherezade Mama, DrPH
- Yuan Lu, ScD
- 2021 Scholars
- Sign Up for Our Email List
- Workforce Training
- Cells-to-Society Courses
- Course/Section Numbers Explained
- Pathway Program with Goucher College
- The George G. Graham Lecture
June 10-14, 2024 1:30 p.m. – 5:00 p.m. 2 credits Course Number: 140.613.79 (synchronous online)
Course Instructor:
- Jenna Krall
Description:
Intended for students with a broad understanding of biostatistical concepts used in public health sciences who seek to develop additional data analysis skills. Emphasizes concepts and illustration of concepts applying a variety of analytic techniques to public health datasets in a computer laboratory using Stata statistical software. In the first workshop (140.613), students learn basic methods of data organization/management and simple methods for data exploration, data editing, and graphical and tabular displays. Also covered basic statistical methodology including the comparison of means and proportions. Enrollment limited: students must have a laptop computer with Intercooled Stata 14 or Intercooled 15 installed.
Student Evaluation: Student evaluation based on laboratory exercises, an exam, and completion of an independent data analysis project.
Learning Objectives: Upon successfully completing this course, students will be able to
Learn to create, save and edit Stata datasets, log files and do files
Use Stata to perform exploratory data analysis for continous and dichotomous variables
Use Stata do files to create reproducible analyses
Recognize the distinction between and appropriate uses of the binomial, poisson and normal probability models
Use Stata to perform paired and unpaired t-tests for differences in group means
Understand the appropriate use of paired and unpaired t-tests and the interpretation of the resulting Stata output
Use Stata to perform a chi-squared test and compute confidence intervals for differences in group proportions, relative risks and odds ratios
Understand the appropriate use of chi-squared tests and the interpretation of the resulting Stata output.
Prerequisite: 140.611 and 140.612 or equivalent
Grading Options: Letter Grade or Pass/Fail
Special Comments: Students must have a laptop computer with Intercooled Stata 16 or 15 installed. Student discounts are available for Intercooled Stata .
Course Materials: Provided in class
Related Courses: Data Analysis Workshop II • Advanced Data Analysis Workshop

- Mission and Goals
- DEI Commitment and Resources
- In Memoriam
- The Halıcıoğlu Challenge
- 5-Year Report
- Administration
- Visiting Scholars
- Founding Faculty
- Artificial Intelligence and Machine Learning
- Biomedical Data Science
- Data Infrastructure and Systems
- Data Science for Scientific Discovery
- Data and Society
- Theoretical Foundations of Data Science
- Visiting Scholar Program
- MS / PhD Admissions
- MSDS Course Requirements
- Degree Questions
- PhD Course Requirements
- PhD Student Resources
- Research Rotation
- Spring Evaluation Requirements
- Course Descriptions
- Course Offerings
- Career Services
- Graduate Advising
- Online Masters Program
- Academic Advising
- Concurrent Enrollment
- Course Descriptions and Prerequisites
- Enrolling in Classes
- Financial Opportunities
- Major Requirements
- Minor Requirements
- OSD Accommodations
- Petition Instructions
- Student Representatives
- Selective Major Application
- Prospective Double Majors
- Prospective First-Year Students
- Prospective Transfer Students
- Partnership Programs
- Research Collaboration
- Access to Talent
- Professional Development
- UCTV Data Science Channel
- Alumni Relations
- Giving Back
Give us a call or drop by anytime, we endeavor to answer all inquiries within 24 hours.

PO Box 16122 Collins Street West Victoria, Australia
[email protected] / [email protected]
Phone support
Phone: + (066) 0760 0260 / + (057) 0760 0560
PhD Program
Requirements for doctor of philosophy (ph.d.) in data science.
The goal of the doctoral program is to create leaders in the field of Data Science who will lay the foundation and expand the boundaries of knowledge in the field. The doctoral program aims to provide a research-oriented education to students, teaching them knowledge, skills and awareness required to perform data driven research, and enabling them to, using this shared background, carry out research that expands the boundaries of knowledge in Data Science. The doctoral program spans from foundational aspects, including computational methods, machine learning, mathematical models and statistical analysis, to applications in data science.
Course Requirements
https://datascience.ucsd.edu/graduate/phd-program/phd-course-requirements/
Research Rotation Program
https://datascience.ucsd.edu/graduate/phd-program/research-rotation/
Preliminary Assessment Examination
The goal of the preliminary assessment examination is to assess students’ preparation for pursuing a PhD in data science, in terms of core knowledge and readiness for conducting research. The preliminary assessment is an advisory examination.
The preliminary assessment is an oral presentation that must be completed before the end of Spring quarter of the second academic year. Students must have a GPA of 3.0 or above to qualify for the assessment and have completed three of four core required courses . The student will choose a committee consisting of three members, one of which will be the HDSI academic advisor of the student. The other two committee members must be HDSI faculty members with 0% or more appointments; we encourage the student to select the second faculty member based on compatibility of research interests and topic of the presentation. The student is responsible for scheduling the meeting and making a room reservation.
The student may choose to be evaluated based on (A) a scientific literature survey and data analysis or (B) based on a previous rotation project. The student will propose the topic of the presentation.
- If the student chooses the survey theme, they should select a broad area that is well represented among HDSI faculty members, such as causal inference, responsible AI, optimization, etc. The student should survey at least 10 peer-reviewed conference or journal papers representative of the last (at least) 5 years of the field. The student should present a novel and rigorous original analysis using publicly available data from the surveyed literature: this analysis may aim to answer a related or new research question.
- If the student chooses the rotation project theme, they should prepare to discuss the motivation for the project, the analysis undertaken, and the outcome of the rotation.
For both themes, the student will describe their topic to the committee by writing a 1-2 page proposal that must be then approved by the committee. We emphasize that this is not a research proposal. The student will have 50 minutes to give an oral presentation which should include a comprehensive overview of previous work, motivation for the presented work or state-of-the-art studies, a critical assessment of previous work and of their own work, and a future outlook including logical next steps or unanswered questions. The presentation will then be followed by a Q&A session by the committee members; the entire exam is expected to finish within two hours.
The committee will assess both the oral presentation as well as the student’s academic performance so far (especially in the required core courses). The committee will evaluate preparedness, technical skills, comprehension, critical thinking, and research readiness. Students who do not receive a satisfactory evaluation will receive a recommendation from the Graduate Program Committee regarding ways to remedy the lacking preparation or an opportunity to receive a terminal MS in Data Science degree provided the student can meet the degree requirements of the MS program . If the lack of preparation is course-based, the committee can require that additional course(s) be taken to pass the exam. If the lack of preparation is research-based, the committee can require an evaluation after another quarter of research with an HDSI faculty member; the faculty member will provide this evaluation. The preliminary assessment must be successfully completed no later than completion of two years (or sixth quarter enrollment) in the Ph.D. program.
The oral presentation must be completed in-person. We recommend the following timeline so that students can plan their preliminary assessments:
- Middle of winter quarter of second year: Student selects committee and proposes preliminary exam topic.
- Beginning of spring quarter of second year: Scheduling of exam is completed.
- End of spring quarter of second year: Exam.
Research Qualifying Examination and Advancing to Candidacy
A research qualifying examination (UQE) is conducted by the dissertation committee consisting of five or more members approved by the graduate division as per senate regulation 715(D). One senate faculty member must have a primary appointment in the department outside of HDSI. Faculty with 25% or less partial appointment in HDSI may be considered for meeting this requirement on an exceptional basis upon approval from the graduate division.
The goal of UQE is to assess the ability of the candidate to perform independent critical research as evidenced by a presentation and writing a technical report at the level of a peer-reviewed journal or conference publication. The examination is taken after the student and his or her adviser have identified a topic for the dissertation and an initial demonstration of feasible progress has been made. The candidate is expected to describe his or her accomplishments to date as well as future work. The research qualifying examination must be completed no later than fourth year or 12 quarters from the start of the degree program; the UQE is tantamount to the advancement to PhD candidacy exam.
A petition to the Graduate Committee is required for students who take UQE after the required 12 quarters deadline. Students who fail the research qualifying examination may file a petition to retake it; if the petition is approved, they will be allowed to retake it one (and only one) more time. Students who fail UQE may also petition to transition to a MS in Data Science track.
Dissertation Defense Examination and Thesis Requirements
Students must successfully complete a final dissertation defense oral presentation and examination to the Dissertation Committee consisting of five or more members approved by the graduate division as per senate regulation 715(D). One senate faculty member in the Dissertation Committee must have a primary appointment in a department outside of HDSI. Partially appointed faculty in HDSI (at 25% or less) are acceptable in meeting this outside-department requirement as long as their main (lead) department is not HDSI.
A dissertation in the scope of Data Science is required of every candidate for the PhD degree. HDSI PhD program thesis requirements must meet Regulation 715(D) requirements. The final form of the dissertation document must comply with published guidelines by the Graduate Division.
The dissertation topic will be selected by the student, under the advice and guidance of Thesis Adviser and the Dissertation Committee. The dissertation must contain an original contribution of quality that would be acceptable for publication in the academic literature that either extends the theory or methodology of data science, or uses data science methods to solve a scientific problem in applied disciplines.
The entire dissertation committee will conduct a final oral examination, which will deal primarily with questions arising out of the relationship of the dissertation to the field of Data Science. The final examination will be conducted in two parts. The first part consists of a presentation by the candidate followed by a brief period of questions pertaining to the presentation; this part of the examination is open to the public. The second part of the examination will immediately follow the first part; this is a closed session between the student and the committee and will consist of a period of questioning by the committee members.
Special Requirements: Generalization, Reproducibility and Responsibility A candidate for doctoral degree in data science is expected to demonstrate evidence of generalization skills as well as evidence of reproducibility in research results. Evidence of generalization skills may be in the form of — but not limited to — generalization of results arrived at across domains, or across applications within a domain, generalization of applicability of method(s) proposed, or generalization of thesis conclusions rooted in formal or mathematical proof or quantitative reasoning supported by robust statistical measures. Reproducibility requirement may be satisfied by additional supplementary material consisting of code and data repository. The dissertation will also be reviewed for responsible use of data.
Special Requirements: Professional Training and Communications
All graduate students in the doctoral program are required to complete at least one quarter of experience in the classroom as teaching assistants regardless of their eventual career goals. Effective communications and ability to explain deep technical subjects is considered a key measure of a well-rounded doctoral education. Thus, Ph.D. students are also required to take a 1-unit DSC 295 (Academia Survival Skills) course for a Satisfactory grade.
Obtaining an MS in Data Science
PhD students may obtain an MS Degree in Data Science along the way or a terminal MS degree, provided they complete the requirements for the MS degree.

An official website of the United States government
The .gov means it’s official. Federal government websites often end in .gov or .mil. Before sharing sensitive information, make sure you’re on a federal government site.
The site is secure. The https:// ensures that you are connecting to the official website and that any information you provide is encrypted and transmitted securely.
- Publications
- Account settings
Preview improvements coming to the PMC website in October 2024. Learn More or Try it out now .
- Advanced Search
- Journal List
- JMIR Med Educ
- PMC10262020
Enhancing Learning About Epidemiological Data Analysis Using R for Graduate Students in Medical Fields With Jupyter Notebook: Classroom Action Research
Ponlagrit kumwichar.
1 Department of Epidemiology, Faculty of Medicine, Prince of Songkla University, Hat Yai, Thailand
Associated Data
The web-based questionnaire for student satisfaction survey.
Jupyter Notebook instruction.
The pedagogical resources pertinent to this research are publicly accessible via the GitHub repository [ 16 ]. The data sets substantiating the outcomes of this investigation can be available from the corresponding author, contingent upon a reasonable request.
Graduate students in medical fields must learn about epidemiology and data analysis to conduct their research. R is a software environment used to develop and run packages for statistical analysis; it can be challenging for students to learn because of compatibility with their computers and problems with package installations. Jupyter Notebook was used to run R, which enhanced the graduate students’ ability to learn epidemiological data analysis by providing an interactive and collaborative environment that allows for more efficient and effective learning.
This study collected class reflections from students and their lecturer in the class “Longitudinal Data Analysis Using R,” identified problems that occurred, and illustrated how Jupyter Notebook can solve those problems.
The researcher analyzed issues encountered in the previous class and devised solutions using Jupyter Notebook. These solutions were then implemented and applied to a new group of students. Reflections from the students were regularly collected and documented in an electronic form. The comments were then thematically analyzed and compared to those of the prior cohort.
Improvements that were identified included the ease of using Jupyter R for data analysis without needing to install packages, increased student questioning due to curiosity, and students having the ability to immediately use all code functions. After using Jupyter Notebook, the lecturer could stimulate interest more effectively and challenge students. Furthermore, they highlighted that students responded to questions. The student feedback shows that learning R with Jupyter Notebook was effective in stimulating their interest. Based on the feedback received, it can be inferred that using Jupyter Notebook to learn R is an effective approach for equipping students with an all-encompassing comprehension of longitudinal data analysis.
Conclusions
The use of Jupyter Notebook can improve graduate students’ learning experience for epidemiological data analysis by providing an interactive and collaborative environment that is not affected by compatibility issues with different operating systems and computers.
Introduction
All graduate students in medical fields must eventually learn about epidemiology. Graduate students also study essential subjects, such as research methodology and data analysis, to conduct and complete the research projects that are part of their degree requirements [ 1 ]. Studying R in an epidemiology course can help students develop important skills for data analysis, reproducibility, and collaboration, which are essential for conducting rigorous and impactful research in their field [ 2 ]. There are collections of functions that use R, known as R packages, which enhance the ability to conduct data analysis in diverse fields, such as medicine [ 3 ]. However, R packages may not be compatible with all computers or operating systems (OSs); this is often evident in the classroom environment [ 4 ].
R is a programming language–based software environment that beginners learn by studying numerous examples of command usage [ 5 ]. Teaching advanced R analysis within scheduled lecture times is not possible if compatibility issues prevent students from following along with their instructors [ 4 ]. These compatibility issues may emerge from discrepancies among various versions of R, its packages, and the OS that the student is using. These issues can lead to errors, unpredictable program behavior, or challenges in code maintenance. To minimize compatibility problems during the practicum, it is crucial that the instructor and all students use the same version of R and the packages [ 4 ]. This process must also be executed differently for Windows and Mac OSs, and there may be a diverse use of OSs among the students, including different versions of the two OSs [ 6 ]. Students may also have trouble installing packages, which requires time to fix [ 4 ]. Owing to the aforementioned difficulties, the students may be less enthusiastic about learning R [ 1 ].
Jupyter Notebook is an integrated development environment for R and Python that can function either on- or offline and allows for the blending of narrative text, mathematics, and executable code [ 7 ]. Jupyter Notebook is an open-source platform that provides an excellent learning environment for students and a better graphics interface than the original R platform [ 8 ]. Jupyter Notebook can improve the ability of graduate students in medical fields to learn epidemiological data analysis by providing an interactive and collaborative environment that allows for more efficient and effective learning [ 9 ]. By using Jupyter Notebook, students can perform interactive data analysis in R through integrated step-by-step instruction that allows them to learn data analysis easily. It also allows students to document their data analysis steps in a clear and reproducible way [ 10 ]. This can be especially important for assignments, as it allows others to follow along and understand their analysis process. Using Jupyter Notebook online can also facilitate collaboration between students and their instructors. Instructors can create and share Jupyter Notebook instances with students, and students can share their work with friends for peer review and feedback [ 9 ]. Hence, instructors can flexibly use an online Jupyter server to create interactive tutorials, assignments, and quizzes.
In our classroom, teaching R in the original version for longitudinal data analysis has often been delayed due to compatibility problems, leading to learning issues. The students were disappointed in their learning experience as computing errors and crashes during package installation prevented them from following the instructions. In this study, we collected class reflections from the students, then determined possible solutions using Jupyter Notebook. Jupyter Notebook was implemented in our classroom for the next cohort of students. This study also compared the satisfaction of the students in the original R class with the satisfaction of the students who used Jupyter Notebook.
Study Design
This study used action research to conduct a thematic summary of issues that were raised by the lecturer and students in the class. Action research is a form of systematic inquiry that involves educators engaging in a cyclical process of problem-solving about their practices. It is often used to improve teaching by identifying and addressing specific issues or challenges within a specific educational setting [ 11 ]. In this approach, the teacher is both the researcher and the participant, and the ultimate goal is to improve the teacher’s own practice and their students’ learning experiences. The original R version for longitudinal data analysis was used to accomplish this task. Subsequently, a detailed illustration of the solutions to the problems created through teaching the original version of R was presented using Jupyter Notebook. The solutions were implemented with a new cohort of students, and the students’ average satisfaction scores were compared with those of the previous cohort to validate the solutions’ effectiveness. This analysis identified areas for potential improvement, which can be useful in enhancing the sustainability of this approach.
Setting and Data Source
This study was based on the longitudinal data analysis class using the tidyverse package [ 12 ]. All students had background knowledge in using Basic R and the epiDisplay package [ 13 ]. The class instruction and learning materials were shared through a circulated email system. The Department of Epidemiology, Faculty of Medicine, Prince of Songkla University (PSU) routinely collected satisfaction information from students using a web-based questionnaire (shown in Multimedia Appendix 1 ). The questionnaire used a five-point Likert scale and was distributed to students after class. It assessed satisfaction across five dimensions: appropriate duration, media suitability, communication skills, discussion encouragement, and critical thinking promotion. These dimensions evaluate various aspects of course satisfaction: duration pertains to time allocation for topics; media suitability measures the effectiveness of instructional materials; communication skills rate the instructor’s clarity, organization, and engagement; discussion encouragement gauges the fostering of interaction and dialogue; and critical thinking promotion examines the support for in-depth analysis and problem-solving. Higher scores in each dimension signify a more satisfactory learning experience for students.
The questionnaire was created for internal use in an arbitrary manner due to the limited number of students per annum. Consequently, no reliability study was undertaken. Routine requests were made to the students to complete the questionnaire and include their reflections on a web-based sheet after class. All data reported by the students were anonymously recorded in a secured database. This mitigated the possibility of social desirability.
Jupyter Server Setup
In accordance with the JupyterHub guidelines [ 14 ], we established a self-hosted Jupyter server on a dedicated machine (US $8700) procured from the Division of Digital Innovation and Data Analytics (DIDA), Faculty of Medicine, at PSU. The server is equipped with a 64-core CPU and 256 GB of RAM. For the default configuration, each student was allocated a server with 1 CPU core and 500 MB of RAM. This allocation sufficed for storing their notebook and any requisite data files for the course. However, it should be noted that individual access settings can be adjusted within the server’s capacity constraints.
To initiate the server, we created a virtual machine on the DIDA server and preinstalled all necessary packages. The cost of operating this instance amounted to approximately US $20 per month, as per the university’s established rates. The management of a JupyterHub server for users necessitated that the authentication be implemented via the PSU passport service, which is provided by the Computer Center of PSU, and that resources be allocated for each user. This ensured that every student had access to essential resources without overwhelming the server’s capacity.
Participants
With the participation of students and author PK as the teacher, the classroom action research was a collaborative learning method that changed specific actions. Participants in this study included PK and all graduate students in medical fields who were taking the longitudinal data analysis class run by PK. All students had already passed a basic epidemiology exam, so it could be inferred that they possessed a foundational understanding of epidemiological concepts and were familiar with relevant basic statistical techniques, including the R base and EpiDisplay packages. All students needed to independently analyze epidemiological data to finish their research and complete their PhD or MSc in epidemiology. The first class (class 1) was taught the original R version in October 2020, and the second class (class 2) was conducted using Jupyter Notebook in July 2022. Each class took 6 hours and comprised different students. After class finished, students from both class 1 and 2 were asked to answer the same web-based satisfaction questionnaire given by the educational assisting staff.
The intended learning outcome of both class 1 and 2 was for students to exhibit competence in using R programming for the analysis of longitudinal data. PK normally observed the action of students during each class. To facilitate individualized learning within the small class setting, students were required to independently interpret results or address parallel questions after completing exercise segments on a section-by-section basis. To further promote understanding, PK presented each student with a spontaneously devised distinct problem (improvised question) that used the same technique. For example:
- Calculate the differences between the square root of the ozone levels on the adjacent days.
- Calculate the differences between the cube root (change function) of the sulfur dioxide levels (change variable) for 2 consecutive days with a lag of 2 (day lag=2).
This approach ensures that students do not merely replicate the code provided in instructions but rather gain a comprehensive grasp of the material.
Problem Identification and Solution
PK noted the problems that occurred and retrieved the comments reported by the students in class 1 from the database. The notes and comments were thematically analyzed to create the problem list. The problems were reviewed and used to develop the R Jupyter for the instruction of longitudinal data analysis. The R Jupyter content was developed incrementally to solve the problems, and subsequently, a flipped class [ 15 ] assignment was included as a preclass assignment as group work. The flipped class assignment may introduce bias due to the confusing effects of using Jupyter R Notebooks. However, it is impossible to avoid since it was mandated by the university in 2022. This enabled the students to exchange ideas through the web-based platform and collaboratively prepare for the longitudinal data analysis class.
Implementation and Evaluation
PK created a mitigation plan for class 2, which included the development of the Jupyter Notebook (see our GitHub [ 16 ]) and PDF instruction file (see Multimedia Appendix 2 ). These materials were distributed to students 2 weeks prior to the commencement of the class. The students were allowed to use the Jupyter server using their PSU passport account [ 17 ]. The problems detected during class 2 were noted by PK. The anonymized satisfaction scores and comments from students were sent to PK a week later. Additional details of the average age and sex distribution of the students were attached; however, those were not linked with the scores to protect personal data.
This study used a thematic analysis to examine the notes and comments made by PK, which were provided by students in class 2, and compare them with thematic issues in class 1. In addition, descriptive statistics were used to compare satisfaction scores between class 1 and class 2 by ignoring parametric assumptions due to the small sample size. Opportunities for improvement were identified based on the observations made in the notes and comments gathered by PK, which were not previously observed in class 1.
Ethics Approval
This study was approved by the Human Research Ethics Committee, PSU (REC 66-104-18-1), which authorized a waiver of consent.
Differences Between Class 1 and 2
Table 1 summarizes the characteristics of students in two different classes. Class 1 had 9 students with a mean age of 32.9 years, while class 2 had 8 students with a mean age of 30.9 years. Both classes had a similar number of male and female students. Before starting, class 2 was given a link to access a Jupyter server and a password for internet access, and students were allowed to use any device to connect to the classroom’s wireless internet. All students chose to use their laptop.
Differences between class 1 and 2.
Problem Identification in Class 1 and Mitigation Plan
Table 2 presents a list of thematic issues that arose during class 1, along with their corresponding mitigation plans. It also outlines particular feedback provided by students in class 1 that had to be addressed before commencing class 2.
Problem identification and solution.
Comparison Between Class 1 and 2
Table 3 presents feedback on the use of Jupyter R for instruction and improvement in class 2 problems, as well as comments from the students regarding their feelings about the changes in the class.
Improvement after the use of Jupyter R for instruction.
Figure 1 shows the satisfaction ratings of the two classes (class 1 and class 2) across different dimensions of satisfaction related to their learning experience. Overall, the findings suggest that class 2 (using Jupyter R) was more effective when compared to class 1, as clearly shown by the higher mean ratings and lower variability in the ratings for class 2. The explicit suitability of media in class 2 was found to be higher than that in class 1.

The six-dimensional satisfaction scores.
Opportunities for Improvement
Table 4 presents the opportunities for improvement in class 2 and notes/comments from both the instructor and students. PK noted that there was uncertainty regarding the long-term effectiveness of the course, as there was no standard procedure in place to monitor whether students continued to engage with coding in R after class was completed. Furthermore, there is also a lack of knowledge regarding their proficiency in solving coding challenges independently. Despite PK’s emphasis that students are able to use Jupyter Notebook when they face compatibility issues related to traditional R (we also provided a Jupyter server for the alumni), it is unclear whether students would remember this or if they would use another program altogether to conduct their data analysis. Hence, a plan was developed to devise a system that could effectively monitor the adherence of students to the practice of coding in R, such as the R Skill Challenge Activity, through the Jupyter server. The student reflections highlight the need for a teaching assistant during class, as some practice sessions run slower when students require specific help. Even though the lecturer was able to cover all the necessary material with the students within the scheduled time by using Jupyter Notebook and teaching at a new pace, the students appeared to be unwilling to wait for assistance in resolving an error while the lecturer was assisting another student. Therefore, a few statisticians will be assigned as teaching assistants in upcoming classes.
Opportunities for improvement.
Principal Findings
This study focused on the challenges faced in teaching R programming in epidemiology classes and proposed the use of Jupyter Notebook as a potential solution. The study aimed to evaluate the effectiveness of Jupyter Notebook in a longitudinal data analysis class and collected reflections from students in a previous class regarding the problems they encountered in learning R programming. The findings of the study indicated that Jupyter Notebook could provide an interactive and collaborative environment that improves the effectiveness and efficiency of the learning process.
Reflections on the action research process revealed that compatibility issues and package installation crashes were the most common challenges faced when teaching R programming. These challenges were resolved by using Jupyter R Notebook, which also facilitated group work and collaborative learning. This study is innovative in its use of Jupyter Notebook as a pedagogical tool for the instruction of epidemiology and, to the best of the author’s knowledge, is the first study to do so. However, previous studies in other fields [ 9 , 19 - 22 ] have revealed that Jupyter Notebook is an effective tool for teaching data analysis.
The primary strength of this study was its collaboration with students, allowing their problems to be identified so that solutions could be found to address those issues. Moreover, the use of Jupyter Notebook as a tool to enhance learning is an innovative approach to teaching epidemiology. The use of this tool was a pragmatic remedy to the obstacles encountered when instructing students in R programming within epidemiology courses. Jupyter Notebook provided an effective and efficient learning environment, enabling students to explore data and document their analysis steps in a clear and reproducible way. Moreover, Jupyter Notebook facilitates collaboration between students and instructors, allowing instructors to create interactive tutorials, assignments, and quizzes.
Limitations
Unfortunately, this study’s focus on a particular class and context constrains its generalizability. Additionally, the long-term efficacy of the Jupyter Notebook method in enhancing student learning outcomes remains unreported. Future research should assess the long-term effectiveness of the Jupyter Notebook strategy in augmenting student learning outcomes. Moreover, to adhere to ethical standards during student data collection, it is crucial to establish a research protocol that delineates the process for securing informed consent prior to further evaluation. The use of a flipped classroom assignment in class 2 may have influenced the overall feedback, complicating whether the observed outcomes could be exclusively attributed to the Jupyter Notebook approach.
Considering these constraints, we propose that subsequent research should examine the long-term effectiveness of the Jupyter Notebook approach in fostering student learning outcomes while accounting for confounding factors, such as flipped classroom assignments. This will facilitate a clearer understanding of the primary effect and aid in discerning the distinct contributions of the Jupyter R notebook method to student learning.
Jupyter Notebook can enhance the learning of epidemiological data analysis for graduate students by providing an interactive and collaborative environment that allows for more efficient and effective learning. The findings of this study demonstrate that Jupyter Notebook can help address the challenges of teaching R programming in epidemiology classes, which are caused by compatibility issues with different OSs and computers.
Acknowledgments
The appreciation of the author is extended to the Division of Digital Innovation and Data Analytics, Faculty of Medicine, Prince of Songkla University for their development of the Jupyter server. The author would also like to thank the Office of International Affairs, Faculty of Medicine, Prince of Songkla University for their English editing support services.
Abbreviations
Multimedia appendix 1, multimedia appendix 2, data availability.
Conflicts of Interest: None declared.
Statistics & Data Science
Dietrich college of humanities and social sciences, ph.d. programs, our ph.d. programs enable students to pursue a wide range of research opportunities, including constructing and implementing advanced methods of data analysis to address crucial cross-disciplinary questions, along with developing the fundamental theory that supports these methods..
Unique opportunities for our Ph.D. students include:
- We host four cross-disciplinary joint Ph.D. programs for students who want to specialize in machine learning , public policy , neuroscience , and the link between engineering and policy .
- Our faculty have deep involvement in a range of important, data-rich scientific collaborations, including in the areas of genetics, neuroscience, astronomy, and the social sciences. This allows students to have easy access to both the crucial questions in these fields, and to the data that can provide the answers.
- Students begin work on their Advanced Data Analysis Project in the second semester. This year-long, faculty/student collaboration, distinct from the thesis, provides an immediate intensive research experience.
- Carnegie Mellon is home to the first Machine Learning Department . Many of our faculty maintain joint appointments with this Department and they (and our students) have strong connections to this exciting and growing area of research.
The programs leading to the degree of Doctor of Philosophy in Statistics seek to strike a balance between theoretical and applied statistics. The Ph.D. program prepares students for university teaching and research careers, and for industrial and governmental positions involving research in new statistical methods. Four to five years are usually needed to complete all requirements for the Ph.D. degree.
These pages present the requirements for each of our Ph.D. programs.
The page "Core Ph.D. Requirements" lays out the requirements for all Ph.D. students, while each of the four joint programs are described under the Joint Ph.D. Degrees pages. Our Ph.D. students can also earn a Master of Science in Statistics as an intermediate step towards their ultimate goal.
Joint Ph.D. Programs
Statistics/machine learning, statistics/public policy, statistics/engineering and public policy, statistics/neural computation .

Ph.D. Program
Advising The vice chair for graduate studies is the chief graduate adviser and heads a committee of faculty advisers who may serve as academic advisers. The research interests of the members of this committee span most of the major areas of statistics. During their first quarter in the program students are required to meet with an academic adviser who assists them in planning a reasonable course of study. In addition, the academic adviser is responsible for monitoring the student’s degree progress and approving the study list each quarter. Students are encouraged to begin thinking about their research interests as early as possible. After the student identifies a dissertation topic, the chair of the dissertation committee becomes the student’s academic adviser.
Continuing students should meet with either the vice chair for graduate studies or their academic adviser at least once each quarter and a record of this interview is placed in the student’s academic file. Each fall a committee consisting of all regular departmental faculty meet to evaluate the progress of all enrolled doctoral students. This committee decides if students are making satisfactory progress, and if not offers specific recommendations to correct the situation. For students who have begun dissertation work, the determination of satisfactory progress is typically delegated to the academic adviser. Students who are found to be consistently performing unsatisfactorily may be recommended for termination by a vote of this committee. Doctoral students normally are considered to be making satisfactory progress if they take the written qualifying examination in the summer following their first year of study and the University Oral Qualifying Examination by the end of their second year.
Major Fields or Sub-disciplines The strengths of current and prospective faculty dictate the specific fields of emphasis in the department: applied multivariate analysis; bioinformatics ( Center for Statistical Research in Computational Biology ); computational and computer-intensive statistics; computer vision; cognition; artificial intelligence; machine learning ( Center for Vision, Cognition, Learning, and Autonomy ); social statistics ( Center for Social Statistics ); experimental design and environmental statistics.
Foreign Language Requirement None.
Course Requirements Students are required to pass, with a grade of B- or better, 54 units of approved graduate course work (200 series) and to maintain an overall grade-point average of 3.0 or better. At least 40 of these units must be in courses from this department; the remaining units may be from courses in related departments. Students are strongly encouraged to take Statistics 200A-200B-200C, 201A-201B-201C, and 202A-202B-202C. All doctoral students are required to take Statistics 290 for at least six quarters, and strongly encouraged to take Stats 290 during each quarter of enrollment. In addition, all doctoral students can take Statistics 296 and/or 596, or 599 as needed. Please note that up to two units of Statistics 285 and eight units of Statistics 596 can be counted toward the 40 units from our department. Stats 290, 296, and 599 are not counted.
Students with gaps in their previous training are allowed to take, with the approval of their academic adviser, undergraduate courses offered by the department. However, Statistics 100A-100B-100C, 101A-101B-101C and 102A-102B-102C may not be applied toward course requirements for a graduate degree in the department. Students who need a basic refresher course are encouraged to take Statistics 100A-100B-100C.
Teaching Experience Students are required to complete at least one quarter of service as a teaching assistant for a minimum of 25% time appointment. Students who serve as teaching assistants in the department must have taken or be currently enrolled in Statistics 495A-495B-495C. International students for whom English is a second language must pass either the Test of Spoken English (TSE) or the UCLA Test of Oral Proficiency (TOP) in English before they may serve as teaching assistants.
Written and Oral Qualifying Examinations Academic Senate regulations require all doctoral students to complete and pass university written and oral qualifying examinations prior to doctoral advancement to candidacy. Also, under Senate regulations, the University Oral Qualifying Examination is open only to the student and appointed members of the doctoral committee. In addition to university requirements, some graduate programs have other pre-candidacy examination requirements. What follows in this section is how students are required to fulfill all of these requirements for this doctoral program.
All committee nominations and reconstitutions adhere to the Minimum Standards for Doctoral Committee Constitution.
The written qualifying examination consists of a high-quality paper, solely authorized by the student. This paper can be a research paper containing an original contribution, or a focused critical survey paper. The paper should demonstrate that the student understands and can integrate and communicate ideas clearly and concisely. The paper should be approximately 10 pages, single-spaced, and the style should be suitable for submission to a first-rate journal or technical conference. Any contributions that are not the student’s, including those of the student’s adviser, must be explicitly acknowledged in detail.
After passing the written qualifying examination, students select a doctoral committee that administers the University Oral Qualifying Examination, required for advancement to candidacy. Students are encouraged to begin thinking about their research interests as early as possible and to seek out faculty members who might serve on their doctoral committee. Students making satisfactory progress are expected to take the written qualifying examination in the summer following their first year of study and the University Oral Qualifying Examination by the end of their second year.
Advancement to Candidacy Students are advanced to candidacy and awarded the Candidate in Philosophy (C.Phil.) degree upon successful completion of the written and oral qualifying examinations.
Doctoral Dissertation Every doctoral degree program requires the completion of an approved dissertation that demonstrates the student’s ability to perform original, independent research and constitutes a distinct contribution to knowledge in the principal field of study.
Final Oral Examination (Defense of the Dissertation) Required for all students in the program. Please see the Advice on Taking the Oral Exam for more information.
Time-to-Degree Students are expected to advance to candidacy for the Ph.D. degree within six quarters of full-time work. Completion of all degree requirements (including the dissertation) normally takes 15 quarters. The maximum time to degree is 24 quarters.
Termination of Graduate Study and Appeal of Termination
University Policy
A student who fails to meet the above requirements may be recommended for termination of graduate study. A graduate student may be disqualified from continuing in the graduate program for a variety of reasons. The most common is failure to maintain the minimum cumulative grade point average (3.00) required by the Academic Senate to remain in good standing (some programs require a higher grade point average). Other examples include failure of examinations, lack of timely progress toward the degree and poor performance in core courses. Probationary students (those with cumulative grade point averages below 3.00) are subject to immediate dismissal upon the recommendation of their department. University guidelines governing termination of graduate students, including the appeal procedure, are outlined in Standards and Procedures for Graduate Study at UCLA.
Special Departmental or Program Policy for the Ph.D. Program
A student who does not advance to doctoral candidacy within six quarters of full-time study is subject to a recommendation for termination. The graduate vice chair informs a student of such a recommendation and the student is asked to submit a written appeal and to solicit letters of support from members of the faculty. The appeal is considered by the Graduate Studies Committee, which makes the final departmental decision.
For Students Who Entered Before Fall 2022 Please click this link . Then navigate to “Program Requirements” in the tab that opens and select the academic year when you matriculated.
Timeline to Filing Your Dissertation
- By Fall of your 2nd year, choose your Faculty Adviser and discuss with your faculty adviser who will be on your committee.
- Complete and submit the Nomination of Doctoral Committee Form at least one month before you take your orals.
- Contact Student Affairs to schedule a time and date to take your orals. Confirm the time and date with your committee.
- Your Adviser will let you know when you are ready to take your final orals and submit your dissertation online. When that time comes, arrange time, date and location with the student affairs office.
- If you still need more time and after you’ve advanced choose to do a Filing Fee instead please read this website carefully: https://grad.ucla.edu/academics/graduate-study/filing-fee-application/
- You must also complete the Filing Fee application found here: https://grad.ucla.edu/gasaa/etd/filingfee.pdf
- Important dates and workshops are found here: https://grad.ucla.edu/academics/calendar/thesis-dissertation-filing-deadlines-and-workshops/
- Should you choose the Filing Fee for a specific quarter, you must be registered and enrolled the quarter before AND you must submit a complete first draft of your dissertation to all committee members at the time you submit your filing fee application (in order to apply the filing fee, students must be registered and enrolled in at least 2 units the quarter before).
Faculty Research Interest See the faculty directory listing for current members and their interests at http://directory.stat.ucla.edu/ .
Advanced Data Analysis
This course provides a theoretical overview and detailed practical knowledge concerning statistical analyses of psychological data.
dr. F. Righetti
Course Description & Study Characteristics
Course Description
Course objectives
After taking this course, you have acquired knowledge and understanding of:
- the formulation of research proposals, including design, methodology, procedure and data analysis
- advanced issues in computational methods, specifically: data modeling and visualization; machine learning; text analysis.
Additionally, you have acquired the competences to:
- conduct advanced analyses in computational research and analytical
methods, including: data modelling and visualization; text analysis; machine learning.
Moreover, you will be able to:
- reflect critically on the validity and scientific and societal relevance of text and data analysis results.
Finally, you will have acquired the skills to:
- Communicate the results of data analysis in a clear and accurate way
to an academic audience using appropriate visualizations in a written report and oral presentation.
Each week, students will participate in four meetings, for which attendance will be required:
- An interactive lecture introducing the main methodology taught in that week;
- Two computer practicals in which students practice the main techniques
and work on their assignments;
- A closing workshops where students present their (draft) assignments and give each other feedback.
See the daily schedule at the end of this document for more information.
Study Characteristics
- Discipline: Social Sciences
- Type of education: in class
- Academic skill: Methods
- Graduate School: Graduate School of Social Sciences
- Start date: 09.01.2023
- End date: 03.02.2023
- Minimum number of students: -
- Maximum number of students: 5
- Admission criteria: PhD candidate from the VU-GSSS
- Concluding assessment: yes
- Assessment type: Written assignments
- With Certificate: yes
- Schedule info: 16 sessions in total, schedule information available here .
- Registration deadline: 01.12.2022
- Available to: PhD students VU-GSSS only
- Name of teachers: prof. dr. W.H. van Atteveldt, dr. K. Welbers
Contact the course coordinator for registration
This website uses cookies
You can accept all cookies or set your preferences per cookie category. You can always alter your choice by removing the cookies from your browser. VU Amsterdam and others use cookies to: 1) analyse website use; 2) personalise the website; 3) connect to social media networks; 4) show relevant advertisements. More information about the cookies we use
Cookie preferences
You can accept all cookies or you can set your preferences per cookie category. You can always alter your choice by removing the cookies from your browser. See more information in the cookie statement.
Personal settings:
These cookies are used to ensure that our website operates properly.
These cookies help to analyse the use of the website. These measurement data are subsequently used to improve the website.
Personalisation
These cookies are used to analyse how you use our website. This enables us to adapt our website content with information that suits your interests.
Social media
These cookies are placed by social media networks. For example, if you watch a YouTube video embedded in the website, or use the social media buttons on our website to share or like a post. This allows social media networks to track your internet behaviour and use that for their own purposes.
Advertising
These cookies are placed by advertising partners. They are used to show you relevant advertisements for Vrije Universiteit Amsterdam on other websites that you visit. They enable advertising networks to track your internet behaviour.
10 free data analytics courses you can take online

Data analytics is the science of taking raw data, cleaning it, and analyzing it to inform conclusions and support decision making. From business to health care to social media, data analytics is changing the way organizations operate.
“It’s not hyperbole to say that data analytics has really taken over the world,” says Brian Caffo, professor of biostatistics at Johns Hopkins University’s Bloomberg School of Public Health and director of academic programs for the university’s Data Science and AI Institute. “Every domain has become increasingly quantitative to inform decision making.”
Berkeley's Data Science Master's
And this space isn’t slowing down anytime soon: The U.S. Bureau of Labor Statistics projects that employment for data scientists will grow 35% from 2022 to 2032, with 17,700 new job openings projected each year on average during that decade.
Interested in becoming a data analyst? Below, we’ve compiled ten free data analytics courses to help give you a firmer grasp of this rapidly growing field.
A/B Testing
About: This course covers the design and analysis of A/B tests, which are online experiments that compare two versions of content to see which one appeals to viewers more. A/B tests are used throughout the tech industry by companies like Amazon and Google. This course is offered through Udacity.
Course length: Six self-paced modules
Who this course is for: Beginners
What you’ll learn: In this course you’ll learn about A/B testing, experiment ethics, how to choose metrics, design an experiment, and analyze results.
Prerequisites: None
Data Analytics Short Course
About: In this quick, five-tutorial course you’ll get a broad overview of data analytics. You’ll learn about the different types of roles in data analytics, a summary of the tools and skills you’ll need to develop, and a hands-on introduction to the field. This course is offered by CareerFoundry.
Course length: 75 minutes, divided into five 15-minute lessons
What you’ll learn: In this course you’ll get an introduction to data analytics. You’ll also analyze a real dataset to solve a business problem through data cleaning, visualizations, and garnering final insights.
Prerequisites: None
Data Science: R Basics
About: This program gives you a foundational knowledge of programming language R. Offered by HarvardX through the EdX platform, this course is offered for free; the paid version includes a credential. It’s the first of ten courses HarvardX offers as part of its Professional Certificate in Data Science.
Course length: Eight weeks, 1–2 hours per week
What you’ll learn: In this course you’ll learn basic R syntax and foundational R programming concepts, including data types, vectors arithmetic, and indexing. You’ll also perform operations that include sorting, data wrangling using dplyr, and making plots.
“It’s the basics of how to wrangle, analyze, and visualize data in R,” says Dustin Tingley, Harvard University’s deputy vice provost for advances in learning and a professor of government in the school’s government department. “That gets you writing a little bit of code, but you’re not doing anything that heavy.”
Prerequisites: HarvardX recommends having an up-to-date browser to enable programming directly in a browser-based interface
Fundamentals of Qualitative Research Methods
About: This course will teach you the fundamentals of qualitative research methods. Qualitative research provides deeper insights into real-world problems that might not always be immediately evident. This course is offered through Yale University on YouTube.
Course length: 90 minutes spread out over six modules
What you’ll learn: In this course you’ll learn how qualitative research is a way to systematically collect, organize, and interpret information that is difficult to measure quantitatively. This includes developing qualitative research questions, gathering data through interviews and focus groups, and analyzing this data.
“Qualitative research is the systematic, rigorous application of narratives and tools to better understand a complex phenomenon,” says Leslie Curry, a professor of public health and management at the Yale School of Public Health and a professor of management at the Yale School of Management. She adds that this approach can help understand flaws in large data sets. “It can be used as an adjunct to a lot of the really important work that’s happening in large data analysis.”
Getting and Cleaning Data
About: This course covers the basic ways that data can be obtained and how that data can be cleaned to make it “tidy.” It will also teach you the components of a complete data set, such as raw data, codebooks, processing instructions, and processed data. This course is offered by Johns Hopkins University through Coursera, and is part of a 10-course Data Science Specialization series.
Course length: Four weeks, totaling approximately 19 hours
What you’ll learn: Through this course you’ll learn about common data storage systems, how to use R for text and date manipulation, how to use data cleaning basics to make data “tidy,” and how to obtain useable data from the web, application programming interfaces (APIs), and databases.
“It’s the starting point” when it comes to data analysis, Caffo says. “Without a good data set that is cleaned and appropriate for use, you have nothing. You can talk all you want about doing models or whatnot—underlying that has to be the data to support it.”
Prerequisites: None
Introduction to Data Science with Python
About: This course teaches you concepts and techniques to give you a foundational understanding of data science and machine learning. Offered by HarvardX through the EdX platform, this course can be taken for free. The paid version offers a credential.
Course length: Eight weeks, 3–4 hours a week
Who this course is for: Intermediate
What you’ll learn: This course will give you hands-on experience using Python to solve real data science challenges. You’ll use Python programming and coding for modeling, statistics, and storytelling.
“It gets you up and running with the main workhorse tools of data analytics,” says Tingley. “It helps to set people up to take more advanced courses in things like machine learning and artificial intelligence.”
Prerequisites: None, but Tingley says having a basic background in high school-level algebra and basic probability is helpful. Some programming experience—particularly in Python—is recommended
Introduction to Databases and SQL Querying
About: In this course you’ll learn how to query a database, create tables and databases, and be proficient in basic SQL querying. This free course is offered through Udemy.
Course length: Two hours and 17 minutes
What you’ll learn: This course will acquaint you with the basic concepts of databases and queries. This course will walk you through setting up your environment, creating your first table, and writing your first query. By the course’s conclusion, you should be able to write simple queries related to dates, string manipulation, and aggregation.
Introduction to Data Analytics
About: This course offers an introduction to data analysis, the role of a data analyst, and the various tools used for data analytics. This course is offered by IBM through Coursera.
Course length: Five modules totaling roughly 10 hours
What you’ll learn: This course will teach you about data analytics and the different types of data structures, file formats, and sources of data. You’ll learn about the data analysis process, including collecting, wrangling, mining, and visualizing data. And you’ll learn about the different roles within the field of data analysis.
Learn to Code for Data Analysis
About: This course will teach you how to write your own computer programs, access open data, clean and analyze data, and produce visualizations. You’ll code in Python, write analyses and do coding exercises using the Jupyter Notebooks platform. This course is offered through the United Kingdom’s Open University on its OpenLearn platform.
Course length: Eight weeks, totaling 24 hours
What you’ll learn: In this course you’ll learn basic programming and data analysis concepts, recognize open data sources, use a programming environment to develop programs, and write simple programs to analyze large datasets and produce results.
Prerequisites: A background in coding—especially Python—is helpful
The Data Scientist’s Toolbox
About: This course will give you an introduction to the main tools and concepts of data science. You will learn the ideas behind turning data into actionable knowledge and get an introduction to tools like version control, markdown, git, GitHub, R, and RStudio. This course is offered by Johns Hopkins University through Coursera, and is part of a 10-course Data Science Specialization series.
Course length: 18 hours
What you’ll learn: This course will teach you how to set up R, RStudio, GitHub, and other tools. You will learn essential study design concepts, as well as how to understand the data, problems, and tools that data analysts use.
“That course is a very accessible introduction for anyone who wants to get started in this,” Caffo says. “It’s an overview that covers the full pipeline, from things like collecting and arranging data to asking good questions, all the way to creating a data deliverable.”
The takeaway
From businesses estimating demand for their products to political campaigns figuring out where they should run advertisements to health care professionals running clinical trials to judge a drug’s efficacy, data analytics has a wide variety of applications. Getting a better understanding of the field on your own time can be done easily and freely. And the field is only growing.
“Just about every field is having a revolution in data analytics,” Caffo says. “In fields like medicine that have always been data driven, it’s become more data-driven.”
Syracuse University MS in Applied Data Science Online
Mba rankings.
- Best Online MBA Programs for 2024
- Best Online Master’s in Accounting Programs for 2024
- Best MBA Programs for 2024
- Best Executive MBA Programs for 2024
- Best Part-Time MBA Programs for 2024
- 25 Most Affordable Online MBAs for 2024
- Best Online Master’s in Business Analytics Programs for 2024
Information technology & data rankings
- Best Online Master’s in Data Science Programs for 2024
- Most Affordable Master’s in Data Science for 2024
- Best Master’s in Cybersecurity Degrees for 2024
- Best Online Master’s in Cybersecurity Degrees for 2024
- Best Online Master’s in Computer Science Degrees for 2024
- Best Master’s in Data Science Programs for 2024
- Most Affordable Online Master’s in Data Science Programs for 2024
- Most Affordable Online Master’s in Cybersecurity Degrees for 2024
Health rankings
- Best Online MSN Nurse Practitioner Programs for 2024
- Accredited Online Master’s of Social Work (MSW) Programs for 2024
- Best Online Master’s in Nursing (MSN) Programs for 2024
- Best Online Master’s in Public Health (MPH) Programs for 2024
- Most Affordable Online MSN Nurse Practitioner Programs for 2024
- Best Online Master’s in Psychology Programs for 2024
Leadership rankings
- Best Online Doctorate in Education (EdD) Programs for 2024
- Most Affordable Online Doctorate in Education (EdD) Programs for 2024
- Coding Bootcamps in New York for 2024
- Best Data Science and Analytics Bootcamps for 2024
- Best Cybersecurity Bootcamps for 2024
- Best UX/UI bootcamps for 2024
Boarding schools
- World’s Leading Boarding Schools for 2024
- Top Boarding School Advisors for 2024
Earn Your Master’s in Data Science Online From SMU
- Request Info
Data Analytics Students Win Global Data Competition
- Home / News / 2024 / April / SAS Data Analytics Competition
Posted on April 17, 2024 by Christopher Reichert

Members of the winning SAS data analytics competition
The team was comprised of students in the college’s M.S. in Data Analytics program and were named the Data Crusaders. Team members were Niharika Bandlamudi , Ki Jeong , Nupoor Karnik and Gagana Uday Kumar .
For their competition entry, the team analyzed data from the 17 most-populated countries in the world to explore how population growth affected energy usage. What they found surprised them. The students had expected that as a country’s population increased, so would its energy consumption – and for about 75% of countries this was true.
However, in the remaining countries, energy usage appeared to stay the same or even decrease. The team hypothesizes that this is due to increased energy conservation efforts as well as the miniaturization and improved efficiency of modern electronic devices. The Data Crusaders also tracked the prevalence of renewable energy sources over time, their data showing that from 1995-2021, the reliance on renewable energy more than doubled.
“It was a great selection of a research topic,” said Isil Koyuncu , faculty advisor and assistant professor of management science and statistics. “It’s so relevant, and caring about society and sustainability is really important. We need more research in this area.”
Initially the Data Crusaders had no intentions of competing in the Curiosity Cup. It wasn’t until Koyuncu suggested entering that the team learned the competition even existed.
“It was originally just a classroom project,” Jeong said. “But from the beginning, she encouraged us to apply to the Curiosity Cup and was supportive the whole way. Then, while we were doing it, we realized our project was pretty decent, so we decided to polish it up and submit it, and we ended up being finalists.”
For the Data Crusaders, this outcome was completely unexpected. “I think we didn’t believe in ourselves,” said Karnik. “We didn’t think that we would get selected, and when we got selected, we were over the moon.”
As competition winners, the members of the Data Crusaders are allowed to select from a variety of prizes, from an Apple iPad to a Nintendo Switch. All winners and runners-up will also receive 12 months of access to SAS software of their choice. But regardless of prizes won, the Data Crusaders say the experience alone was worth the effort they put into their project.
“We’re at a stage now where we’re starting to realize we’re actually developing as proper data analysts,” Jeong said. “Before this, it was very much a student mindset: we’re still learning, we’re not good enough, we’re very new at this, let’s just do our best. But now, we’re starting to transition into mature data analysts. With that, we’re gaining a sense of confidence in our abilities.”
This self-confidence, Kumar agrees, is the real prize of the Curiosity Cup. “It’s not for anybody else, it’s for yourself. It gives you the confidence that you are ready to face the world and ready to take up any job. You’re going to be the best at it. This is a stepping stone. So, if just to boost your own confidence, take that leap.”
The Curiosity Cup is an annual data analytics challenge sponsored by analytics and artificial intelligence software developer SAS Institute. This year’s competition featured 107 teams from 19 countries all competing to be recognized for their data preparation, analysis and presentation.
For more information on the SAS Curiosity Cup or to view the presentation video, visit https://www.sas.com/en_us/events/23q3/curiosity-cup.html .
Tags: Cyber , Undergraduate
- Latest News
- News Archive 2023 2022 2021 2020 2019 2018 2017 2016 2015 2014
- Annual Reports 2022 2021 2019 2018 2017 2016 2015 2014 2013 2012
- Request Info Visit Apply
- Business Building
- One UTSA Circle
- San Antonio, TX 78249
- Contact Webmaster
Stay Connected to the Alvarez College of Business
Office Listing
Maps and Directions
Connect with Us
Faculty/Staff Links
Business Service Center
College Intranet
Communications and Marketing Requests
Dean Event/Speaking Request Form
ES Seminar: “Data Analysis for Nonparametric Survey Results”, 4:30PM April 19 2024 (EN)
You are cordially invited to the hybrid research seminar organized by the Department of Educational Sciences.
Speakers: Dr. Scott Courtney and Dr. Anita Alexander Title: Data Analysis for Nonparametric Survey Results: ESSENTIAL DOCTORAL PROGRAM FEATURES IDENTIFIED BY MATHEMATICS EDUCATION UNIVERSITY FACULTY
Date: Friday, 19 April Time: 16:30-17:20 Location: G – 160 (hybrid)
Zoom information: Time: Apr 19, 2024 04:30 PM Istanbul
This is an online seminar. To obtain event details please send a message to department.
Abstract: The purpose of this study was to learn from university faculty with a doctorate in mathematics education from across the world about how programs in mathematics education should prepare doctoral students for research and teaching in mathematics education. This seminar will present some of the quantitative results from this ongoing study with a focus on how to analyze nonparametric data. Since the quantitative survey items were of Likert Scale type, results of the Kruskal-Wallis H test which indicated a significant difference in the selected importance levels between the different program features are presented, along with the post hoc Dunn’s test using a Šidák correction. The researchers aim to demonstrate the strength of such nonparametric data analyses to model appropriate strategies for analysing ordinal data.
About the speakers: Dr. Scott Courtney is a Mathematics Education Associate Professor in the School of Teaching, Learning, and Curriculum Studies at Kent State University in the United States. He is also the current Program Coordinator for the Curriculum and Instruction Program in the College of Education, Health and Human Services. Dr. Courtney has directed multiple state-funded mathematics and science partnership projects. His research interests include teachers’ conceptions of mathematics and statistics in grades 6–14, instructional engagements propitious for student development of intended ideas and ways of thinking, and teachers’ conceptions and ways of thinking that support or constrain their capacity to transform their cognitions with cognitive structures that are more conceptually oriented. In addition, Dr. Courtney’s research explores teachers’ and their students’ experiences with digital/ICT-based resources, with a particular focus on developing and investigating synchronous online workshops and courses for mathematics teachers.
Dr. Anita Alexander is an Assistant Professor of Mathematics Education at Bilkent University. Her primary research interest is in changing the teaching norms and improving the instructional strategies of university mathematics instructors, with a focus on Inquiry-Based Learning and the 5E Model, Differentiation, and effective practice in STEM Education. Currently Dr. Alexander is working with undergraduate and graduate mathematics students to inspire the next generation of mathematics professors to move away from the culture of passive lecture, toward a classroom environment that promotes inquiry, discourse, and collaboration in advanced mathematics. As a teacher educator, she models effective practice in teaching with the hope that both current and future educators implement engaging activities, differentiate their lessons, and seek feedback as lifelong learners.
Information for:
- International Students
- Exchange Students
- Faculty / Staff
- Prospective Students
Numbers, Facts and Trends Shaping Your World
Read our research on:
Full Topic List
Regions & Countries
- Publications
- Our Methods
- Short Reads
- Tools & Resources
Read Our Research On:
10 facts about today’s college graduates

Having a bachelor’s degree remains an important advantage in many sectors of the U.S. labor market. College graduates generally out-earn those who have not attended college, and they are more likely to be employed in the first place. At the same time, many Americans say they cannot afford to get a four-year degree – or that they just don’t want to.
Here are key facts about American college graduates.
This Pew Research Center analysis about U.S. college graduates relies on data from sources including the Census Bureau, the Bureau of Labor Statistics, the National Center for Education Statistics, the National Student Clearinghouse and the Federal Reserve Bank, as well as surveys conducted by the Center.
Everyone who took the Pew Research Center surveys cited is a member of the Center’s American Trends Panel (ATP), an online survey panel that is recruited through national, random sampling of residential addresses. This way nearly all U.S. adults have a chance of selection. The survey is weighted to be representative of the U.S. adult population by gender, race, ethnicity, partisan affiliation, education and other categories. Read more about the ATP’s methodology .
Nearly four-in-ten Americans ages 25 and older have a bachelor’s degree, a share that has grown over the last decade. As of 2021, 37.9% of adults in this age group held a bachelor’s degree, including 14.3% who also obtained a graduate or professional degree, according to data from the Census Bureau’s Current Population Survey. That share is up 7.5 percentage points from 30.4% in 2011.
An additional 10.5% had an associate degree in 2021. About four-in-ten Americans ages 25 and older had a high school diploma with no further education (25.3%) or completed some college but didn’t have a degree (14.9%).
In a reversal, women are now more likely than men to graduate from college, according to the Current Population Survey . In 2021, 39% of women ages 25 and older had a bachelor’s degree or more education, compared with 37% of men in the same age range. The gap in college completion is even wider among adults ages 25 to 34: 46% of women in this age group have at least a bachelor’s degree, compared with 36% of men.

In an October 2021 Pew Research Center survey of Americans without a degree, 34% of men said a major reason why they have not received a four-year college degree is that they just didn’t want to. Only one-in-four women said the same. Men were also more likely to say a major reason they didn’t have a four-year degree is that they didn’t need more education for the job or career they wanted (26% of men said this vs. 20% of women).

Women (44%) were more likely than men (39%) to say not being able to afford college was a major reason they don’t have a bachelor’s degree. Men and women were about equally likely to say a major impediment was needing to work to help support their family.

There are racial and ethnic differences in college graduation patterns, as well as in the reasons for not completing a degree. Among adults ages 25 and older, 61% of Asian Americans have a bachelor’s degree or more education, along with 42% of White adults, 28% of Black adults and 21% of Hispanic adults, according to 2021 Current Population Survey data. The share of bachelor’s degree holders in each group has increased since 2010. That year, 52% of Asian Americans had a four-year degree or more, compared with a third of White adults, 20% of Black adults and 14% of Hispanic adults.
The October 2021 Center survey found that among adults without a bachelor’s degree, Hispanic adults (52%) were more likely than those who are White (39%) or Black (41%) to say a major reason they didn’t graduate from a four-year college is that they couldn’t afford it. Hispanic and Black adults were more likely than their White counterparts to say needing to work to support their family was a major reason.
While a third of White adults said not wanting to go to school was a major reason they didn’t complete a four-year degree, smaller shares of Black (22%) and Hispanic (23%) adults said the same. White adults were also more likely to cite not needing more education for the job or career they wanted. (There weren’t enough Asian adults without a bachelor’s degree in the sample to analyze separately.)

Only 62% of students who start a degree or certificate program finish their program within six years, according to the most recent data from the National Student Clearinghouse , a nonprofit verification and research organization that tracked first-time college students who enrolled in fall 2015 with the intent of pursuing a degree or certificate. The degree completion rate for this group was highest among students who started at four-year, private, nonprofit schools (78.3%), and lowest among those who started at two-year public institutions (42.2%).
Business is the most commonly held bachelor’s degree, followed by health professions. According to the National Center for Education Statistics , about a fifth (19%) of the roughly 2 million bachelor’s degrees conferred in 2019-20 were in business. Health professions and related programs were the second most-popular field, making up 12.6% of degrees conferred that year. Business has been the single most common major since 1980-81; before that, education led the way.
The least common bachelor’s degrees in 2019-20 were in military technologies and applied sciences (1,156 degrees conferred in 2019-20), library science (118), and precision production (39).
There is a growing earnings gap between young college graduates and their counterparts without degrees. In 2021, full-time workers ages 22 to 27 who held a bachelor’s degree, but no further education, made a median annual wage of $52,000, compared with $30,000 for full-time workers of the same age with a high school diploma and no degree, according to data from the Bureau of Labor Statistics. This gap has widened over time. Young bachelor’s degree holders earned a median annual wage of $48,481 in 1990, compared with $35,257 for full-time workers ages 22 to 27 with a high school diploma.
The unemployment rate is lower for college graduates than for workers without a bachelor’s degree, and that gap widened as a result of the coronavirus pandemic. In February 2020, just before the COVID-19 outbreak began in the U.S., only 1.9% of college graduates ages 25 and older were unemployed, compared with 3.1% of workers who completed some college but not a four-year degree, and 3.7% of workers with only a high school diploma. By June 2020, after the pandemic hit, 6.8% of college grads, 10.8% of workers with some college, and 12.2% of high school grads were unemployed.
By March 2022, the unemployment rate had nearly returned to pre-pandemic levels for college graduates (2%) while dropping to 3% among those with some college education but no four-year degree, and 4% among those with only a high school diploma.

Recent college graduates are more likely than graduates overall to be underemployed – that is, working in jobs that typically do not require a college degree, according to an analysis of Census Bureau and BLS data by the Federal Reserve Bank of New York . As of December 2021, 41% of college graduates ages 22 to 27 were underemployed, compared with 34% among all college graduates. The underemployment rates for recent college grads rose in 2020 as the COVID-19 outbreak strained the job market, but have since returned to pre-pandemic levels.
As of the end of 2021, only 34% of underemployed graduates ages 22 to 27 worked what the Fed defines as “good non-college jobs” – those paying at least $45,000 a year – down from around half in the 1990s. The share of underemployed graduates ages 22 to 27 in low-wage jobs – those earning less than $25,000 annually – rose from about 9% in 1990 to 11% last year.

When it comes to income and wealth accumulation, first-generation college graduates lag substantially behind those with college-educated parents, according to a May 2021 Pew Research Center analysis . Households headed by a first-generation college graduate – that is, someone who has completed at least a bachelor’s degree but does not have a parent with a college degree – had a median annual income of $99,600 in 2019, compared with $135,800 for households headed by those with at least one parent who graduated from college. The median wealth of households headed by first-generation college graduates ($152,000) also trailed that of households headed by someone with a parent who graduated from college ($244,500). The higher household income of the latter facilitates saving and wealth accumulation.
The gap also reflects differences in how individuals finance their education. Second-generation college graduates tend to come from more affluent families , while first-generation college graduates are more likely to incur education debt than those with a college-educated parent.
Most Americans with college degrees see value in their experience. In the Center’s October 2021 survey , majorities of graduates said their college education was extremely or very useful when it came to helping them grow personally and intellectually (79%), opening doors to job opportunities (70%) and developing specific skills and knowledge that could be used in the workplace (65%).
Younger college graduates were less likely than older ones to see value in their college education. For example, only a third of college graduates younger than 50 said their college experience was extremely useful in helping them develop skills and knowledge that could be used in the workplace. Among college graduates ages 50 and older, 45% said this.
- Higher Education

About 1 in 4 U.S. teachers say their school went into a gun-related lockdown in the last school year
About half of americans say public k-12 education is going in the wrong direction, what public k-12 teachers want americans to know about teaching, what’s it like to be a teacher in america today, race and lgbtq issues in k-12 schools, most popular.
1615 L St. NW, Suite 800 Washington, DC 20036 USA (+1) 202-419-4300 | Main (+1) 202-857-8562 | Fax (+1) 202-419-4372 | Media Inquiries
Research Topics
- Age & Generations
- Coronavirus (COVID-19)
- Economy & Work
- Family & Relationships
- Gender & LGBTQ
- Immigration & Migration
- International Affairs
- Internet & Technology
- Methodological Research
- News Habits & Media
- Non-U.S. Governments
- Other Topics
- Politics & Policy
- Race & Ethnicity
- Email Newsletters
ABOUT PEW RESEARCH CENTER Pew Research Center is a nonpartisan fact tank that informs the public about the issues, attitudes and trends shaping the world. It conducts public opinion polling, demographic research, media content analysis and other empirical social science research. Pew Research Center does not take policy positions. It is a subsidiary of The Pew Charitable Trusts .
Copyright 2024 Pew Research Center
Terms & Conditions
Privacy Policy
Cookie Settings
Reprints, Permissions & Use Policy
Cookie Acceptance Needed
This website would like to use cookies to collect information to improve your browsing experience. Please review our Privacy Statement for more information. Do you accept?
accept deny
College of Sciences and Mathematics Homepage
- Toggle Search
- Find People
COSAM News Articles 2024 01 Sean Grate will present "Bootstrapping Computations in Topological Data Analysis" at COSAM Graduate Student Research Forum (GSRF) on April 17.
Sean Grate will present "Bootstrapping Computations in Topological Data Analysis" at COSAM Graduate Student Research Forum (GSRF) on April 17.
Published: 04/17/2024

Sean Grate will present "Bootstrapping Computations in Topological Data Analysis" at COSAM Graduate Student Research Forum (GSRF) on April 17 th at 5 PM in CASIC Building Room 109/110 (559 Devall Drive AU Research Park).
FREE PARKING and FREE FOOD! Dinner from Taco Mama will be catered before the forum.
Latest Headlines
- Hal Schenck has been elected as a 2023 AAAS Fellow! 04/18/2024
- Congratulations to Elvan Ceyhan, recipient of the Marie Kraska Award for Excellence in Teaching 04/18/2024
- Congratulations to Joe Briggs, recipient of the Robert K. Butz Award for Excellence in Teaching 04/18/2024
- Sean Grate will present "Bootstrapping Computations in Topological Data Analysis" at COSAM Graduate Student Research Forum (GSRF) on April 17. 04/17/2024
- DMS Drs. Overtoun Jenda and Peter Johnson have their grant that supports the REU program renewed by the NSF. 04/12/2024
Stay Connected
IMAGES
VIDEO
COMMENTS
Data Analytic Tools That PhDs Actually Like. Written by R3ciprocity_Team in phd. Graduate and doctoral students, as well as academics, should demonstrate competency in using data analysis software to conduct quantitative or qualitative studies. The use of data analytics software and platforms by students and academics to perform predictive ...
An NRT-sponsored program in Data Science Overview Overview Advances in computational speed and data availability, and the development of novel data analysis methods, have birthed a new field: data science. This new field requires a new type of researcher and actor: the rigorously trained, cross-disciplinary, and ethically responsible data scientist. Launched in Fall 2017, the …
PhD in Analytics and Data Science. Students pursuing a PhD in analytics and data science at Kennesaw State University must complete 78 credit hours: 48 course hours and 6 electives (spread over 4 years of study), a minimum 12 credit hours for dissertation research, and a minimum 12 credit-hour internship.
A PhD in Data Analytics or a closely related field will always contain a set of courses in advanced analytics & data science subjects. These courses can come from multiple departments (e.g. Computer Science, Mathematics & Statistics, Industrial Engineering, Psychology, etc.). Examples include: Big Data Analytics.
Data analysis is a crucial component of any PhD research project, and having the right tools at your disposal can greatly enhance the accuracy and efficiency of your analysis. One such tool widely ...
PhD Program Overview. The doctoral program in Statistics and Data Science is designed to provide students with comprehensive training in theory and methodology in statistics and data science, and their applications to problems in a wide range of fields. The program is flexible and may be arranged to reflect students' interests and career goals.
PhD in Data Analytics Programs. A PhD in data analytics prepares professionals to work in data-driven fields, including research, business, healthcare, and government. The most common reason people pursue a PhD in a data-related field is that they are passionate about data and would like to have a career that involves research and making ...
In-Brief Data analysis is the critical part of any research. Data analysis summarizes already collected data. It is the process that involves the interpretation of data gathered through the use of analytical and logical reasoning to determine the patterns, relationships and trends on the research topic selected. Each field, in PhD Statistical Data Analysis, has+ Read More
The PhD minor in Data Science is designed for doctoral students interested in understanding the methods of data gathering and analysis. Special Master's in Computer Science A Master's degree in Computer Science (CS) is available to students enrolled in a PhD or MS/PhD program in statistics.
Students in the Big Data Analytics PhD program are expected to complete their degree in no more than seven years. Our full-time students are expected to complete the PhD degree in four years from the Bachelor's degree or in three years for those with a MS degree in Statistics, Data Science track.
PhD candidates are also encouraged to acquire transferable skills — for example, in data analysis, public engagement, project management or business, economics and finance.
The cost of a PhD in Data Science will depend on the university you study with, but average tuition fee is £4000-£6000 per academic year for UK/EU students and £16,000-£19,000 per academic year for international students. Due to the popularity of Data Science PhD projects and the increasing demand for individuals who can elaborately analyse ...
A PhD in data analytics can help anyone upgrade their status in data science and analysis. PhD in Data Analytics Benefits. ... A yearly cost of between $35,000 to $50000 is typical for a PhD in data analytics. Students pursuing doctorates frequently receive financial aid. Programs frequently provide financial assistance and tuition breaks in ...
The Ph.D. in Data Science and Analytics requires 78 total credit hours spread over four years of study. Example Program of Study: Year 2. 21 credit hours of electives in computer science, statistics, mathematics, information technology, or other area by permission. Year 4.
Entry requirements for a PhD in Data Analysis. To pursue a PhD in Data Analysis, you will typically need a strong background in mathematics or a related field. Most universities require applicants to hold a Master's degree in Mathematics, Statistics, or a relevant discipline. Additionally, a solid understanding of programming and statistical ...
A research plan outlines the steps you need to take to conduct your research effectively. It includes the research question, research objectives, research design, data collection methods, data ...
Data Analysis Workshop I. June 10-14, 2024. 1:30 p.m. - 5:00 p.m. 2 credits. Course Number: 140.613.79 (synchronous online) Course Instructor: Jenna Krall. Description: Intended for students with a broad understanding of biostatistical concepts used in public health sciences who seek to develop additional data analysis skills.
Requirements for Doctor of Philosophy (Ph.D.) in Data Science. The goal of the doctoral program is to create leaders in the field of Data Science who will lay the foundation and expand the boundaries of knowledge in the field. The doctoral program aims to provide a research-oriented education to students, teaching them knowledge, skills and ...
Introduction. All graduate students in medical fields must eventually learn about epidemiology. Graduate students also study essential subjects, such as research methodology and data analysis, to conduct and complete the research projects that are part of their degree requirements [].Studying R in an epidemiology course can help students develop important skills for data analysis ...
The Ph.D. programs of the Department of Statistics at Carnegie Mellon University enable students to pursue a wide range of research opportunities, including constructing and implementing advanced methods of data analysis to address crucial cross-disciplinary questions, along with developing the fundamental theory that supports these methods.
Students are expected to advance to candidacy for the Ph.D. degree within six quarters of full-time work. Completion of all degree requirements (including the dissertation) normally takes 15 quarters. The maximum time to degree is 24 quarters. Termination of Graduate Study and Appeal of Termination. University Policy.
Course Description. Course objectives. After taking this course, you have acquired knowledge and understanding of: - the formulation of research proposals, including design, methodology, procedure and data analysis. - advanced issues in computational methods, specifically: data modeling and visualization; machine learning; text analysis.
Introduction to Data Analytics. About: This course offers an introduction to data analysis, the role of a data analyst, and the various tools used for data analytics. This course is offered by IBM ...
Using machine learning to evaluate atomic force microscopy nanoindentation data. The University of Southampton is expanding its PhD research in the area of medical data analysis. We aim to implement machine learning to analyse atomic force microscopy nanoindentation data towards automated diagnosis of cancer biopsies.
A Ph.D. from National University costs $26,520, while the same degree from Kennesaw State University costs a minimum of $18,384. However, the tuition rates for Ph.D. programs vary significantly ...
The team was comprised of students in the college's M.S. in Data Analytics program and were named the Data Crusaders. Team members were Niharika Bandlamudi, Ki Jeong, Nupoor Karnik and Gagana Uday Kumar.. For their competition entry, the team analyzed data from the 17 most-populated countries in the world to explore how population growth affected energy usage.
Title: Data Analysis for Nonparametric Survey Results: ESSENTIAL DOCTORAL PROGRAM FEATURES IDENTIFIED BY MATHEMATICS EDUCATION UNIVERSITY FACULTY. Date: Friday, 19 April Time: 16:30-17:20 Location: G - 160 (hybrid) Zoom information: Time: Apr 19, 2024 04:30 PM Istanbul. This is an online seminar.
Presenters: Yu Jung Han, Postdoctoral Associate and Md Mamunur Rashid, PhD student In the rapidly evolving landscape of social science research, generative Artificial Intelligence (GenAI) is opening up a new era for qualitative data analysis. This Wednesday Talk will present the most recent developments and shifts in the use of generative AI for qualitative data analysis, along with the ...
This Pew Research Center analysis about U.S. college graduates relies on data from sources including the Census Bureau, the Bureau of Labor Statistics, the National Center for Education Statistics, the National Student Clearinghouse and the Federal Reserve Bank, as well as surveys conducted by the Center.
Sean Grate will present "Bootstrapping Computations in Topological Data Analysis" at COSAM Graduate Student Research Forum (GSRF) on April 17 th at 5 PM in CASIC Building Room 109/110 (559 Devall Drive AU Research Park). FREE PARKING and FREE FOOD! Dinner from Taco Mama will be catered before the forum.