
How to Write an Image Analysis Essay in 6 Easy Steps
Writing an analysis of a picture can be a little daunting, especially if analyzing and essay writing are not your strengths. Not to worry. In this tutorial, you’ll learn how to do it, even if you’re a beginner.
To write an effective visual analysis, all you need to do is break the image into parts and discuss the relationship between them. That’s it in a nutshell.
Writing an image analysis essay, whether you’re analyzing a photo, painting, or any other kind of an image, is a simple, 6-step process. Let me take you through it.
Together, we’ll analyze a simple image and write a short analysis essay based on it. You can analyze any image, such as a photo or a painting, by following these steps.
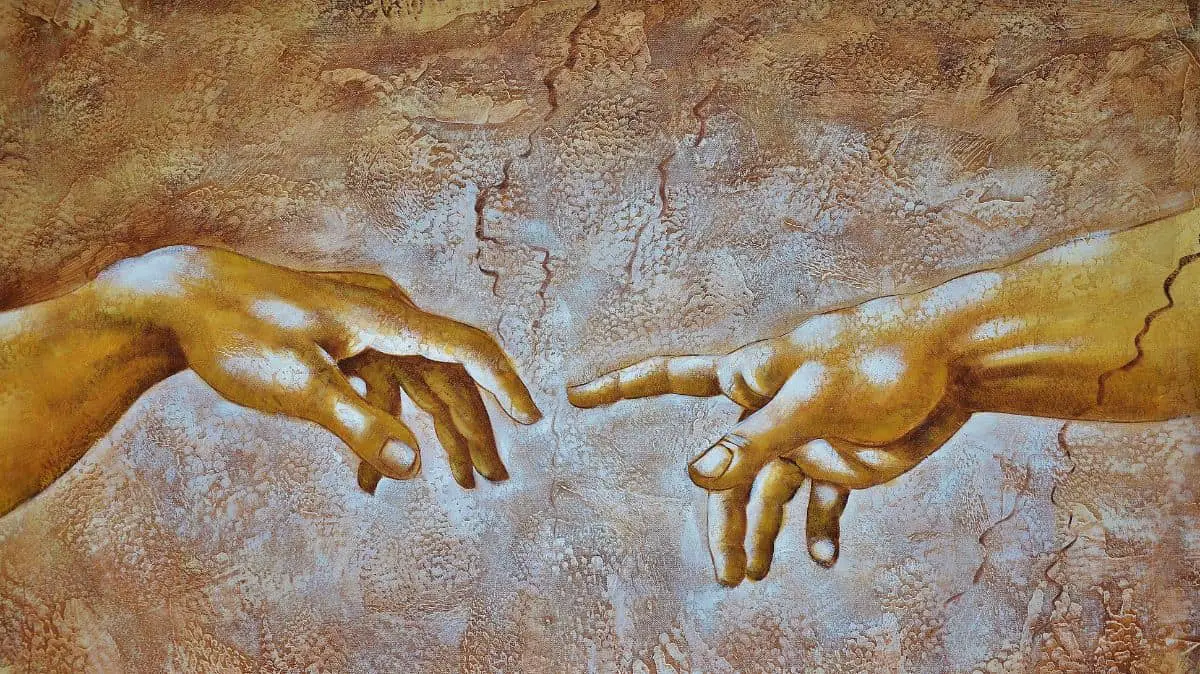
Here is a simple image we’ll analyze.

And we’re ready for the…
6 Steps to Writing a Visual Analysis Essay
Step 1: Identify the Elements
When you look at this image, what do you see?
Right now, you are not just a casual observer. You are like a detective who must inspect things thoroughly and be careful not to miss any details.
So, let’s put on our Sherlock Holmes hat, grab a magnifying glass, and make a list of all the major and some minor elements of this picture.
What do we observe?
- Children. How many? Four.
- Children’s hands. Four pairs.
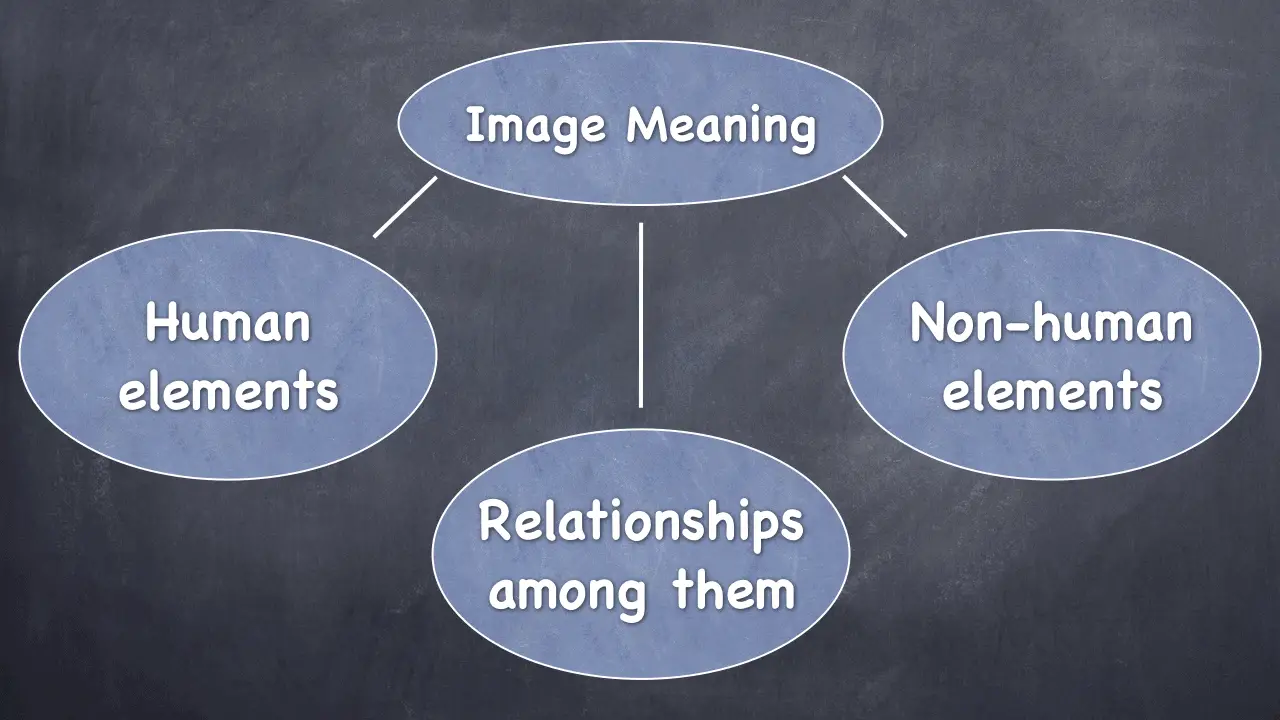
Great. These are all human elements. In fact, it would be useful for us to have two categories of elements: human and non-human.
When we group elements into categories, it will help us later when we’ll be writing the essay. Categories make it easier to think about the elements.
What other elements do we see?
- The hands are holding soil.
- Each handful of soil also has a tiny plant in it.
- Finally, we see the green lawn or ground on which the children stand.
These are all of the obvious elements in the image. But can we dig deeper and observe more?
Again, wearing our Sherlock Holmes hat, our job is to gather information that may not be immediately obvious or noticeable.
Let’s take another look, using our detective tentacles:
- The children’s hands are arranged in a circle.
- The children’s skin color varies from lighter to darker.
- The children wear summer clothes.
You may have noticed these elements even when you first saw the image. In that case, great job!
It looks like we’ve covered all the elements. We’re ready to move on to the next step.
Step 2. Detect Symbols and Connections
What does Sherlock Holmes or any good detective do after basic observation? It is time to think and use our logic and imagination.
We will now look for symbols and any connections or relationships among the elements.
Identifying Symbols
- Children symbolize future and hope.
- Their hands form a circle, creating a unifying effect. The symbol is unity, and there is power in unity.
- Children’s hands hold soil, and soil symbolizes earth, perhaps planet Earth.
- The earth holds young plants which symbolize the environment and ecology.
- The young plants also symbolize youth and the future.
- The children wear summer clothes, and summer symbolizes happiness and freedom because this is when children are on vacation and enjoy life.
Great. Now, let’s see if we can make some connections and identify some relationships among the elements and symbols.
We will use our imagination to put together some kind of a meaning.
In analyzing an image, we want to understand what the creator or the artist is trying to convey.
Do artists and photographers always want to convey something or is it sometimes just a picture?
It doesn’t matter because we never know what the artist really thought when creating the work . We’re not mind readers.
But we can always gather meaning using our own logic and imagination. We can derive meaning from any image. And that’s all we need to do to write an analysis essay.
Finding Connections and Relationships
Let’s allow our imagination to roam free and write down a few thoughts. Some ideas will be more obvious than others.
- This entire image seems to be about the future of the environment.
- Why is this future important? It’s important because of the future generations, symbolized by the children.
- A strong sense of long-term future is conveyed because not only do the children hold plants, but these are baby plants. The message is “children hold future generations.”
- The variety of skin colors implies diversity. Also, the hands form a circle. Together, these two elements can mean: “global diversity.”
As you can see, we can derive really interesting meaning from even a simple image.
We did a great job here and now have plenty of material to work with and write about. It’s time for the next step.
Step 3. Formulate Your Thesis
In this step, your task is to put together an argument that you will support in your essay. What can this argument be?
The goal of writing a visual analysis is to arrive at the meaning of the image and to reveal it to the reader.
We just finished the analysis by breaking the image down into parts. As a result, we have a pretty good idea of the meaning of the image.
Now, we need to take these parts and put them together into a meaningful statement. This statement will be our thesis.
Let’s do it.
Writing the Thesis
This whole picture may mean something like the following:
This sounds good. Let’s write another version:
This sounds good, as well. What is the difference between the two statements?
The first one places the responsibility for the future of the planet on children.
The second one places this responsibility on the entire humanity.
Therefore, the second statement just makes more sense. Based on it, let’s write our thesis.
We now have our thesis, which means we know exactly what argument we will be supporting in the essay.
Step 4: Write the Complete Thesis Statement
While a thesis is our main point, a thesis statement is a complete paragraph that includes the supporting points.
To write it, we’ll use the Power of Three. This means that we are going to come up with three supporting points for our main point.
This is where our categories from Step 1 will come in handy. These categories are human and non-human elements. They will make up the first two supporting points for the thesis.
The third supporting point can be the relationships among the elements.
We can also pick a different set of supporting points. Our job here is to simply have three supporting ideas that make sense to us.
For example, we have our elements, symbols, and connections. And we can structure the complete argument this way:
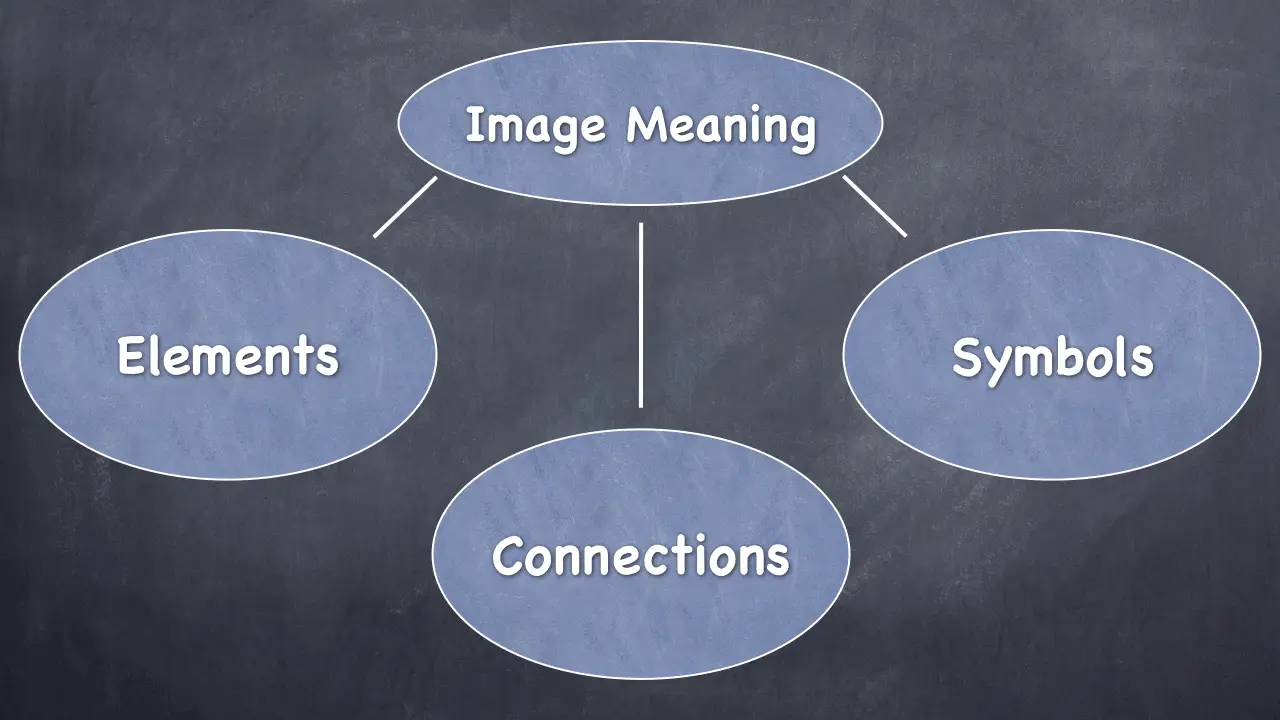
All we really need is one way to organize our thoughts in the essay. Let’s go with the first version and formulate the supporting points.
Here’s our main point again:
Here are our supporting points:
- The photographer uses the image of children to symbolize the future.
- The non-human elements in the photo symbolize life and planet Earth.
- The author connects many ideas represented by images to get the message across.
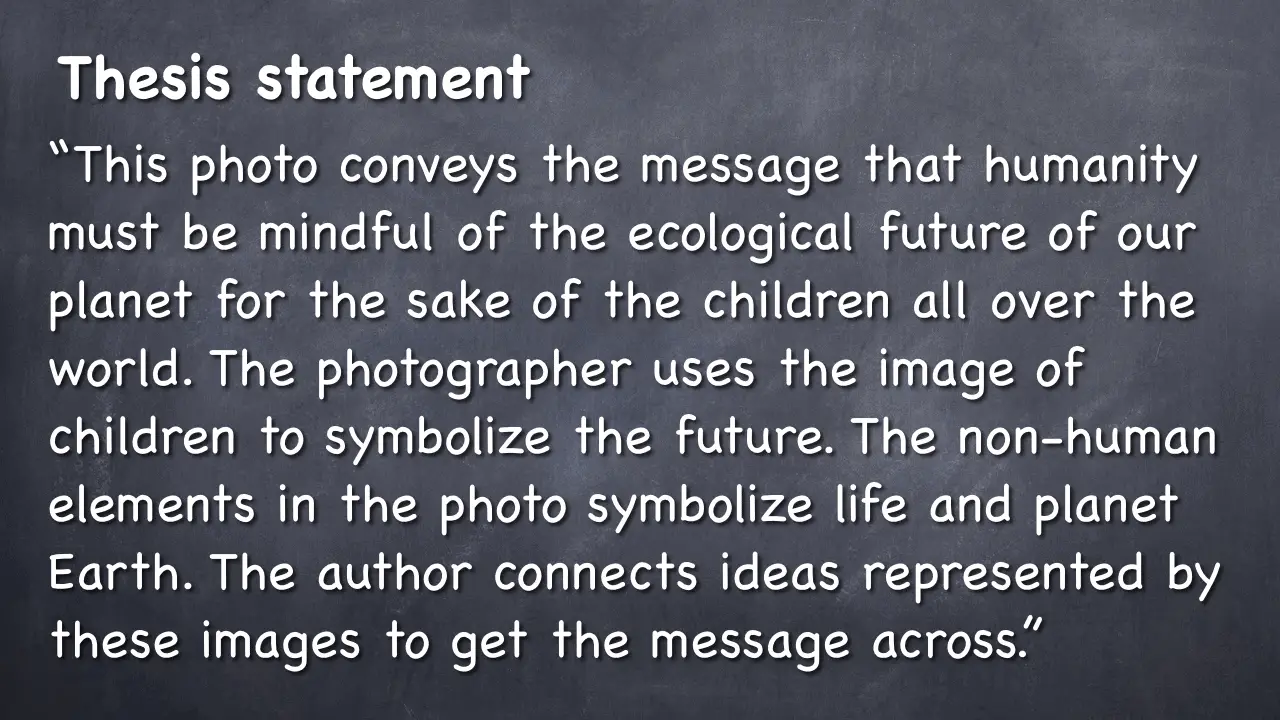
Now we have everything we need to write the complete thesis statement. We’ll just put the main and the supporting statements into one paragraph.
Thesis Statement
Step 5: write the body of your essay.
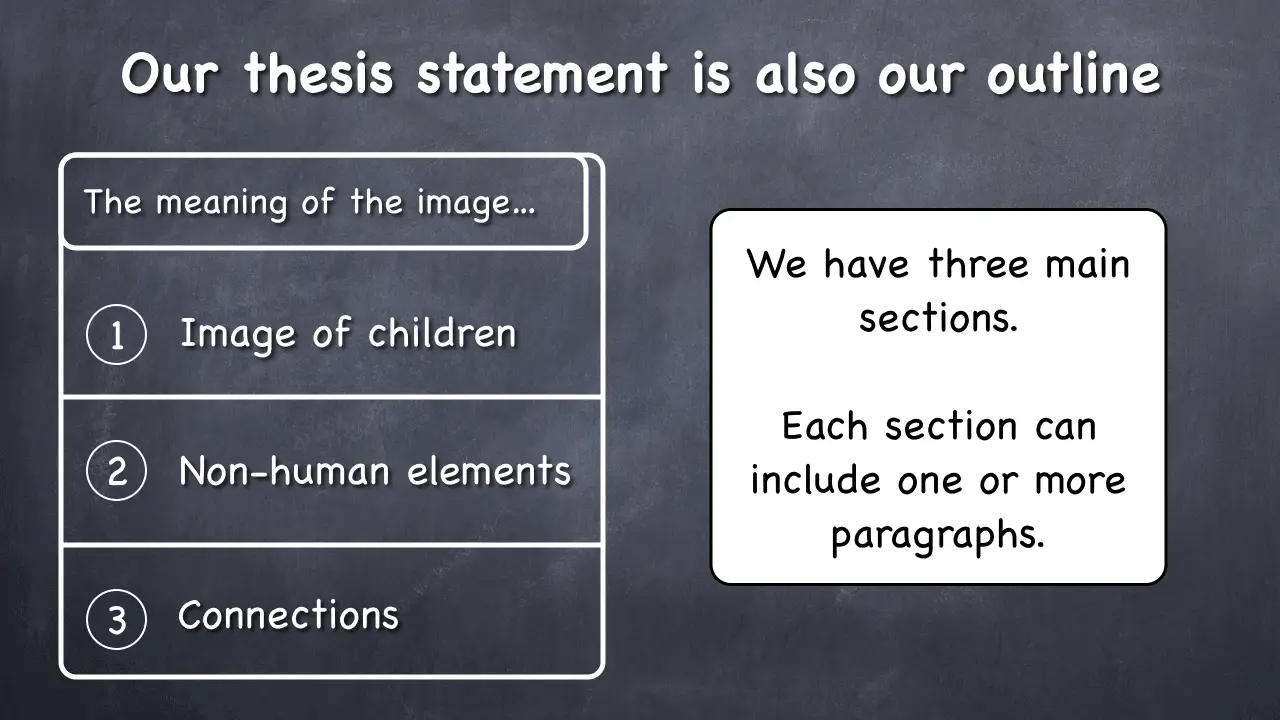
At this point, we have everything we need to write the rest of the essay. We know that it will have three main sections because the thesis statement is also our outline.
We’re ready to write the body of the essay. Let’s do it.
Body of the Essay (3 paragraphs)
“The author of this photograph chose children and, more specifically, children’s hands in order to convey his point. In many, if not all human cultures, children evoke the feelings of hope, new beginnings, and the future. This is why people often say, ‘Children are our future.’ Furthermore, the children in the photo are of different ethnic backgrounds. This is evident from their skin colors, which vary from lighter to darker. This detail shows that the author probably meant children all over the world.
The non-human elements of the picture are the plants and the soil. The plants are very young – they are just sprouts, and that signifies the fragility of life. The soil in which they grow evokes the image of our planet Earth. Soil also symbolizes fertility. The clothes the children wear are summer clothes, and summer signifies freedom because this is the time of a long vacation for school children. Perhaps the author implies that the environment affects people’s freedom.
Finally, the relationships and connections among these elements help the photographer convey the message that humans should be mindful of their decisions today to ensure a bright future for the planet. This idea can be arrived at by careful examination. First, the children’s hands are arranged in a circle, which is a symbol of our planet and also signifies the power of unity. The future depends on people’s cooperation. Second, the children seem to be in the process of planting. The author emphasizes long-term future because the children hold baby plants. In other words, they ‘hold the future of other children’ in their hands. Third, the placement of the sprouts, which rest inside the soil in children’s hands, is a strong way to suggest that the future of the ecology is literally ‘in our hands.’”
Step 6. Add an Introduction and a Conclusion
Before we continue, I have an entire detailed article on how to write an essay step-by-step for beginners . In it, I walk you through writing every part of an essay, from the thesis to the conclusion.
Introduction
That said, your introduction should be just a sentence or two that go right before you state the thesis.
Let’s revisit our thesis statement, and then write the introduction.
And now let’s write an introductory sentence that would make the opening paragraph complete:
Now, if you read this intro sentence followed by the thesis statement, you’ll see that they work great together. And we’re done with the opening paragraph.
Your conclusion should be just a simple restatement. You can conclude your essay in many ways, but this is the basic and time-proven one.
Let’s do it:
We simply restated our thesis here. Your conclusion can be one or more sentences. In a short essay, a sentence will suffice.
Guess what – we just wrote a visual analysis essay together, and now you have a pretty good idea of how to write one.
Hope this was helpful!
How to Write a 300 Word Essay – Simple Tutorial
How to expand an essay – 4 tips to increase the word count, 10 solid essay writing tips to help you improve quickly, essay writing for beginners: 6-step guide with examples, 6 simple ways to improve sentence structure in your essays.
Tutor Phil is an e-learning professional who helps adult learners finish their degrees by teaching them academic writing skills.
You Might Like These Next...
How to Write a Summary of an Article in 5 Easy Steps
https://youtu.be/mXGNf8JMY4Y When you’re summarizing, you’re simply trying to express something in fewer words. I’m Tutor Phil, and in this tutorial, I’ll show you how to summarize an...
How to Write Strong Body Paragraphs in an Essay
https://youtu.be/OcI9NKg_cEk A body paragraph in an essay consists of three parts: topic sentence, explanation, and one or more examples. The topic sentence summarizes your paragraph completely...
How to Write a Visual Analysis Essay: Examples & Template
A visual analysis essay is an academic paper type that history and art students often deal with. It consists of a detailed description of an image or object. It can also include an interpretation or an argument that is supported by visual evidence.
Our specialists will write a custom essay specially for you!

In this article, our custom writing experts will:
- explain what a visual analysis is;
- share useful tips on how to write a good visual analysis essay;
- provide an essay sample.
- 🎨 Visual Analysis Definition
- 🏺 Artwork Analysis Tips
- ✅ Visual Analysis Writing Guide
- 📑 Example & Citation Tips
🎨 What Is a Visual Analysis?
The primary objective of visual analysis is to understand an artwork better by examining the visual elements. There are two types of visual analysis: formal and contextual.
- A formal analysis focuses on artwork elements such as texture, color, size, and line. It aims to organize visual information and translate it into words. A formal analysis doesn’t interpret the piece.
- Unlike formal analysis, contextual analysis’ primary goal is to connect artwork to its purpose or meaning within a culture. A contextual analysis includes formal analysis. Additionally, it discusses an artwork’s social purpose and significance.
Usually, students deal with formal visual analysis. Before starting to work on your essay, make sure to ask your professor whether to include contextual analysis or not.
The Purpose of Analyzing Images
Why is visual analysis important? What does it help to learn? There are several things that visual analysis helps with:
- It allows students to enhance their appreciation of art.
- It enables students to develop the ability to synthesize information.
- It encourages students to seek out answers instead of simply receiving them.
- It prompts higher-order critical thinking and helps to create a well-reasoned analysis.
- By conducting visual analysis, students learn how to support and explain their ideas by studying visual information.
What Is Formal Analysis: Art History
When we look at an artwork, we want to know why it was created, who made it, and what its function was. That’s why art historians and researchers pay special attention to the role of artworks within historical contexts.
Just in 1 hour! We will write you a plagiarism-free paper in hardly more than 1 hour
Visual analysis is a helpful tool in exploring art. It focuses on the following aspects:
- Interpretation of subject matter ( iconography). An iconographic analysis is an explanation of the work’s meaning. Art historians try to understand what is shown and why it is depicted in a certain way.
- The analysis of function. Many works of art were designed to serve a purpose that goes beyond aesthetics. Understanding that purpose by studying their historical use helps learn more about artworks. It also establishes a connection between function and appearance.
Formal Analysis: Art Glossary
Now, let’s look at some visual elements and principles and learn how to define them.
Visual Elements :
Visual Principles :
🏺 How to Analyze Artworks: Different Types
Writing a formal analysis is a skill that requires practice. Being careful and attentive during the pre-writing stage is essential if you want to create a good and well-structured visual analysis.
Receive a plagiarism-free paper tailored to your instructions. Cut 15% off your first order!
Visual analysis essay mainly consists of two components:
- Description of the selected image or object,
- Interpretation built on the visual evidence.
During the pre-writing stage:
- Collect general information about an artwork. Describe it briefly. Pay special attention to visual elements and principles:
- Develop an interpretation. Think critically. What does the information in your notes imply? How can it be interpreted?
- Support your ideas. To do it, refer to the visual elements directly. Avoid generalizing art and double-check your prompts.
How to Analyze a Painting Using the Elements of Art
To write an excellent formal visual analysis, you need to consider as many visual principles and elements as you can apply. In the formal analysis part:
- Target your description;
- Address only those elements relevant to your essay;
- Pay attention to visual elements and principles;
- Introduce the subject of the painting and describe it;
- Explain why you have decided to discuss specific elements;
- Discuss the relationship between visual elements of the artwork;
- Use the vocabulary terms.
If you are asked to do a contextual analysis , you may want to:
- Focus on the historical importance of an artwork;
- Explore the style or movement associated with an artwork;
- Learn about the historical context and the public’s reaction to the artwork;
- Learn about the author and how they’ve created the piece of art.
Painting Analysis Essay Example & Tips
Here is a template you can use for your essay.
Get an originally-written paper according to your instructions!
Now, let’s take a look at an essay example.
How to Analyze a Photograph
Analyzing photos has a lot in common with paintings. There are three methods on which photo visual analysis relies: description, reflection, and formal analysis. Historical analysis can be included as well, though it is optional.
- Description . It implies looking closely at the photo and considering all the details. The description needs to be objective and consists of basic statements that don’t express an opinion.
- Reflection. For the next step, focus on the emotions that the photograph evokes. Here, every viewer will have a different opinion and feelings about the artwork. Knowing some historical context may be helpful to construct a thoughtful response.
- Formal analysis . Think of the visual elements and principles. How are they represented in the photograph?
- Historical analysis. For a contextual analysis, you need to pay attention to the external elements of the photograph. Make sure that you understand the environmental context in which the photo was taken. Under what historical circumstances was the picture made?
Photo Analysis Essay Tips
Now that we’ve talked about analyzing a photograph let’s look at some helpful tips that will help you write an essay.
How to Analyze a Sculpture
Visual analysis of a sculpture is slightly different from the one of a painting or a photograph. However, it still uses similar concepts, relies on visual elements and principles. When you write about sculpture, consider:
Visual Analysis Essay on a Sculpture: Writing Tips
A sculpture analysis consists of the following parts:
- Description . Include specific details, such as what the sculpture may represent. For instance, the human figure may be an athlete, an ancient God, a poet, etc. Consider their pose, body build, and attire.
- Formal analysis . Here, visual elements and principles become the focus. Discuss the color, shape, technique, and medium.
- Contextual analysis . If you decide to include a contextual analysis, you can talk about the sculpture’s function and how it conveys ideas and sentiments of that period. Mention its historical and cultural importance.
When it comes to sculpture analysis, you may also want to collect technical data such as:
- The size of the sculpture
- Medium (the material)
- The current condition (is it damaged, preserved as a fragment, or as a whole piece)
- Display (Was a sculpture a part of an architectural setting, or was it an independent piece of work?)
For instance, if you were to do a visual analysis of Laocoön and His Sons , you could first look up such details:
- Location: Discovered in a Roman vineyard in 1506
- Current location: Vatican
- Date: Hellenistic Period (323 BCE – 31 CE)
- Size: Height 208 cm; Width 163 cm; Depth 112 cm
- Material: Marble
- Current condition: Missing several parts.
Visual Analysis Essay: Advertisement Analysis
Visuals are used in advertisements to attract attention or convince the public that they need what is being advertised. The purpose of a visual argument is to create interest. Advertisements use images to convey information and communicate with the audience.
When writing a visual analysis of an advertisement, pay attention to the following:
- text elements,
- illustrations,
- composition.
All of this influences how the viewer perceives the information and reacts to it.
When you write about an advertisement, you conduct a rhetorical analysis of its visual elements. Visual rhetoric is mainly directed at analyzing images and extracting information from them. It helps to understand the use of typography, imagery, and the arrangement of elements on the page.
Think of the famous visual rhetoric examples such as the We can do it! poster or a Chanel №5 commercial. Both examples demonstrate how persuasive imagery has been used throughout history.
How to Write a Visual Analysis Paper on an Advertisement
The presentation of visual elements in advertising is essential. It helps to convince the audience. When you analyze visual arguments, always keep the rhetorical situation in mind. Here are some crucial elements to focus on:
✅ How to Write a Visual Analysis Paper: Step by Step
Now, we’ll focus on the paper itself and how to structure it. But first, check out the list of topics and choose what suits you best.
Visual Analysis Essay Topics
There are a lot of artworks and advertisements that can be analyzed and viewed from different perspectives. Here are some essay topics on visual analysis that you may find helpful:
- Analyze Gustav Klimt’s The Kiss (1907-1908.)
- The theme of humanity and The Son of Man (1964) by René Magritte.
- The use of visual elements in Almond Blossom by Vincent van Gogh (1888-1890.)
- Identity and Seated Harlequin (1901) by Picasso .
- Explore the themes of Paul Klee ’s The Tree of Houses , 1918.
- Objectives, activities, and instructions of Pietro Perugino’s fresco The Delivery of the Keys to Saint Peter .
- Reflection on social issues of the time in Two Fridas by Frida Kahlo and Untitled by Ramses Younan .
- Analyze the importance of Mural (1943) by Jackson Pollock .
- The political message in John Gast’s painting American Progress (1872).
- Describe the visual techniques used in Toy Pieta by Scott Avett .
- The interpretation of the painting Indian Fire God by Frederic Remington.
- Explore the historical significance and aesthetic meaning of Ognissanti Madonna by Giotto di Bondone .
- Analyze different interpretations of The Three Dancers by Pablo Picasso .
Photography:
- The idea behind Lindsay Key (1985) by Robert Mapplethorpe.
- Explore the mythical appeal of Robert Capa’s photograph The Falling Soldier (Spain,1936) from Death in Making photobook.
- Describe Two Boys with Fish (2018) from Faith series by Mario Macilau.
- Kevin Carter’s Starving Child and Vulture (1993) as the representation of photojournalism.
- The story behind Philippe Halsman’s Dali Atomicus , 1948.
- Describe The Starving Boy in Uganda photograph by Mike Wells
- Analyse the view of a historic disaster in San Francisco photograph by George R. Lawrence.
- The statement behind Eddie Adams’s photo Shooting a Viet Cong Prisoner .
- How is Steve McCurry’s perception of the world reflected in his photo Afghanistan Girl .
- Analyze the reflection of Ansel Adams’s environmental philosophy in his photo Moon and Half Dome (1960).
- Describe Girl on the Garda Lake (2016) by Giuseppe Milo.
- Combination of internal geometry and true-to-life moments in Behind the Gare Saint Lazare by Henri Cartier-Bresson .
- Modern art and Couple on Seat by Lynn Chadwick (1984.)
- Analyze the biblical context of Pieta (1498-1499) by Michelangelo.
- The use of shapes in Louise Bourgeois’ Spider (1996.)
- Analysis of the symbolism behind The Thinker (1880) by Rodin.
- The historical meaning of Fountain (1917) by Duchamp .
- Analyze the Miniature Statue of Liberty by Willard Wigan
- The combination of Egyptian culture and classical Greek ideology in statue of Osiris-Antinous .
- Reflection of the civilization values in emperor Qin’s Terracotta Army .
- The aesthetic and philosophical significance of Michelangelo’s David .
- Explore the controversial meaning of Damien Hirst’s sculpture For the Love of God (2007).
- Analyze the elements of art and design used in The Thinker by August Rodin .
- Symbolic elements in the Ancient Greek statues of Zeus .
- Depiction of the fundamental aspects of Buddhism in The Parinirvana of Siddhartha/Shakyamuni.
Advertisement:
- How Volkswagen : Think Small (1960) ad changed advertising.
- Analyze the use of figures in California Milk Processor Board: Got Milk? (1993) ad campaign .
- Analyze the use of colors in Coca-Cola — The Pause that Refreshes (1931.)
- Explore the historical context of We Can Do It! (1942) campaign.
- The importance of a slogan in 1947: A Diamond Is Forever by De Beers.
- Examine the specifics of visual advert: dogs and their humans.
- Describe the use of visual techniques in Kentucky Fried Chicken company’s advertisement.
- Analyze the multiple messages behind the print ad of JBL .
- Discuss the methods used in Toyota Highlander advertisement .
- Elucidation of people’s dependency on social networks in the advertising campaign Followers by Miller Lite.
- The use of the visual arguments in Schlitz Brewing Company advertisement .
- The role of colors and fonts in Viva la Juicy perfume advertisement .
Visual Analysis Essay Outline
You can use this art analysis template to structure your essay:

How to Start an Art Essay
Every analysis starts with an introduction. In the first paragraph, make sure that:
- the reader knows that this essay is a visual analysis;
- you have provided all the necessary background information about an artwork.
It’s also important to know how to introduce an artwork. If you’re dealing with a panting or a photograph, it’s better to integrate them into the first page of your analysis. This way, the reader can see the piece and use it as a reference while reading your paper.
Art Thesis Statement Examples & Tips
Formulating a thesis is an essential step in every essay. Depending on the purpose of your paper, you can either focus your visual analysis thesis statement on formal elements or connect it with the contextual meaning.
To create a strong thesis, you should relate it to an artwork’s meaning, significance, or effect. Your interpretation should put out an argument that someone could potentially disagree with.
- For instance, you can consider how formal elements or principles impact the meaning of an artwork. Here are some options you can consider:
- If your focus is the contextual analysis, you can find the connection between the artwork and the artist’s personal life or a historical event.
How to Write Visual Analysis Body Paragraphs
Body paragraphs of formal analysis consist of two parts—the description and the analysis itself. Let’s take Klimt’s The Kiss as an example:
The contextual analysis includes interpretation and evaluation.
Visual Analysis Essay Conclusion
When you work on the conclusion, try to conclude your paper without restating the thesis. At the end of your essay, you can present an interesting fact. You can also try to:
- Compare an artwork to similar ones;
- Contrast your own ideas on the piece with the reaction people had when it was first revealed.
- Talk about an artwork’s significance to the culture and art in general.
📑 Visual Analysis Essay Example & Citation Tips
In this section of the article, we will share some tips on how to reference an artwork in a paper. We will also provide an essay example.
How to Reference a Painting in an Essay
When you work on visual analysis, it is important to know how to write the title of an artwork properly. Citing a painting, a photograph, or any other visual source, will require a little more information than citing a book or an article. Here is what you will need:
- Size dimensions
- Current location
- Name of the piece
- Artist’s name
- Date when artwork was created
If you want to cite a painting or an artwork you saw online, you will also need:
- The name of the website
- Website URL
- Page’s publication date
- Date of your access
How to Properly Credit an Artwork in APA
How to properly credit an artwork in mla, how to properly credit an artwork in chicago format.
Finally, here’s a sample visual analysis of Rodin’s sculpture The Thinker in APA format. Feel free to download it below.
Many people believe that works of art are bound to be immortal. Indeed, some remarkable masterpieces have outlived their artists by many years, gaining more and more popularity with time. Among them is The Thinker, a brilliant sculpture made by Auguste Rodin, depicting a young, athletic man, immersed deep into his thoughts.
You can also look at the following essay samples to get even more ideas.
- The Protestors Cartoon by Clay Bennett: Visual Analysis
- Visual Analysis – Editorial Cartoon
- Visual Analysis: “Dust Storm” Photo by Steve McCurry
- Visual, Aural, Read & Write, Kinesthetic Analysis
- Schlitz Brewing Company Advertisement: Visual Arguments Analysis
Thanks for reading through our article! We hope you found it helpful. Don’t hesitate to share it with your friends.
Further reading:
- How to Write a Lab Report: Format, Tips, & Example
- Literature Review Outline: Examples, Approaches, & Templates
- How to Write a Research Paper Step by Step [2024 Upd.]
- How to Write a Term Paper: The Ultimate Guide and Tips
❓ Visual Analysis FAQs
To write a visual argument essay, you need to use rhetorical analysis. Visual rhetoric is directed at analyzing images and extracting the information they contain. It helps to analyze the visuals and the arrangement of elements on the page.
A well-though contextual analysis will include:
1. formal analysis, 2. some information about the artist, 3. details on when and where the piece was created, 4. the social purpose of the work, 5. its cultural meaning.
It is better to include pictures in the introduction part of your paper. Make sure to cite them correctly according to the format you’re using. Don’t forget to add the website name, the URL, and the access date.
To analyze means not only to describe but also to evaluate and synthesize visual information. To do that, you need to learn about visual elements and principles and see how and why they are used within artworks.
🔍 References
- Art History: University of North Carolina at Chapel Hill
- Visual Analysis: Duke University
- Writing a Formal Analysis in Art History: Hamilton College
- Contextual Analysis: Pine-Richland School District
- How to Analyze an Artwork: Student Art Guide
- Introduction to Art Historical Analysis: Khan Academy
- Guidelines for Analysis of Art: University of Arkansas at Little Rock
- Elements of Art: Getty.edu
- Formal or Critical Analysis: LibreTexts
- Analyzing a Photograph: University of Oregon
- Picture Composition Analysis and Photo Essay: University of Northern Iowa
- Visual Analysis Guidelines: Skidmore College
- How to Analyze Sculpture: NLA Design and Visual Arts: WordPress
- Visual Rhetoric: Purdue University
- Formal Visual Analysis: The Elements & Principles of Composition
- Share to Facebook
- Share to Twitter
- Share to LinkedIn
- Share to email

Want to know how to write a reflection paper for college or school? To do that, you need to connect your personal experiences with theoretical knowledge. Usually, students are asked to reflect on a documentary, a text, or their experience. Sometimes one needs to write a paper about a lesson...

A character analysis is an examination of the personalities and actions of protagonists and antagonists that make up a story. It discusses their role in the story, evaluates their traits, and looks at their conflicts and experiences. You might need to write this assignment in school or college. Like any...
![Critical Writing: Examples & Brilliant Tips [2024]](https://custom-writing.org/blog/wp-content/uploads/2021/02/fingers-note-report-journalist-filling-284x153.jpg "thesis on image analysis")
Any critique is nothing more than critical analysis, and the word “analysis” does not have a negative meaning. Critical writing relies on objective evaluations of or a response to an author’s creation. As such, they can be either positive or negative, as the work deserves. To write a critique, you...

If you are assigned to write a rhetorical analysis essay, you have one significant advantage. You can choose a text from an almost infinite number of resources. The most important thing is that you analyze the statement addressed to an audience. The task of a rhetorical analysis essay is to...

Any literary analysis is a challenging task since literature includes many elements that can be interpreted differently. However, a stylistic analysis of all the figurative language the poets use may seem even harder. You may never realize what the author actually meant and how to comment on it! While analyzing...

As a student, you may be asked to write a book review. Unlike an argumentative essay, a book review is an opportunity to convey the central theme of a story while offering a new perspective on the author’s ideas. Knowing how to create a well-organized and coherent review, however, is...

The difference between an argumentative and persuasive essay isn’t always clear. If you’re struggling with either style for your next assignment, don’t worry. The following will clarify everything you need to know so you can write with confidence. First, we define the primary objectives of argumentative vs. persuasive writing. We...

You don’t need to be a nerd to understand the general idea behind cause and effect essays. Let’s see! If you skip a meal, you get hungry. And if you write an essay about it, your goal is achieved! However, following multiple rules of academic writing can be a tough...
![How to Write an Argumentative Essay: 101 Guide [+ Examples]](https://custom-writing.org/blog/wp-content/uploads/2021/01/young-writer-taking-notes-284x153.jpg "thesis on image analysis")
An argumentative essay is a genre of academic writing that investigates different sides of a particular issue. Its central purpose is to inform the readers rather than expressively persuade them. Thus, it is crucial to differentiate between argumentative and persuasive essays. While composing an argumentative essay, the students have to...
![How to Title an Essay: Guide with Creative Examples [2024]](https://custom-writing.org/blog/wp-content/uploads/2021/01/close-up-woman-making-greeting-card-new-year-christmas-2021-friends-family-scrap-booking-diy-writing-letter-with-best-wishes-design-her-homemade-card-holidays-celebration-284x153.jpg "thesis on image analysis")
It’s not a secret that the reader notices an essay title first. No catchy hook or colorful examples attract more attention from a quick glance. Composing a creative title for your essay is essential if you strive to succeed, as it: Thus, how you name your paper is of the...

The conclusion is the last paragraph in your paper that draws the ideas and reasoning together. However, its purpose does not end there. A definite essay conclusion accomplishes several goals: Therefore, a conclusion usually consists of: Our experts prepared this guide, where you will find great tips on how to...
![How to Write a Good Introduction: Examples & Tips [2024 Upd.]](https://custom-writing.org/blog/wp-content/uploads/2021/01/closeup-shot-woman-working-studying-from-home-with-red-coffee-cup-nearby-284x153.jpg "thesis on image analysis")
A five-paragraph essay is one of the most common academic assignments a student may face. It has a well-defined structure: an introduction, three body paragraphs, and a conclusion. Writing an introduction can be the most challenging part of the entire piece. It aims to introduce the main ideas and present...
do you review and edit visual arts extended essay
How to Write a Visual Analysis Essay: Mastering Artful Interpretations 👌
.png "thesis on image analysis")
Setting itself apart from other essays, visual analysis essays necessitate a thorough examination of design elements and principles. Whether it's the mysterious smile of the 'Mona Lisa' or a striking photograph capturing a fleeting moment, visual art has the power to move us. Writing this kind of paper is like peeling back the layers of a visual story, uncovering its meanings, and unraveling its impact.
Think of it as decoding the secrets a picture holds. Imagine standing in front of a famous painting, like the 'Mona Lisa' in the Louvre. Millions are drawn to it, captivated by the tale it tells. Your essay lets you share your perspective on the stories hidden in images.
If you're feeling unsure about tackling this kind of essay, don't worry—check out this blog for a straightforward guide. The expert team at our essay service online will walk you through each step of writing the essay, offering tips and examples along the way.

What Is a Visual Analysis Essay
A visual analysis essay is a unique form of writing that delves into the interpretation of visual elements within an image, such as a painting, photograph, or advertisement. Rather than focusing solely on the subject matter, this type of essay scrutinizes the design elements and principles employed in the creation of the visual piece.
Design Elements: These include fundamental components like color, size, shape, and line. By dissecting these elements, you gain a deeper understanding of how they contribute to the overall composition and convey specific messages or emotions.
Design Principles: Equally important are the design principles—balance, texture, contrast, and proportion. These principles guide the arrangement and interaction of the design elements, influencing the visual impact of the entire composition.
Purpose: The goal is not only to describe the visual content but also to decipher its underlying meaning and the artistic choices made by the creator. It goes beyond the surface level, encouraging the writer to explore the intentions behind the visual elements and how they communicate with the audience.
Stepwise Approach: To tackle this essay, follow a stepwise approach. Begin by closely observing the image, noting each design element and principle. Then, interpret how these choices contribute to the overall message or theme. Structure your essay to guide the reader through your analysis, providing evidence and examples to support your interpretations.
Tips for How to Write a Visual Analysis Essay Successfully:
- Use clear and concise language.
- Support your analysis with specific details from the visual piece.
- Consider the historical or cultural context when applicable.
- Connect your observations to the overall artistic or rhetorical goals.
Sample Visual Analysis Essay Outline
This sample outline offers a framework for organizing a comprehensive structure for a visual analysis essay, ensuring a systematic exploration of design elements and principles. Adjustments can be made based on the specific requirements of the assignment and the characteristics of the chosen visual piece. Now, let's delve into how to start a visual analysis essay using this template.
I. Visual Analysis Essay Introduction
A. Briefly introduce the chosen visual piece
- Include relevant details (title, artist, date)
B. Provide a thesis statement
- Express the main point of your analysis
- Preview the key design elements and principles to be discussed
II. Description of the Visual Piece
A. Present an overview of the visual content
- Describe the subject matter and overall composition
- Highlight prominent visual elements (color, size, shape, line)
III. Design Elements Analysis
- Discuss the use of color and its impact on the composition
- Explore the emotional or symbolic associations of specific colors
B. Size and Shape
- Analyze the significance of size and shape in conveying meaning
- Discuss how these elements contribute to the overall visual appeal
- Examine the use of lines and their role in guiding the viewer's gaze
- Discuss any stylistic choices related to lines
IV. Design Principles Analysis
- Discuss the visual balance and how it contributes to the overall harmony
- Analyze whether the balance is symmetrical or asymmetrical
- Explore the use of texture and its impact on the viewer's perception
- Discuss how texture adds depth and visual interest
C. Contrast
- Analyze the contrast between elements and its effect on the composition
- Discuss whether the contrast enhances the visual impact
D. Proportion
- Discuss the proportion of elements and their role in creating a cohesive visual experience
- Analyze any intentional distortions for artistic effect
V. Interpretation and Analysis
A. Explore the overall meaning or message conveyed by the visual piece
- Consider the synthesis of design elements and principles
- Discuss any cultural or historical context influencing the interpretation
VI. Conclusion
A. Summarize the key points discussed in the analysis
B. Restate the thesis in the context of the insights gained
C. Conclude with a reflection on the overall impact and effectiveness of the visual piece.
An In-Depth Guide to Analyzing Visual Art
This in-depth guide on how to start a visual analysis essay begins with establishing a contextual foundation, progresses to a meticulous description of the painting, and culminates in a comprehensive analysis that unveils the intricate layers of meaning embedded in the artwork. As we navigate through each step of writing a visual analysis paper, the intention is not only to see the art but to understand the language it speaks and the stories it tells.
Step 1: Introduction and Background
Analyzing the art requires setting the stage with a solid analysis essay format - introduction and background. Begin by providing essential context about the artwork, including details about the artist, the time period, and the broader artistic movement it may belong to. This preliminary step allows the audience to grasp the significance of the painting within a larger cultural or historical framework.
Step 2: Painting Description
The next crucial phase in visual analysis involves a meticulous examination and description of the painting itself. Take your audience on a vivid tour through the canvas, unraveling its visual elements such as color palette, composition, shapes, and lines.
Provide a comprehensive snapshot of the subject matter, capturing the essence of what the artist intended to convey. This step serves as the foundation for the subsequent in-depth analysis, offering a detailed understanding of the visual elements at play.
Step 3: In-Depth Analysis
With the groundwork laid in the introduction and the painting description, now it's time to dive into the heart of writing a visual analysis paper. Break down the visual elements and principles, exploring how they interact to convey meaning and emotion. Discuss the deliberate choices made by the artist in terms of color symbolism, compositional techniques, and the use of texture.
Consider the emotional impact on the viewer and any cultural or historical influences that might be reflected in the artwork. According to our custom essay service experts, this in-depth analysis goes beyond the surface, encouraging a profound exploration of the artistic decisions that shape the overall narrative of the visual piece.
How to Write a Visual Analysis Essay: A Proper Structure
Using the conventional five-paragraph essay structure proves to be a reliable approach for your essay. When examining a painting, carefully select the relevant aspects that capture your attention and analyze them in relation to your thesis. Keep it simple and adhere to the classic essay structure; it's like a reliable roadmap for your thoughts.
.png "thesis on image analysis")
Introduction
The gateway to a successful visual analysis essay lies in a compelling introduction. Begin by introducing the chosen visual piece, offering essential details such as the title, artist, and date. Capture the reader's attention by providing a brief overview of the artwork's significance. Conclude the introduction with a concise thesis statement, outlining the main point of your analysis and previewing the key aspects you will explore.
Crafting a robust thesis statement is pivotal in guiding your analysis. Clearly articulate the primary message or interpretation you aim to convey through your essay. Your thesis should serve as the roadmap for the reader, indicating the specific elements and principles you will analyze and how they contribute to the overall meaning of the visual piece.
The body is where the intricate exploration takes place. Divide this section into coherent paragraphs, each dedicated to a specific aspect of your analysis. Focus on the chosen design elements and principles, discussing their impact on the composition and the intended message. Support your analysis with evidence from the visual piece, providing detailed descriptions and interpretations. Consider the historical or cultural context if relevant, offering a well-rounded understanding of the artwork.
Conclude with a concise yet impactful conclusion. Summarize the key points discussed in the body of the essay, reinforcing the connection between design elements, principles, and the overall message. Restate your thesis in the context of the insights gained through your analysis. Leave the reader with a final thought that encapsulates the significance of the visual piece and the depth of understanding achieved through your exploration.
In your essays, it's important to follow the usual citation rules to give credit to your sources. When you quote from a book, website, journal, or movie, use in-text citations according to the style your teacher prefers, like MLA or APA. At the end of your essay, create a list of all your sources on a page called 'Sources Cited' or 'References.'
The good news for your analysis essays is that citing art is simpler. You don't need to stress about putting art citations in the middle of your sentences. In your introduction, just explain the artwork you're talking about—mentioning details like its name and who made it. After that, in the main part of your essay, you can mention the artwork by its name, such as 'Starry Night' by Vincent van Gogh.
This way, you can keep your focus on talking about the art without getting tangled up in the details of citing it in your text. Always keep in mind that using citations correctly makes your writing look more professional.
Visual Analysis Essay Example
To provide a clearer illustration of a good paper, let's delve into our sample essay, showcasing an exemplary art history visual analysis essay example.
Unveiling the Details in Image Analysis Essay
Have you ever gazed at an image and wondered about the stories it silently holds? Describing images in visual analysis papers is not just about putting what you see into words; it's about unraveling the visual tales woven within every pixel. So, how do you articulate the unspoken language of images? Let's examine below:
.png "thesis on image analysis")
- Start with the Basics: Begin your description by addressing the fundamental elements like colors, shapes, and lines. What hues dominate the image? Are there distinct shapes that catch your eye? How do the lines guide your gaze?
- Capture the Atmosphere: Move beyond the surface and capture the mood or atmosphere the image evokes. Is it serene or bustling with energy? Does it exude warmth or coolness? Conveying the emotional tone adds layers to your description.
- Detail the Composition: Dive into the arrangement of elements. How are objects positioned? What is the focal point? Analyzing the composition unveils the intentional choices made by the creator.
- Consider Scale and Proportion: When unsure how to write an image analysis essay well, try exploring the relationships between objects. Are there disparities in size? How do these proportions contribute to the overall visual impact? Scale and proportion provide insights into the image's dynamics.
- Examine Textures and Patterns: Zoom in on the finer details. Are there textures that invite touch? Do patterns emerge upon closer inspection? Describing these nuances enriches your analysis, offering a tactile dimension.
- Cultural and Historical Context: Consider the broader context in which the image exists. How might cultural or historical factors influence its meaning? Understanding context adds depth to your description.
Final Thoughts
As we conclude our journey, consider this: how might your newfound appreciation for the subtleties of visual description enhance your understanding of the world around you? Every image, whether captured in art or everyday life, has a story to tell. Will you be the perceptive storyteller, wielding the brush of description to illuminate the tales that images whisper? The adventure of discovery lies in your hands, and the language of images eagerly awaits your interpretation. How will you let your descriptions shape the narratives yet untold?
Keep exploring, keep questioning, and let the rich tapestry of visual storytelling unfold before you. And if you're looking for a boost on how to write a thesis statement for a visual analysis essay, order an essay online , and our experts will gladly handle it for you!

How Do You Make a Good Conclusion to a Visual Analysis Essay?
How do you write a visual analysis essay thesis, what is a good approach to writing a visual analysis paper formally.

- Plagiarism Report
- Unlimited Revisions
- 24/7 Support
- Campus Library Info.
- ARC Homepage
- Library Resources
- Articles & Databases
- Books & Ebooks
Baker College Research Guides
- Research Guides
- General Education
COM 1020: Composition and Critical Thinking II
- Visual Analysis Essay
- COM 1020 Reminders: The Writing Process, Research, etc.
- Understanding Rhetoric and Rhetorical Analysis
- Visual Rhetoric
- What is an Annotated Bibliography?
- Understanding Oral Communications
- Narrated PowerPoint
- Presentations (Tips and Strategies)
- Letter Formatting
- Abstract Formatting
- Scholarly Articles
- Critical Reading
- Google Slides
Understanding Visual Analysis Essays
A written analysis allows writers to explore the discrete parts of some thing—in this case, several visual artifacts—to better understand the whole and how it communicates its message.
We should also consider how the image(s) appeal to ethos, pathos, and logos, and why. Consider, for example, how most advertisements rely on an appeal to pathos--or emotion--to persuade consumers to buy their project. Some ads will use humor to do so. Others will evoke patriotism to persuade consumers to purchase a product (suggesting buying a certain product will make them a good American).
This particular analysis will allow students to focus on visual materials relating to their career of interest to better understand how messages related to their field are composed and presented. This project will grant students the means to evaluate qualitative and quantitative arguments in the visual artifacts as well as interpret the claims made and supporting reasons. The project also will allow students to research discipline-specific and professional visual resources.
The audience for the analysis is an audience with comparable knowledge on the topic. Students should define and explain any terminology or jargon used that may be difficult for a general audience to understand.
Instructions:
Begin the essay by finding at least two examples of images relating to your intended future field of study (or a field that you are interested in learning more about). Use the Visual Analysis Planning Sheet to record your observations about the images. You will describe the images in great detail.
You will also need to research and find out who made the images, when, why and for what purpose. (This is called the rhetorical situation).
The essay should also explain what the purpose and intent of the images is and if there are any implicit messages (hidden messages) as well. An ad for Coca-Cola sells soda, but it also might imply something about family values. A public service announcement about hand-washing might also imply a sense of fear about pathogens and the spread of viruses from abroad. You should explore such obvious and hidden messages in your essay.
After describing all the key components, you’ll consider whether or not the images succeed at their goal or purpose and what these images suggest about how the field communicates its messages. See the Visual Analysis Planning Sheet for more help: https://docs.google.com/document/d/1HUa4_XZ84svJPJ2Ppe5TTIK20Yp7bd-h/edit
Suggested Organization of Visual Analysis Essay
I. Introduction (1 paragraph) - should contain a hook (attention-grabber), set the context for the essay, and contain your thesis statement (described below).
a. Thesis statement : State what two images are being analyzed and what your overall claim is about them. The thesis should make a claim about the images such as whether they are effective or ineffective at communicating their message.
II. Explain the Rhetorical Situation of both images: (2 paragraphs) Begin by discussing what is being advertised or displayed, who made it (company, artist, writer, etc.), who is the target audience, where and when the image was published and shared, and where the image was made (country). Provide these details for both images being discussed and analyzed.
III. Description of both images (4-8 paragraphs). Discuss each image in full detail, providing the following details about both:
a. Describe what appears in the image. Be as detailed as possible.
b. Discuss the primary color choice used and what mood these colors create.
c. Explain the overall layout and organization of each image.
d. Discuss the use of wording in the visual image. What font is used, what color, and size is the font.
e. Explain what the message in the visual actually says and what this message means/indicates/asks of viewers and readers.
F. Discuss any other relevant information (from the planning worksheet or anything you think is noteworthy.
IV. Discussion and Evaluation (2-4 paragraphs) - Synthesizing your findings,and analyze what you think the smaller details accomplish.
- Discuss if the images appeal to ethos, pathos, or logos and provide evidence to back up your claim.
- Discuss what sociological, political, economic or cultural attitudes are indirectly reflected in the images. Back up your claims with evidence. An advertisement may be about a pair of blue jeans but it might, indirectly, reflect such matters as sexism, alienation, stereotyped thinking, conformism, generational conflict, loneliness, elitism, and so on.
- Assert what claims are being made by the images. Consider the reasons which support that claim: reasons about the nature of the visual's product or service, reasons about those responsible for that product or service, and reasons which appeal to the audience's values, beliefs, or desires.
V. Conclusion (1 paragraph) - should contain both a recap of your response, as well as a closing statement in regards to your overall response to the chosen essay. Include a conclusion that reviews the messages the images make and offer a conclusion that combines the results of your findings and why they matter.
Drafting/Research Strategies:
To write a visual analysis, you must look closely at a visual object—and translate your visual observations into written text. However, a visual analysis does not simply record your observations. It also makes a claim about the images. You will describe the images in detail and then offer an analysis of what the images communicate at the surface level. You will also highlight any implicit messages that the images communicate. (Use Visual Analysis Planning Sheet). Students should begin the project by taking detailed notes about the images. Review every component of each image. Be precise. Consider the composition, colors, textures, size, space, and other visual and material attributes of the images. Go beyond your first impressions. This should take some time—allow your eye to absorb the image. Making a sketch of the work can help you understand its visual logic.
Good to Know
Below are some helpful resources to aid in creating your Visual Analysis Essay.
- Visual Analysis essay sample
- Photos and Illustrations
- Visual Elements: Play, Use, and Design
- << Previous: Visual Rhetoric
- Next: What is an Annotated Bibliography? >>
- Last Updated: Feb 23, 2024 2:01 PM
- URL: https://guides.baker.edu/com1020
- Search this Guide Search
Your browser does not support javascript. Some site functionality may not work as expected.
- Images from UW Libraries
- Open Images
- Image Analysis
- Citing Images
- University of Washington Libraries
- Library Guides
- Images Research Guide
Images Research Guide: Image Analysis
Analyze images.
Content analysis
- What do you see?
- What is the image about?
- Are there people in the image? What are they doing? How are they presented?
- Can the image be looked at different ways?
- How effective is the image as a visual message?
Visual analysis
- How is the image composed? What is in the background, and what is in the foreground?
- What are the most important visual elements in the image? How can you tell?
- How is color used?
- What meanings are conveyed by design choices?
Contextual information
- What information accompanies the image?
- Does the text change how you see the image? How?
- Is the textual information intended to be factual and inform, or is it intended to influence what and how you see?
- What kind of context does the information provide? Does it answer the questions Where, How, Why, and For whom was the image made?
Image source
- Where did you find the image?
- What information does the source provide about the origins of the image?
- Is the source reliable and trustworthy?
- Was the image found in an image database, or was it being used in another context to convey meaning?
Technical quality
- Is the image large enough to suit your purposes?
- Are the color, light, and balance true?
- Is the image a quality digital image, without pixelation or distortion?
- Is the image in a file format you can use?
- Are there copyright or other use restrictions you need to consider?
developed by Denise Hattwig , [email protected]
More Resources
National Archives document analysis worksheets :
- Photographs
- All worksheets
Visual literacy resources :
- Visual Literacy for Libraries: A Practical, Standards-Based Guide (book, 2016) by Brown, Bussert, Hattwig, Medaille ( UW Libraries availability )
- 7 Things You Should Know About... Visual Literacy ( Educause , 2015 )
- Keeping Up With... Visual Literacy (ACRL, 2013)
- Visual Literacy Competency Standards for Higher Education (ACRL, 2011)
- Visual Literacy White Paper (Adobe, 2003)
- Reading Images: an Introduction to Visual Literacy (UNC School of Education)
- Visual Literacy Activities (Oakland Museum of California)
- << Previous: Open Images
- Next: Citing Images >>
- Last Updated: Nov 15, 2023 12:45 PM
- URL: https://guides.lib.uw.edu/newimages

Quick Links:

ENC 1101- Prof. Berkley
- Log In Required
- Source Analysis Essay
- Argumentative Essay With Sources
Images Databases
- About MLA This link opens in a new window
- MLA Template
- How Do I Cite?
Image Analysis Essay
Assignment Description : Write an argumentative essay based on an image. The argument should focus on the image and the message the image conveys. All evidence for your argument should come from the image. The analysis should come from you. An excellent essay will analyze the image in a way that conveys a deeper meaning than one gets from simply observing the image.
Assignment Outcomes : The Image Analysis Essay should demonstrate your ability to make a logical argument that is well supported by evidence and correct use of MLA format and citation style.
Assignment Requirements :
Write an argumentative essay on an image. The image can not include any text.
Have an arguable thesis that is well supported by every paragraph of the essay.
Have a conclusion that answers the questions, “So what?”
The only required source is the image itself. If necessary for your argument, you may bring in other sources that give historical era, artist’s information, or other background material that provides context for the image. All sources must be from a credible, academic source like those found in the Broward College databases.
Correctly cite and document sources according to MLA format, using both in-text citations and the works cited list.
Essays must be 800-1,000 words minimum.
Advice : Choose an image that evokes a strong reaction in you. Look for an image that is rich, so you have plenty of material with which to work. You may also want to tie it thematically to the research you've done in the other two essays.
Norman Rockwell Museum
(works best in explorer).
- Opposing Viewpoints in Context Use "Advance Search" to select "Cartoon" in search box and "Images" in content type
- ARTstor A repository of hundreds of thousands of digital images and related data.
- Cartoon Bank Conde Nast single image cartoons
- Library of Congress Collections of photographs, cartoons and caricatures from American newspapers and magazines
- LIFE Magazine Hosted by Google, cover to cover of LIFE Magazine from November 23, 1936 to December 29, 1972 including advertisements.
- American Memory
- National Geographic Image Library
- Florida Memory Project
- << Previous: Argumentative Essay With Sources
- Next: About MLA >>
- Last Updated: Apr 18, 2024 10:58 AM
- URL: https://libguides.broward.edu/berkley
Medical image analysis based on deep learning approach
- Published: 06 April 2021
- Volume 80 , pages 24365–24398, ( 2021 )
Cite this article

- Muralikrishna Puttagunta 1 &
- S. Ravi ORCID: orcid.org/0000-0001-7267-9233 1
33k Accesses
111 Citations
9 Altmetric
Explore all metrics
Medical imaging plays a significant role in different clinical applications such as medical procedures used for early detection, monitoring, diagnosis, and treatment evaluation of various medical conditions. Basicsof the principles and implementations of artificial neural networks and deep learning are essential for understanding medical image analysis in computer vision. Deep Learning Approach (DLA) in medical image analysis emerges as a fast-growing research field. DLA has been widely used in medical imaging to detect the presence or absence of the disease. This paper presents the development of artificial neural networks, comprehensive analysis of DLA, which delivers promising medical imaging applications. Most of the DLA implementations concentrate on the X-ray images, computerized tomography, mammography images, and digital histopathology images. It provides a systematic review of the articles for classification, detection, and segmentation of medical images based on DLA. This review guides the researchers to think of appropriate changes in medical image analysis based on DLA.
Brain tumor detection and classification using machine learning: a comprehensive survey

Machine learning and deep learning approach for medical image analysis: diagnosis to detection

UNet++: A Nested U-Net Architecture for Medical Image Segmentation
Avoid common mistakes on your manuscript.
1 Introduction
In the health care system, there has been a dramatic increase in demand for medical image services, e.g. Radiography, endoscopy, Computed Tomography (CT), Mammography Images (MG), Ultrasound images, Magnetic Resonance Imaging (MRI), Magnetic Resonance Angiography (MRA), Nuclear medicine imaging, Positron Emission Tomography (PET) and pathological tests. Besides, medical images can often be challenging to analyze and time-consuming process due to the shortage of radiologists.
Artificial Intelligence (AI) can address these problems. Machine Learning (ML) is an application of AI that can be able to function without being specifically programmed, that learn from data and make predictions or decisions based on past data. ML uses three learning approaches, namely, supervised learning, unsupervised learning, and semi-supervised learning. The ML techniques include the extraction of features and the selection of suitable features for a specific problem requires a domain expert. Deep learning (DL) techniques solve the problem of feature selection. DL is one part of ML, and DL can automatically extract essential features from raw input data [ 88 ]. The concept of DL algorithms was introduced from cognitive and information theories. In general, DL has two properties: (1) multiple processing layers that can learn distinct features of data through multiple levels of abstraction, and (2) unsupervised or supervised learning of feature presentations on each layer. A large number of recent review papers have highlighted the capabilities of advanced DLA in the medical field MRI [ 8 ], Radiology [ 96 ], Cardiology [ 11 ], and Neurology [ 155 ].
Different forms of DLA were borrowed from the field of computer vision and applied to specific medical image analysis. Recurrent Neural Networks (RNNs) and convolutional neural networks are examples of supervised DL algorithms. In medical image analysis, unsupervised learning algorithms have also been studied; These include Deep Belief Networks (DBNs), Restricted Boltzmann Machines (RBMs), Autoencoders, and Generative Adversarial Networks (GANs) [ 84 ]. DLA is generally applicable for detecting an abnormality and classify a specific type of disease. When DLA is applied to medical images, Convolutional Neural Networks (CNN) are ideally suited for classification, segmentation, object detection, registration, and other tasks [ 29 , 44 ]. CNN is an artificial visual neural network structure used for medical image pattern recognition based on convolution operation. Deep learning (DL) applications in medical images are visualized in Fig. 1 .

a X-ray image with pulmonary masses [ 121 ] b CT image with lung nodule [ 82 ] c Digitized histo pathological tissue image [ 132 ]
2 Neural networks
2.1 history of neural networks.
The study of artificial neural networks and deep learning derives from the ability to create a computer system that simulates the human brain [ 33 ]. A neurophysiologist, Warren McCulloch, and a mathematician Walter Pitts [ 97 ] developed a primitive neural network based on what has been known as a biological structure in the early 1940s. In 1949, a book titled “Organization of Behavior” [ 100 ] was the first to describe the process of upgrading synaptic weights which is now referred to as the Hebbian Learning Rule. In 1958, Frank Rosenblatt’s [ 127 ] landmark paper defined the structure of the neural network called the perceptron for the binary classification task.
In 1962, Windrow [ 172 ] introduced a device called the Adaptive Linear Neuron (ADALINE) by implementing their designs in hardware. The limitations of perceptions were emphasized by Minski and Papert (1969) [ 98 ]. The concept of the backward propagation of errors for purposes of training is discussed in Werbose1974 [ 171 ]. In 1979, Fukushima [ 38 ] designed artificial neural networks called Neocognitron, with multiple pooling and convolution layers. One of the most important breakthroughs in deep learning occurred in 2006, when Hinton et al. [ 9 ] implemented the Deep Belief Network, with several layers of Restricted Boltzmann Machines, greedily teaching one layer at a time in an unsupervised fashion. In 1989, Yann LeCun [ 71 ] combined CNN with backpropagation to effectively perform the automated recognition of handwritten digits. Figure 2 shows important advancements in the history of neural networks that led to a deep learning era.

Demonstrations of significant developments in the history of neural networks [ 33 , 134 ]
2.2 Artificial neural networks
Artificial Neural Networks (ANN) form the basis for most of the DLA. ANN is a computational model structure that has some performance characteristics similar to biological neural networks. ANN comprises simple processing units called neurons or nodes that are interconnected by weighted links. A biological neuron can be described mathematically in Eq. ( 1 ). Figure 3 shows the simplest artificial neural model known as the perceptron.

Perceptron [ 77 ]
2.3 Training a neural network with Backpropagation (BP)
In the neural networks, the learning process is modeled as an iterative process of optimization of the weights to minimize a loss function. Based on network performance, the weights are modified on a set of examples belonging to the training set. The necessary steps of the training procedure contain forward and backward phases. For Neural Network training, any of the activation functions in forwarding propagation is selected and BP training is used for changing weights. The BP algorithm helps multilayer FFNN to learn input-output mappings from training samples [ 16 ]. Forward propagation and backpropagation are explained with the one hidden layer deep neural networks in the following algorithm.
The backpropagation algorithm is as follows for one hidden layer neural network
Initialize all weights to small random values.
While the stopping condition is false, do steps 3 through10.
For each training pair (( x 1 , y 1 )…( x n , y n ) do steps 4 through 9.
Feed-forward propagation:
Each input unit ( X i , i = 1, 2, … n ) receives the input signal x i and send this signal to all hidden units in the above layer.
Each hidden unit ( Z j , j = 1. ., p ) compute output using the below equation, and it transmits to the output unit (i.e.) \( {z}_{j\_ in}={b}_j+{\sum}_{i=1}^n{w}_{ij}{x}_i \) applies to an activation function Z j = f ( Z j _ in ).
Compute the out signal for each output unit ( Y k , k = 1, …., m ).
\( {y}_{k\_ in}={b}_k+{\sum}_{j=1}^p{z}_j{w}_{jk} \) and calculate activation y k = f ( y k _ in )
Backpropagation
For input training pattern ( x 1 , x 2 …., x n ) corresponding output pattern ( y 1 , y 2 , …, y m ), let ( t 1 , t 2 , …. . t m ) be target pattern. For each output, the neuron computes network error δ k
At output-layer neurons δ k = ( t k − y k ) f ′ ( y k _ in )
For each hidden neuron, calculate its error information term δ j while doing so, use δ k of the output neurons as obtained in the previous step
At Hidden layer neurons \( {\delta}_j={f}^{\prime}\left({z}_{j\_ in}\right){\sum}_k^m{\delta}_k{w}_{jk} \)
Update weights and biases using the following formulas where η is learning rate
Each output layer ( Y k , k = 1, 2, …. m ) updates its weights ( J = 0, 1, … P ) and bias
w jk ( new ) = w jk ( old ) + ηδ k z j ; b k ( new ) = b k ( old ) + ηδ k
Each hidden layer ( Z J , J = 1, 2, … p ) updates its weights ( i = 0, 1, … n ) biases:
w ij ( new ) = w ij ( old ) + ηδ j x i ; b j ( old ) = b j ( old ) + ηδ j
Test stopping condition
2.4 Activation function
The activation function is the mechanism by which artificial neurons process and transfers information [ 42 ]. There are various types of activation functions which can be used in neural networks based on the characteristic of the application. The activation functions are non-linear and continuously differentiable. Differentiability property is important mainly when training a neural network using the gradient descent method. Some widely used activation functions are listed in Table 1 .
3 Deep learning
Deep learning is a subset of the machine learning field which deals with the development of deep neural networks inspired by biological neural networks in the human brain .
3.1 Autoencoder
Autoencoder (AE) [ 128 ] is one of the deep learning models which exemplifies the principle of unsupervised representation learning as depicted in Fig. 4a . AE is useful when the input data have more number of unlabelled data compared to labeled data. AE encodes the input x into a lower-dimensional space z. The encoded representation is again decoded to an approximated representation x ′ of the input x through one hidden layer z.

a Autoencoder [ 187 ] b Restricted Boltzmann Machine with n hidden and m visible units [ 88 ] c Deep Belief Networks [ 88 ]
Basic AE consists of three main steps:
Encode: Convert input vector \( x\ \epsilon\ {\mathbf{\mathfrak{R}}}^{\boldsymbol{m}} \) into \( h\ \epsilon\ {\mathbf{\mathfrak{R}}}^{\mathrm{n}} \) , the hidden layer by h = f ( wx + b )where \( w\ \epsilon\ {\mathbf{\mathfrak{R}}}^{\boldsymbol{m}\ast \boldsymbol{n}} \) and \( b\ \epsilon\ {\mathbf{\mathfrak{R}}}^{\boldsymbol{n}} \) . m and n are dimensions of the input vector and converted hidden state. The dimension of the hidden layer h is to be smaller than x . f is an activate function.
Decode: Based on the above h , reconstruct input vector z by equation z = f ′ ( w ′ h + b ′ ) where \( {w}^{\prime}\epsilon\ {\mathbf{\mathfrak{R}}}^{\boldsymbol{n}\ast \boldsymbol{m}} \) and \( {b}^{\prime}\boldsymbol{\epsilon} {\mathbf{\mathfrak{R}}}^{\boldsymbol{m}}. \) The f ′ is the same as the above activation function.
Calculate square error: L recons ( x , z) = ∥ x − z∥ 2 , which is the reconstruction error cost function. Reconstruct error minimization is achieved by optimizing the cost function (2)
Another unsupervised algorithm representation is known as Stacked Autoencoder (SAE). The SAE comprises stacks of autoencoder layers mounted on top of each other where the output of each layer was wired to the inputs of the next layer. A Denoising Autoencoder (DAE) was introduced by Vincent et al. [ 159 ]. The DAE is trained to reconstruct the input from random noise added input data. Variational autoencoder (VAE) [ 66 ] is modifying the encoder where the latent vector space is used to represent the images that follow a Gaussian distribution unit. There are two losses in this model; one is a mean squared error and the Kull back Leibler divergence loss that determines how close the latent variable matches the Gaussian distribution unit. Sparse autoencoder [ 106 ] and variational autoencoders have applications in unsupervised, semi-supervised learning, and segmentation.
3.2 Restricted Boltzmann machine
A Restricted Boltzmann machine [RBM] is a Markov Random Field (MRF) associated with the two-layer undirected probabilistic generative model, as shown in Fig. 4b . RBM contains visible units (input) v and hidden (output) units h . A significant feature of this model is that there is no direct contact between the two visible units or either of the two hidden units. In binary RBMs, the random variables ( v , h ) takes ( v , h ) ∈ {0, 1} m + n . Like the general Boltzmann machine [ 50 ], the RBM is an energy-based model. The energy of the state { v , h } is defined as (3)
where v j , h i are the binary states of visible unit j ∈ {1, 2, … m } and hidden unit i ∈ {1, 2, .. n }, b j , c i are their biases of visible and hidden units, w ij is the symmetric interaction term between the units v j and h i them. A joint probability of ( v , h ) is given by the Gibbs distribution in Eq. ( 4 )
Z is a “partition function” that can be given by summing over all possible pairs of visual v and hidden h (5).
A significant feature of the RBM model is that there is no direct contact between the two visible units or either of the two hidden units. In term of probability, conditional distributions p ( h | v ) and p ( v | h ) is computed as (6) \( p\left(h|v\right)={\prod}_{i=1}^np\left({h}_i|v\right) \)
For binary RBM condition distribution of visible and hidden are given by (7) and (8)
where σ( · ) is a sigmoid function
RBMs parameters ( w ij , b j , c i ) are efficiently calculated using the contrastive divergence learning method [ 150 ]. A batch version of k-step contrastive divergence learning (CD-k) can be discussed in the algorithm below [ 36 ]

3.3 Deep belief networks
The Deep Belief Networks (DBN) proposed by Hinton et al. [ 51 ] is a non-convolution model that can extract features and learn a deep hierarchical representation of training data. DBNs are generative models constructed by stacking multiple RBMs. DBN is a hybrid model, the first two layers are like RBM, and the rest of the layers form a directed generative model. A DBN has one visible layer v and a series of hidden layers h (1) , h (2) , …, h ( l ) as shown in Fig. 4c . The DBN model joint distribution between the observed units v and the l hidden layers h k ( k = 1, … l ) as (9)
where v = h (0) , P ( h k | h k + 1 ) is a conditional distribution (10) for the layer k given the units of k + 1
A DBN has l weight matrices: W (1) , …. , W ( l ) and l + 1 bias vectors: b (0) , …, b ( l ) P ( h ( l ) , h ( l − 1) ) is the joint distribution of top-level RBM (11).
The probability distribution of DBN is given by Eq. ( 12 )
3.4 Convolutional neural networks (CNN)
In neural networks, CNN is a unique family of deep learning models. CNN is a major artificial visual network for the identification of medical image patterns. The family of CNN primarily emerges from the information of the animal visual cortex [ 55 , 116 ]. The major problem within a fully connected feed-forward neural network is that even for shallow architectures, the number of neurons may be very high, which makes them impractical to apply to image applications. The CNN is a method for reducing the number of parameters, allows a network to be deeper with fewer parameters.
CNN’s are designed based on three architectural ideas that are shared weights, local receptive fields, and spatial sub-sampling [ 70 ]. The essential element of CNN is the handling of unstructured data through the convolution operation. Convolution of the input signal x ( t ) with filter signal h ( t ) creates an output signal y ( t ) that may reveal more information than the input signal itself. 1D convolution of a discrete signals x ( t ) and h ( t ) is (13)
A digital image x ( n 1 , n 2 ) is a 2-D discrete signal. The convolution of images x ( n 1 , n 2 ) and h ( n 1 , n 2 ) is (14)
where 0 ≤ n 1 ≤ M − 1, 0 ≤ n 2 ≤ N − 1.
The function of the convolution layer is to detect local features x l from input feature maps x l − 1 using kernels k l by convolution operation (*) i.e. x l − 1 ∗ k l . This convolution operation is repeated for every convolutional layer subject to non-linear transform (15)
where \( {k}_{mn}^{(l)} \) represents weights between feature map m at layer l − 1 and feature map n at \( l.{x}_m^{\left(l-1\right)} \) represents the m feature map of the layer l − 1 and \( {x}_n^l \) is n feature map of the layer l . \( {b}_m^{(l)} \) is the bias parameter. f (.) is the non-linear activation function. M l − 1 denotes a set of feature maps. CNN significantly reduces the number of parameters compared with a fully connected neural network because of local connectivity and weight sharing. The depth, zero-padding, and stride are three hyperparameters for controlling the volume of the convolution layer output.
A pooling layer comes after the convolutional layer to subsample the feature maps. The goal of the pooling layers is to achieve spatial invariance by minimizing the spatial dimension of the feature maps for the next convolution layer. Max pooling and average pooling are commonly used two different polling operations to achieve downsampling. Let the size of the pooling region M and each element in the pooling region is given as x j = ( x 1 , x 2 , … x M × M ), the output after pooling is given as x i . Max pooling and average polling are described in the following Eqs. ( 16 ) and ( 17 ).
The max-pooling method chooses the most superior invariant feature in a pooling region. The average pooling method selects the average of all the features in the pooling area. Thus, the max-pooling method holds texture information that can lead to faster convergence, average pooling method is called Keep background information [ 133 ]. Spatial pyramid pooling [ 48 ], stochastic polling [ 175 ], Def-pooling [ 109 ], Multi activation pooling [ 189 ], and detailed preserving pooling [ 130 ] are different pooling techniques in the literature. A fully connected layer is used at the end of the CNN model. Fully connected layers perform like a traditional neural network [ 174 ]. The input to this layer is a vector of numbers (output of the pooling layer) and outputs an N-dimensional vector (N number of classes). After the pooling layers, the feature of previous layer maps is flattened and connected to fully connected layers.
The first successful seven-layered LeNet-5 CNN was developed by Yann LeCunn in 1990 for handwritten digit recognition successfully. Krizhevsky et al. [ 68 ] proposed AlexNet is a deep convolutional neural network composed of 5 convolutional and 3 fully-connected layers. In AlexNet changed the sigmoid activation function to a ReLU activation function to make model training easier.
K. Simonyan and A. Zisserman invented the VGG-16 [ 143 ] which has 13 convolutional and 3 fully connected layers. The Visual Geometric Group (VGG) research group released a series of CNN starting from VGG-11, VGG-13, VGG-16, and VGG-19. The main intention of the VGG group to understand how the depth of convolutional networks affects the accuracy of the models of image classification and recognition. Compared to the maximum VGG19, which has 16 convolutional layers and 3 fully connected layers, the minimum VGG11 has 8 convolutional layers and 3 fully connected layers. The last three fully connected layers are the same as the various variations of VGG.
Szegedy et al. [ 151 ] proposed an image classification network consisting of 22 different layers, which is GoogleNet. The main idea behind GoogleNet is the introduction of inception layers. Each inception layer convolves the input layers partially using different filter sizes. Kaiming He et al. [ 49 ] proposed the ResNet architecture, which has 33 convolutional layers and one fully-connected layer. Many models introduced the principle of using multiple hidden layers and extremely deep neural networks, but then it was realized that such models suffered from the issue of vanishing or exploding gradients problem. For eliminating vanishing gradients’ problem skip layers (shortcut connections) are introduced. DenseNet developed by Gao et al. [ 54 ] consists of several dense blocks and transition blocks, which are placed between two adjacent dense blocks. The dense block consists of three layers of batch normalization, followed by a ReLU and a 3 × 3 convolution operation. The transition blocks are made of Batch Normalization, 1 × 1 convolution, and average Pooling.
Compared to state-of-the-art handcrafted feature detectors, CNNs is an efficient technique for detecting features of an object and achieving good classification performance. There are drawbacks to CNNs, which are that unique relationships, size, perspective, and orientation of features are not taken into account. To overcome the loss of information in CNNs by pooling operation Capsule Networks (CapsNet) are used to obtain spatial information and most significant features [ 129 ]. The special type of neurons, called capsules, can detect efficiently distinct information. The capsule network consists of four main components that are matrix multiplication, Scalar weighting of the input, dynamic routing algorithm, and squashing function.
3.5 Recurrent neural networks (RNN)
RNN is a class of neural networks used for processing sequential information (deal with sequential data). The structure of the RNN shown in Fig. 5a is like an FFNN and the difference is that recurrent connections are introduced among hidden nodes. A generic RNN model at time t , the recurrent connection hidden unit h t receives input activation from the present data x t and the previous hidden state h t − 1 . The output y t is calculated given the hidden state h t . It can be represented using the mathematical Eqs. ( 18 ) and ( 19 ) as

a Recurrent Neural Networks [ 163 ] b Long Short-Term Memory [ 163 ] c Generative Adversarial Networks [ 64 ]
Here f is a non-linear activation function, w hx is the weight matrix between the input and hidden layers, w hh is the matrix of recurrent weights between the hidden layers and itself w yh is the weight matrix between the hidden and output layer, and b h and b y are biases that allow each node to learn and offset. While the RNN is a simple and efficient model, in reality, it is, unfortunately, difficult to train properly. Real-Time Recurrent Learning (RTRL) algorithm [ 173 ] and Back Propagation Through Time (BPTT) [ 170 ] methods are used to train RNN. Training with these methods frequently fails because of vanishing (multiplication of many small values) or explode (multiplication of many large values) gradient problem [ 10 , 112 ]. Hochreiter and Schmidhuber (1997) designed a new RNN model named Long Short Term Memory (LSTM) that overcome error backflow problems with the aid of a specially designed memory cell [ 52 ]. Figure 5b shows an LSTM cell which is typically configured by three gates: input gate g t , forget gate f t and output gate o t , these gates add or remove information from the cell.
An LSTM can be represented with the following Eqs. ( 20 ) to ( 25 )
3.6 Generative adversarial networks (GAN)
In the field of deep learning, one of the deep generative models are Generative Adversarial Networks (GANs) introduced by Good Fellow in [ 43 ]. GANs are neural networks that can generate synthetic images that closely imitate the original images. In GAN shown in Fig. 5c , there are two neural networks, namely generator, and discriminator, which are trained simultaneously. The generator G generates counterfeit data samples which aim to “fool” the discriminator D , while the discriminator attempts to correctly distinguish the true and false samples. In mathematical terms, D and G play a two player minimax game with the cost function of (26) [ 64 ].
Where x represents the original image, z is a noise vector with random numbers. p data ( x ) and p z ( z ) are probability distributions of x and z , respectively. D ( x ) represents the probability that x comes from the actual data p data ( x ) rather than the generated data. 1 − D ( G (z)) is the probability that it can be generated from p z (z). The expectation of x from the real data distribution p data is expressed by \( {E}_{x\sim {p}_{data(x)}} \) and the expectation of z sampled from noise is \( {E}_{\mathrm{z}\sim {P}_{\mathrm{z}}\left(\mathrm{z}\right)}. \) The goal of the training is to maximize the loss function for the discriminator, while the training objective for the generator is to reduce the term log (1 − D ( G ( z ))).The most utilization of GAN in the field of medical image analysis is data augmentation (generating new data) and image to image translation [ 107 ]. Trustability of the Generated Data, Unstable Training, and evaluation of generated data are three major drawbacks of GAN that might hinder their acceptance in the medical community [ 183 ].
Ronneberger et al. [ 126 ] proposed CNN based U-Net architecture for segmentation in biomedical image data. The architecture consists of a contracting path (left side) to capture context and an expansive symmetric path (right side) that enables precise localization. U-Net is a generalized DLA used for quantification tasks such as cell detection and shape measurement in medical image data [ 34 ].
3.8 Software frameworks
There are several software frameworks available for implementing DLA which are regularly updated as new approaches and ideas are created. DLA encapsulates many levels of mathematical principles based on probability, linear algebra, calculus, and numerical computation. Several deep learning frameworks exist such as Theano, TensorFlow, Caffe, CNTK, Torch, Neon, pylearn, etc. [ 138 ]. Globally, Python is probably the most commonly used programming language for DL. PyTorch and Tensorflow are the most widely used libraries for research in 2019. Table 2 shows the analysis of various Deep Learning Frameworks based on the core language and supported interface language.
4 Use of deep learning in medical imaging
4.1 x-ray image.
Chest radiography is widely used in diagnosis to detect heart pathologies and lung diseases such as tuberculosis, atelectasis, consolidation, pleural effusion, pneumothorax, and hyper cardiac inflation. X-ray images are accessible, affordable, and less dose-effective compared to other imaging methods, and it is a powerful tool for mass screening [ 14 ]. Table 3 presents a description of the DL methods used for X-ray image analysis.
S. Hwang et al. [ 57 ] proposed the first deep CNN-based Tuberculosis screening system with a transfer learning technique. Rajaraman et al. [ 119 ] proposed modality-specific ensemble learning for the detection of abnormalities in chest X-rays (CXRs). These model predictions are combined using various ensemble techniques toward minimizing prediction variance. Class selective mapping of interest (CRM) is used for visualizing the abnormal regions in the CXR images. Loey et al. [ 90 ] proposed A GAN with deep transfer training for COVID-19 detection in CXR images. The GAN network was used to generate more CXR images due to the lack of the COVID-19 dataset. Waheed et al. [ 160 ] proposed a CovidGAN model based on the Auxiliary Classifier Generative Adversarial Network (ACGAN) to produce synthetic CXR images for COVID-19 detection. S. Rajaraman and S. Antani [ 120 ] introduced weakly labeled data augmentation for increasing training dataset to improve the COVID-19 detection performance in CXR images.
4.2 Computerized tomography (CT)
CT uses computers and rotary X-ray equipment to create cross-section images of the body. CT scans show the soft tissues, blood vessels, and bones in different parts of the body. CT is a high detection ability, reveals small lesions, and provides a more detailed assessment. CT examinations are frequently used for pulmonary nodule identification [ 93 ]. The detection of malignant pulmonary nodules is fundamental to the early diagnosis of lung cancer [ 102 , 142 ]. Table 4 summarizes the latest deep learning developments in the study of CT image analysis.
Li et al. 2016 [ 74 ] proposed deep CNN for the detection of three types of nodules that are semisolid, solid, and ground-glass opacity. Balagourouchetty et al. [ 5 ] proposed GoogLeNet based an ensemble FCNet classifier for The liver lesion classification. For feature extraction, basic Googlenet architecture is modified with three modifications. Masood et al. [ 95 ] proposed the multidimensional Region-based Fully Convolutional Network (mRFCN) for lung nodule detection/classification and achieved a classification accuracy of 97.91%. In lung nodule detection, the feature work is the detection of micronodules (less than 3 mm) without loss of sensitivity and accuracy. Zhao and Zeng 2019 [ 190 ] proposed DLA based on supervised MSS U-Net and 3DU-Net to automatically segment kidneys and kidney tumors from CT images. In the present pandemic situation, Fan et al. [ 35 ] and Li et al. [ 79 ] used deep learning-based techniques for COVID-19 detection from CT images.
4.3 Mammograph (MG)
Breast cancer is one of the world’s leading causes of death among women with cancer. MG is a reliable tool and the most common modality for early detection of breast cancer. MG is a low-dose x-ray imaging method used to visualize the breast structure for the detection of breast diseases [ 40 ]. Detection of breast cancer on mammography screening is a difficult task in image classification because the tumors constitute a small part of the actual breast image. For analyzing breast lesions from MG, three steps are involved that are detection, segmentation, and classification [ 139 ].
The automatic classification and detection of masses at an early stage in MG is still a hot subject of research. Over the past decade, DLA has shown some significant overcome in breast cancer detection and classification problem. Table 5 summarizes the latest DLA developments in the study of mammogram image analysis.
Fonseca et al. [ 37 ] proposed a breast composition classification according to the ACR standard based on CNN for feature extraction. Wang et al. [ 161 ] proposed twelve-layer CNN to detect Breast arterial calcifications (BACs) in mammograms image for risk assessment of coronary artery disease. Ribli et al. [ 124 ] developed a CAD system based on Faster R-CNN for detection and classification of benign and malignant lesions on a mammogram image without any human involvement. Wu et al. [ 176 ] present a deep CNN trained and evaluated on over 1,000,000 mammogram images for breast cancer screening exam classification. Conant et al. [ 26 ] developed a Deep CNN based AI system to detect calcified lesions and soft- tissue in digital breast tomosynthesis (DBT) images. Kang et al. [ 62 ] introduced Fuzzy completely connected layer (FFCL) architecture, which focused primarily on fused fuzzy rules with traditional CNN for semantic BI-RADS scoring. The proposed FFCL framework achieved superior results in BI-RADS scoring for both triple and multi-class classifications.
4.4 Histopathology
Histopathology is the field of study of human tissue in the sliding glass using a microscope to identify different diseases such as kidney cancer, lung cancer, breast cancer, and so on. The staining is used in histopathology for visualization and highlight a specific part of the tissue [ 45 ]. For example, Hematoxylin and Eosin (H&E) staining tissue gives a dark purple color to the nucleus and pink color to other structures. H&E stain plays a key role in the diagnosis of different pathologies, cancer diagnosis, and grading over the last century. The recent imaging modality is digital pathology
Deep learning is emerging as an effective method in the analysis of histopathology images, including nucleus detection, image classification, cell segmentation, tissue segmentation, etc. [ 178 ]. Tables 6 and 7 summarize the latest deep learning developments in pathology. In the study of digital pathology image analysis, the latest development is the introduction of whole slide imaging (WSI). WSI allows digitizing glass slides with stained tissue sections at high resolution. Dimitriou et al. [ 30 ] reviewed challenges for the analysis of multi-gigabyte WSI images for building deep learning models. A. Serag et al. [ 135 ] discuss different public “Grand Challenges” that have innovations using DLA in computational pathology.
4.5 Other images
Endoscopy is the insertion of a long nonsurgical solid tube directly into the body for the visual examination of an internal organ or tissue in detail. Endoscopy is beneficial in studying several systems inside the human body, such as the gastrointestinal tract, the respiratory tract, the urinary tract, and the female reproductive tract [ 60 , 101 ]. Du et al. [ 31 ] reviewed the Applications of Deep Learning in the Analysis of Gastrointestinal Endoscopy Images. A revolutionary device for direct, painless, and non-invasive inspection of the gastrointestinal (GI) tract for detecting and diagnosing GI diseases (ulcer, bleeding) is Wireless capsule endoscopy (WCE). Soffer et al. [ 145 ] performed a systematic analysis of the existing literature on the implementation of deep learning in the WCE. The first deep learning-based framework was proposed by He et al. [ 46 ] for the detection of hookworm in WCE images. Two CNN networks integrated (edge extraction and classification of hookworm) to detect hookworm. Since tubular structures are crucial elements for hookworm detection, the edge extraction network was used for tubular region detection. Yoon et al. [ 185 ] developed a CNN model for early gastric cancer (EGC) identification and prediction of invasion depth. The depth of tumor invasion in early gastric cancer (EGC) is a significant factor in deciding the method of treatment. For the classification of endoscopic images as EGC or non-EGC, the authors employed a VGG-16 model. Nakagawa et al. [ 105 ] applied DL technique based on CNN to enhance the diagnostic assessment of oesophageal wall invasion using endoscopy. J.choi et al. [ 22 ] express the feature aspects of DL in endoscopy.
Positron Emission Tomography (PET) is a nuclear imaging tool that is generally used by the injection of particular radioactive tracers to visualize molecular-level activities within tissues. T. Wang et al. [ 168 ] reviewed applications of machine learning in PET attenuation correction (PET AC) and low-count PET reconstruction. The authors discussed the advantages of deep learning over machine learning in the applications of PET images. AJ reader et al. [ 123 ] reviewed the reconstruction of PET images that can be used in deep learning either directly or as a part of traditional reconstruction methods.
5 Discussion
The primary purpose of this paper is to review numerous publications in the field of deep learning applications in medical images. Classification, detection, and segmentation are essential tasks in medical image processing [ 144 ]. For specific deep learning tasks in medical applications, the training of deep neural networks needs a lot of labeled data. But in the medical field, at least thousands of labeled data is not available. This issue is alleviated by a technique called transfer learning. Two transfer learning approaches are popular and widely applied that are fixed feature extractors and fine-tuning a pre-trained network. In the classification process, the deep learning models are used to classify images into two or more classes. In the detection process, Deep learning models have the function of identifying tumors and organs in medical images. In the segmentation task, deep learning models try to segment the region of interest in medical images for processing.
5.1 Segmentation
For medical image segmentation, deep learning has been widely used, and several articles have been published documenting the progress of deep learning in the area. Segmentation of breast tissue using deep learning alone has been successfully implemented [ 104 ]. Xing et al. [ 179 ] used CNN to acquire the initial shape of the nucleus and then isolate the actual nucleus using a deformable pattern. Qu et al. [ 118 ] suggested a deep learning approach that could segment the individual nucleus and classify it as a tumor, lymphocyte, and stroma nuclei. Pinckaers and Litjens [ 115 ] show on a colon gland segmentation dataset (GlaS) that these Neural Ordinary Differential Equations (NODE) can be used within the U-Net framework to get better segmentation results. Sun 2019 [ 149 ] developed a deep learning architecture for gastric cancer segmentation that shows the advantage of utilizing multi-scale modules and specific convolution operations together. Figure 6 shows U-Net is the most usually used network for segmentation (Fig. 6 ).

U-Net architecture for segmentation,comprising encoder (downsampling) and decoder (upsampling) sections [ 135 ]
5.2 Detection
The main challenge posed by methods of detection of lesions is that they can give rise to multiple false positives while lacking a good proportion of true positive ones . For tuberculosis detection using deep learning methods applied in [ 53 , 57 , 58 , 91 , 119 ]. Pulmonary nodule detection using deep learning has been successfully applied in [ 82 , 108 , 136 , 157 ].
Shin et al. [ 141 ] discussed the effect of CNN pre-trained architectures and transfer learning on the identification of enlarged thoracoabdominal lymph nodes and the diagnosis of interstitial lung disease on CT scans, and considered transfer learning to be helpful, given the fact that natural images vary from medical images. Litjens et al. [ 85 ] introduced CNN for the identification of Prostate cancer in biopsy specimens and breast cancer metastasis identification in sentinel lymph nodes. The CNN has four convolution layers for feature extraction and three classification layers. Riddle et al. [ 124 ] proposed the Faster R-CNN model for the detection of mammography lesions and classified these lesions into benign and malignant, which finished second in the Digital Mammography DREAM Challenge. Figure 7 shows VGG architecture for detection.

CNN architecture for detection [ 144 ]
An object detection framework named Clustering CNN (CLU-CNNs) was proposed by Z. Li et al. [ 76 ] for medical images. CLU-CNNs used Agglomerative Nesting Clustering Filtering (ANCF) and BN-IN Net to avoid much computation cost facing medical images. Image saliency detection aims at locating the most eye-catching regions in a given scene [ 21 , 78 ]. The goal of image saliency detection is to locate a given scene in the most eye-catching regions. In different applications, it also acts as a pre-processing tool including video saliency detection [ 17 , 18 ], object recognition, and object tracking [ 20 ]. Saliency maps are a commonly used tool for determining which areas are most important to the prediction of a trained CNN on the input image [ 92 ]. NT Arun et al. [ 4 ] evaluated the performance of several popular saliency methods on the RSNA Pneumonia Detection dataset and was found that GradCAM was sensitive to the model parameters and model architecture.
5.3 Classification
In classification tasks, deep learning techniques based on CNN have seen several advancements. The success of CNN in image classification has led researchers to investigate its usefulness as a diagnostic method for identifying and characterizing pulmonary nodules in CT images. The classification of lung nodules using deep learning [ 74 , 108 , 117 , 141 ] has also been successfully implemented.
Breast parenchymal density is an important indicator of the risk of breast cancer. The DL algorithms used for density assessment can significantly reduce the burden of the radiologist. Breast density classification using DL has been successfully implemented [ 37 , 59 , 72 , 177 ]. Ionescu et al. [ 59 ] introduced a CNN-based method to predict Visual Analog Score (VAS) for breast density estimation. Figure 8 shows AlexNet architecture for classification.
Alcoholism or alcohol use disorder (AUD) has effects on the brain. The structure of the brain was observed using the Neuroimaging approach. S.H.Wang et al. [ 162 ] proposed a 10-layer CNN for alcohol use disorder (AUD) problem using dropout, batch normalization, and PReLU techniques. The authors proposed a 10 layer CNN model that has obtained a sensitivity of 97.73, a specificity of 97.69, and an accuracy of 97.71. Cerebral micro-bleeding (CMB) are small chronic brain hemorrhages that can result in cognitive impairment, long-term disability, and neurologic dysfunction. Therefore, early-stage identification of CMBs for prompt treatment is essential. S. Wang et al. [ 164 ] proposed the transfer learning-based DenseNet to detect Cerebral micro-bleedings (CMBs). DenseNet based model attained an accuracy of 97.71% (Fig. 8 ).

CNN architecture for classification [ 144 ]
5.4 Limitations and challenges
The application of deep learning algorithms to medical imaging is fascinating, but many challenges are pulling down the progress. One of the limitations to the adoption of DL in medical image analysis is the inconsistency in the data itself (resolution, contrast, signal-to-noise), typically caused by procedures in clinical practice [ 113 ]. The non-standardized acquisition of medical images is another limitation in medical image analysis. The need for comprehensive medical image annotations limits the applicability of deep learning in medical image analysis. The major challenge is limited data and compared to other datasets, the sharing of medical data is incredibly complicated. Medical data privacy is both a sociological and a technological issue that needs to be discussed from both viewpoints. For building DLA a large amount of annotated data is required. Annotating medical images is another major challenge. Labeling medical images require radiologists’ domain knowledge. Therefore, it is time-consuming to annotate adequate medical data. Semi-supervised learning could be implemented to make combined use of the existing labeled data and vast unlabelled data to alleviate the issue of “limited labeled data”. Another way to resolve the issue of “data scarcity” is to develop few-shot learning algorithms using a considerably smaller amount of data. Despite the successes of DL technology, there are many restrictions and obstacles in the medical field. Whether it is possible to reduce medical costs, increase medical efficiency, and improve the satisfaction of patients using DL in the medical field cannot be adequately checked. However, in clinical trials, it is necessary to demonstrate the efficacy of deep learning methods and to develop guidelines for the medical image analysis applications of deep learning.
6 Conclusion and future directions
Medical imaging is a place of origin of the information necessary for clinical decisions. This paper discusses the new algorithms and strategies in the area of deep learning. In this brief introduction to DLA in medical image analysis, there are two objectives. The first one is an introduction to the field of deep learning and the associated theory. The second is to provide a general overview of the medical image analysis using DLA. It began with the history of neural networks since 1940 and ended with breakthroughs in medical applications in recent DL algorithms. Several supervised and unsupervised DL algorithms are first discussed, including auto-encoders, recurrent, CNN, and restricted Boltzmann machines. Several optimization techniques and frameworks in this area include Caffe, TensorFlow, Theano, and PyTorch are discussed. After that, the most successful DL methods were reviewed in various medical image applications, including classification, detection, and segmentation. Applications of the RBM network is rarely published in the medical image analysis literature. In classification and detection, CNN-based models have achieved good results and are most commonly used. Several existing solutions to medical challenges are available. However, there are still several issues in medical image processing that need to be addressed with deep learning. Many of the current DL implementations are supervised algorithms, while deep learning is slowly moving to unsupervised and semi-supervised learning to manage real-world data without manual human labels.
DLA can support clinical decisions for next-generation radiologists. DLA can automate radiologist workflow and facilitate decision-making for inexperienced radiologists. DLA is intended to aid physicians by automatically identifying and classifying lesions to provide a more precise diagnosis. DLA can help physicians to minimize medical errors and increase medical efficiency in the processing of medical image analysis. DL-based automated diagnostic results using medical images for patient treatment are widely used in the next few decades. Therefore, physicians and scientists should seek the best ways to provide better care to the patient with the help of DLA. The potential future research for medical image analysis is the designing of deep neural network architectures using deep learning. The enhancement of the design of network structures has a direct impact on medical image analysis. Manual design of DL Model structure requires rich knowledge; hence Neural Network Search will probably replace the manual design [ 73 ]. A meaningful feature research direction is also the design of various activation functions. Radiation therapy is crucial for cancer treatment. Different medical imaging modalities are playing a critical role in treatment planning. Radiomics was defined as the extraction of high throughput features from medical images [ 28 ]. In the feature, Deep-learning analysis of radionics will be a promising tool in clinical research for clinical diagnosis, drug development, and treatment selection for cancer patients . Due to limited annotated medical data, unsupervised, weakly supervised, and reinforcement learning methods are the emerging research areas in DL for medical image analysis. Overall, deep learning, a new and fast-growing field, offers various obstacles as well as opportunities and solutions for a range of medical image applications.
Abadi M et al. (2016) TensorFlow: Large-Scale Machine Learning on Heterogeneous Distributed Systems, [Online]. Available: http://arxiv.org/abs/1603.04467 .
Abbas A, Abdelsamea MM, Gaber MM (2020) Classification of COVID-19 in chest X-ray images using DeTraC deep convolutional neural network, pp. 1–9, [Online]. Available: http://arxiv.org/abs/2003.13815 .
Apostolopoulos ID, Mpesiana TA (2020) Covid-19: automatic detection from X-ray images utilizing transfer learning with convolutional neural networks, Phys Eng Sci Med, no. 0123456789, pp. 1–6, DOI: https://doi.org/10.1007/s13246-020-00865-4 .
Arun NT et al. (2020) Assessing the validity of saliency maps for abnormality localization in medical imaging, pp. 1–5, [Online]. Available: http://arxiv.org/abs/2006.00063 .
L. Balagourouchetty, J. K. Pragatheeswaran, B. Pottakkat, and R. G, “GoogLeNet based ensemble FCNet classifier for focal liver lesion diagnosis,” IEEE J Biomed Heal Inf, vol. 2194, no. c, pp. 1–1, 2019, DOI: https://doi.org/10.1109/jbhi.2019.2942774 , 1694.
Bastien F et al. (2012) Theano: new features and speed improvements, pp. 1–10, [Online]. Available: http://arxiv.org/abs/1211.5590 .
Basu S, Mitra S, Saha N (2020) Deep Learning for Screening COVID-19 using Chest X-Ray Images, pp. 1–6, [Online]. Available: http://arxiv.org/abs/2004.10507 .
Bauer S, Wiest R, Nolte LP, Reyes M (2013) A survey of MRI-based medical image analysis for brain tumor studies. Phys Med Biol 58(13):1–44. https://doi.org/10.1088/0031-9155/58/13/R97
Article Google Scholar
Bengio Y, Lamblin P, Popovici D, Larochelle H (2006) Greedy layer-wise training of deep networks. In: The 19th International Conference on Neural Information Processing Systems(NIPS’06), pp 153–160. https://doi.org/10.5555/2976456.2976476
Chapter Google Scholar
Bengio Y, Simard P, Palo F (1994) Learning long -term dependencies with gradient descent is difficult. IEEE Trans Neural Netw 5(2):157–166
Bizopoulos P, Koutsouris D (2019) Deep learning in cardiology. IEEE Rev Biomed Eng 12(c):168–193. https://doi.org/10.1109/RBME.2018.2885714
Bulten W, Litjens G (2018) Unsupervised Prostate Cancer Detection on H&E using Convolutional Adversarial Autoencoders, [Online]. Available: http://arxiv.org/abs/1804.07098 .
Cai H et al. (2019) Breast Microcalcification Diagnosis Using Deep Convolutional Neural Network from Digital Mammograms, Comput Math Methods Med, vol. 2019, DOI: https://doi.org/10.1155/2019/2717454 .
Candemir S, Rajaraman S, Thoma G, Antani S (2018) Deep learning for grading cardiomegaly severity in chest x-rays : an investigation. In: 2018 IEEE Life Sciences Conference (LSC), pp 109–113. https://doi.org/10.1109/LSC.2018.8572113
Capizzi G, Lo Sciuto G, Napoli C, Połap D (2020) Small Lung Nodules Detection based on Fuzzy-Logic and Probabilistic Neural Network with Bio-inspired Reinforcement Learning, IEEE Trans Fuzzy Syst, vol. PP, no. XX, p. 1. https://doi.org/10.1109/TFUZZ.2019.2952831 .
Chen DS, Jain RC (1994) A robust back propagation learning algorithm for function approximation. IEEE Trans. Neural Networks 5(3):467–479. https://doi.org/10.1109/72.286917
Chen C, Li S, Qin H, Pan Z, Yang G (2018) Bilevel feature learning for video saliency detection. IEEE Trans Multimed 20(12):3324–3336. https://doi.org/10.1109/TMM.2018.2839523
Chen C, Li S, Wang Y, Qin H, Hao A (2017) Video saliency detection via spatial-temporal fusion and low-rank coherency diffusion. IEEE Trans Image Process 26(7):3156–3170. https://doi.org/10.1109/TIP.2017.2670143
Article MathSciNet MATH Google Scholar
Chen H, Qi X, Yu L, Dou Q, Qin J, Heng PA (2017) DCAN: deep contour-aware networks for object instance segmentation from histology images. Med Image Anal 36:135–146. https://doi.org/10.1016/j.media.2016.11.004
Chen C, Wang G, Peng C, Zhang X, Qin H (2020) Improved robust video saliency detection based on long-term spatial-temporal information. IEEE Trans Image Process 29:1090–1100. https://doi.org/10.1109/TIP.2019.2934350
Article MathSciNet Google Scholar
Chen C, Wei J, Peng C, Zhang W, Qin H (2020) Improved saliency detection in RGB-D images using two-phase depth estimation and selective deep fusion. IEEE Trans Image Process 29:4296–4307. https://doi.org/10.1109/TIP.2020.2968250
Choi J, Shin K, Jung J, Bae HJ, Kim DH, Byeon JS, Kim N (2020) Convolutional neural network technology in endoscopic imaging: artificial intelligence for endoscopy. Clin Endosc 53(2):117–126. https://doi.org/10.5946/ce.2020.054
Chougrad H, Zouaki H, Alheyane O (2018) Deep convolutional neural networks for breast cancer screening. Comput Methods Prog Biomed 157:19–30. https://doi.org/10.1016/j.cmpb.2018.01.011
Clevert DA, Unterthiner T, Hochreiter S (2016) Fast and accurate deep network learning by exponential linear units (ELUs). In: 4th International Conference on Learning Representations, ICLR 2016, pp 1–14
Google Scholar
Collobert R, Kavukcuoglu K, Farabet C (2011) Torch7: A matlab-like environment for machine learning, BigLearn, NIPS Work, pp. 1–6, [Online]. Available: http://infoscience.epfl.ch/record/192376/files/Collobert_NIPSWORKSHOP_2011.pdf .
Conant EF et al (2019) Improving Accuracy and Efficiency with Concurrent Use of Artificial Intelligence for Digital Breast Tomosynthesis. Radiol Artif Intell 1(4):e180096. https://doi.org/10.1148/ryai.2019180096
Coudray N, Ocampo PS, Sakellaropoulos T, Narula N, Snuderl M, Fenyö D, Moreira AL, Razavian N, Tsirigos A (2018) Classification and mutation prediction from non–small cell lung cancer histopathology images using deep learning. Nat Med 24(10):1559–1567. https://doi.org/10.1038/s41591-018-0177-5
Dercle L, Henry T, Carré A, Paragios N, Deutsch E, Robert C (2020) Reinventing radiation therapy with machine learning and imaging bio-markers (radiomics): State-of-the-art, challenges and perspectives, Methods, no. May, pp. 0–1, DOI: https://doi.org/10.1016/j.ymeth.2020.07.003 .
Dhillon A, Verma GK (2019) Convolutional neural network: a review of models, methodologies, and applications to object detection Prog Artif Intell, no. 0123456789, DOI: https://doi.org/10.1007/s13748-019-00203-0 .
Dimitriou N, Arandjelović O, Caie PD (2019) Deep Learning for Whole Slide Image Analysis: An Overview. Front Med 6(November):1–7. https://doi.org/10.3389/fmed.2019.00264
Du W et al (2019) Review on the applications of deep learning in the analysis of gastrointestinal endoscopy images. IEEE Access 7:142053–142069. https://doi.org/10.1109/ACCESS.2019.2944676
Dugas C, Bengio Y, Bélisle F, Nadeau C, Garcia R (2000) Incorporating second-order functional knowledge for better option pricing. In: 13th International Conference on Neural Information Processing Systems (NIPS’00), pp 451–457. https://doi.org/10.5555/3008751.3008817
Eberhart RC, Dobbins RW (1990) Early neural network development history: the age of Camelot. IEEE Eng Med Biol Mag 9(3):15–18. https://doi.org/10.1109/51.59207
Falk T, Mai D, Bensch R, Çiçek Ö, Abdulkadir A, Marrakchi Y, Böhm A, Deubner J, Jäckel Z, Seiwald K, Dovzhenko A, Tietz O, Dal Bosco C, Walsh S, Saltukoglu D, Tay TL, Prinz M, Palme K, Simons M, Diester I, Brox T, Ronneberger O (2019) U-net: deep learning for cell counting, detection, and morphometry. Nat Methods 16(1):67–70. https://doi.org/10.1038/s41592-018-0261-2
Fan D-P et al. (2020) Inf-Net: Automatic COVID-19 Lung Infection Segmentation from CT Scans, pp. 1–10, [Online]. Available: http://arxiv.org/abs/2004.14133 .
Fischer A, Igel C (2014) Training restricted Boltzmann machines: an introduction. Pattern Recogn 47(1):25–39. https://doi.org/10.1016/j.patcog.2013.05.025
Article MATH Google Scholar
Fonseca P et al (2015) Automatic breast density classification using a convolutional neural network architecture search procedure. Med Imaging 2015 Comput Diagnosis 9414(c):941428. https://doi.org/10.1117/12.2081576
Fukushima K (1980) Neocognitron: a self-organizing neural network model for a mechanism of pattern recognition unaffected by shift in position. Biol Cybern 36(4):193–202. https://doi.org/10.1007/BF00344251
Gadermayr M, Gupta L, Appel V, Boor P, Klinkhammer BM, Merhof D (2019) Generative adversarial networks for facilitating stain-independent supervised and unsupervised segmentation: a study on kidney histology. IEEE Trans Med Imaging 38(10):2293–2302. https://doi.org/10.1109/TMI.2019.2899364
Gardezi SJS, Elazab A, Lei B, Wang T (2019) Breast cancer detection and diagnosis using mammographic data: systematic review. J Med Internet Res 21(7):1–22. https://doi.org/10.2196/14464
Geras KJ et al. (2017) High-Resolution Breast Cancer Screening with Multi-View Deep Convolutional Neural Networks, pp. 1–9, [Online]. Available: http://arxiv.org/abs/1703.07047 .
Goodfellow I, Bengio Y, Courville A (2016) “Deep learning,” DOI: https://doi.org/10.1038/nmeth.3707
Goodfellow IJ et al (2014) Generative adversarial nets. Adv Neural Inf Process Syst 3(January):2672–2680
Greenspan H, Van Ginneken B, Summers RM (2016) Guest editorial deep learning in medical imaging: overview and future promise of an exciting new technique. IEEE Trans Med Imaging 35(5):1153–1159. https://doi.org/10.1109/TMI.2016.2553401
Gurcan MN, Boucheron LE, Can A, Madabhushi A, Rajpoot NM, Yener B (2009) Histopathological image analysis: a review. IEEE Rev Biomed Eng 2:147–171. https://doi.org/10.1109/RBME.2009.2034865
He JY, Wu X, Jiang YG, Peng Q, Jain R (2018) Hookworm detection in wireless capsule endoscopy images with deep learning. IEEE Trans Image Process 27(5):2379–2392. https://doi.org/10.1109/TIP.2018.2801119
He K, Zhang X, Ren S., Sun J (2015) Delving deep into rectifiers: Surpassing human-level performance on imagenet classification, Proc IEEE Int Conf Comput Vis, vol. 2015 Inter, pp 1026–1034, DOI: https://doi.org/10.1109/ICCV.2015.123 .
He K, Zhang X, Ren S, Sun J (2015) Spatial pyramid pooling in deep convolutional networks for visual recognition. IEEE Trans Pattern Anal Mach Intell 37(9):1904–1916
He K, Zhang X, Ren S, Sun J (2016) Deep residual learning for image recognition. Proc IEEE Comput Soc Conf Comput Vis Pattern Recognit 2016(Decem):770–778. https://doi.org/10.1109/CVPR.2016.90
Hinton G (2014) Boltzmann Machines, Encycl Mach Learn Data Min, no. 1, pp. 1–7, DOI: https://doi.org/10.1007/978-1-4899-7502-7_31-1 .
Hinton GE, Osindero S, Teh Y-W (2006) A fast learning algorithm for deep belief nets. Neural Comput 18:1527–1554. https://doi.org/10.1162/neco.2006.18.7.1527
Hochreiter S, Schmidhuber J (1997) Long short-term memory. Neural Comput 9(8):1735–1780. https://doi.org/10.1162/neco.1997.9.8.1735
Hooda R, Mittal A, Sofat S (2019) Automated TB classification using ensemble of deep architectures. Multimed Tools Appl 78(22):31515–31532. https://doi.org/10.1007/s11042-019-07984-5
Huang G, Liu Z, Van Der Maaten L, Weinberger KQ (2017) Densely connected convolutional networks. Proc - 30th IEEE Conf Comput Vis Pattern Recognition, CVPR 2017 2017(Janua):2261–2269. https://doi.org/10.1109/CVPR.2017.243
Hubel DH, Wiesel TN (1962) Receptive fields, binocular interaction and functional architecture in the cat’s visual cortex. J Physiol 160(1):106–154. https://doi.org/10.1113/jphysiol.1962.sp006837
Huynh BQ, Li H, Giger ML (2016) Digital mammographic tumor classification using transfer learning from deep convolutional neural networks. J Med Imaging 3(3):034501. https://doi.org/10.1117/1.jmi.3.3.034501
Hwang S, Kim H-E, Jeong J, Kim H-J (2016) A novel approach for tuberculosis screening based on deep convolutional neural networks. Med Imaging 2016 Comput Diagnosis 9785:97852W. https://doi.org/10.1117/12.2216198
Hwang EJ, Park S, Jin KN, Kim JI, Choi SY, Lee JH, Goo JM, Aum J, Yim JJ, Park CM, Deep Learning-Based Automatic Detection Algorithm Development and Evaluation Group, Kim DH, Woo W, Choi C, Hwang IP, Song YS, Lim L, Kim K, Wi JY, Oh SS, Kang MJ (2019) Development and validation of a deep learning–based automatic detection algorithm for active pulmonary tuberculosis on chest radiographs. Clin Infect Dis 69(5):739–747. https://doi.org/10.1093/cid/ciy967
Ionescu GV et al (2019) Prediction of reader estimates of mammographic density using convolutional neural networks. J Med Imaging 6(03):1. https://doi.org/10.1117/1.jmi.6.3.031405
Jani KK, Srivastava R (2019) A survey on medical image analysis in capsule endoscopy. Curr Med Imaging Rev 15(7):622–636. https://doi.org/10.2174/1573405614666181102152434
Jia Y et al. (2014) Caffe: Convolutional architecture for fast feature embedding,” MM 2014 – Proc 2014 ACM Conf Multimed , pp. 675–678, DOI: https://doi.org/10.1145/2647868.2654889 .
Kang C, Yu X, Wang SH, Guttery DS, Pandey HM, Tian Y, Zhang YD (2020) A heuristic neural network structure relying on fuzzy logic for images scoring. IEEE Trans Fuzzy Syst 6706(c):1–1. https://doi.org/10.1109/tfuzz.2020.2966163 45
S. Karthik, R. Srinivasa Perumal, and P. V. S. S. R. Chandra Mouli, “Breast cancer classification using deep neural networks,” Knowl Comput Its Appl Knowl Manip Process Tech Vol. 1, pp. 227–241, 2018, DOI: https://doi.org/10.1007/978-981-10-6680-1_12
Kazeminia S et al. (2020) GANs for Medical Image Analysis,” Artif Intell Med, p. 104262, DOI: https://doi.org/10.1016/j.jece.2020.104262 .
Kim EK, Kim HE, Han K, Kang BJ, Sohn YM, Woo OH, Lee CW (2018) Applying data-driven imaging biomarker in mammography for breast Cancer screening: preliminary study. Sci Rep 8(1):1–8. https://doi.org/10.1038/s41598-018-21215-1
Kingma DP, Welling M Auto-encoding variational bayes. In: 2nd International Conference on Learning, ICLR 2014, vol 2014, pp 1–14
Klambauer G, Unterthiner T, Mayr A, Hochreiter S (2017) Self-normalizing neural networks. Adv Neural Inf Process Syst 2017(Decem):972–981
Krizhevsky A, Sutskever I, Hinton GE (2012) ImageNet classification with deep convolutional neural networks. In: The 25th International Conference on Neural Information Processing Systems, pp 1097–1105. https://doi.org/10.1145/3065386
Kyono T, Gilbert FJ, van der Schaar M (2018) MAMMO: A Deep Learning Solution for Facilitating Radiologist-Machine Collaboration in Breast Cancer Diagnosis, pp. 1–18, [Online]. Available: http://arxiv.org/abs/1811.02661 .
LeCun Y, Bengio Y (1998) Convolutional networks for images, speech, and time-series. In: The handbook of brain theory and neural networks, pp 255–258
LeCun Y, Boser B, Denker JS, Henderson D, Howard RE, Hubbard W, Jackel LD (1989) Backpropagation applied to digit recognition. Neural Comput 1(4):541–551
Lehman CD, Yala A, Schuster T, Dontchos B, Bahl M, Swanson K, Barzilay R (2019) Mammographic breast density assessment using deep learning: clinical implementation. Radiology 290(1):52–58. https://doi.org/10.1148/radiol.2018180694
Lei T, Wang R, Wan Y, Du X, Meng H, Nandi AK (2020) Medical Image Segmentation Using Deep Learning: A survey, vol. 171, pp. 17–31, DOI: https://doi.org/10.1007/978-3-030-32606-7_2 .
Li W, Cao P, Zhao D, Wang J (2016) Pulmonary Nodule Classification with Deep Convolutional Neural Networks on Computed Tomography Images, Comput Math Methods Med, vol. 2016, DOI: https://doi.org/10.1155/2016/6215085 .
Li X, Chen H, Qi X, Dou Q, Fu CW, Heng PA (2018) H-DenseUNet: hybrid densely connected UNet for liver and tumor segmentation from CT volumes. IEEE Trans Med Imaging 37(12):2663–2674. https://doi.org/10.1109/TMI.2018.2845918
Li Z, Dong M, Wen S, Hu X, Zhou P, Zeng Z (2019) CLU-CNNs: Object detection for medical images. Neurocomputing 350(May):53–59. https://doi.org/10.1016/j.neucom.2019.04.028
Li Y, Huang C, Ding L, Li Z, Pan Y, Gao X (2019) Deep learning in bioinformatics: introduction, application, and perspective in the big data era. Methods 166:4–21. https://doi.org/10.1016/j.ymeth.2019.04.008
Li Y, Li S, Chen C, Hao A, Qin H (2020) A Plug-and-play Scheme to Adapt Image Saliency Deep Model for Video Data, IEEE Trans Circuits Syst Video Technol, no. Xx, pp. 1–1, DOI: https://doi.org/10.1109/tcsvt.2020.3023080 .
Li L, Qin L, Yin Y, Wang X et al (2019) Artificial Intelligence Distinguishes COVID-19 from Community Acquired Pneumonia on Chest CT. Radiology 2020:1–5. https://doi.org/10.1007/s10489-020-01714-3
Li C, Wang X, Liu W, Latecki LJ, Wang B, Huang J (2019) Weakly supervised mitosis detection in breast histopathology images using concentric loss. Med Image Anal 53:165–178. https://doi.org/10.1016/j.media.2019.01.013
Liang Q, Nan Y, Coppola G, Zou K, Sun W, Zhang D, Wang Y, Yu G (2019) Weakly supervised biomedical image segmentation by reiterative learning. IEEE J Biomed Heal Inf 23(3):1205–1214. https://doi.org/10.1109/JBHI.2018.2850040
Liao F, Liang M, Li Z, Hu X, Song S (2019) Evaluate the malignancy of pulmonary nodules using the 3-D deep leaky Noisy-OR network. IEEE Trans Neural Netw Learn Syst 30(11):3484–3495. https://doi.org/10.1109/TNNLS.2019.2892409
Lin H, Chen H, Graham S, Dou Q, Rajpoot N, Heng PA (2019) Fast ScanNet: fast and dense analysis of multi-Gigapixel whole-slide images for Cancer metastasis detection. IEEE Trans Med Imaging 38(8):1948–1958. https://doi.org/10.1109/TMI.2019.2891305
Litjens G, Kooi T, Bejnordi BE, Setio AAA, Ciompi F, Ghafoorian M, van der Laak JAWM, van Ginneken B, Sánchez CI (2017) A survey on deep learning in medical image analysis. Med Image Anal 42(1995):60–88. https://doi.org/10.1016/j.media.2017.07.005
Litjens G et al (2016) Deep learning as a tool for increased accuracy and efficiency of histopathological diagnosis. Sci Rep 6(January):1–11. https://doi.org/10.1038/srep26286
Little WA (1974) The existence of persistent states in the brain. Math Biosci 19(1–2):101–120. https://doi.org/10.1016/0025-5564(74)90031-5
Little WA, Shaw GL (1978) Analytic study of the memory storage capacity of a neural network. Math Biosci 39(3–4):281–290. https://doi.org/10.1016/0025-5564(78)90058-5
Liu W, Wang Z, Liu X, Zeng N, Liu Y, Alsaadi FE (2017) A survey of deep neural network architectures and their applications. Neurocomputing 234(November 2016):11–26. https://doi.org/10.1016/j.neucom.2016.12.038
Lo SLJLMFMCSMSC, Lo SCB, Lou SLA, Chien MV, Mun SK (1995) Artificial convolution neural network techniques and applications for lung nodule detection. IEEE Trans Med Imaging 14(4):711–718. https://doi.org/10.1109/42.476112
Loey M, Smarandache F, Khalifa NEM (2020) Within the lack of chest COVID-19 X-ray dataset: A novel detection model based on GAN and deep transfer learning, Symmetry (Basel)., vol. 12, no. 4, DOI: https://doi.org/10.3390/SYM12040651 .
Lopes UK, Valiati JF (2017) Pre-trained convolutional neural networks as feature extractors for tuberculosis detection. Comput Biol Med 89(August):135–143. https://doi.org/10.1016/j.compbiomed.2017.08.001
Ma G, Li S, Chen C, Hao A, Qin H (2020) Stage-wise salient object detection in 360 omnidirectional image via object-level Semantical saliency ranking. IEEE Trans Vis Comput Graph 26:3535–3545. https://doi.org/10.1109/tvcg.2020.3023636
Ma J, Song Y, Tian X, Hua Y, Zhang R, Wu J (2020) Survey on deep learning for pulmonary medical imaging. Front Med 14(4):450–469. https://doi.org/10.1007/s11684-019-0726-4
Maas AL, Hannun AY, Ng AY (2013) Rectifier nonlinearities improve neural network acoustic models. In: The 30th International Conference on Machine Learning, vol 30
Masood A, Sheng B, Yang P, Li P, Li H, Kim J, Feng DD (2020) Automated decision support system for lung Cancer detection and classification via enhanced RFCN with multilayer fusion RPN. IEEE Trans Ind Inf 3203(c):1–1. https://doi.org/10.1109/tii.2020.2972918 7801
Mazurowski MA, Buda M, Saha A, Bashir MR (2019) Deep learning in radiology: an overview of the concepts and a survey of the state of the art with a focus on MRI. J Magn Reson Imaging 49(4):939–954. https://doi.org/10.1002/jmri.26534
Mcculloch WS, Pitts W (1943) A logical calculus of the ideas immanent in nervous activity. Bull Math Biophys 5:115–133. https://doi.org/10.1007/BF02478259
Minsky M, Papert S (1969) Perceptrons: an introduction to computational geometry, vol 522. MIT Press, Cambridge MA, pp 20–522. https://doi.org/10.1016/S0019-9958(70)90409-2
Book MATH Google Scholar
Mittal A, Hooda R, Sofat S (2018) LF-SegNet : a fully convolutional encoder – decoder network for segmenting lung fields from chest, Wirel Pers Commun, DOI: https://doi.org/10.1007/s11277-018-5702-9
Morris RGM, Hebb DO (1949) The Organization of Behavior, Wiley: New York; 1949,” Brain Res Bull, vol. 50, no. 5–6, p. 437, DOI: https://doi.org/10.1016/S0361-9230(99)00182-3 .
Münzer B, Schoeffmann K, Böszörmenyi L (2018) Content-based processing and analysis of endoscopic images and videos: a survey. Multimed Tools Appl 77(1):1323–1362. https://doi.org/10.1007/s11042-016-4219-z
Murphy A, Skalski M, Gaillard F (2018) The utilisation of convolutional neural networks in detecting pulmonary nodules: a review. Br J Radiol 91(1090):1–6. https://doi.org/10.1259/bjr.20180028
Murphy K et al. (2019) Computer aided detection of tuberculosis on chest radiographs: An evaluation of the CAD4TB v6 system, pp. 1–11, [Online]. Available: http://arxiv.org/abs/1903.03349 .
Nair V, Hinton GE (2010) Rectified linear units improve restricted Boltzmann machines. Proc 27th Int Conf Mach Learn (ICML-10), 807–814 33(5):807–814
Nakagawa K, Ishihara R, Aoyama K, Ohmori M (2019) Classification for invasion depth of esophageal squamous cell carcinoma using a deep neural network compared with experienced endoscopists. Gastrointest Endosc 90(3):407–414. https://doi.org/10.1016/j.gie.2019.04.245
Ng A (2011) Sparse autoencoder. CS294A Lect. Notes 72:1–19
Nie D, Trullo R, Lian J, Wang L, Petitjean C, Ruan S, Wang Q, Shen D (2018) Medical image synthesis with deep convolutional adversarial networks. IEEE Trans Biomed Eng 65(12):2720–2730. https://doi.org/10.1109/TBME.2018.2814538
Onishi Y et al. (2019) Automated Pulmonary Nodule Classification in Computed Tomography Images Using a Deep Convolutional Neural Network Trained by Generative Adversarial Networks, Biomed Res Int, vol. 2019, DOI: https://doi.org/10.1155/2019/6051939 .
Ouyang W et al (2015) DeepID-Net: Deformable deep convolutional neural networks for object detection. Proc IEEE Comput Soc Conf Comput Vis Pattern Recognit 07–12(June):2403–2412. https://doi.org/10.1109/CVPR.2015.7298854
Ozturk T, Talo M, Yildirim EA, Baloglu UB, Yildirim O, Rajendra Acharya U (2020) Automated detection of COVID-19 cases using deep neural networks with X-ray images. Comput Biol Med 121(April):103792. https://doi.org/10.1016/j.compbiomed.2020.103792
Pang S, Zhang Y, Ding M, Wang X, Xie X (2020) A deep model for lung Cancer type identification by densely connected convolutional networks and adaptive boosting. IEEE Access 8:4799–4805. https://doi.org/10.1109/ACCESS.2019.2962862
Pascanu R, Mikolov T, Bengio Y (2013) On the difficulty of training recurrent neural networks. 30th Int Conf Mach Learn ICML 2013(PART 3):2347–2355
Perone CS, Cohen-Adad J (2019) Promises and limitations of deep learning for medical image segmentation. J Med Artif Intell 2:1–1. https://doi.org/10.21037/jmai.2019.01.01
Pezeshk A, Hamidian S, Petrick N, Sahiner B (2018) 3D convolutional neural networks for automatic detection of pulmonary nodules in chest CT. IEEE J Biomed Heal Inf PP(c):1. https://doi.org/10.1109/JBHI.2018.2879449
Pinckaers H, Litjens G (2019) Neural Ordinary Differential Equations for Semantic Segmentation of Individual Colon Glands, no. NeurIPS, [Online]. Available: http://arxiv.org/abs/1910.10470 .
Poggio T, Serre T (2013) Models of visual cortex. Scholarpedia 8(4):3516. https://doi.org/10.4249/scholarpedia.3516
Qiang Y, Ge L, Zhao X, Zhang X, Tang X (2017) Pulmonary nodule diagnosis using dual-modal supervised autoencoder based on extreme learning machine. Expert Syst 34(6):1–12. https://doi.org/10.1111/exsy.12224
Qu H et al (2019) Joint Segmentation and fine -grained classification of nuclei in histopathology images. In: 2019 IEEE 16th International Symposium on Biomedical Imaging (ISBI 2019), pp 900–904. https://doi.org/10.1109/ISBI.2019.8759457
Rajaraman S, Antani SK (2020) Modality-specific deep learning model ensembles toward improving TB detection in chest radiographs. IEEE Access 8:27318–27326. https://doi.org/10.1109/ACCESS.2020.2971257
Rajaraman S, Antani S (2020) Weakly labeled data augmentation for deep learning: a study on COVID-19 detection in chest X-rays. Diagnostics 10(6):1–17. https://doi.org/10.3390/diagnostics10060358
Rajpurkar P, Irvin J, Ball RL, Zhu K, Yang B, Mehta H, Duan T, Ding D, Bagul A, Langlotz CP, Patel BN, Yeom KW, Shpanskaya K, Blankenberg FG, Seekins J, Amrhein TJ, Mong DA, Halabi SS, Zucker EJ, Ng AY, Lungren MP (2018) Deep learning for chest radiograph diagnosis: a retrospective comparison of the CheXNeXt algorithm to practicing radiologists. PLoS Med 15(11):1–17. https://doi.org/10.1371/journal.pmed.1002686
Rajpurkar P et al. (2017) CheXNet: Radiologist-Level Pneumonia Detection on Chest X-Rays with Deep Learning, pp. 3–9, [Online]. Available: http://arxiv.org/abs/1711.05225 .
Reader AJ, Corda G, Mehranian A, da Costa-Luis C, Ellis S, Schnabel JA (2020) Deep learning for PET image reconstruction. IEEE Trans Radiat Plasma Med Sci 7311(1):1–1. https://doi.org/10.1109/trpms.2020.3014786 25
Ribli D, Horváth A, Unger Z, Pollner P, Csabai I (2018) Detecting and classifying lesions in mammograms with deep learning. Sci Rep 8(1):1–7. https://doi.org/10.1038/s41598-018-22437-z
Rodríguez-Ruiz A, Krupinski E, Mordang JJ, Schilling K, Heywang-Köbrunner SH, Sechopoulos I, Mann RM (2019) Detection of breast cancer with mammography: effect of an artificial intelligence support system. Radiology 290(3):1–10. https://doi.org/10.1148/radiol.2018181371
Ronneberger O, Fischer P, Brox T (2015) U-net: Convolutional networks for biomedical image segmentation. Lect Notes Comput Sci (including Subser Lect. Notes Artif Intell Lect Notes Bioinformatics) 9351:234–241. https://doi.org/10.1007/978-3-319-24574-4_28
Rosenblatt F (1958) The perceptron: a probabilistic model for information storage and organization in the brain. Psychol Rev 65(6):386–408. https://doi.org/10.1037/h0042519
Rumelhart DE, Hinton GE, Williams RJ (1986) Learning representations by back-propagating errors. Nature 323(9):533–536
Sabour S, Frosst N, Hinton GE (2017) Dynamic routing between capsules. Adv Neural Inf Process Syst 2017-Decem(Nips):3857–3867
Saeedan F, Weber N, Goesele M, Roth S (2018) Detail-Preserving Pooling in Deep Networks,” Proc IEEE Comput Soc Conf Comput Vis Pattern Recognit , no. June, pp. 9108–9116, DOI: https://doi.org/10.1109/CVPR.2018.00949 .
Sahiner B, Heang-Ping Chan, Petrick N, Datong Wei, Helvie MA, Adler DD, Goodsitt MM (1996) Classification of mass and normal breast tissue: a convolution neural network classifier with spatial domain and texture images. IEEE Trans Med Imaging 15(5):598–610. https://doi.org/10.1109/42.538937
Sari CT, Gunduz-Demir C (2019) Unsupervised feature extraction via deep learning for Histopathological classification of Colon tissue images. IEEE Trans Med Imaging 38(5):1139–1149. https://doi.org/10.1109/TMI.2018.2879369
Scherer D, Müller A, Behnke S (2010) Evaluation of pooling operations in convolutional architectures for object recognition. Lect Notes Comput Sci (including Subser Lect Notes Artif Intell Lect Notes Bioinformatics) 6354 LNCS(PART 3):92–101. https://doi.org/10.1007/978-3-642-15825-4_10
Schmidhuber J (2015) Deep learning in neural networks: an overview. Neural Netw 61:85–117. https://doi.org/10.1016/j.neunet.2014.09.003
Serag A et al (2019) Translational AI and Deep Learning in Diagnostic Pathology. Front Med 6(October):1–15. https://doi.org/10.3389/fmed.2019.00185
Setio AAA, Ciompi F, Litjens G, Gerke P, Jacobs C, van Riel SJ, Wille MMW, Naqibullah M, Sanchez CI, van Ginneken B (2016) Pulmonary nodule detection in CT images: false positive reduction using multi-view convolutional networks. IEEE Trans Med Imaging 35(5):1160–1169. https://doi.org/10.1109/TMI.2016.2536809
Shah A, Kadam E, Shah H, Shinde S, Shingade S (2016) Deep residual networks with exponential linear unit. ACM Int Conf Proceeding Ser 21–24(Sept):59–65. https://doi.org/10.1145/2983402.2983406
Shatnawi A, Al-Bdour G, Al-Qurran R, Al-Ayyoub M (2018) A comparative study of open source deep learning frameworks. 2018 9th Int Conf Inf Commun Syst ICICS 2018 2018-Janua:72–77. https://doi.org/10.1109/IACS.2018.8355444
Shen L, Margolies LR, Rothstein JH, Fluder E, McBride R, Sieh W (2019) Deep learning to improve breast Cancer detection on screening mammography. Sci Rep 9(1):1–13. https://doi.org/10.1038/s41598-019-48995-4
Shickel B, Tighe PJ, Bihorac A, Rashidi P (2017) Deep EHR : A Survey of Recent Advances in Deep Learning Techniques for Electronic Health Record, vol. 2194, no. c, pp. 1–17, DOI: https://doi.org/10.1109/JBHI.2017.2767063 .
Shin HC, Roth HR, Gao M, Lu L, Xu Z, Nogues I, Yao J, Mollura D, Summers RM (2016) Deep convolutional neural networks for computer-aided detection: CNN architectures, dataset characteristics and transfer learning. IEEE Trans Med Imaging 35(5):1285–1298. https://doi.org/10.1109/TMI.2016.2528162
Siegel RL, Miller KD, Jemal A (2019) Cancer statistics, 2019. CA Cancer J Clin 69(1):7–34. https://doi.org/10.3322/caac.21551
Simonyan K, Zisserman (2015) A Very deep convolutional networks for large-scale image recognition. In: 3rd International Conference on Learning Representations, ICLR 2015, pp 1–14
Soffer S, Ben-Cohen A, Shimon O, Amitai MM, Greenspan H, Klang E (2019) Convolutional neural networks for radiologic images: a Radiologist’s guide. Radiology 290(3):590–606. https://doi.org/10.1148/radiol.2018180547
Soffer S, Klang E, Shimon O, Nachmias N, Eliakim R (2020) Deep learning for wireless capsule endoscopy : a systematic review and meta-analysis. Gastrointest Endosc 92(4):831–839.e8. https://doi.org/10.1016/j.gie.2020.04.039
Song TH, Sanchez V, Eidaly H, Rajpoot NM (2019) Simultaneous cell detection and classification in bone marrow histology images. IEEE J Biomed Heal Inf 23(4):1469–1476. https://doi.org/10.1109/JBHI.2018.2878945
Song Y, Tan EL, Jiang X, Cheng JZ, Ni D, Chen S, Lei B, Wang T (2017) Accurate cervical cell segmentation from overlapping clumps in pap smear images. IEEE Trans Med Imaging 36(1):288–300. https://doi.org/10.1109/TMI.2016.2606380
Souza JC, Bandeira Diniz JO, Ferreira JL, França da Silva GL, Corrêa Silva A, de Paiva AC (2019) An automatic method for lung segmentation and reconstruction in chest X-ray using deep neural networks. Comput Methods Prog Biomed 177:285–296. https://doi.org/10.1016/j.cmpb.2019.06.005
Sun M, Zhang G, Dang H, Qi X, Zhou X, Chang Q (2019) Accurate gastric Cancer segmentation in digital pathology images using deformable convolution and multi-scale embedding networks. IEEE Access 7:75530–75541. https://doi.org/10.1109/ACCESS.2019.2918800
Swersky K, Chen B, Marlin B, de Freitas N (2010) A tutorial on stochastic approximation algorithms for training restricted Boltzmann machines and deep belief nets,” 2010 Inf Theory Appl Work ITA 2010, Conf Proc, pp. 80–89, DOI: https://doi.org/10.1109/ITA.2010.5454138 .
Szegedy C, Reed S, Sermanet P, Vanhoucke V, Rabinovich A (2015) Going deeper with convolutions. In: The IEEE conference on Computer Vision and Pattern Recognition (CVPR), pp 1–9. https://doi.org/10.1109/CVPR.2015.7298594
Tabibu S, Vinod PK, Jawahar CV (2019) Pan-renal cell carcinoma classification and survival prediction from histopathology images using deep learning. Sci Rep 9(1):1–9. https://doi.org/10.1038/s41598-019-46718-3
The Theano Development Team et al. (2016) Theano: A Python framework for fast computation of mathematical expressions, pp. 1–19, [Online]. Available: http://arxiv.org/abs/1605.02688 .
Valkonen M, Isola J, Ylinen O, Muhonen V, Saxlin A, Tolonen T, Nykter M, Ruusuvuori P (2020) Cytokeratin-supervised deep learning for automatic recognition of epithelial cells in breast cancers stained for ER, PR, and Ki-67. IEEE Trans Med Imaging 39(2):534–542. https://doi.org/10.1109/TMI.2019.2933656
Valliani AAA, Ranti D, Oermann EK (2019) Deep learning and neurology: a systematic review. Neurol Ther 8(2):351–365. https://doi.org/10.1007/s40120-019-00153-8
Van Eycke YR, Balsat C, Verset L, Debeir O, Salmon I, Decaestecker C (2018) Segmentation of glandular epithelium in colorectal tumours to automatically compartmentalise IHC biomarker quantification: a deep learning approach. Med Image Anal 49:35–45. https://doi.org/10.1016/j.media.2018.07.004
van Ginneken B, Setio AAA, Jacobs C, Ciompi F (2015) Off-the-shelf convolutional neural network features for pulmonary nodule detection in computed tomography scans. In: 2015 IEEE 12th International Symposium on Biomedical Imaging (ISBI), pp 286–289. https://doi.org/10.1109/ISBI.2015.7163869
Vedaldi A, Lenc K (2015) MatConvNet: Convolutional neural networks for MATLAB, MM 2015 – Proc 2015 ACM Multimed Conf, pp. 689–692, DOI: https://doi.org/10.1145/2733373.2807412 .
Vincent P, Larochelle H, Lajoie I, Bengio Y, Manzagol PA (2010) Stacked denoising autoencoders: learning useful representations in a deep network with a local Denoising criterion. J Mach Learn Res 11:3371–3408
MathSciNet MATH Google Scholar
Waheed A, Goyal M, Gupta D, Khanna A, Al-Turjman F, Pinheiro PR (2020) CovidGAN: data augmentation using auxiliary classifier GAN for improved Covid-19 detection. IEEE Access 8:91916–91923. https://doi.org/10.1109/ACCESS.2020.2994762
Wang J, Ding H, Bidgoli FA, Zhou B, Iribarren C, Molloi S, Baldi P (2017) Detecting cardiovascular disease from mammograms with deep learning. IEEE Trans Med Imaging 36(5):1172–1181. https://doi.org/10.1109/TMI.2017.2655486
Wang SH, Muhammad K, Hong J, Sangaiah AK, Zhang YD (2020) Alcoholism identification via convolutional neural network based on parametric ReLU, dropout, and batch normalization. Neural Comput & Applic 32(3):665–680. https://doi.org/10.1007/s00521-018-3924-0
Wang H, Raj B (2017) On the Origin of Deep Learning,” pp. 1–72, [Online]. Available: http://arxiv.org/abs/1702.07800 .
Wang S, Tang C, Sun J, Zhang Y (2019) Cerebral micro-bleeding detection based on densely connected neural network. Front Neurosci 13(MAY):1–11. https://doi.org/10.3389/fnins.2019.00422
Wang L, Wong A (2020) COVID-Net: A Tailored Deep Convolutional Neural Network Design for Detection of COVID-19 Cases from Chest X-Ray Images, pp. 1–12, [Online]. Available: http://arxiv.org/abs/2003.09871 .
Wang Y, Yan F, Lu X, Zheng G, Zhang X, Wang C, Zhou K, Zhang Y, Li H, Zhao Q, Zhu H, Chen F, Gao C, Qing Z, Ye J, Li A, Xin X, Li D, Wang H, Yu H, Cao L, Zhao C, Deng R, Tan L, Chen Y, Yuan L, Zhou Z, Yang W, Shao M, Dou X, Zhou N, Zhou F, Zhu Y, Lu G, Zhang B (2019) IILS: intelligent imaging layout system for automatic imaging report standardization and intra-interdisciplinary clinical workflow optimization. EBioMedicine 44:162–181. https://doi.org/10.1016/j.ebiom.2019.05.040
Wang X et al (2019) Weakly Supervised Deep Learning for Whole Slide Lung Cancer Image Analysis. IEEE Trans Cybern PP:1–13. https://doi.org/10.1109/tcyb.2019.2935141
Wang T et al (2020) Machine learning in quantitative PET: A review of attenuation correction and low-count image reconstruction methods. Phys Medica 76(March):294–306. https://doi.org/10.1016/j.ejmp.2020.07.028
Wei JW, Tafe LJ, Linnik YA, Vaickus LJ, Tomita N, Hassanpour S (2019) Pathologist-level classification of histologic patterns on resected lung adenocarcinoma slides with deep neural networks. Sci Rep 9(1):1–8. https://doi.org/10.1038/s41598-019-40041-7
Werbos PJ (1990) Backpropagation through time: what it does and how to do it. Proc IEEE 78(10):1550–1560. https://doi.org/10.1109/5.58337
Werbose J (1974) Beyond regression: new tools for prediction and analysis in the behavioral
Widrow B, Hoff ME (1962) Associative Storage and Retrieval of Digital Information in Networks of Adaptive ‘Neurons. Biol Prototypes Synth Syst:160–160. https://doi.org/10.1007/978-1-4684-1716-6_25
Williams RJ, David Z (1995) Gradient-based learning algorithms for recurrent networks and their computational complexity. In: Back-propagation: theory, architectures and applications. L. Erlbaum Associates Inc, pp 433–486
Wu J (2017) Convolutional Neural Networks. Med Imaging Inf Sci 34(2):109–111. https://doi.org/10.11318/mii.34.109
Wu H, Gu X (2015) Max-pooling dropout for regularization of convolutional neural networks. Lect Notes Comput Sci (including Subser Lect Notes Artif Intell Lect Notes Bioinformatics) 9489:46–54. https://doi.org/10.1007/978-3-319-26532-2_6
Wu N, Phang J, Park J, Shen Y, Huang Z, Zorin M, Jastrzebski S, Fevry T, Katsnelson J, Kim E, Wolfson S, Parikh U, Gaddam S, Lin LLY, Ho K, Weinstein JD, Reig B, Gao Y, Toth H, Pysarenko K, Lewin A, Lee J, Airola K, Mema E, Chung S, Hwang E, Samreen N, Kim SG, Heacock L, Moy L, Cho K, Geras KJ (2019) Deep neural networks improve radiologists’ performance in breast Cancer screening. IEEE Trans Med Imaging 39:1–1. https://doi.org/10.1109/tmi.2019.2945514 1194
Wu N et al (2018) Breast density classification with deep convolutional neural networks. ICASSP, IEEE Int Conf Acoust Speech Signal Process - Proc 2018-April:6682–6686. https://doi.org/10.1109/ICASSP.2018.8462671
Xing F, Xie Y, Su H, Liu F, Yang L (2018) Deep learning in microscopy image analysis: a survey. IEEE Trans Neural Netw Learn Syst 29(10):4550–4568. https://doi.org/10.1109/TNNLS.2017.2766168
Xing F, Xie Y, Yang L (2016) An automatic learning-based framework for robust nucleus segmentation. IEEE Trans Med Imaging 35(2):550–566. https://doi.org/10.1109/TMI.2015.2481436
Xu B, Wang N, Chen T, Li M (2015) Empirical Evaluation of Rectified Activations in Convolutional Network , [Online]. Available: http://arxiv.org/abs/1505.00853 .
Xu S, Wu H, Bie R (2019) CXNet-m1: anomaly detection on chest X-rays with image-based deep learning. IEEE Access 7(c):4466–4477. https://doi.org/10.1109/ACCESS.2018.2885997
Xu J, Xiang L, Liu Q, Gilmore H, Wu J, Tang J, Madabhushi A (2016) Stacked sparse autoencoder (SSAE) for nuclei detection on breast cancer histopathology images. IEEE Trans Med Imaging 35(1):119–130. https://doi.org/10.1109/TMI.2015.2458702
Yi X, Walia E, Babyn P (2019) Generative adversarial network in medical imaging: A review,” Med Image Anal, vol. 58, DOI: https://doi.org/10.1016/j.media.2019.101552 .
Yi F, Yang L, Wang S, Guo L, Huang C, Xie Y, Xiao G (2018) Microvessel prediction in H&E Stained Pathology Images using fully convolutional neural networks. BMC Bioinform 19(1):1–9. https://doi.org/10.1186/s12859-018-2055-z
Yoon HJ et al (2019) A Lesion-Based Convolutional Neural Network Improves Endoscopic Detection and Depth Prediction of Early Gastric Cancer. J Clin Med 8(9):1310. https://doi.org/10.3390/jcm8091310
Yu D et al (2014) An Introduction to Computational Networks and the Computational Network Toolkit. INTERSPEECH, Microsoft Research
Zhang S, Zhang S, Wang B, Habetler TG (2020) Deep learning algorithms for bearing fault diagnostics - a comprehensive review. IEEE Access 8:29857–29881. https://doi.org/10.1109/ACCESS.2020.2972859
Zhang X et al (2017) Whole mammogram image classification with convolutional neural networks. Proc - 2017 IEEE Int Conf Bioinforma Biomed BIBM 2017 2017-Janua(Cc):700–704. https://doi.org/10.1109/BIBM.2017.8217738
Zhao Q, Lyu S, Zhang B, Feng W (2018) Multiactivation pooling method in convolutional neural networks for image recognition. Wirel Commun Mob Comput 2018:1–16. https://doi.org/10.1155/2018/8196906
Zhao W, Zeng Z (2019) Multi Scale Supervised 3D U-Net for Kidney and Tumor Segmentation,, DOI: https://doi.org/10.24926/548719.007 .
Download references
Author information
Authors and affiliations.
Department of Computer Science, School of Engineering and Technology, Pondicherry University, Pondicherry, India
Muralikrishna Puttagunta & S. Ravi
You can also search for this author in PubMed Google Scholar
Corresponding author
Correspondence to S. Ravi .
Additional information
Publisher’s note.
Springer Nature remains neutral with regard to jurisdictional claims in published maps and institutional affiliations.
Rights and permissions
Reprints and permissions
About this article
Puttagunta, M., Ravi, S. Medical image analysis based on deep learning approach. Multimed Tools Appl 80 , 24365–24398 (2021). https://doi.org/10.1007/s11042-021-10707-4
Download citation
Received : 25 August 2020
Revised : 28 November 2020
Accepted : 10 February 2021
Published : 06 April 2021
Issue Date : July 2021
DOI : https://doi.org/10.1007/s11042-021-10707-4
Share this article
Anyone you share the following link with will be able to read this content:
Sorry, a shareable link is not currently available for this article.
Provided by the Springer Nature SharedIt content-sharing initiative
- Deep learning
- Convolutional neural networks
- Medical images
- Segmentation
- Classification
- Find a journal
- Publish with us
- Track your research
Visual Analysis Essay
Visual Analysis Essay - A Writing Guide with Format & Sample
14 min read
-10652.jpg&w=640&q=75 "thesis on image analysis")
People also read
Learn How to Write an Editorial on Any Topic
Best Tips on How to Avoid Plagiarism
How to Write a Movie Review - Guide & Examples
A Complete Guide on How to Write a Summary for Students
Write Opinion Essay Like a Pro: A Detailed Guide
Evaluation Essay - Definition, Examples, and Writing Tips
How to Write a Thematic Statement - Tips & Examples
How to Write a Bio - Quick Tips, Structure & Examples
How to Write a Synopsis – A Simple Format & Guide
How to Write a Comparative Essay – A Complete Guide
List of Common Social Issues Around the World
Writing Character Analysis - Outline, Steps, and Examples
11 Common Types of Plagiarism Explained Through Examples
Article Review Writing: A Complete Step-by-Step Guide with Examples
A Detailed Guide on How to Write a Poem Step by Step
Detailed Guide on Appendix Writing: With Tips and Examples
A visual analysis essay is a common assignment for the students of history, art, and communications. It is quite a unique type of academic essay.
Visual analysis essays are where images meet text. These essays aim to analyze the meanings embedded in the artworks, explaining visual concepts in a written form.
It may sound difficult to write a visual analysis essay, but it can be done in simple steps by following the right approach. Let’s dive into the writing steps, tips, example essays, and potential topics to help you write an excellent essay.
- 1. What is a Visual Analysis Essay
- 2. How to Write a Visual Analysis Essay - 7 Simple Steps
- 3. Tips on How to Analyze a Photograph
- 4. Tips on How to Analyze a Sculpture
- 5. Visual Analysis Essay on Advertisement
- 6. Visual Rhetorical Analysis Essay Examples
- 7. Visual Analysis Essay Topics
What is a Visual Analysis Essay
A visual analysis essay basically requires you to provide a detailed description of a specific visual work of art. It is a type of analytical essay that deals with imagery and visual art instead of texts.
The subject of a visual analysis essay could be an image, painting, photograph, or any visual medium.
In this type of essay, you need to describe the artwork and analyze its elements in detail. That is, how different elements and features fit together to make the whole work stand out. In this sense, you need to use a mixture of descriptive writing and analytical language.
To write a good visual analysis essay, you need to know the basic visual elements and principles of design. Let’s learn about these concepts first before diving into the writing steps.

Paper Due? Why Suffer? That's our Job
Visual Elements for a Visual Analysis Essay
Writing a visual analysis essay involves analyzing the visual elements of a piece of art. These elements form the basis of the features and characteristics of an image.
Below you can find the common visual elements of a visual analysis essay.
Principles of Design in a Visual Analysis Essay
In addition to visual elements, you must also consider the principles of design for writing a great visual analysis essay. These principles help you identify and explain the characteristics of the image.
How to Write a Visual Analysis Essay - 7 Simple Steps
Now that you have an idea about visual elements and principles, you are now ready to proceed.
Here are the steps that you need to follow for writing a visual analysis essay. Let’s discuss them in detail.
Step 1 - Gather General Information About the Artwork
Once you have a specific artwork or image, here is how to start a visual analysis essay. You need to ask some basic questions about the work and jot down your ideas.
This pre-writing step is for brainstorming ideas. Ask these questions to begin:
- Who and what does the artwork represent?
- Who is the author of the piece?
- Who did the artist create the work for? Who is the intended audience?
- When and where was the work created? What is its historical context?
- Where was this work displayed for the first time?
- Identify which medium, materials, and techniques were used to create the image?
Step 2 - Note Down the Characteristics of the Artwork
The next thing that you need to do is identify what the image depicts. Moreover, you need to identify and describe the visual art elements and design principles used in the work.
Here’s what you need to note:
- The subject matter and its representation.
- Colors, shapes, and lines used in the composition.
- The balance, proportion, and harmony within the artwork.
- Any symbolism or metaphors present.
By pointing out such characteristics, you set the stage for a nuanced analysis in your essay.
Step 3 - Visual Analysis Essay Outline
Once you have gathered your main points by carefully studying the image, you should now organize them in an outline.
Here is how you make an outline for your visual analysis essay:
Step 4- Write the Introduction
This is the first paragraph of a visual analysis essay in which you need to provide some background information on the topic. After grabbing the readers’ attention with an interesting fact, briefly provide information on the following points.
- Talk briefly about the painting and its artist or creator.
- Provide a brief description of the painting and give historical context
- Add an interesting fact about the artist or the painting.
The introduction should end with a thesis statement. The visual analysis essay thesis states the analysis points on the artwork that you aim to discuss in your essay.
Step 5 - Provide Detailed Description, Analysis, and Interpretation
In the body section, you need to explore the artwork in detail. In the first body paragraph, simply describe the features and characteristics of the work. For instance, talk about the technique being used, shape, color, and other aspects to support your thesis.
In the next paragraphs, you can go into the analysis and interpretation of these elements and the work as a whole. Present all the details logically and discuss the relationship between the objects. Talk about the meaning, significance, and impact of the work.
Step 6 - Writing a Conclusion
Once you have completed the body section, move to the conclusion paragraph. This is the last paragraph of the essay that should be strong and well-written to create a sense of closure.
Here’s how you can do it
- Revisit the main insights gained through the analysis, summarizing the key visual elements and principles discussed.
- Emphasize the significance of cultural or historical context in interpreting the visual narrative.
- Tie together the threads of your analysis to reinforce your thesis or main argument.
- End with a memorable statement and encourage readers to carry the lessons learned from the analysis into their own encounters with art.
Step 7 - Edit & Revise Your Essay
Here’s how to end your visual analysis essay: edit and revise your first draft until it becomes the perfect version. Consider these steps for an excellent revision:
- Review for Clarity: Ensure your ideas flow logically. Clarify any ambiguous or unclear statements to enhance the overall readability of your essay.
- Trim Unnecessary Details: Trim excess information that doesn't directly contribute to your main points. Keep your analysis focused and concise.
- Check Consistency: Verify that your writing style remains consistent throughout the essay. Maintain a balance between formal language and engaging expression.
- Fine-Tune Transitions: Ensure smooth transitions between different sections of your essay. Transitions help guide your reader through the analysis, making the journey more enjoyable and comprehensible.
- Proofread for Errors: Carefully proofread your essay for grammar, spelling, and punctuation errors. A polished essay enhances your credibility and the overall professionalism of your work.
With these basic steps, you can craft an amazing visual analysis essay. Read on for some useful tips for analyzing different kinds of visual subjects.
Tips on How to Analyze a Photograph
Painting and photograph analysis are very similar. There are three ways in which photo visual analysis is conducted: description, reflection, and formal analysis.
Although the historical study may be used, it is not necessary.
- Description - It implies examining the picture carefully and considering all of the details. The description should be neutral, focusing on simple facts without expressing a personal viewpoint.
- Reflection - For the next stage, consider the emotions that the picture stirs in you. Every viewer will have a distinct viewpoint and feelings about the piece. Knowing some historical background might be useful when formulating an educated response.
- Formal analysis - Consider the visual components and concepts. How are they shown in the photo?
- Historical analysis - For a contextual analysis, keep an eye on the photo's surroundings. Make sure you comprehend the surrounding environment in which the photograph was taken. What era was this image shot during?
Tips on How to Analyze a Sculpture
A sculpture, unlike a painting or photograph, requires a different approach to visual analysis. It still depends on visible components and principles, however it does so in a slightly different way.
When you're writing about sculptures, keep the following in mind:
- Medium, size, and technique - What kind of material is it? Is it carved in a negative or positive method?
- Color and lightning - Describe the hue of the sculpture, whether it is painted. Was the sculptor concerned with the illumination when creating the work?
- Human body and scale - Consider how a human body is portrayed in the piece. Also, assess the sculpture's size compared to that of the viewer.
- Function - What was the sculpture's main aim? You could speak about whether it represented a religious conviction or honored someone, for example.
- Composition - Examine the placement of the piece and determine whether there is a focal point.
Tough Essay Due? Hire Tough Writers!
Visual Analysis Essay on Advertisement
In advertisements, visuals are used to pique interest or persuade the public that what is being advertised is needed. The goal of a visual argument is to generate attention and intrigue. Images are utilized in advertisements to transmit information and interact with the audience.
When conducting a visual analysis of an ad, keep the following in mind:
- Textual Elements
- Illustrations
- Composition
This all has an impact on how people perceive information and how they react to it.
When you analyze the visuals of an ad, you're performing a rhetorical analysis. The study of images and extracting information from them is known as visual rhetoric. It aids in the comprehension of typography, imagery, and the structure of elements on the page.
How to Write a Visual Analysis Paper on an Advertisement
Visual components in advertising are important. It aids in the persuasion of the audience.
Always keep the rhetorical situation in mind while analyzing visual arguments. The following are some key elements to consider:
- Audience - Who is the advertisement meant to attract?
- Purpose - What message does the photo try to get across to the audience?
- Design - What kind of visualizations are included? Are the visuals clear and easy to follow? Are there any patterns or repetitions in the design?
- Strategies - Is there any humor, celebrities, or cultural allusions in the graphic's message?
- Medium - Is the photograph surrounded by text? Is there any text within the picture? How does it interact with the picture to produce an intended effect if there is any?
- Context - What are the characters in an ad? Where are they positioned?
- Subtext - Consider the meaning of the picture's words. What are they trying to say?
Visual Rhetorical Analysis Essay Examples
Here are some visual analysis essay samples that you can read to understand this type of essay better.
Art history Visual Analysis Essay Example
Political Cartoon Visual Analysis Essay
Rhetorical and Visual Analysis Essay Sample
Mona Lisa Visual Analysis Essay
Visual Analysis Essay Topics
Here are some top visual analysis essay topics that you can choose from and begin the writing process.
- Make a review of your favorite Hollywood production and discuss the visual arts involved.
- Write about the use of color and action in TV commercials.
- Discuss how the brand name is displayed in digital media campaigns.
- Discuss different types of visual appeals used in web ads.
- What is the special about Cleo Award-winning ads?
- The Use of Light and Shadow in Caravaggio's "The Calling of Saint Matthew"
- The Symbolism of Colors in Vincent van Gogh's "Starry Night"
- What is the importance of art and culture in our life?
- How has art changed over the last 50 years?
- The use of colors in marketing and advertising.
To conclude,
From gathering information about the artwork to crafting a compelling analysis, we've navigated the essential steps you need for a visual analysis essay. Moreover, with the specific tips and examples, you have everything you need to get started.
So dive into the writing process with confidence and return to this blog whenever you need help on any step!
However, if you have gone through the whole article and are still unsure how to start your essay, we can help you.
Our professional essay writers at MyPerfectWords.com can help you with your visual analysis essay assignment. Contact us with your order details, and we will get it done for you.
We provide essay writing service for students that you can trust for better grades. Place your order now and get the best visual analysis essay writing help.

Write Essay Within 60 Seconds!

Dr. Barbara is a highly experienced writer and author who holds a Ph.D. degree in public health from an Ivy League school. She has worked in the medical field for many years, conducting extensive research on various health topics. Her writing has been featured in several top-tier publications.

Paper Due? Why Suffer? That’s our Job!
Keep reading

- Create Account
- Login
- Home
UR Research > Computer Science Department > CS Ph.D. Theses >
Deep learning methods for medical image computing., url to cite or link to: http://hdl.handle.net/1802/35662.
Copyright © This item is protected by copyright, with all rights reserved.
All Versions
- Help |
- Contact Us |
- About |
- Privacy Policy
Do you want to delete this Institutional Publication?
- Search Menu
- Advance Articles
- Author Videos
- Supplements
- Author Guidelines
- Submission Site
- Why Publish With Us?
- Open Access Policy
- Self-Archiving Policy
- About Neuro-Oncology Advances
- About Society for Neuro-Oncology
- About the European Association of Neuro-Oncology
- Editorial Board
- Advertising & Corporate Services
- Journals on Oxford Academic
- Books on Oxford Academic

Article Contents
Preprocessing, segmentation, feature extraction, concluding remarks, authorship statement..
- < Previous
MRI image analysis methods and applications: an algorithmic perspective using brain tumors as an exemplar
- Article contents
- Figures & tables
- Supplementary Data
Vachan Vadmal, Grant Junno, Chaitra Badve, William Huang, Kristin A Waite, Jill S Barnholtz-Sloan, MRI image analysis methods and applications: an algorithmic perspective using brain tumors as an exemplar, Neuro-Oncology Advances , Volume 2, Issue 1, January-December 2020, vdaa049, https://doi.org/10.1093/noajnl/vdaa049
- Permissions Icon Permissions
The use of magnetic resonance imaging (MRI) in healthcare and the emergence of radiology as a practice are both relatively new compared with the classical specialties in medicine. Having its naissance in the 1970s and later adoption in the 1980s, the use of MRI has grown exponentially, consequently engendering exciting new areas of research. One such development is the use of computational techniques to analyze MRI images much like the way a radiologist would. With the advent of affordable, powerful computing hardware and parallel developments in computer vision, MRI image analysis has also witnessed unprecedented growth. Due to the interdisciplinary and complex nature of this subfield, it is important to survey the current landscape and examine the current approaches for analysis and trend trends moving forward.
MRI imaging, analytics, imaging informatics, deep learning.
The past decade has seen a remarkable change in the availability of powerful, inexpensive computer hardware that has been a major driving force for the progression of machine vision in medical research. This has resulted in advances in digital MRI imaging analysis that ranges from simple tumor identification to the assessment of tumor response and treatments in clinical oncology. 1 Due to the interdisciplinary nature of the field, principles from physics, computer science, and computer graphics are used to address medical imaging informatics problems. With the existence of vast amounts of imaging data procured during standard clinical practice, a primary focus among investigators has been to use image analysis to augment current standards of tumor detection and to gain new insights about the nature of diseases. The stages in a typical workflow are image acquisition, preprocessing, segmentation, and feature extraction. These key terms that define a typical workflow were queried to find current literature in repositories such as Elsevier, IEEE Xplore, Radiology, PubMed, and Google Scholar. This review discusses past and current methods employed in each of these stages as well as the rising popularity of artificial intelligence (AI)-based approaches, using brain tumors as an exemplar. A glossary of key terms is provided in the supplementary materials for ease of reference as these topics are presented.
The first step in any data-driven study is to preprocess the raw images. Preprocessing removes noise by ensuring there is a degree of parity among all the images that in turn make the following segmentation and feature extraction steps more effective. 2 This involves performing operations to remove artifacts, modify image resolution, and address contrast differences that arise from different acquisition hardware and parameters. One common source of noise is bias fields, which are caused by low-frequency signals emitted from the MRI machine combined with patient anatomy that ultimately leads to inhomogeneities in the magnetic field. 3 The resulting images, therefore, have variations in intensity for the same tissue when each tissue should correspond to a specific intensity level. 4 , 5 Another source of noise arises from temporal data. During the course of treatment, patients often have a series of pre- and post-images. These imaging series are valuable for analytics, but is almost impossible for the patient to be in the same exact position for the pre- and post-scans. This can make it difficult to discern the status of the tumor not only for imaging software, but also for radiologists. Thus, images taken over a timeframe must be aligned in a process known as image registration.
To address the contrast differences in studies where images are taken from multiple sources and machines, images undergo normalization of color or grayscale values. 6 Normalization is almost universal in controlled imaging studies and is necessary when employing machine-learning techniques. Normalization effectively defines a new range of color values relative to other images in the data set. Before normalization, it may be necessary to remove noise existing on scans of any modality, including the signal from the patient’s skull for patients with brain tumors. Skull stripping is employed to reduce noise from the scans and increase the signal intensities.
MR Bias Correction
Despite the use of higher field strength MRI scanners, inhomogeneities in the magnetic field coupled with general anatomical noise from tissue attenuation will result in minute, visibly undetectable intensity variations in the resulting images. 5 , 7 Because these nonuniformities can skew results of segmentation and statistical features detection, they need to be corrected before proceeding with the rest of the analytical pipeline. 5 The 2 main methodologies for reducing bias field are prospective and retrospective methods. 3 Prospective approaches attempt to reduce the bias field by altering the image capture sequence on the MRI hardware side. Retrospective approaches apply post processing strategies on the already captured image. Retrospective methods can be classified into 4 main subcategories: filtering, surface fitting, segmentation, and histogram.
Filtering Methods
Filtering-based methods are perhaps the oldest, easiest, and least computationally demanding of the 4 categories. Filtering removes aspects that meet or do not meet a specified threshold. For MR images, the noise that is removed are artifacts corresponding to low frequencies. However, because the filtering is rather crude, there is a high probability of removing valid signals when using low-pass filtering techniques and the chance of creating new artifacts called edge effects. Research has been conducted to mitigate edge effects, but the overall result still shows bias field. 3 This is important when analyzing brain tumor images as it is crucial to properly identify the structural differences that change as the disease progresses such as the necrotic area and the tumor.
The 2 main classical filtering methods still used today are homomorphic filtering and homomorphic unsharp masking. Here, the image is first log transformed followed by a transformation into the frequency domain. Then the bias field is removed via a low-pass filter with the corrected image being the difference between the original image and the bias field. This bias field image is often called the background image. 4 Homomorphic unsharp masking performs the same operations without log transforming the image.
Surface Fitting
The surface fitting approach is parametric in that it attempts to extract the background image by representing the image as a parametric surface and fitting a 2D image to it. 3 , 7 The 2 main categories of surface fitting methods are intensity and gradient based. Intensity-based methods operate under the precondition that there is no significant intensity variation for a single tissue type. Similarly, gradient-based methods operate with the assumption that there is an even dispersion of bias field and are corrected by estimating the variation in intensity gradients. 3
Because accurate segmentation of regions of interest (ROI) is the goal of bias correction, the 2 steps can be combined. The 2 main segmentation-based approaches are both iterative algorithms: expectation maximum (EM) and fuzzy c-means. The EM algorithm is a machine learning-based approach used to iteratively converge a parametric model’s parameters based on the maximum likelihood probability. The EM approach can use different criteria to estimate the model’s parameters. The fuzzy c-means method also iteratively segments by minimizing a cost function as it steps through a vector of the image’s pixel intensities. 4 EM-based approaches have fallen out of in favor of fuzzy c-means.
A histogram is a list that runs the length of the number of intensity values and counts the frequency of each pixel intensity for a given image. An example of a histogram showing the 8-bit pixel value distribution of a slice can be seen in Figure 1b and 1c . Approaches that use intensity distributions are popular and a standard way many research studies correct bias in MR images. 3 The nonparametric nonuniform normalization method (N3) has, since its inception in 1998, been shown to produce the best bias correction. Since then, the N3 method has been upgraded, and the current standard for bias correction is the N4 method. A popular software that contains the N4 bias correction can be found in the Nipype Python package. Chang and coworkers used the N4 bias correction in deep learning based study utilizing TensorFlow to predict isocitrate dehydrogenase status in low- and high-grade gliomas. 8 Although there are several approaches to address bias correction, the area still remains one of the active researches.

(a) An axial slice near the middle of the brain and its associated histograms. (b) A histogram of all gray-level values (0–255). (c) A histogram of all gray-level values but 0 (1–255).
Image Registration
Image registration is the process by which 2 images are spatially aligned using a combination of geometric transformations governed by an optimizer. An image can be geometrically represented and transformed in multiple ways, each with its own pros and cons. It is crucial that key biological landmarks are in the same location for an accurate comparison and analysis. For example, studies may have multitemporal (occurring over a period of time) and/or multimodal (having different contrasts) patient MR imaging data. Due to the breadth of the different kinds of problems that exist when registering images, no one method works for all cases. 9 , 10 In cases that involve brain tumors, especially well-defined glioblastoma multiforme, image registration is crucial as the extraction of accurate morphological features depends on correct alignment of the tumor region.
Registration can be divided into 4 main components: feature space, search space, search strategy, and the similarity. Each provides vital information to determine which registration technique to use. 10 Feature space refers to the area of interest to be used as the basis for registration, for example, edges, outlines, tumors. Search space refers to how the image will be transformed to align with the source. Search strategy follows up by determining what transformation to choose based on previous transformation results. The similarity is a comparison metric between the source and target images that are being aligned. This forms the basis of how to frame the registration problem. Recently, advances in image registration research has made this less experimental and more applicable.
In practice, the de facto standard for research-based MR image registration and segmentation utilizes the software suite, Insight ToolKit (ITK). 9 ITK (version 5.0) consists of a robust set of algorithms and a structured used in many medical imaging-based software such as 3D Slicer and ITK-Snap. In addition to ITK, the FMRIB Software Library ( 11 FSL) also offers a set of robust image registration frameworks; FMRIB’s Linear Image Registration Tool and its nonlinear counterpart, FMRIB’s Nonlinear Image Registration Tool. Both ITK and FSL are highly regarded for registration. Links to the mentioned software can be found in the Supplementary Materials.
Traditional Registration
Principle axis transformation.
Principal axes transformation, first reported in 1990s, is a classical way of registering images based off the rigid body rotation concept in Newtonian dynamics. 11 Using brain tumors as the exemplar, we start with the brain. The rigid body is the overall shape of the brain. The brain is treated as a body of mass (ellipse), exhibiting the properties of a mass body such as a center of mass. In this algorithm, the center of mass, or centroid, of the head is calculated. It is important to note that the centroid is computed from the bounding surface of the brain and not the actual dimensions of the image. This is computed by finding the mean intensity level for the x and y axes. Calculated by 11 :
where I refers to the intensity of the pixel at coordinate ( x , y ). The moment of inertia matrix of the rigid body is also calculated. This is a standard property of the rigid body that describes the rotational moment from the center of mass. The eigenvector column vectors are then calculated from the inertia matrix, that is then used to find the axes of the ellipse of the head. This is done for both target and source images. The maximum eigenvector is used to calculate the angle with the horizontal axes, which is then compared against source and target images. The difference in angle between source and target is used to dictate how much to align the source to the target. 11 Advantages of this algorithm are as follows: (1) it is easier to register images of different contrasts (modalities), for example PD to T2, and (2) it is a completely unsupervised process.
Finite Fourier Transform
Another unsupervised, rigid-body-based method utilizes a comparison of the source and target images via the frequency domain through Fourier transformations. 12 The basis of this algorithm is that given 2 images, the source s 0 ( x , y ) and the target or translated image s 1 ( x , y ), where the target s 1 is assumed to be rotated by an angle θ and translated by pixel distances (Δ x , Δ y ). 12 Thus, the problem now is to find the translation distances (Δ x , Δ y ) and θ , which is accomplished by Fourier transforming s 0 ( x , y ) and s 1 ( x , y ) to S 0 (ξ, η ) and S 1 (ξ, η ), converting the problem to the frequency domain from the spatial domain. In this process, the image is a discrete source of information and the underlying Fourier transform becomes a discrete Fourier transform.
The above equations describe the conversion from a 2D matrix representation of the image, f ( x , y ) to the frequency domain F and the reverse process. Following that, the ratio of the 2 images is taken in the frequency domain to determine the rotation angle of the target needed to align with the source.
ITK Registration Methods
ITK takes an input of 2 images: the source and target. The source is the image to transform to be aligned with the target. The source and target are input into 2 interpolators with a similarity metric process that assesses how closely aligned the source is to the target. With a predefined threshold set, the image iterates through the loop driven by the optimizer algorithms that continues transforming the image until convergence is met. There are 4 main software components of the ITK registration workflow: transformations, the interpolator, the similarity metric, and the optimizer.
ITK Transformations
Transformations in the context of image registration and ITK moves points from one space to another—the input to output space. 13 Medical images and MR scans are in a voxel coordinate space and need to be converted into physical coordinate space before any transformations can occur. ITK has its own C++ classes representing certain important geometric properties of images for optimal transformation. These geometric objects are ITK Point, Vector, and CovariantVector. ITK also requires the Jacobian matrix in order to perform transformations. In the matrix, the elements represent the degree of change a transformation will have on the input space to the output space for each point.
Linear Geometric Transforms
These are transformations where a function maps the pixels from one space to another expressed as follows: T : R n → R m . In order for the transform to be linear, it must meet the following criteria:
All linear transformations are achieved using matrix multiplication and addition, keeping the vector space the same.
Affine Transformation
Affine transformation is the simplest and most widely used linear transforms that treats the image as a rigid body. The affine family encompasses all rigid body transforms and contains operations that are uniform and nonuniform scales, rotations, shears, and reflections. It provides 12 degrees of freedom in the 3D space. The mathematical operations applied are straightforward and not computationally intensive. The matrix operation, below, for a rotation in 2D illustrates an affine transformation. 14
These affine transforms are composited together to produce the desired alignment, dictated by the metric and optimizer. The crux of the registration difficulty comes with optimizing the transform. An example of a translation of a point is as follows:
ITK Interpolators
The interpolator functions similarly to interpolation in general image processing. Interpolation is the process where one image is remapped onto a new image space through transformations. In order to determine the new image pixels after transformation, interpolation is necessary. Since the advent of image processing and manipulation software such as Adobe PhotoShop, there are some default interpolators used universally for general image manipulation that ITK employs. ITK utilizes the following interpolation algorithms: Nearest Neighbor, linear, b-spline, and windowed sinc interpolation (higher order). 13
ITK Similarity Metrics
The similarity metric is primarily responsible for comparing how closely 2 images are to each other based on a predefined parameter of comparison. This is a crucial process that can significantly affect the resulting registration. A similarity metric can also be used during texture analysis. The metric that is utilized depends on the kind of image data. With unimodal images, it is preferable to use an intensity based metric. In contrast, a multimodal image set is better suited to a mutual information similarity metric. Since ITK v3, the number of similarity metrics has been refactored and reduced. Metrics included in ITK v5 are as follows: mean square, correlation, mutual information, joint histogram/mutual information, demons, and ANTS neighborhood correlation metrics.
Means Square
The means square method for assessing similarity between images compares pixel intensities at a given coordinate. This method is pixel intensity driven in the grayscale and is quick to compute. If images A and B are represented by a matrix, i is the pixel index, and N is the total number of pixels, the means square metric is calculated as follows 13 :
A value of 0 indicates that A and B are the same, with increasing values indicating increasing dissimilarity.
Mutual Information
The mutual information method is an area-based method and can be readily applied in assessing the similarities of 2 images being registered. The basis of mutual information comes from the entropy of one random variable to another. Entropy is the measure of randomness of a random variable that is computed using the formula for Shannon entropy 15 :
The mutual information in terms of entropy is written in the following 3 equivalent ways:
The mutual information expressions above are analogous to conditional probability. I ( A ; B ) in the second equation states that based on the knowledge of B , there is a decrease in the uncertainty of A . For MRI images, the random variables are the source and target. To interpret mutual information in the context of equation 2: image A at pixel a is the uncertainty of a minus the uncertainty of pixel intensity given the corresponding pixel intensity at b is the mutual information of a and b . 16 Achieving the maximum mutual information indicates a successful registration. The uncertainty comparison between source and target demonstrates how the mutual information metric works on multi-modal image sets performing a relative comparison of intensity values putting it closer in line with feature and area based methods versus intensity-based methods.
ITK Optimizers
Optimization is the last step in the iterative process of registration. The optimizer’s function consists of a cost function that takes the output value from the similarity metric to calculate and determine the next set of transform parameters to decrease the next metric value. This is an iterative process, of which ITK has many to choose from depending on the transition and metric used. 13
Normalization
Normalization is the process by which gray or color values across multiple images are scaled down to a common set of relative gray values. This ensures that variation in acquisition parameters among scanners is accounted for and that similar tissues appear in a common range of values across all images. The classic method for normalization is histogram matching; however, other methods are better suited for MRI images, such as nonparametric and nonuniform intensity normalization. 17 , 18
Skull Stripping Used When Studying the Brain
Skull stripping, or brain extraction, is a computational process that removes extraneous material not critical for analysis such as the skull, fat, and skin. 19 , 20 The removal of extraneous information reduces the amount of noise in the system creating a cleaner platform from which features can be segmented and further analyzed. Because the problem is well defined, the process has been refined to where fully automated methods often do a clean job. The skull appears as a bright ring surrounding the brain allowing for an accurate mask to be created for brain extraction. The Brain Extraction Tool (BET) from FSL is an excellent, fully automated process that performs this task with great success.
Segmentation occurs after preprocessing and is where an image is divided into disparate, nonoverlapping regions whose texture features share degrees of homogeneity. In patients with brain cancers, the goal would be to delineate the ROI containing tumor, edema, or other distinguishing features. Segmentation of tumors is a very important part of general clinical diagnosis that also forms the basis of imaging studies. In most segmentation challenges, segmentation algorithms are assessed by the accuracy of segmentation of white matter, gray matter, and cerebrospinal fluid. Over the years, segmentation strategies have been developed and are categorized in different ways. There are 3 main types of segmentation that range in their degree of computer-aided automation: manual segmentation, supervised, and unsupervised. 6 Manual segmentation requires the expertise of a neuroradiologist to draw a perimeter around the area containing the pathology and is completely computer unaided. Supervised segmentation involves input from the user, instructing the algorithm how to perform and what constraints to abide by. The most difficult is unsupervised segmentation method, which requires no user input. Unsupervised segmentation is an area of active research. It is especially problematic with gliomas due to the nature of the disease and surrounding tissue. In some cases, regions can be segmented during the registration process as some alignment functions also recognize distinct regions. A visualization of some of the common segmentation filters applied to an example image can be found in Figure 2 .

The application of 4 common filters used for segmentation in Insight ToolKit. From left to right and top to bottom, the filters are as follows: simple thresholding, binary thresholding, Otsu’s thresholding, region growing, confidence connected, the gradient magnitude, fast marching, and watershed. It is important to note that none of the parameters have been tuned for any of these filters.
Segmentation Methods
Region-growing algorithms.
Region growing is a contextual form of segmentation that accounts for the distance of pixels to the current region at hand. Region growing algorithms are considered classical methods that form the foundation for complex permutations of region growing based methods. The basis of region growing is that a random pixel (seed point) is selected either manually or by the computer and the region around that chosen pixel is compared to its neighbors. Similar pixels are grouped according to some parameter as the region grows out from that seed point. Although this method is conceptually quite simple, it can be overly sensitive. Thus, most software packages that utilize region-growing-type algorithms take into account those shortcomings and have developed some complexity.
Connected Threshold
One type of region growing method implemented in ITK is thresholding, specifically connected thresholding. Thresholding turns a grayscale image to a black and white scale by changing each pixel to either black or white depending on a specified gray value cutoff. For example, a simple rule may specify that all pixel values less than constant T will be black and those greater than or equal will be white. The connected threshold method in ITK takes in several parameters as user input: the random coordinates (seed), and upper and lower bounds for the intensities of the region growing algorithm represented as follows: I(X)∈[lower, upper]. 13 As these 3 parameters are required, it is a semiautomatic process. The bounds for the intensities can be determined by observing where the maxima lie on the histogram, calculated either before running through the main region growing algorithm or through observation. Usually, the values for the threshold will lie between 2 maxima. Once the 3 parameters are calculated and input, the process of region growing and thresholding begins by visiting neighboring pixels and determining if they fall under the interval. The process is quick with low computational requirements. Due to the simplicity of the algorithm, it is susceptible to noise and complicated patterns such as inhomogeneities and disconnected regions. This algorithm is ideal for quick prototyping but is limiting.
Neighborhood Connected Segmentation
The neighborhood connected method is similar to the connected threshold method. The main differences are that instead of only looking at the next pixel from the current working pixel, the algorithm looks at a neighborhood of pixels and their intensities, like that of a kernel. In this context, a kernel is a fixed square matrix with real number values that iterates over an image from its center point. Depending on the filter, a set of algebraic operations is performed on the current working pixel I ( x , y ) replacing its value with the new one computed from the kernel.
Otsu’s Segmentation
MR images are grayscale with a typical bit depth of 8 (ie, 8-bit images) where each pixel carries 256 (2 8 ) gray level values. Otsu’s algorithm is an automated binarization method that attempts to separate the foreground from the background by minimizing the within class variance. The problem is essentially divided into 2 parts: background and foreground. For each part, the weight, mean, and variances are calculated as the algorithm iterates along each threshold value (0–255). Although this algorithm works, it is not the most computationally efficient. The process can run faster by using between class variance and optimizing for the largest value.
Confidence Connected
This semi-automatic method utilizes basic statistical features of the image to apply the filter. Here, the user provides a numerical constant and starting seed location. The method calculates the mean intensity and standard deviation of the region and defines an interval based off the constant value provided. This interval given image is represented as follows: I ( X ) ∈ [ μ − c σ , μ + c σ ] . Neighboring pixels that fall in the interval are found and kept record. This process iterates for either a specified number of iterations or until no more pixels fall under the interval. A pitfall of this method is that the region growing is susceptible to incorrect segmentation when the tissue is statistically inhomogeneous. The output is a binary image with a mask, where the segmented region appears in white and the rest in black.
Watershed Algorithm
In nature, land topography dictates how water flows and watershed algorithms in segmentation emulate this. By analyzing the topography of the landscape, the problem is redefined using gradient descents.
Gradient descent is an iterative optimization algorithm that attempts to find the local minima of a function and is widely used in machine learning. In this case, the image is represented as a height function whose minimum is sought. There are 2 ways to optimize the function, by either starting from the bottom and finding the maximum or starting from the top and finding the minimum. The ITK framework employs the latter.
Level Set Algorithms
The level set family of algorithms originated from the research conducted by Sethian and coworkers, who developed an algorithm that can automatically track curves in any dimension. 21 The level set methodologies have been applied to other fields, including medical image analysis, and form the basis of a family of segmentation algorithms. The fundamental problem is to accurately model a curve. The straightforward way is to parameterize a curve with a set of explicit equations. This approach, however, is both complex and computationally intensive. Additionally, limitations arise when boundaries intersect, divide, and rejoin over time. To solve this problem, the level set method builds the curve as it propagates in space. The initial level set, where the curve has no change in elevation, is called the zero level set and is represented by φ ( x , y ) = 0 . The 2 main ways to describe the curve are through its normal and tangent vectors N → , T → both of which are related to the gradient of φ . The other main property of a propagating curve is its velocity V . The normal vector is defined by N → = − ∇ ϕ | ∇ ϕ | and the tangent is defined by T → = ∇ ϕ | ∇ ϕ | . The normal vector is negative to ensure it points in the inward direction of the curve. The curve’s movement is described in terms of both the explicit curve C and implicit curve φ . The curve C and its movement are described as a function of time with d C d t = V and is related to the implicit definition by d ϕ d t = V | ∇ ϕ | . This forms the basis of the level set methodology.
ITK represents the level set function as a higher dimensional function from the beginning as Ψ ( X , t ) where the zero level set is Γ ( X , t ) = { Ψ ( X , t ) = 0 } . 14 Here, X refers to the n -dimensional surface and t the time step. Internally in ITK, the level set works via the following general partial differential equation:
In the equation, α , β , γ are constants that serve as weights to influence the advection, propagation, and spatial modifier for the curvature, respectively.
Fast Marching Segmentation
The fast marching method is a level set that can quickly resolve shapes when the problem is fairly simple. In fast marching, the problem is framed around movement of the curve starting from the zero level set ϕ ( x , y ) = 0 and the propagating speed of the curve F ( x , y ) > 0. 22 Fast marching functions by aiming to solve the Eikonal partial differential equation, an equation used to model many physical phenomena. The solution to this equation is a set of points, which is the curve and verified to be accepted. In ITK, this starting set of points is user provided as a seed point for the algorithm to start its curve propagation. Because the level set family of algorithms is able to merge with other growing curves, it is preferential to even use multiple seed points for efficient computation.
Shape Detection
Shape detection was pioneered by Malladi and Sethian and forgoes the parameterized, geometric Lagrangian approach taken by earlier “snake” methods for level sets. 21 The ITK shape detection filter implements Malladi’s principles by requiring 2 objects of input: the initial ITK image as a level set and its edge potential image, produced via sigmoid filter, which is used to help determine the speed of front propagation. Before the original image goes through the shape detection module, it is first preprocessed with a Gaussian filter, followed by the sigmoid filter to create its complementary edge potential image. Briefly, the process is:
Read image with ITK
Smooth with anisotropic filter
Smooth again with Gaussian filter
Produce edge potential image with Sigmoid filter
Use seeds and distance parameters to create a level set from the ITK image
Pass level set and edge potential into shape detection module and post process with a binary filter to reveal the segmented image
Geodesic Active Contour
The Geodesic active contour method, proposed by Caselles et al., sought to solve the limitations of the classical “snake”-based method of curve tracking that fails when topological changes are presented. 18 This is achieved by starting from the classical snake’s energy-based representation of the curve, called E ( C ) and expressed as follows:
Here, α and λ are constants greater than 0, the first integral represents the contour’s smoothness, and the second the attraction of the contour to an arbitrary object in the image I . 23 Maupertuis’ and Fermat’s Principles are combined with Sethian’s level set to derive the implicit parameterization of curves via geodesics.
In ITK, this underlying theory is abstracted to a workflow similar to that of the shape detection. For the ITK geodesic pipeline, the parameters that can be changed affect the propagation, curvature, and advection of the curves that are drawn from the source image. The pipeline parameters are: seed coordinate, distance, σ for the sigmoid filter, α and β constants, and a propagation scaling value.
The last commonly used segmentation method found in ITK, as well as SciKit and OpenCV, is Canny edge detection, which works by calculating the gradient of the image and using the resulting matrices to “find” the edge. A Gaussian filter is commonly applied first to the image to remove noise and smooth edges. In the ITK workflow, the 2 parameters that can be modified are the variance for the Gaussian filter, and a threshold value for the binary thresholding at the very end.
Atlas-Based Segmentation with a Focus on Brain Imaging
Unlike previous techniques, atlas-based segmentation is not a de novo technique. An atlas is a template that outlines and defines the main anatomical structures and their coordinates, typically on the 3 anatomical planes (axial, sagittal, coronal). For brain imaging, an atlas of a healthy human brain is used to perform and aid in segmenting features. Several standards and types of atlases exist including the Talairach Atlas and Allen Brain Atlas. The 2 main types of atlases are topological (deterministic) and probabilistic. 24 The Talairach atlas is topological and attempts to map out a healthy male and female brain volumetrically using a combination of imaging modalities such as CT and MR. It is often sourced from only one sample. Probabilistic atlases, in contrast, are created from multiple subjects in order to probabilistically determine the chances of a certain feature appearing in a certain region of the brain. It is akin to the creation of a probability distribution for a random variable of brain atlases. These atlases address the shortcomings of the Talairach atlas by establishing a probabilistic map of brain tissue features often produced from a large sample of subjects. A major source of data for probabilistic atlases comes from the UCLA Brain Mapping Center, part of the International Consortium for Brain Mapping. Using these atlases, it is possible to segment features from new scans. The first step is typically to undergo preprocessing steps that involve skull stripping and image registration to the atlas. Once completed, there are 3 main atlas-based segmentation strategies that can be utilized: label propagation, multiatlas propagation, and probabilistic atlas segmentation.
The simplest method is label propagation, which assumes that once the image is registered to the atlas, many of the major anatomical structures are approximately in the same voxels. The general framework of label propagation algorithms attempts to map the labels from the atlas onto the image of interest. These mappings are almost like a continuation of registration, as the mathematical techniques often used are ones such as affine transformations and principle axes. More complex methods can also be used, such as the level set-based approaches. Label propagation is limited as it simply outlines major contours and cannot identify new features.
Multiatlas propagation is the application of label propagation across multiple atlases. The biggest challenge with this approach is choosing how to aggregate and register the labels across multiple atlases. One common method is to use a weighting function for each atlas to classify voxels and has seen favorable accuracy. For general probabilistic segmentation, the approach is Bayesian and expressed as p ( l ( x ) | c ) ∗ p ( c ) ; the conditional probability of the pixel intensity given a class c (label of a feature) and the class prior p ( c ). 24 The probabilistic strategy tends to work best when segmenting new features, such as tumors.
Segmentation and Brain Tumors
The preprocessing steps prior to segmentation are necessary to increase the probability and quality of accurate segmentation. In the clinical setting, a licensed radiologist parses through a patient’s data, identifies key features through segmentation, and reports their findings—an arduous process that takes years of experience and time. Computationally driven segmentation of brain tumors is necessary to reduce this overhead while procuring the same quality of information for data driven studies. However, gliomas, the most common type of malignant brain tumor in adults, can manifest in any region of the brain and are much harder to detect when they are lower grade. Fortunately, the availability of neural network frameworks has given researchers a new tool to address the segmentation challenge.
Once the ROI have been accurately segmented and classified, the next step is to find meaning from the newly sorted information through feature extraction. The major features that are used are first order, gray level co-occurrence, structural, and transform features. Each of these provides information about an image or image series.
First-Order Features
First-order statistical features are those that are directly computed from the gray value intensities in the image. These are computationally simple and form the basis of second and higher order features. Table 1 summarizes the most used first-order features for texture analysis where m , n , and f refer to the length, width, and the image, respectively. 13 , 17 , 25
A Summary of Common First-Order Statistical Features and Their Significance in regards to a Grayscale Image
Gray-Level Co-occurrence Matrices
Gray-level co-occurrence matrices (GLCM), developed by Haralick et al., show the occurrence of gray levels per pixel relative to other pixels. 26 These matrices can show the run length of the gray level values in 4 directions θ : 0°, 45°, 90°, 135°. Among the most common GLCM are the gray level run length matrix (GLRLM), gray-level size zone matrix (GLSZM), neighborhood gray tone difference matrix, and gray-level dependence matrix.
A GLCM has square dimensions of length equal to the number of gray values. The matrix is computed by counting the frequency of gray value i to gray value j per a determined spatial relationship. The most common spatial relationship used is adjacency to the current pixel. A GLRLM maps out how many continuous gray-level values exist in the image along a defined angle θ . For example, if an image has 8 gray-level values and is of dimension 10 × 10 pixels, the resulting GLRLM has dimensions 8 × 10. The rows represent each gray-level value and the columns represent the length of contiguous pixels of that gray-level value. The number of unique occurrences is counted. A GLSZM is similar to the GLRLM in that continuous gray-level values are counted, with the added condition it counts every single connected instance not restricted by an angle θ . This results in only one matrix. With the results taken from the first and GLCM statistics, models to characterize images or an image series are built (3D).
Structural Features
Structural features, or morphological features, describe the shapes of a ROI. Common 3D structural features are volume and shape metrics. 27 Volumetric features include volumes of contrast-enhanced tumor, peritumoral edema, necrosis, and nonenhancing tumor. Ratios of each of these regions can be taken to compute a comparative metric. Shape features include the bounding ellipsoid volume ratio, which is the ratio of the tumor’s volume to the volume of the smallest ellipsoid that bounds the tumor. The orientation of the ellipsoid highlights the spatial position of the tumor. Metrics of sphericity, measuring roundness, compare the ratio of the surface area of the tumor to the surface area of a sphere of equivalent volume. In addition to 3D features, 2D shape features are computed on a per slice basis and include a tumor’s centroid, mean radial distance, radial distance standard deviation, mass circularity, entropy of radial distance, area ratio, zero crossing count, and mass boundary roughness.
Transform Features
The other approach to extracting features is by decomposing the image into a frequency domain allowing for a spectral analysis approach. Common transform methods are wavelet transforms, Fourier, and discrete cosine.
Statistical Tests
Once the features have been extracted, perhaps the largest hurdle is result interpretation and statistical testing. When testing for normality, tests such as the t -test, ANOVA, the Kruskal–Wallis, and Mann–Whitney are used. When multiple groups with multiple features exist, the Tukey honest significant difference test or Benjamin–Hochberg tests are utilized. For a logistic regression type analysis, the standard Cox regression model and receiver operating characteristic analysis are often used. 28
Biomarker Recording
All of the features discussed quickly create a massive matrix of data, making it difficult to properly maintain records of each biological feature, or biomarker. To address this data management problem, the image standardization biomarker initiative (IBSI) was founded to devise a set of rules to standardize the extraction and naming of imaging biomarkers, enhance reproducibility, suggest workflows, and establish biomarker reporting guidelines. 29
The IBSI has proposed a general scheme for biomedical image processing workflows. As the field is dynamic, this scheme is not permanent but rather a guideline for investigators. This review has been structured in a way that follows IBSI’s scheme: data acquisition, preprocessing, segmentation, image interpolation (optional), feature extraction, and feature data. A high-level visualization of this workflow can be found in the flowchart in Figure 3 . Interpolation is optional in cases where patients do not have the same number of slices. This often occurs in multi-institutional studies. Interpolating missing images for parity is sometimes necessary, depending on the type of analysis to be performed.

A flowchart of a general MR image analytics workflow and a potential use of AI-based methods in the segmentation process block.
The main quantitative image features that the IBSI outlines are morphology, local intensity, intensity-based statistics, intensity histogram, intensity volume histogram, gray level co-occurrence, run length, size zone, distance zone matrix, neighborhood gray tone difference, and neighborhood gray-level dependence matrix. For each of the features in these groups, IBSI assigns a standard code. For example, the mean intensity statistical feature is assigned the ID of Q4LE. To further remove ambiguity and avoid the misuse of terminology when discussing certain radiomics terms the nomenclature is defined. The guidelines set forth by IBSI are thorough and outline a typical image processing workflow for investigators.
Approaches Using AI
AI is a relatively new field that emerged in the mid-20th century. AI can be generally defined as the study of rational agents, their composition, and construction that encompasses both machine learning and deep learning approaches. 30 Minsky and Papert formulated the early theory of perceptron which was a generalizable model establishing the foundation of neural networks that comprises the basis of many modern deep learning models today. Neural networks are made up of nodes (neurons), an activation a , and a set of parameters Θ = { W , B } , which are weights and biases, respectively. The activation is simply a linear combination of the input x to the parameters multiplied by a transfer function σ which is expressed as a = σ ( w T x + b ) . 25 Common transfer functions are the sigmoid and hyperbolic tangent functions. These inputs x undergo numerous transformations that in turn form the hidden layers of a deep neural network (DNN). One of the most widely used DNN, especially in MRI imaging, is the convolutional neural network (CNN). 31 Its use can be observed in all parts of the workflow.
Among these DNN, some of the most widely used network architectures are ResNet, generative adversarial neural networks (GANs), and U-nets. The last of which is particularly important as the authors who formulated the U-net architecture did so with a focus of applying it to segment medical data. 32 The foundational blocks that comprise a CNN are its convolutional and pooling layers. A convolutional layer, which takes a layer of neurons as input, applies a filter to that layer of neurons. The raw input image is the initial layer set followed by filters to produce a feature map of the original data. This is then passed further through the network. The feature map is what the network deems as a unique feature. Often, the convolutional layers and its filters will produce a vast number of features in its map. When this occurs, a pooling layer is added, condensing the feature map to reduce its size. The third important block is batch normalization. As the name suggest, batch normalization normalizes data and consequently accelerates the learning process in the CNN. This is achieved through normalization of new inputs before each layer. In constructing these CNNs, network architects have increased freedom to choose the location and number of the convolutions, in addition to other features. This ability allows for the generation of unique networks that can be used to accomplish individual imaging goals. In contrast to traditional methods where registration and segmentation can be answered by framing the problem in different ways, deep learning accomplishes this through the construction of novel networks, training it with a large data set, and assessing the results. 33
Deep learning approaches also start and end differently compared with traditional methods. Deep learning algorithms require a training set of already preprocessed, normalized images that are cropped to the same dimensions. This is crucial as the quality of the input dictates output quality. Although the aforementioned methods in ITK function can successfully segment disparate regions, they do require manual tweaking, which becomes cumbersome with large data sets. With deep learning, the CNN performs the tweaking automatically while iterating through the convolutions. Applications of deep learning have been used in all aspects of MRI image data including image registration, segmentation, and feature extraction and classification. 18 Besides the application of CNNs to address the traditional problems, they can be used unconventionally to generate artificial data via GANs. This has led to research in ways GANs can be used to denoise data and find artifacts. 31 Recent developments in this area have been the use of GANs to super-sample low resolution MRI images to create resulting data that has effectively higher spatial resolution than the source while maintaining source structural integrity. 34
Neural Networks and Brain Tumors
When applied to general imaging analytics, neural networks have had some success when compared with prior methods, which was related to previous over tumor segmentation in MRI images. 35 Segmentation of brain tumor features is challenging due to the wide variability at present and progression of disease, making the accuracy of CNNs more attractive for use in this complex disease. Unlike tabulated information, 3D MRI scans contain vast amounts of information. When training a model using imaging data, a CNN can often times create millions of parameters as it attempts to find and classify features. 35 Typically, MRI images can be fed into a model by dividing each slice into patches or by supplying the whole slice image. Zhao et al. employed a fully convolutional neural network that was found to be more efficient by reading the full slice. 35 As these novel approaches are more commonly applied to brain tumors, it is expected that novel discoveries for patient translational will be utilized.
MRI imaging analysis advanced significantly since the advent of computer vision and computer graphics. Many advances were made in parallel and led to the creation of key tools such as ITK and FSL. Both are widely used among researchers with continued refinement. AI is being applied to many areas, including MRI imaging analysis, which is now moving at an accelerated pace as new deep learning-based research is conducted. This application of AI will undoubtedly open new areas of research and investigation, particularly for challenging diseases such as brain tumors.
This work was supported through developmental funds from CWRU School of Medicine and University Hospitals Research Division.
Conflict of interest statement . None of the authors have any conflicts of interest to disclose.
All authors participated in the manuscript draft and revision.
Cai WL , Hong GB . Quantitative image analysis for evaluation of tumor response in clinical oncology . Chronic Dis Transl Med. 2018 ; 4 ( 1 ): 18 – 28 .
Google Scholar
van Ginneken B , Schaefer-Prokop CM , Prokop M . Computer-aided diagnosis: how to move from the laboratory to the clinic . Radiology. 2011 ; 261 ( 3 ): 719 – 732 .
Song S , Zheng Y , He Y . A review of methods for bias correction in medical images . Biomed Eng Rev. 2017 ; 3 ( 1 ). doi: 10.18103/bme.v3i1.1550
Juntu J , Sijbers J , Dyck D , Gielen J . Bias field correction for MRI images. In: Kurzyński M , Puchała E , Woźniak M , Żołnierek A , eds. Computer Recognition Systems . Vol 30 . Berlin/Heidelberg, Germany : Springer Berlin Heidelberg ; 2005 : 543 – 551 . doi: 10.1007/3-540-32390-2_64
Google Preview
Leger S , Löck S , Hietschold V , Haase R , Böhme HJ , Abolmaali N . Physical correction model for automatic correction of intensity non-uniformity in magnetic resonance imaging . Phys Imaging Radiat Oncol. 2017 ; 4 : 32 – 38 .
Iqbal S , Khan MUG , Saba T , Rehman A . Computer-assisted brain tumor type discrimination using magnetic resonance imaging features . Biomed Eng Lett. 2018 ; 8 ( 1 ): 5 – 28 .
Brinkmann BH , Manduca A , Robb RA . Optimized homomorphic unsharp masking for MR grayscale inhomogeneity correction . IEEE Trans Med Imaging. 1998 ; 17 ( 2 ): 161 – 171 .
Chang K , Bai HX , Zhou H , et al. Residual convolutional neural network for the determination of idh status in low- and high-grade gliomas from MR imaging . Clin Cancer Res. 2018 ; 24 ( 5 ): 1073 – 1081 .
Avants BB , Tustison NJ , Stauffer M , Song G , Wu B , Gee JC . The insight toolkit image registration framework . Front Neuroinform. 2014 ; 8 : 44 .
Kostelec PJ , Periaswamy S . Image registration for MRI . Modern Signal Processing 2013 ; 46 : 161 – 184 .
Alpert NM , Bradshaw JF , Kennedy D , Correia JA . The principal axes transformation: a method for image registration . J Nucl Med . 1990 ; 31 ( 10 ): 1717 – 1722 .
De Castro E , Morandi C . Registration of translated and rotated images using finite Fourier transforms . IEEE Trans Pattern Anal Mach Intell. 1987 ; 9 ( 5 ): 700 – 703 .
Johnson HJ , McCormick MM. The ITK Software Guide Book 2: Design and Functionality . 4th ed. Vol. 536 . Clifton Park, NY : Kitware, Inc .
Jenkinson M , Smith S . A global optimisation method for robust affine registration of brain images . Med Image Anal. 2001 ; 5 ( 2 ): 143 – 156 .
Shannon CE. A Mathematical Theory of Communication . Vol. 55 . Nokia Bell Labs.
Pluim JPW , Maintz JBA , Viergever MA . Mutual-information-based registration of medical images: a survey . IEEE Trans Med Imaging. 2003 ; 22 ( 8 ): 986 – 1004 .
Aggarwal N , Agrawal R . First and second order statistics features for classification of magnetic resonance brain images . J Signal Inf Process. 2012 ; 03 ( 02 ): 146 – 153 .
Litjens G , Kooi T , Bejnordi BE , et al. A survey on deep learning in medical image analysis . Med Image Anal. 2017 ; 42 : 60 – 88 .
Bahadure NB , Ray AK , Thethi HP . Image analysis for MRI based brain tumor detection and feature extraction using biologically inspired BWT and SVM . Int J Biomed Imaging. 2017 ; 2017 : 9749108 .
Varuna Shree N , Kumar TNR . Identification and classification of brain tumor MRI images with feature extraction using DWT and probabilistic neural network . Brain Inform. 2018 ; 5 ( 1 ): 23 – 30 .
Malladi R , Sethian JA , Vemuri BC . Shape modeling with front propagation: a level set approach . IEEE Trans Pattern Anal Mach Intell. 1995 ; 17 ( 2 ): 158 – 175 .
Sethian JA . Evolution, implementation, and application of level set and fast marching methods for advancing fronts . J Comput Phys. 2001 ; 169 ( 2 ): 503 – 555 .
Caselles V , Kimmel R , Sapiro G . Geodesic active contours. In: Proceedings of IEEE International Conference on Computer Vision . Cambridge, MA : IEEE Computer Society Press ; 1995 : 694 – 699 .
Cabezas M , Oliver A , Lladó X , Freixenet J , Cuadra MB . A review of atlas-based segmentation for magnetic resonance brain images . Comput Methods Programs Biomed. 2011 ; 104 ( 3 ): e158 – e177 .
Nabizadeh N , Kubat M . Brain tumors detection and segmentation in MR images: gabor wavelet vs. statistical features . Comput Electr Eng. 2015 ; 45 : 286 – 301 .
Haralick RM , Shanmugam K , Dinstein I . Textural features for image classification . IEEE Trans Syst Man Cybern. 1973 ; SMC-3 ( 6 ): 610 – 621 .
Sanghani P , Ang BT , King NKK , Ren H . Overall survival prediction in glioblastoma multiforme patients from volumetric, shape and texture features using machine learning . Surg Oncol. 2018 ; 27 ( 4 ): 709 – 714 .
Varghese BA , Cen SY , Hwang DH , Duddalwar VA . Texture analysis of imaging: what radiologists need to know . AJR Am J Roentgenol. 2019 ; 212 ( 3 ): 520 – 528 .
Zwanenburg A , Leger S , Vallières M , Löck S . Image biomarker standardisation initiative . ArXiv161207003 Cs Eess. 2019 . http://arxiv.org/abs/1612.07003 . Accessed January 23, 2020 .
Russell SJ , Norvig P , Davis E. Artificial Intelligence: A Modern Approach . 3rd ed. Upper Saddle River, NJ : Prentice Hall ; 2010 .
Selvikvåg Lundervold A , Lundervold A . An overview of deep learning in medical imaging focusing on MRI . Z Für Med Phys. 2018 .
Ronneberger O , Fischer P , Brox T . U-Net: convolutional networks for biomedical image segmentation . ArXiv150504597 Cs. 2015 . http://arxiv.org/abs/1505.04597 . Accessed April 16, 2019 .
Işın A , Direkoğlu C , Şah M . Review of MRI-based brain tumor image segmentation using deep learning methods . Procedia Comput Sci. 2016 ; 102 : 317 – 324 .
Lyu Q , Shan H , Wang G . Multi-contrast super-resolution mri through a progressive network . ArXiv190801612 Phys. 2019 . http://arxiv.org/abs/1908.01612 . Accessed November 20, 2019 .
Zhao X , Wu Y , Song G , Li Z , Zhang Y , Fan Y . A deep learning model integrating FCNNs and CRFs for brain tumor segmentation . Med Image Anal. 2018 ; 43 : 98 – 111 .
- magnetic resonance imaging
- diagnostic radiologic examination
- brain tumors
- radiology specialty
- radiologists
Email alerts
Related articles in pubmed, citing articles via.
- Advertising & Corporate Services
- Recommend to your Librarian
- Journals Career Network
Affiliations
- Online ISSN 2632-2498
- Copyright © 2024 Society for NeuroOncology (SNO); the European Association of Neuro-Oncology(EANO); and Oxford University Press
- About Oxford Academic
- Publish journals with us
- University press partners
- What we publish
- New features
- Open access
- Institutional account management
- Rights and permissions
- Get help with access
- Accessibility
- Advertising
- Media enquiries
- Oxford University Press
- Oxford Languages
- University of Oxford
Oxford University Press is a department of the University of Oxford. It furthers the University's objective of excellence in research, scholarship, and education by publishing worldwide
- Copyright © 2024 Oxford University Press
- Cookie settings
- Cookie policy
- Privacy policy
- Legal notice
This Feature Is Available To Subscribers Only
Sign In or Create an Account
This PDF is available to Subscribers Only
For full access to this pdf, sign in to an existing account, or purchase an annual subscription.
File(s) under embargo
until file(s) become available
SPATIAL-SPECTRAL ANALYSIS FOR THE IDENTIFICATION OF CROP NITROGEN DEFICIENCY BASED ON HIGH-RESOLUTION HYPERSPECTRAL LEAF IMAGES
Among the major row crops in the United States, corn and soybeans stand out due to their high nutritional value and economic importance. Achieving optimal yields is restrained by the challenge of fertilizer management. Many fields experience yield losses due to insufficient mineral nutrients like nitrogen (N), while excessive fertilization raises costs and environmental risks. The critical issue is the accurate determination of fertilizer quantity and timing, underscoring the need for precise, early-stage diagnostics. Emerging high-throughput plant phenotyping techniques, notably hyperspectral imaging (HSI), have been increasingly utilized to identify plant’s responses to abiotic or biotic stresses. Varieties of HSI systems have been developed, such as airborne imaging systems and indoor imaging stations. However, most of the current HSI systems’ signal quality is often compromised by various environmental factors. To address the issue, a handheld hyperspectral imager known as LeafSpec was recently developed at Purdue University and represents a breakthrough with its ability to scan corn or soybean leaves at exceptional spatial and spectral resolutions, improving plant phenotyping quality at reduced costs. Most of the current HSI data processing methods focus on spectral features but rarely consider spatially distributed information. Thus, the objective of this work was to develop a methodology utilizing spatial-spectral features for accurate and reliable diagnostics of crop N nutrient stress. The key innovations include the designing of spatial-spectral features based on the leaf venation structures and the feature mining method for predicting the plant nitrogen condition. First, a novel analysis method called the Natural Leaf Coordinate System (NLCS) was developed to reallocate leaf pixels and innovate the nutrient stress analysis using pixels’ relative locations to the venation structure. A new nitrogen prediction index for soybean plants called NLCS-N was developed, outperforming the conventional averaged vegetation index (Avg. NDVI) in distinguishing healthy plants from nitrogen-stressed plants with higher t-test p-values and predicting the plant nitrogen concentration (PNC) with higher R-squared values. In one of the test cases, the p-values and R-squared values were improved, respectively, from 2.1×10 -3 to 6.92×10 -12 and from 0.314 to 0.565 by Avg. NDVI and NLCS-N. Second, a corn leaf venation segmentation algorithm was developed to separate the venation structure from a corn leaf LeafSpec image, which was further used to generate 3930 spatial-spectral (S-S) features. While the S-S features could be the input variable to build a PNC prediction model, a feature selection mechanism was developed to improve the models’ accuracy in terms of reduced cross-validation errors. In one of the test cases, the cross-validation root mean squared errors were reduced compared with the leaf mean spectra from 0.273 to 0.127 using the selected features. Third, several novel spatial-spectral indexes for corn leaves were developed based on the color distributions at the venation level. The top-performing indexes were selected through a ranking system based on Cohen’s d values and the R-squared values, resulting in a best-performing S-S N prediction index with 0.861 R-squared values for predicting the corn PNC in a field assay. The discussion sections provided insights into how a robust PNC prediction index could be developed and related to plant science. The methodologies outlined offer a framework for broader applications in spatial-spectral analysis using leaf-level hyperspectral imagery, serving as a guide for scientists and researchers in customizing their future studies within this field.
Degree Type
- Doctor of Philosophy
- Agricultural and Biological Engineering
Campus location
- West Lafayette
Advisor/Supervisor/Committee Chair
Additional committee member 2, additional committee member 3, additional committee member 4, usage metrics.
- Agricultural biotechnology diagnostics (incl. biosensors)
- Image processing
- Agricultural engineering
- Data mining and knowledge discovery

COMMENTS
Writing an image analysis essay, whether you're analyzing a photo, painting, or any other kind of an image, is a simple, 6-step process. Let me take you through it. ... While a thesis is our main point, a thesis statement is a complete paragraph that includes the supporting points. To write it, we'll use the Power of Three. ...
Visual analysis is a helpful tool in exploring art. It focuses on the following aspects: Interpretation of subject matter (iconography). An iconographic analysis is an explanation of the work's meaning. Art historians try to understand what is shown and why it is depicted in a certain way. The analysis of function.
Image analysis is used as a fundamental tool for recognizing, differentiating, and. quantifying diverse types of images, including grayscale and color images, multi-. spectral images for a few ...
Sample Outline of Visual Analysis Essay. Introduction: Tell the basic facts about the art (see citing your image). Get the reader interested in the image by using one of the following methods: Describe the image vividly so the reader can see it. Tell about how the image was created. Explain the purpose of the artist.
Question the criteria you established in your thesis and introduction to see if it holds up throughout your analysis. Now you are ready to begin writing a visual rhetorical analysis of your selected image. Arguments Presented By/Within a Visual. In the summer of 2015, the Bureau of Land Management ran an ad campaign with the # ...
Step 1: Introduction and Background. Analyzing the art requires setting the stage with a solid analysis essay format - introduction and background. Begin by providing essential context about the artwork, including details about the artist, the time period, and the broader artistic movement it may belong to.
This image analysis followed the following framework: 1) image acquisition, 2) image processing, 3) feature extraction, and 4) classification and machine learning. For image acquisition, images were taken using Canon EOS REBEL T5i camera, and the. whole canopy was included in the field of view of the camera.
Thesis directed by Associate Professor Catalin Grigoras ABSTRACT Due to the widespread availability of image processing software, it has become easier to produce visually convincing image forgeries. To overcome this issue, there has been considerable work in the digital image analysis field to determine forgeries when no visual indications exist.
Suggested Organization of Visual Analysis Essay. I. Introduction (1 paragraph) - should contain a hook (attention-grabber), set the context for the essay, and contain your thesis statement (described below). a. Thesis statement: State what two images are being analyzed and what your overall claim is about them. The thesis should make a claim ...
Deep Learning in Medical Image Analysis. Over recent years, deep learning (DL) has established itself as a powerful tool across a broad spectrum of domains in imaging—e.g., classification, prediction, detection, segmentation, diagnosis, interpretation, reconstruction, etc. While deep neural networks were initially nurtured in the computer ...
Visual analysis is an important step in evaluating an image and understanding its meaning. It is also important to consider textual information provided with the image, the image source and original context of the image, and the technical quality of the image. The following questions can help guide your analysis and evaluation. Content analysis.
As indicated by the title, the analysis is of 'visual media' online, a term that could be more specific such as 'visual social media' (Leaver et al., 2020), 'digital visual media' (), 'digital visual artefacts' (Leszczynski, 2018) or even 'digital images, digitally analysed' ().An even more straightforward designation could be 'social media images' (Pearce et al., 2020).
Assignment Outcomes: The Image Analysis Essay should demonstrate your ability to make a logical argument that is well supported by evidence and correct use of MLA format and citation style. Assignment Requirements: Write an argumentative essay on an image. The image can not include any text. Have an arguable thesis that is well supported by ...
This Master Thesis provides a summary overview on the use of current deep learning-based object detection methods for the analysis of medical images, in particular from microscopic tissue sections. An accentuating peculiarity of medical image analysis and likewise a pronounced challenge, arises from the fact, that, datasets from patients are ...
This paper discusses the new algorithms and strategies in the area of deep learning. In this brief introduction to DLA in medical image analysis, there are two objectives. The first one is an introduction to the field of deep learning and the associated theory. The second is to provide a general overview of the medical image analysis using DLA.
Medical imaging plays a significant role in different clinical applications such as medical procedures used for early detection, monitoring, diagnosis, and treatment evaluation of various medical conditions. Basicsof the principles and implementations of artificial neural networks and deep learning are essential for understanding medical image analysis in computer vision. Deep Learning ...
Abstract. My thesis develops machine learning methods that exploit multimodal clinical data to improve medical image analysis. Medical images capture rich information of a patient's physiological and disease status, central in clinical practice and research. Computational models, such as artificial neural networks, enable automatic and ...
ISSN 1651-6214 ISBN 978-91-554-9567-1. urn:nbn:se:uu:diva-283846. Dissertation presented at Uppsala University to be publicly examined in 2446, ITC, Lägerhyddsvägen 2, Hus 2, Uppsala, Thursday, 9 June 2016 at 10:15 for the degree of Doctor of Philosophy. The examination will be conducted in English.
Once you have a specific artwork or image, here is how to start a visual analysis essay. You need to ask some basic questions about the work and jot down your ideas. ... The visual analysis essay thesis states the analysis points on the artwork that you aim to discuss in your essay. Step 5 - Provide Detailed Description, Analysis, and ...
Introduction. Medical image analysis is a critical component of modern healthcare, allowing physicians to diagnose, monitor, and treat a wide range of medical conditions. However, the ...
This thesis develops deep learning models and techniques for medical image analysis, reconstruction and synthesis. In medical image analysis, we concentrate on understanding the content of the medical images and giving guidance to medical practitioners. In particular, we investigate deep learning ways to address classification, detection ...
Pragmatic Medical Image Analysis and Deep Learning: An Emerging Trend. December 2019. DOI: 10.1007/978-981-15-1100-4_1. In book: Advancement of Machine Intelligence in Interactive Medical Image ...
With the advent of affordable, powerful computing hardware and parallel developments in computer vision, MRI image analysis has also witnessed unprecedented growth. Due to the interdisciplinary and complex nature of this subfield, it is important to survey the current landscape and examine the current approaches for analysis and trend trends ...
Among the major row crops in the United States, corn and soybeans stand out due to their high nutritional value and economic importance. Achieving optimal yields is restrained by the challenge of fertilizer management. Many fields experience yield losses due to insufficient mineral nutrients like nitrogen (N), while excessive fertilization raises costs and environmental risks. The critical ...