
15 Scientific Method Examples

The scientific method is a structured and systematic approach to investigating natural phenomena using empirical evidence .
The scientific method has been a lynchpin for rapid improvements in human development. It has been an invaluable procedure for testing and improving upon human ingenuity. It’s led to amazing scientific, technological, and medical breakthroughs.
Some common steps in a scientific approach would include:
- Observation
- Question formulation
- Hypothesis development
- Experimentation and collecting data
- Analyzing results
- Drawing conclusions

Definition of Scientific Method
The scientific method is a structured and systematic approach to investigating natural phenomena or events through empirical evidence.
Empirical evidence can be gathered from experimentation, observation, analysis, and interpretation of data that allows one to create generalizations about probable reasons behind those happenings.
As mentioned in the article published in the journal Nature,
“ As schoolchildren, we are taught that the scientific method involves a question and suggested explanation (hypothesis) based on observation, followed by the careful design and execution of controlled experiments, and finally validation, refinement or rejection of this hypothesis” (p. 237).
The use of scientific methods permits replication and validation of other people’s scientific analyses, leading toward improvement upon previous results, and solid empirical conclusions.
Voit (2019) adds that:
“…it not only prescribes the order and types of activities that give a scientific study validity and a stamp of approval but also has substantially shaped how we collectively think about the endeavor of investigating nature” (p. 1).
This method aims to minimize subjective biases while maximizing objectivity helping researchers gather factual data.
It follows set procedures and guidelines for testing hypotheses using controlled conditions, assuring optimum accuracy and relevance in concluding by assessing a range of aspects (Blystone & Blodgett, 2006).
Overall, the scientific method provides researchers with a structured way of inquiry that seeks insightful explanations regarding evidence-based investigation grounded in facts acquired from an array of fields.
15 Examples of Scientific Method
- Medicine Delivery : Scientists use scientific method to determine the most effective way of delivering a medicine to its target location in the body. They perform experiments and gather data on the different methods of medicine delivery, monitoring factors such as dosage and time release.
- Agricultural Research : Scientific method is frequently used in agricultural research to determine the most effective way to grow crops or raise livestock. This may involve testing different fertilizers, irrigation methods, or animal feed, measuring yield, and analyzing data.
- Food Science and Nutrition : Nutritionists and food scientists use the scientific method to study the effects of different food types and diet on health. They design experiments to understand the impact of dietary changes on weight, disease risk, and overall health outcomes.
- Environmental Studies : Researchers use scientific method to study natural ecosystems and how human activities impact them. They collect data on things like biodiversity, water quality, and pollution levels, analyzing changes over time.
- Psychological Studies : Psychologists use the scientific method to understand human behavior and cognition. They conduct experiments under controlled conditions to test theories about learning, memory, social interaction, and more.
- Climate Change Research : Climate scientists use the scientific method to study the Earth’s changing climate. They collect and analyze data on temperature, CO2 levels, and ice coverage to understand trends and make predictions about future changes.
- Geology Exploration : Geologists use scientific method to analyze rock samples from deep in the earth’s crust and gather information about geological processes over millions of years. They evaluate data by studying patterns left behind by these processes.
- Space Exploration : Scientists use scientific methods in designing space missions so that they can explore other planets or learn more about our solar system. They employ experiments like landing craft exploration missions as well as remote sensing techniques that allow them to examine far-off planets without having physically land on their surfaces.
- Archaeology : Archaeologists use the scientific method to understand past human cultures. They formulate hypotheses about a site or artifact, conduct excavations or analyses, and then interpret the data to test their hypotheses.
- Clinical Trials : Medical researchers use scientific method to test new treatments and therapies for various diseases. They design controlled studies that track patients’ outcomes while varying variables like dosage or treatment frequency.
- Industrial Research & Development : Many companies use scientific methods in their R&D departments. For example, automakers may assess the effectiveness of anti-lock brakes before releasing them into the marketplace through tests with dummy targets.
- Material Science Experiments : Engineers have extensively used scientific method experimentation efforts when designing new materials and testing which options could be flexible enough for certain applications. These experiments might include casting molten material into molds and then subjecting it to high heat to expose vulnerabilities
- Chemical Engineering Investigations : Chemical engineers also abide by scientific method principles to create new chemical compounds & technologies designed to be valuable in the industry. They may experiment with different substances, changing materials’ concentration and heating conditions to ensure the final end-product safety and reliability of the material.
- Biotechnology : Biotechnologists use the scientific method to develop new products or processes. For instance, they may experiment with genetic modification techniques to enhance crop resistance to pests or disease.
- Physics Research : Scientists use scientific method in their work to study fundamental principles of the universe. They seek answers for how atoms and molecules are breaking down and related events that unfold naturally by running many simulations using computer models or designing sophisticated experiments to test hypotheses.
Origins of the Scientific Method
The scientific method can be traced back to ancient times when philosophers like Aristotle used observation and logic to understand the natural world.
These early philosophers were focused on understanding the world around them and sought explanations for natural phenomena through direct observation (Betz, 2010).
In the Middle Ages, Muslim scholars played a key role in developing scientific inquiry by emphasizing empirical observations.
Alhazen (a.k.a Ibn al-Haytham), for example, introduced experimental methods that helped establish optics as a modern science. He emphasized investigation through experimentation with controlled conditions (De Brouwer, 2021).
During the Scientific Revolution of the 17th century in Europe, scientists such as Francis Bacon and René Descartes began to develop what we now know as the scientific method observation (Betz, 2010).
Bacon argued that knowledge must be based on empirical evidence obtained through observation and experimentation rather than relying solely upon tradition or authority.
Descartes emphasized mathematical methods as tools in experimentation and rigorous thinking processes (Fukuyama, 2021).
These ideas later developed into systematic research designs , including hypothesis testing, controlled experiments, and statistical analysis – all of which are still fundamental aspects of modern-day scientific research.
Since then, technological advancements have allowed for more sophisticated instruments and measurements, yielding far more precise data sets scientists use today in fields ranging from Medicine & Chemistry to Astrophysics or Genetics.
So, while early Greek philosophers laid much groundwork toward an observational-based approach to explaining nature, Islam scholars furthered our understanding of logical reasoning techniques and gave rise to a more formalized methodology.
Steps in the Scientific Method
While there may be variations in the specific steps scientists follow, the general process has six key steps (Blystone & Blodgett, 2006).
Here is a brief overview of each of these steps:
1. Observation
The first step in the scientific method is to identify and observe a phenomenon that requires explanation.
This can involve asking open-ended questions, making detailed observations using our senses or tools, or exploring natural patterns, which are sources to develop hypotheses.
2. Formulation of a Hypothesis
A hypothesis is an educated guess or proposed explanation for the observed phenomenon based on previous observations & experiences or working assumptions derived from a valid literature review .
The hypothesis should be testable and falsifiable through experimentation and subsequent analysis.
3. Testing of the Hypothesis
In this step, scientists perform experiments to test their hypothesis while ensuring that all variables are controlled besides the one being observed.
The data collected in these experiments must be measurable, repeatable, and consistent.
4. Data Analysis
Researchers carefully scrutinize data gathered from experiments – typically using inferential statistics techniques to analyze whether results support their hypotheses or not.
This helps them gain important insights into what previously unknown mechanisms might exist based on statistical evidence gained about their system.
See: 15 Examples of Data Analysis
5. Drawing Conclusions
Based on their data analyses, scientists reach conclusions about whether their original hypotheses were supported by evidence obtained from testing.
If there is insufficient supporting evidence for their ideas – trying again with modified iterations of the initial idea sometimes happens.
6. Communicating Results
Once results have been analyzed and interpreted under accepted principles within the scientific community, scientists publish findings in respected peer-reviewed journals.
These publications help knowledge-driven communities establish trends within respective fields while indirectly subjecting papers reviews requests boosting research quality across the scientific discipline.
Importance of the Scientific Method
The scientific method is important because it helps us to collect reliable data and develop testable hypotheses that can be used to explain natural phenomena (Haig, 2018).
Here are some reasons why the scientific method is so essential:
- Objectivity : The scientific method requires researchers to conduct unbiased experiments and analyses, which leads to more impartial conclusions. In this way, replication of findings by peers also ensures results can be relied upon as founded on sound principles allowing others confidence in building further knowledge on top of existing research.
- Precision & Predictive Power : Scientific methods usually include techniques for obtaining highly precise measurements, ensuring that data collected is more meaningful with fewer uncertainties caused by limited measuring errors leading to statistically significant results having firm logical foundations. If predictions develop scientifically tested generalized defined conditions factored into the analysis, it helps in delivering realistic expectations
- Validation : By following established scientific principles defined within the community – independent scholars can replicate observation data without being influenced by subjective biases or prejudices. It assures general acceptance among scientific communities who follow similar protocols when researching within respective fields.
- Application & Innovation : Scientific concept advancements that occur based on correct hypothesis testing commonly lead scientists toward new discoveries, identifying potential breakthroughs in research. They pave the way for technological innovations often seen as game changers, like mapping human genome DNA onto creating novel therapies against genetic diseases or unlocking secrets of today’s universe through discoveries at LHC.
- Impactful Decision-Making : Policymakers can draw from these scientific findings investing resources into informed decisions leading us toward a sustainable future. For example, research gathered about carbon pollution’s impact on climate change informs debate making policy action decisions about our planet’s environment, providing valuable knowledge-useful information benefiting societies (Haig, 2018).
The scientific method is an essential tool that has revolutionized our understanding of the natural world.
By emphasizing rigorous experimentation, objective measurement, and logical analysis- scientists can obtain more unbiased evidence with empirical validity .
Utilizing this methodology has led to groundbreaking discoveries & knowledge expansion that have shaped our modern world from medicine to technology.
The scientific method plays a crucial role in advancing research and our overall societal consensus on reliable information by providing reliable results, ensuring we can make more informed decisions toward a sustainable future.
As scientific advancements continue rapidly, ensuring we’re applying core principles of this process enables objectives to progress, paving new ways for interdisciplinary research across all fields, thereby fuelling ever-driving human curiosity.
Betz, F. (2010). Origin of scientific method. Managing Science , 21–41. https://doi.org/10.1007/978-1-4419-7488-4_2
Blystone, R. V., & Blodgett, K. (2006). WWW: The scientific method. CBE—Life Sciences Education , 5 (1), 7–11. https://doi.org/10.1187/cbe.05-12-0134
De Brouwer , P. J. S. (2021). The big r-book: From data science to learning machines and big data . John Wiley & Sons, Inc.
Defining the scientific method. (2009). Nature Methods , 6 (4), 237–237. https://doi.org/10.1038/nmeth0409-237
Fukuyama, F. (2012). The end of history and the last man . New York: Penguin.
Haig, B. D. (2018). The importance of scientific method for psychological science. Psychology, Crime & Law , 25 (6), 527–541. https://doi.org/10.1080/1068316x.2018.1557181
Voit, E. O. (2019). Perspective: Dimensions of the scientific method. PLOS Computational Biology , 15 (9), e1007279. https://doi.org/10.1371/journal.pcbi.1007279

Viktoriya Sus (MA)
Viktoriya Sus is an academic writer specializing mainly in economics and business from Ukraine. She holds a Master’s degree in International Business from Lviv National University and has more than 6 years of experience writing for different clients. Viktoriya is passionate about researching the latest trends in economics and business. However, she also loves to explore different topics such as psychology, philosophy, and more.
- Viktoriya Sus (MA) #molongui-disabled-link 15 Free Enterprise Examples
- Viktoriya Sus (MA) #molongui-disabled-link 21 Sunk Costs Examples (The Fallacy Explained)
- Viktoriya Sus (MA) #molongui-disabled-link Price Floor: 15 Examples & Definition
- Viktoriya Sus (MA) #molongui-disabled-link Linguistic Relativity: 10 Examples and Definition

Chris Drew (PhD)
This article was peer-reviewed and edited by Chris Drew (PhD). The review process on Helpful Professor involves having a PhD level expert fact check, edit, and contribute to articles. Reviewers ensure all content reflects expert academic consensus and is backed up with reference to academic studies. Dr. Drew has published over 20 academic articles in scholarly journals. He is the former editor of the Journal of Learning Development in Higher Education and holds a PhD in Education from ACU.
- Chris Drew (PhD) #molongui-disabled-link 25 Positive Punishment Examples
- Chris Drew (PhD) #molongui-disabled-link 25 Dissociation Examples (Psychology)
- Chris Drew (PhD) #molongui-disabled-link 15 Zone of Proximal Development Examples
- Chris Drew (PhD) #molongui-disabled-link Perception Checking: 15 Examples and Definition
Scientific Method
Illustration by J.R. Bee. ThoughtCo.
- Cell Biology
- Weather & Climate
- B.A., Biology, Emory University
- A.S., Nursing, Chattahoochee Technical College
The scientific method is a series of steps followed by scientific investigators to answer specific questions about the natural world. It involves making observations, formulating a hypothesis , and conducting scientific experiments . Scientific inquiry starts with an observation followed by the formulation of a question about what has been observed. The steps of the scientific method are as follows:
Observation
The first step of the scientific method involves making an observation about something that interests you. This is very important if you are doing a science project because you want your project to be focused on something that will hold your attention. Your observation can be on anything from plant movement to animal behavior, as long as it is something you really want to know more about. This is where you come up with the idea for your science project.
Once you've made your observation, you must formulate a question about what you have observed. Your question should tell what it is that you are trying to discover or accomplish in your experiment. When stating your question you should be as specific as possible. For example, if you are doing a project on plants , you may want to know how plants interact with microbes. Your question may be: Do plant spices inhibit bacterial growth ?
The hypothesis is a key component of the scientific process. A hypothesis is an idea that is suggested as an explanation for a natural event, a particular experience, or a specific condition that can be tested through definable experimentation. It states the purpose of your experiment, the variables used, and the predicted outcome of your experiment. It is important to note that a hypothesis must be testable. That means that you should be able to test your hypothesis through experimentation . Your hypothesis must either be supported or falsified by your experiment. An example of a good hypothesis is: If there is a relation between listening to music and heart rate, then listening to music will cause a person's resting heart rate to either increase or decrease.
Once you've developed a hypothesis, you must design and conduct an experiment that will test it. You should develop a procedure that states very clearly how you plan to conduct your experiment. It is important that you include and identify a controlled variable or dependent variable in your procedure. Controls allow us to test a single variable in an experiment because they are unchanged. We can then make observations and comparisons between our controls and our independent variables (things that change in the experiment) to develop an accurate conclusion.
The results are where you report what happened in the experiment. That includes detailing all observations and data made during your experiment. Most people find it easier to visualize the data by charting or graphing the information.
The final step of the scientific method is developing a conclusion. This is where all of the results from the experiment are analyzed and a determination is reached about the hypothesis. Did the experiment support or reject your hypothesis? If your hypothesis was supported, great. If not, repeat the experiment or think of ways to improve your procedure.
- Six Steps of the Scientific Method
- What Is an Experiment? Definition and Design
- Scientific Method Flow Chart
- Scientific Method Lesson Plan
- How To Design a Science Fair Experiment
- Science Projects for Every Subject
- How to Do a Science Fair Project
- What Are the Elements of a Good Hypothesis?
- How to Write a Lab Report
- What Is a Hypothesis? (Science)
- Biology Science Fair Project Ideas
- Understanding Simple vs Controlled Experiments
- Null Hypothesis Definition and Examples
- Stove Top Frozen Pizza Science Experiment
- Dependent Variable Definition and Examples
- What Is the Difference Between Hard and Soft Science?
Science and the scientific method: Definitions and examples
Here's a look at the foundation of doing science — the scientific method.

The scientific method
Hypothesis, theory and law, a brief history of science, additional resources, bibliography.
Science is a systematic and logical approach to discovering how things in the universe work. It is also the body of knowledge accumulated through the discoveries about all the things in the universe.
The word "science" is derived from the Latin word "scientia," which means knowledge based on demonstrable and reproducible data, according to the Merriam-Webster dictionary . True to this definition, science aims for measurable results through testing and analysis, a process known as the scientific method. Science is based on fact, not opinion or preferences. The process of science is designed to challenge ideas through research. One important aspect of the scientific process is that it focuses only on the natural world, according to the University of California, Berkeley . Anything that is considered supernatural, or beyond physical reality, does not fit into the definition of science.
When conducting research, scientists use the scientific method to collect measurable, empirical evidence in an experiment related to a hypothesis (often in the form of an if/then statement) that is designed to support or contradict a scientific theory .
"As a field biologist, my favorite part of the scientific method is being in the field collecting the data," Jaime Tanner, a professor of biology at Marlboro College, told Live Science. "But what really makes that fun is knowing that you are trying to answer an interesting question. So the first step in identifying questions and generating possible answers (hypotheses) is also very important and is a creative process. Then once you collect the data you analyze it to see if your hypothesis is supported or not."

The steps of the scientific method go something like this, according to Highline College :
- Make an observation or observations.
- Form a hypothesis — a tentative description of what's been observed, and make predictions based on that hypothesis.
- Test the hypothesis and predictions in an experiment that can be reproduced.
- Analyze the data and draw conclusions; accept or reject the hypothesis or modify the hypothesis if necessary.
- Reproduce the experiment until there are no discrepancies between observations and theory. "Replication of methods and results is my favorite step in the scientific method," Moshe Pritsker, a former post-doctoral researcher at Harvard Medical School and CEO of JoVE, told Live Science. "The reproducibility of published experiments is the foundation of science. No reproducibility — no science."
Some key underpinnings to the scientific method:
- The hypothesis must be testable and falsifiable, according to North Carolina State University . Falsifiable means that there must be a possible negative answer to the hypothesis.
- Research must involve deductive reasoning and inductive reasoning . Deductive reasoning is the process of using true premises to reach a logical true conclusion while inductive reasoning uses observations to infer an explanation for those observations.
- An experiment should include a dependent variable (which does not change) and an independent variable (which does change), according to the University of California, Santa Barbara .
- An experiment should include an experimental group and a control group. The control group is what the experimental group is compared against, according to Britannica .
The process of generating and testing a hypothesis forms the backbone of the scientific method. When an idea has been confirmed over many experiments, it can be called a scientific theory. While a theory provides an explanation for a phenomenon, a scientific law provides a description of a phenomenon, according to The University of Waikato . One example would be the law of conservation of energy, which is the first law of thermodynamics that says that energy can neither be created nor destroyed.
A law describes an observed phenomenon, but it doesn't explain why the phenomenon exists or what causes it. "In science, laws are a starting place," said Peter Coppinger, an associate professor of biology and biomedical engineering at the Rose-Hulman Institute of Technology. "From there, scientists can then ask the questions, 'Why and how?'"
Laws are generally considered to be without exception, though some laws have been modified over time after further testing found discrepancies. For instance, Newton's laws of motion describe everything we've observed in the macroscopic world, but they break down at the subatomic level.
This does not mean theories are not meaningful. For a hypothesis to become a theory, scientists must conduct rigorous testing, typically across multiple disciplines by separate groups of scientists. Saying something is "just a theory" confuses the scientific definition of "theory" with the layperson's definition. To most people a theory is a hunch. In science, a theory is the framework for observations and facts, Tanner told Live Science.

The earliest evidence of science can be found as far back as records exist. Early tablets contain numerals and information about the solar system , which were derived by using careful observation, prediction and testing of those predictions. Science became decidedly more "scientific" over time, however.
1200s: Robert Grosseteste developed the framework for the proper methods of modern scientific experimentation, according to the Stanford Encyclopedia of Philosophy. His works included the principle that an inquiry must be based on measurable evidence that is confirmed through testing.
1400s: Leonardo da Vinci began his notebooks in pursuit of evidence that the human body is microcosmic. The artist, scientist and mathematician also gathered information about optics and hydrodynamics.
1500s: Nicolaus Copernicus advanced the understanding of the solar system with his discovery of heliocentrism. This is a model in which Earth and the other planets revolve around the sun, which is the center of the solar system.
1600s: Johannes Kepler built upon those observations with his laws of planetary motion. Galileo Galilei improved on a new invention, the telescope, and used it to study the sun and planets. The 1600s also saw advancements in the study of physics as Isaac Newton developed his laws of motion.
1700s: Benjamin Franklin discovered that lightning is electrical. He also contributed to the study of oceanography and meteorology. The understanding of chemistry also evolved during this century as Antoine Lavoisier, dubbed the father of modern chemistry , developed the law of conservation of mass.
1800s: Milestones included Alessandro Volta's discoveries regarding electrochemical series, which led to the invention of the battery. John Dalton also introduced atomic theory, which stated that all matter is composed of atoms that combine to form molecules. The basis of modern study of genetics advanced as Gregor Mendel unveiled his laws of inheritance. Later in the century, Wilhelm Conrad Röntgen discovered X-rays , while George Ohm's law provided the basis for understanding how to harness electrical charges.
1900s: The discoveries of Albert Einstein , who is best known for his theory of relativity, dominated the beginning of the 20th century. Einstein's theory of relativity is actually two separate theories. His special theory of relativity, which he outlined in a 1905 paper, " The Electrodynamics of Moving Bodies ," concluded that time must change according to the speed of a moving object relative to the frame of reference of an observer. His second theory of general relativity, which he published as " The Foundation of the General Theory of Relativity ," advanced the idea that matter causes space to curve.
In 1952, Jonas Salk developed the polio vaccine , which reduced the incidence of polio in the United States by nearly 90%, according to Britannica . The following year, James D. Watson and Francis Crick discovered the structure of DNA , which is a double helix formed by base pairs attached to a sugar-phosphate backbone, according to the National Human Genome Research Institute .
2000s: The 21st century saw the first draft of the human genome completed, leading to a greater understanding of DNA. This advanced the study of genetics, its role in human biology and its use as a predictor of diseases and other disorders, according to the National Human Genome Research Institute .
- This video from City University of New York delves into the basics of what defines science.
- Learn about what makes science science in this book excerpt from Washington State University .
- This resource from the University of Michigan — Flint explains how to design your own scientific study.
Merriam-Webster Dictionary, Scientia. 2022. https://www.merriam-webster.com/dictionary/scientia
University of California, Berkeley, "Understanding Science: An Overview." 2022. https://undsci.berkeley.edu/article/0_0_0/intro_01
Highline College, "Scientific method." July 12, 2015. https://people.highline.edu/iglozman/classes/astronotes/scimeth.htm
North Carolina State University, "Science Scripts." https://projects.ncsu.edu/project/bio183de/Black/science/science_scripts.html
University of California, Santa Barbara. "What is an Independent variable?" October 31,2017. http://scienceline.ucsb.edu/getkey.php?key=6045
Encyclopedia Britannica, "Control group." May 14, 2020. https://www.britannica.com/science/control-group
The University of Waikato, "Scientific Hypothesis, Theories and Laws." https://sci.waikato.ac.nz/evolution/Theories.shtml
Stanford Encyclopedia of Philosophy, Robert Grosseteste. May 3, 2019. https://plato.stanford.edu/entries/grosseteste/
Encyclopedia Britannica, "Jonas Salk." October 21, 2021. https://www.britannica.com/ biography /Jonas-Salk
National Human Genome Research Institute, "Phosphate Backbone." https://www.genome.gov/genetics-glossary/Phosphate-Backbone
National Human Genome Research Institute, "What is the Human Genome Project?" https://www.genome.gov/human-genome-project/What
Live Science contributor Ashley Hamer updated this article on Jan. 16, 2022.
Sign up for the Live Science daily newsletter now
Get the world’s most fascinating discoveries delivered straight to your inbox.

Eerie, orange skies loom over Athens as dust storm engulfs southern Greece
Hidden 'biosphere' of extreme microbes discovered 13 feet below Atacama Desert is deepest found there to date
Eclipse from space: Paths of 2024 and 2017 eclipses collide over US in new satellite image
Most Popular
- 2 James Webb telescope confirms there is something seriously wrong with our understanding of the universe
- 3 Giant, 82-foot lizard fish discovered on UK beach could be largest marine reptile ever found
- 4 Global 'time signals' subtly shifted as the total solar eclipse reshaped Earth's upper atmosphere, new data shows
- 5 'I nearly fell out of my chair': 1,800-year-old mini portrait of Alexander the Great found in a field in Denmark
- 2 Why does striking flint against steel start a fire?
- 3 Tweak to Schrödinger's cat equation could unite Einstein's relativity and quantum mechanics, study hints
- 4 32 times lasers revealed hidden forts and settlements from centuries ago
- 5 New UTI vaccine wards off infection for years, early studies suggest
- Bipolar Disorder
- Therapy Center
- When To See a Therapist
- Types of Therapy
- Best Online Therapy
- Best Couples Therapy
- Best Family Therapy
- Managing Stress
- Sleep and Dreaming
- Understanding Emotions
- Self-Improvement
- Healthy Relationships
- Student Resources
- Personality Types
- Guided Meditations
- Verywell Mind Insights
- 2023 Verywell Mind 25
- Mental Health in the Classroom
- Editorial Process
- Meet Our Review Board
- Crisis Support
Scientific Method Steps in Psychology Research
Steps, Uses, and Key Terms
Kendra Cherry, MS, is a psychosocial rehabilitation specialist, psychology educator, and author of the "Everything Psychology Book."
:max_bytes(150000):strip_icc():format(webp)/IMG_9791-89504ab694d54b66bbd72cb84ffb860e.jpg "research scientific method example")
Emily is a board-certified science editor who has worked with top digital publishing brands like Voices for Biodiversity, Study.com, GoodTherapy, Vox, and Verywell.
:max_bytes(150000):strip_icc():format(webp)/Emily-Swaim-1000-0f3197de18f74329aeffb690a177160c.jpg "research scientific method example")
Verywell / Theresa Chiechi
How do researchers investigate psychological phenomena? They utilize a process known as the scientific method to study different aspects of how people think and behave.
When conducting research, the scientific method steps to follow are:
- Observe what you want to investigate
- Ask a research question and make predictions
- Test the hypothesis and collect data
- Examine the results and draw conclusions
- Report and share the results
This process not only allows scientists to investigate and understand different psychological phenomena but also provides researchers and others a way to share and discuss the results of their studies.
Generally, there are five main steps in the scientific method, although some may break down this process into six or seven steps. An additional step in the process can also include developing new research questions based on your findings.
What Is the Scientific Method?
What is the scientific method and how is it used in psychology?
The scientific method consists of five steps. It is essentially a step-by-step process that researchers can follow to determine if there is some type of relationship between two or more variables.
By knowing the steps of the scientific method, you can better understand the process researchers go through to arrive at conclusions about human behavior.
Scientific Method Steps
While research studies can vary, these are the basic steps that psychologists and scientists use when investigating human behavior.
The following are the scientific method steps:
Step 1. Make an Observation
Before a researcher can begin, they must choose a topic to study. Once an area of interest has been chosen, the researchers must then conduct a thorough review of the existing literature on the subject. This review will provide valuable information about what has already been learned about the topic and what questions remain to be answered.
A literature review might involve looking at a considerable amount of written material from both books and academic journals dating back decades.
The relevant information collected by the researcher will be presented in the introduction section of the final published study results. This background material will also help the researcher with the first major step in conducting a psychology study: formulating a hypothesis.
Step 2. Ask a Question
Once a researcher has observed something and gained some background information on the topic, the next step is to ask a question. The researcher will form a hypothesis, which is an educated guess about the relationship between two or more variables
For example, a researcher might ask a question about the relationship between sleep and academic performance: Do students who get more sleep perform better on tests at school?
In order to formulate a good hypothesis, it is important to think about different questions you might have about a particular topic.
You should also consider how you could investigate the causes. Falsifiability is an important part of any valid hypothesis. In other words, if a hypothesis was false, there needs to be a way for scientists to demonstrate that it is false.
Step 3. Test Your Hypothesis and Collect Data
Once you have a solid hypothesis, the next step of the scientific method is to put this hunch to the test by collecting data. The exact methods used to investigate a hypothesis depend on exactly what is being studied. There are two basic forms of research that a psychologist might utilize: descriptive research or experimental research.
Descriptive research is typically used when it would be difficult or even impossible to manipulate the variables in question. Examples of descriptive research include case studies, naturalistic observation , and correlation studies. Phone surveys that are often used by marketers are one example of descriptive research.
Correlational studies are quite common in psychology research. While they do not allow researchers to determine cause-and-effect, they do make it possible to spot relationships between different variables and to measure the strength of those relationships.
Experimental research is used to explore cause-and-effect relationships between two or more variables. This type of research involves systematically manipulating an independent variable and then measuring the effect that it has on a defined dependent variable .
One of the major advantages of this method is that it allows researchers to actually determine if changes in one variable actually cause changes in another.
While psychology experiments are often quite complex, a simple experiment is fairly basic but does allow researchers to determine cause-and-effect relationships between variables. Most simple experiments use a control group (those who do not receive the treatment) and an experimental group (those who do receive the treatment).
Step 4. Examine the Results and Draw Conclusions
Once a researcher has designed the study and collected the data, it is time to examine this information and draw conclusions about what has been found. Using statistics , researchers can summarize the data, analyze the results, and draw conclusions based on this evidence.
So how does a researcher decide what the results of a study mean? Not only can statistical analysis support (or refute) the researcher’s hypothesis; it can also be used to determine if the findings are statistically significant.
When results are said to be statistically significant, it means that it is unlikely that these results are due to chance.
Based on these observations, researchers must then determine what the results mean. In some cases, an experiment will support a hypothesis, but in other cases, it will fail to support the hypothesis.
So what happens if the results of a psychology experiment do not support the researcher's hypothesis? Does this mean that the study was worthless?
Just because the findings fail to support the hypothesis does not mean that the research is not useful or informative. In fact, such research plays an important role in helping scientists develop new questions and hypotheses to explore in the future.
After conclusions have been drawn, the next step is to share the results with the rest of the scientific community. This is an important part of the process because it contributes to the overall knowledge base and can help other scientists find new research avenues to explore.
Step 5. Report the Results
The final step in a psychology study is to report the findings. This is often done by writing up a description of the study and publishing the article in an academic or professional journal. The results of psychological studies can be seen in peer-reviewed journals such as Psychological Bulletin , the Journal of Social Psychology , Developmental Psychology , and many others.
The structure of a journal article follows a specified format that has been outlined by the American Psychological Association (APA) . In these articles, researchers:
- Provide a brief history and background on previous research
- Present their hypothesis
- Identify who participated in the study and how they were selected
- Provide operational definitions for each variable
- Describe the measures and procedures that were used to collect data
- Explain how the information collected was analyzed
- Discuss what the results mean
Why is such a detailed record of a psychological study so important? By clearly explaining the steps and procedures used throughout the study, other researchers can then replicate the results. The editorial process employed by academic and professional journals ensures that each article that is submitted undergoes a thorough peer review, which helps ensure that the study is scientifically sound.
Once published, the study becomes another piece of the existing puzzle of our knowledge base on that topic.
Before you begin exploring the scientific method steps, here's a review of some key terms and definitions that you should be familiar with:
- Falsifiable : The variables can be measured so that if a hypothesis is false, it can be proven false
- Hypothesis : An educated guess about the possible relationship between two or more variables
- Variable : A factor or element that can change in observable and measurable ways
- Operational definition : A full description of exactly how variables are defined, how they will be manipulated, and how they will be measured
Uses for the Scientific Method
The goals of psychological studies are to describe, explain, predict and perhaps influence mental processes or behaviors. In order to do this, psychologists utilize the scientific method to conduct psychological research. The scientific method is a set of principles and procedures that are used by researchers to develop questions, collect data, and reach conclusions.
Goals of Scientific Research in Psychology
Researchers seek not only to describe behaviors and explain why these behaviors occur; they also strive to create research that can be used to predict and even change human behavior.
Psychologists and other social scientists regularly propose explanations for human behavior. On a more informal level, people make judgments about the intentions, motivations , and actions of others on a daily basis.
While the everyday judgments we make about human behavior are subjective and anecdotal, researchers use the scientific method to study psychology in an objective and systematic way. The results of these studies are often reported in popular media, which leads many to wonder just how or why researchers arrived at the conclusions they did.
Examples of the Scientific Method
Now that you're familiar with the scientific method steps, it's useful to see how each step could work with a real-life example.
Say, for instance, that researchers set out to discover what the relationship is between psychotherapy and anxiety .
- Step 1. Make an observation : The researchers choose to focus their study on adults ages 25 to 40 with generalized anxiety disorder.
- Step 2. Ask a question : The question they want to answer in their study is: Do weekly psychotherapy sessions reduce symptoms in adults ages 25 to 40 with generalized anxiety disorder?
- Step 3. Test your hypothesis : Researchers collect data on participants' anxiety symptoms . They work with therapists to create a consistent program that all participants undergo. Group 1 may attend therapy once per week, whereas group 2 does not attend therapy.
- Step 4. Examine the results : Participants record their symptoms and any changes over a period of three months. After this period, people in group 1 report significant improvements in their anxiety symptoms, whereas those in group 2 report no significant changes.
- Step 5. Report the results : Researchers write a report that includes their hypothesis, information on participants, variables, procedure, and conclusions drawn from the study. In this case, they say that "Weekly therapy sessions are shown to reduce anxiety symptoms in adults ages 25 to 40."
Of course, there are many details that go into planning and executing a study such as this. But this general outline gives you an idea of how an idea is formulated and tested, and how researchers arrive at results using the scientific method.
Erol A. How to conduct scientific research ? Noro Psikiyatr Ars . 2017;54(2):97-98. doi:10.5152/npa.2017.0120102
University of Minnesota. Psychologists use the scientific method to guide their research .
Shaughnessy, JJ, Zechmeister, EB, & Zechmeister, JS. Research Methods In Psychology . New York: McGraw Hill Education; 2015.
By Kendra Cherry, MSEd Kendra Cherry, MS, is a psychosocial rehabilitation specialist, psychology educator, and author of the "Everything Psychology Book."
When you choose to publish with PLOS, your research makes an impact. Make your work accessible to all, without restrictions, and accelerate scientific discovery with options like preprints and published peer review that make your work more Open.
- PLOS Biology
- PLOS Climate
- PLOS Complex Systems
- PLOS Computational Biology
- PLOS Digital Health
- PLOS Genetics
- PLOS Global Public Health
- PLOS Medicine
- PLOS Mental Health
- PLOS Neglected Tropical Diseases
- PLOS Pathogens
- PLOS Sustainability and Transformation
- PLOS Collections
- About This Blog
- Official PLOS Blog
- EveryONE Blog
- Speaking of Medicine
- PLOS Biologue
- Absolutely Maybe
- DNA Science
- PLOS ECR Community
- All Models Are Wrong
- About PLOS Blogs
A Guide to Using the Scientific Method in Everyday Life

The scientific method —the process used by scientists to understand the natural world—has the merit of investigating natural phenomena in a rigorous manner. Working from hypotheses, scientists draw conclusions based on empirical data. These data are validated on large-scale numbers and take into consideration the intrinsic variability of the real world. For people unfamiliar with its intrinsic jargon and formalities, science may seem esoteric. And this is a huge problem: science invites criticism because it is not easily understood. So why is it important, then, that every person understand how science is done?
Because the scientific method is, first of all, a matter of logical reasoning and only afterwards, a procedure to be applied in a laboratory.
Individuals without training in logical reasoning are more easily victims of distorted perspectives about themselves and the world. An example is represented by the so-called “ cognitive biases ”—systematic mistakes that individuals make when they try to think rationally, and which lead to erroneous or inaccurate conclusions. People can easily overestimate the relevance of their own behaviors and choices. They can lack the ability to self-estimate the quality of their performances and thoughts . Unconsciously, they could even end up selecting only the arguments that support their hypothesis or beliefs . This is why the scientific framework should be conceived not only as a mechanism for understanding the natural world, but also as a framework for engaging in logical reasoning and discussion.
A brief history of the scientific method
The scientific method has its roots in the sixteenth and seventeenth centuries. Philosophers Francis Bacon and René Descartes are often credited with formalizing the scientific method because they contrasted the idea that research should be guided by metaphysical pre-conceived concepts of the nature of reality—a position that, at the time, was highly supported by their colleagues . In essence, Bacon thought that inductive reasoning based on empirical observation was critical to the formulation of hypotheses and the generation of new understanding : general or universal principles describing how nature works are derived only from observations of recurring phenomena and data recorded from them. The inductive method was used, for example, by the scientist Rudolf Virchow to formulate the third principle of the notorious cell theory , according to which every cell derives from a pre-existing one. The rationale behind this conclusion is that because all observations of cell behavior show that cells are only derived from other cells, this assertion must be always true.
Inductive reasoning, however, is not immune to mistakes and limitations. Referring back to cell theory, there may be rare occasions in which a cell does not arise from a pre-existing one, even though we haven’t observed it yet—our observations on cell behavior, although numerous, can still benefit from additional observations to either refute or support the conclusion that all cells arise from pre-existing ones. And this is where limited observations can lead to erroneous conclusions reasoned inductively. In another example, if one never has seen a swan that is not white, they might conclude that all swans are white, even when we know that black swans do exist, however rare they may be.
The universally accepted scientific method, as it is used in science laboratories today, is grounded in hypothetico-deductive reasoning . Research progresses via iterative empirical testing of formulated, testable hypotheses (formulated through inductive reasoning). A testable hypothesis is one that can be rejected (falsified) by empirical observations, a concept known as the principle of falsification . Initially, ideas and conjectures are formulated. Experiments are then performed to test them. If the body of evidence fails to reject the hypothesis, the hypothesis stands. It stands however until and unless another (even singular) empirical observation falsifies it. However, just as with inductive reasoning, hypothetico-deductive reasoning is not immune to pitfalls—assumptions built into hypotheses can be shown to be false, thereby nullifying previously unrejected hypotheses. The bottom line is that science does not work to prove anything about the natural world. Instead, it builds hypotheses that explain the natural world and then attempts to find the hole in the reasoning (i.e., it works to disprove things about the natural world).
How do scientists test hypotheses?
Controlled experiments
The word “experiment” can be misleading because it implies a lack of control over the process. Therefore, it is important to understand that science uses controlled experiments in order to test hypotheses and contribute new knowledge. So what exactly is a controlled experiment, then?
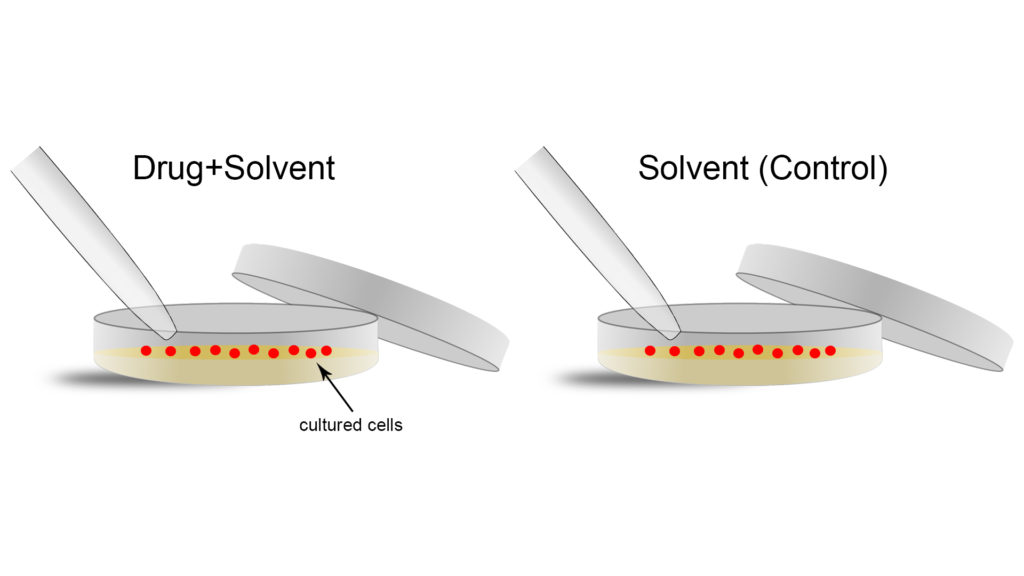
Let us take a practical example. Our starting hypothesis is the following: we have a novel drug that we think inhibits the division of cells, meaning that it prevents one cell from dividing into two cells (recall the description of cell theory above). To test this hypothesis, we could treat some cells with the drug on a plate that contains nutrients and fuel required for their survival and division (a standard cell biology assay). If the drug works as expected, the cells should stop dividing. This type of drug might be useful, for example, in treating cancers because slowing or stopping the division of cells would result in the slowing or stopping of tumor growth.
Although this experiment is relatively easy to do, the mere process of doing science means that several experimental variables (like temperature of the cells or drug, dosage, and so on) could play a major role in the experiment. This could result in a failed experiment when the drug actually does work, or it could give the appearance that the drug is working when it is not. Given that these variables cannot be eliminated, scientists always run control experiments in parallel to the real ones, so that the effects of these other variables can be determined. Control experiments are designed so that all variables, with the exception of the one under investigation, are kept constant. In simple terms, the conditions must be identical between the control and the actual experiment.
Coming back to our example, when a drug is administered it is not pure. Often, it is dissolved in a solvent like water or oil. Therefore, the perfect control to the actual experiment would be to administer pure solvent (without the added drug) at the same time and with the same tools, where all other experimental variables (like temperature, as mentioned above) are the same between the two (Figure 1). Any difference in effect on cell division in the actual experiment here can be attributed to an effect of the drug because the effects of the solvent were controlled.
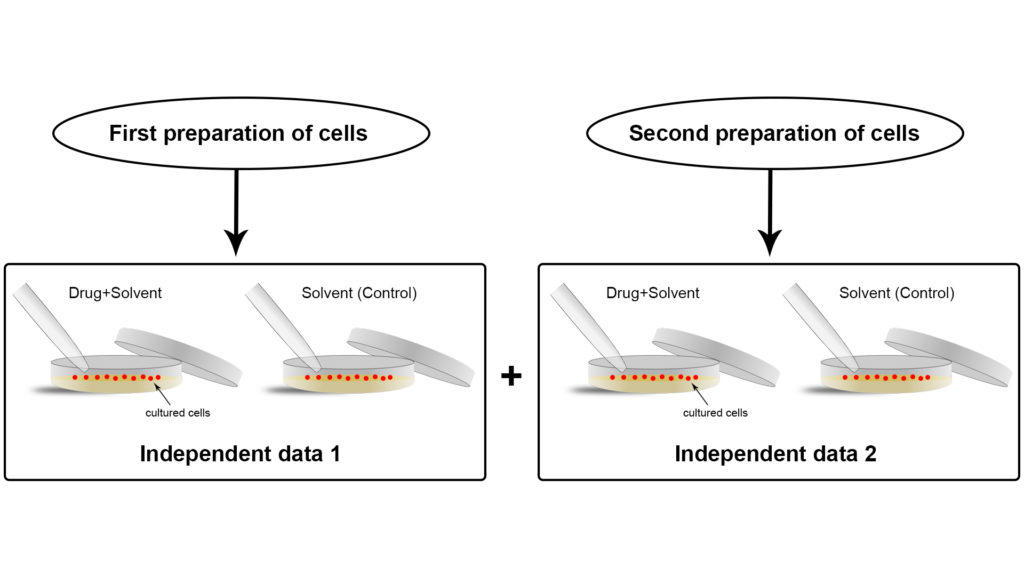
In order to provide evidence of the quality of a single, specific experiment, it needs to be performed multiple times in the same experimental conditions. We call these multiple experiments “replicates” of the experiment (Figure 2). The more replicates of the same experiment, the more confident the scientist can be about the conclusions of that experiment under the given conditions. However, multiple replicates under the same experimental conditions are of no help when scientists aim at acquiring more empirical evidence to support their hypothesis. Instead, they need independent experiments (Figure 3), in their own lab and in other labs across the world, to validate their results.

Often times, especially when a given experiment has been repeated and its outcome is not fully clear, it is better to find alternative experimental assays to test the hypothesis.
Applying the scientific approach to everyday life
So, what can we take from the scientific approach to apply to our everyday lives?
A few weeks ago, I had an agitated conversation with a bunch of friends concerning the following question: What is the definition of intelligence?
Defining “intelligence” is not easy. At the beginning of the conversation, everybody had a different, “personal” conception of intelligence in mind, which – tacitly – implied that the conversation could have taken several different directions. We realized rather soon that someone thought that an intelligent person is whoever is able to adapt faster to new situations; someone else thought that an intelligent person is whoever is able to deal with other people and empathize with them. Personally, I thought that an intelligent person is whoever displays high cognitive skills, especially in abstract reasoning.
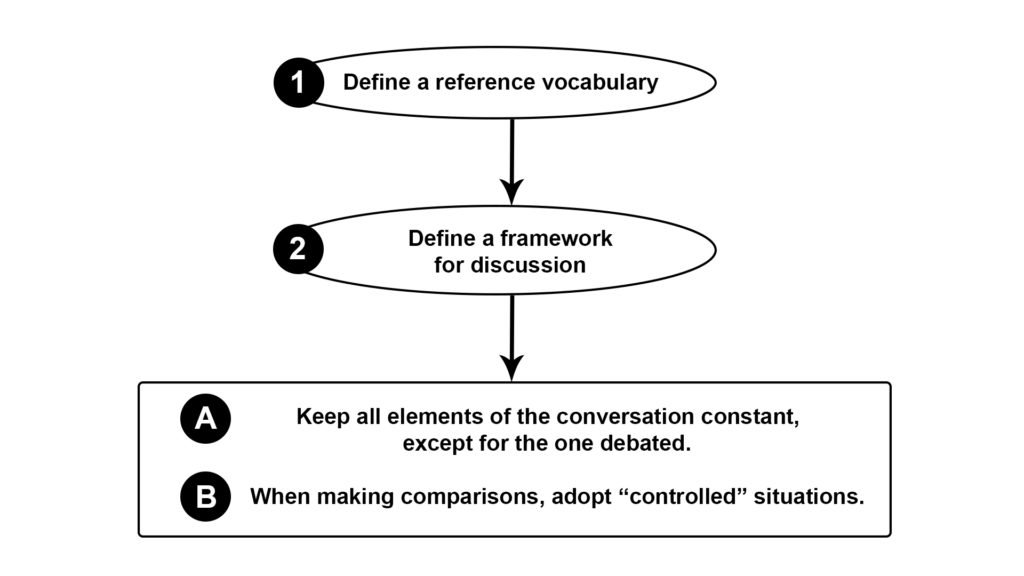
The scientific method has the merit of providing a reference system, with precise protocols and rules to follow. Remember: experiments must be reproducible, which means that an independent scientists in a different laboratory, when provided with the same equipment and protocols, should get comparable results. Fruitful conversations as well need precise language, a kind of reference vocabulary everybody should agree upon, in order to discuss about the same “content”. This is something we often forget, something that was somehow missing at the opening of the aforementioned conversation: even among friends, we should always agree on premises, and define them in a rigorous manner, so that they are the same for everybody. When speaking about “intelligence”, we must all make sure we understand meaning and context of the vocabulary adopted in the debate (Figure 4, point 1). This is the first step of “controlling” a conversation.
There is another downside that a discussion well-grounded in a scientific framework would avoid. The mistake is not structuring the debate so that all its elements, except for the one under investigation, are kept constant (Figure 4, point 2). This is particularly true when people aim at making comparisons between groups to support their claim. For example, they may try to define what intelligence is by comparing the achievements in life of different individuals: “Stephen Hawking is a brilliant example of intelligence because of his great contribution to the physics of black holes”. This statement does not help to define what intelligence is, simply because it compares Stephen Hawking, a famous and exceptional physicist, to any other person, who statistically speaking, knows nothing about physics. Hawking first went to the University of Oxford, then he moved to the University of Cambridge. He was in contact with the most influential physicists on Earth. Other people were not. All of this, of course, does not disprove Hawking’s intelligence; but from a logical and methodological point of view, given the multitude of variables included in this comparison, it cannot prove it. Thus, the sentence “Stephen Hawking is a brilliant example of intelligence because of his great contribution to the physics of black holes” is not a valid argument to describe what intelligence is. If we really intend to approximate a definition of intelligence, Steven Hawking should be compared to other physicists, even better if they were Hawking’s classmates at the time of college, and colleagues afterwards during years of academic research.
In simple terms, as scientists do in the lab, while debating we should try to compare groups of elements that display identical, or highly similar, features. As previously mentioned, all variables – except for the one under investigation – must be kept constant.
This insightful piece presents a detailed analysis of how and why science can help to develop critical thinking.
In a nutshell
Here is how to approach a daily conversation in a rigorous, scientific manner:
- First discuss about the reference vocabulary, then discuss about the content of the discussion. Think about a researcher who is writing down an experimental protocol that will be used by thousands of other scientists in varying continents. If the protocol is rigorously written, all scientists using it should get comparable experimental outcomes. In science this means reproducible knowledge, in daily life this means fruitful conversations in which individuals are on the same page.
- Adopt “controlled” arguments to support your claims. When making comparisons between groups, visualize two blank scenarios. As you start to add details to both of them, you have two options. If your aim is to hide a specific detail, the better is to design the two scenarios in a completely different manner—it is to increase the variables. But if your intention is to help the observer to isolate a specific detail, the better is to design identical scenarios, with the exception of the intended detail—it is therefore to keep most of the variables constant. This is precisely how scientists ideate adequate experiments to isolate new pieces of knowledge, and how individuals should orchestrate their thoughts in order to test them and facilitate their comprehension to others.
Not only the scientific method should offer individuals an elitist way to investigate reality, but also an accessible tool to properly reason and discuss about it.
Edited by Jason Organ, PhD, Indiana University School of Medicine.

Simone is a molecular biologist on the verge of obtaining a doctoral title at the University of Ulm, Germany. He is Vice-Director at Culturico (https://culturico.com/), where his writings span from Literature to Sociology, from Philosophy to Science. His writings recently appeared in Psychology Today, openDemocracy, Splice Today, Merion West, Uncommon Ground and The Society Pages. Follow Simone on Twitter: @simredaelli
- Pingback: Case Studies in Ethical Thinking: Day 1 | Education & Erudition
This has to be the best article I have ever read on Scientific Thinking. I am presently writing a treatise on how Scientific thinking can be adopted to entreat all situations.And how, a 4 year old child can be taught to adopt Scientific thinking, so that, the child can look at situations that bothers her and she could try to think about that situation by formulating the right questions. She may not have the tools to find right answers? But, forming questions by using right technique ? May just make her find a way to put her mind to rest even at that level. That is why, 4 year olds are often “eerily: (!)intelligent, I have iften been intimidated and plain embarrassed to see an intelligent and well spoken 4 year old deal with celibrity ! Of course, there are a lot of variables that have to be kept in mind in order to train children in such controlled thinking environment, as the screenplay of little Sheldon shows. Thanking the author with all my heart – #ershadspeak #wearescience #weareallscientists Ershad Khandker
Simone, thank you for this article. I have the idea that I want to apply what I learned in Biology to everyday life. You addressed this issue, and have given some basic steps in using the scientific method.
Leave a Reply Cancel reply
Your email address will not be published. Required fields are marked *
Save my name and email for the next time I comment.
By Ashley Moses, edited by Andrew S. Cale Each year, millions of scientific research papers are published. Virtually none of them can…
By Ana Santos-Carvalho and Carolina Lebre, edited by Andrew S. Cale Excessive use of technical jargon can be a significant barrier to…
By Ryan McRae and Briana Pobiner, edited by Andrew S. Cale In 2023, the field of human evolution benefited from a plethora…

- Table of Contents
- Random Entry
- Chronological
- Editorial Information
- About the SEP
- Editorial Board
- How to Cite the SEP
- Special Characters
- Advanced Tools
- Support the SEP
- PDFs for SEP Friends
- Make a Donation
- SEPIA for Libraries
- Entry Contents
Bibliography
Academic tools.
- Friends PDF Preview
- Author and Citation Info
- Back to Top
Scientific Method
Science is an enormously successful human enterprise. The study of scientific method is the attempt to discern the activities by which that success is achieved. Among the activities often identified as characteristic of science are systematic observation and experimentation, inductive and deductive reasoning, and the formation and testing of hypotheses and theories. How these are carried out in detail can vary greatly, but characteristics like these have been looked to as a way of demarcating scientific activity from non-science, where only enterprises which employ some canonical form of scientific method or methods should be considered science (see also the entry on science and pseudo-science ). Others have questioned whether there is anything like a fixed toolkit of methods which is common across science and only science. Some reject privileging one view of method as part of rejecting broader views about the nature of science, such as naturalism (Dupré 2004); some reject any restriction in principle (pluralism).
Scientific method should be distinguished from the aims and products of science, such as knowledge, predictions, or control. Methods are the means by which those goals are achieved. Scientific method should also be distinguished from meta-methodology, which includes the values and justifications behind a particular characterization of scientific method (i.e., a methodology) — values such as objectivity, reproducibility, simplicity, or past successes. Methodological rules are proposed to govern method and it is a meta-methodological question whether methods obeying those rules satisfy given values. Finally, method is distinct, to some degree, from the detailed and contextual practices through which methods are implemented. The latter might range over: specific laboratory techniques; mathematical formalisms or other specialized languages used in descriptions and reasoning; technological or other material means; ways of communicating and sharing results, whether with other scientists or with the public at large; or the conventions, habits, enforced customs, and institutional controls over how and what science is carried out.
While it is important to recognize these distinctions, their boundaries are fuzzy. Hence, accounts of method cannot be entirely divorced from their methodological and meta-methodological motivations or justifications, Moreover, each aspect plays a crucial role in identifying methods. Disputes about method have therefore played out at the detail, rule, and meta-rule levels. Changes in beliefs about the certainty or fallibility of scientific knowledge, for instance (which is a meta-methodological consideration of what we can hope for methods to deliver), have meant different emphases on deductive and inductive reasoning, or on the relative importance attached to reasoning over observation (i.e., differences over particular methods.) Beliefs about the role of science in society will affect the place one gives to values in scientific method.
The issue which has shaped debates over scientific method the most in the last half century is the question of how pluralist do we need to be about method? Unificationists continue to hold out for one method essential to science; nihilism is a form of radical pluralism, which considers the effectiveness of any methodological prescription to be so context sensitive as to render it not explanatory on its own. Some middle degree of pluralism regarding the methods embodied in scientific practice seems appropriate. But the details of scientific practice vary with time and place, from institution to institution, across scientists and their subjects of investigation. How significant are the variations for understanding science and its success? How much can method be abstracted from practice? This entry describes some of the attempts to characterize scientific method or methods, as well as arguments for a more context-sensitive approach to methods embedded in actual scientific practices.
1. Overview and organizing themes
2. historical review: aristotle to mill, 3.1 logical constructionism and operationalism, 3.2. h-d as a logic of confirmation, 3.3. popper and falsificationism, 3.4 meta-methodology and the end of method, 4. statistical methods for hypothesis testing, 5.1 creative and exploratory practices.
- 5.2 Computer methods and the ‘new ways’ of doing science
6.1 “The scientific method” in science education and as seen by scientists
6.2 privileged methods and ‘gold standards’, 6.3 scientific method in the court room, 6.4 deviating practices, 7. conclusion, other internet resources, related entries.
This entry could have been given the title Scientific Methods and gone on to fill volumes, or it could have been extremely short, consisting of a brief summary rejection of the idea that there is any such thing as a unique Scientific Method at all. Both unhappy prospects are due to the fact that scientific activity varies so much across disciplines, times, places, and scientists that any account which manages to unify it all will either consist of overwhelming descriptive detail, or trivial generalizations.
The choice of scope for the present entry is more optimistic, taking a cue from the recent movement in philosophy of science toward a greater attention to practice: to what scientists actually do. This “turn to practice” can be seen as the latest form of studies of methods in science, insofar as it represents an attempt at understanding scientific activity, but through accounts that are neither meant to be universal and unified, nor singular and narrowly descriptive. To some extent, different scientists at different times and places can be said to be using the same method even though, in practice, the details are different.
Whether the context in which methods are carried out is relevant, or to what extent, will depend largely on what one takes the aims of science to be and what one’s own aims are. For most of the history of scientific methodology the assumption has been that the most important output of science is knowledge and so the aim of methodology should be to discover those methods by which scientific knowledge is generated.
Science was seen to embody the most successful form of reasoning (but which form?) to the most certain knowledge claims (but how certain?) on the basis of systematically collected evidence (but what counts as evidence, and should the evidence of the senses take precedence, or rational insight?) Section 2 surveys some of the history, pointing to two major themes. One theme is seeking the right balance between observation and reasoning (and the attendant forms of reasoning which employ them); the other is how certain scientific knowledge is or can be.
Section 3 turns to 20 th century debates on scientific method. In the second half of the 20 th century the epistemic privilege of science faced several challenges and many philosophers of science abandoned the reconstruction of the logic of scientific method. Views changed significantly regarding which functions of science ought to be captured and why. For some, the success of science was better identified with social or cultural features. Historical and sociological turns in the philosophy of science were made, with a demand that greater attention be paid to the non-epistemic aspects of science, such as sociological, institutional, material, and political factors. Even outside of those movements there was an increased specialization in the philosophy of science, with more and more focus on specific fields within science. The combined upshot was very few philosophers arguing any longer for a grand unified methodology of science. Sections 3 and 4 surveys the main positions on scientific method in 20 th century philosophy of science, focusing on where they differ in their preference for confirmation or falsification or for waiving the idea of a special scientific method altogether.
In recent decades, attention has primarily been paid to scientific activities traditionally falling under the rubric of method, such as experimental design and general laboratory practice, the use of statistics, the construction and use of models and diagrams, interdisciplinary collaboration, and science communication. Sections 4–6 attempt to construct a map of the current domains of the study of methods in science.
As these sections illustrate, the question of method is still central to the discourse about science. Scientific method remains a topic for education, for science policy, and for scientists. It arises in the public domain where the demarcation or status of science is at issue. Some philosophers have recently returned, therefore, to the question of what it is that makes science a unique cultural product. This entry will close with some of these recent attempts at discerning and encapsulating the activities by which scientific knowledge is achieved.
Attempting a history of scientific method compounds the vast scope of the topic. This section briefly surveys the background to modern methodological debates. What can be called the classical view goes back to antiquity, and represents a point of departure for later divergences. [ 1 ]
We begin with a point made by Laudan (1968) in his historical survey of scientific method:
Perhaps the most serious inhibition to the emergence of the history of theories of scientific method as a respectable area of study has been the tendency to conflate it with the general history of epistemology, thereby assuming that the narrative categories and classificatory pigeon-holes applied to the latter are also basic to the former. (1968: 5)
To see knowledge about the natural world as falling under knowledge more generally is an understandable conflation. Histories of theories of method would naturally employ the same narrative categories and classificatory pigeon holes. An important theme of the history of epistemology, for example, is the unification of knowledge, a theme reflected in the question of the unification of method in science. Those who have identified differences in kinds of knowledge have often likewise identified different methods for achieving that kind of knowledge (see the entry on the unity of science ).
Different views on what is known, how it is known, and what can be known are connected. Plato distinguished the realms of things into the visible and the intelligible ( The Republic , 510a, in Cooper 1997). Only the latter, the Forms, could be objects of knowledge. The intelligible truths could be known with the certainty of geometry and deductive reasoning. What could be observed of the material world, however, was by definition imperfect and deceptive, not ideal. The Platonic way of knowledge therefore emphasized reasoning as a method, downplaying the importance of observation. Aristotle disagreed, locating the Forms in the natural world as the fundamental principles to be discovered through the inquiry into nature ( Metaphysics Z , in Barnes 1984).
Aristotle is recognized as giving the earliest systematic treatise on the nature of scientific inquiry in the western tradition, one which embraced observation and reasoning about the natural world. In the Prior and Posterior Analytics , Aristotle reflects first on the aims and then the methods of inquiry into nature. A number of features can be found which are still considered by most to be essential to science. For Aristotle, empiricism, careful observation (but passive observation, not controlled experiment), is the starting point. The aim is not merely recording of facts, though. For Aristotle, science ( epistêmê ) is a body of properly arranged knowledge or learning—the empirical facts, but also their ordering and display are of crucial importance. The aims of discovery, ordering, and display of facts partly determine the methods required of successful scientific inquiry. Also determinant is the nature of the knowledge being sought, and the explanatory causes proper to that kind of knowledge (see the discussion of the four causes in the entry on Aristotle on causality ).
In addition to careful observation, then, scientific method requires a logic as a system of reasoning for properly arranging, but also inferring beyond, what is known by observation. Methods of reasoning may include induction, prediction, or analogy, among others. Aristotle’s system (along with his catalogue of fallacious reasoning) was collected under the title the Organon . This title would be echoed in later works on scientific reasoning, such as Novum Organon by Francis Bacon, and Novum Organon Restorum by William Whewell (see below). In Aristotle’s Organon reasoning is divided primarily into two forms, a rough division which persists into modern times. The division, known most commonly today as deductive versus inductive method, appears in other eras and methodologies as analysis/synthesis, non-ampliative/ampliative, or even confirmation/verification. The basic idea is there are two “directions” to proceed in our methods of inquiry: one away from what is observed, to the more fundamental, general, and encompassing principles; the other, from the fundamental and general to instances or implications of principles.
The basic aim and method of inquiry identified here can be seen as a theme running throughout the next two millennia of reflection on the correct way to seek after knowledge: carefully observe nature and then seek rules or principles which explain or predict its operation. The Aristotelian corpus provided the framework for a commentary tradition on scientific method independent of science itself (cosmos versus physics.) During the medieval period, figures such as Albertus Magnus (1206–1280), Thomas Aquinas (1225–1274), Robert Grosseteste (1175–1253), Roger Bacon (1214/1220–1292), William of Ockham (1287–1347), Andreas Vesalius (1514–1546), Giacomo Zabarella (1533–1589) all worked to clarify the kind of knowledge obtainable by observation and induction, the source of justification of induction, and best rules for its application. [ 2 ] Many of their contributions we now think of as essential to science (see also Laudan 1968). As Aristotle and Plato had employed a framework of reasoning either “to the forms” or “away from the forms”, medieval thinkers employed directions away from the phenomena or back to the phenomena. In analysis, a phenomena was examined to discover its basic explanatory principles; in synthesis, explanations of a phenomena were constructed from first principles.
During the Scientific Revolution these various strands of argument, experiment, and reason were forged into a dominant epistemic authority. The 16 th –18 th centuries were a period of not only dramatic advance in knowledge about the operation of the natural world—advances in mechanical, medical, biological, political, economic explanations—but also of self-awareness of the revolutionary changes taking place, and intense reflection on the source and legitimation of the method by which the advances were made. The struggle to establish the new authority included methodological moves. The Book of Nature, according to the metaphor of Galileo Galilei (1564–1642) or Francis Bacon (1561–1626), was written in the language of mathematics, of geometry and number. This motivated an emphasis on mathematical description and mechanical explanation as important aspects of scientific method. Through figures such as Henry More and Ralph Cudworth, a neo-Platonic emphasis on the importance of metaphysical reflection on nature behind appearances, particularly regarding the spiritual as a complement to the purely mechanical, remained an important methodological thread of the Scientific Revolution (see the entries on Cambridge platonists ; Boyle ; Henry More ; Galileo ).
In Novum Organum (1620), Bacon was critical of the Aristotelian method for leaping from particulars to universals too quickly. The syllogistic form of reasoning readily mixed those two types of propositions. Bacon aimed at the invention of new arts, principles, and directions. His method would be grounded in methodical collection of observations, coupled with correction of our senses (and particularly, directions for the avoidance of the Idols, as he called them, kinds of systematic errors to which naïve observers are prone.) The community of scientists could then climb, by a careful, gradual and unbroken ascent, to reliable general claims.
Bacon’s method has been criticized as impractical and too inflexible for the practicing scientist. Whewell would later criticize Bacon in his System of Logic for paying too little attention to the practices of scientists. It is hard to find convincing examples of Bacon’s method being put in to practice in the history of science, but there are a few who have been held up as real examples of 16 th century scientific, inductive method, even if not in the rigid Baconian mold: figures such as Robert Boyle (1627–1691) and William Harvey (1578–1657) (see the entry on Bacon ).
It is to Isaac Newton (1642–1727), however, that historians of science and methodologists have paid greatest attention. Given the enormous success of his Principia Mathematica and Opticks , this is understandable. The study of Newton’s method has had two main thrusts: the implicit method of the experiments and reasoning presented in the Opticks, and the explicit methodological rules given as the Rules for Philosophising (the Regulae) in Book III of the Principia . [ 3 ] Newton’s law of gravitation, the linchpin of his new cosmology, broke with explanatory conventions of natural philosophy, first for apparently proposing action at a distance, but more generally for not providing “true”, physical causes. The argument for his System of the World ( Principia , Book III) was based on phenomena, not reasoned first principles. This was viewed (mainly on the continent) as insufficient for proper natural philosophy. The Regulae counter this objection, re-defining the aims of natural philosophy by re-defining the method natural philosophers should follow. (See the entry on Newton’s philosophy .)
To his list of methodological prescriptions should be added Newton’s famous phrase “ hypotheses non fingo ” (commonly translated as “I frame no hypotheses”.) The scientist was not to invent systems but infer explanations from observations, as Bacon had advocated. This would come to be known as inductivism. In the century after Newton, significant clarifications of the Newtonian method were made. Colin Maclaurin (1698–1746), for instance, reconstructed the essential structure of the method as having complementary analysis and synthesis phases, one proceeding away from the phenomena in generalization, the other from the general propositions to derive explanations of new phenomena. Denis Diderot (1713–1784) and editors of the Encyclopédie did much to consolidate and popularize Newtonianism, as did Francesco Algarotti (1721–1764). The emphasis was often the same, as much on the character of the scientist as on their process, a character which is still commonly assumed. The scientist is humble in the face of nature, not beholden to dogma, obeys only his eyes, and follows the truth wherever it leads. It was certainly Voltaire (1694–1778) and du Chatelet (1706–1749) who were most influential in propagating the latter vision of the scientist and their craft, with Newton as hero. Scientific method became a revolutionary force of the Enlightenment. (See also the entries on Newton , Leibniz , Descartes , Boyle , Hume , enlightenment , as well as Shank 2008 for a historical overview.)
Not all 18 th century reflections on scientific method were so celebratory. Famous also are George Berkeley’s (1685–1753) attack on the mathematics of the new science, as well as the over-emphasis of Newtonians on observation; and David Hume’s (1711–1776) undermining of the warrant offered for scientific claims by inductive justification (see the entries on: George Berkeley ; David Hume ; Hume’s Newtonianism and Anti-Newtonianism ). Hume’s problem of induction motivated Immanuel Kant (1724–1804) to seek new foundations for empirical method, though as an epistemic reconstruction, not as any set of practical guidelines for scientists. Both Hume and Kant influenced the methodological reflections of the next century, such as the debate between Mill and Whewell over the certainty of inductive inferences in science.
The debate between John Stuart Mill (1806–1873) and William Whewell (1794–1866) has become the canonical methodological debate of the 19 th century. Although often characterized as a debate between inductivism and hypothetico-deductivism, the role of the two methods on each side is actually more complex. On the hypothetico-deductive account, scientists work to come up with hypotheses from which true observational consequences can be deduced—hence, hypothetico-deductive. Because Whewell emphasizes both hypotheses and deduction in his account of method, he can be seen as a convenient foil to the inductivism of Mill. However, equally if not more important to Whewell’s portrayal of scientific method is what he calls the “fundamental antithesis”. Knowledge is a product of the objective (what we see in the world around us) and subjective (the contributions of our mind to how we perceive and understand what we experience, which he called the Fundamental Ideas). Both elements are essential according to Whewell, and he was therefore critical of Kant for too much focus on the subjective, and John Locke (1632–1704) and Mill for too much focus on the senses. Whewell’s fundamental ideas can be discipline relative. An idea can be fundamental even if it is necessary for knowledge only within a given scientific discipline (e.g., chemical affinity for chemistry). This distinguishes fundamental ideas from the forms and categories of intuition of Kant. (See the entry on Whewell .)
Clarifying fundamental ideas would therefore be an essential part of scientific method and scientific progress. Whewell called this process “Discoverer’s Induction”. It was induction, following Bacon or Newton, but Whewell sought to revive Bacon’s account by emphasising the role of ideas in the clear and careful formulation of inductive hypotheses. Whewell’s induction is not merely the collecting of objective facts. The subjective plays a role through what Whewell calls the Colligation of Facts, a creative act of the scientist, the invention of a theory. A theory is then confirmed by testing, where more facts are brought under the theory, called the Consilience of Inductions. Whewell felt that this was the method by which the true laws of nature could be discovered: clarification of fundamental concepts, clever invention of explanations, and careful testing. Mill, in his critique of Whewell, and others who have cast Whewell as a fore-runner of the hypothetico-deductivist view, seem to have under-estimated the importance of this discovery phase in Whewell’s understanding of method (Snyder 1997a,b, 1999). Down-playing the discovery phase would come to characterize methodology of the early 20 th century (see section 3 ).
Mill, in his System of Logic , put forward a narrower view of induction as the essence of scientific method. For Mill, induction is the search first for regularities among events. Among those regularities, some will continue to hold for further observations, eventually gaining the status of laws. One can also look for regularities among the laws discovered in a domain, i.e., for a law of laws. Which “law law” will hold is time and discipline dependent and open to revision. One example is the Law of Universal Causation, and Mill put forward specific methods for identifying causes—now commonly known as Mill’s methods. These five methods look for circumstances which are common among the phenomena of interest, those which are absent when the phenomena are, or those for which both vary together. Mill’s methods are still seen as capturing basic intuitions about experimental methods for finding the relevant explanatory factors ( System of Logic (1843), see Mill entry). The methods advocated by Whewell and Mill, in the end, look similar. Both involve inductive generalization to covering laws. They differ dramatically, however, with respect to the necessity of the knowledge arrived at; that is, at the meta-methodological level (see the entries on Whewell and Mill entries).
3. Logic of method and critical responses
The quantum and relativistic revolutions in physics in the early 20 th century had a profound effect on methodology. Conceptual foundations of both theories were taken to show the defeasibility of even the most seemingly secure intuitions about space, time and bodies. Certainty of knowledge about the natural world was therefore recognized as unattainable. Instead a renewed empiricism was sought which rendered science fallible but still rationally justifiable.
Analyses of the reasoning of scientists emerged, according to which the aspects of scientific method which were of primary importance were the means of testing and confirming of theories. A distinction in methodology was made between the contexts of discovery and justification. The distinction could be used as a wedge between the particularities of where and how theories or hypotheses are arrived at, on the one hand, and the underlying reasoning scientists use (whether or not they are aware of it) when assessing theories and judging their adequacy on the basis of the available evidence. By and large, for most of the 20 th century, philosophy of science focused on the second context, although philosophers differed on whether to focus on confirmation or refutation as well as on the many details of how confirmation or refutation could or could not be brought about. By the mid-20 th century these attempts at defining the method of justification and the context distinction itself came under pressure. During the same period, philosophy of science developed rapidly, and from section 4 this entry will therefore shift from a primarily historical treatment of the scientific method towards a primarily thematic one.
Advances in logic and probability held out promise of the possibility of elaborate reconstructions of scientific theories and empirical method, the best example being Rudolf Carnap’s The Logical Structure of the World (1928). Carnap attempted to show that a scientific theory could be reconstructed as a formal axiomatic system—that is, a logic. That system could refer to the world because some of its basic sentences could be interpreted as observations or operations which one could perform to test them. The rest of the theoretical system, including sentences using theoretical or unobservable terms (like electron or force) would then either be meaningful because they could be reduced to observations, or they had purely logical meanings (called analytic, like mathematical identities). This has been referred to as the verifiability criterion of meaning. According to the criterion, any statement not either analytic or verifiable was strictly meaningless. Although the view was endorsed by Carnap in 1928, he would later come to see it as too restrictive (Carnap 1956). Another familiar version of this idea is operationalism of Percy William Bridgman. In The Logic of Modern Physics (1927) Bridgman asserted that every physical concept could be defined in terms of the operations one would perform to verify the application of that concept. Making good on the operationalisation of a concept even as simple as length, however, can easily become enormously complex (for measuring very small lengths, for instance) or impractical (measuring large distances like light years.)
Carl Hempel’s (1950, 1951) criticisms of the verifiability criterion of meaning had enormous influence. He pointed out that universal generalizations, such as most scientific laws, were not strictly meaningful on the criterion. Verifiability and operationalism both seemed too restrictive to capture standard scientific aims and practice. The tenuous connection between these reconstructions and actual scientific practice was criticized in another way. In both approaches, scientific methods are instead recast in methodological roles. Measurements, for example, were looked to as ways of giving meanings to terms. The aim of the philosopher of science was not to understand the methods per se , but to use them to reconstruct theories, their meanings, and their relation to the world. When scientists perform these operations, however, they will not report that they are doing them to give meaning to terms in a formal axiomatic system. This disconnect between methodology and the details of actual scientific practice would seem to violate the empiricism the Logical Positivists and Bridgman were committed to. The view that methodology should correspond to practice (to some extent) has been called historicism, or intuitionism. We turn to these criticisms and responses in section 3.4 . [ 4 ]
Positivism also had to contend with the recognition that a purely inductivist approach, along the lines of Bacon-Newton-Mill, was untenable. There was no pure observation, for starters. All observation was theory laden. Theory is required to make any observation, therefore not all theory can be derived from observation alone. (See the entry on theory and observation in science .) Even granting an observational basis, Hume had already pointed out that one could not deductively justify inductive conclusions without begging the question by presuming the success of the inductive method. Likewise, positivist attempts at analyzing how a generalization can be confirmed by observations of its instances were subject to a number of criticisms. Goodman (1965) and Hempel (1965) both point to paradoxes inherent in standard accounts of confirmation. Recent attempts at explaining how observations can serve to confirm a scientific theory are discussed in section 4 below.
The standard starting point for a non-inductive analysis of the logic of confirmation is known as the Hypothetico-Deductive (H-D) method. In its simplest form, a sentence of a theory which expresses some hypothesis is confirmed by its true consequences. As noted in section 2 , this method had been advanced by Whewell in the 19 th century, as well as Nicod (1924) and others in the 20 th century. Often, Hempel’s (1966) description of the H-D method, illustrated by the case of Semmelweiss’ inferential procedures in establishing the cause of childbed fever, has been presented as a key account of H-D as well as a foil for criticism of the H-D account of confirmation (see, for example, Lipton’s (2004) discussion of inference to the best explanation; also the entry on confirmation ). Hempel described Semmelsweiss’ procedure as examining various hypotheses explaining the cause of childbed fever. Some hypotheses conflicted with observable facts and could be rejected as false immediately. Others needed to be tested experimentally by deducing which observable events should follow if the hypothesis were true (what Hempel called the test implications of the hypothesis), then conducting an experiment and observing whether or not the test implications occurred. If the experiment showed the test implication to be false, the hypothesis could be rejected. If the experiment showed the test implications to be true, however, this did not prove the hypothesis true. The confirmation of a test implication does not verify a hypothesis, though Hempel did allow that “it provides at least some support, some corroboration or confirmation for it” (Hempel 1966: 8). The degree of this support then depends on the quantity, variety and precision of the supporting evidence.
Another approach that took off from the difficulties with inductive inference was Karl Popper’s critical rationalism or falsificationism (Popper 1959, 1963). Falsification is deductive and similar to H-D in that it involves scientists deducing observational consequences from the hypothesis under test. For Popper, however, the important point was not the degree of confirmation that successful prediction offered to a hypothesis. The crucial thing was the logical asymmetry between confirmation, based on inductive inference, and falsification, which can be based on a deductive inference. (This simple opposition was later questioned, by Lakatos, among others. See the entry on historicist theories of scientific rationality. )
Popper stressed that, regardless of the amount of confirming evidence, we can never be certain that a hypothesis is true without committing the fallacy of affirming the consequent. Instead, Popper introduced the notion of corroboration as a measure for how well a theory or hypothesis has survived previous testing—but without implying that this is also a measure for the probability that it is true.
Popper was also motivated by his doubts about the scientific status of theories like the Marxist theory of history or psycho-analysis, and so wanted to demarcate between science and pseudo-science. Popper saw this as an importantly different distinction than demarcating science from metaphysics. The latter demarcation was the primary concern of many logical empiricists. Popper used the idea of falsification to draw a line instead between pseudo and proper science. Science was science because its method involved subjecting theories to rigorous tests which offered a high probability of failing and thus refuting the theory.
A commitment to the risk of failure was important. Avoiding falsification could be done all too easily. If a consequence of a theory is inconsistent with observations, an exception can be added by introducing auxiliary hypotheses designed explicitly to save the theory, so-called ad hoc modifications. This Popper saw done in pseudo-science where ad hoc theories appeared capable of explaining anything in their field of application. In contrast, science is risky. If observations showed the predictions from a theory to be wrong, the theory would be refuted. Hence, scientific hypotheses must be falsifiable. Not only must there exist some possible observation statement which could falsify the hypothesis or theory, were it observed, (Popper called these the hypothesis’ potential falsifiers) it is crucial to the Popperian scientific method that such falsifications be sincerely attempted on a regular basis.
The more potential falsifiers of a hypothesis, the more falsifiable it would be, and the more the hypothesis claimed. Conversely, hypotheses without falsifiers claimed very little or nothing at all. Originally, Popper thought that this meant the introduction of ad hoc hypotheses only to save a theory should not be countenanced as good scientific method. These would undermine the falsifiabililty of a theory. However, Popper later came to recognize that the introduction of modifications (immunizations, he called them) was often an important part of scientific development. Responding to surprising or apparently falsifying observations often generated important new scientific insights. Popper’s own example was the observed motion of Uranus which originally did not agree with Newtonian predictions. The ad hoc hypothesis of an outer planet explained the disagreement and led to further falsifiable predictions. Popper sought to reconcile the view by blurring the distinction between falsifiable and not falsifiable, and speaking instead of degrees of testability (Popper 1985: 41f.).
From the 1960s on, sustained meta-methodological criticism emerged that drove philosophical focus away from scientific method. A brief look at those criticisms follows, with recommendations for further reading at the end of the entry.
Thomas Kuhn’s The Structure of Scientific Revolutions (1962) begins with a well-known shot across the bow for philosophers of science:
History, if viewed as a repository for more than anecdote or chronology, could produce a decisive transformation in the image of science by which we are now possessed. (1962: 1)
The image Kuhn thought needed transforming was the a-historical, rational reconstruction sought by many of the Logical Positivists, though Carnap and other positivists were actually quite sympathetic to Kuhn’s views. (See the entry on the Vienna Circle .) Kuhn shares with other of his contemporaries, such as Feyerabend and Lakatos, a commitment to a more empirical approach to philosophy of science. Namely, the history of science provides important data, and necessary checks, for philosophy of science, including any theory of scientific method.
The history of science reveals, according to Kuhn, that scientific development occurs in alternating phases. During normal science, the members of the scientific community adhere to the paradigm in place. Their commitment to the paradigm means a commitment to the puzzles to be solved and the acceptable ways of solving them. Confidence in the paradigm remains so long as steady progress is made in solving the shared puzzles. Method in this normal phase operates within a disciplinary matrix (Kuhn’s later concept of a paradigm) which includes standards for problem solving, and defines the range of problems to which the method should be applied. An important part of a disciplinary matrix is the set of values which provide the norms and aims for scientific method. The main values that Kuhn identifies are prediction, problem solving, simplicity, consistency, and plausibility.
An important by-product of normal science is the accumulation of puzzles which cannot be solved with resources of the current paradigm. Once accumulation of these anomalies has reached some critical mass, it can trigger a communal shift to a new paradigm and a new phase of normal science. Importantly, the values that provide the norms and aims for scientific method may have transformed in the meantime. Method may therefore be relative to discipline, time or place
Feyerabend also identified the aims of science as progress, but argued that any methodological prescription would only stifle that progress (Feyerabend 1988). His arguments are grounded in re-examining accepted “myths” about the history of science. Heroes of science, like Galileo, are shown to be just as reliant on rhetoric and persuasion as they are on reason and demonstration. Others, like Aristotle, are shown to be far more reasonable and far-reaching in their outlooks then they are given credit for. As a consequence, the only rule that could provide what he took to be sufficient freedom was the vacuous “anything goes”. More generally, even the methodological restriction that science is the best way to pursue knowledge, and to increase knowledge, is too restrictive. Feyerabend suggested instead that science might, in fact, be a threat to a free society, because it and its myth had become so dominant (Feyerabend 1978).
An even more fundamental kind of criticism was offered by several sociologists of science from the 1970s onwards who rejected the methodology of providing philosophical accounts for the rational development of science and sociological accounts of the irrational mistakes. Instead, they adhered to a symmetry thesis on which any causal explanation of how scientific knowledge is established needs to be symmetrical in explaining truth and falsity, rationality and irrationality, success and mistakes, by the same causal factors (see, e.g., Barnes and Bloor 1982, Bloor 1991). Movements in the Sociology of Science, like the Strong Programme, or in the social dimensions and causes of knowledge more generally led to extended and close examination of detailed case studies in contemporary science and its history. (See the entries on the social dimensions of scientific knowledge and social epistemology .) Well-known examinations by Latour and Woolgar (1979/1986), Knorr-Cetina (1981), Pickering (1984), Shapin and Schaffer (1985) seem to bear out that it was social ideologies (on a macro-scale) or individual interactions and circumstances (on a micro-scale) which were the primary causal factors in determining which beliefs gained the status of scientific knowledge. As they saw it therefore, explanatory appeals to scientific method were not empirically grounded.
A late, and largely unexpected, criticism of scientific method came from within science itself. Beginning in the early 2000s, a number of scientists attempting to replicate the results of published experiments could not do so. There may be close conceptual connection between reproducibility and method. For example, if reproducibility means that the same scientific methods ought to produce the same result, and all scientific results ought to be reproducible, then whatever it takes to reproduce a scientific result ought to be called scientific method. Space limits us to the observation that, insofar as reproducibility is a desired outcome of proper scientific method, it is not strictly a part of scientific method. (See the entry on reproducibility of scientific results .)
By the close of the 20 th century the search for the scientific method was flagging. Nola and Sankey (2000b) could introduce their volume on method by remarking that “For some, the whole idea of a theory of scientific method is yester-year’s debate …”.
Despite the many difficulties that philosophers encountered in trying to providing a clear methodology of conformation (or refutation), still important progress has been made on understanding how observation can provide evidence for a given theory. Work in statistics has been crucial for understanding how theories can be tested empirically, and in recent decades a huge literature has developed that attempts to recast confirmation in Bayesian terms. Here these developments can be covered only briefly, and we refer to the entry on confirmation for further details and references.
Statistics has come to play an increasingly important role in the methodology of the experimental sciences from the 19 th century onwards. At that time, statistics and probability theory took on a methodological role as an analysis of inductive inference, and attempts to ground the rationality of induction in the axioms of probability theory have continued throughout the 20 th century and in to the present. Developments in the theory of statistics itself, meanwhile, have had a direct and immense influence on the experimental method, including methods for measuring the uncertainty of observations such as the Method of Least Squares developed by Legendre and Gauss in the early 19 th century, criteria for the rejection of outliers proposed by Peirce by the mid-19 th century, and the significance tests developed by Gosset (a.k.a. “Student”), Fisher, Neyman & Pearson and others in the 1920s and 1930s (see, e.g., Swijtink 1987 for a brief historical overview; and also the entry on C.S. Peirce ).
These developments within statistics then in turn led to a reflective discussion among both statisticians and philosophers of science on how to perceive the process of hypothesis testing: whether it was a rigorous statistical inference that could provide a numerical expression of the degree of confidence in the tested hypothesis, or if it should be seen as a decision between different courses of actions that also involved a value component. This led to a major controversy among Fisher on the one side and Neyman and Pearson on the other (see especially Fisher 1955, Neyman 1956 and Pearson 1955, and for analyses of the controversy, e.g., Howie 2002, Marks 2000, Lenhard 2006). On Fisher’s view, hypothesis testing was a methodology for when to accept or reject a statistical hypothesis, namely that a hypothesis should be rejected by evidence if this evidence would be unlikely relative to other possible outcomes, given the hypothesis were true. In contrast, on Neyman and Pearson’s view, the consequence of error also had to play a role when deciding between hypotheses. Introducing the distinction between the error of rejecting a true hypothesis (type I error) and accepting a false hypothesis (type II error), they argued that it depends on the consequences of the error to decide whether it is more important to avoid rejecting a true hypothesis or accepting a false one. Hence, Fisher aimed for a theory of inductive inference that enabled a numerical expression of confidence in a hypothesis. To him, the important point was the search for truth, not utility. In contrast, the Neyman-Pearson approach provided a strategy of inductive behaviour for deciding between different courses of action. Here, the important point was not whether a hypothesis was true, but whether one should act as if it was.
Similar discussions are found in the philosophical literature. On the one side, Churchman (1948) and Rudner (1953) argued that because scientific hypotheses can never be completely verified, a complete analysis of the methods of scientific inference includes ethical judgments in which the scientists must decide whether the evidence is sufficiently strong or that the probability is sufficiently high to warrant the acceptance of the hypothesis, which again will depend on the importance of making a mistake in accepting or rejecting the hypothesis. Others, such as Jeffrey (1956) and Levi (1960) disagreed and instead defended a value-neutral view of science on which scientists should bracket their attitudes, preferences, temperament, and values when assessing the correctness of their inferences. For more details on this value-free ideal in the philosophy of science and its historical development, see Douglas (2009) and Howard (2003). For a broad set of case studies examining the role of values in science, see e.g. Elliott & Richards 2017.
In recent decades, philosophical discussions of the evaluation of probabilistic hypotheses by statistical inference have largely focused on Bayesianism that understands probability as a measure of a person’s degree of belief in an event, given the available information, and frequentism that instead understands probability as a long-run frequency of a repeatable event. Hence, for Bayesians probabilities refer to a state of knowledge, whereas for frequentists probabilities refer to frequencies of events (see, e.g., Sober 2008, chapter 1 for a detailed introduction to Bayesianism and frequentism as well as to likelihoodism). Bayesianism aims at providing a quantifiable, algorithmic representation of belief revision, where belief revision is a function of prior beliefs (i.e., background knowledge) and incoming evidence. Bayesianism employs a rule based on Bayes’ theorem, a theorem of the probability calculus which relates conditional probabilities. The probability that a particular hypothesis is true is interpreted as a degree of belief, or credence, of the scientist. There will also be a probability and a degree of belief that a hypothesis will be true conditional on a piece of evidence (an observation, say) being true. Bayesianism proscribes that it is rational for the scientist to update their belief in the hypothesis to that conditional probability should it turn out that the evidence is, in fact, observed (see, e.g., Sprenger & Hartmann 2019 for a comprehensive treatment of Bayesian philosophy of science). Originating in the work of Neyman and Person, frequentism aims at providing the tools for reducing long-run error rates, such as the error-statistical approach developed by Mayo (1996) that focuses on how experimenters can avoid both type I and type II errors by building up a repertoire of procedures that detect errors if and only if they are present. Both Bayesianism and frequentism have developed over time, they are interpreted in different ways by its various proponents, and their relations to previous criticism to attempts at defining scientific method are seen differently by proponents and critics. The literature, surveys, reviews and criticism in this area are vast and the reader is referred to the entries on Bayesian epistemology and confirmation .
5. Method in Practice
Attention to scientific practice, as we have seen, is not itself new. However, the turn to practice in the philosophy of science of late can be seen as a correction to the pessimism with respect to method in philosophy of science in later parts of the 20 th century, and as an attempted reconciliation between sociological and rationalist explanations of scientific knowledge. Much of this work sees method as detailed and context specific problem-solving procedures, and methodological analyses to be at the same time descriptive, critical and advisory (see Nickles 1987 for an exposition of this view). The following section contains a survey of some of the practice focuses. In this section we turn fully to topics rather than chronology.
A problem with the distinction between the contexts of discovery and justification that figured so prominently in philosophy of science in the first half of the 20 th century (see section 2 ) is that no such distinction can be clearly seen in scientific activity (see Arabatzis 2006). Thus, in recent decades, it has been recognized that study of conceptual innovation and change should not be confined to psychology and sociology of science, but are also important aspects of scientific practice which philosophy of science should address (see also the entry on scientific discovery ). Looking for the practices that drive conceptual innovation has led philosophers to examine both the reasoning practices of scientists and the wide realm of experimental practices that are not directed narrowly at testing hypotheses, that is, exploratory experimentation.
Examining the reasoning practices of historical and contemporary scientists, Nersessian (2008) has argued that new scientific concepts are constructed as solutions to specific problems by systematic reasoning, and that of analogy, visual representation and thought-experimentation are among the important reasoning practices employed. These ubiquitous forms of reasoning are reliable—but also fallible—methods of conceptual development and change. On her account, model-based reasoning consists of cycles of construction, simulation, evaluation and adaption of models that serve as interim interpretations of the target problem to be solved. Often, this process will lead to modifications or extensions, and a new cycle of simulation and evaluation. However, Nersessian also emphasizes that
creative model-based reasoning cannot be applied as a simple recipe, is not always productive of solutions, and even its most exemplary usages can lead to incorrect solutions. (Nersessian 2008: 11)
Thus, while on the one hand she agrees with many previous philosophers that there is no logic of discovery, discoveries can derive from reasoned processes, such that a large and integral part of scientific practice is
the creation of concepts through which to comprehend, structure, and communicate about physical phenomena …. (Nersessian 1987: 11)
Similarly, work on heuristics for discovery and theory construction by scholars such as Darden (1991) and Bechtel & Richardson (1993) present science as problem solving and investigate scientific problem solving as a special case of problem-solving in general. Drawing largely on cases from the biological sciences, much of their focus has been on reasoning strategies for the generation, evaluation, and revision of mechanistic explanations of complex systems.
Addressing another aspect of the context distinction, namely the traditional view that the primary role of experiments is to test theoretical hypotheses according to the H-D model, other philosophers of science have argued for additional roles that experiments can play. The notion of exploratory experimentation was introduced to describe experiments driven by the desire to obtain empirical regularities and to develop concepts and classifications in which these regularities can be described (Steinle 1997, 2002; Burian 1997; Waters 2007)). However the difference between theory driven experimentation and exploratory experimentation should not be seen as a sharp distinction. Theory driven experiments are not always directed at testing hypothesis, but may also be directed at various kinds of fact-gathering, such as determining numerical parameters. Vice versa , exploratory experiments are usually informed by theory in various ways and are therefore not theory-free. Instead, in exploratory experiments phenomena are investigated without first limiting the possible outcomes of the experiment on the basis of extant theory about the phenomena.
The development of high throughput instrumentation in molecular biology and neighbouring fields has given rise to a special type of exploratory experimentation that collects and analyses very large amounts of data, and these new ‘omics’ disciplines are often said to represent a break with the ideal of hypothesis-driven science (Burian 2007; Elliott 2007; Waters 2007; O’Malley 2007) and instead described as data-driven research (Leonelli 2012; Strasser 2012) or as a special kind of “convenience experimentation” in which many experiments are done simply because they are extraordinarily convenient to perform (Krohs 2012).
5.2 Computer methods and ‘new ways’ of doing science
The field of omics just described is possible because of the ability of computers to process, in a reasonable amount of time, the huge quantities of data required. Computers allow for more elaborate experimentation (higher speed, better filtering, more variables, sophisticated coordination and control), but also, through modelling and simulations, might constitute a form of experimentation themselves. Here, too, we can pose a version of the general question of method versus practice: does the practice of using computers fundamentally change scientific method, or merely provide a more efficient means of implementing standard methods?
Because computers can be used to automate measurements, quantifications, calculations, and statistical analyses where, for practical reasons, these operations cannot be otherwise carried out, many of the steps involved in reaching a conclusion on the basis of an experiment are now made inside a “black box”, without the direct involvement or awareness of a human. This has epistemological implications, regarding what we can know, and how we can know it. To have confidence in the results, computer methods are therefore subjected to tests of verification and validation.
The distinction between verification and validation is easiest to characterize in the case of computer simulations. In a typical computer simulation scenario computers are used to numerically integrate differential equations for which no analytic solution is available. The equations are part of the model the scientist uses to represent a phenomenon or system under investigation. Verifying a computer simulation means checking that the equations of the model are being correctly approximated. Validating a simulation means checking that the equations of the model are adequate for the inferences one wants to make on the basis of that model.
A number of issues related to computer simulations have been raised. The identification of validity and verification as the testing methods has been criticized. Oreskes et al. (1994) raise concerns that “validiation”, because it suggests deductive inference, might lead to over-confidence in the results of simulations. The distinction itself is probably too clean, since actual practice in the testing of simulations mixes and moves back and forth between the two (Weissart 1997; Parker 2008a; Winsberg 2010). Computer simulations do seem to have a non-inductive character, given that the principles by which they operate are built in by the programmers, and any results of the simulation follow from those in-built principles in such a way that those results could, in principle, be deduced from the program code and its inputs. The status of simulations as experiments has therefore been examined (Kaufmann and Smarr 1993; Humphreys 1995; Hughes 1999; Norton and Suppe 2001). This literature considers the epistemology of these experiments: what we can learn by simulation, and also the kinds of justifications which can be given in applying that knowledge to the “real” world. (Mayo 1996; Parker 2008b). As pointed out, part of the advantage of computer simulation derives from the fact that huge numbers of calculations can be carried out without requiring direct observation by the experimenter/simulator. At the same time, many of these calculations are approximations to the calculations which would be performed first-hand in an ideal situation. Both factors introduce uncertainties into the inferences drawn from what is observed in the simulation.
For many of the reasons described above, computer simulations do not seem to belong clearly to either the experimental or theoretical domain. Rather, they seem to crucially involve aspects of both. This has led some authors, such as Fox Keller (2003: 200) to argue that we ought to consider computer simulation a “qualitatively different way of doing science”. The literature in general tends to follow Kaufmann and Smarr (1993) in referring to computer simulation as a “third way” for scientific methodology (theoretical reasoning and experimental practice are the first two ways.). It should also be noted that the debates around these issues have tended to focus on the form of computer simulation typical in the physical sciences, where models are based on dynamical equations. Other forms of simulation might not have the same problems, or have problems of their own (see the entry on computer simulations in science ).
In recent years, the rapid development of machine learning techniques has prompted some scholars to suggest that the scientific method has become “obsolete” (Anderson 2008, Carrol and Goodstein 2009). This has resulted in an intense debate on the relative merit of data-driven and hypothesis-driven research (for samples, see e.g. Mazzocchi 2015 or Succi and Coveney 2018). For a detailed treatment of this topic, we refer to the entry scientific research and big data .
6. Discourse on scientific method
Despite philosophical disagreements, the idea of the scientific method still figures prominently in contemporary discourse on many different topics, both within science and in society at large. Often, reference to scientific method is used in ways that convey either the legend of a single, universal method characteristic of all science, or grants to a particular method or set of methods privilege as a special ‘gold standard’, often with reference to particular philosophers to vindicate the claims. Discourse on scientific method also typically arises when there is a need to distinguish between science and other activities, or for justifying the special status conveyed to science. In these areas, the philosophical attempts at identifying a set of methods characteristic for scientific endeavors are closely related to the philosophy of science’s classical problem of demarcation (see the entry on science and pseudo-science ) and to the philosophical analysis of the social dimension of scientific knowledge and the role of science in democratic society.
One of the settings in which the legend of a single, universal scientific method has been particularly strong is science education (see, e.g., Bauer 1992; McComas 1996; Wivagg & Allchin 2002). [ 5 ] Often, ‘the scientific method’ is presented in textbooks and educational web pages as a fixed four or five step procedure starting from observations and description of a phenomenon and progressing over formulation of a hypothesis which explains the phenomenon, designing and conducting experiments to test the hypothesis, analyzing the results, and ending with drawing a conclusion. Such references to a universal scientific method can be found in educational material at all levels of science education (Blachowicz 2009), and numerous studies have shown that the idea of a general and universal scientific method often form part of both students’ and teachers’ conception of science (see, e.g., Aikenhead 1987; Osborne et al. 2003). In response, it has been argued that science education need to focus more on teaching about the nature of science, although views have differed on whether this is best done through student-led investigations, contemporary cases, or historical cases (Allchin, Andersen & Nielsen 2014)
Although occasionally phrased with reference to the H-D method, important historical roots of the legend in science education of a single, universal scientific method are the American philosopher and psychologist Dewey’s account of inquiry in How We Think (1910) and the British mathematician Karl Pearson’s account of science in Grammar of Science (1892). On Dewey’s account, inquiry is divided into the five steps of
(i) a felt difficulty, (ii) its location and definition, (iii) suggestion of a possible solution, (iv) development by reasoning of the bearing of the suggestions, (v) further observation and experiment leading to its acceptance or rejection. (Dewey 1910: 72)
Similarly, on Pearson’s account, scientific investigations start with measurement of data and observation of their correction and sequence from which scientific laws can be discovered with the aid of creative imagination. These laws have to be subject to criticism, and their final acceptance will have equal validity for “all normally constituted minds”. Both Dewey’s and Pearson’s accounts should be seen as generalized abstractions of inquiry and not restricted to the realm of science—although both Dewey and Pearson referred to their respective accounts as ‘the scientific method’.
Occasionally, scientists make sweeping statements about a simple and distinct scientific method, as exemplified by Feynman’s simplified version of a conjectures and refutations method presented, for example, in the last of his 1964 Cornell Messenger lectures. [ 6 ] However, just as often scientists have come to the same conclusion as recent philosophy of science that there is not any unique, easily described scientific method. For example, the physicist and Nobel Laureate Weinberg described in the paper “The Methods of Science … And Those By Which We Live” (1995) how
The fact that the standards of scientific success shift with time does not only make the philosophy of science difficult; it also raises problems for the public understanding of science. We do not have a fixed scientific method to rally around and defend. (1995: 8)
Interview studies with scientists on their conception of method shows that scientists often find it hard to figure out whether available evidence confirms their hypothesis, and that there are no direct translations between general ideas about method and specific strategies to guide how research is conducted (Schickore & Hangel 2019, Hangel & Schickore 2017)
Reference to the scientific method has also often been used to argue for the scientific nature or special status of a particular activity. Philosophical positions that argue for a simple and unique scientific method as a criterion of demarcation, such as Popperian falsification, have often attracted practitioners who felt that they had a need to defend their domain of practice. For example, references to conjectures and refutation as the scientific method are abundant in much of the literature on complementary and alternative medicine (CAM)—alongside the competing position that CAM, as an alternative to conventional biomedicine, needs to develop its own methodology different from that of science.
Also within mainstream science, reference to the scientific method is used in arguments regarding the internal hierarchy of disciplines and domains. A frequently seen argument is that research based on the H-D method is superior to research based on induction from observations because in deductive inferences the conclusion follows necessarily from the premises. (See, e.g., Parascandola 1998 for an analysis of how this argument has been made to downgrade epidemiology compared to the laboratory sciences.) Similarly, based on an examination of the practices of major funding institutions such as the National Institutes of Health (NIH), the National Science Foundation (NSF) and the Biomedical Sciences Research Practices (BBSRC) in the UK, O’Malley et al. (2009) have argued that funding agencies seem to have a tendency to adhere to the view that the primary activity of science is to test hypotheses, while descriptive and exploratory research is seen as merely preparatory activities that are valuable only insofar as they fuel hypothesis-driven research.
In some areas of science, scholarly publications are structured in a way that may convey the impression of a neat and linear process of inquiry from stating a question, devising the methods by which to answer it, collecting the data, to drawing a conclusion from the analysis of data. For example, the codified format of publications in most biomedical journals known as the IMRAD format (Introduction, Method, Results, Analysis, Discussion) is explicitly described by the journal editors as “not an arbitrary publication format but rather a direct reflection of the process of scientific discovery” (see the so-called “Vancouver Recommendations”, ICMJE 2013: 11). However, scientific publications do not in general reflect the process by which the reported scientific results were produced. For example, under the provocative title “Is the scientific paper a fraud?”, Medawar argued that scientific papers generally misrepresent how the results have been produced (Medawar 1963/1996). Similar views have been advanced by philosophers, historians and sociologists of science (Gilbert 1976; Holmes 1987; Knorr-Cetina 1981; Schickore 2008; Suppe 1998) who have argued that scientists’ experimental practices are messy and often do not follow any recognizable pattern. Publications of research results, they argue, are retrospective reconstructions of these activities that often do not preserve the temporal order or the logic of these activities, but are instead often constructed in order to screen off potential criticism (see Schickore 2008 for a review of this work).
Philosophical positions on the scientific method have also made it into the court room, especially in the US where judges have drawn on philosophy of science in deciding when to confer special status to scientific expert testimony. A key case is Daubert vs Merrell Dow Pharmaceuticals (92–102, 509 U.S. 579, 1993). In this case, the Supreme Court argued in its 1993 ruling that trial judges must ensure that expert testimony is reliable, and that in doing this the court must look at the expert’s methodology to determine whether the proffered evidence is actually scientific knowledge. Further, referring to works of Popper and Hempel the court stated that
ordinarily, a key question to be answered in determining whether a theory or technique is scientific knowledge … is whether it can be (and has been) tested. (Justice Blackmun, Daubert v. Merrell Dow Pharmaceuticals; see Other Internet Resources for a link to the opinion)
But as argued by Haack (2005a,b, 2010) and by Foster & Hubner (1999), by equating the question of whether a piece of testimony is reliable with the question whether it is scientific as indicated by a special methodology, the court was producing an inconsistent mixture of Popper’s and Hempel’s philosophies, and this has later led to considerable confusion in subsequent case rulings that drew on the Daubert case (see Haack 2010 for a detailed exposition).
The difficulties around identifying the methods of science are also reflected in the difficulties of identifying scientific misconduct in the form of improper application of the method or methods of science. One of the first and most influential attempts at defining misconduct in science was the US definition from 1989 that defined misconduct as
fabrication, falsification, plagiarism, or other practices that seriously deviate from those that are commonly accepted within the scientific community . (Code of Federal Regulations, part 50, subpart A., August 8, 1989, italics added)
However, the “other practices that seriously deviate” clause was heavily criticized because it could be used to suppress creative or novel science. For example, the National Academy of Science stated in their report Responsible Science (1992) that it
wishes to discourage the possibility that a misconduct complaint could be lodged against scientists based solely on their use of novel or unorthodox research methods. (NAS: 27)
This clause was therefore later removed from the definition. For an entry into the key philosophical literature on conduct in science, see Shamoo & Resnick (2009).
The question of the source of the success of science has been at the core of philosophy since the beginning of modern science. If viewed as a matter of epistemology more generally, scientific method is a part of the entire history of philosophy. Over that time, science and whatever methods its practitioners may employ have changed dramatically. Today, many philosophers have taken up the banners of pluralism or of practice to focus on what are, in effect, fine-grained and contextually limited examinations of scientific method. Others hope to shift perspectives in order to provide a renewed general account of what characterizes the activity we call science.
One such perspective has been offered recently by Hoyningen-Huene (2008, 2013), who argues from the history of philosophy of science that after three lengthy phases of characterizing science by its method, we are now in a phase where the belief in the existence of a positive scientific method has eroded and what has been left to characterize science is only its fallibility. First was a phase from Plato and Aristotle up until the 17 th century where the specificity of scientific knowledge was seen in its absolute certainty established by proof from evident axioms; next was a phase up to the mid-19 th century in which the means to establish the certainty of scientific knowledge had been generalized to include inductive procedures as well. In the third phase, which lasted until the last decades of the 20 th century, it was recognized that empirical knowledge was fallible, but it was still granted a special status due to its distinctive mode of production. But now in the fourth phase, according to Hoyningen-Huene, historical and philosophical studies have shown how “scientific methods with the characteristics as posited in the second and third phase do not exist” (2008: 168) and there is no longer any consensus among philosophers and historians of science about the nature of science. For Hoyningen-Huene, this is too negative a stance, and he therefore urges the question about the nature of science anew. His own answer to this question is that “scientific knowledge differs from other kinds of knowledge, especially everyday knowledge, primarily by being more systematic” (Hoyningen-Huene 2013: 14). Systematicity can have several different dimensions: among them are more systematic descriptions, explanations, predictions, defense of knowledge claims, epistemic connectedness, ideal of completeness, knowledge generation, representation of knowledge and critical discourse. Hence, what characterizes science is the greater care in excluding possible alternative explanations, the more detailed elaboration with respect to data on which predictions are based, the greater care in detecting and eliminating sources of error, the more articulate connections to other pieces of knowledge, etc. On this position, what characterizes science is not that the methods employed are unique to science, but that the methods are more carefully employed.
Another, similar approach has been offered by Haack (2003). She sets off, similar to Hoyningen-Huene, from a dissatisfaction with the recent clash between what she calls Old Deferentialism and New Cynicism. The Old Deferentialist position is that science progressed inductively by accumulating true theories confirmed by empirical evidence or deductively by testing conjectures against basic statements; while the New Cynics position is that science has no epistemic authority and no uniquely rational method and is merely just politics. Haack insists that contrary to the views of the New Cynics, there are objective epistemic standards, and there is something epistemologically special about science, even though the Old Deferentialists pictured this in a wrong way. Instead, she offers a new Critical Commonsensist account on which standards of good, strong, supportive evidence and well-conducted, honest, thorough and imaginative inquiry are not exclusive to the sciences, but the standards by which we judge all inquirers. In this sense, science does not differ in kind from other kinds of inquiry, but it may differ in the degree to which it requires broad and detailed background knowledge and a familiarity with a technical vocabulary that only specialists may possess.
- Aikenhead, G.S., 1987, “High-school graduates’ beliefs about science-technology-society. III. Characteristics and limitations of scientific knowledge”, Science Education , 71(4): 459–487.
- Allchin, D., H.M. Andersen and K. Nielsen, 2014, “Complementary Approaches to Teaching Nature of Science: Integrating Student Inquiry, Historical Cases, and Contemporary Cases in Classroom Practice”, Science Education , 98: 461–486.
- Anderson, C., 2008, “The end of theory: The data deluge makes the scientific method obsolete”, Wired magazine , 16(7): 16–07
- Arabatzis, T., 2006, “On the inextricability of the context of discovery and the context of justification”, in Revisiting Discovery and Justification , J. Schickore and F. Steinle (eds.), Dordrecht: Springer, pp. 215–230.
- Barnes, J. (ed.), 1984, The Complete Works of Aristotle, Vols I and II , Princeton: Princeton University Press.
- Barnes, B. and D. Bloor, 1982, “Relativism, Rationalism, and the Sociology of Knowledge”, in Rationality and Relativism , M. Hollis and S. Lukes (eds.), Cambridge: MIT Press, pp. 1–20.
- Bauer, H.H., 1992, Scientific Literacy and the Myth of the Scientific Method , Urbana: University of Illinois Press.
- Bechtel, W. and R.C. Richardson, 1993, Discovering complexity , Princeton, NJ: Princeton University Press.
- Berkeley, G., 1734, The Analyst in De Motu and The Analyst: A Modern Edition with Introductions and Commentary , D. Jesseph (trans. and ed.), Dordrecht: Kluwer Academic Publishers, 1992.
- Blachowicz, J., 2009, “How science textbooks treat scientific method: A philosopher’s perspective”, The British Journal for the Philosophy of Science , 60(2): 303–344.
- Bloor, D., 1991, Knowledge and Social Imagery , Chicago: University of Chicago Press, 2 nd edition.
- Boyle, R., 1682, New experiments physico-mechanical, touching the air , Printed by Miles Flesher for Richard Davis, bookseller in Oxford.
- Bridgman, P.W., 1927, The Logic of Modern Physics , New York: Macmillan.
- –––, 1956, “The Methodological Character of Theoretical Concepts”, in The Foundations of Science and the Concepts of Science and Psychology , Herbert Feigl and Michael Scriven (eds.), Minnesota: University of Minneapolis Press, pp. 38–76.
- Burian, R., 1997, “Exploratory Experimentation and the Role of Histochemical Techniques in the Work of Jean Brachet, 1938–1952”, History and Philosophy of the Life Sciences , 19(1): 27–45.
- –––, 2007, “On microRNA and the need for exploratory experimentation in post-genomic molecular biology”, History and Philosophy of the Life Sciences , 29(3): 285–311.
- Carnap, R., 1928, Der logische Aufbau der Welt , Berlin: Bernary, transl. by R.A. George, The Logical Structure of the World , Berkeley: University of California Press, 1967.
- –––, 1956, “The methodological character of theoretical concepts”, Minnesota studies in the philosophy of science , 1: 38–76.
- Carrol, S., and D. Goodstein, 2009, “Defining the scientific method”, Nature Methods , 6: 237.
- Churchman, C.W., 1948, “Science, Pragmatics, Induction”, Philosophy of Science , 15(3): 249–268.
- Cooper, J. (ed.), 1997, Plato: Complete Works , Indianapolis: Hackett.
- Darden, L., 1991, Theory Change in Science: Strategies from Mendelian Genetics , Oxford: Oxford University Press
- Dewey, J., 1910, How we think , New York: Dover Publications (reprinted 1997).
- Douglas, H., 2009, Science, Policy, and the Value-Free Ideal , Pittsburgh: University of Pittsburgh Press.
- Dupré, J., 2004, “Miracle of Monism ”, in Naturalism in Question , Mario De Caro and David Macarthur (eds.), Cambridge, MA: Harvard University Press, pp. 36–58.
- Elliott, K.C., 2007, “Varieties of exploratory experimentation in nanotoxicology”, History and Philosophy of the Life Sciences , 29(3): 311–334.
- Elliott, K. C., and T. Richards (eds.), 2017, Exploring inductive risk: Case studies of values in science , Oxford: Oxford University Press.
- Falcon, Andrea, 2005, Aristotle and the science of nature: Unity without uniformity , Cambridge: Cambridge University Press.
- Feyerabend, P., 1978, Science in a Free Society , London: New Left Books
- –––, 1988, Against Method , London: Verso, 2 nd edition.
- Fisher, R.A., 1955, “Statistical Methods and Scientific Induction”, Journal of The Royal Statistical Society. Series B (Methodological) , 17(1): 69–78.
- Foster, K. and P.W. Huber, 1999, Judging Science. Scientific Knowledge and the Federal Courts , Cambridge: MIT Press.
- Fox Keller, E., 2003, “Models, Simulation, and ‘computer experiments’”, in The Philosophy of Scientific Experimentation , H. Radder (ed.), Pittsburgh: Pittsburgh University Press, 198–215.
- Gilbert, G., 1976, “The transformation of research findings into scientific knowledge”, Social Studies of Science , 6: 281–306.
- Gimbel, S., 2011, Exploring the Scientific Method , Chicago: University of Chicago Press.
- Goodman, N., 1965, Fact , Fiction, and Forecast , Indianapolis: Bobbs-Merrill.
- Haack, S., 1995, “Science is neither sacred nor a confidence trick”, Foundations of Science , 1(3): 323–335.
- –––, 2003, Defending science—within reason , Amherst: Prometheus.
- –––, 2005a, “Disentangling Daubert: an epistemological study in theory and practice”, Journal of Philosophy, Science and Law , 5, Haack 2005a available online . doi:10.5840/jpsl2005513
- –––, 2005b, “Trial and error: The Supreme Court’s philosophy of science”, American Journal of Public Health , 95: S66-S73.
- –––, 2010, “Federal Philosophy of Science: A Deconstruction-and a Reconstruction”, NYUJL & Liberty , 5: 394.
- Hangel, N. and J. Schickore, 2017, “Scientists’ conceptions of good research practice”, Perspectives on Science , 25(6): 766–791
- Harper, W.L., 2011, Isaac Newton’s Scientific Method: Turning Data into Evidence about Gravity and Cosmology , Oxford: Oxford University Press.
- Hempel, C., 1950, “Problems and Changes in the Empiricist Criterion of Meaning”, Revue Internationale de Philosophie , 41(11): 41–63.
- –––, 1951, “The Concept of Cognitive Significance: A Reconsideration”, Proceedings of the American Academy of Arts and Sciences , 80(1): 61–77.
- –––, 1965, Aspects of scientific explanation and other essays in the philosophy of science , New York–London: Free Press.
- –––, 1966, Philosophy of Natural Science , Englewood Cliffs: Prentice-Hall.
- Holmes, F.L., 1987, “Scientific writing and scientific discovery”, Isis , 78(2): 220–235.
- Howard, D., 2003, “Two left turns make a right: On the curious political career of North American philosophy of science at midcentury”, in Logical Empiricism in North America , G.L. Hardcastle & A.W. Richardson (eds.), Minneapolis: University of Minnesota Press, pp. 25–93.
- Hoyningen-Huene, P., 2008, “Systematicity: The nature of science”, Philosophia , 36(2): 167–180.
- –––, 2013, Systematicity. The Nature of Science , Oxford: Oxford University Press.
- Howie, D., 2002, Interpreting probability: Controversies and developments in the early twentieth century , Cambridge: Cambridge University Press.
- Hughes, R., 1999, “The Ising Model, Computer Simulation, and Universal Physics”, in Models as Mediators , M. Morgan and M. Morrison (eds.), Cambridge: Cambridge University Press, pp. 97–145
- Hume, D., 1739, A Treatise of Human Nature , D. Fate Norton and M.J. Norton (eds.), Oxford: Oxford University Press, 2000.
- Humphreys, P., 1995, “Computational science and scientific method”, Minds and Machines , 5(1): 499–512.
- ICMJE, 2013, “Recommendations for the Conduct, Reporting, Editing, and Publication of Scholarly Work in Medical Journals”, International Committee of Medical Journal Editors, available online , accessed August 13 2014
- Jeffrey, R.C., 1956, “Valuation and Acceptance of Scientific Hypotheses”, Philosophy of Science , 23(3): 237–246.
- Kaufmann, W.J., and L.L. Smarr, 1993, Supercomputing and the Transformation of Science , New York: Scientific American Library.
- Knorr-Cetina, K., 1981, The Manufacture of Knowledge , Oxford: Pergamon Press.
- Krohs, U., 2012, “Convenience experimentation”, Studies in History and Philosophy of Biological and BiomedicalSciences , 43: 52–57.
- Kuhn, T.S., 1962, The Structure of Scientific Revolutions , Chicago: University of Chicago Press
- Latour, B. and S. Woolgar, 1986, Laboratory Life: The Construction of Scientific Facts , Princeton: Princeton University Press, 2 nd edition.
- Laudan, L., 1968, “Theories of scientific method from Plato to Mach”, History of Science , 7(1): 1–63.
- Lenhard, J., 2006, “Models and statistical inference: The controversy between Fisher and Neyman-Pearson”, The British Journal for the Philosophy of Science , 57(1): 69–91.
- Leonelli, S., 2012, “Making Sense of Data-Driven Research in the Biological and the Biomedical Sciences”, Studies in the History and Philosophy of the Biological and Biomedical Sciences , 43(1): 1–3.
- Levi, I., 1960, “Must the scientist make value judgments?”, Philosophy of Science , 57(11): 345–357
- Lindley, D., 1991, Theory Change in Science: Strategies from Mendelian Genetics , Oxford: Oxford University Press.
- Lipton, P., 2004, Inference to the Best Explanation , London: Routledge, 2 nd edition.
- Marks, H.M., 2000, The progress of experiment: science and therapeutic reform in the United States, 1900–1990 , Cambridge: Cambridge University Press.
- Mazzochi, F., 2015, “Could Big Data be the end of theory in science?”, EMBO reports , 16: 1250–1255.
- Mayo, D.G., 1996, Error and the Growth of Experimental Knowledge , Chicago: University of Chicago Press.
- McComas, W.F., 1996, “Ten myths of science: Reexamining what we think we know about the nature of science”, School Science and Mathematics , 96(1): 10–16.
- Medawar, P.B., 1963/1996, “Is the scientific paper a fraud”, in The Strange Case of the Spotted Mouse and Other Classic Essays on Science , Oxford: Oxford University Press, 33–39.
- Mill, J.S., 1963, Collected Works of John Stuart Mill , J. M. Robson (ed.), Toronto: University of Toronto Press
- NAS, 1992, Responsible Science: Ensuring the integrity of the research process , Washington DC: National Academy Press.
- Nersessian, N.J., 1987, “A cognitive-historical approach to meaning in scientific theories”, in The process of science , N. Nersessian (ed.), Berlin: Springer, pp. 161–177.
- –––, 2008, Creating Scientific Concepts , Cambridge: MIT Press.
- Newton, I., 1726, Philosophiae naturalis Principia Mathematica (3 rd edition), in The Principia: Mathematical Principles of Natural Philosophy: A New Translation , I.B. Cohen and A. Whitman (trans.), Berkeley: University of California Press, 1999.
- –––, 1704, Opticks or A Treatise of the Reflections, Refractions, Inflections & Colors of Light , New York: Dover Publications, 1952.
- Neyman, J., 1956, “Note on an Article by Sir Ronald Fisher”, Journal of the Royal Statistical Society. Series B (Methodological) , 18: 288–294.
- Nickles, T., 1987, “Methodology, heuristics, and rationality”, in Rational changes in science: Essays on Scientific Reasoning , J.C. Pitt (ed.), Berlin: Springer, pp. 103–132.
- Nicod, J., 1924, Le problème logique de l’induction , Paris: Alcan. (Engl. transl. “The Logical Problem of Induction”, in Foundations of Geometry and Induction , London: Routledge, 2000.)
- Nola, R. and H. Sankey, 2000a, “A selective survey of theories of scientific method”, in Nola and Sankey 2000b: 1–65.
- –––, 2000b, After Popper, Kuhn and Feyerabend. Recent Issues in Theories of Scientific Method , London: Springer.
- –––, 2007, Theories of Scientific Method , Stocksfield: Acumen.
- Norton, S., and F. Suppe, 2001, “Why atmospheric modeling is good science”, in Changing the Atmosphere: Expert Knowledge and Environmental Governance , C. Miller and P. Edwards (eds.), Cambridge, MA: MIT Press, 88–133.
- O’Malley, M., 2007, “Exploratory experimentation and scientific practice: Metagenomics and the proteorhodopsin case”, History and Philosophy of the Life Sciences , 29(3): 337–360.
- O’Malley, M., C. Haufe, K. Elliot, and R. Burian, 2009, “Philosophies of Funding”, Cell , 138: 611–615.
- Oreskes, N., K. Shrader-Frechette, and K. Belitz, 1994, “Verification, Validation and Confirmation of Numerical Models in the Earth Sciences”, Science , 263(5147): 641–646.
- Osborne, J., S. Simon, and S. Collins, 2003, “Attitudes towards science: a review of the literature and its implications”, International Journal of Science Education , 25(9): 1049–1079.
- Parascandola, M., 1998, “Epidemiology—2 nd -Rate Science”, Public Health Reports , 113(4): 312–320.
- Parker, W., 2008a, “Franklin, Holmes and the Epistemology of Computer Simulation”, International Studies in the Philosophy of Science , 22(2): 165–83.
- –––, 2008b, “Computer Simulation through an Error-Statistical Lens”, Synthese , 163(3): 371–84.
- Pearson, K. 1892, The Grammar of Science , London: J.M. Dents and Sons, 1951
- Pearson, E.S., 1955, “Statistical Concepts in Their Relation to Reality”, Journal of the Royal Statistical Society , B, 17: 204–207.
- Pickering, A., 1984, Constructing Quarks: A Sociological History of Particle Physics , Edinburgh: Edinburgh University Press.
- Popper, K.R., 1959, The Logic of Scientific Discovery , London: Routledge, 2002
- –––, 1963, Conjectures and Refutations , London: Routledge, 2002.
- –––, 1985, Unended Quest: An Intellectual Autobiography , La Salle: Open Court Publishing Co..
- Rudner, R., 1953, “The Scientist Qua Scientist Making Value Judgments”, Philosophy of Science , 20(1): 1–6.
- Rudolph, J.L., 2005, “Epistemology for the masses: The origin of ‘The Scientific Method’ in American Schools”, History of Education Quarterly , 45(3): 341–376
- Schickore, J., 2008, “Doing science, writing science”, Philosophy of Science , 75: 323–343.
- Schickore, J. and N. Hangel, 2019, “‘It might be this, it should be that…’ uncertainty and doubt in day-to-day science practice”, European Journal for Philosophy of Science , 9(2): 31. doi:10.1007/s13194-019-0253-9
- Shamoo, A.E. and D.B. Resnik, 2009, Responsible Conduct of Research , Oxford: Oxford University Press.
- Shank, J.B., 2008, The Newton Wars and the Beginning of the French Enlightenment , Chicago: The University of Chicago Press.
- Shapin, S. and S. Schaffer, 1985, Leviathan and the air-pump , Princeton: Princeton University Press.
- Smith, G.E., 2002, “The Methodology of the Principia”, in The Cambridge Companion to Newton , I.B. Cohen and G.E. Smith (eds.), Cambridge: Cambridge University Press, 138–173.
- Snyder, L.J., 1997a, “Discoverers’ Induction”, Philosophy of Science , 64: 580–604.
- –––, 1997b, “The Mill-Whewell Debate: Much Ado About Induction”, Perspectives on Science , 5: 159–198.
- –––, 1999, “Renovating the Novum Organum: Bacon, Whewell and Induction”, Studies in History and Philosophy of Science , 30: 531–557.
- Sober, E., 2008, Evidence and Evolution. The logic behind the science , Cambridge: Cambridge University Press
- Sprenger, J. and S. Hartmann, 2019, Bayesian philosophy of science , Oxford: Oxford University Press.
- Steinle, F., 1997, “Entering New Fields: Exploratory Uses of Experimentation”, Philosophy of Science (Proceedings), 64: S65–S74.
- –––, 2002, “Experiments in History and Philosophy of Science”, Perspectives on Science , 10(4): 408–432.
- Strasser, B.J., 2012, “Data-driven sciences: From wonder cabinets to electronic databases”, Studies in History and Philosophy of Science Part C: Studies in History and Philosophy of Biological and Biomedical Sciences , 43(1): 85–87.
- Succi, S. and P.V. Coveney, 2018, “Big data: the end of the scientific method?”, Philosophical Transactions of the Royal Society A , 377: 20180145. doi:10.1098/rsta.2018.0145
- Suppe, F., 1998, “The Structure of a Scientific Paper”, Philosophy of Science , 65(3): 381–405.
- Swijtink, Z.G., 1987, “The objectification of observation: Measurement and statistical methods in the nineteenth century”, in The probabilistic revolution. Ideas in History, Vol. 1 , L. Kruger (ed.), Cambridge MA: MIT Press, pp. 261–285.
- Waters, C.K., 2007, “The nature and context of exploratory experimentation: An introduction to three case studies of exploratory research”, History and Philosophy of the Life Sciences , 29(3): 275–284.
- Weinberg, S., 1995, “The methods of science… and those by which we live”, Academic Questions , 8(2): 7–13.
- Weissert, T., 1997, The Genesis of Simulation in Dynamics: Pursuing the Fermi-Pasta-Ulam Problem , New York: Springer Verlag.
- William H., 1628, Exercitatio Anatomica de Motu Cordis et Sanguinis in Animalibus , in On the Motion of the Heart and Blood in Animals , R. Willis (trans.), Buffalo: Prometheus Books, 1993.
- Winsberg, E., 2010, Science in the Age of Computer Simulation , Chicago: University of Chicago Press.
- Wivagg, D. & D. Allchin, 2002, “The Dogma of the Scientific Method”, The American Biology Teacher , 64(9): 645–646
How to cite this entry . Preview the PDF version of this entry at the Friends of the SEP Society . Look up topics and thinkers related to this entry at the Internet Philosophy Ontology Project (InPhO). Enhanced bibliography for this entry at PhilPapers , with links to its database.
- Blackmun opinion , in Daubert v. Merrell Dow Pharmaceuticals (92–102), 509 U.S. 579 (1993).
- Scientific Method at philpapers. Darrell Rowbottom (ed.).
- Recent Articles | Scientific Method | The Scientist Magazine
al-Kindi | Albert the Great [= Albertus magnus] | Aquinas, Thomas | Arabic and Islamic Philosophy, disciplines in: natural philosophy and natural science | Arabic and Islamic Philosophy, historical and methodological topics in: Greek sources | Arabic and Islamic Philosophy, historical and methodological topics in: influence of Arabic and Islamic Philosophy on the Latin West | Aristotle | Bacon, Francis | Bacon, Roger | Berkeley, George | biology: experiment in | Boyle, Robert | Cambridge Platonists | confirmation | Descartes, René | Enlightenment | epistemology | epistemology: Bayesian | epistemology: social | Feyerabend, Paul | Galileo Galilei | Grosseteste, Robert | Hempel, Carl | Hume, David | Hume, David: Newtonianism and Anti-Newtonianism | induction: problem of | Kant, Immanuel | Kuhn, Thomas | Leibniz, Gottfried Wilhelm | Locke, John | Mill, John Stuart | More, Henry | Neurath, Otto | Newton, Isaac | Newton, Isaac: philosophy | Ockham [Occam], William | operationalism | Peirce, Charles Sanders | Plato | Popper, Karl | rationality: historicist theories of | Reichenbach, Hans | reproducibility, scientific | Schlick, Moritz | science: and pseudo-science | science: theory and observation in | science: unity of | scientific discovery | scientific knowledge: social dimensions of | simulations in science | skepticism: medieval | space and time: absolute and relational space and motion, post-Newtonian theories | Vienna Circle | Whewell, William | Zabarella, Giacomo
Copyright © 2021 by Brian Hepburn < brian . hepburn @ wichita . edu > Hanne Andersen < hanne . andersen @ ind . ku . dk >
- Accessibility
Support SEP
Mirror sites.
View this site from another server:
- Info about mirror sites
The Stanford Encyclopedia of Philosophy is copyright © 2023 by The Metaphysics Research Lab , Department of Philosophy, Stanford University
Library of Congress Catalog Data: ISSN 1095-5054
What Are The Steps Of The Scientific Method?
Julia Simkus
Editor at Simply Psychology
BA (Hons) Psychology, Princeton University
Julia Simkus is a graduate of Princeton University with a Bachelor of Arts in Psychology. She is currently studying for a Master's Degree in Counseling for Mental Health and Wellness in September 2023. Julia's research has been published in peer reviewed journals.
Learn about our Editorial Process
Saul Mcleod, PhD
Editor-in-Chief for Simply Psychology
BSc (Hons) Psychology, MRes, PhD, University of Manchester
Saul Mcleod, PhD., is a qualified psychology teacher with over 18 years of experience in further and higher education. He has been published in peer-reviewed journals, including the Journal of Clinical Psychology.
Olivia Guy-Evans, MSc
Associate Editor for Simply Psychology
BSc (Hons) Psychology, MSc Psychology of Education
Olivia Guy-Evans is a writer and associate editor for Simply Psychology. She has previously worked in healthcare and educational sectors.
On This Page:
Science is not just knowledge. It is also a method for obtaining knowledge. Scientific understanding is organized into theories.
The scientific method is a step-by-step process used by researchers and scientists to determine if there is a relationship between two or more variables. Psychologists use this method to conduct psychological research, gather data, process information, and describe behaviors.
It involves careful observation, asking questions, formulating hypotheses, experimental testing, and refining hypotheses based on experimental findings.
How it is Used
The scientific method can be applied broadly in science across many different fields, such as chemistry, physics, geology, and psychology. In a typical application of this process, a researcher will develop a hypothesis, test this hypothesis, and then modify the hypothesis based on the outcomes of the experiment.
The process is then repeated with the modified hypothesis until the results align with the observed phenomena. Detailed steps of the scientific method are described below.
Keep in mind that the scientific method does not have to follow this fixed sequence of steps; rather, these steps represent a set of general principles or guidelines.
7 Steps of the Scientific Method
Psychology uses an empirical approach.
Empiricism (founded by John Locke) states that the only source of knowledge comes through our senses – e.g., sight, hearing, touch, etc.
Empirical evidence does not rely on argument or belief. Thus, empiricism is the view that all knowledge is based on or may come from direct observation and experience.
The empiricist approach of gaining knowledge through experience quickly became the scientific approach and greatly influenced the development of physics and chemistry in the 17th and 18th centuries.

Step 1: Make an Observation (Theory Construction)
Every researcher starts at the very beginning. Before diving in and exploring something, one must first determine what they will study – it seems simple enough!
By making observations, researchers can establish an area of interest. Once this topic of study has been chosen, a researcher should review existing literature to gain insight into what has already been tested and determine what questions remain unanswered.
This assessment will provide helpful information about what has already been comprehended about the specific topic and what questions remain, and if one can go and answer them.
Specifically, a literature review might implicate examining a substantial amount of documented material from academic journals to books dating back decades. The most appropriate information gathered by the researcher will be shown in the introduction section or abstract of the published study results.
The background material and knowledge will help the researcher with the first significant step in conducting a psychology study, which is formulating a research question.
This is the inductive phase of the scientific process. Observations yield information that is used to formulate theories as explanations. A theory is a well-developed set of ideas that propose an explanation for observed phenomena.
Inductive reasoning moves from specific premises to a general conclusion. It starts with observations of phenomena in the natural world and derives a general law.
Step 2: Ask a Question
Once a researcher has made observations and conducted background research, the next step is to ask a scientific question. A scientific question must be defined, testable, and measurable.
A useful approach to develop a scientific question is: “What is the effect of…?” or “How does X affect Y?”
To answer an experimental question, a researcher must identify two variables: the independent and dependent variables.
The independent variable is the variable manipulated (the cause), and the dependent variable is the variable being measured (the effect).
An example of a research question could be, “Is handwriting or typing more effective for retaining information?” Answering the research question and proposing a relationship between the two variables is discussed in the next step.
Step 3: Form a Hypothesis (Make Predictions)
A hypothesis is an educated guess about the relationship between two or more variables. A hypothesis is an attempt to answer your research question based on prior observation and background research. Theories tend to be too complex to be tested all at once; instead, researchers create hypotheses to test specific aspects of a theory.
For example, a researcher might ask about the connection between sleep and educational performance. Do students who get less sleep perform worse on tests at school?
It is crucial to think about different questions one might have about a particular topic to formulate a reasonable hypothesis. It would help if one also considered how one could investigate the causalities.
It is important that the hypothesis is both testable against reality and falsifiable. This means that it can be tested through an experiment and can be proven wrong.
The falsification principle, proposed by Karl Popper , is a way of demarcating science from non-science. It suggests that for a theory to be considered scientific, it must be able to be tested and conceivably proven false.
To test a hypothesis, we first assume that there is no difference between the populations from which the samples were taken. This is known as the null hypothesis and predicts that the independent variable will not influence the dependent variable.
Examples of “if…then…” Hypotheses:
- If one gets less than 6 hours of sleep, then one will do worse on tests than if one obtains more rest.
- If one drinks lots of water before going to bed, one will have to use the bathroom often at night.
- If one practices exercising and lighting weights, then one’s body will begin to build muscle.
The research hypothesis is often called the alternative hypothesis and predicts what change(s) will occur in the dependent variable when the independent variable is manipulated.
It states that the results are not due to chance and that they are significant in terms of supporting the theory being investigated.
Although one could state and write a scientific hypothesis in many ways, hypotheses are usually built like “if…then…” statements.
Step 4: Run an Experiment (Gather Data)
The next step in the scientific method is to test your hypothesis and collect data. A researcher will design an experiment to test the hypothesis and gather data that will either support or refute the hypothesis.
The exact research methods used to examine a hypothesis depend on what is being studied. A psychologist might utilize two primary forms of research, experimental research, and descriptive research.
The scientific method is objective in that researchers do not let preconceived ideas or biases influence the collection of data and is systematic in that experiments are conducted in a logical way.
Experimental Research
Experimental research is used to investigate cause-and-effect associations between two or more variables. This type of research systematically controls an independent variable and measures its effect on a specified dependent variable.
Experimental research involves manipulating an independent variable and measuring the effect(s) on the dependent variable. Repeating the experiment multiple times is important to confirm that your results are accurate and consistent.
One of the significant advantages of this method is that it permits researchers to determine if changes in one variable cause shifts in each other.
While experiments in psychology typically have many moving parts (and can be relatively complex), an easy investigation is rather fundamental. Still, it does allow researchers to specify cause-and-effect associations between variables.
Most simple experiments use a control group, which involves those who do not receive the treatment, and an experimental group, which involves those who do receive the treatment.
An example of experimental research would be when a pharmaceutical company wants to test a new drug. They give one group a placebo (control group) and the other the actual pill (experimental group).
Descriptive Research
Descriptive research is generally used when it is challenging or even impossible to control the variables in question. Examples of descriptive analysis include naturalistic observation, case studies , and correlation studies .
One example of descriptive research includes phone surveys that marketers often use. While they typically do not allow researchers to identify cause and effect, correlational studies are quite common in psychology research. They make it possible to spot associations between distinct variables and measure the solidity of those relationships.
Step 5: Analyze the Data and Draw Conclusions
Once a researcher has designed and done the investigation and collected sufficient data, it is time to inspect this gathered information and judge what has been found. Researchers can summarize the data, interpret the results, and draw conclusions based on this evidence using analyses and statistics.
Upon completion of the experiment, you can collect your measurements and analyze the data using statistics. Based on the outcomes, you will either reject or confirm your hypothesis.
Analyze the Data
So, how does a researcher determine what the results of their study mean? Statistical analysis can either support or refute a researcher’s hypothesis and can also be used to determine if the conclusions are statistically significant.
When outcomes are said to be “statistically significant,” it is improbable that these results are due to luck or chance. Based on these observations, investigators must then determine what the results mean.
An experiment will support a hypothesis in some circumstances, but sometimes it fails to be truthful in other cases.
What occurs if the developments of a psychology investigation do not endorse the researcher’s hypothesis? It does mean that the study was worthless. Simply because the findings fail to defend the researcher’s hypothesis does not mean that the examination is not helpful or instructive.
This kind of research plays a vital role in supporting scientists in developing unexplored questions and hypotheses to investigate in the future. After decisions have been made, the next step is to communicate the results with the rest of the scientific community.
This is an integral part of the process because it contributes to the general knowledge base and can assist other scientists in finding new research routes to explore.
If the hypothesis is not supported, a researcher should acknowledge the experiment’s results, formulate a new hypothesis, and develop a new experiment.
We must avoid any reference to results proving a theory as this implies 100% certainty, and there is always a chance that evidence may exist that could refute a theory.
Draw Conclusions and Interpret the Data
When the empirical observations disagree with the hypothesis, a number of possibilities must be considered. It might be that the theory is incorrect, in which case it needs altering, so it fully explains the data.
Alternatively, it might be that the hypothesis was poorly derived from the original theory, in which case the scientists were expecting the wrong thing to happen.
It might also be that the research was poorly conducted, or used an inappropriate method, or there were factors in play that the researchers did not consider. This will begin the process of the scientific method again.
If the hypothesis is supported, the researcher can find more evidence to support their hypothesis or look for counter-evidence to strengthen their hypothesis further.
In either scenario, the researcher should share their results with the greater scientific community.
Step 6: Share Your Results
One of the final stages of the research cycle involves the publication of the research. Once the report is written, the researcher(s) may submit the work for publication in an appropriate journal.
Usually, this is done by writing up a study description and publishing the article in a professional or academic journal. The studies and conclusions of psychological work can be seen in peer-reviewed journals such as Developmental Psychology , Psychological Bulletin, the Journal of Social Psychology, and numerous others.
Scientists should report their findings by writing up a description of their study and any subsequent findings. This enables other researchers to build upon the present research or replicate the results.
As outlined by the American Psychological Association (APA), there is a typical structure of a journal article that follows a specified format. In these articles, researchers:
- Supply a brief narrative and background on previous research
- Give their hypothesis
- Specify who participated in the study and how they were chosen
- Provide operational definitions for each variable
- Explain the measures and methods used to collect data
- Describe how the data collected was interpreted
- Discuss what the outcomes mean
A detailed record of psychological studies and all scientific studies is vital to clearly explain the steps and procedures used throughout the study. So that other researchers can try this experiment too and replicate the results.
The editorial process utilized by academic and professional journals guarantees that each submitted article undergoes a thorough peer review to help assure that the study is scientifically sound. Once published, the investigation becomes another piece of the current puzzle of our knowledge “base” on that subject.
This last step is important because all results, whether they supported or did not support the hypothesis, can contribute to the scientific community. Publication of empirical observations leads to more ideas that are tested against the real world, and so on. In this sense, the scientific process is circular.
The editorial process utilized by academic and professional journals guarantees that each submitted article undergoes a thorough peer review to help assure that the study is scientifically sound.
Once published, the investigation becomes another piece of the current puzzle of our knowledge “base” on that subject.
By replicating studies, psychologists can reduce errors, validate theories, and gain a stronger understanding of a particular topic.
Step 7: Repeat the Scientific Method (Iteration)
Now, if one’s hypothesis turns out to be accurate, find more evidence or find counter-evidence. If one’s hypothesis is false, create a new hypothesis or try again.
One may wish to revise their first hypothesis to make a more niche experiment to design or a different specific question to test.
The amazingness of the scientific method is that it is a comprehensive and straightforward process that scientists, and everyone, can utilize over and over again.
So, draw conclusions and repeat because the scientific method is never-ending, and no result is ever considered perfect.
The scientific method is a process of:
- Making an observation.
- Forming a hypothesis.
- Making a prediction.
- Experimenting to test the hypothesis.
The procedure of repeating the scientific method is crucial to science and all fields of human knowledge.
Further Information
- Karl Popper – Falsification
- Thomas – Kuhn Paradigm Shift
- Positivism in Sociology: Definition, Theory & Examples
- Is Psychology a Science?
- Psychology as a Science (PDF)
List the 6 steps of the scientific methods in order
- Make an observation (theory construction)
- Ask a question. A scientific question must be defined, testable, and measurable.
- Form a hypothesis (make predictions)
- Run an experiment to test the hypothesis (gather data)
- Analyze the data and draw conclusions
- Share your results so that other researchers can make new hypotheses
What is the first step of the scientific method?
The first step of the scientific method is making an observation. This involves noticing and describing a phenomenon or group of phenomena that one finds interesting and wishes to explain.
Observations can occur in a natural setting or within the confines of a laboratory. The key point is that the observation provides the initial question or problem that the rest of the scientific method seeks to answer or solve.
What is the scientific method?
The scientific method is a step-by-step process that investigators can follow to determine if there is a causal connection between two or more variables.
Psychologists and other scientists regularly suggest motivations for human behavior. On a more casual level, people judge other people’s intentions, incentives, and actions daily.
While our standard assessments of human behavior are subjective and anecdotal, researchers use the scientific method to study psychology objectively and systematically.
All utilize a scientific method to study distinct aspects of people’s thinking and behavior. This process allows scientists to analyze and understand various psychological phenomena, but it also provides investigators and others a way to disseminate and debate the results of their studies.
The outcomes of these studies are often noted in popular media, which leads numerous to think about how or why researchers came to the findings they did.
Why Use the Six Steps of the Scientific Method
The goal of scientists is to understand better the world that surrounds us. Scientific research is the most critical tool for navigating and learning about our complex world.
Without it, we would be compelled to rely solely on intuition, other people’s power, and luck. We can eliminate our preconceived concepts and superstitions through methodical scientific research and gain an objective sense of ourselves and our world.
All psychological studies aim to explain, predict, and even control or impact mental behaviors or processes. So, psychologists use and repeat the scientific method (and its six steps) to perform and record essential psychological research.
So, psychologists focus on understanding behavior and the cognitive (mental) and physiological (body) processes underlying behavior.
In the real world, people use to understand the behavior of others, such as intuition and personal experience. The hallmark of scientific research is evidence to support a claim.
Scientific knowledge is empirical, meaning it is grounded in objective, tangible evidence that can be observed repeatedly, regardless of who is watching.
The scientific method is crucial because it minimizes the impact of bias or prejudice on the experimenter. Regardless of how hard one tries, even the best-intentioned scientists can’t escape discrimination. can’t
It stems from personal opinions and cultural beliefs, meaning any mortal filters data based on one’s experience. Sadly, this “filtering” process can cause a scientist to favor one outcome over another.
For an everyday person trying to solve a minor issue at home or work, succumbing to these biases is not such a big deal; in fact, most times, it is important.
But in the scientific community, where results must be inspected and reproduced, bias or discrimination must be avoided.
When to Use the Six Steps of the Scientific Method ?
One can use the scientific method anytime, anywhere! From the smallest conundrum to solving global problems, it is a process that can be applied to any science and any investigation.
Even if you are not considered a “scientist,” you will be surprised to know that people of all disciplines use it for all kinds of dilemmas.
Try to catch yourself next time you come by a question and see how you subconsciously or consciously use the scientific method.
Scientific Methods
What is scientific method.
The Scientific method is a process with the help of which scientists try to investigate, verify, or construct an accurate and reliable version of any natural phenomena. They are done by creating an objective framework for the purpose of scientific inquiry and analysing the results scientifically to come to a conclusion that either supports or contradicts the observation made at the beginning.
Scientific Method Steps
The aim of all scientific methods is the same, that is, to analyse the observation made at the beginning. Still, various steps are adopted per the requirement of any given observation. However, there is a generally accepted sequence of steps in scientific methods.

- Observation and formulation of a question: This is the first step of a scientific method. To start one, an observation has to be made into any observable aspect or phenomena of the universe, and a question needs to be asked about that aspect. For example, you can ask, “Why is the sky black at night? or “Why is air invisible?”
- Data Collection and Hypothesis: The next step involved in the scientific method is to collect all related data and formulate a hypothesis based on the observation. The hypothesis could be the cause of the phenomena, its effect, or its relation to any other phenomena.
- Testing the hypothesis: After the hypothesis is made, it needs to be tested scientifically. Scientists do this by conducting experiments. The aim of these experiments is to determine whether the hypothesis agrees with or contradicts the observations made in the real world. The confidence in the hypothesis increases or decreases based on the result of the experiments.
- Analysis and Conclusion: This step involves the use of proper mathematical and other scientific procedures to determine the results of the experiment. Based on the analysis, the future course of action can be determined. If the data found in the analysis is consistent with the hypothesis, it is accepted. If not, then it is rejected or modified and analysed again.
It must be remembered that a hypothesis cannot be proved or disproved by doing one experiment. It needs to be done repeatedly until there are no discrepancies in the data and the result. When there are no discrepancies and the hypothesis is proved, it is accepted as a ‘theory’.
Scientific Method Examples
Following is an example of the scientific method:
Growing bean plants:
- What is the purpose: The main purpose of this experiment is to know where the bean plant should be kept inside or outside to check the growth rate and also set the time frame as four weeks.
- Construction of hypothesis: The hypothesis used is that the bean plant can grow anywhere if the scientific methods are used.
- Executing the hypothesis and collecting the data: Four bean plants are planted in identical pots using the same soil. Two are placed inside, and the other two are placed outside. Parameters like the amount of exposure to sunlight, and amount of water all are the same. After the completion of four weeks, all four plant sizes are measured.
- Analyse the data: While analysing the data, the average height of plants should be taken into account from both places to determine which environment is more suitable for growing the bean plants.
- Conclusion: The conclusion is drawn after analyzing the data.
- Results: Results can be reported in the form of a tabular form.
Frequently Asked Questions – FAQs
What is scientific method, what is hypothesis, give an example of a simple hypothesis., define complex hypothesis., what are the steps of the scientific method, what is the aim of scientific methods, state true or false: observation and formulation of a question is the third step of scientific method, explain the step: analysis and conclusion., leave a comment cancel reply.
Your Mobile number and Email id will not be published. Required fields are marked *
Request OTP on Voice Call
Post My Comment
- Share Share
Register with BYJU'S & Download Free PDFs
Register with byju's & watch live videos.

- Privacy Policy
Home » Research Methods – Types, Examples and Guide
Research Methods – Types, Examples and Guide
Table of Contents

Research Methods
Definition:
Research Methods refer to the techniques, procedures, and processes used by researchers to collect , analyze, and interpret data in order to answer research questions or test hypotheses. The methods used in research can vary depending on the research questions, the type of data that is being collected, and the research design.
Types of Research Methods
Types of Research Methods are as follows:
Qualitative research Method
Qualitative research methods are used to collect and analyze non-numerical data. This type of research is useful when the objective is to explore the meaning of phenomena, understand the experiences of individuals, or gain insights into complex social processes. Qualitative research methods include interviews, focus groups, ethnography, and content analysis.
Quantitative Research Method
Quantitative research methods are used to collect and analyze numerical data. This type of research is useful when the objective is to test a hypothesis, determine cause-and-effect relationships, and measure the prevalence of certain phenomena. Quantitative research methods include surveys, experiments, and secondary data analysis.
Mixed Method Research
Mixed Method Research refers to the combination of both qualitative and quantitative research methods in a single study. This approach aims to overcome the limitations of each individual method and to provide a more comprehensive understanding of the research topic. This approach allows researchers to gather both quantitative data, which is often used to test hypotheses and make generalizations about a population, and qualitative data, which provides a more in-depth understanding of the experiences and perspectives of individuals.
Key Differences Between Research Methods
The following Table shows the key differences between Quantitative, Qualitative and Mixed Research Methods
Examples of Research Methods
Examples of Research Methods are as follows:
Qualitative Research Example:
A researcher wants to study the experience of cancer patients during their treatment. They conduct in-depth interviews with patients to gather data on their emotional state, coping mechanisms, and support systems.
Quantitative Research Example:
A company wants to determine the effectiveness of a new advertisement campaign. They survey a large group of people, asking them to rate their awareness of the product and their likelihood of purchasing it.
Mixed Research Example:
A university wants to evaluate the effectiveness of a new teaching method in improving student performance. They collect both quantitative data (such as test scores) and qualitative data (such as feedback from students and teachers) to get a complete picture of the impact of the new method.
Applications of Research Methods
Research methods are used in various fields to investigate, analyze, and answer research questions. Here are some examples of how research methods are applied in different fields:
- Psychology : Research methods are widely used in psychology to study human behavior, emotions, and mental processes. For example, researchers may use experiments, surveys, and observational studies to understand how people behave in different situations, how they respond to different stimuli, and how their brains process information.
- Sociology : Sociologists use research methods to study social phenomena, such as social inequality, social change, and social relationships. Researchers may use surveys, interviews, and observational studies to collect data on social attitudes, beliefs, and behaviors.
- Medicine : Research methods are essential in medical research to study diseases, test new treatments, and evaluate their effectiveness. Researchers may use clinical trials, case studies, and laboratory experiments to collect data on the efficacy and safety of different medical treatments.
- Education : Research methods are used in education to understand how students learn, how teachers teach, and how educational policies affect student outcomes. Researchers may use surveys, experiments, and observational studies to collect data on student performance, teacher effectiveness, and educational programs.
- Business : Research methods are used in business to understand consumer behavior, market trends, and business strategies. Researchers may use surveys, focus groups, and observational studies to collect data on consumer preferences, market trends, and industry competition.
- Environmental science : Research methods are used in environmental science to study the natural world and its ecosystems. Researchers may use field studies, laboratory experiments, and observational studies to collect data on environmental factors, such as air and water quality, and the impact of human activities on the environment.
- Political science : Research methods are used in political science to study political systems, institutions, and behavior. Researchers may use surveys, experiments, and observational studies to collect data on political attitudes, voting behavior, and the impact of policies on society.
Purpose of Research Methods
Research methods serve several purposes, including:
- Identify research problems: Research methods are used to identify research problems or questions that need to be addressed through empirical investigation.
- Develop hypotheses: Research methods help researchers develop hypotheses, which are tentative explanations for the observed phenomenon or relationship.
- Collect data: Research methods enable researchers to collect data in a systematic and objective way, which is necessary to test hypotheses and draw meaningful conclusions.
- Analyze data: Research methods provide tools and techniques for analyzing data, such as statistical analysis, content analysis, and discourse analysis.
- Test hypotheses: Research methods allow researchers to test hypotheses by examining the relationships between variables in a systematic and controlled manner.
- Draw conclusions : Research methods facilitate the drawing of conclusions based on empirical evidence and help researchers make generalizations about a population based on their sample data.
- Enhance understanding: Research methods contribute to the development of knowledge and enhance our understanding of various phenomena and relationships, which can inform policy, practice, and theory.
When to Use Research Methods
Research methods are used when you need to gather information or data to answer a question or to gain insights into a particular phenomenon.
Here are some situations when research methods may be appropriate:
- To investigate a problem : Research methods can be used to investigate a problem or a research question in a particular field. This can help in identifying the root cause of the problem and developing solutions.
- To gather data: Research methods can be used to collect data on a particular subject. This can be done through surveys, interviews, observations, experiments, and more.
- To evaluate programs : Research methods can be used to evaluate the effectiveness of a program, intervention, or policy. This can help in determining whether the program is meeting its goals and objectives.
- To explore new areas : Research methods can be used to explore new areas of inquiry or to test new hypotheses. This can help in advancing knowledge in a particular field.
- To make informed decisions : Research methods can be used to gather information and data to support informed decision-making. This can be useful in various fields such as healthcare, business, and education.
Advantages of Research Methods
Research methods provide several advantages, including:
- Objectivity : Research methods enable researchers to gather data in a systematic and objective manner, minimizing personal biases and subjectivity. This leads to more reliable and valid results.
- Replicability : A key advantage of research methods is that they allow for replication of studies by other researchers. This helps to confirm the validity of the findings and ensures that the results are not specific to the particular research team.
- Generalizability : Research methods enable researchers to gather data from a representative sample of the population, allowing for generalizability of the findings to a larger population. This increases the external validity of the research.
- Precision : Research methods enable researchers to gather data using standardized procedures, ensuring that the data is accurate and precise. This allows researchers to make accurate predictions and draw meaningful conclusions.
- Efficiency : Research methods enable researchers to gather data efficiently, saving time and resources. This is especially important when studying large populations or complex phenomena.
- Innovation : Research methods enable researchers to develop new techniques and tools for data collection and analysis, leading to innovation and advancement in the field.
About the author

Muhammad Hassan
Researcher, Academic Writer, Web developer
You may also like

Questionnaire – Definition, Types, and Examples

Data Collection – Methods Types and Examples

Delimitations in Research – Types, Examples and...

Research Process – Steps, Examples and Tips

Research Design – Types, Methods and Examples

Institutional Review Board – Application Sample...
Get science-backed answers as you write with Paperpal's Research feature
How to Write a Hypothesis? Types and Examples

All research studies involve the use of the scientific method, which is a mathematical and experimental technique used to conduct experiments by developing and testing a hypothesis or a prediction about an outcome. Simply put, a hypothesis is a suggested solution to a problem. It includes elements that are expressed in terms of relationships with each other to explain a condition or an assumption that hasn’t been verified using facts. 1 The typical steps in a scientific method include developing such a hypothesis, testing it through various methods, and then modifying it based on the outcomes of the experiments.
A research hypothesis can be defined as a specific, testable prediction about the anticipated results of a study. 2 Hypotheses help guide the research process and supplement the aim of the study. After several rounds of testing, hypotheses can help develop scientific theories. 3 Hypotheses are often written as if-then statements.
Here are two hypothesis examples:
Dandelions growing in nitrogen-rich soils for two weeks develop larger leaves than those in nitrogen-poor soils because nitrogen stimulates vegetative growth. 4
If a company offers flexible work hours, then their employees will be happier at work. 5
Table of Contents
- What is a hypothesis?
- Types of hypotheses
- Characteristics of a hypothesis
- Functions of a hypothesis
- How to write a hypothesis
- Hypothesis examples
- Frequently asked questions
What is a hypothesis?

A hypothesis expresses an expected relationship between variables in a study and is developed before conducting any research. Hypotheses are not opinions but rather are expected relationships based on facts and observations. They help support scientific research and expand existing knowledge. An incorrectly formulated hypothesis can affect the entire experiment leading to errors in the results so it’s important to know how to formulate a hypothesis and develop it carefully.
A few sources of a hypothesis include observations from prior studies, current research and experiences, competitors, scientific theories, and general conditions that can influence people. Figure 1 depicts the different steps in a research design and shows where exactly in the process a hypothesis is developed. 4
There are seven different types of hypotheses—simple, complex, directional, nondirectional, associative and causal, null, and alternative.
Types of hypotheses
The seven types of hypotheses are listed below: 5 , 6,7
- Simple : Predicts the relationship between a single dependent variable and a single independent variable.
Example: Exercising in the morning every day will increase your productivity.
- Complex : Predicts the relationship between two or more variables.
Example: Spending three hours or more on social media daily will negatively affect children’s mental health and productivity, more than that of adults.
- Directional : Specifies the expected direction to be followed and uses terms like increase, decrease, positive, negative, more, or less.
Example: The inclusion of intervention X decreases infant mortality compared to the original treatment.
- Non-directional : Does not predict the exact direction, nature, or magnitude of the relationship between two variables but rather states the existence of a relationship. This hypothesis may be used when there is no underlying theory or if findings contradict prior research.
Example: Cats and dogs differ in the amount of affection they express.
- Associative and causal : An associative hypothesis suggests an interdependency between variables, that is, how a change in one variable changes the other.
Example: There is a positive association between physical activity levels and overall health.
A causal hypothesis, on the other hand, expresses a cause-and-effect association between variables.
Example: Long-term alcohol use causes liver damage.
- Null : Claims that the original hypothesis is false by showing that there is no relationship between the variables.
Example: Sleep duration does not have any effect on productivity.
- Alternative : States the opposite of the null hypothesis, that is, a relationship exists between two variables.
Example: Sleep duration affects productivity.

Characteristics of a hypothesis
So, what makes a good hypothesis? Here are some important characteristics of a hypothesis. 8,9
- Testable : You must be able to test the hypothesis using scientific methods to either accept or reject the prediction.
- Falsifiable : It should be possible to collect data that reject rather than support the hypothesis.
- Logical : Hypotheses shouldn’t be a random guess but rather should be based on previous theories, observations, prior research, and logical reasoning.
- Positive : The hypothesis statement about the existence of an association should be positive, that is, it should not suggest that an association does not exist. Therefore, the language used and knowing how to phrase a hypothesis is very important.
- Clear and accurate : The language used should be easily comprehensible and use correct terminology.
- Relevant : The hypothesis should be relevant and specific to the research question.
- Structure : Should include all the elements that make a good hypothesis: variables, relationship, and outcome.
Functions of a hypothesis
The following list mentions some important functions of a hypothesis: 1
- Maintains the direction and progress of the research.
- Expresses the important assumptions underlying the proposition in a single statement.
- Establishes a suitable context for researchers to begin their investigation and for readers who are referring to the final report.
- Provides an explanation for the occurrence of a specific phenomenon.
- Ensures selection of appropriate and accurate facts necessary and relevant to the research subject.
To summarize, a hypothesis provides the conceptual elements that complete the known data, conceptual relationships that systematize unordered elements, and conceptual meanings and interpretations that explain the unknown phenomena. 1

How to write a hypothesis
Listed below are the main steps explaining how to write a hypothesis. 2,4,5
- Make an observation and identify variables : Observe the subject in question and try to recognize a pattern or a relationship between the variables involved. This step provides essential background information to begin your research.
For example, if you notice that an office’s vending machine frequently runs out of a specific snack, you may predict that more people in the office choose that snack over another.
- Identify the main research question : After identifying a subject and recognizing a pattern, the next step is to ask a question that your hypothesis will answer.
For example, after observing employees’ break times at work, you could ask “why do more employees take breaks in the morning rather than in the afternoon?”
- Conduct some preliminary research to ensure originality and novelty : Your initial answer, which is your hypothesis, to the question is based on some pre-existing information about the subject. However, to ensure that your hypothesis has not been asked before or that it has been asked but rejected by other researchers you would need to gather additional information.
For example, based on your observations you might state a hypothesis that employees work more efficiently when the air conditioning in the office is set at a lower temperature. However, during your preliminary research you find that this hypothesis was proven incorrect by a prior study.
- Develop a general statement : After your preliminary research has confirmed the originality of your proposed answer, draft a general statement that includes all variables, subjects, and predicted outcome. The statement could be if/then or declarative.
- Finalize the hypothesis statement : Use the PICOT model, which clarifies how to word a hypothesis effectively, when finalizing the statement. This model lists the important components required to write a hypothesis.
P opulation: The specific group or individual who is the main subject of the research
I nterest: The main concern of the study/research question
C omparison: The main alternative group
O utcome: The expected results
T ime: Duration of the experiment
Once you’ve finalized your hypothesis statement you would need to conduct experiments to test whether the hypothesis is true or false.
Hypothesis examples
The following table provides examples of different types of hypotheses. 10 ,11

Key takeaways
Here’s a summary of all the key points discussed in this article about how to write a hypothesis.
- A hypothesis is an assumption about an association between variables made based on limited evidence, which should be tested.
- A hypothesis has four parts—the research question, independent variable, dependent variable, and the proposed relationship between the variables.
- The statement should be clear, concise, testable, logical, and falsifiable.
- There are seven types of hypotheses—simple, complex, directional, non-directional, associative and causal, null, and alternative.
- A hypothesis provides a focus and direction for the research to progress.
- A hypothesis plays an important role in the scientific method by helping to create an appropriate experimental design.
Frequently asked questions
Hypotheses and research questions have different objectives and structure. The following table lists some major differences between the two. 9
Here are a few examples to differentiate between a research question and hypothesis.
Yes, here’s a simple checklist to help you gauge the effectiveness of your hypothesis. 9 1. When writing a hypothesis statement, check if it: 2. Predicts the relationship between the stated variables and the expected outcome. 3. Uses simple and concise language and is not wordy. 4. Does not assume readers’ knowledge about the subject. 5. Has observable, falsifiable, and testable results.
As mentioned earlier in this article, a hypothesis is an assumption or prediction about an association between variables based on observations and simple evidence. These statements are usually generic. Research objectives, on the other hand, are more specific and dictated by hypotheses. The same hypothesis can be tested using different methods and the research objectives could be different in each case. For example, Louis Pasteur observed that food lasts longer at higher altitudes, reasoned that it could be because the air at higher altitudes is cleaner (with fewer or no germs), and tested the hypothesis by exposing food to air cleaned in the laboratory. 12 Thus, a hypothesis is predictive—if the reasoning is correct, X will lead to Y—and research objectives are developed to test these predictions.
Null hypothesis testing is a method to decide between two assumptions or predictions between variables (null and alternative hypotheses) in a statistical relationship in a sample. The null hypothesis, denoted as H 0 , claims that no relationship exists between variables in a population and any relationship in the sample reflects a sampling error or occurrence by chance. The alternative hypothesis, denoted as H 1 , claims that there is a relationship in the population. In every study, researchers need to decide whether the relationship in a sample occurred by chance or reflects a relationship in the population. This is done by hypothesis testing using the following steps: 13 1. Assume that the null hypothesis is true. 2. Determine how likely the sample relationship would be if the null hypothesis were true. This probability is called the p value. 3. If the sample relationship would be extremely unlikely, reject the null hypothesis and accept the alternative hypothesis. If the relationship would not be unlikely, accept the null hypothesis.

To summarize, researchers should know how to write a good hypothesis to ensure that their research progresses in the required direction. A hypothesis is a testable prediction about any behavior or relationship between variables, usually based on facts and observation, and states an expected outcome.
We hope this article has provided you with essential insight into the different types of hypotheses and their functions so that you can use them appropriately in your next research project.
References
- Dalen, DVV. The function of hypotheses in research. Proquest website. Accessed April 8, 2024. https://www.proquest.com/docview/1437933010?pq-origsite=gscholar&fromopenview=true&sourcetype=Scholarly%20Journals&imgSeq=1
- McLeod S. Research hypothesis in psychology: Types & examples. SimplyPsychology website. Updated December 13, 2023. Accessed April 9, 2024. https://www.simplypsychology.org/what-is-a-hypotheses.html
- Scientific method. Britannica website. Updated March 14, 2024. Accessed April 9, 2024. https://www.britannica.com/science/scientific-method
- The hypothesis in science writing. Accessed April 10, 2024. https://berks.psu.edu/sites/berks/files/campus/HypothesisHandout_Final.pdf
- How to develop a hypothesis (with elements, types, and examples). Indeed.com website. Updated February 3, 2023. Accessed April 10, 2024. https://www.indeed.com/career-advice/career-development/how-to-write-a-hypothesis
- Types of research hypotheses. Excelsior online writing lab. Accessed April 11, 2024. https://owl.excelsior.edu/research/research-hypotheses/types-of-research-hypotheses/
- What is a research hypothesis: how to write it, types, and examples. Researcher.life website. Published February 8, 2023. Accessed April 11, 2024. https://researcher.life/blog/article/how-to-write-a-research-hypothesis-definition-types-examples/
- Developing a hypothesis. Pressbooks website. Accessed April 12, 2024. https://opentext.wsu.edu/carriecuttler/chapter/developing-a-hypothesis/
- What is and how to write a good hypothesis in research. Elsevier author services website. Accessed April 12, 2024. https://scientific-publishing.webshop.elsevier.com/manuscript-preparation/what-how-write-good-hypothesis-research/
- How to write a great hypothesis. Verywellmind website. Updated March 12, 2023. Accessed April 13, 2024. https://www.verywellmind.com/what-is-a-hypothesis-2795239
- 15 Hypothesis examples. Helpfulprofessor.com Published September 8, 2023. Accessed March 14, 2024. https://helpfulprofessor.com/hypothesis-examples/
- Editage insights. What is the interconnectivity between research objectives and hypothesis? Published February 24, 2021. Accessed April 13, 2024. https://www.editage.com/insights/what-is-the-interconnectivity-between-research-objectives-and-hypothesis
- Understanding null hypothesis testing. BCCampus open publishing. Accessed April 16, 2024. https://opentextbc.ca/researchmethods/chapter/understanding-null-hypothesis-testing/#:~:text=In%20null%20hypothesis%20testing%2C%20this,said%20to%20be%20statistically%20significant
Paperpal is a comprehensive AI writing toolkit that helps students and researchers achieve 2x the writing in half the time. It leverages 21+ years of STM experience and insights from millions of research articles to provide in-depth academic writing, language editing, and submission readiness support to help you write better, faster.
Get accurate academic translations, rewriting support, grammar checks, vocabulary suggestions, and generative AI assistance that delivers human precision at machine speed. Try for free or upgrade to Paperpal Prime starting at US$19 a month to access premium features, including consistency, plagiarism, and 30+ submission readiness checks to help you succeed.
Experience the future of academic writing – Sign up to Paperpal and start writing for free!
Related Reads:
- Empirical Research: A Comprehensive Guide for Academics
- How to Write a Scientific Paper in 10 Steps
- What is a Literature Review? How to Write It (with Examples)
- How to Paraphrase Research Papers Effectively
Measuring Academic Success: Definition & Strategies for Excellence
You may also like, what is academic writing: tips for students, why traditional editorial process needs an upgrade, paperpal’s new ai research finder empowers authors to..., what is hedging in academic writing , how to use ai to enhance your college..., ai + human expertise – a paradigm shift..., how to use paperpal to generate emails &..., ai in education: it’s time to change the..., is it ethical to use ai-generated abstracts without....
Numbers, Facts and Trends Shaping Your World
Read our research on:
Full Topic List
Regions & Countries
- Publications
- Our Methods
- Short Reads
- Tools & Resources
Read Our Research On:
Writing Survey Questions
Perhaps the most important part of the survey process is the creation of questions that accurately measure the opinions, experiences and behaviors of the public. Accurate random sampling will be wasted if the information gathered is built on a shaky foundation of ambiguous or biased questions. Creating good measures involves both writing good questions and organizing them to form the questionnaire.
Questionnaire design is a multistage process that requires attention to many details at once. Designing the questionnaire is complicated because surveys can ask about topics in varying degrees of detail, questions can be asked in different ways, and questions asked earlier in a survey may influence how people respond to later questions. Researchers are also often interested in measuring change over time and therefore must be attentive to how opinions or behaviors have been measured in prior surveys.
Surveyors may conduct pilot tests or focus groups in the early stages of questionnaire development in order to better understand how people think about an issue or comprehend a question. Pretesting a survey is an essential step in the questionnaire design process to evaluate how people respond to the overall questionnaire and specific questions, especially when questions are being introduced for the first time.
For many years, surveyors approached questionnaire design as an art, but substantial research over the past forty years has demonstrated that there is a lot of science involved in crafting a good survey questionnaire. Here, we discuss the pitfalls and best practices of designing questionnaires.
Question development
There are several steps involved in developing a survey questionnaire. The first is identifying what topics will be covered in the survey. For Pew Research Center surveys, this involves thinking about what is happening in our nation and the world and what will be relevant to the public, policymakers and the media. We also track opinion on a variety of issues over time so we often ensure that we update these trends on a regular basis to better understand whether people’s opinions are changing.
At Pew Research Center, questionnaire development is a collaborative and iterative process where staff meet to discuss drafts of the questionnaire several times over the course of its development. We frequently test new survey questions ahead of time through qualitative research methods such as focus groups , cognitive interviews, pretesting (often using an online, opt-in sample ), or a combination of these approaches. Researchers use insights from this testing to refine questions before they are asked in a production survey, such as on the ATP.
Measuring change over time
Many surveyors want to track changes over time in people’s attitudes, opinions and behaviors. To measure change, questions are asked at two or more points in time. A cross-sectional design surveys different people in the same population at multiple points in time. A panel, such as the ATP, surveys the same people over time. However, it is common for the set of people in survey panels to change over time as new panelists are added and some prior panelists drop out. Many of the questions in Pew Research Center surveys have been asked in prior polls. Asking the same questions at different points in time allows us to report on changes in the overall views of the general public (or a subset of the public, such as registered voters, men or Black Americans), or what we call “trending the data”.
When measuring change over time, it is important to use the same question wording and to be sensitive to where the question is asked in the questionnaire to maintain a similar context as when the question was asked previously (see question wording and question order for further information). All of our survey reports include a topline questionnaire that provides the exact question wording and sequencing, along with results from the current survey and previous surveys in which we asked the question.
The Center’s transition from conducting U.S. surveys by live telephone interviewing to an online panel (around 2014 to 2020) complicated some opinion trends, but not others. Opinion trends that ask about sensitive topics (e.g., personal finances or attending religious services ) or that elicited volunteered answers (e.g., “neither” or “don’t know”) over the phone tended to show larger differences than other trends when shifting from phone polls to the online ATP. The Center adopted several strategies for coping with changes to data trends that may be related to this change in methodology. If there is evidence suggesting that a change in a trend stems from switching from phone to online measurement, Center reports flag that possibility for readers to try to head off confusion or erroneous conclusions.
Open- and closed-ended questions
One of the most significant decisions that can affect how people answer questions is whether the question is posed as an open-ended question, where respondents provide a response in their own words, or a closed-ended question, where they are asked to choose from a list of answer choices.
For example, in a poll conducted after the 2008 presidential election, people responded very differently to two versions of the question: “What one issue mattered most to you in deciding how you voted for president?” One was closed-ended and the other open-ended. In the closed-ended version, respondents were provided five options and could volunteer an option not on the list.
When explicitly offered the economy as a response, more than half of respondents (58%) chose this answer; only 35% of those who responded to the open-ended version volunteered the economy. Moreover, among those asked the closed-ended version, fewer than one-in-ten (8%) provided a response other than the five they were read. By contrast, fully 43% of those asked the open-ended version provided a response not listed in the closed-ended version of the question. All of the other issues were chosen at least slightly more often when explicitly offered in the closed-ended version than in the open-ended version. (Also see “High Marks for the Campaign, a High Bar for Obama” for more information.)
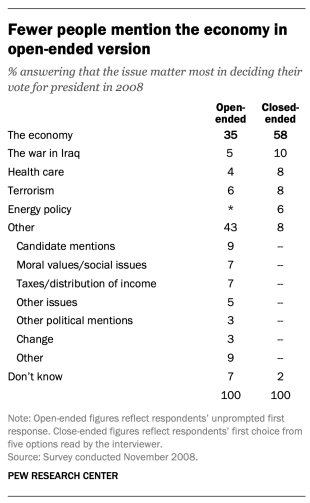
Researchers will sometimes conduct a pilot study using open-ended questions to discover which answers are most common. They will then develop closed-ended questions based off that pilot study that include the most common responses as answer choices. In this way, the questions may better reflect what the public is thinking, how they view a particular issue, or bring certain issues to light that the researchers may not have been aware of.
When asking closed-ended questions, the choice of options provided, how each option is described, the number of response options offered, and the order in which options are read can all influence how people respond. One example of the impact of how categories are defined can be found in a Pew Research Center poll conducted in January 2002. When half of the sample was asked whether it was “more important for President Bush to focus on domestic policy or foreign policy,” 52% chose domestic policy while only 34% said foreign policy. When the category “foreign policy” was narrowed to a specific aspect – “the war on terrorism” – far more people chose it; only 33% chose domestic policy while 52% chose the war on terrorism.
In most circumstances, the number of answer choices should be kept to a relatively small number – just four or perhaps five at most – especially in telephone surveys. Psychological research indicates that people have a hard time keeping more than this number of choices in mind at one time. When the question is asking about an objective fact and/or demographics, such as the religious affiliation of the respondent, more categories can be used. In fact, they are encouraged to ensure inclusivity. For example, Pew Research Center’s standard religion questions include more than 12 different categories, beginning with the most common affiliations (Protestant and Catholic). Most respondents have no trouble with this question because they can expect to see their religious group within that list in a self-administered survey.
In addition to the number and choice of response options offered, the order of answer categories can influence how people respond to closed-ended questions. Research suggests that in telephone surveys respondents more frequently choose items heard later in a list (a “recency effect”), and in self-administered surveys, they tend to choose items at the top of the list (a “primacy” effect).
Because of concerns about the effects of category order on responses to closed-ended questions, many sets of response options in Pew Research Center’s surveys are programmed to be randomized to ensure that the options are not asked in the same order for each respondent. Rotating or randomizing means that questions or items in a list are not asked in the same order to each respondent. Answers to questions are sometimes affected by questions that precede them. By presenting questions in a different order to each respondent, we ensure that each question gets asked in the same context as every other question the same number of times (e.g., first, last or any position in between). This does not eliminate the potential impact of previous questions on the current question, but it does ensure that this bias is spread randomly across all of the questions or items in the list. For instance, in the example discussed above about what issue mattered most in people’s vote, the order of the five issues in the closed-ended version of the question was randomized so that no one issue appeared early or late in the list for all respondents. Randomization of response items does not eliminate order effects, but it does ensure that this type of bias is spread randomly.
Questions with ordinal response categories – those with an underlying order (e.g., excellent, good, only fair, poor OR very favorable, mostly favorable, mostly unfavorable, very unfavorable) – are generally not randomized because the order of the categories conveys important information to help respondents answer the question. Generally, these types of scales should be presented in order so respondents can easily place their responses along the continuum, but the order can be reversed for some respondents. For example, in one of Pew Research Center’s questions about abortion, half of the sample is asked whether abortion should be “legal in all cases, legal in most cases, illegal in most cases, illegal in all cases,” while the other half of the sample is asked the same question with the response categories read in reverse order, starting with “illegal in all cases.” Again, reversing the order does not eliminate the recency effect but distributes it randomly across the population.
Question wording
The choice of words and phrases in a question is critical in expressing the meaning and intent of the question to the respondent and ensuring that all respondents interpret the question the same way. Even small wording differences can substantially affect the answers people provide.
[View more Methods 101 Videos ]
An example of a wording difference that had a significant impact on responses comes from a January 2003 Pew Research Center survey. When people were asked whether they would “favor or oppose taking military action in Iraq to end Saddam Hussein’s rule,” 68% said they favored military action while 25% said they opposed military action. However, when asked whether they would “favor or oppose taking military action in Iraq to end Saddam Hussein’s rule even if it meant that U.S. forces might suffer thousands of casualties, ” responses were dramatically different; only 43% said they favored military action, while 48% said they opposed it. The introduction of U.S. casualties altered the context of the question and influenced whether people favored or opposed military action in Iraq.
There has been a substantial amount of research to gauge the impact of different ways of asking questions and how to minimize differences in the way respondents interpret what is being asked. The issues related to question wording are more numerous than can be treated adequately in this short space, but below are a few of the important things to consider:
First, it is important to ask questions that are clear and specific and that each respondent will be able to answer. If a question is open-ended, it should be evident to respondents that they can answer in their own words and what type of response they should provide (an issue or problem, a month, number of days, etc.). Closed-ended questions should include all reasonable responses (i.e., the list of options is exhaustive) and the response categories should not overlap (i.e., response options should be mutually exclusive). Further, it is important to discern when it is best to use forced-choice close-ended questions (often denoted with a radio button in online surveys) versus “select-all-that-apply” lists (or check-all boxes). A 2019 Center study found that forced-choice questions tend to yield more accurate responses, especially for sensitive questions. Based on that research, the Center generally avoids using select-all-that-apply questions.
It is also important to ask only one question at a time. Questions that ask respondents to evaluate more than one concept (known as double-barreled questions) – such as “How much confidence do you have in President Obama to handle domestic and foreign policy?” – are difficult for respondents to answer and often lead to responses that are difficult to interpret. In this example, it would be more effective to ask two separate questions, one about domestic policy and another about foreign policy.
In general, questions that use simple and concrete language are more easily understood by respondents. It is especially important to consider the education level of the survey population when thinking about how easy it will be for respondents to interpret and answer a question. Double negatives (e.g., do you favor or oppose not allowing gays and lesbians to legally marry) or unfamiliar abbreviations or jargon (e.g., ANWR instead of Arctic National Wildlife Refuge) can result in respondent confusion and should be avoided.
Similarly, it is important to consider whether certain words may be viewed as biased or potentially offensive to some respondents, as well as the emotional reaction that some words may provoke. For example, in a 2005 Pew Research Center survey, 51% of respondents said they favored “making it legal for doctors to give terminally ill patients the means to end their lives,” but only 44% said they favored “making it legal for doctors to assist terminally ill patients in committing suicide.” Although both versions of the question are asking about the same thing, the reaction of respondents was different. In another example, respondents have reacted differently to questions using the word “welfare” as opposed to the more generic “assistance to the poor.” Several experiments have shown that there is much greater public support for expanding “assistance to the poor” than for expanding “welfare.”
We often write two versions of a question and ask half of the survey sample one version of the question and the other half the second version. Thus, we say we have two forms of the questionnaire. Respondents are assigned randomly to receive either form, so we can assume that the two groups of respondents are essentially identical. On questions where two versions are used, significant differences in the answers between the two forms tell us that the difference is a result of the way we worded the two versions.
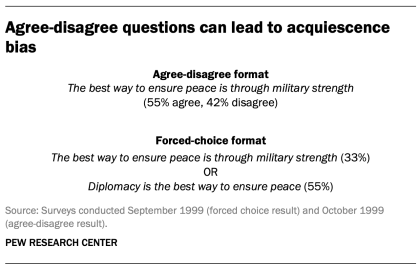
One of the most common formats used in survey questions is the “agree-disagree” format. In this type of question, respondents are asked whether they agree or disagree with a particular statement. Research has shown that, compared with the better educated and better informed, less educated and less informed respondents have a greater tendency to agree with such statements. This is sometimes called an “acquiescence bias” (since some kinds of respondents are more likely to acquiesce to the assertion than are others). This behavior is even more pronounced when there’s an interviewer present, rather than when the survey is self-administered. A better practice is to offer respondents a choice between alternative statements. A Pew Research Center experiment with one of its routinely asked values questions illustrates the difference that question format can make. Not only does the forced choice format yield a very different result overall from the agree-disagree format, but the pattern of answers between respondents with more or less formal education also tends to be very different.
One other challenge in developing questionnaires is what is called “social desirability bias.” People have a natural tendency to want to be accepted and liked, and this may lead people to provide inaccurate answers to questions that deal with sensitive subjects. Research has shown that respondents understate alcohol and drug use, tax evasion and racial bias. They also may overstate church attendance, charitable contributions and the likelihood that they will vote in an election. Researchers attempt to account for this potential bias in crafting questions about these topics. For instance, when Pew Research Center surveys ask about past voting behavior, it is important to note that circumstances may have prevented the respondent from voting: “In the 2012 presidential election between Barack Obama and Mitt Romney, did things come up that kept you from voting, or did you happen to vote?” The choice of response options can also make it easier for people to be honest. For example, a question about church attendance might include three of six response options that indicate infrequent attendance. Research has also shown that social desirability bias can be greater when an interviewer is present (e.g., telephone and face-to-face surveys) than when respondents complete the survey themselves (e.g., paper and web surveys).
Lastly, because slight modifications in question wording can affect responses, identical question wording should be used when the intention is to compare results to those from earlier surveys. Similarly, because question wording and responses can vary based on the mode used to survey respondents, researchers should carefully evaluate the likely effects on trend measurements if a different survey mode will be used to assess change in opinion over time.
Question order
Once the survey questions are developed, particular attention should be paid to how they are ordered in the questionnaire. Surveyors must be attentive to how questions early in a questionnaire may have unintended effects on how respondents answer subsequent questions. Researchers have demonstrated that the order in which questions are asked can influence how people respond; earlier questions can unintentionally provide context for the questions that follow (these effects are called “order effects”).
One kind of order effect can be seen in responses to open-ended questions. Pew Research Center surveys generally ask open-ended questions about national problems, opinions about leaders and similar topics near the beginning of the questionnaire. If closed-ended questions that relate to the topic are placed before the open-ended question, respondents are much more likely to mention concepts or considerations raised in those earlier questions when responding to the open-ended question.
For closed-ended opinion questions, there are two main types of order effects: contrast effects ( where the order results in greater differences in responses), and assimilation effects (where responses are more similar as a result of their order).

An example of a contrast effect can be seen in a Pew Research Center poll conducted in October 2003, a dozen years before same-sex marriage was legalized in the U.S. That poll found that people were more likely to favor allowing gays and lesbians to enter into legal agreements that give them the same rights as married couples when this question was asked after one about whether they favored or opposed allowing gays and lesbians to marry (45% favored legal agreements when asked after the marriage question, but 37% favored legal agreements without the immediate preceding context of a question about same-sex marriage). Responses to the question about same-sex marriage, meanwhile, were not significantly affected by its placement before or after the legal agreements question.

Another experiment embedded in a December 2008 Pew Research Center poll also resulted in a contrast effect. When people were asked “All in all, are you satisfied or dissatisfied with the way things are going in this country today?” immediately after having been asked “Do you approve or disapprove of the way George W. Bush is handling his job as president?”; 88% said they were dissatisfied, compared with only 78% without the context of the prior question.
Responses to presidential approval remained relatively unchanged whether national satisfaction was asked before or after it. A similar finding occurred in December 2004 when both satisfaction and presidential approval were much higher (57% were dissatisfied when Bush approval was asked first vs. 51% when general satisfaction was asked first).
Several studies also have shown that asking a more specific question before a more general question (e.g., asking about happiness with one’s marriage before asking about one’s overall happiness) can result in a contrast effect. Although some exceptions have been found, people tend to avoid redundancy by excluding the more specific question from the general rating.
Assimilation effects occur when responses to two questions are more consistent or closer together because of their placement in the questionnaire. We found an example of an assimilation effect in a Pew Research Center poll conducted in November 2008 when we asked whether Republican leaders should work with Obama or stand up to him on important issues and whether Democratic leaders should work with Republican leaders or stand up to them on important issues. People were more likely to say that Republican leaders should work with Obama when the question was preceded by the one asking what Democratic leaders should do in working with Republican leaders (81% vs. 66%). However, when people were first asked about Republican leaders working with Obama, fewer said that Democratic leaders should work with Republican leaders (71% vs. 82%).
The order questions are asked is of particular importance when tracking trends over time. As a result, care should be taken to ensure that the context is similar each time a question is asked. Modifying the context of the question could call into question any observed changes over time (see measuring change over time for more information).
A questionnaire, like a conversation, should be grouped by topic and unfold in a logical order. It is often helpful to begin the survey with simple questions that respondents will find interesting and engaging. Throughout the survey, an effort should be made to keep the survey interesting and not overburden respondents with several difficult questions right after one another. Demographic questions such as income, education or age should not be asked near the beginning of a survey unless they are needed to determine eligibility for the survey or for routing respondents through particular sections of the questionnaire. Even then, it is best to precede such items with more interesting and engaging questions. One virtue of survey panels like the ATP is that demographic questions usually only need to be asked once a year, not in each survey.
U.S. Surveys
Other research methods, sign up for our weekly newsletter.
Fresh data delivered Saturday mornings
1615 L St. NW, Suite 800 Washington, DC 20036 USA (+1) 202-419-4300 | Main (+1) 202-857-8562 | Fax (+1) 202-419-4372 | Media Inquiries
Research Topics
- Age & Generations
- Coronavirus (COVID-19)
- Economy & Work
- Family & Relationships
- Gender & LGBTQ
- Immigration & Migration
- International Affairs
- Internet & Technology
- Methodological Research
- News Habits & Media
- Non-U.S. Governments
- Other Topics
- Politics & Policy
- Race & Ethnicity
- Email Newsletters
ABOUT PEW RESEARCH CENTER Pew Research Center is a nonpartisan fact tank that informs the public about the issues, attitudes and trends shaping the world. It conducts public opinion polling, demographic research, media content analysis and other empirical social science research. Pew Research Center does not take policy positions. It is a subsidiary of The Pew Charitable Trusts .
Copyright 2024 Pew Research Center
Terms & Conditions
Privacy Policy
Cookie Settings
Reprints, Permissions & Use Policy
- Open access
- Published: 17 April 2024
A data-driven combined prediction method for the demand for intensive care unit healthcare resources in public health emergencies
- Weiwei Zhang 1 &
- Xinchun Li 1
BMC Health Services Research volume 24 , Article number: 477 ( 2024 ) Cite this article
235 Accesses
1 Altmetric
Metrics details
Public health emergencies are characterized by uncertainty, rapid transmission, a large number of cases, a high rate of critical illness, and a high case fatality rate. The intensive care unit (ICU) is the “last line of defense” for saving lives. And ICU resources play a critical role in the treatment of critical illness and combating public health emergencies.
This study estimates the demand for ICU healthcare resources based on an accurate prediction of the surge in the number of critically ill patients in the short term. The aim is to provide hospitals with a basis for scientific decision-making, to improve rescue efficiency, and to avoid excessive costs due to overly large resource reserves.
A demand forecasting method for ICU healthcare resources is proposed based on the number of current confirmed cases. The number of current confirmed cases is estimated using a bilateral long-short-term memory and genetic algorithm support vector regression (BILSTM-GASVR) combined prediction model. Based on this, this paper constructs demand forecasting models for ICU healthcare workers and healthcare material resources to more accurately understand the patterns of changes in the demand for ICU healthcare resources and more precisely meet the treatment needs of critically ill patients.
Data on the number of COVID-19-infected cases in Shanghai between January 20, 2020, and September 24, 2022, is used to perform a numerical example analysis. Compared to individual prediction models (GASVR, LSTM, BILSTM and Informer), the combined prediction model BILSTM-GASVR produced results that are closer to the real values. The demand forecasting results for ICU healthcare resources showed that the first (ICU human resources) and third (medical equipment resources) categories did not require replenishment during the early stages but experienced a lag in replenishment when shortages occurred during the peak period. The second category (drug resources) is consumed rapidly in the early stages and required earlier replenishment, but replenishment is timelier compared to the first and third categories. However, replenishment is needed throughout the course of the epidemic.
The first category of resources (human resources) requires long-term planning and the deployment of emergency expansion measures. The second category of resources (drugs) is suitable for the combination of dynamic physical reserves in healthcare institutions with the production capacity reserves of corporations. The third category of resources (medical equipment) is more dependent on the physical reserves in healthcare institutions, but care must be taken to strike a balance between normalcy and emergencies.
Peer Review reports
Introduction
The outbreak of severe acute respiratory syndrome (SARS) in 2003 was the first global public health emergency of the 21st century. From SARS to the coronavirus disease (COVID-19) pandemic at the end of 2019, followed shortly by the monkeypox epidemic of 2022, the global community has witnessed eight major public health events within the span of only 20 years [ 1 ]. These events are all characterized by high infection and fatality rates. For example, the number of confirmed COVID-19 cases worldwide is over 700 million, and the number of deaths has exceeded 7 million [ 2 ]. Every major public health emergency typically consists of four stages: incubation, outbreak, peak, and decline. During the outbreak and transmission, surges in the number of infected individuals and the number of critically ill patients led to a corresponding increase in the urgent demand for intensive care unit (ICU) medical resources. ICU healthcare resources provide material security for rescue work during major public health events as they allow critically ill patients to be treated, which decreases the case fatality rate and facilitates the prevention and control of epidemics. Nevertheless, in actual cases of prevention and control, the surge in patients has often led to shortages of ICU healthcare resources and a short-term mismatch of supply and demand, which are problems that have occurred several times in different regions. These issues can drastically impact anti-epidemic frontline healthcare workers and the treatment outcomes of infected patients. According to COVID-19 data from recent years, many infected individuals take about two weeks to progress from mild to severe disease. As the peak of severe cases tends to lag behind that of infected cases, predicting the changes in the number of new infections can serve as a valuable reference for healthcare institutions in forecasting the demand for ICU healthcare resources. The accurate forecasting of the demand for ICU healthcare resources can facilitate the rational resource allocation of hospitals under changes in demand patterns, which is crucial for improving the provision of critical care and rescue efficiency. Therefore, in this study, we combined a support vector regression (SVR) prediction model optimized by a genetic algorithm (GA) with bidirectional long-short-term memory (BILSTM), with the aim of enhancing the dynamic and accurate prediction of the number of current confirmed cases. Based on this, we forecasted the demand for ICU healthcare resources, which in turn may enable more efficient resource deployment during severe epidemic outbreaks and improve the precise supply of ICU healthcare resources.
Research on the demand forecasting of emergency materials generally employs quantitative methods, and traditional approaches mainly include linear regression and GM (1,1). Linear regression involves the use of regression equations to make predictions based on data. Sui et al. proposed a method based on multiple regression that aimed to predict the demand for emergency supplies in the power grid system following natural disasters [ 3 ]. Historical data was used to obtain the impact coefficient of each factor on emergency resource forecasting, enabling the quick calculation of the demand for each emergency resource during a given type of disaster. However, to ensure prediction accuracy, regression analysis needs to be supported by data from a large sample size. Other researchers have carried out demand forecasting for emergency supplies from the perspective of grey prediction models. Li et al. calculated the development coefficient and grey action of the grey GM (1,1) model using the particle swarm optimization algorithm to minimize the relative errors between the real and predicted values [ 4 ]. Although these studies have improved the prediction accuracy of grey models, they mainly involve pre-processing the initial data series without considering the issue of the excessively fast increase in predicted values by traditional grey GM (1,1) models. In emergency situations, the excessively fast increase in predicted values compared to real values will result in the consumption of a large number of unnecessary resources, thereby decreasing efficiency and increasing costs. As traditional demand forecasting models for emergency supplies have relatively poor perfect order rates in demand analysis, which result in low prediction accuracy, they are not mainstream.
At present, dynamic models of infectious diseases and demand forecasting models based on machine learning are at the cutting edge of research. With regard to the dynamic models of infectious diseases, susceptible infected recovered model (SIR) is a classic mathematical model employed by researchers [ 5 , 6 , 7 ]. After many years of development, the SIR model has been expanded into various forms within the field of disease transmission, including susceptible exposed infected recovered model (SEIR) and susceptible exposed infected recovered dead model (SEIRD) [ 8 , 9 ]. Nevertheless, with the outbreak of COVID-19, dynamic models of infectious diseases have once again come under the spotlight, with researchers combining individual and group variables and accounting for different factors to improve the initial models and reflect the state of COVID-19 [ 10 , 11 , 12 , 13 ]. Based on the first round of epidemic data from Wuhan, Li et al. predicted the time-delay distributions, epidemic doubling time, and basic reproductive number [ 14 ]. Upon discovering the presence of asymptomatic COVID-19 infections, researchers began constructing different SEIR models that considered the infectivity of various viral incubation periods, yielding their respective predictions of the inflection point. Based on this, Anggriani et al. further considered the impact of the status of infected individuals and established a transmission model with seven compartments [ 15 ]. Efimov et al. set the model parameters for separating the recovered and the dead as uncertain and applied the improved SEIR model to analyze the transmission trend of the pandemic [ 16 ]. In addition to analyzing the transmission characteristics of normal COVID-19 infection to predict the status of the epidemic, many researchers have also used infectious disease models to evaluate the effects of various epidemic preventive measures. Lin et al. applied an SEIR model that considered individual behavioral responses, government restrictions on public gatherings, pet-related transmission, and short-term population movements [ 17 ]. Cao et al. considered the containment effect of isolation measures on the pandemic and solved the model using Euler’s numerical method [ 18 ]. Reiner et al. employed an improved SEIR model to study the impact of non-pharmaceutical interventions implemented by the government (e.g., restricting population movement, enhancing disease testing, and increasing mask use) on disease transmission and evaluated the effectiveness of social distancing and the closure of public spaces [ 19 ]. These studies have mainly focused on modeling the COVID-19 pandemic to perform dynamic forecasting and analyze the effectiveness of control measures during the epidemic. Infectious disease dynamics offer good predictions for the early transmission trends of epidemics. However, this approach is unable to accurately estimate the spread of the virus in open-flow environments. Furthermore, it is also impossible to set hypothetical parameters, such as disease transmissibility and the recovery probability constant, that are consistent with the conditions in reality. Hence, with the increase in COVID-19 data, this approach has become inadequate for the accurate long-term analysis of epidemic trends.
Machine learning has shown significant advantages in this regard [ 20 , 21 ]. Some researchers have adopted the classic case-based reasoning approach in machine learning to make predictions. However, it is not feasible to find historical cases that fully match the current emergency event, so this approach has limited operability. Other researchers have also employed neural network training in machine learning to make predictions. For example, Hamou et al. predicted the number of injuries and deaths, which in turn were used to forecast the demand for emergency supplies [ 22 ]. However, this approach requires a large initial dataset and a high number of training epochs, while uncertainty due to large changes in intelligence information can lead to significant errors in data prediction [ 23 , 24 , 25 ]. To address these problems, researchers have conducted investigations that account (to varying degrees) for data characterized by time-series and non-linearity and have employed time-series models with good non-linear fitting [ 26 , 27 , 28 ]. The use of LSTM to explore relationships within the data can improve the accuracy of predicting COVID-19 to some extent. However, there are two problems with this approach. First, LSTM neural networks require extremely large datasets, and each wave of the epidemic development cycle would be insufficient to support a dataset suitable for LSTM. Second, neural networks involve a large number of parameters and highly complex models and, hence, are susceptible to overfitting, which can prevent them from achieving their true and expected advantages in prediction.
Overall, Our study differs from other papers in the following three ways. First, the research object of this paper focuses on the specific point of ICU healthcare resource demand prediction, aiming to improve the rate of critical care patient treatment. However, past research on public health emergencies has focused more on resource prediction , such as N95 masks, vaccines, and generalized medical supplies during the epidemic , to mitigate the impact of rapid transmission and high morbidity rates. This has led to less attention being paid to the reality of the surge in critically ill patients due to their high rates of severe illness and mortality.
Second, the idea of this paper is to further forecast resource needs based on the projected number of people with confirmed diagnoses, which is more applicable to healthcare organizations than most other papers that only predict the number of people involved. However, in terms of the methodology for projecting the number of people, this paper adopts a combined prediction method that combines regression algorithms and recurrent neural networks to propose a BILSTM-GASVR prediction model for the number of confirmed diagnoses. It capitalizes on both the suitability of SVR for small samples and non-linear prediction as well as the learning and memory abilities of BILSTM in processing time-series data. On the basis of the prediction model for the number of infected cases, by considering the characteristics of ICU healthcare resources, we constructed a demand forecasting model of emergency healthcare supplies. Past public health emergencies are more likely to use infectious disease models or a single prediction model in deep learning. some of the articles, although using a combination of prediction, but also more for the same method domain combination, such as CNN-LSTM, GRU-LSTM, etc., which are all recurrent neural networks.
Third, in terms of specific categorization of resources to be forecasted, considering the specificity of ICU medical resources, we introduce human resource prediction on the basis of previous studies focusing on material security, and classified ICU medical resources into three categories: ICU human resources, drugs and medical equipment. The purpose of this classification is to match the real-life prediction scenarios of public health emergencies and improve the demand forecasting performance for local ICU healthcare resources. Thus, it is easy for healthcare institutions to grasp the overall development of events, optimizing decision-making, and reducing the risk of healthcare systems collapsing during the outbreak stage.
In this section, we accomplish the following two tasks. Firstly, we introduce the idea of predicting the number of infected cases and show the principle of the relevant models. Secondly, based on the number of infected cases, ICU healthcare resources are divided into two categories (healthcare workers and healthcare supplies), and their respective demand forecasting models are constructed.
Prediction model for the number of infected cases
Gasvr model.
Support vector machine (SVM) is a machine-learning language for classification developed by Vapnik [ 29 ]. Suppose there are two categories of samples: H1 and H2. If hyperplane H is able to correctly classify the samples into these two categories and maximize the margin between the two categories, it is known as the optimal separating hyperplane (OSH). The sample vectors closest to the OSH in H1 and H2 are known as the support vectors. To apply SVM to prediction, it is essential to perform regression fitting. By introducing the \(\varepsilon\) -insensitive loss function, SVM can be converted to a support vector regression machine, where the role of the OSH is to minimize the error of all samples from this plane. SVR has a theoretical basis in statistical learning and relatively high learning performance, making it suitable for performing predictions in small-sample, non-linear, and multi-dimensional fields [ 30 , 31 ].
Assume the training sample set containing \(l\) training samples is given by \(\{({x}_{i},{y}_{i}),i=\mathrm{1,2},...,l\}\) , where \({x}_{i}=[{x}_{i}^{1},{x}_{i}^{2},...,{x}_{i}^{d}{]}^{\rm T}\) and \({y}_{i}\in R\) are the corresponding output values.
Let the regression function be \(f(x)=w\Phi (x)+b\) , where \(\phi (x)\) is the non-linear mapping function. The linear \(\varepsilon\) -insensitive loss function is defined as shown in formula ( 1 ).
Among the rest, \(f(x)\) is the predicted value returned by the regression function, and \(y\) is the corresponding real value. If the error between \(f(x)\) and \(y\) is ≤ \(\varepsilon\) , the loss is 0; otherwise, the loss is \(\left|y-f(x)\right|-\varepsilon\) .
The slack variables \({\xi }_{i}\) and \({\xi }_{i}^{*}\) are introduced, and \(w\) , \(b\) are solved using the following equation as shown in formula ( 2 ).
Among the rest, \(C\) is the penalty factor, with larger values indicating a greater penalty for errors > \(\varepsilon\) ; \(\varepsilon\) is defined as the error requirement, with smaller values indicating a smaller error of the regression function.
The Lagrange function is introduced to solve the above function and transformed into the dual form to give the formula ( 3 ).
Among the rest, \(K({x}_{i},{x}_{j})=\Phi ({x}_{i})\Phi ({x}_{j})\) is the kernel function. The kernel function determines the structure of high-dimensional feature space and the complexity of the final solution. The Gaussian kernel is selected for this study with the function \(K({x}_{i},{x}_{j})=\mathit{exp}(-\frac{\Vert {x}_{i}-{x}_{j}\Vert }{2{\sigma }^{2}})\) .
Let the optimal solution be \(a=[{a}_{1},{a}_{2},...,{a}_{l}]\) and \({a}^{*}=[{a}_{1}^{*},{a}_{2}^{*},...,{a}_{l}]\) to give the formula ( 4 ) and formula ( 5 ).
Among the rest, \({N}_{nsv}\) is the number of support vectors.
In sum, the regression function is as shown in formula ( 6 ).
when some of the parameters are not 0, the corresponding samples are the support vectors in the problem. This is the principle of SVR. The values of the three unknown parameters (penalty factor C, ε -insensitive loss function, and kernel function coefficient \(\sigma )\) , can directly impact the model effect. The penalty factor C affects the degree of function fitting through the selection of outliers in the sample by the function. Thus, excessively large values lead to better fit but poorer generalization, and vice versa. The ε value in the ε-insensitive loss function determines the accuracy of the model by affecting the width of support vector selection. Thus, excessively large values lead to lower accuracy that does not meet the requirements and excessively small values are overly complex and increase the difficulty. The kernel function coefficient \(\sigma\) determines the distribution and range of the training sample by controlling the size of inner product scaling in high-dimensional space, which can affect overfitting.
Therefore, we introduce other algorithms for optimization of the three parameters in SVR. Currently the commonly used algorithms are 32and some heuristic algorithms. Although the grid search method is able to find the highest classification accuracy, which is the global optimal solution. However, sometimes it can be time-consuming to find the optimal parameters for larger scales. If a heuristic algorithm is used, we could find the global optimal solution without having to trace over all the parameter points in the grid. And GA is one of the most commonly used heuristic algorithms, compared to other heuristic algorithms, it has the advantages of strong global search, generalizability, and broader blending with other algorithms.
Given these factors, we employ a GA to encode and optimize the relevant parameters of the model. The inputs are the experimental training dataset, the Gaussian kernel function expression, the maximum number of generations taken by the GA, the accuracy range of the optimized parameters, the GA population size, the fitness function, the probability of crossover, and the probability of mutation. The outputs are the optimal penalty factor C, ε-insensitive loss function parameter \(\varepsilon ,\) and optimal Gaussian kernel parameter \(\sigma\) of SVR, thus achieving the optimization of SVR. The basic steps involved in GA optimization are described in detail below, and the model prediction process is shown in Fig. 1 .

Prediction process of the GASVR model
Population initialization
The three parameters are encoded using binary arrays composed of 0–1 bit-strings. Each parameter consisted of six bits, and the initial population is randomly generated. The population size is set at 60, and the number of iterations is 200.
Fitness calculation
In the same dataset, the K-fold cross-validation technique is used to test each individual in the population, with K = 5. K-fold cross validation effectively avoids the occurrence of model over-learning and under-learning. For the judgment of the individual, this paper evaluates it in terms of fitness calculations. Therefore, combining the two enables the effective optimization of the model’s selected parameters and improves the accuracy of regression prediction.
Fitness is calculated using the mean error method, with smaller mean errors indicating better fitness. The fitness function is shown in formula ( 7 ) [ 32 ].
The individual’s genotype is decoded and mapped to the corresponding parameter value, which is substituted into the SVR model for training. The parameter optimization range is 0.01 ≤ C ≤ 100, 0.1 ≤ \(\sigma\) ≤ 20, and 0.001 ≤ ε ≤ 1.
Selection: The selection operator is performed using the roulette wheel method.
Crossover: The multi-point crossover operator, in which two chromosomes are selected and multiple crossover points are randomly chosen for swapping, is employed. The crossover probability is set at 0.9.
Mutation: The inversion mutation operator, in which two points are randomly selected and the gene values between them are reinserted to the original position in reverse order, is employed. The mutation probability is set at 0.09.
Decoding: The bit strings are converted to parameter sets.
The parameter settings of the GASVR model built in this paper are shown in Table 1 .
BILSTM model
The LSTM model is a special recurrent neural network algorithm that can remember the long-term dependencies of data series and has an excellent capacity for self-learning and non-linear fitting. LSTM automatically connects hidden layers across time points, such that the output of one time point can arbitrarily enter the output terminal or the hidden layer of the next time point. Therefore, it is suitable for the sample prediction of time-series data and can predict future data based on stored data. Details of the model are shown in Fig. 2 .

Schematic diagram of the LSTM model
LSTM consists of a forget gate, an input gate, and an output gate.
The forget gate combines the previous and current time steps to give the output of the sigmoid activation function. Its role is to screen the information from the previous state and identify useful information that truly impacts the subsequent time step. The equation for the forget gate is shown in formula ( 8 ).
Among the number, \(W_{f}\) is the weight of the forget gate, \({b}_{f}\) is the bias, \(\sigma\) is the sigmoid activation function, \({f}_{t}\) is the output of the sigmoid activation function, \(t-1\) is the previous time step, \(t\) is the current time step, and \({x}_{t}\) is the input time-series data at time step \(t\) .
The input gate is composed of the output of the sigmoid and tanh activation functions, and its role is to control the ratio of input information entering the information of a given time step. The equation for the input gate is shown in formula ( 9 ).
Among the number, \({W}_{i}\) is the output weight of the input gate, \({i}_{t}\) is the output of the sigmoid activation function, \({b}_{i}\) and \({b}_{C}\) are the biases of the input gate, and \({W}_{C}\) is the output of the tanh activation function.
The role of the output gate is to control the amount of information output at the current state, and its equation is shown in formula ( 10 ).
Among the number, \({W}_{o}\) is the weight of \({o}_{t}\) , and \({b}_{o}\) is the bias of the output gate.
The values of the above activation functions \(\sigma\) and tanh are generally shown in formulas ( 11 ) and ( 12 ).
\({C}_{t}\) is the data state of the current time step, and its value is determined by the input information of the current state and the information of the previous state. It is shown in formula ( 13 ).
Among the number, \(\widetilde{{C}_{t}}=\mathit{tan}h({W}_{c}[{h}_{t-1},{x}_{t}]+{b}_{c})\) .
\({h}_{t}\) is the state information of the hidden layer at the current time step, \({h}_{t}={o}_{t}\times \mathit{tan}h({c}_{t})\) .Each time step \({T}_{n}\) has a corresponding state \({C}_{t}\) . By undergoing the training process, the model can learn how to modify state \({C}_{t}\) through the forget, output, and input gates. Therefore, this state is consistently passed on, implying that important distant information will neither be forgotten nor significantly affected by unimportant information.
The above describes the principle of LSTM, which involves forward processing when applied. BILSTM consists of two LSTM networks, one of which processes the input sequence in the forward direction (i.e., the original order), while the other inputs the time series in the backward direction into the LSTM model. After processing both LSTM networks, the outputs are combined, which eventually gives the output results of the BILSTM model. Details of the model are presented in Fig. 3 .

Schematic diagram of the BILSTM model
Compared to LSTM, BILSTM can achieve bidirectional information extraction of the time-series and connect the two LSTM layers onto the same output layer. Therefore, in theory, its predictive performance should be superior to that of LSTM. In BILSTM, the equations of the forward hidden layer( \(\overrightarrow{{h}_{t}}\) ) , backward hidden layer( \(\overleftarrow{{h}_{t}}\) ) , and output layer( \({o}_{t}\) ) are shown in formulas ( 14 ) , ( 15 ) and ( 16 ).
The parameter settings of the BILSTM model built in this paper are shown in Table 2 .
Informer model
The Informer model follows the compiler-interpreter architecture in the Transformer model, and based on this, structural optimizations have been made to reduce the computational time complexity of the algorithm and to optimize the output form of the interpreter. The two optimization methods are described in detail next.
With large amounts of input data, neural network models can have difficulty capturing long-term interdependencies in sequences, which can produce gradient explosions or gradient vanishing and affect the model's prediction accuracy. Informer model solves the existential gradient problem by using a ProbSparse Self-attention mechanism to make more efficient than conventional self-attention.
The value of Transformer self-attention is shown in formula ( 17 ).
Among them, \(Q\in {R}^{{L}_{Q}\times d}\) is the query matrix, \(K\in {R}^{{L}_{K}\times d}\) is the key matrix, and \(V\in {R}^{{L}_{V}\times d}\) is the value matrix, which are obtained by multiplying the input matrix X with the corresponding weight matrices \({W}^{Q}\) , \({W}^{K}\) , \({W}^{V}\) respectively, and d is the dimensionality of Q, K, and V. Let \({q}_{i}\) , \({k}_{i}\) , \(v_{i}\) represent the ith row in the Q, K, V matrices respectively, then the ith attention coefficient is shown in formula ( 18 ) as follows.
Therein, \(p({k}_{j}|{q}_{i})\) denotes the traditional Transformer's probability distribution formula, and \(k({q}_{i},{K}_{l})\) denotes the asymmetric exponential sum function. Firstly, q=1 is assumed, which implies that the value of each moment is equally important; secondly, the difference between the observed distribution and the assumed one is evaluated by the KL scatter, if the value of KL is bigger, the bigger the difference with the assumed distribution, which represents the more important this moment is. Then through inequality \(ln{L}_{k}\le M({q}_{i},K)\le {\mathit{max}}_{j}\left\{\frac{{q}_{i}{k}_{j}^{\rm T}}{\sqrt{d}}\right\}-\frac{1}{{L}_{k}}{\sum }_{j=1}^{{L}_{k}}\left\{\frac{{q}_{i}{k}_{j}^{\rm T}}{\sqrt{d}}\right\}+ln{L}_{k}\) , \(M({q}_{i},K)\) is transformed into \(\overline{M}({q}_{i},K)\) . According to the above steps, the ith sparsity evaluation formula is obtained as shown in formula ( 19 ) [ 33 ].
One of them, \(M({q}_{i},K)\) denotes the ith sparsity measure; \(\overline{M}({q}_{i},K)\) denotes the ith approximate sparsity measure; \({L}_{k}\) is the length of query vector. \(TOP-u\) quantities of \(\overline{M}\) are selected to form \(\overline{Q}\) , \(\overline{Q}\) is the first u sparse matrices, and the final sparse self-attention is shown in Formula ( 20 ). At this point, the time complexity is still \(O({n}^{2})\) , and to solve this problem, only l moments of M2 are computed to reduce the time complexity to \(O(L\cdot \mathit{ln}(L))\) .
Informer uses a generative decoder to obtain long sequence outputs.Informer uses the standard decoder architecture shown in Fig. 4 , in long time prediction, the input given to the decoder is shown in formula ( 21 ).

Informer uses a generative decoder to obtain long sequence outputs
Therein, \({X}_{de}^{t}\) denotes the input to the decoder; \({X}_{token}^{t}\in {R}^{({L}_{token}+{L}_{y})\times {d}_{\mathit{mod}el}}\) is the dimension of the encoder output, which is the starting token without using all the output dimensions; \({X}_{0}^{t}\in {R}^{({L}_{token}+{L}_{y})\times {d}_{\mathit{mod}el}}\) is the dimension of the target sequence, which is uniformly set to 0; and finally the splicing input is performed to the encoder for prediction.
The parameter settings of Informer model created in this paper are shown in Table 3 .
BILSTM-GASVR combined prediction model
SVR has demonstrated good performance in solving problems like finite samples and non-linearity. Compared to deep learning methods, it offers faster predictions and smaller empirical risks. BILSTM has the capacity for long-term memory, can effectively identify data periodicity and trends, and is suitable for the processing of time-series data. Hence, it can be used to identify the effect of time-series on the number of confirmed cases. Given the advantages of these two methods in different scenarios, we combined them to perform predictions using GASVR, followed by error repair using BILSTM. The basic steps for prediction based on the BILSTM-GASVR model are as follows:
Normalization is performed on the initial data.
The GASVR model is applied to perform training and parameter optimization of the data to obtain the predicted value \(\widehat{{y}_{i}}\) .
After outputting the predicted value of GASVR, the residual sequence between the predicted value and real data is extracted to obtain the error \({\gamma }_{i}\) (i.e., \({\gamma }_{i}={y}_{i}-\widehat{{y}_{i}}\) ).
The BILSTM model is applied to perform training of the error to improve prediction accuracy. The BILSTM model in this paper is a multiple input single output model. Its inputs are the true and predicted error values \({\gamma }_{i}\) and its output is the new error value \(\widehat{{\gamma }_{i}}\) predicted by BILSTM.
The final predicted value is the sum of the GASVR predicted value and the BILSTM residual predicted value (i.e., \({Y}_{i}=\widehat{{y}_{i}}+\widehat{{\gamma }_{i}}\) ).
The parameter settings of the BILSTM-GASVR model built in this paper are shown in Table 4 .
Model testing criteria
To test the effect of the model, the prediction results of the BILSTM-GASVR model are compared to those of GASVR, LSTM, BILSTM and Informer. The prediction error is mainly quantified using three indicators: mean squared error (MSE), root mean squared error (RMSE), and correlation coefficient ( \(R^{2}\) ). Their respective equations are shown in formulas ( 22 ), ( 23 ) and ( 24 ).
Demand forecasting model of ICU healthcare resources
ICU healthcare resources can be divided into human and material resources. Human resources refer specifically to the professional healthcare workers in the ICU. Material resources, which are combined with the actual consumption of medical supplies, can be divided into consumables and non-consumables. Consumables refer to the commonly used drugs in the ICU, which include drugs for treating cardiac insufficiency, vasodilators, anti-shock vasoactive drugs, analgesics, sedatives, muscle relaxants, anti-asthmatic drugs, and anticholinergics. Given that public health emergencies have a relatively high probability of affecting the respiratory system, we compiled a list of commonly used drugs for respiratory diseases in the ICU (Table 5 ).
Non-consumables refer to therapeutic medical equipment, including electrocardiogram machines, blood gas analyzers, electrolyte analyzers, bedside diagnostic ultrasound machines, central infusion workstations, non-invasive ventilators, invasive ventilators, airway clearance devices, defibrillators, monitoring devices, cardiopulmonary resuscitation devices, and bedside hemofiltration devices.
The demand forecasting model of ICU healthcare resources constructed in this study, as well as its relevant parameters and definitions, are described below. \({R}_{ij}^{n}\) is the forecasted demand for the \(i\) th category of resources on the \(n\) th day in region \(j\) . \({Y}_{j}^{n}\) is the predicted number of current confirmed cases on the \(n\) th day in region \(j\) . \({M}_{j}^{n}\) is the number of ICU healthcare workers on the \(n\) th day in region \(j\) , which is given by the following formula: number of healthcare workers the previous day + number of new recruits − reduction in number the previous day, where the reduction in number refers to the number of healthcare workers who are unable to work due to infection or overwork. In general, the number of ICU healthcare workers should not exceed 5% of the number of current confirmed cases (i.e., it takes the value range [0, \(Y_{j}^{n}\) ×5%]). \(U_{i}\) is the maximum working hours or duration of action of the \(i\) th resource category within one day. \({A}_{j}\) is the number of resources in the \(i\) th category allocated to patients (i.e., how many units of resources in the \(i\) th category is needed for a patient who need the \(i\) th unit of the given resource). \({\varphi }_{i}\) is the demand conversion coefficient (i.e., the proportion of the current number of confirmed cases who need to use the \(i\) th resource category). \({C}_{ij}^{n}\) is the available quantity of material resources of the \(i\) th category on the \(n\) th day in region \(j\) . At the start, this quantity is the initial reserve, and once the initial reserve is exhausted, it is the surplus from the previous day. The formula for this parameter is given as follows: available quantity from the previous day + replenishment on the previous day − quantity consumed on the previous day, where if \({C}_{ij}^{n}\) is a negative number, it indicates the amount of shortage for the given category of resources on the previous day.
In summary, the demand forecast for emergency medical supplies constructed in this study is shown in formula ( 25 ).
The number of confirmed cases based on data-driven prediction is introduced into the demand forecasting model for ICU resources to forecast the demand for the various categories of resources. In addition to the number of current confirmed cases, the main variables of the first demand forecasting model for human resources are the available quantity and maximum working hours. The main variable of the second demand forecasting model for consumable resources is the number of units consumed by the available quantity. The main variable of the third model for non-consumable resources is the allocated quantity. These three resource types can be predicted using the demand forecasting model constructed in this study.
Prediction of the number of current infected cases
The COVID-19 situation in Shanghai is selected for our experiment. A total of 978 entries of epidemic-related data in Shanghai between January 20, 2020, and September 24, 2022, are collected from the epidemic reporting platform. This dataset is distributed over a large range and belongs to a right-skewed leptokurtic distribution. The specific statistical description of data is shown in Table 6 . Part of the data is shown in Table 7 .
And we divided the data training set and test set in an approximate 8:2 ratio, namely, 798 days for training (January 20, 2020 to March 27, 2022) and 180 days for prediction (March 28, 2022 to September 24, 2022).
Due to the large difference in order of magnitude between the various input features, directly implementing training and model construction would lead to suboptimal model performance. Such effects are usually eliminated through normalization. In terms of interval selection, [0, 1] reflects the probability distribution of the sample, whereas [-1, 1] mostly reflects the state distribution or coordinate distribution of the sample. Therefore, [-1, 1] is selected for the normalization interval in this study, and the processing method is shown in formula ( 26 ).
Among the rest, \(X\) is the input sample, \({X}_{min}\) and \({X}_{max}\) are the minimum and maximum values of the input sample, and \({X}_{new}\) is the input feature after normalization.
In addition, we divide the data normalization into two parts, considering that the amount of data in the training set is much more than the test set in the real operating environment. In the first step, we normalize the training set data directly according to the above formula; in the second step, we normalize the test data set using the maximum and minimum values of the training data set.
The values of the preprocessed data are inserted into the GASVR, LSTM, Informer, BILSTM models and the BILSTM-GASVR model is constructed. Figures 5 , 6 , 7 , 8 and 9 show the prediction results. From Figs. 5 , 6 , and 7 , it can be seen that in terms of data accuracy, GASVR more closely matches the real number of infected people relative to BILSTM and LSTM. Especially in the most serious period of the epidemic in Shanghai (April 17, 2022 to April 30, 2022), the advantage of the accuracy of the predicted data of GASVR is even more obvious, which is due to the characteristics of GASVR for small samples and nonlinear prediction. However, in the overall trend of the epidemic, BILSTM and LSTM, which have the ability to learn and memorize to process time series data, are superior. It is clearly seen that in April 1, 2022-April 7, 2022 and May 10, 2022-May 15, 2022, there is a sudden and substantial increase in GASVR in these two time phases, and a sudden and substantial decrease in April 10, 2022-April 14, 2022. These errors also emphasize the stability of BILSTM and LSTM, which are more closely matched to the real epidemic development situation in the whole process of prediction, and the difference between BILSTM and LSTM prediction is that the former predicts data more accurately than the latter, which is focused on the early stage of prediction as well as the peak period of the epidemic. Informer is currently an advanced time series forecasting method. From Fig. 8 , it can be seen that the prediction data accuracy and the overall trend of the epidemic are better than the single prediction models of GASVR, LSTM and BILSTM. However, Informer is more suitable for long time series and more complex and large prediction problems, so the total sample size of less than one thousand cases is not in the comfort zone of Informer model. Figure 9 shows that the BILSTM-GASVR model constructed in this paper is more suitable for this smaller scale prediction problem, with the best prediction results, closest to the actual parameter (number of current confirmed cases), demonstrating small sample and time series advantages. In Short, the prediction effect of models is ranked as follows: BILSTM-GASVR> Informer> GASVR> BILSTM> LSTM.

The prediction result of the GASVR model

The prediction result of the LSTM model

The prediction result of the BILSTM model

The prediction result of the Informer model

The prediction result of the BILSTM-GASVR model
The values of the three indicators (MSE, RMSE, and correlation coefficient \({R}^{2}\) ) for the five models are shown in Table 8 . MSE squares the error so that the larger the model error, the larger the value, which help capture the model's prediction error more sensitively. RMSE is MSE with a root sign added to it, which allows for a more intuitive representation of the order of magnitude difference from the true value. \({R}^{2}\) is a statistical indicator used to assess the overall goodness of fit of the model, which reflects the overall consistency of the predicted trend and does not specifically reflect the degree of data. The results in the Table 8 are consistent with the prediction results in the figure above, while the ranking of MSE, RMSE, and \({R}^{2}\) are also the same (i.e., BILSTM-GASVR> Informer> GASVR> BILSTM> LSTM).
In addition, we analyze the five model prediction data using significance tests as a way of demonstrating whether the model used is truly superior to the other baseline models. The test dataset with kurtosis higher than 4 does not belong to the approximate normal distribution, so parametric tests are not used in this paper. Given that the datasets predicted by each of the five models are continuous and independent datasets, this paper uses the Kruskal-Wallis test, which is a nonparametric test. The test steps are as follows.
Determine hypotheses (H0, H1) and significance level ( \(\alpha\) ).
For each data set, all its sample data are combined and ranked from smallest to largest. Then find the number of data items ( \({n}_{i}\) ), rank sum ( \({R}_{i}\) ) and mean rank of each group of data respectively.
Based on the rank sum, the test statistic (H) is calculated for each data set in the Kruskal-Wallis test. The specific calculation is shown in formula ( 27 ).
According to the test statistic and degrees of freedom, find the corresponding p-value in the Kruskal-Wallis distribution table. Based on the P-value, determine whether the original hypothesis is valid.
In the significance test, we set the significance setting original hypothesis (H0) as there is no significant difference between the five data sets obtained from the five predictive models. We set the alternative hypothesis (H1) as there is a significant difference between the five data sets obtained from the five predictive models. At the same time, we choose the most commonly used significance level taken in the significance test, namely 0.05. In this paper, multiple comparisons and two-by-two comparisons of the five data sets obtained from the five predictive models are performed through the SPSS software. The results of the test show that in the multiple comparison session, P=0.001<0.05, so H0 is rejected, which means that the difference between the five groups of data is significant. In the two-by-two comparison session, BILSTM-GASVR is less than 0.05 from the other four prediction models. The specific order of differences is Informer < GASVR < BILSTM < LSTM, which means that the BILSTM-GASVR prediction model does get a statistically significant difference between the dataset and the other models.
In summary, combined prediction using the BILSTM-GASVR model is superior to the other four single models in various aspects in the case study analysis of Shanghai epidemic with a sample size of 978.
Demand forecasting of ICU healthcare resources
Combined with the predicted number of current infected cases, representatives are selected from the three categories of resources for forecasting. The demand for nurses is selected as the representative for the first category of resources.
In view of the fact that there are currently no specific medications that are especially effective for this public health emergency, many ICU treatment measures involved helping patients survive as their own immune systems eliminated the virus. This involved, for example, administering antibiotics when patients developed a secondary bacterial infection. glucocorticoids are used to temporarily suppress the immune system when their immune system attacked and damaged lung tissues causing patients to have difficulty breathing. extracorporeal membrane oxygenation (ECMO) is used for performing cardiopulmonary resuscitation when patients are suffering from cardiac arrest. In this study, we take dexamethasone injection (5 mg), a typical glucocorticoid drug, as the second category of ICU resources (i.e., drugs); and invasive ventilators as the third category of ICU resources (i.e., medical equipment).
During the actual epidemic in Shanghai, the municipal government organized nine critical care teams, which are stationed in eight municipally designated hospitals and are dedicated to the treatment of critically ill patients. In this study, the ICU nurses, dexamethasone injections, and invasive ventilators in Shanghai are selected as the prediction targets and introduced into their respective demand forecasting models. Forecasting of ICU healthcare resources is then performed for the period from March 28, 2022, to April 28, 2022, as an example. Part of the parameter settings for the three types of resources are shown in Tables 9 , 10 , and 11 , respectively.
Table 12 shows the forecasting results of the demand for ICU nurses, dexamethasone injections, and invasive ventilators during the epidemic wave in Shanghai between March 28, 2022, and April 28, 2022.
For the first category (i.e., ICU nurses), human resource support is only needed near the peak period, but the supply could not be replenished immediately. In the early stages, Shanghai could only rely on the nurses’ perseverance, alleviating the shortage of human resources by reducing the number of shifts and increasing working hours. This situation persisted until about April 10 and is only resolved when nurses from other provinces and regions successively arrived in Shanghai.
The second category of ICU resources is drugs, which are rapidly consumed. The pre-event reserve of 30,000 dexamethasone injections could only be maintained for a short period and is fully consumed during the outbreak. Furthermore, daily replenishment is still needed, even when the epidemic has passed its peak and begun its decline.
The third category is invasive ventilators, which are non-consumables. Thus, the reserve lasted for a relatively long period of time in the early stages and did not require replenishment after its maximum usage during the peak period.
Demand forecasting models are constructed based on the classification of healthcare resources according to their respective features. We choose ICU nurses, dexamethasone injections, and invasive ventilators as examples, and then forecast demand for the epidemic wave in Shanghai between March 28, 2022, and April 28, 2022. The main conclusions are as follows:
A long period of time is needed to train ICU healthcare workers who can independently be on duty, taking at least one year from graduation to entering the hospital, in addition to their requiring continuous learning, regular theoretical training, and the accumulation of clinical experience during this process. Therefore, for the first category of ICU healthcare resources, in the long term, healthcare institutions should place a greater emphasis on their talent reserves. Using China as an example, according to the third ICU census, the ratio of the number of ICU physicians to the number of beds is 0.62:1 and the ratio of the number of nurses to the number of beds is 1.96:1, which are far lower than those stipulated by China itself and those of developed countries. Therefore, a fundamental solution is to undertake proactive and systematic planning and construction to ensure the more effective deployment of human resources in the event of a severe outbreak. In the short term, healthcare institutions should focus on the emergency expansion capacity of their human resources. In case there are healthcare worker shortages during emergencies, the situation can be alleviated by summoning retired workers back to work and asking senior medical students from various universities to help in the hospitals to prevent the passive scenario of severely compressing the rest time of existing staff or waiting for external aid. However, it is worth noting that to ensure the effectiveness of such a strategy of using retired healthcare workers or senior students of university medical faculties, it is necessary for healthcare organizations to provide them with regular training in the norm, such as organizing 2-3 drills a year, to ensure the professionalism and proficiency of healthcare workers who are temporarily and suddenly put on the job. At the same time, it is also necessary to fully mobilize the will of individuals. Medical institutions can provide certain subsidies to retired health-care workers and award them with honorable titles. For senior university medical students, volunteer certificates are issued and priority is given to their internships, so that health-care workers can be motivated to self-realization through spiritual and material rewards.
Regarding the second category of ICU resources (i.e., drugs), healthcare institutions perform the subdivision of drug types and carry out dynamic physical preparations based on 15–20% of the service recipient population for clinically essential drugs. This will enable a combination of good preparedness during normal times and emergency situations. In addition, in-depth collaboration with corporations is needed to fully capitalize on their production capacity reserves. This helps medical institutions to be able to scientifically and rationally optimize the structure and quantity of their drug stockpiles to prevent themselves from being over-stressed. Yet the lower demand for medicines at the end of the epidemic led to the problem of excess inventory of enterprises at a certain point in time must be taken into account. So, the medical institutions should sign a strategic agreement on stockpiling with enterprises, take the initiative to bear the guaranteed acquisition measures, and consider the production costs of the cooperative enterprises. These measures are used to truly safeguard the enthusiasm of the cooperative enterprises to invest in the production capacity.
Regarding the third category of ICU resources (i.e., medical equipment), large-scale medical equipment cannot be rapidly mass-produced due to limitations in the capacity for emergency production and conversion of materials. In addition, the bulk procurement of high-end medical equipment is also relatively difficult in the short term. Therefore, it is more feasible for healthcare institutions to have physical reserves of medical equipment, such as invasive ventilators. However, the investment costs of medical equipment are relatively high. Ventilators, for example, cost up to USD $50,000, and subsequent maintenance costs are also relatively high. After all, according to the depreciable life of specialized hospital equipment, the ventilator, as a surgical emergency equipment, is depreciated over five years. And its depreciation rate is calculated at 20% annually for the first five years, which means a monthly depreciation of $835. Thus, the excessively low utilization rate of such equipment will also impact the hospital. Healthcare institutions should, therefore, conduct further investigations on the number of beds and the reserves of ancillary large-scale medical equipment to find a balance between capital investment and patient needs.
The limitations of this paper are reflected in the following three points. Firstly, in the prediction of the number of infections, the specific research object in this paper is COVID-19, and other public health events such as SARS, H1N1, and Ebola are not comparatively analyzed. The main reason for this is the issue of data accessibility, and it is easier for us to analyze events that have occurred in recent years. In addition, using the Shanghai epidemic as a specific case may be more representative of the epidemic situation in an international metropolis with high population density and mobility. Hence, it has certain regional limitations, and subsequent studies should expand the scope of the case study to reflect the characteristics of epidemic transmission in different types of urban areas and enhance the generalizability.
Secondly, the main emphasis of this study is on forecasting the demand for ICU healthcare resources across the entire region of the epidemic, with a greater focus on patient demand during public emergencies. Our aims are to help all local healthcare institutions more accurately identify changes in ICU healthcare resource demand during this local epidemic wave, gain a more accurate understanding of the treatment demands of critically ill patients, and carry out comprehensive, scientifically based decision-making. Therefore, future studies can examine individual healthcare institutions instead and incorporate the actual conditions of individual units to construct multi-objective models. In this way, medical institutions can further grasp the relationship between different resource inputs and the recovery rate of critically ill patients, and achieve the balance between economic and social benefits.
Finally, for the BILSTM-GASVR prediction method, in addition to the number of confirmed diagnoses predicted for an outbreak in a given region, other potential applications beyond this type of medium-sized dataset still require further experimentation. For example, whether the method is suitable for procurement planning of a certain supply in production management, forecasting of goods sales volume in marketing management, and other long-period, large-scale and other situations.
Within the context of major public health events, the fluctuations and uncertainties in the demand for ICU resources can lead to large errors between the healthcare supply and actual demand. Therefore, this study focuses on the question of forecasting the demand for ICU healthcare resources. Based on the number of current confirmed cases, we construct the BILSTM-GASVR model for predicting the number of patients. By comparing the three indicators (MSE, MAPE, and correlation coefficient \(R^{2}\) ) and the results of the BILSTM, LSTM, and GASVR models, we demonstrate that our model have a higher accuracy. Our findings can improve the timeliness and accuracy of predicting ICU healthcare resources and enhance the dynamics of demand forecasting. Hence, this study may serve as a reference for the scientific deployment of ICU resources in healthcare institutions during major public events.
Given the difficulty in data acquisition, only the Shanghai epidemic dataset is selected in this paper, which is one of the limitations mentioned in Part 4. Although the current experimental cases of papers in the same field do not fully conform to this paper, the results of the study cannot be directly compared. However, after studying the relevant reviews and the results of the latest papers, we realize that there is consistency in the prediction ideas and prediction methods [ 34 , 35 ]. Therefore, we summarize the similarities and differences between the results of the study and other research papers in epidemic forecasting as shown below.
Similarities: on the one hand, we all characterize trends in the spread of the epidemic and predict the number of infections over 14 days. On the other hand, we all select the current mainstream predictive models as the basis and combine or improve them. Moreover, we all use the same evaluation method (comparison of metrics such as MSE and realistic values) to evaluate the improvements against other popular predictive models.
Differences: on the one hand, other papers focus more on predictions at the point of the number of patients, such as hospitalization rate, number of infections, etc. This paper extends the prediction from the number of patients to the specific healthcare resources. This paper extends the prediction from the number of patients to specific healthcare resources. We have divided the medical resources and summarized the demand regularities of the three types of information in the epidemic, which provides the basis for decision-making on epidemic prevention to the government or medical institutions. On the other hand, in addition to the two assessment methods mentioned in the same point, this paper assesses the performance of the prediction methods with the help of significance tests, which is a statistical approach to data. This can make the practicality of the forecasting methodology more convincing.
Availability of data and materials
The datasets used and/or analysed during the current study available from the corresponding author on reasonable request.
Yuan, R., Yang, Y., Wang, X., Duo, J. & Li, J. Study on the forecasting and allocation of emergency medical material needs in the event of a major infectious disease outbreak. J Saf Environ. https://doi.org/10.13637/j.issn.1009-6094.2023.2448 .
Total epidemic data (global). 2024. Retrieved March 30, 2024, from: https://www.sy72.com/world/ .
Sui, K., Wang, Y., Wang, S., Chen, C., & Sun, X. A multiple regression analysis-based method for forecasting the demand of emergency materials for power grids. Electron Technol Softw Eng. 2016; (23), 195-197.
Li K, Liu L, Zhai J, Khoshgoftaar TM, Li T. The improved grey model based on particle swarm optimization algorithm for time series prediction. Eng Appl Artif Intell. 2016;55:285–91. https://doi.org/10.1016/j.engappai.2016.07.005 .
Article Google Scholar
Fan R, Wang Y, Luo M. SEIR-based COVID-19 transmission model and inflection point prediction analysis. J Univ Electron Sci Technol China. 2020;49(3):369–74.
Google Scholar
Neves AGM, Guerrero G. Predicting the evolution of the COVID-19 epidemic with the A-SIR model: Lombardy, Italy and São Paulo state Brazil. Physica D. 2020;413:132693. https://doi.org/10.1016/j.physd.2020.132693 .
Article PubMed PubMed Central Google Scholar
Li R, Pei S, Chen B, Song Y, Zhang T, Wan Y, Shaman J. Substantial undocumented infection facilitates the rapid dissemination of novel coronavirus (SARS-CoV-2). Science. 2020;368(6490):489–93. https://doi.org/10.1126/science.abb3221 .
Article CAS PubMed PubMed Central Google Scholar
Kermack WO, McKendrick AG. A contribution to the mathematical theory of epidemics. Proc R Soc Lond. 1927;115(772):700–21. https://doi.org/10.1098/rspa.1927.0118 .
Hethcote HW. The mathematics of infectious diseases. Siam Rev. 2000;42(4):599–653. https://doi.org/10.1137/SIREAD000042000004000655000001 .
Estrada E. COVID-19 and SARS-CoV-2. Modeling the present, looking at the future. Phys Rep. 2020;869:1–51. https://doi.org/10.1016/j.physrep.2020.07.005 .
Mizumoto K, Chowell G. Transmission potential of the novel coronavirus (COVID-19) onboard the diamond Princess Cruises Ship, 2020. Infect Dis Model. 2020;5:264–70. https://doi.org/10.1016/j.idm.2020.02.003 .
Delamater PL, Street EJ, Leslie TF, Yang YT, Jacobsen KH. Complexity of the Basic Reproduction Number. Emerg Infect Dis. 2019;25(1):1–4. https://doi.org/10.3201/eid2501.171901 .
Annas S, Isbar Pratama M, Rifandi M, Sanusi W, Side S. Stability analysis and numerical simulation of SEIR model for pandemic COVID-19 spread in Indonesia. Chaos Solit Fract. 2020;139:110072. https://doi.org/10.1016/j.chaos.2020.110072 .
Li Q, Guan X, Wu P, Wang X, Zhou L, Tong Y, Ren R, Leung KSM. Early Transmission Dynamics in Wuhan, China, of Novel Coronavirus-Infected Pneumonia. N Engl J Med. 2020;382(13):1199–209. https://doi.org/10.1056/NEJMoa2001316 .
Anggriani N, Ndii MZ, Amelia R, Suryaningrat W, Pratama MAA. A mathematical COVID-19 model considering asymptomatic and symptomatic classes with waning immunity. Alexandria Eng J. 2022;61(1):113–24. https://doi.org/10.1016/j.aej.2021.04.104 .
Efimov D, Ushirobira R. On an interval prediction of COVID-19 development based on a SEIR epidemic model. Ann Rev Control. 2021;51:477–87. https://doi.org/10.1016/j.arcontrol.2021.01.006 .
Lin Q, Zhao S, Gao D, Lou Y, Yang S, Musa SS, Wang MH. A conceptual model for the coronavirus disease 2019 (COVID-19) outbreak in Wuhan, China with individual reaction and governmental action. Int J Infect Dis. 2020;93:211–16.
Chao L, Feng P, Shi P. Study on the epidemic development of COVID-19 in Hubei. J Zhejiang Univ (Med Sci). 2020;49(2):178–84.
Reiner RC, Barber RM, Collins JK, et al. Modeling COVID-19 scenarios for the United States. Nat Med. 2021;27(1):94–105. https://doi.org/10.1038/s41591-020-1132-9 .
Article CAS Google Scholar
Shahid F, Zameer A, Muneeb M. Predictions for COVID-19 with deep learning models of LSTM GRU and Bi-LSTM. Chaos Solit Fract. 2020;140:110212. https://doi.org/10.1016/j.chaos.2020.110212 .
Chimmula VKR, Zhang L. Time series forecasting of COVID-19 transmission in Canada using LSTM networks. Chaos Solit Fract. 2020;135:109864. https://doi.org/10.1016/j.chaos.2020.109864 .
Hamou AA, Azroul E, Hammouch Z, Alaoui AAL. A fractional multi-order model to predict the COVID-19 outbreak in Morocco. Appl Comput Math. 2021;20(1):177–203.
Zhou, L., Zhao, C., Liu, N., Yao, X., & Cheng, Z. Improved LSTM-based deep learning model for COVID-19 prediction using optimized approach. Eng Appl Artif Intell. 2023; 122. https://doi.org/10.1016/j.engappai.2023.106157 .
Huang C, Chen Y, Ma Y, Kuo P. Multiple-Input Deep Convolutional Neural Network Model for COVID-19 Forecasting in China. medRxiv. 2020;74822–34.
Gautam Y. Transfer Learning for COVID-19 cases and deaths forecast using LSTM network. Isa Trans. 2022;124:41–56. https://doi.org/10.1016/j.isatra.2020.12.057 .
Article PubMed Google Scholar
Ghany KKA, Zawbaa HM, Sabri HM. COVID-19 prediction using LSTM algorithm: GCC case study. Inform Med Unlock. 2021;23:100566. https://doi.org/10.1016/j.imu.2021.100566 .
Devaraj J, Madurai Elavarasan R, Pugazhendhi R, Shafiullah GM, Ganesan S, Jeysree AK, Khan IA, Hossain E. Forecasting of COVID-19 cases using deep learning models: Is it reliable and practically significant? Results Phys. 2021;21:103817. https://doi.org/10.1016/j.rinp.2021.103817 .
Arora P, Kumar H, Panigrahi BK. Prediction and analysis of COVID-19 positive cases using deep learning models: a descriptive case study of India. Chaos Solit Fract. 2020;139:110017. https://doi.org/10.1016/j.chaos.2020.110017 .
Liu Q, Fung DLX, Lac L, Hu P. A Novel Matrix Profile-Guided Attention LSTM Model for Forecasting COVID-19 Cases in USA. Front Public Health. 2021;9:741030. https://doi.org/10.3389/fpubh.2021.741030 .
Ribeiro MHDM, Da Silva RG, Mariani VC, Coelho LDS. Short-term forecasting COVID-19 cumulative confirmed cases: perspectives for Brazil. Chaos Solit Fract. 2020;135:109853. https://doi.org/10.1016/j.chaos.2020.109853 .
Shoko C, Sigauke C. Short-term forecasting of COVID-19 using support vector regression: an application using Zimbabwean data. Am J Infect Control. 2023. https://doi.org/10.1016/j.ajic.2023.03.010 .
Feng T, Peng Y, Wang J. ISGS: A Combinatorial Model for Hysteresis Effects. Acta Electronica Sinica. 2023;09:2504–9.
Zhou H, Zhang S, Peng J, Zhang S, Li J, Xiong H, Zhang W. Informer: Beyond Efficient Transformer for Long Sequence Time-Series Forecasting. AAAI Conference Artif Intell. 2020;35(12):11106–15.
Rahimi I, Chen F, Gandomi AH. A review on COVID-19 forecasting models. Neural Comput Applic. 2023;35:23671–81. https://doi.org/10.1007/s00521-020-05626-8 .
Chen J, Creamer GG, Ning Y, Ben-Zvi T. Healthcare Sustainability: Hospitalization Rate Forecasting with Transfer Learning and Location-Aware News Analysis. Sustainability. 2023;15(22):15840. https://doi.org/10.3390/su152215840 .
Download references
Acknowledgements
We would like to acknowledge the hard and dedicated work of all the staff that implemented the intervention and evaluation components of the study.
No external funding received to conduct this study.
Author information
Authors and affiliations.
School of Logistics, Beijing Wuzi University, No.321, Fuhe Street, Tongzhou District, Beijing, 101149, China
Weiwei Zhang & Xinchun Li
You can also search for this author in PubMed Google Scholar
Contributions
WWZ and XCL conceived the idea and conceptualised the study. XCL collected the data. WWZ analysed the data. WWZ and XCL drafted the manuscript, then WWZ and XCLreviewed the manuscript. WWZ and XCL read and approved the final draft.
Corresponding author
Correspondence to Xinchun Li .
Ethics declarations
Ethics approval and consent to participate.
Not applicable.
Consent for publication
Competing interests.
The authors declare no competing interests.
Additional information
Publisher’s note.
Springer Nature remains neutral with regard to jurisdictional claims in published maps and institutional affiliations.
Rights and permissions
Open Access This article is licensed under a Creative Commons Attribution 4.0 International License, which permits use, sharing, adaptation, distribution and reproduction in any medium or format, as long as you give appropriate credit to the original author(s) and the source, provide a link to the Creative Commons licence, and indicate if changes were made. The images or other third party material in this article are included in the article's Creative Commons licence, unless indicated otherwise in a credit line to the material. If material is not included in the article's Creative Commons licence and your intended use is not permitted by statutory regulation or exceeds the permitted use, you will need to obtain permission directly from the copyright holder. To view a copy of this licence, visit http://creativecommons.org/licenses/by/4.0/ . The Creative Commons Public Domain Dedication waiver ( http://creativecommons.org/publicdomain/zero/1.0/ ) applies to the data made available in this article, unless otherwise stated in a credit line to the data.
Reprints and permissions
About this article
Cite this article.
Zhang, W., Li, X. A data-driven combined prediction method for the demand for intensive care unit healthcare resources in public health emergencies. BMC Health Serv Res 24 , 477 (2024). https://doi.org/10.1186/s12913-024-10955-8
Download citation
Received : 21 September 2023
Accepted : 05 April 2024
Published : 17 April 2024
DOI : https://doi.org/10.1186/s12913-024-10955-8
Share this article
Anyone you share the following link with will be able to read this content:
Sorry, a shareable link is not currently available for this article.
Provided by the Springer Nature SharedIt content-sharing initiative
- Public health emergency
- ICU healthcare resource demand
- Machine learning
- Combined prediction
BMC Health Services Research
ISSN: 1472-6963
- General enquiries: [email protected]
IMAGES
VIDEO
COMMENTS
The first step in the scientific method is to identify and observe a phenomenon that requires explanation. This can involve asking open-ended questions, making detailed observations using our senses or tools, or exploring natural patterns, which are sources to develop hypotheses. 2. Formulation of a Hypothesis.
The scientific method. At the core of biology and other sciences lies a problem-solving approach called the scientific method. The scientific method has five basic steps, plus one feedback step: Make an observation. Ask a question. Form a hypothesis, or testable explanation. Make a prediction based on the hypothesis.
The scientific method is critical to the development of scientific theories, which explain empirical (experiential) laws in a scientifically rational manner.In a typical application of the scientific method, a researcher develops a hypothesis, tests it through various means, and then modifies the hypothesis on the basis of the outcome of the tests and experiments.
A simple example of the scientific method is: Ask a Question: Why does Greenland look so large on a map? Background Research: Learn that Greenland is a quarter the size of the United States in land mass. Also learn that Mercator projection maps are made by transferring the images from a sphere to a sheet of paper wrapped around the sphere in a ...
The scientific method is a series of steps followed by scientific investigators to answer specific questions about the natural world. It involves making observations, formulating a hypothesis, and conducting scientific experiments. Scientific inquiry starts with an observation followed by the formulation of a question about what has been ...
When conducting research, scientists use the scientific method to collect measurable, empirical evidence in an experiment related to a hypothesis (often in the form of an if/then statement) that ...
Examples of descriptive research include case studies, naturalistic observation, and correlation studies. Phone surveys that are often used by marketers are one example of descriptive research. ... In order to do this, psychologists utilize the scientific method to conduct psychological research. The scientific method is a set of principles and ...
With our list of scientific method examples, you can easily follow along with the six steps and understand the process you may be struggling with.
A brief history of the scientific method. The scientific method has its roots in the sixteenth and seventeenth centuries. Philosophers Francis Bacon and René Descartes are often credited with formalizing the scientific method because they contrasted the idea that research should be guided by metaphysical pre-conceived concepts of the nature of reality—a position that, at the time, was ...
The study of scientific method is the attempt to discern the activities by which that success is achieved. Among the activities often identified as characteristic of science are systematic observation and experimentation, inductive and deductive reasoning, and the formation and testing of hypotheses and theories.
The scientific method involves making observations and asking questions. Scientists form hypotheses based on these observations and then develop controlled experiments to collecting and analyze data. Using this data, they are able to draw conclusions and form questions for new scientific research.
The six steps of the scientific method are as follows: 1. Come Up with a Question, 2. Gather Background Research, 3. Make a Hypothesis, 4. Design an Experiment, 5. Analyze the Data, and 6. Form a ...
The scientific method is a process that includes several steps: First, an observation or question arises about a phenomenon. Then a hypothesis is formulated to explain the phenomenon, which is used to make predictions about other related occurrences or to predict the results of new observations quantitatively. Finally, these predictions are put to the test through experiments or further ...
Unsure of what the steps of the scientific method are? Not sure how to apply the scientific method? Watch how we use the scientific method to explore the sci...
The scientific method is a systematic way of conducting experiments or studies so that you can explore the world around you and answer questions using reason and evidence. It's a step-by-step ...
Research methods are specific procedures for collecting and analyzing data. Developing your research methods is an integral part of your research design. When planning your methods, there are two key decisions you will make. First, decide how you will collect data. Your methods depend on what type of data you need to answer your research question:
The scientific method is an empirical method for acquiring knowledge that has characterized the development of science since at least the 17th century. (For notable practitioners in previous centuries, see history of scientific method.). The scientific method involves careful observation coupled with rigorous scepticism, because cognitive assumptions can distort the interpretation of the ...
The scientific method is a combined method, which consists of theoretical knowledge and practical experimentation by using scientific instruments, analysis and comparisons of results, and then peer reviews. Scientific Method. The scientific method is a procedure that the scientists use to conduct research.
Scientific Method Examples. Following is an example of the scientific method: ... It includes components like variables, population and the relation between the variables. A research hypothesis is a hypothesis that is used to test the relationship between two or more variables. Q3 . Give an example of a simple hypothesis.
The scientific method is an important tool to solve problems and learn from our observations. There are six steps to it:Observe and Ask QuestionsResearchForm...
Scientific research is the systematic and empirical investigation of phenomena, theories, or hypotheses, using various methods and techniques in order to acquire new knowledge or to validate existing knowledge. It involves the collection, analysis, interpretation, and presentation of data, as well as the formulation and testing of hypotheses.
Research Methodology refers to the systematic and scientific approach used to conduct research, investigate problems, and gather data and information for a specific purpose. It involves the techniques and procedures used to identify, collect, analyze, and interpret data to answer research questions or solve research problems.
Quantitative research methods are used to collect and analyze numerical data. This type of research is useful when the objective is to test a hypothesis, determine cause-and-effect relationships, and measure the prevalence of certain phenomena. Quantitative research methods include surveys, experiments, and secondary data analysis.
All research studies involve the use of the scientific method, which is a mathematical and experimental technique used to conduct experiments by developing and testing a hypothesis or a prediction about an outcome. ... This step provides essential background information to begin your research. For example, if you notice that an office's ...
A chemical method for selective labelling of the key amino acid tryptophan A broadly applicable method allows selective, rapid and efficient chemical modification of the side chain of tryptophan ...
Women have historically encountered numerous barriers and biases that hinder their complete participation and acknowledgement in scientific research. In this study, we scrutinise the gender makeup of scientific teams publishing in top business journals based on a cross-sectional sample of 46,708 publications. Scientific impact is based on the citations, and novelty by using the NLP co ...
[View more Methods 101 Videos]. An example of a wording difference that had a significant impact on responses comes from a January 2003 Pew Research Center survey. When people were asked whether they would "favor or oppose taking military action in Iraq to end Saddam Hussein's rule," 68% said they favored military action while 25% said they opposed military action.
The aim is to provide hospitals with a basis for scientific decision-making, to improve rescue efficiency, and to avoid excessive costs due to overly large resource reserves. ... Research on the demand forecasting of emergency materials generally employs quantitative methods, and traditional approaches mainly include linear regression and GM (1 ...