- Preferences


Press Ganey Scores - PowerPoint PPT Presentation

Press Ganey Scores
Press ganey scores research on promptness in returning calls, helpfulness on the telephone, and wait before going to an exam room – powerpoint ppt presentation.
- Research on Promptness in Returning Calls, Helpfulness on the Telephone, and Wait Before Going to an Exam Room
- Press Ganey report and data analysis
- Peer group benchmarks
- Promptness in returning calls
- Helpfulness on the telephone
- Wait before going to an exam room
- Solutions and suggestions
- The Good News
- Perhaps surprisingly, patients are often very complimentary when writing comments on their patient surveys. In fact, almost half of all patient comments are positive.
- Patients are three times more likely to write a positive comment about their nurse or physician than a negative comment.
- The Not So Good News
- Communication between hospital staff and patients continues to need improvement.
- Communication is a key driver of satisfaction.
- Patients want more attention and credence given to their personal needs.
- quotes from Pulse Report on www.pressganey.com
- What Is Most Important
- The top priority for improving hospitals, from the patient perspective, is the ability to respond to their concerns and complaints.
- A hospitals ability to provide attention to the patients needs is the strongest predictor of a facilitys overall performance score on the HCAHPS public reporting tool. HCAHPS, or Hospital Consumer Assessment of Healthcare Providers and Systems, was developed under the direction of the Centers for Medicare and Medicaid Services (CMS). Beginning with discharges in July 2007, hospitals are required to participate in HCAHPS to receive full CMS reimbursement.
- Survey Standards for DHJ
- (from Director John Hayes)
- average of 125 surveys per month sent to patients 198 surveys sent in a the last two months
- 9 average returned rate or about 11 surveys returned per month
- taken from reports on www.pressganey.com
- Patient Issues
- patients want immediate resolution of their concern
- staff members are not offering the answer that patients want
- patients perceive that staff members are not meeting their needs due to cultural differences
- Staff Issues
- there is not enough time or staff to return calls promptly
- patients are not available when staff members call
- patients are not providing telephone numbers where DHJ can easily reach them
- patients perceive reasonable delays in callback times as poor service
- Patient Dissatisfaction
- loss of current and new patients
- misunderstandings about services leads to a loss in JPS reputation
- cost of a patients complaint equals loss in dollars ()
- - lawsuits and other legal
- proceedings
- Steps in Patient Complaint
- patient contacts Patient Relations
- Director notifies staff
- staff member researches complaint and conducts an inquiry
- staff member calls and meets with patient to present answers
- resolved on the spot noted in files
- reduced staff affects morale and productivity and leads to less helpfulness on the telephone
- good time management is needed
- universal telephone system
- - calls in queue patients get
- lost in call tree and are holding for 15 minutes or longer
- - need an enhanced single
- telephone system to support
- a large volume of calls
- patient seeks help right away for all concerns
- patients believe that JPS owes them high quality service at no cost
- patients perception of how issues they have are handled or answered can be either
- - helpful or
- - not helpful
- needs met and responses correspond to patients questions
- receives a call back within 2 hours
- receives a follow-up call from their doctor
- appointments are available same day
- Not Helpful
- does not receive a call back in a timely manner
- staff members are not answering when phones ring
- providers are not hearing what patients are saying
- Registration
- check-in time taking an average of 5-8 minutes
- slow internet access
- - A2K takes less time per
- patient than Net Access
- - dropped transactions
- can take gt5 minutes
- Steps in Registration
- give educational information to patient
- verify demographic/ask questions
- scan/verify insurance
- consent/HIPAA forms
- receive co-pay
- put on armbands
- MDs show up late
- providers take too long between patients
- providers take time teaching residents as well as treating patients
- providers may handle emergency procedures and schedules fall further behind
- physicians do not have quick access to patient clinical information
- medical records are not available at time of visit
- support staff members are sometimes shared between providers
- patient shows up late
- patient does not have proper information
- pediatric patients require different forms
- non-compliant or difficult patients require more time to register and treat
- patients hate waiting and leave without being seen by a provider
- patients take smoking and bathroom breaks and staff needs to search for them
- patient visit type changes from a simple follow-up to a longer medical procedure
- patients miss follow-ups and require referral appointments, but referrals are hard to get since there are not enough specialists
- patients schedule appointments but will show up at a walk-in clinic they prefer walk-ins over appointments
- DNKA rate (DHJ) 23 for April 2007
- - 2,484 patients scheduled and 571 DNKA
- YTD rate (DHJ) 19
- - 12,430 patients scheduled and 2,349 DNKA
- patient liaison/advocate position
- use of automated Televox callback system to its fullest extent
- clearly inform patient of when to expect a return call
- clarify patients expectations of what DHJ can immediately do for them
- Quotes from staff members
- need to specify on survey how long the wait for return phone call is we
- may be calling back in a reasonable timeframe from a medical standpoint,
- but some (most) pts. are unrealistic in their expectations. Waiting longer
- than 5 mins. is too long for some and they will give low marks
- pt. wants an instant/complete answer to their call regardless of the issue.
- Some things are not resolved in 15-30 mins. maybe before the end of
- hire a dedicated phone operator (PBX)
- create a better mix in the staffing model
- re-enforce customer service behavior with staff
- patient orientation to learn DHJ processes
- provide discharge instruction sheet and informational handouts to patients
- Quotes from some DHJ staff on tone of voice
- a caring tone is low and well modulated,
- with an underlying smile in tone
- when you express and transmit through your
- voice that you really care in a soft tone, you
- identify yourself with patients concerns and
- Controllable
- physicians starting work on time
- getting patients in and out of exam rooms faster
- improve current practice management system to create faster registration times
- Uncontrollable
- self-service kiosks similar to the ones in airports
- improving Net Access software to make it more user-friendly
- Press Ganey 2007 Report
- The Press Ganey Hospital Pulse Report Patient Perspectives on American Health Care finds patients want care that is safe, complete, and delivered in a manner that respects their personhood.
- Responding to concerns with compassion and sensitivity is essential to providing quality patient care.
- The bottom line is, if hospitals listen to what patients are saying then they can offer them better quality health care.
PowerShow.com is a leading presentation sharing website. It has millions of presentations already uploaded and available with 1,000s more being uploaded by its users every day. Whatever your area of interest, here you’ll be able to find and view presentations you’ll love and possibly download. And, best of all, it is completely free and easy to use.
You might even have a presentation you’d like to share with others. If so, just upload it to PowerShow.com. We’ll convert it to an HTML5 slideshow that includes all the media types you’ve already added: audio, video, music, pictures, animations and transition effects. Then you can share it with your target audience as well as PowerShow.com’s millions of monthly visitors. And, again, it’s all free.
About the Developers
PowerShow.com is brought to you by CrystalGraphics , the award-winning developer and market-leading publisher of rich-media enhancement products for presentations. Our product offerings include millions of PowerPoint templates, diagrams, animated 3D characters and more.

Press Ganey
Home Company
Putting Human Experience at the heart of healthcare
Press Ganey improves the overall Human Experience through innovation, insight, and action. We bring our deep expertise, layered on top of our groundbreaking technology. And together? That’s when the magic happens. We exist to help industry leaders shape the future of healthcare. And reimagine the system so it just works. For everyone.

Our mission
Through best-in-class talent and expertise we will offer the most innovative and connected Human Experience platform designed to turn data into insights, and insights into stories that change the world.
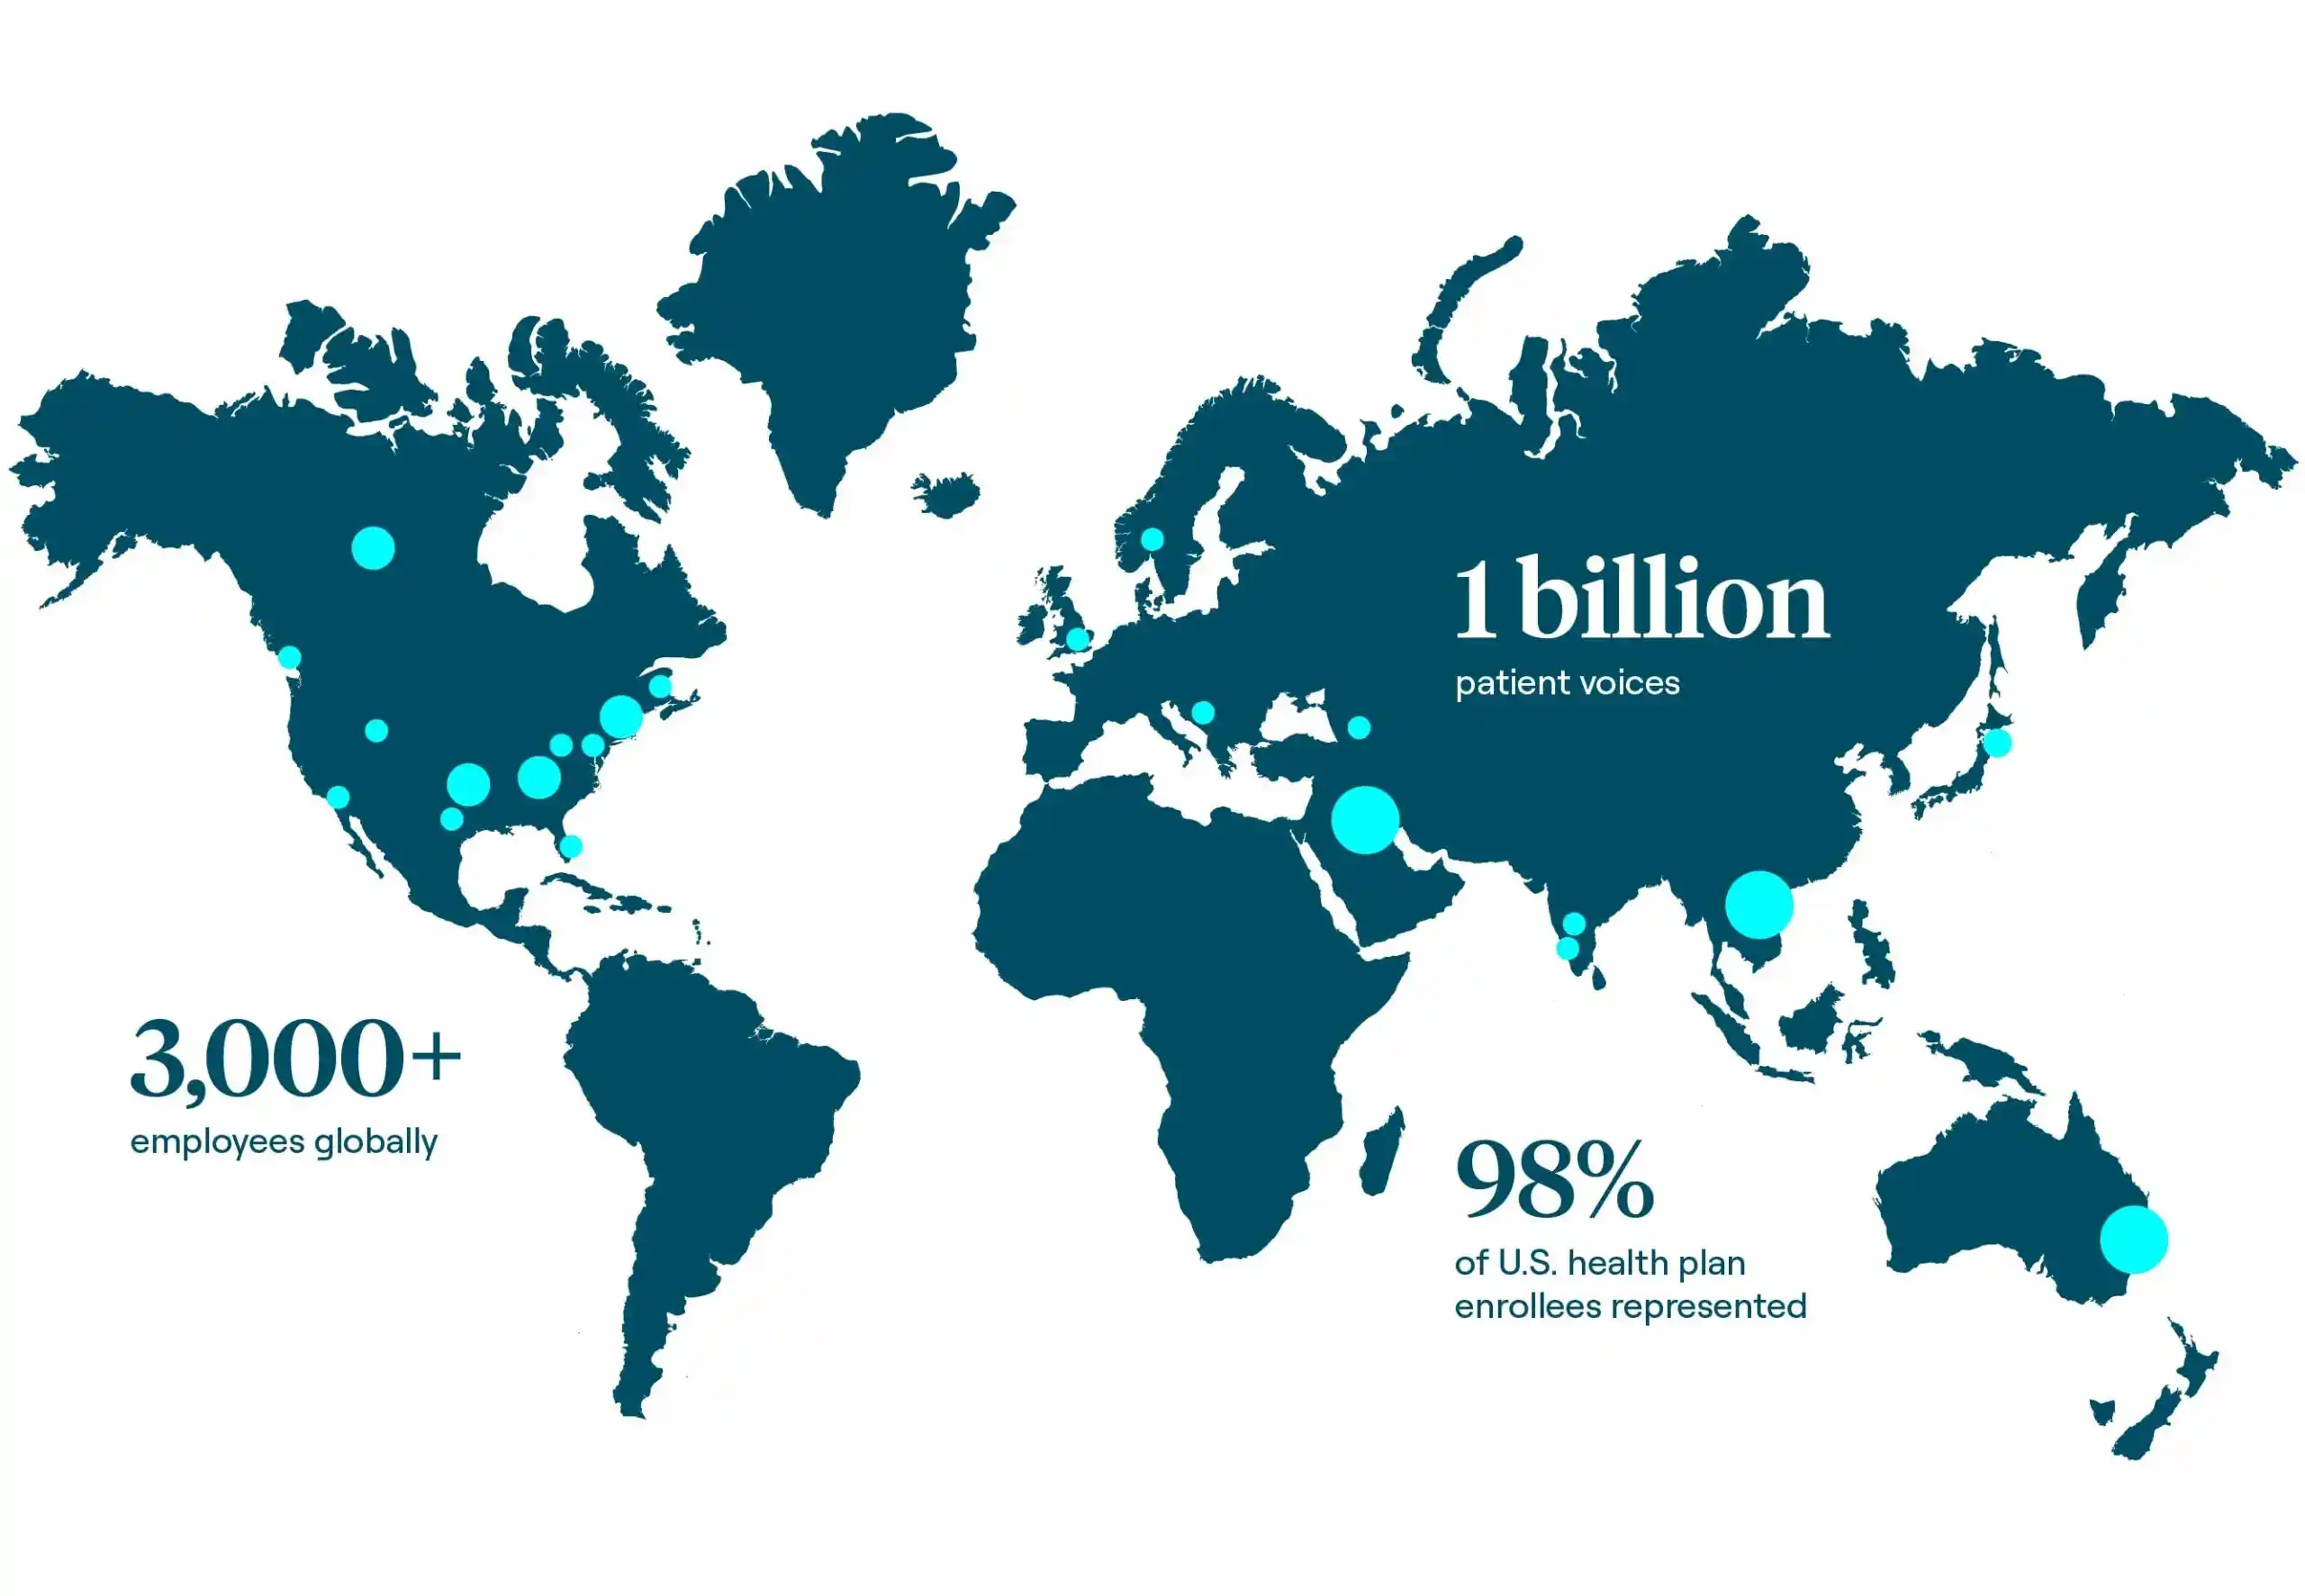
1b patient voices .
We have the industry’s largest database of patient feedback. Which gives you the information to understand exactly what people want—and need across their healthcare journey. We help you build and deliver a better experience. And make a real difference in their lives.
3,000+ employees
We understand healthcare because we are healthcare. Our team is dedicated to our mission—and helping you achieve yours. From nurses, doctors, and clinicians, to experience leaders and more, our team has been in your shoes and knows how to help.
1 HX platform
Welcome to the future of healthcare, where cutting-edge technology meets the human touch. We built the world’s first Human Experience platform to help you better understand the individuals and optimize the experiences at the heart of healthcare, all in one place.

Our Commitment to our Associates
We will invest in our community and our people
We will be a client-centric company that invests in innovation, and we will be responsible financial stewards of the company, respecting our 38 year history. We will be a performance-based culture that embraces change, listens to each other, embraces debate, communicates transparently, actively listens and treats all fellow associates with respect.
Our New Values
1. Energize the customer relationship
2. all together better , 3. dare to try, commit to learning, 4. we grow as one.
Our purpose
To help shape and optimize the future of healthcare
Our network .
Across hospitals, payers, and the life sciences, we are a strategic business partner to more than 41,000 healthcare facilities. Press Ganey helps these organizations transform the care experience, drive innovation, and deliver continuous, sustainable improvement.
We support our communities and foster togetherness, both locally and on a global scale. It’s why we donate millions to causes we care about, like community health and well-being, veterans’ issues, education, and so much more.
Our locations
We’re in your neck of the woods, no matter where you are in the world
Get industry insights that matter, delivered direct to your inbox
We collect this information to send you free content, offers, and product updates. Visit our recently updated privacy policy for details on how we protect and manage your submitted data.

Interested in our solutions? Get in touch, and we can bring you up to speed.

Physician Satisfaction Survey Press Ganey - October 2010
Sep 02, 2012
110 likes | 296 Views
Share Presentation

Presentation Transcript
1. Physician Satisfaction Survey Press Ganey - October 2010 Quarterly Medical Staff Meeting September 14, 2010 Larry Schecter, MD
2. Background 2008 Press Ganey Physician Satisfaction Survey Oct. 18 - November 19, 2010 2008 Refresher (No survey in 2009) Three comparison groups All Hospitals 300-449 beds PH&S
4. Likelihood of Recommending Facility to Family/Friends
5. Overall Assessment Areas focused on for improvement Scheduling (outpatient tests/treatments, in/ outpatient surgery, other medical procedures) Facility enhanced your practice Recommend facility to physicians Recommend facility to family/friends Satisfaction with facility
6. What you told us in 2008 Scheduling tests was difficult Scheduling surgery was difficult Access to surgery slots was difficult OR Turnaround times were too long A Pre-operative evaluation clinic was needed Obstetricians were overwhelmed by �no-doc� patients
7. 2008-2010 Challenging Years Economic Downturn Pressure on hospital finances Decreasing physician reimbursement Demand for increased physician productivity Increased regulatory requirements Documentation RAC/MAC/MIC audits Increasing consolidation in healthcare industry Anesthesia Group turn-over
8. What has been done Open/remote viewing of surgery schedule Increased OR availability Improved surgeon Turn-around Time Total Joint Replacement �5 by 6� Improved anesthesia coverage for non-OR cases Pre-op clinic to open in October
9. And what else Centralized Remote Monitoring Placed Critical Care Nurse at Pacific Campus Decreased ED call burden in many specialties General Surgery Team Pediatric Hospitalist Team Laborist Team New Programs Robotics Gyn/Onc Service
10. Future Challenges Further reductions in reimbursement Hospitals and Physicians Further consolidation of delivery systems Transition to New Bed Tower Evolution of PRMCE into Tertiary Referral Center Transition to new EMR (Epic) Support of Pacific Campus
11. Thank you for all you have done!
- More by User

EMPLOYEES’ SATISFACTION SURVEY
EMPLOYEES’ SATISFACTION SURVEY. SOLUTIONS FOR ORGANISATIONAL EXCELLENCE. 2003. The Power of our people. Employee. Employee. Employee. Employee. Satis-faction. Satis-faction. Satis-faction. Satis-faction. External Service Value. Employee. Employee. Employee. Employee. Customer.
322 views • 11 slides
Parental Satisfaction Survey 2010/11
Parental Satisfaction Survey 2010/11. Summary of Findings: Overall response to the survey was low with only 18.5% returning a completed form
199 views • 9 slides

2010 Citizen Satisfaction Survey Results
2010 Citizen Satisfaction Survey Results. November 2010. Purpose. Determine how satisfied citizens are with quality of life, government and safety 2. Identify strengths and opportunities 3. Develop action plans for improvement.
391 views • 26 slides
Employee Satisfaction Survey
Employee Satisfaction Survey. Judy Bosland Survey Research Consultant. Western New Mexico University. Spring 2001. Methodology. Administered to all Faculty and Staff Surveys were anonymous. WNMU Spring 2001. Demographics of Respondents. WNMU Spring 2001. Demographics of Respondents.
393 views • 17 slides
American Family Physician October 15 th 2010
American Family Physician October 15 th 2010. Oguchi O.A. Nwosu MD FAAFP Assistant Prof. Emory Family Medicine December 9 th 2010. Articles. Common Types of SVT: Diagnosis and Management ACL injury: Diagnosis, Management, and Prevention Postpartum Major Depression
526 views • 28 slides
DIT STUDENT SATISFACTION SURVEY 2010
DIT STUDENT SATISFACTION SURVEY 2010. Dr Rachel O Connor Mark Russell Campus Life & Student Retention Office DUBLIN INSTITUTE OF TECHNOLOGY. DIT SSS 2010 Methodology and Demographics. The survey was carried out from the1st of February and closed on February 23rd 2010
294 views • 11 slides


2010 Satisfaction survey results
2010 Satisfaction survey results. In early 2010 MCC conducted a survey of the satisfaction of delegates and users of the 3GPP web site. 2010 Satisfaction survey results.
437 views • 35 slides

Lender Satisfaction Survey
Lender Satisfaction Survey. Short Sale Breakout Final Results, 07-25-12. Objective and Methodology. Objective:
123 views • 0 slides
Press Ganey Results Presentation FY 13 Q 4
Press Ganey Results Presentation FY 13 Q 4. Women and Infants Hospital Hospital Wide Advisory Council. FY 2013 Q4 Results. All inpatient services: 87.0 mean score (54 %) OB service line: 85.6 mean score (13%) Med/ Surg service line: 90.0 (97%) NICU: 88.8 mean score (54%)
207 views • 5 slides
Consumer Satisfaction Survey
Consumer Satisfaction Survey. M. Ari Nugraha Directorate Dissemination of Statistics BPS-Statistics Indonesia Bogor, 17 June 2014. Data Sources. Consumer Satisfaction Survey Conducted by third party Data Needs Survey Conducted by BPS (Internal). Comparison (1).
325 views • 13 slides
2011 SURVEY OF PHYSICIAN PRACTICE PATTERNS & SATISFACTION
2011 SURVEY OF PHYSICIAN PRACTICE PATTERNS & SATISFACTION. KEY FINDINGS. WHO RESPONDED?. PRIMARY MESSAGE OF SURVEY:. IHS OFFERS A FAVORABLE PRACTICE “BRAND” Reasonable Hours Generally less paperwork Relatively fewer patients More time per patient Minimal call/inpatient duties
260 views • 11 slides

2010 Student Satisfaction Survey
2010 Student Satisfaction Survey. Survey Background. Created to address the “Student Satisfaction” Performance Measures Developed and updated by the Student Affairs Action Committee and other key stakeholders Fourth annual survey - trend data available. Survey Topic Areas.
822 views • 67 slides
2011 Physician Satisfaction Survey Results September 2, 2011
2011 Physician Satisfaction Survey Results September 2, 2011. FY11 Survey Methodology and Respondent Profile. Online and hard copy survey developed and administered by LG Health and distributed to 720 members of medical staff 18% response rate (125 responses) 64 employed physicians
249 views • 9 slides

Family Physician Job Satisfaction
Family Physician Job Satisfaction. Is there an association with doing procedures in practice? Christine Rivet MD, Moira Stewart PhD, Bridget Ryan M.Sc. Why is this important?. Anything which increases job satisfaction is useful for recruitment and retention of family physicians. Objective.
561 views • 38 slides
Resident Satisfaction Survey
Resident Satisfaction Survey. 28 th Annual Survey Assistance from Institute for Design Research and Outreach (IDRO), College of Design, ISU Extension City/ISU distribution 1,350 utility bill customers 986 email surveys to ISU students 728 returned surveys (48.7% response rate)
267 views • 13 slides
Freshmen Satisfaction Survey
Freshmen Satisfaction Survey. Yuko Araki Ashley Campbell Terence Chau Jennifer Crossan. Purpose & Goal. The purpose of our survey is to find the strengths and weaknesses of freshmen experiences.
449 views • 31 slides
Customer Satisfaction Survey
Customer Satisfaction Survey. June 3, 2013. Presenters //. Sharon Younger, Ph.D . Younger Associates. Thomas Sexton, Ph.D . M. Davis Company. Lana Suite Younger Associates. John Houghton, AICP Gresham Smith and Partners. Morris Davis M. Davis Company.
521 views • 31 slides
MTAC Satisfaction Survey May 2010
MTAC Satisfaction Survey May 2010. Respondents * 8 9 Respondents * Primarily MTAC representatives (64%) * Association Executives (24%). Methodology Respondents were asked to indicate how much they agreed or disagree with 11 statements about MTAC. Summary of Findings. Key Insights.
331 views • 16 slides
Physician Satisfaction and Worklife
Physician Satisfaction and Worklife. Mark Linzer MD and the MEMO investigators Hennepin County Medical Center Minneapolis, MN; Madison, WI; Milwaukee, WI; Chicago, IL; NYC, NY. No conflicts of interest. No financial support for this talk –
437 views • 27 slides
Antepartum Press Ganey Patient Satisfaction Scores Have Trended Favorably Since Implementation
Antepartum Press Ganey Patient Satisfaction Scores Have Trended Favorably Since Implementation. Implementation. Sources: Press Ganey, eCompass database *May 2009 not included in FY09 Q3 because n < 4 **FY09 Q4 Data only includes June 2009.
265 views • 2 slides
WalgreensListens help you understand everything that you need to do to participate and successfully complete the customer satisfaction survey and become eligible for the cash prize.
64 views • 5 slides

Resident Satisfaction Survey. May 2019. Ontario Resident Satisfaction Survey. Focused on: Resident satisfaction Public opinion on city priorities Challenges facing the city Evaluation of specific municipal departments and services. Survey Demographics.
146 views • 13 slides

Press Release | Water crises threaten world peace (report)

Paris, 22 March 2024 – The United Nations World Water Development Report 2024, published by UNESCO on behalf of UN-Water, highlights that tensions over water are exacerbating conflicts worldwide. To preserve peace, States must boost international cooperation and transboundary agreements.
Click here to view the full report
“As water stress increases, so do the risks of local or regional conflict. UNESCO’s message is clear: if we want to preserve peace, we must act swiftly not only to safeguard water resources but also to enhance regional and global cooperation in this area,” said Audrey Azoulay, Director-General of UNESCO.
“Water, when managed sustainably and equitably, can be a source of peace and prosperity. It is also the literal lifeblood of agriculture, the major socio-economic driver for billions of people,” said Alvaro Lario, President of the International Fund for Agricultural Development (IFAD), and Chair of UN-Water.
According to the new report published by UNESCO, on behalf of UN-Water, today 2.2 billion people still live without access to safely managed drinking water and 3.5 billion lack access to safely managed sanitation. The UN goal of ensuring this access for all by 2030 is therefore far from being attained, and there is reason to fear that these inequalities may continue to rise.
Between 2002 and 2021 droughts affected more than 1.4 billion people. As of 2022, roughly half of the world’s population experienced severe water scarcity for at least part of the year, while one quarter faced ‘extremely high’ levels of water stress, using over 80% of their annual renewable freshwater supply. Climate change is projected to increase the frequency and severity of these phenomena, with acute risks for social stability.
Girls and women are the first victims of a lack of water
The first impact is the deterioration of living conditions, leading to heightened food insecurity and health risks. Water scarcity also has consequences on social development, particularly for girls and women. In many rural areas, they are the primary water collectors, spending up to several hours a day on this task. Reduced access to water supply exacerbates this burden, which undermines women’s education, economic participation and safety. This may also contribute to the higher secondary school dropout rate among girls compared to boys.
The lack of water security has also been identified as one of the drivers of migration. This displacement can, in turn, contribute to water insecurity by placing added strain on water systems and resources in settlement locations, thereby fuelling social tensions. A study conducted in Somalia indicates a 200% increase in gender-based violence against a group of displaced people.
An urgent need for transboundary agreements
This water scarcity can increase the risk of conflict. In the Sahel region, wetland degradation – often due to ill-advised water development projects – has exacerbated local disputes over access to water and productive land, causing tensions.
While approximately 40% of the world’s population lives in transboundary river and lake basins, only a fifth of countries have cross border agreements to jointly manage these shared resources equitably. Many transboundary basins are already located in areas marked by current or past interstate tensions. In the Arab region, seven countries were in conflict in 2021 – some dating back many years –which has had wide-ranging implications for water supply, infrastructure, and potential cooperation on water-related issues.
Africa remains especially vulnerable to interstate tensions relating to water: 19 out of 22 states studied suffer from water scarcity, and two-thirds of the continent’s freshwater resources are transboundary. Of the 106 transboundary aquifers mapped in Africa, interstate cooperation has only been formalized in seven.
Concrete progress in cooperation in several regions
In this context, cooperation on transboundary water management appears to be a powerful lever for maintaining peace. By creating conditions for regular dialogue between all parties and instituting the necessary legal frameworks, this cooperation has the potential to resolve most disputes relating to water, and therefore prevent the emergence or exacerbation of wider-ranging conflicts.
The Framework Agreement on the Sava River Basin (FASRB), signed in 2002 by Bosnia and Herzegovina, Croatia, Serbia and Slovenia, was the first multilateral, development-oriented agreement in South-East Europe. It has successfully laid the groundwork for sustainable water management. Two decades after its adoption, it has become a key driver of stability in the region, and now serves as an example of best practice for other regions of the world.
The decline in volume of Lake Chad – which has decreased in size by 90% over 60 years – has led to a broad range of economic and security challenges in the region. Yet in recent years, Cameroon, Chad, the Central Africa Republic, Libya, Niger and Nigeria have given a new impetus to the Lake Chad Basin Commission (LCBC). LCBC’s mandate has expanded to ensure the most efficient use of the basin’s waters, coordinate local development, and prevent the emergence of disputes that might arise among these countries and local communities. LCBC is today the most appropriate institution for addressing the specific needs of the basin, including socio-economic development and security issues.
These two examples highlight the fact that, even in complex situations, states have the means to enact policies around access to water and shared resource management that are both fair and equitable thanks to international cooperation and the support of the United Nations system.
The United Nations World Water Development Report is published by UNESCO on behalf of UN-Water and its production is coordinated by the UNESCO World Water Assessment Programme. The report gives insight into the main trends concerning the state, use and management of freshwater and sanitation, based on work by Members and Partners of UN-Water. Launched in conjunction with World Water Day, the report provides decision-makers with knowledge and tools to formulate and implement sustainable water policies. It also offers best practice examples and in-depth analyses to stimulate ideas and actions for better stewardship in the water sector and beyond.
About UNESCO
With 194 Member States, the United Nations Educational, Scientific and Cultural Organization contributes to peace and security by leading multilateral cooperation on education, science, culture, communication and information. Headquartered in Paris, UNESCO has offices in 54 countries and employs over 2300 people. UNESCO oversees more than 2000 World Heritage sites, Biosphere Reserves and Global Geoparks; networks of Creative, Learning, Inclusive and Sustainable Cities; and over 13 000 associated schools, university chairs, training and research institutions. Its Director-General is Audrey Azoulay.
“Since wars begin in the minds of men, it is in the minds of men that the defenses of peace must be constructed” – UNESCO Constitution, 1945.
More information: www.unesco.org
About UN-Water
UN-Water is the United Nations inter-agency coordination mechanism for all freshwater-related matters, including sanitation. It represents 36 UN Agencies, Funds and Programs and 47 international organizations who work together to address the cross-cutting nature of water and sanitation issues, to identify gaps and opportunities and to maximise system-wide coordinated action at the global, regional and country levels and across the United Nations pillars.
More information: https://www.unwater.org/
Media Contacts
- Continuous listening
- Crowdsourcing
- Digital feedback
- Digital rounding
- CAHPS & regulatory
- Healthcare big data
- Machine learning & AI
- Predictive analytics
- Natural language processing
- Key drivers analysis
- Transparency
- Effective reporting
- Data visualizations
- Interactive dashboards
- Industry benchmarks
- Review publishing
- Service recovery
- High reliability & PSO
- Core measures
Problems we solve
- Brand & growth
- Patient experience
- Health plan star ratings
- Employee experience
- Diversity, equity & inclusion
- Nursing excellence
- Patient & workforce safety
- Nurse leader
- Physician leader
- Technology & digital leader
- Marketing leader
- Experience leader
- Human resources
- Safety & quality leader
- Chief executive officer
- Culture & diversity leader
Your industry
- Health systems & providers
- Health plans
- Life sciences
- Strategic consulting
- Consulting overview
- Health plan
- Safety & high reliability
- Our team of experts
Insights & initiatives
- Centers of excellence
- Industry initiatives
- Safety 2025
- Equity partnership
- Workforce well-being
- Thought leaders
- Request a speaker
- Awards overview
- 2022 HX NDNQI Award winners
- 2022 HX Guardian of Excellence Award winners
- 2022 HX Pinnacle Excellence Award winners
- Case studies
- HX Insights 2024
- Pulse Podcast
- On-demand webinars
- Request a demo
High reliability organizing: The pathway to organizational resilience
Coauthored by Carole Stockmeier , SVP, Safety and Reliability Solutions.
Leaders from CMS and CDC recently identified an urgent need for a resilient healthcare system that must be achieved by “redesigning our current processes and developing new approaches that will permit the delivery of safe and equitable care across the healthcare continuum during both normal and extraordinary times.” 1 The authors rightly recognize that resilience is the outcome, not the starting point of improvement efforts. Many organizations have been focusing on individual resilience, with attention on professional burnout. Far less attention, however, has been given to achieving organizational resilience, described as “the flexibility to pivot as new and unexpected challenges arise, and to absorb unexpected shocks that cannot be avoided even with proper planning.” 2 The COVID pandemic has highlighted the importance of organizational resilience like nothing before, with a recent assessment identifying eight categories of gaps in preparation and response with causal factors rooted in behaviors, structures, processes, protocol, and environment. 3 In this article, we make the case that high reliability organizing is the starting point to achieving resilience and closing gaps effectively.
Like individuals, organizations have a finite amount of energy. Figure 1a models a healthcare organization’s total energy as energy expended (the black line) plus energy in reserve. In normal operations, energy expended is relatively stable. During a short-term crisis, energy expended increases, often tapping into energy reserves. As the crisis abates, energy expended moderates. In contrast, during a prolonged crisis, such as the COVID pandemic (Figure 1b), energy expended remains high, and energy in reserve nears depletion. Data substantiates a COVID-coincidental nationwide performance decline in safety and quality, likely due to the energy expended on the crisis with less attention placed on routine quality and safety activities.
Yet there are positive variations (Figure 1c). For some organizations, energy expended during normal operations is less than that of others—they operate more effectively. Closely related, the increase in energy expended during crisis is less steep—they are able to take on more with less and expend less energy in reserve. The extra energy these organizations have can then be placed on other, noncrisis related activities, reflected by stable or even improved performance during the pandemic. For example, Sentara Healthcare experienced a reduction in hospital-acquired infections and an increase in overall workforce engagement (personal communication).
What enables some organizations to manage more effectively and maintain—or improve—during a crisis? “HRO” is a well-known acronym for high reliability organization. 4 More powerfully, consider HRO as an action— high reliability organizing . 5 High reliability organizing is a deliberate undertaking of leaders to shape processes and behaviors to prevent adverse events and optimize outcomes. Organizations in high-consequence industries—like nuclear power and aviation—understand that outcomes result from the actions and interactions of organization members. They recognize the importance of clear behavior expectations for individuals and leaders and understand that behaviors are influenced by organizational processes. Leaders align and integrate behavior expectations with organizational values, structures, processes, and environments to make it easy to do the right thing and hard to do the wrong thing.
We interviewed executives at health systems, like Sentara, that had embarked on a focused safety and reliability culture transformation prior to the pandemic to understand the impact that HRO had on how their organization managed during the pandemic.
Without knowing what lay ahead, the safety and HRO efforts of these organizations formed the foundation for resilience during the COVID pandemic. Insights from these interviews can be organized into three themes: (1) safety as the core value; (2) leadership structures and expectations for shared situational awareness, problem identification, and problem solving; and (3) behavior expectations for individual and team actions and interactions to mitigate human errors and mistakes.
Organizations that revere safety as their core value demonstrate a commitment to zero harm in word and in deed. This commitment is led by the board and the CEO; it is reflected in how leaders think, speak, and act; and, importantly, it is evidenced in the moment-to-moment decision making of the front-line workforce. All executives interviewed cited the important role their commitment to safety played during the COVID pandemic. Zero harm was not a new articulation that required alignment effort, but a familiar true north that pointed the way, reassured, and served as a check on prioritization and decision making.
“Our work in reliability culture puts safety in the forefront of everything we do,” shares Nick Testa MD, Chief Medical Officer at Dignity Health Southern California. “When COVID started, there was fear and concern among our people about their personal safety. Our work in creating a culture of safety didn’t stop that fear, but it did do two things. First, our people knew very well our commitment not only to patient safety, but to their safety as well. Second, it allowed us to move quickly through the fear factor and into being productive and operational.”
One powerful HRO leadership structure is Daily Check-In, a focused leadership meeting about safety events and risks. In structured order, the team looks back on significant issues from the last 24 hours; looks ahead by anticipating issues in the next 24 hours; and follows up on significant issues previously identified.5 Common across organizations interviewed, leadership teams leveraged Daily Check-In as a means of communicating rapidly changing information and maintaining awareness of COVID-related issues. If Daily Check-In had already been embedded into their processes pre-pandemic, less energy was expended on establishing communication structures once the pandemic began. “Our history and ongoing work in high reliability enabled our healthcare system to stay focused on our core safety commitments while managing rapid changes,” says Genemarie McGee, RN, Chief Nursing Officer of Sentara Healthcare. “Daily huddles were embedded in our culture. We utilized the process to expand communication with specialized COVID huddles. This ensured communication reached front-line employees and providers, keeping them informed and engaged in the quickly changing landscape.”
The HRO efforts of these organizations also included defining and embedding behavior expectations as individual and teamwork habits. These behaviors include paying attention to detail, communicating clearly, having a questioning attitude, and peer checking and coaching. 5 The clear articulation of such behaviors and the elevation of these behaviors as personal and professional habits reduces human errors and mistakes that lead to failures in safety, as well as all areas of performance. Those interviewed identified these embedded behaviors and habits as foundational to their energy performance during COVID.
According to Sandy Cox, Director of Safety at Novant Health: “Our high reliability foundation prepared our team to be battle-ready for any crisis. We had developed safety and high reliability muscle memory and habit formation. Skills that have been put into practice day in and day out, year over year, situated our organization to be prepared when crisis hit rather than preparing for the crisis at its start.”
Through these principles and practices, HRO underpins high performance and enables organizations to manage their total energy more efficiently and effectively. Essential HRO components include safety as the core value, leadership structures and expectations for shared situational awareness, problem identification, problem-solving, and behavior expectations. HRO is the starting point for resilience by both preventing failures during routine operations as well as containing the impact and managing during times of crisis.
Acknowledgments:
- Sandy Cox – Director of Safety at Novant Health
- Genemarie McGee, RN – Chief Nursing Officer, Sentara Healthcare
- Nick Testa, MD – Chief Medical Officer, Dignity Health – Southern California Division
References:
Fleisher L, Schreiber M, et al. "Health Care Safety during the Pandemic and Beyond – Building a System That Ensures Resilience." NEJM, 17 February 2022.
Barash, I and Kahn, J. "Fostering hospital resilience – lessons from COVID-19." Journal of the American Medical Association, August 24/31, 2021; Volume 326, Number 8: 693-694.
Jarrett, M et al. "Pandemic preparedness: COVID-19 lessons learned in New York’s Hospitals." The Joint Commission Journal on Quality and Patient Safety, 2022.
Weick, K. E. and Sutcliffe, K. M. "Managing the unexpected: resilient performance in the age of uncertainty, 2nd ed." Jossey-Bass, 2007.
Clapper C, Merlino J, Stockmeier C, eds. "Zero harm – how to achieve patient and workforce safety in healthcare." McGraw Hill, 2019: 51-71.
- Brand growth
- Health plan consulting
- Nursing consulting
- Copyright © 2023 Press Ganey
- Cookies settings
- Terms of service
- Legal and Privacy Policy
- Accessibility statement
- Cookie policy
- Copyright © 2024 Press Ganey

IMAGES
COMMENTS
Explore Press Ganey's industry best practices, healthcare thought leadership, and exclusive research drawn from millions of patients, nurses, and physicians. Press Ganey draws upon more than 1 billion patient voices and 3.1 million voices in the healthcare workforce (and counting) to help you and your organization deliver the best healthcare ...
The Press Ganey NDNQI is a valuable database for understanding how your nursing practices stack up to the competition—and how your RNs experience their work environment. To get the most out of this program and unlock new levels of data, it's critical to understand the basics of the National Database of Nursing Quality Indicators, how to get ...
Press Ganey Scores Research on Promptness in Returning Calls, Helpfulness on the Telephone, and Wait Before Going to an Exam Room - PowerPoint PPT presentation. Number of Views: 66. Avg rating:3.0/5.0. Slides: 35.
Press Ganey emergency department (ED) patient satisfaction scores and ED administration of analgesic medications, including the amount of opioid analgesics received, among patients who completed a patient satisfaction survey. Overall Press Ganey ED patient satisfaction scores were not primarily based on in-ED receipt of analgesic , department. ,
Our software tools make every task quicker and slicker—whether you're preparing a highly visual board presentation, comparing the KPIs for a system of regional facilities in one view, or using a virtual huddle board for daily rounding. Best of all, you can do all of these and more from one simple platform. Stories you can see. Data you can ...
Think beyond the survey. Our patient experience management platform gives you a comprehensive picture of the healthcare experience, as told by your patients. Connect with patients in new ways across their journey in virtual focus groups and online communities. Generate fresh ideas from your patients to drive innovation.
ᵃIn 2019, Cleveland Clinic began administering the Press Ganey Medical Practice Survey for use in the physician office setting to measure patients' perspectives of outpatient care. *Benchmark average based on Press Ganey all clients per calendar year 2022. All response options: Very good, good, fair, poor, very poor.
Employee User Guide: Provides a step by step review of how to navigate the Press Ganey Portal for your work unit's survey results. Snapshot Export Quick Guide: Provides a step-by-step review of how to generate a printable document of the most common portal views. Press Ganey Technical Support: 1-800-849-2292, Option 1.
How to build patient trust by prioritizing empathy. A positive patient experience starts with building trust. We need 100% trust in healthcare—which is no simple feat. To build patient trust and a positive patient experience, clinicians and caregivers must quickly establish a personal connection supported by a feeling of competence in their role.
Unprecedented insights into how to make your healthcare business better. Hand-delivered to you and your team to fix your biggest challenges. Healthcare Experience, Press Ganey helps healthcare organizations improve patient experience, safety, and quality. Discover our solutions and services for transforming healthcare.
If it says you are being ranked by specialty then you are ranked by providers with the specialty on your Press Ganey profile. If your specialty needs to be updated in Press Ganey, contact Kelley Werts. Only physicians are ranked by specialty. Author: Lovelace, Amanda Created Date: 12/31/1903 16:00:00 Title: PowerPoint Presentation Last modified by:
'Press ganey patient satisfaction' presentation slideshows Press ganey patient satisfaction - PowerPoint PPT Presentation Bringing Quality to the Bedside The Evolution of the Nurse Quality Champion Sue Nuss, PhD, RN
Press Ganey has launched an updated version of Press Ganey Online, a state-of-the-art Human Experience (HX) platform for organizations seeking to improve performance. The platform features intuitive dashboards with clear visuals of key insights, trends, benchmarks, and patient comments. These dashboards are tailored for various user levels ...
1 HX platform. Welcome to the future of healthcare, where cutting-edge technology meets the human touch. We built the world's first Human Experience platform to help you better understand the individuals and optimize the experiences at the heart of healthcare, all in one place. Our Commitment to our Associates.
MHSE Three Year Customer Experience Comparison. HCAHPS Top Box. HCAHPS Real Time Ranking. Press Ganey Overall. ★ ★ ★ ★ ★. 141 views • 5 slides. View Press ganey PowerPoint PPT Presentations on SlideServe. Collection of 100+ Press ganey slideshows.
Press Ganey Results Presentation FY 13 Q 4. Press Ganey Results Presentation FY 13 Q 4. Women and Infants Hospital Hospital Wide Advisory Council. FY 2013 Q4 Results. All inpatient services: 87.0 mean score (54 %) OB service line: 85.6 mean score (13%) Med/ Surg service line: 90.0 (97%) NICU: 88.8 mean score (54%) 207 views • 5 slides
Press Ganey. Provider Scorecard Information. Faculty Practice Plan. Provider Scorecard. 2 • This version is the only option that includes comments • Header is still a challenge, but format will change in ... PowerPoint Presentation Author: Lovelace, Amanda Created Date:
United Nations Sustainable Development Goals - Time for Global Action for People and Planet
Press Ganey data shows the importance of nursing care in pressure injury prevention. Read blog. 5 months ago Star Ratings: Key strategies of high-performing health plans to drive improvement Facilitate a more seamless member journey, a better member experience, higher health plan member engagement, and improved health plan ratings.