- 0 Shopping Cart


Japan Earthquake 2011
Japan earthquake 2011 case study.
An earthquake measuring 9.0 on the Richter Scale struck off Japan’s northeast coast, about 250 miles (400km) from Tokyo at a depth of 20 miles.
The magnitude 9.0 earthquake happened at 2:46 pm (local time) on Friday, March 11, 2011.
The earthquake occurred 250 miles off the North East Coast of Japan’s main island Honshu.
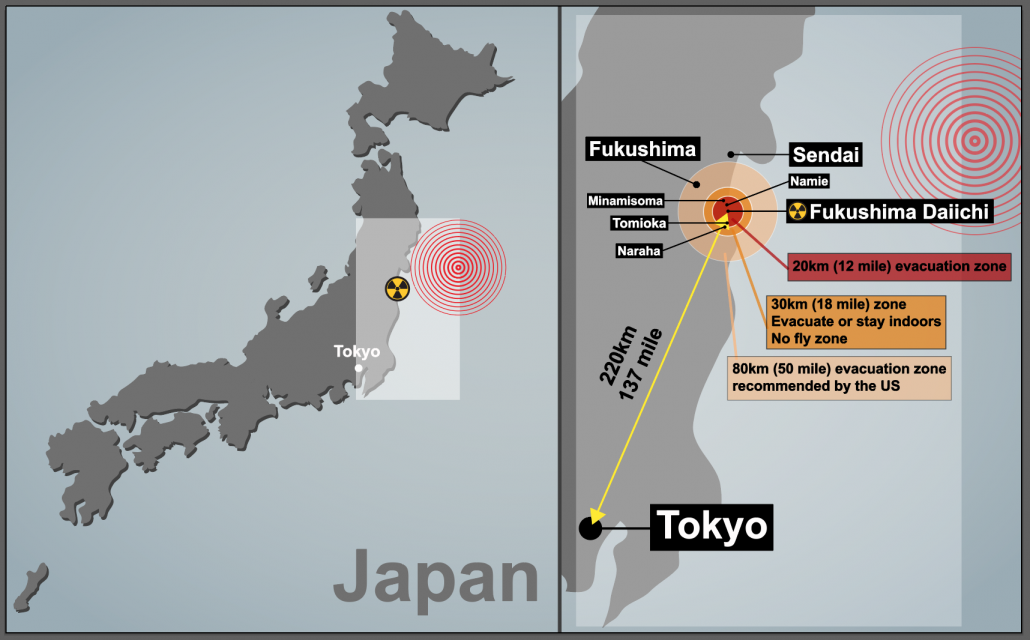
Japan 2011 Earthquake map
Japan is located on the eastern edge of the Eurasian Plate. The Eurasian plate, which is continental, is subducted by the Pacific Plate, an oceanic plate forming a subduction zone to the east of Japan. This type of plate margin is known as a destructive plate margin . The process of subduction is not smooth. Friction causes the Pacific Plate to stick. Pressure builds and is released as an earthquake.
Friction has built up over time, and when released, this caused a massive ‘megathrust’ earthquake.
The amount of energy released in this single earthquake was 600 million times the energy of the Hiroshima nuclear bomb.
Scientists drilled into the subduction zone soon after the earthquake and discovered a thin, slippery clay layer lining the fault. The researchers think this clay layer allowed the two plates to slide an incredible distance, some 164 feet (50 metres), facilitating the enormous earthquake and tsunami .
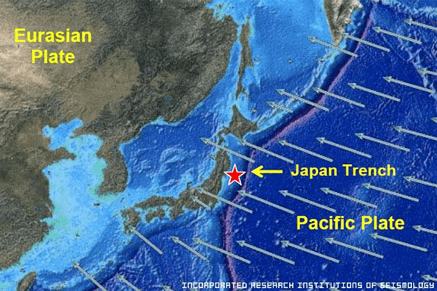
2011 Japan Earthquake Map
The earthquake occurred at a relatively shallow depth of 20 miles below the surface of the Pacific Ocean. This, combined with the high magnitude, caused a tsunami (find out more about how a tsunami is formed on the BBC website).
Areas affected by the 2011 Japanese earthquake.
What were the primary effects of the 2011 Japan earthquake?
Impacts on people
Death and injury – Some 15,894 people died, and 26,152 people were injured. 130,927 people were displaced, and 2,562 remain missing.
Damage – 332,395 buildings, 2,126 roads, 56 bridges and 26 railways were destroyed or damaged. 300 hospitals were damaged, and 11 were destroyed.
Blackouts – Over 4.4 million households were left without electricity in North-East Japan.
Transport – Japan’s transport network suffered huge disruptions.
Impacts on the environment
Landfall – some coastal areas experienced land subsidence as the earthquake dropped the beachfront in some places by more than 50 cm.
Land movement – due to tectonic shift, the quake moved parts of North East Japan 2.4 m closer to North America.
Plate shifts – It has been estimated by geologists that the Pacific plate has slipped westwards by between 20 and 40 m.
Seabed shift – The seabed near the epicentre shifted by 24 m, and the seabed off the coast of the Miyagi province has moved by 3 m.
Earth axis moves – The earthquake moved the earth’s axis between 10 and 25 cm, shortening the day by 1.8 microseconds.
Liquefaction occurred in many of the parts of Tokyo built on reclaimed land. 1,046 buildings were damaged
What were the secondary effects of the 2011 Japan earthquake?
Economy – The earthquake was the most expensive natural disaster in history, with an economic cost of US$235 billion.
Tsunami – Waves up to 40 m in high devastated entire coastal areas and resulted in the loss of thousands of lives. This caused a lot of damage and pollution up to 6 miles inland. The tsunami warnings in coastal areas were only followed by 58% who headed for higher ground. The wave hit 49% of those not following the warning.
Nuclear power – Seven reactors at the Fukushima nuclear power station experienced a meltdown. Levels of radiation were over eight times the normal levels.
Transport – Rural areas remained isolated for a long time because the tsunami destroyed major roads and local trains and buses. Sections of the Tohoku Expressway were damaged. Railway lines were damaged, and some trains were derailed.
Aftermath – The ‘Japan move forward committee’ thought that young adults and teenagers could help rebuild parts of Japan devastated by the earthquake.
Coastal changes – The tsunami was able to travel further inland due to a 250-mile stretch of coastline dropping by 0.6 m.
What were the immediate responses to the Japan 2011 earthquake?
- The Japan Meteorological Agency issued tsunami warnings three minutes after the earthquake.
- Scientists had been able to predict where the tsunami would hit after the earthquake using modelling and forecasting technology so that responses could be directed to the appropriate areas.
- Rescue workers and around 100,000 members of the Japan Self-Defence Force were dispatched to help with search and rescue operations within hours of the tsunami hitting the coast.
- Although many search and rescue teams focused on recovering bodies washing up on shore following the tsunami, some people were rescued from under the rubble with the help of sniffer dogs.
- The government declared a 20 km evacuation zone around the Fukushima nuclear power plant to reduce the threat of radiation exposure to local residents.
- Japan received international help from the US military, and search and rescue teams were sent from New Zealand, India, South Korea, China and Australia.
- Access to the affected areas was restricted because many were covered in debris and mud following the tsunami, so it was difficult to provide immediate support in some areas.
- Hundreds of thousands of people who had lost their homes were evacuated to temporary shelters in schools and other public buildings or relocated to other areas.
- Many evacuees came from the exclusion zone surrounding the Fukushima nuclear power plant. After the Fukushima Daiichi nuclear meltdown, those in the area had their radiation levels checked, and their health monitored to ensure they did not receive dangerous exposure to radiation. Many evacuated from the area around the nuclear power plant were given iodine tablets to reduce the risk of radiation poisoning.
What were the long-term responses to the Japan 2011 earthquake?
- In April 2011, one month after the event occurred, the central government established the Reconstruction Policy Council to develop a national recovery and reconstruction outlook for tsunami-resilient communities. The Japanese government has approved a budget of 23 trillion yen (approximately £190 billion) to be spent over ten years. Central to the New Growth Strategy is creating a ‘Special Zones for Reconstruction’ system. These aim to provide incentives to attract investment, both in terms of business and reconstruction, into the Tohoku region.
- Also, the central government decided on a coastal protection policy, such as seawalls and breakwaters which would be designed to ensure their performance to a potential tsunami level of up to the approximately 150-year recurrence interval.
- In December 2011, the central government enacted the ‘Act on the Development of Tsunami-resilient Communities’. According to the principle that ‘Human life is most important, this law promotes the development of tsunami-resistant communities based on the concept of multiple defences, which combines infrastructure development and other measures targeting the largest class tsunami.
- Japan’s economic growth after the Second World War was the world’s envy. However, over the last 20 years, the economy has stagnated and been in and out of recession. The 11 March earthquake wiped 5–10% off the value of Japanese stock markets, and there has been global concern over Japan’s ability to recover from the disaster. The priority for Japan’s long-term response is to rebuild the infrastructure in the affected regions and restore and improve the economy’s health as a whole.
- By the 24th of March 2011, 375 km of the Tohoku Expressway (which links the region to Tokyo) was repaired and reopened.
- The runway at Sendai Airport had been badly damaged. However, it was restored and reusable by the 29th of March due to a joint effort by the Japanese Defence Force and the US Army.
- Other important areas of reconstruction include the energy, water supply and telecommunications infrastructure. As of November 2011, 96% of the electricity supply had been restored, 98% of the water supply and 99% of the landline network.
Why do people live in high-risk areas in Japan?
There are several reasons why people live in areas of Japan at risk of tectonic hazards:
- They have lived there all their lives, are close to family and friends and have an attachment to the area.
- The northeast has fertile farmland and rich fishing waters.
- There are good services, schools and hospitals.
- 75% of Japan is mountainous and flat land is mainly found in coastal areas, which puts pressure on living space.
- They are confident about their safety due to the protective measures that have been taken, such as the construction of tsunami walls.
Japan’s worst previous earthquake was of 8.3 magnitude and killed 143,000 people in Kanto in 1923. A magnitude 7.2 quake in Kobe killed 6,400 people in 1995 .

Premium Resources
Please support internet geography.
If you've found the resources on this page useful please consider making a secure donation via PayPal to support the development of the site. The site is self-funded and your support is really appreciated.
Related Topics
Use the images below to explore related GeoTopics.
Previous Topic Page
Topic home, next topic page, share this:.
- Click to share on Twitter (Opens in new window)
- Click to share on Facebook (Opens in new window)
- Click to share on Pinterest (Opens in new window)
- Click to email a link to a friend (Opens in new window)
- Click to share on WhatsApp (Opens in new window)
- Click to print (Opens in new window)
If you've found the resources on this site useful please consider making a secure donation via PayPal to support the development of the site. The site is self-funded and your support is really appreciated.
Search Internet Geography
Latest Blog Entries
Pin It on Pinterest
- Click to share
- Print Friendly


Case Study: How does Japan live with earthquakes?
Japan lies within one of the most tectonically active zones in the world. It experiences over 400 earthquakes every day. The majority of these are not felt by humans and are only detected by instruments. Japan has been hit by a number of high-intensity earthquakes in the past. Since 2000 there are have been 16000 fatalities as the result of tectonic activity.
Japan is located on the Pacific Ring of Fire, where the North American, Pacific, Eurasian and Philippine plates come together. Northern Japan is on top of the western tip of the North American plate. Southern Japan sits mostly above the Eurasian plate. This leads to the formation of volcanoes such as Mount Unzen and Mount Fuji. Movements along these plate boundaries also present the risk of tsunamis to the island nation. The Pacific Coastal zone, on the east coast of Japan, is particularly vulnerable as it is very densely populated.
The 2011 Japan Earthquake: Tōhoku
Japan experienced one of its largest seismic events on March 11 2011. A magnitude 9.0 earthquake occurred 70km off the coast of the northern island of Honshu where the Pacific and North American plate meet. It is the largest recorded earthquake to hit Japan and is in the top five in the world since records began in 1900. The earthquake lasted for six minutes.
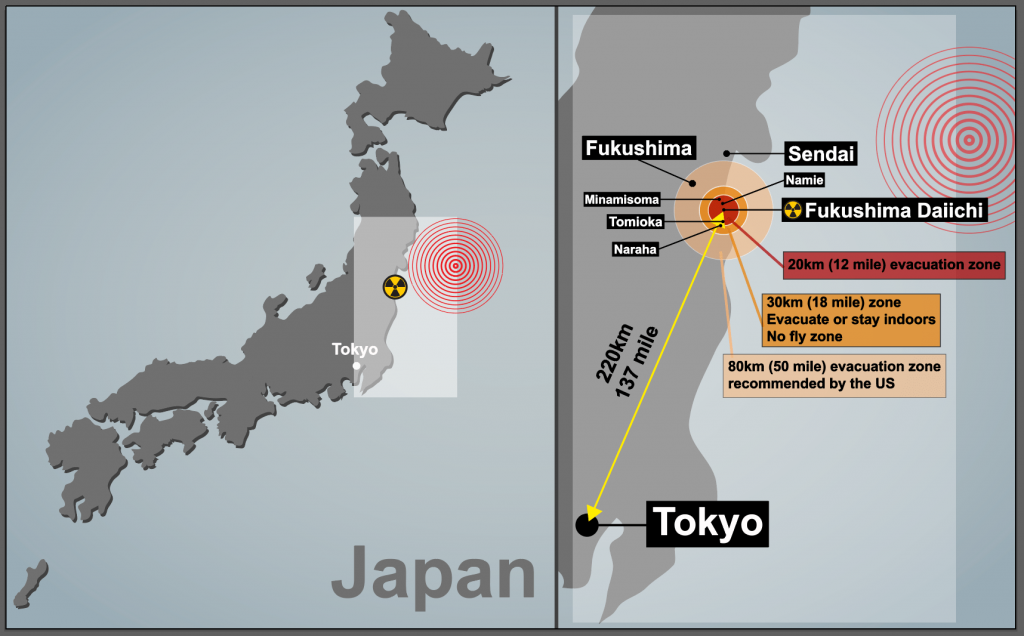
A map to show the location of the 2011 Japan Earthquake
The earthquake had a significant impact on the area. The force of the megathrust earthquake caused the island of Honshu to move east 2.4m. Parts of the Japanese coastline dr[[ed by 60cm. The seabed close to the focus of the earthquake rose by 7m and moved westwards between 40-50m. In addition to this, the earthquake shifted the Earth 10-15cm on its axis.
The earthquake triggered a tsunami which reached heights of 40m when it reached the coast. The tsunami wave reached 10km inland in some places.
What were the social impacts of the Japanese earthquake in 2011?
The tsunami in 2011 claimed the lives of 15,853 people and injured 6023. The majority of the victims were over the age of 60 (66%). 90% of the deaths was caused by drowning. The remaining 10% died as the result of being crushed in buildings or being burnt. 3282 people were reported missing, presumed dead.
Disposing of dead bodies proved to be very challenging because of the destruction to crematoriums, morgues and the power infrastructure. As the result of this many bodies were buried in mass graves to reduce the risk of disease spreading.
Many people were displaced as the result of the tsunami. According to Save the Children 100,000 children were separated from their families. The main reason for this was that children were at school when the earthquake struck. In one elementary school, 74 of 108 students and 10 out of 13 staff lost their lives.
More than 333000 people had to live in temporary accommodation. National Police Agency of Japan figures shows almost 300,000 buildings were destroyed and a further one million damaged, either by the quake, tsunami or resulting fires. Almost 4,000 roads, 78 bridges and 29 railways were also affected. Reconstruction is still taking place today. Some communities have had to be relocated from their original settlements.
What were the economic impacts of the Japanese earthquake in 2011?
The estimated cost of the earthquake, including reconstruction, is £181 billion. Japanese authorities estimate 25 million tonnes of debris were generated in the three worst-affected prefectures (counties). This is significantly more than the amount of debris created during the 2010 Haiti earthquake. 47,700 buildings were destroyed and 143,300 were damaged. 230,000 vehicles were destroyed or damaged. Four ports were destroyed and a further 11 were affected in the northeast of Japan.
There was a significant impact on power supplies in Japan. 4.4 million households and businesses lost electricity. 11 nuclear reactors were shut down when the earthquake occurred. The Fukushima Daiichi nuclear power plant was decommissioned because all six of its reactors were severely damaged. Seawater disabled the plant’s cooling systems which caused the reactor cores to meltdown, leading to the release of radioactivity. Radioactive material continues to be released by the plant and vegetation and soil within the 30km evacuation zone is contaminated. Power cuts continued for several weeks after the earthquake and tsunami. Often, these lasted between 3-4 hours at a time. The earthquake also had a negative impact on the oil industry as two refineries were set on fire during the earthquake.
Transport was also negatively affected by the earthquake. Twenty-three train stations were swept away and others experienced damage. Many road bridges were damaged or destroyed.
Agriculture was affected as salt water contaminated soil and made it impossible to grow crops.
The stock market crashed and had a negative impact on companies such as Sony and Toyota as the cost of the earthquake was realised. Production was reduced due to power cuts and assembly of goods, such as cars overseas, were affected by the disruption in the supply of parts from Japan.
What were the political impacts of the Japanese earthquake in 2011?
Government debt was increased when it injects billions of yen into the economy. This was at a time when the government were attempting to reduce the national debt.
Several years before the disaster warnings had been made about the poor defences that existed at nuclear power plants in the event of a tsunami. A number of executives at the Fukushima power plant resigned in the aftermath of the disaster. A movement against nuclear power, which Japan heavily relies on, developed following the tsunami.
The disaster at Fukushima added political weight in European countries were anti-nuclear bodies used the event to reinforce their arguments against nuclear power.
Privacy Overview
| Cookie | Duration | Description |
|---|---|---|
| cookielawinfo-checkbox-analytics | 11 months | This cookie is set by GDPR Cookie Consent plugin. The cookie is used to store the user consent for the cookies in the category "Analytics". |
| cookielawinfo-checkbox-functional | 11 months | The cookie is set by GDPR cookie consent to record the user consent for the cookies in the category "Functional". |
| cookielawinfo-checkbox-necessary | 11 months | This cookie is set by GDPR Cookie Consent plugin. The cookies is used to store the user consent for the cookies in the category "Necessary". |
| cookielawinfo-checkbox-others | 11 months | This cookie is set by GDPR Cookie Consent plugin. The cookie is used to store the user consent for the cookies in the category "Other. |
| cookielawinfo-checkbox-performance | 11 months | This cookie is set by GDPR Cookie Consent plugin. The cookie is used to store the user consent for the cookies in the category "Performance". |
| viewed_cookie_policy | 11 months | The cookie is set by the GDPR Cookie Consent plugin and is used to store whether or not user has consented to the use of cookies. It does not store any personal data. |
Pin It on Pinterest
You must be logged in to post a comment.
Case Study: Japan 2010 Tsunami
Impacts of the japan earthquake in 2011.
Japan is a developed country in east Asia. Japan's geography is dominated by islands. The country is a high-risk area for tectonic hazards.
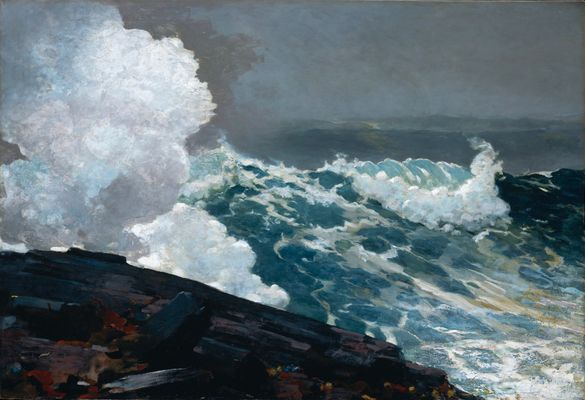
What caused the 2011 Japan tsunami?
- There was an earthquake with a magnitude of 9.0 in northeast Japan on the 11th March 2011.
- The earthquake is known as the Tohoku earthquake.
Primary impacts
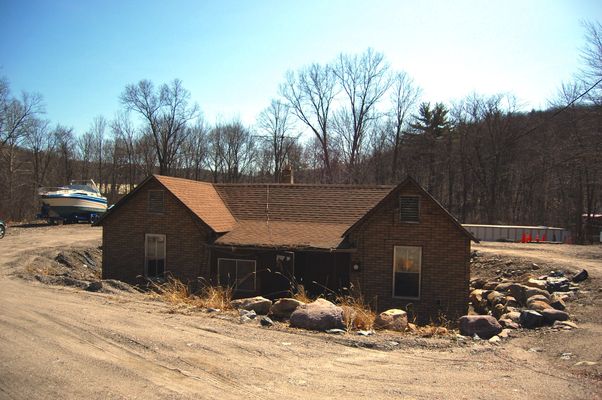
- 1 million buildings were damaged and over 120,000 buildings were completely destroyed.
- Many buildings sunk into the ground because of liquefaction, which is when waterlogged soil acts like a liquid.
Secondary impacts
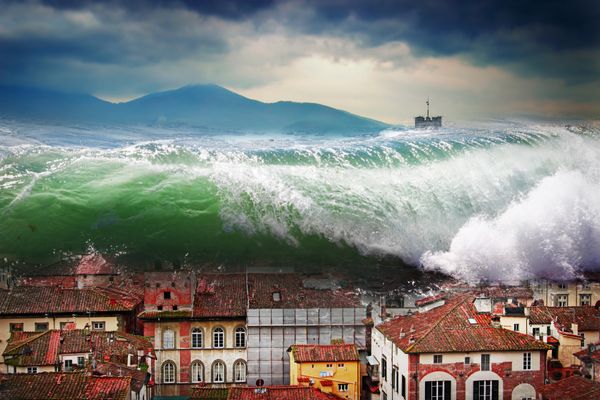
- The tsunami that was caused by the earthquake caused thousands of deaths (it is hard to know how many people died in the earthquake or the tsunami and lots of people are still missing).
- More than 150,000 people became homeless and in 2017, 6 years on, 50,000 people still had no homes.
- The tsunami damaged the Fukushima nuclear power station. Electricity could no longer reach Fukushima and there was a nuclear meltdown at the plant, releasing toxic nuclear waste into the local area.
- Railways lines were destroyed by the tsunami.

Long-term impact and response
- Economists estimate that the total damage done by the earthquake and tsunami is $200 bn. This is the largest amount of damage caused by any natural disaster ever.
- Japan was a high income country and had a new tsunami warning system. But, studies suggest that only 58% paid any attention to the tsunami warning.
- In the 12 months after the Tohoku earthquake, there were 5,000 aftershocks in Japan.
1 Geography Skills
1.1 Mapping
1.1.1 Map Making
1.1.2 OS Maps
1.1.3 Grid References
1.1.4 Contour Lines
1.1.5 Symbols, Scale and Distance
1.1.6 Directions on Maps
1.1.7 Describing Routes
1.1.8 Map Projections
1.1.9 Aerial & Satellite Images
1.1.10 Using Maps to Make Decisions
1.2 Geographical Information Systems
1.2.1 Geographical Information Systems
1.2.2 How do Geographical Information Systems Work?
1.2.3 Using Geographical Information Systems
1.2.4 End of Topic Test - Geography Skills
2 Geology of the UK
2.1 The UK's Rocks
2.1.1 The UK's Main Rock Types
2.1.2 The UK's Landscape
2.1.3 Using Rocks
2.1.4 Weathering
2.2 Case Study: The Peak District
2.2.1 The Peak District
2.2.2 Limestone Landforms
2.2.3 Quarrying
3 Geography of the World
3.1 Geography of America & Europe
3.1.1 North America
3.1.2 South America
3.1.3 Europe
3.1.4 The European Union
3.1.5 The Continents
3.1.6 The Oceans
3.1.7 Longitude
3.1.8 Latitude
3.1.9 End of Topic Test - Geography of the World
4 Development
4.1 Development
4.1.1 Classifying Development
4.1.3 Evaluation of GDP
4.1.4 The Human Development Index
4.1.5 Population Structure
4.1.6 Developing Countries
4.1.7 Emerging Countries
4.1.8 Developed Countries
4.1.9 Comparing Development
4.2 Uneven Development
4.2.1 Consequences of Uneven Development
4.2.2 Physical Factors Affecting Development
4.2.3 Historic Factors Affecting Development
4.2.4 Human & Social Factors Affecting Development
4.2.5 Breaking Out of the Poverty Cycle
4.3 Case Study: Democratic Republic of Congo
4.3.1 The DRC: An Overview
4.3.2 Political & Social Factors Affecting Development
4.3.3 Environmental Factors Affecting the DRC
4.3.4 The DRC: Aid
4.3.5 The Pros & Cons of Aid in DRC
4.3.6 Top-Down vs Bottom-Up in DRC
4.3.7 The DRC: Comparison with the UK
4.3.8 The DRC: Against Malaria Foundation
4.4 Case Study: Nigeria
4.4.1 The Importance & Development of Nigeria
4.4.2 Nigeria's Relationships with the Rest of the World
4.4.3 Urban Growth in Lagos
4.4.4 Population Growth in Lagos
4.4.5 Factors influencing Nigeria's Growth
4.4.6 Nigeria: Comparison with the UK
5 Weather & Climate
5.1 Weather
5.1.1 Weather & Climate
5.1.2 Components of Weather
5.1.3 Temperature
5.1.4 Sunshine, Humidity & Air Pressure
5.1.5 Cloud Cover
5.1.6 Precipitation
5.1.7 Convectional Precipitation
5.1.8 Frontal Precipitation
5.1.9 Relief or Orographic Precipitation
5.1.10 Wind
5.1.11 Extreme Wind
5.1.12 Recording the Weather
5.1.13 Extreme Weather
5.2 Climate
5.2.1 Climate of the British Isles
5.2.2 Comparing Weather & Climate London
5.2.3 Climate of the Tropical Rainforest
5.2.4 End of Topic Test - Weather & Climate
5.3 Tropical Storms
5.3.1 Formation of Tropical Storms
5.3.2 Features of Tropical Storms
5.3.3 The Structure of Tropical Storms
5.3.4 Tropical Storms Case Study: Katrina Effects
5.3.5 Tropical Storms Case Study: Katrina Responses
6 The World of Work
6.1 Tourism
6.1.1 Landscapes
6.1.2 The Growth of Tourism
6.1.3 Benefits of Tourism
6.1.4 Economic Costs of Tourism
6.1.5 Social, Cultural & Environmental Costs of Tourism
6.1.6 Tourism Case Study: Blackpool
6.1.7 Ecotourism
6.1.8 Tourism Case Study: Kenya
7 Natural Resources
7.1.1 What are Rocks?
7.1.2 Types of Rock
7.1.4 The Rock Cycle - Weathering
7.1.5 The Rock Cycle - Erosion
7.1.6 What is Soil?
7.1.7 Soil Profiles
7.1.8 Water
7.1.9 Global Water Demand
7.2 Fossil Fuels
7.2.1 Introduction to Fossil Fuels
7.2.2 Fossil Fuels
7.2.3 The Global Energy Supply
7.2.5 What is Peak Oil?
7.2.6 End of Topic Test - Natural Resources
8.1 River Processes & Landforms
8.1.1 Overview of Rivers
8.1.2 The Bradshaw Model
8.1.3 Erosion
8.1.4 Sediment Transport
8.1.5 River Deposition
8.1.6 River Profiles: Long Profiles
8.1.7 River Profiles: Cross Profiles
8.1.8 Waterfalls & Gorges
8.1.9 Interlocking Spurs
8.1.10 Meanders
8.1.11 Floodplains
8.1.12 Levees
8.1.13 Case Study: River Tees
8.2 Rivers & Flooding
8.2.1 Flood Risk Factors
8.2.2 Flood Management: Hard Engineering
8.2.3 Flood Management: Soft Engineering
8.2.4 Flooding Case Study: Boscastle
8.2.5 Flooding Case Study: Consequences of Boscastle
8.2.6 Flooding Case Study: Responses to Boscastle
8.2.7 Flooding Case Study: Bangladesh
8.2.8 End of Topic Test - Rivers
8.2.9 Rivers Case Study: The Nile
8.2.10 Rivers Case Study: The Mississippi
9.1 Formation of Coastal Landforms
9.1.1 Weathering
9.1.2 Erosion
9.1.3 Headlands & Bays
9.1.4 Caves, Arches & Stacks
9.1.5 Wave-Cut Platforms & Cliffs
9.1.6 Waves
9.1.7 Longshore Drift
9.1.8 Coastal Deposition
9.1.9 Spits, Bars & Sand Dunes
9.2 Coast Management
9.2.1 Management Strategies for Coastal Erosion
9.2.2 Case Study: The Holderness Coast
9.2.3 Case Study: Lyme Regis
9.2.4 End of Topic Test - Coasts
10 Glaciers
10.1 Overview of Glaciers & How They Work
10.1.1 Distribution of Glaciers
10.1.2 Types of Glaciers
10.1.3 The Last Ice Age
10.1.4 Formation & Movement of Glaciers
10.1.5 Shaping of Landscapes by Glaciers
10.1.6 Glacial Landforms Created by Erosion
10.1.7 Glacial Till & Outwash Plain
10.1.8 Moraines
10.1.9 Drumlins & Erratics
10.1.10 End of Topic Tests - Glaciers
10.1.11 Tourism in Glacial Landscapes
10.1.12 Strategies for Coping with Tourists
10.1.13 Case Study - Lake District: Tourism
10.1.14 Case Study - Lake District: Management
11 Tectonics
11.1 Continental Drift & Plate Tectonics
11.1.1 The Theory of Plate Tectonics
11.1.2 The Structure of the Earth
11.1.3 Tectonic Plates
11.1.4 Plate Margins
11.2 Volcanoes
11.2.1 Volcanoes & Their Products
11.2.2 The Development of Volcanoes
11.2.3 Living Near Volcanoes
11.3 Earthquakes
11.3.1 Overview of Earthquakes
11.3.2 Consequences of Earthquakes
11.3.3 Case Study: Christchurch, New Zealand Earthquake
11.4 Tsunamis
11.4.1 Formation of Tsunamis
11.4.2 Case Study: Japan 2010 Tsunami
11.5 Managing the Risk of Volcanoes & Earthquakes
11.5.1 Coping With Earthquakes & Volcanoes
11.5.2 End of Topic Test - Tectonics
12 Climate Change
12.1 The Causes & Consequences of Climate Change
12.1.1 Evidence for Climate Change
12.1.2 Natural Causes of Climate Change
12.1.3 Human Causes of Climate Change
12.1.4 The Greenhouse Effect
12.1.5 Effects of Climate Change on the Environment
12.1.6 Effects of Climate Change on People
12.1.7 Climate Change Predictions
12.1.8 Uncertainty About Future Climate Change
12.1.9 Mitigating Against Climate Change
12.1.10 Adapting to Climate Change
12.1.11 Case Study: Bangladesh
13 Global Population & Inequality
13.1 Global Populations
13.1.1 World Population
13.1.2 Population Structure
13.1.3 Ageing Populations
13.1.4 Youthful Populations
13.1.5 Population Control
13.1.6 Mexico to USA Migration
13.1.7 End of Topic Test - Development & Population
14 Urbanisation
14.1 Urbanisation
14.1.1 Rural Characterisitcs
14.1.2 Urban Characteristics
14.1.3 Urbanisation Growth
14.1.4 The Land Use Model
14.1.5 Rural-Urban Pull Factors
14.1.6 Rural-Urban Push Factors
14.1.7 The Impacts of Migration
14.1.8 Challenges of Urban Areas in Developed Countries
14.1.9 Challenges of Urban Areas in Developing Countries
14.1.10 Urban Sustainability
14.1.11 Case Study: China's Urbanisation
14.1.12 Major UK Cities
14.1.13 Urbanisation in the UK
14.1.14 End of Topic Test- Urbanisation
14.1.15 End of Topic Test - Urban Issues
15 Ecosystems
15.1 The Major Biomes
15.1.1 Distribution of Major Biomes
15.1.2 What Affects the Distribution of Biomes?
15.1.3 Biome Features: Tropical Forests
15.1.4 Biome Features: Temperate Forests
15.1.5 Biome Features: Tundra
15.1.6 Biome Features: Deserts
15.1.7 Biome Features: Tropical Grasslands
15.1.8 Biome Features: Temperate Grasslands
15.2 Case Study: The Amazon Rainforest
15.2.1 Interdependence of Rainforest Ecosystems
15.2.2 Nutrient Cycling in Tropical Rainforests
15.2.3 Deforestation in the Amazon
15.2.4 Impacts of Deforestation in the Amazon
15.2.5 Protecting the Amazon
15.2.6 Adaptations of Plants to Rainforests
15.2.7 Adaptations of Animals to Rainforests
16 Life in an Emerging Country
16.1 Case Studies
16.1.1 Mumbai: Opportunities
16.1.2 Mumbai: Challenges
17 Analysis of Africa
17.1 Africa
17.1.1 Desert Biomes in Africa
17.1.2 The Semi-Desert Biome
17.1.3 The Savanna Biome
17.1.4 Overview of Tropical Rainforests
17.1.5 Colonisation History
17.1.6 Population Distribution in Africa
17.1.7 Economic Resources in Africa
17.1.8 Urbanisation in Africa
17.1.9 Africa's Location
17.1.10 Physical Geography of Africa
17.1.11 Desertification in Africa
17.1.12 Reducing the Risk of Desertification
17.1.13 Case Study: The Sahara Desert - Opportunities
17.1.14 Case Study: The Sahara Desert - Development
18 Analysis of India
18.1 India - Physical Geography
18.1.1 Geographical Location of India
18.1.2 Physical Geography of India
18.1.3 India's Climate
18.1.4 Natural Disasters in India
18.1.5 Case Study: The Thar Desert
18.1.6 Case Study: The Thar Desert - Challenges
18.2 India - Human Geography
18.2.1 Population Distribution in India
18.2.2 Urabinsation in India
18.2.3 The History of India
18.2.4 Economic Resources in India
19 Analysis of the Middle East
19.1 The Middle East
19.1.1 Physical Geography of the Middle East
19.1.2 Human Geography of the Middle East
19.1.3 Climate Zones in the Middle East
19.1.4 Climate Comparison with the UK
19.1.5 Oil & Natural Gas in the Middle East
19.1.6 Water in the Middle East
19.1.7 Population of the Middle East
19.1.8 Development Case Studies: The UAE
19.1.9 Development Case Studies: Yemen
19.1.10 Supporting Development in Yemen
19.1.11 Connection to the UK
19.1.12 Importance of Oil
19.1.13 Oil & Tourism in the UAE
20 Analysis of Bangladesh
20.1 Bangladesh Physical Geography
20.1.1 Location of Bangladesh
20.1.2 Climate of Bangladesh
20.1.3 Rivers in Bangladesh
20.1.4 Flooding in Bangladesh
20.2 Bangladesh Human Geography
20.2.1 Population Structure in Bangladesh
20.2.2 Urbanisation in Bangladesh
20.2.3 Bangladesh's Economy
20.2.4 Energy & Sustainability in Bangladesh
21 Analysis of Russia
21.1 Russia's Physical Geography
21.1.1 Russia's Climate
21.1.2 Russia's Landscape
21.2 Russia's Human Geography
21.2.1 Population of Russia
21.2.2 Russia's Economy
21.2.3 Energy & Sustainability in Russia
Jump to other topics

Unlock your full potential with GoStudent tutoring
Affordable 1:1 tutoring from the comfort of your home
Tutors are matched to your specific learning needs
30+ school subjects covered
Formation of Tsunamis
Coping With Earthquakes & Volcanoes

IMAGES
VIDEO
COMMENTS
Tsunami: A giant tsunami wave resulted in widespread destruction along the coast. Fatalities : Around 16,000 deaths were reported, mainly resulting from the tsunami. Injuries : 26,152 were injured, mainly as a result of the tsunami.
The 2011 tsunami affected over 500 kilometres of the Japanese coastline. Water rushing into the Fukushima No.1 nuclear power plant, after a tsunami triggered by an earthquake. The tsunami...
Japan’s worst previous earthquake was of 8.3 magnitude and killed 143,000 people in Kanto in 1923. A magnitude 7.2 quake in Kobe killed 6,400 people in 1995. The 2011 Japan earthquake had a devastating impact. This case study explores the cause and effects of the earthquake including a tsunami.
National Police Agency of Japan figures shows almost 300,000 buildings were destroyed and a further one million damaged, either by the quake, tsunami or resulting fires. Almost 4,000 roads, 78 bridges and 29 railways were also affected.
Japan was a high income country and had a new tsunami warning system. But, studies suggest that only 58% paid any attention to the tsunami warning. In the 12 months after the Tohoku earthquake, there were 5,000 aftershocks in Japan. Affordable 1:1 tutoring from the comfort of your home.
Case Study of the Japan 2011 earthquake in Tohoku. This is the sixth video for the AQA GCSE 9-1 Geography course, and the sixth video of the Challenge of Natural Hazards topic.
Lesson 6: Japan’s Earthquake and Tsunami Case Study The Japanese earthquake of Friday 11th March 2011 had a magnitude of 9 on the Richter scale. This is equivalent to the energy needed to power every home in the USA for 50 days. It was 600 million times more powerful than the Hiroshima nuclear bomb. The effects of the earthquake were
a great tsunami that killed nearly 20,000 people and wreaked destruc-tion along the Tohoku (eastern) coast of Japan. The tsunami traveled across the Pacific basin, triggering evacuations and causing some dam- age in many countries; one person was killed in California. The earth-quake struck at 2:46.
On 11 March, 2011 a devastating tsunami triggered by a Mw 9.0 earthquake struck the northern Pacific coast of Japan, and completely destroyed many coastal communities, particularly in Iwate, Miyagi and Fukushima prefectures.
The 2011 Great Tohoku Earthquake near the coast of Japan created a tsunami that sent destructive waves traveling across the Pacific Ocean. The Tsunami Began in Northern Japan. On March 11, 2011, a 9.1 earthquake occurred near Japan, shifting the earth 200 feet along a fault line under the sea.