- Privacy Policy
Home » Documentary Analysis – Methods, Applications and Examples

Documentary Analysis – Methods, Applications and Examples
Table of Contents

Documentary Analysis
Definition:
Documentary analysis, also referred to as document analysis , is a systematic procedure for reviewing or evaluating documents. This method involves a detailed review of the documents to extract themes or patterns relevant to the research topic .
Documents used in this type of analysis can include a wide variety of materials such as text (words) and images that have been recorded without a researcher’s intervention. The domain of document analysis, therefore, includes all kinds of texts – books, newspapers, letters, study reports, diaries, and more, as well as images like maps, photographs, and films.
Documentary analysis provides valuable insight and a unique perspective on the past, contextualizing the present and providing a baseline for future studies. It is also an essential tool in case studies and when direct observation or participant observation is not possible.
The process usually involves several steps:
- Sourcing : This involves identifying the document or source, its origin, and the context in which it was created.
- Contextualizing : This involves understanding the social, economic, political, and cultural circumstances during the time the document was created.
- Interrogating : This involves asking a series of questions to help understand the document better. For example, who is the author? What is the purpose of the document? Who is the intended audience?
- Making inferences : This involves understanding what the document says (either directly or indirectly) about the topic under study.
- Checking for reliability and validity : Just like other research methods, documentary analysis also involves checking for the validity and reliability of the documents being analyzed.
Documentary Analysis Methods
Documentary analysis as a qualitative research method involves a systematic process. Here are the main steps you would generally follow:
Defining the Research Question
Before you start any research , you need a clear and focused research question . This will guide your decision on what documents you need to analyze and what you’re looking for within them.
Selecting the Documents
Once you know what you’re looking for, you can start to select the relevant documents. These can be a wide range of materials – books, newspapers, letters, official reports, diaries, transcripts of speeches, archival materials, websites, social media posts, and more. They can be primary sources (directly from the time/place/person you are studying) or secondary sources (analyses created by others).
Reading and Interpreting the Documents
You need to closely read the selected documents to identify the themes and patterns that relate to your research question. This might involve content analysis (looking at what is explicitly stated) and discourse analysis (looking at what is implicitly stated or implied). You need to understand the context in which the document was created, the author’s purpose, and the audience’s perspective.
Coding and Categorizing the Data
After the initial reading, the data (text) can be broken down into smaller parts or “codes.” These codes can then be categorized based on their similarities and differences. This process of coding helps in organizing the data and identifying patterns or themes.
Analyzing the Data
Once the data is organized, it can be analyzed to make sense of it. This can involve comparing the data with existing theories, examining relationships between categories, or explaining the data in relation to the research question.
Validating the Findings
The researcher needs to ensure that the findings are accurate and credible. This might involve triangulating the data (comparing it with other sources or types of data), considering alternative explanations, or seeking feedback from others.
Reporting the Findings
The final step is to report the findings in a clear, structured way. This should include a description of the methods used, the findings, and the researcher’s interpretations and conclusions.
Applications of Documentary Analysis
Documentary analysis is widely used across a variety of fields and disciplines due to its flexible and comprehensive nature. Here are some specific applications:
Historical Research
Documentary analysis is a fundamental method in historical research. Historians use documents to reconstruct past events, understand historical contexts, and interpret the motivations and actions of historical figures. Documents analyzed may include personal letters, diaries, official records, newspaper articles, photographs, and more.
Social Science Research
Sociologists, anthropologists, and political scientists use documentary analysis to understand social phenomena, cultural practices, political events, and more. This might involve analyzing government policies, organizational records, media reports, social media posts, and other documents.
Legal Research
In law, documentary analysis is used in case analysis and statutory interpretation. Legal practitioners and scholars analyze court decisions, statutes, regulations, and other legal documents.
Business and Market Research
Companies often analyze documents to gather business intelligence, understand market trends, and make strategic decisions. This might involve analyzing competitor reports, industry news, market research studies, and more.
Media and Communication Studies
Scholars in these fields might analyze media content (e.g., news reports, advertisements, social media posts) to understand media narratives, public opinion, and communication practices.
Literary and Film Studies
In these fields, the “documents” might be novels, poems, films, or scripts. Scholars analyze these texts to interpret their meaning, understand their cultural context, and critique their form and content.
Educational Research
Educational researchers may analyze curricula, textbooks, lesson plans, and other educational documents to understand educational practices and policies.
Health Research
Health researchers may analyze medical records, health policies, clinical guidelines, and other documents to study health behaviors, healthcare delivery, and health outcomes.
Examples of Documentary Analysis
Some Examples of Documentary Analysis might be:
- Example 1 : A historian studying the causes of World War I might analyze diplomatic correspondence, government records, newspaper articles, and personal diaries from the period leading up to the war.
- Example 2 : A policy analyst trying to understand the impact of a new public health policy might analyze the policy document itself, as well as related government reports, statements from public health officials, and news media coverage of the policy.
- Example 3 : A market researcher studying consumer trends might analyze social media posts, customer reviews, industry reports, and news articles related to the market they’re studying.
- Example 4 : An education researcher might analyze curriculum documents, textbooks, and lesson plans to understand how a particular subject is being taught in schools. They might also analyze policy documents to understand the broader educational policy context.
- Example 5 : A criminologist studying hate crimes might analyze police reports, court records, news reports, and social media posts to understand patterns in hate crimes, as well as societal and institutional responses to them.
- Example 6 : A journalist writing a feature article on homelessness might analyze government reports on homelessness, policy documents related to housing and social services, news articles on homelessness, and social media posts from people experiencing homelessness.
- Example 7 : A literary critic studying a particular author might analyze their novels, letters, interviews, and reviews of their work to gain insight into their themes, writing style, influences, and reception.
When to use Documentary Analysis
Documentary analysis can be used in a variety of research contexts, including but not limited to:
- When direct access to research subjects is limited : If you are unable to conduct interviews or observations due to geographical, logistical, or ethical constraints, documentary analysis can provide an alternative source of data.
- When studying the past : Documents can provide a valuable window into historical events, cultures, and perspectives. This is particularly useful when the people involved in these events are no longer available for interviews or when physical evidence is lacking.
- When corroborating other sources of data : If you have collected data through interviews, surveys, or observations, analyzing documents can provide additional evidence to support or challenge your findings. This process of triangulation can enhance the validity of your research.
- When seeking to understand the context : Documents can provide background information that helps situate your research within a broader social, cultural, historical, or institutional context. This can be important for interpreting your other data and for making your research relevant to a wider audience.
- When the documents are the focus of the research : In some cases, the documents themselves might be the subject of your research. For example, you might be studying how a particular topic is represented in the media, how an author’s work has evolved over time, or how a government policy was developed.
- When resources are limited : Compared to methods like experiments or large-scale surveys, documentary analysis can often be conducted with relatively limited resources. It can be a particularly useful method for students, independent researchers, and others who are working with tight budgets.
- When providing an audit trail for future researchers : Documents provide a record of events, decisions, or conditions at specific points in time. They can serve as an audit trail for future researchers who want to understand the circumstances surrounding a particular event or period.
Purpose of Documentary Analysis
The purpose of documentary analysis in research can be multifold. Here are some key reasons why a researcher might choose to use this method:
- Understanding Context : Documents can provide rich contextual information about the period, environment, or culture under investigation. This can be especially useful for historical research, where the context is often key to understanding the events or trends being studied.
- Direct Source of Data : Documents can serve as primary sources of data. For instance, a letter from a historical figure can give unique insights into their thoughts, feelings, and motivations. A company’s annual report can offer firsthand information about its performance and strategy.
- Corroboration and Verification : Documentary analysis can be used to validate and cross-verify findings derived from other research methods. For example, if interviews suggest a particular outcome, relevant documents can be reviewed to confirm the accuracy of this finding.
- Substituting for Other Methods : When access to the field or subjects is not possible due to various constraints (geographical, logistical, or ethical), documentary analysis can serve as an alternative to methods like observation or interviews.
- Unobtrusive Method : Unlike some other research methods, documentary analysis doesn’t require interaction with subjects, and therefore doesn’t risk altering the behavior of those subjects.
- Longitudinal Analysis : Documents can be used to study change over time. For example, a researcher might analyze census data from multiple decades to study demographic changes.
- Providing Rich, Qualitative Data : Documents often provide qualitative data that can help researchers understand complex issues in depth. For example, a policy document might reveal not just the details of the policy, but also the underlying beliefs and attitudes that shaped it.
Advantages of Documentary Analysis
Documentary analysis offers several advantages as a research method:
- Unobtrusive : As a non-reactive method, documentary analysis does not require direct interaction with human subjects, which means that the research doesn’t affect or influence the subjects’ behavior.
- Rich Historical and Contextual Data : Documents can provide a wealth of historical and contextual information. They allow researchers to examine events and perspectives from the past, even from periods long before modern research methods were established.
- Efficiency and Accessibility : Many documents are readily accessible, especially with the proliferation of digital archives and databases. This accessibility can often make documentary analysis a more efficient method than others that require data collection from human subjects.
- Cost-Effective : Compared to other methods, documentary analysis can be relatively inexpensive. It generally requires fewer resources than conducting experiments, surveys, or fieldwork.
- Permanent Record : Documents provide a permanent record that can be reviewed multiple times. This allows for repeated analysis and verification of the data.
- Versatility : A wide variety of documents can be analyzed, from historical texts to contemporary digital content, providing flexibility and applicability to a broad range of research questions and fields.
- Ability to Cross-Verify (Triangulate) Data : Documentary analysis can be used alongside other methods as a means of triangulating data, thus adding validity and reliability to the research.
Limitations of Documentary Analysis
While documentary analysis offers several benefits as a research method, it also has its limitations. It’s important to keep these in mind when deciding to use documentary analysis and when interpreting your findings:
- Authenticity : Not all documents are genuine, and sometimes it can be challenging to verify the authenticity of a document, particularly for historical research.
- Bias and Subjectivity : All documents are products of their time and their authors. They may reflect personal, cultural, political, or institutional biases, and these biases can affect the information they contain and how it is presented.
- Incomplete or Missing Information : Documents may not provide all the information you need for your research. There may be gaps in the record, or crucial information may have been omitted, intentionally or unintentionally.
- Access and Availability : Not all documents are readily available for analysis. Some may be restricted due to privacy, confidentiality, or security considerations. Others may be difficult to locate or access, particularly historical documents that haven’t been digitized.
- Interpretation : Interpreting documents, particularly historical ones, can be challenging. You need to understand the context in which the document was created, including the social, cultural, political, and personal factors that might have influenced its content.
- Time-Consuming : While documentary analysis can be cost-effective, it can also be time-consuming, especially if you have a large number of documents to analyze or if the documents are lengthy or complex.
- Lack of Control Over Data : Unlike methods where the researcher collects the data themselves (e.g., through experiments or surveys), with documentary analysis, you have no control over what data is available. You are reliant on what others have chosen to record and preserve.
About the author

Muhammad Hassan
Researcher, Academic Writer, Web developer
You may also like

Cluster Analysis – Types, Methods and Examples

Discriminant Analysis – Methods, Types and...

MANOVA (Multivariate Analysis of Variance) –...

ANOVA (Analysis of variance) – Formulas, Types...

Graphical Methods – Types, Examples and Guide

Substantive Framework – Types, Methods and...
Document Analysis
- First Online: 02 January 2023
Cite this chapter

- Benjamin Kutsyuruba 4
Part of the book series: Springer Texts in Education ((SPTE))
4667 Accesses
1 Citations
This chapter describes the document analysis approach. As a qualitative method, document analysis entails a systematic procedure for reviewing and evaluating documents through finding, selecting, appraising (making sense of), and synthesizing data contained within them. This chapter outlines the brief history, method and use of document analysis, provides an outline of its process, strengths and limitations, and application, and offers further readings, resources, and suggestions for student engagement activities.
This is a preview of subscription content, log in via an institution to check access.
Access this chapter
- Available as PDF
- Read on any device
- Instant download
- Own it forever
- Available as EPUB and PDF
- Compact, lightweight edition
- Dispatched in 3 to 5 business days
- Free shipping worldwide - see info
Tax calculation will be finalised at checkout
Purchases are for personal use only
Institutional subscriptions
Altheide, D. L. (1987). Ethnographic content analysis. Qualitative Sociology, 10 (1), 65–77.
Article Google Scholar
Altheide, D. L. (1996). Qualitative media analysis . SAGE.
Google Scholar
Altheide, D. L. (2000). Tracking discourse and qualitative document analysis. Poetics, 27 , 287–299.
Atkinson, P. A., & Coffey, A. (1997). Analysing documentary realities. In D. Silverman (Ed.), Qualitative research: Theory, method and practice (pp. 45–62). SAGE.
Berg, B. L. (2001). Qualitative research methods for social sciences . Allyn and Bacon.
Bowen, G. A. (2009). Document analysis as a qualitative research method. Qualitative Research Journal, 9 (2), 27–40. https://doi.org/10.3316/qrj0902027
Bryman, A. (2003). Research methods and organization studies . Routledge.
Book Google Scholar
Cardno, C. (2018). Policy document analysis: A practical educational leadership tool and a qualitative research method. Educational Administration: Theory and Practice , 24 (4), 623–640. https://doi.org/10.14527/kuey.2018.016
Caulley, D. N. (1983). Document analysis in program evaluation. Evaluation and Program Planning, 6 , 19–29.
Corbin, J., & Strauss, A. (2008). Basics of qualitative research: Techniques and procedures for developing grounded theory (3rd ed.). SAGE.
Derrida, J. (1978). Writing and difference . Routledge & Kegan Paul.
Glaser, B. G., & Strauss, A. L. (1967). The discovery of grounded theory: Strategies for qualitative research . Aldine De Gruyter.
Glesne, C., & Peshkin, A. (1992). Becoming qualitative researchers (2nd ed.). Longman.
Goode, W. J., & Hatt, P. K. (1952). Methods in social research . McGraw-Hill.
Hodder, I. (2000). The interpretation of documents and material culture. In N. K. Denzin & Y. S. Lincoln (Eds.), Handbook of qualitative research (2nd ed., pp. 703–715). SAGE.
Krippendorff, K. (1980). Content analysis: An introduction to its methodology. SAGE.
Lombard, M., Snyder-Duch, J., & Bracken, C. C. (2002). Content analysis in mass communication: Assessment and reporting of intercoder reliability. Human Communication Research, 28 , 587–604.
Lombard, M., Snyder-Duch, J., & Bracken, C. C. (2010). Practical resources for assessing and reporting intercoder reliability in content analysis research projects . Retrieved March 20, 2011, from http://matthewlombard.com/reliability/index_print.html
Mayring, P. (2000). Qualitative content analysis. Forum: Qualitative social research (Vol. 1(2)). Retrieved March 22, 2011, from http://www.qualitative-research.net/index.php/fqs/article/viewArticle/1089/2385
McMillan, J. H., & Schumacher, S. (2010). Research in education: Evidence-based inquiry (7th ed.). Pearson.
Merriam, S. B. (1988a). Case study research in education: A qualitative approach . Jossey-Bass.
Merriam, S. B. (1998b). Case study research in education . Jossey-Bass.
Miller, F. A., & Alvarado, K. (2005). Incorporating documents into qualitative nursing research. Journal of Nursing Scholarship, 37 (4), 348–353.
Neuendorf, K. A. (2002). The content analysis guidebook . SAGE.
O’Leary, Z. (2014). The essential guide to doing your research project (2nd ed.). SAGE.
Patton, M. Q. (2002). Qualitative research & evaluation methods (3rd ed.). SAGE.
Prior, L. (2003). Using documents in social research . SAGE.
Prior, L. (2008a). Document analysis. In L. Given (Ed.), The SAGE encyclopaedia of qualitative research methods (pp. 231–232). SAGE. https://doi.org/10.4135/9781412963909
Prior, L. (2008b). Repositioning documents in social research. Sociology, 42 (5), 821–836. https://doi.org/10.1177/0038038508094564
Prior, L. (2012). The role of documents in social research. In S. Delamont (Ed.), Handbook of qualitative research in education (pp. 426–438). Edward Elgar.
Salminen, A., Kauppinen, K., & Lehtovaara, M. (1997). Towards a methodology for document analysis. Journal of the American Society for Information Science, 48 (7), 644–655.
Stake, R. E. (1995). The art of case study research . SAGE.
Wharton, C. (2006). Document analysis. In V. Jupp (Ed.), The SAGE dictionary of social research methods (pp. 80–81). SAGE. https://doi.org/10.4135/9780857020116
Yin, R. K. (2009). Case study research, design and methods (4th ed.). SAGE.
Additional Reading
Kutsyuruba, B. (2017). Examining education reforms through document analysis methodology. In I. Silova, A. Korzh, S. Kovalchuk, & N. Sobe (Eds.), Reimagining Utopias: Theory and method for educational research in post-socialist contexts (pp. 199–214). Sense.
Kutsyuruba, B., Christou, T., Heggie, L., Murray, J., & Deluca, C. (2015). Teacher collaborative inquiry in Ontario: An analysis of provincial and school board policies and support documents. Canadian Journal of Educational Administration and Policy, 172 , 1–38.
Kutsyuruba, B., Godden, L., & Tregunna, L. (2014). Curbing the early-career attrition: A pan-Canadian document analysis of teacher induction and mentorship programs. Canadian Journal of Educational Administration and Policy, 161 , 1–42.
Segeren, A., & Kutsyuruba, B. (2012). Twenty years and counting: An examination of the development of equity and inclusive education policy in Ontario (1990–2010). Canadian Journal of Educational Administration and Policy, 136 , 1–38.
Online Resources
Document Analysis: A How To Guide (12:27 min) https://www.youtube.com/watch?v=vOsE9saR_ck
Document Analysis with Philip Adu (1:16:40 min) https://youtu.be/bLKBffW5JPU
Download references
Author information
Authors and affiliations.
Queen’s University, Kingston, Canada
Benjamin Kutsyuruba
You can also search for this author in PubMed Google Scholar
Corresponding author
Correspondence to Benjamin Kutsyuruba .
Editor information
Editors and affiliations.
Department of Educational Administration, College of Education, University of Saskatchewan, Saskatoon, SK, Canada
Janet Mola Okoko
Scott Tunison
Department of Educational Administration, University of Saskatchewan, Saskatoon, SK, Canada
Keith D. Walker
Rights and permissions
Reprints and permissions
Copyright information
© 2023 The Author(s), under exclusive license to Springer Nature Switzerland AG
About this chapter
Kutsyuruba, B. (2023). Document Analysis. In: Okoko, J.M., Tunison, S., Walker, K.D. (eds) Varieties of Qualitative Research Methods. Springer Texts in Education. Springer, Cham. https://doi.org/10.1007/978-3-031-04394-9_23
Download citation
DOI : https://doi.org/10.1007/978-3-031-04394-9_23
Published : 02 January 2023
Publisher Name : Springer, Cham
Print ISBN : 978-3-031-04396-3
Online ISBN : 978-3-031-04394-9
eBook Packages : Education Education (R0)
Share this chapter
Anyone you share the following link with will be able to read this content:
Sorry, a shareable link is not currently available for this article.
Provided by the Springer Nature SharedIt content-sharing initiative
- Publish with us
Policies and ethics
- Find a journal
- Track your research

Document Analysis - How to Analyze Text Data for Research

Introduction
What is document analysis, where is document analysis used, how to perform document analysis, what is text analysis, atlas.ti as text analysis software.
In qualitative research , you can collect primary data through surveys , observations , or interviews , to name a few examples. In addition, you can rely on document analysis when the data already exists in secondary sources like books, public reports, or other archival records that are relevant to your research inquiry.
In this article, we will look at the role of document analysis, the relationship between document analysis and text analysis, and how text analysis software like ATLAS.ti can help you conduct qualitative research.

Document analysis is a systematic procedure used in qualitative research to review and interpret the information embedded in written materials. These materials, often referred to as “documents,” can encompass a wide range of physical and digital sources, such as newspapers, diaries, letters, policy documents, contracts, reports, transcripts, and many others.
At its core, document analysis involves critically examining these sources to gather insightful data and understand the context in which they were created. Research can perform sentiment analysis , text mining, and text categorization, to name a few methods. The goal is not just to derive facts from the documents, but also to understand the underlying nuances, motivations, and perspectives that they represent. For instance, a historical researcher may examine old letters not just to get a chronological account of events, but also to understand the emotions, beliefs, and values of people during that era.
Benefits of document analysis
There are several advantages to using document analysis in research:
- Authenticity : Since documents are typically created for purposes other than research, they can offer an unobtrusive and genuine insight into the topic at hand, without the potential biases introduced by direct observation or interviews.
- Availability : Documents, especially those in the public domain, are widely accessible, making it easier for researchers to source information.
- Cost-effectiveness : As these documents already exist, researchers can save time and resources compared to other data collection methods.
However, document analysis is not without challenges. One must ensure the documents are authentic and reliable. Furthermore, the researcher must be adept at discerning between objective facts and subjective interpretations present in the document.
Document analysis is a versatile method in qualitative research that offers a lens into the intricate layers of meaning, context, and perspective found within textual materials. Through careful and systematic examination, it unveils the richness and depth of the information housed in documents, providing a unique dimension to research findings.

Document analysis is employed in a myriad of sectors, serving various purposes to generate actionable insights. Whether it's understanding customer sentiments or gleaning insights from historical records, this method offers valuable information. Here are some examples of how document analysis is applied.
Analyzing surveys and their responses
A common use of document analysis in the business world revolves around customer surveys . These surveys are designed to collect data on the customer experience, seeking to understand how products or services meet or fall short of customer expectations.
By analyzing customer survey responses , companies can identify areas of improvement, gauge satisfaction levels, and make informed decisions to enhance the customer experience. Even if customer service teams designed a survey for a specific purpose, text analytics of the responses can focus on different angles to gather insights for new research questions.
Examining customer feedback through social media posts
In today's digital age, social media is a goldmine of customer feedback. Customers frequently share their experiences, both positive and negative, on platforms like Twitter, Facebook, and Instagram.
Through document analysis of social media posts, companies can get a real-time pulse of their customer sentiments. This not only helps in immediate issue resolution but also in shaping product or service strategies to align with customer preferences.
Interpreting customer support tickets
Another rich source of data is customer support tickets. These tickets often contain detailed descriptions of issues faced by customers, their frustrations, or sometimes their appreciation for assistance received.
By employing document analysis on these tickets, businesses can detect patterns, identify recurring issues, and work towards streamlining their support processes. This ensures a smoother and more satisfying customer experience.
Historical research and social studies
Beyond the world of business, document analysis plays a pivotal role in historical and social research. Scholars analyze old manuscripts, letters, and other archival materials to construct a narrative of past events, cultures, and civilizations.
As a result, document analysis is an ideal method for historical research since generating new data is less feasible than turning to existing sources for analysis. Researchers can not only examine historical narratives but also how those narratives were constructed in their own time.

Turn to ATLAS.ti for your data analysis needs
Try out our powerful data analysis tools with a free trial to make the most out of your data today.
Performing document analysis is a structured process that ensures researchers can derive meaningful, qualitative insights by organizing source material into structured data . Here's a brief outline of the process:
- Define the research question
- Choose relevant documents
- Prepare and organize the documents
- Begin initial review and coding
- Analyze and interpret the data
- Present findings and draw conclusions
The process in detail
Before diving into the documents, it's crucial to have a clear research question or objective. This serves as the foundation for the entire analysis and guides the selection and review of documents. A well-defined question will focus the research, ensuring that the document analysis is targeted and relevant.
The next step is to identify and select documents that align with the research question. It's vital to ensure that these documents are credible, reliable, and pertinent to the research inquiry. The chosen materials can vary from official reports, personal diaries, to digital resources like social media data , depending on the nature of the research.
Once the documents are selected, they need to be organized in a manner that facilitates smooth analysis. This could mean categorizing documents by themes, chronology, or source types. Digital tools and data analysis software , such as ATLAS.ti, can assist in this phase, making the organization more efficient and helping researchers locate specific data when needed.

With everything in place, the researcher starts an initial review of the documents. During this phase, the emphasis is on identifying patterns, themes, or specific information relevant to the research question.
Coding involves assigning labels or tags to sections of the text to categorize the information. This step is iterative, and codes can be refined as the researcher delves deeper.
After coding, interesting patterns across codes can be analyzed. Here, researchers seek to draw meaningful connections between codes, identify overarching themes, and interpret the data in the context of the research question .
This is where the hidden insights and deeper understanding emerge, as researchers juxtapose various pieces of information and infer meaning from them.
Finally, after the intensive process of document analysis, the researcher consolidates their findings, crafting a narrative or report that presents the results. This might also involve visual representations like charts or graphs, especially when demonstrating patterns or trends.
Drawing conclusions involves synthesizing the insights gained from the analysis and offering answers or perspectives in relation to the original research question.
Ultimately, document analysis is a meticulous and iterative procedure. But with a clear plan and systematic approach, it becomes a potent tool in the researcher's arsenal, allowing them to uncover profound insights from textual data.

Text analysis, often referenced alongside document analysis, is a method that focuses on extracting meaningful information from textual data. While document analysis revolves around reviewing and interpreting data from various sources, text analysis hones in on the intricate details within these documents, enabling a deeper understanding. Both these methods are vital in fields such as linguistics, literature, social sciences, and business analytics.
In the context of document analysis, text analysis emerges as a nuanced exploration of the textual content. After documents have been sourced, be it from books, articles, social networks, or any other medium, they undergo a preprocessing phase. Here, irrelevant information is eliminated, errors are rectified, and the text may be translated or converted to ensure uniformity.
This cleaned text is then tokenized into smaller units like words or phrases, facilitating a granular review. Techniques specific to text analysis, such as topic modeling to determine discussed subjects or pattern recognition to identify trends, are applied.
The derived insights can be visualized using tools like graphs or charts, offering a clearer understanding of the content's depth. Interpretation follows, allowing researchers to draw actionable insights or theoretical conclusions based on both the broader document context and the specific text analysis.
Merging text analysis with document analysis presents unique challenges. With the proliferation of digital content, managing vast data sets becomes a significant hurdle. The inherent variability of language, laden with cultural nuances, idioms, and sometimes sarcasm, can make precise interpretation elusive.
Many text analysis tools exist that can facilitate the analytical process. ATLAS.ti offers a well-rounded, useful solution as a text analytics software . In this section, we'll highlight some of the tools that can help you conduct document analysis.
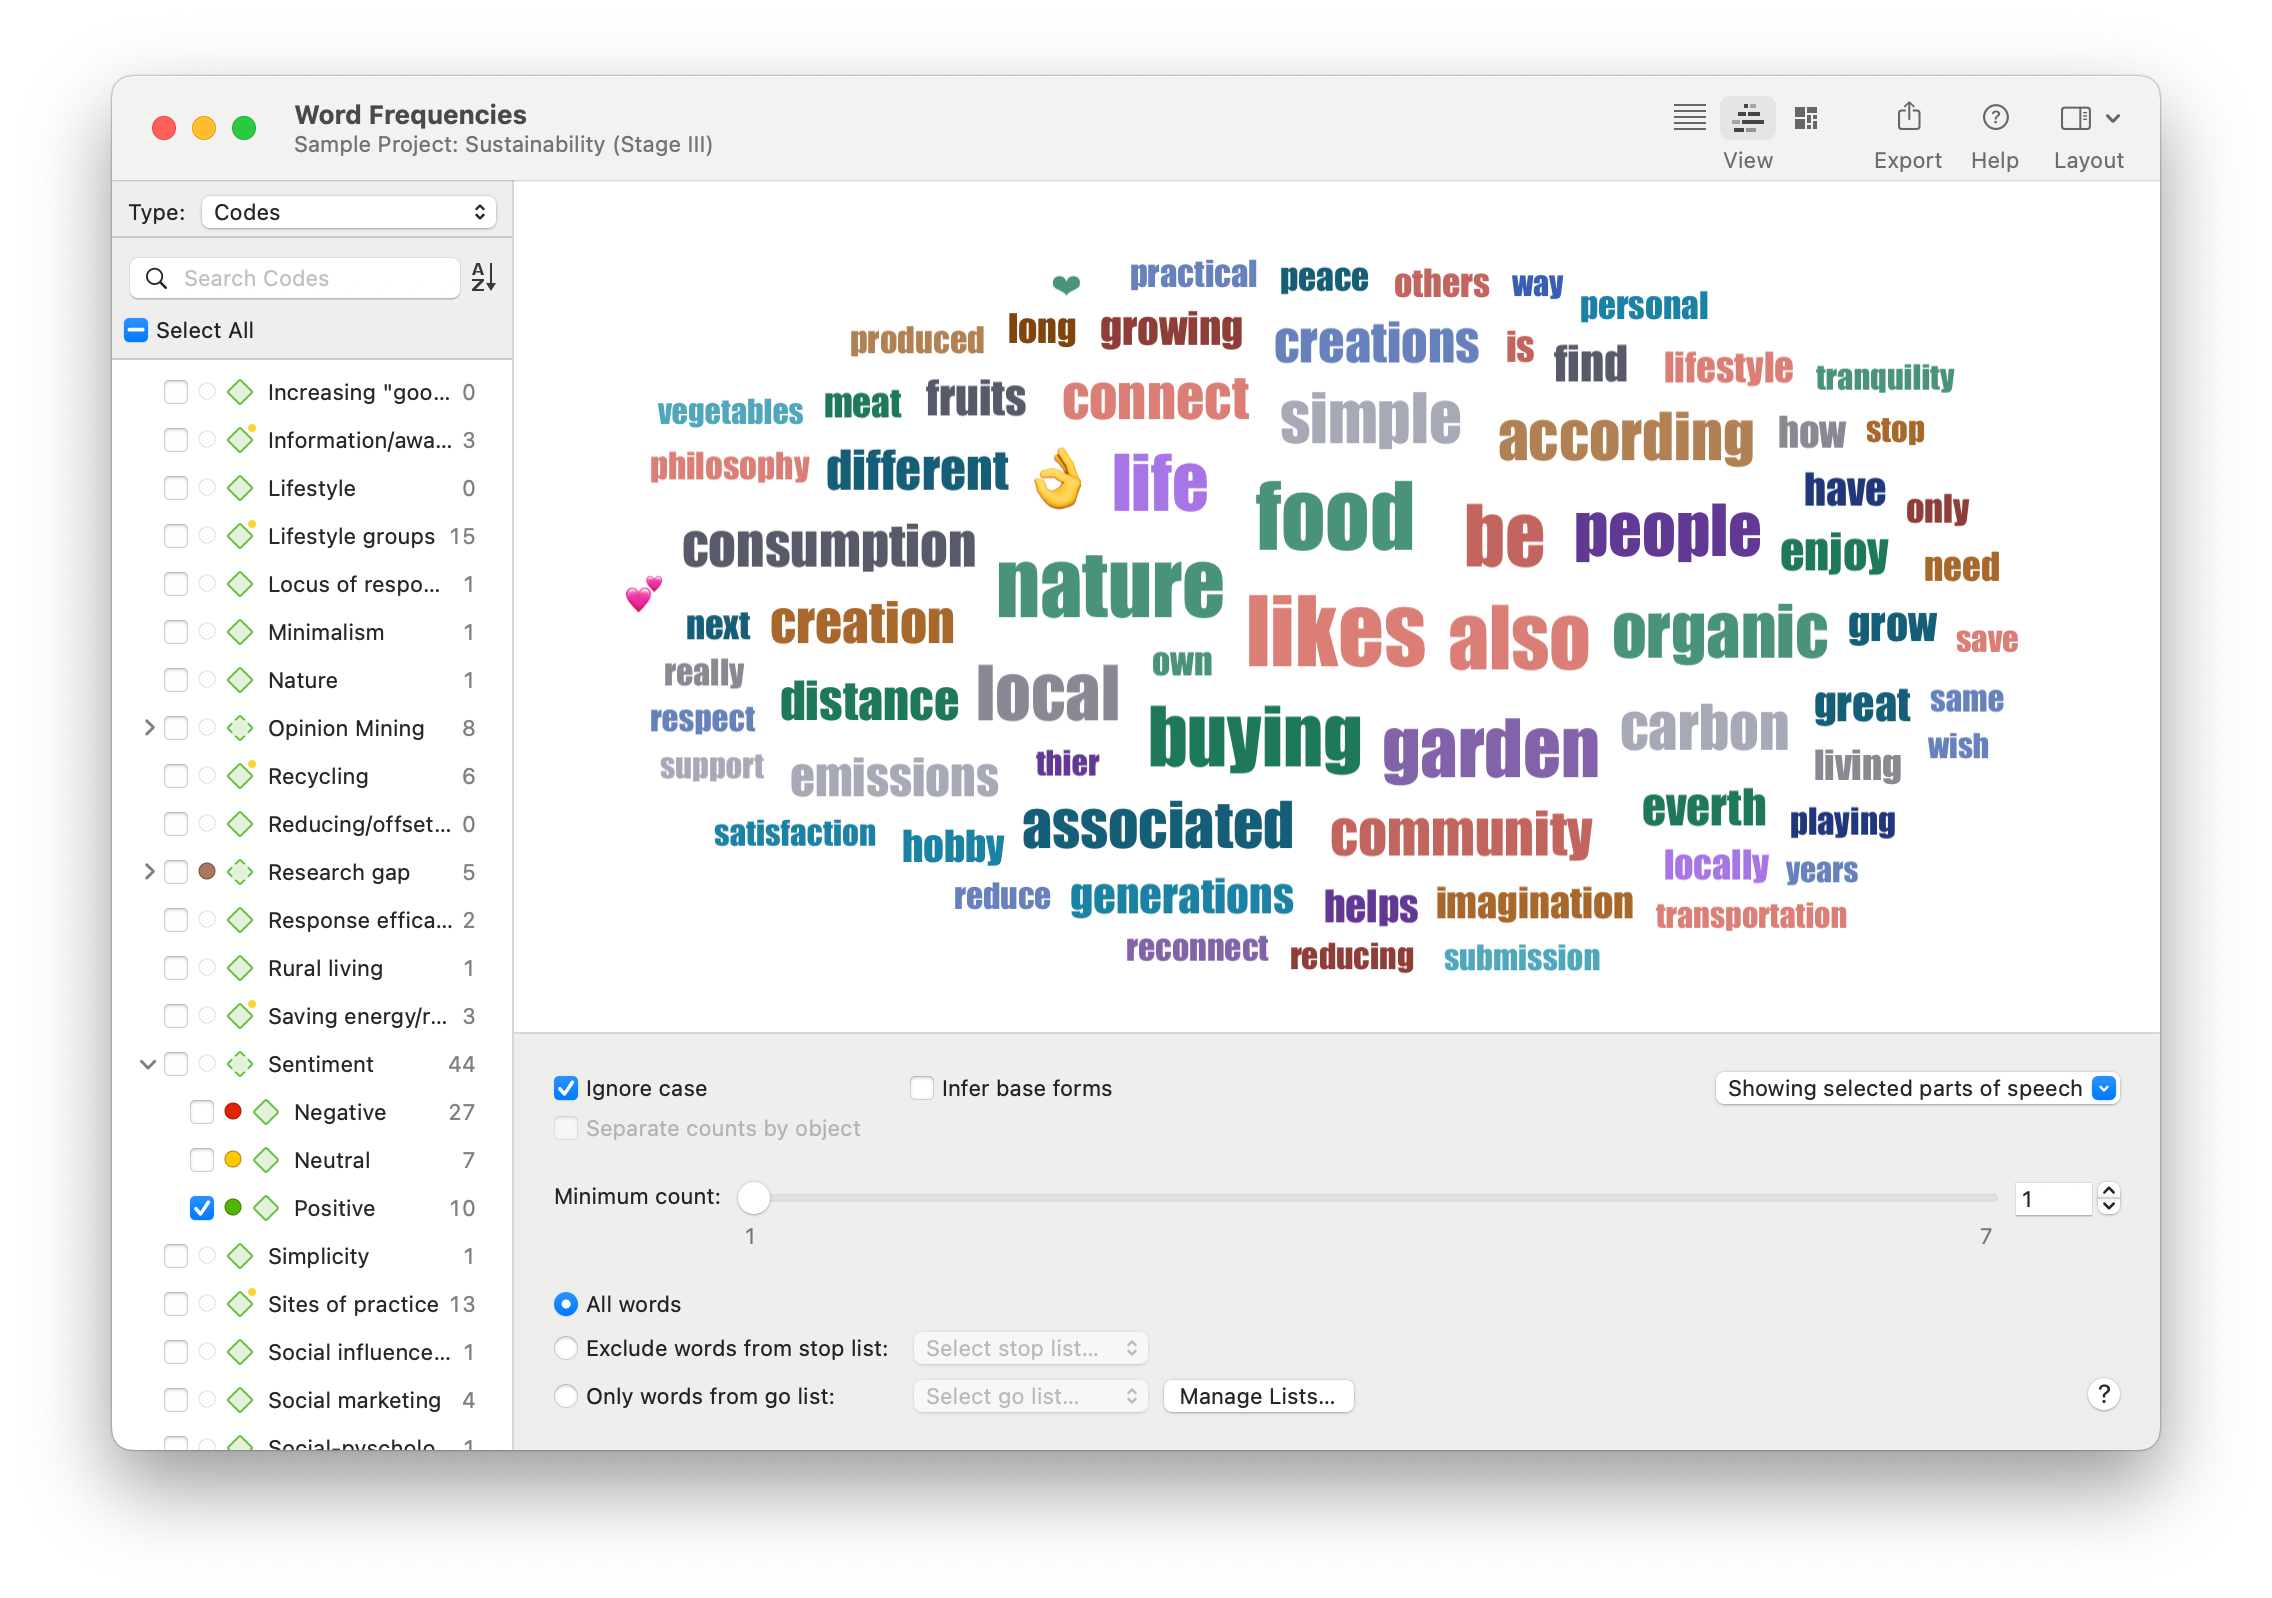
Word Frequencies
A word cloud can be a powerful text analytics tool to understand the nature of human language as it pertains to a particular context. Researchers can perform text mining on their unstructured text data to get a sense of what is being discussed. The Word Frequencies tool can also parse out specific parts of speech, facilitating more granular text extraction.
Sentiment Analysis
The Sentiment Analysis tool employs natural language processing (NLP) and machine learning to analyze text based on sentiment and facilitate natural language understanding. This is important for tasks such as, for example, analyzing customer reviews and assessing customer satisfaction, because you can quickly categorize large numbers of customer data records by their positive or negative sentiment.
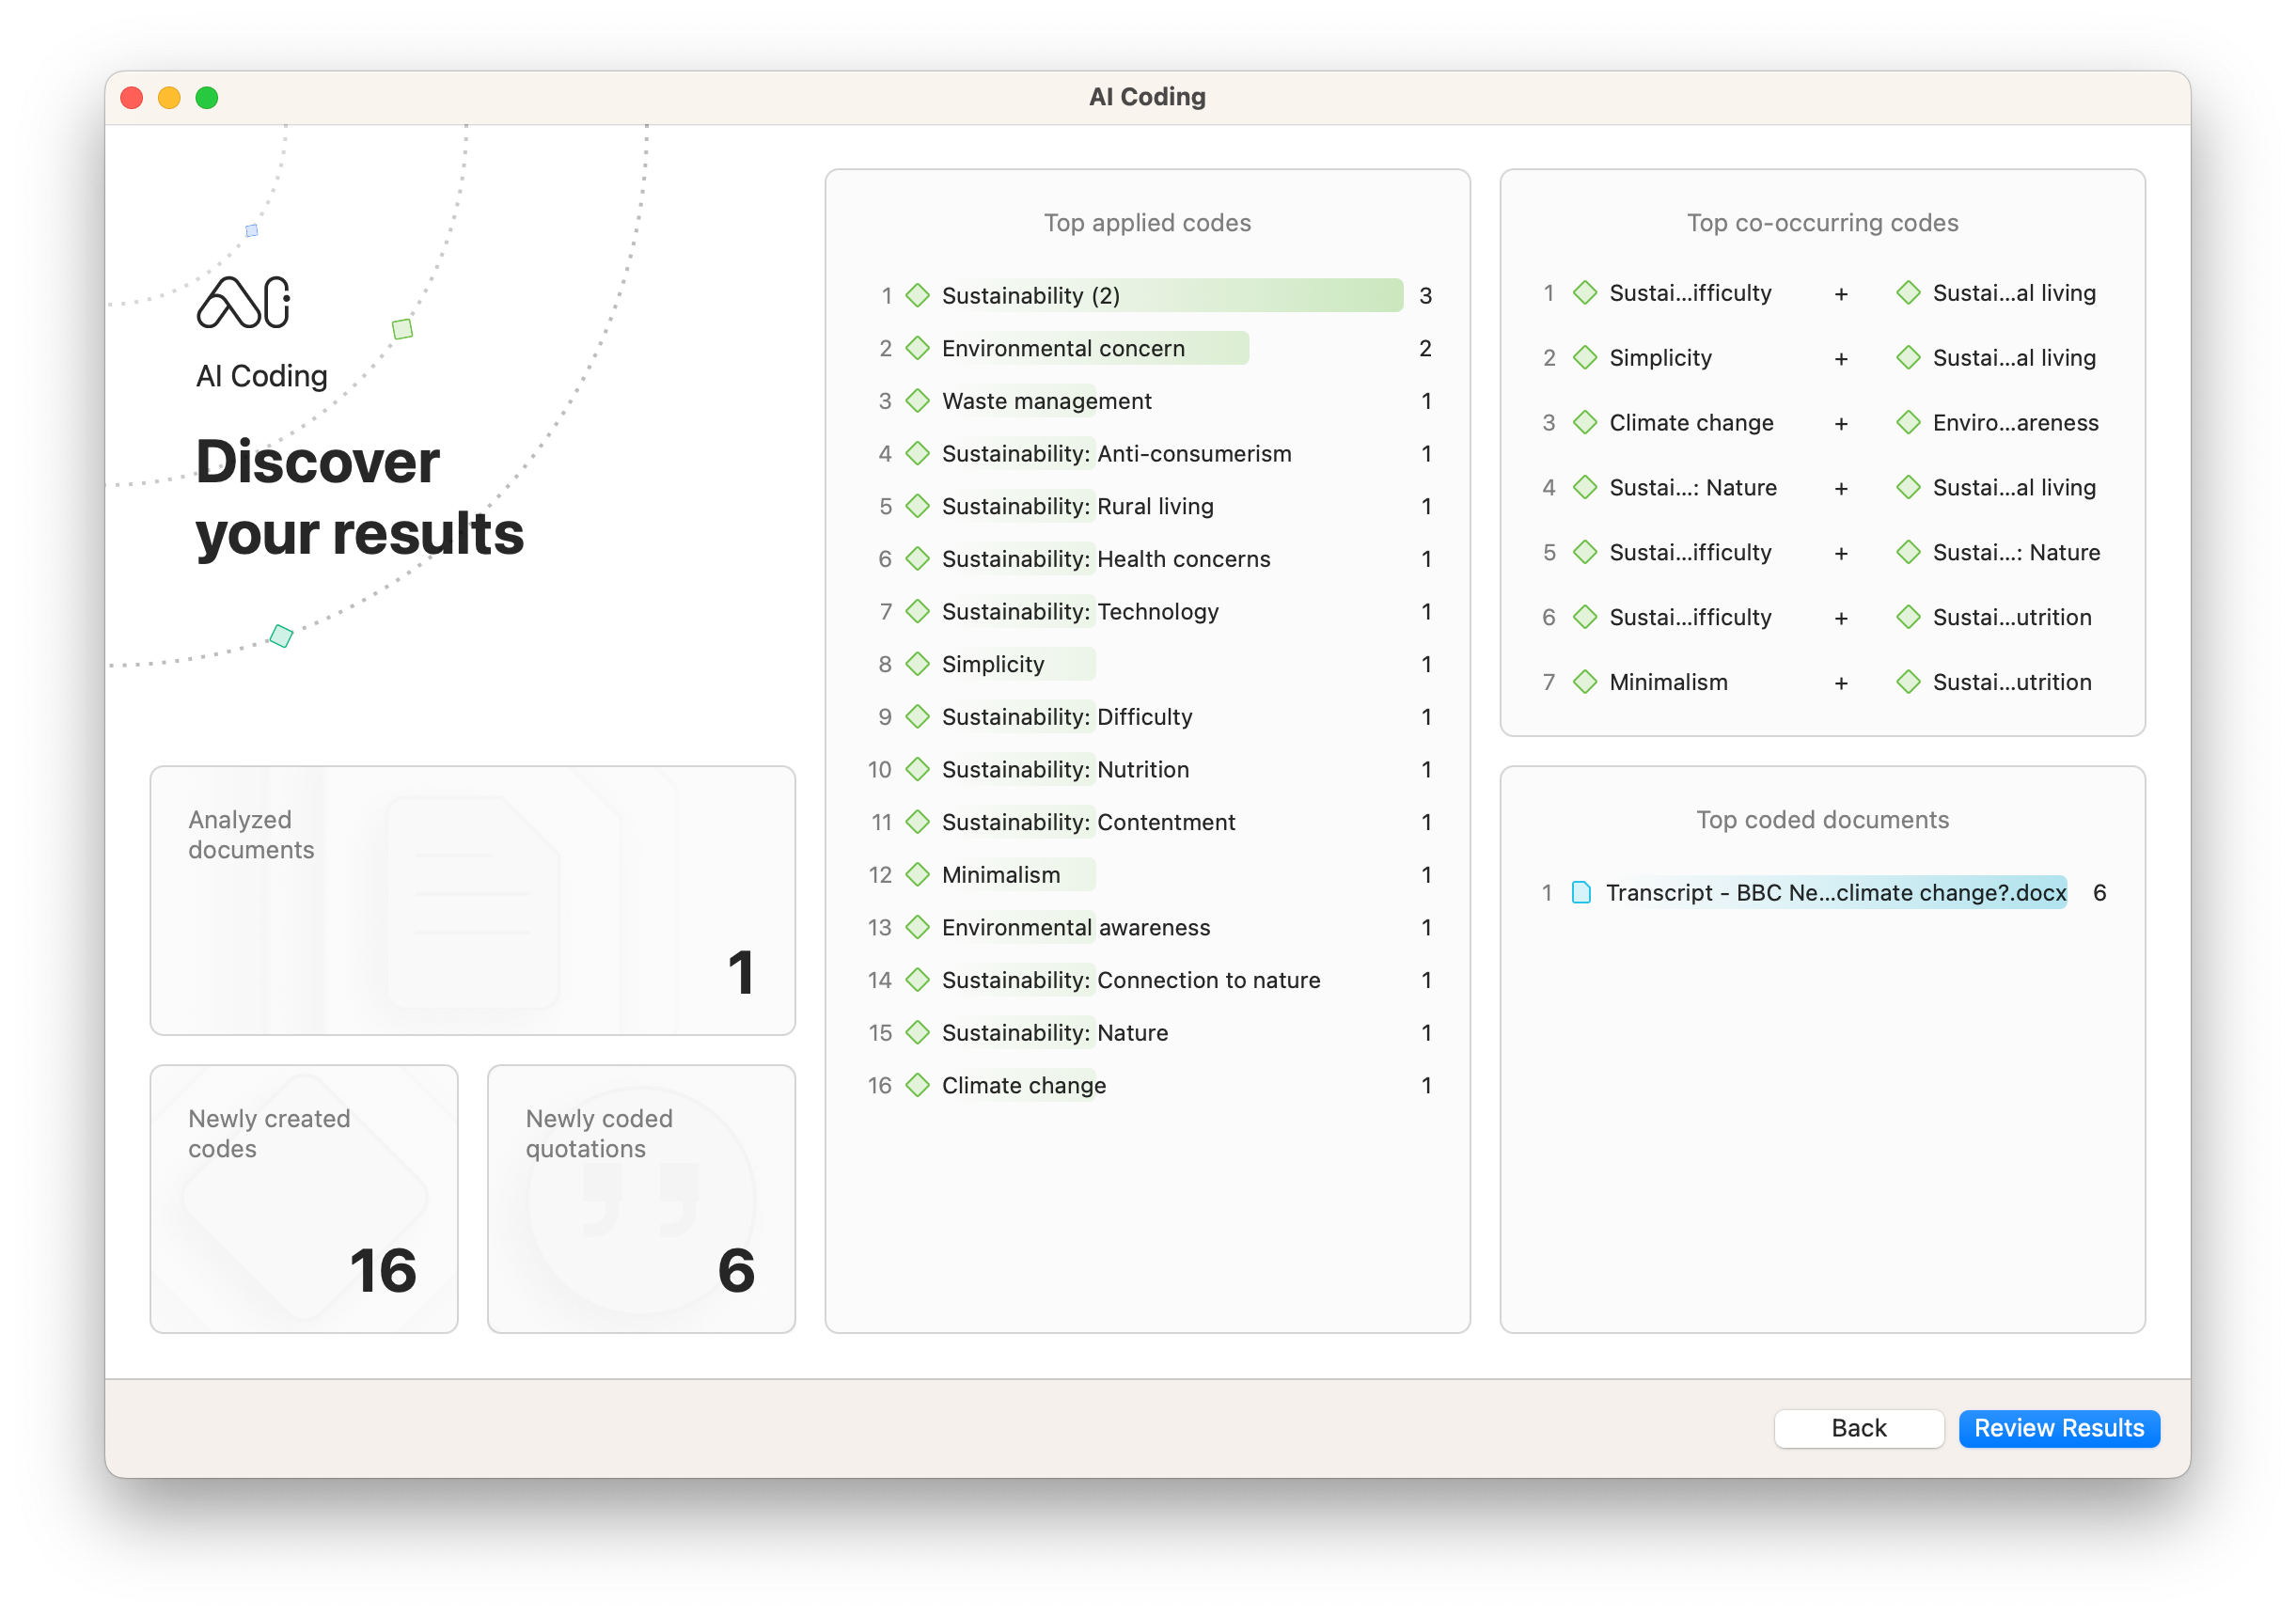
AI Coding relies on massive amounts of training data to interpret text and automatically code large amounts of qualitative data. Rather than read each and every document line by line, you can turn to AI Coding to process your data and devote time to the more essential tasks of analysis such as critical reflection and interpretation.
These text analytics tools can be a powerful complement to research. When you're conducting document analysis to understand the meaning of text, AI Coding can help with providing a code structure or organization of data that helps to identify deeper insights.
AI Summaries
Dealing with large numbers of discrete documents can be a daunting task if done manually, especially if each document in your data set is lengthy and complicated. Simplifying the meaning of documents down to their essential insights can help researchers identify patterns in the data.
AI Summaries fills this role by using natural language processing algorithms to simplify data to its salient points. Text generated by AI Summaries are stored in memos attached to documents to illustrate pathways to coding and analysis or to highlight how the data conveys meaning.
Take advantage of ATLAS.ti's analysis tools with a free trial
Let our powerful data analysis interface make the most out of your data. Download a free trial today.

No products in the cart.
The Basics of Document Analysis

Document analysis is the process of reviewing or evaluating documents both printed and electronic in a methodical manner. The document analysis method, like many other qualitative research methods, involves examining and interpreting data to uncover meaning, gain understanding, and come to a conclusion.

What is Meant by Document Analysis?
Document analysis pertains to the process of interpreting documents for an assessment topic by the researcher as a means of giving voice and meaning. In Document Analysis as a Qualitative Research Method by Glenn A. Bowen , document analysis is described as, “... a systematic procedure for reviewing or evaluating documents—both printed and electronic (computer-based and Internet-transmitted) material. Like other analytical methods in qualitative research, document analysis requires that data be examined and interpreted in order to elicit meaning, gain understanding, and develop empirical knowledge.”
During the analysis of documents, the content is categorized into distinct themes, similar to the way transcripts from interviews or focus groups are analyzed. The documents may also be graded or scored using a rubric.
Document analysis is a social research method of great value, and it plays a crucial role in most triangulation methods, combining various methods to study a particular phenomenon.
>> View Webinar: How-To’s for Data Analysis
Documents fall into three main categories:
- Personal Documents: A personal account of an individual's beliefs, actions, and experiences. The following are examples: e-mails, calendars, scrapbooks, Facebook posts, incident reports, blogs, duty logs, newspapers, and reflections or journals.
- Public Records: Records of an organization's activities that are maintained continuously over time. These include mission statements, student transcripts, annual reports, student handbooks, policy manuals, syllabus, and strategic plans.
- Physical Evidence: Artifacts or items found within a study setting, also referred to as artifacts. Among these are posters, flyers, agendas, training materials, and handbooks.

The qualitative researcher generally makes use of two or more resources, each using a different data source and methodology, to achieve convergence and corroboration. An important purpose of triangulating evidence is to establish credibility through a convergence of evidence. Corroboration of findings across data sets reduces the possibility of bias, by examining data gathered in different ways.
It is important to note that document analysis differs from content analysis as content analysis refers to more than documents. As part of their definition for content analysis, Columbia Mailman School of Public Health states that, “Sources of data could be from interviews, open-ended questions, field research notes, conversations, or literally any occurrence of communicative language (such as books, essays, discussions, newspaper headlines, speeches, media, historical documents).
How Do You Do Document Analysis?
In order for a researcher to obtain reliable results from document analysis, a detailed planning process must be undertaken. The following is an outline of an eight-step planning process that should be employed in all textual analysis including document analysis techniques.
- Identify the texts you want to analyze such as samples, population, participants, and respondents.
- You should consider how texts will be accessed, paying attention to any cultural or linguistic barriers.
- Acknowledge and resolve biases.
- Acquire appropriate research skills.
- Strategize for ensuring credibility.
- Identify the data that is being sought.
- Take into account ethical issues.
- Keep a backup plan handy.

Researchers can use a wide variety of texts as part of their research, but the most common source is likely to be written material. Researchers often ask how many documents they should collect. There is an opinion that a wide selection of documents is preferable, but the issue should probably revolve more around the quality of the document than its quantity.
Why is Document Analysis Useful?
Different types of documents serve different purposes. They provide background information, indicate potential interview questions, serve as a mechanism for monitoring progress and tracking changes within a project, and allow for verification of any claims or progress made.
You can triangulate your claims about the phenomenon being studied using document analysis by using multiple sources and other research gathering methods.
Below are the advantages and disadvantages of document analysis
- Document analysis may assist researchers in determining what questions to ask your interviewees, as well as provide insight into what to watch out for during your participant observation.
- It is particularly useful to researchers who wish to focus on specific case studies
- It is inexpensive and quick in cases where data is easily obtainable.
- Documents provide specific and reliable data, unaffected by researchers' presence unlike with other research methods like participant observation.
Disadvantages
- It is likely that the documents researchers obtain are not complete or written objectively, requiring researchers to adopt a critical approach and not assume their contents are reliable or unbiased.
- There may be a risk of information overload due to the number of documents involved. Researchers often have difficulties determining what parts of each document are relevant to the topic being studied.
- It may be necessary to anonymize documents and compare them with other documents.
How NVivo Can Help with Document Analysis
Analyzing copious amounts of data and information can be a daunting and time-consuming prospect. Luckily, qualitative data analysis tools like NVivo can help!
NVivo’s AI-powered autocoding text analysis tool can help you efficiently analyze data and perform thematic analysis . By automatically detecting, grouping, and tagging noun phrases, you can quickly identify key themes throughout your documents – aiding in your evaluation.
Additionally, once you start coding part of your data, NVivo’s smart coding can take care of the rest for you by using machine learning to match your coding style. After your initial coding, you can run queries and create visualizations to expand on initial findings and gain deeper insights.
These features allow you to conduct data analysis on large amounts of documents – improving the efficiency of this qualitative research method. Learn more about these features in the webinar, NVivo 14: Thematic Analysis Using NVivo.
>> Watch Webinar NVivo 14: Thematic Analysis Using NVivo
Learn More About Document Analysis
Watch Twenty-Five Qualitative Researchers Share How-To's for Data Analysis

Recent Articles
- Ask Dr Cath
- How to work in public health
- Tips for getting public health jobs
- How to become a Public Health Consultant
- Being a Consultant in Public Health
- Securing the consultant interview
- Public Health Registrars
- Public Health Estate Agent
- FPH Diplomate Exam
- FPH Membership Exam
- GP Trainees
- Public Health
- Child Public Health
- Health Protection
- Health Promotion
- Medical Sociology
- Population Health
- Social Medicine
- Instaskills
- Caldicott Guardian
- Commissioning Public Health Services
- Effective Manager
- Effective Leader
- Implementing Best Practice
- Infographics
- Outbreak management
- Press Releases
- Time Management
- Strategic Planning and Management
- Understanding Statistics
- More Statistical Understanding
- Action Research
- Case Control
- Delphi Methods
- Descriptive Studies
Document Analysis
- Economic Appraisal
- Focus Groups
- Health Acorn
- Health Equity Audit
- Health Impact Assessment
- Health Needs Asessment
- Health Status Assessment
- Intervention Studies
- Observational Studies
- Official statistics
- Quality of Life
- Respondent Driven Sampling
- Social Marketing Research
- Systematic Reviews
- Secondary Statisitical Analysis
- In Dr Cath's Shoes
What is document analysis?
Document or Documentary analysis is a social research method and is an important research tool in its own right and is an invaluable part of most schemes of triangulation. It refers to the various procedures involved in analyzing and interpreting data generated from the examination of documents and records relevant to a particular study. In other words, documentary work involves reading lots of written material (it helps to scan the documents onto a computer and use a qualitative analysis package). A document is something that we can read and which relates to some aspect of the social world. Official documents are intended to be read as objective statements of fact but they are themselves socially produced.
How does document analysis work in public health?
Use of documentary analysis has become quite popular within public health research, especially if you are trying to evaluate the impact of an initiative, for example a committee led venture to increase immunisation uptake in an area or a board led approach to reduce sexual ill-health or increase physical activity during a major event like the Olympics or Rugby World Cup. In this situation, you could take a 'qualitative' approach, utilising what is known as a 'realist viewpoint'. This involves establishing ‘a priori’ set of criteria to investigate whilst enabling the analysis to be guided by the data that emerges from familiarisation with the borough plans’ material. Data would be extracted relating to pre-agreed named terms covering the scope and scale of action plans, perhaps evidence of governance arrangements and minutes of the groups used to deliver the plans. To quantify the process, number and frequency of meetings and email exchanges may be included. This approach may then be supported with follow up interviews or surveys of the parties involved in delivering the plans.
Sources of Documents:
- Public records
- Private papers
- Visual documents
- Minutes of meetings (plus emails etc which indicate the frequency of those meetings - that can help to quantify the process - and governance arrangements)
- Strategies, policies, action plans by public bodies or organisations
The term 'biography' has two meanings in social research. Firstly, it is a particular style of interviewing, where the informant is encouraged to describe how his or her life (or some aspect of it) has changed and developed over time. In doing so, they reflect his/her own conception of self, identity and personal history. Secondly, 'biography' refers to a work that draws on whatever materials are available to an author to represent an account of a person's life and achievements. Narrative analysis is used to elicit results. This is a form of analysis used for chronologically told stories. It focuses on how elements are sequenced, why some elements are evaluated differently from others and how the past shapes perceptions of the present and how the present shapes perceptions of the past and of course, how both shape perceptions of the future. It is especially used in feminist research.
Types of Analysis
Quantitative:, content analysis, qualitative:.
- Discourse analysis
- Interpretative analysis
- Conversation analysis
Grounded Theory
Content analysis is like a social survey but uses a sample of images rather than people. It is a technique for gathering and analyzing content of text. Generally speaking, it consists of the following steps:
- Choose a question which can be measured with variables.
- Devise your unit of analysis (amount of text that's assigned a code - e.g. each daily newspaper could be a unit) and design your code book.
- Make a sampling frame, choosing the cases to analyse that are representative and unbiased. To get a sampling frame, search for relevant cases in contemporary or historical archives. The sample has to be representative, yet small enough for analyzing in depth. You define your population (which can be words, paragraphs, sentences or all articles in a certain period of time) and sampling element. Very often you are counting words - e.g. how many times does the word 'hooligan' appear in articles sensationalizing the reporting of disturbances at football matches?
- Code all the cases and analyze the resulting data.
- Produce semi-quantitative results using cross-tabulations, charts or graphs and where there are few cases, use tables.
- Report in a standard 'scientific' format.
This coding is sometimes known as 'manifest coding' and measures 4 characteristics:
- Frequency - e.g. how many times is the subject, phrase or word mentioned?
- Direction - i.e. the direction of messages in the content along some continuum - e.g. positive, negative.
- Intensity - i.e. strength or poser of a message in a direction.
- Space - i.e. size of space on a newspaper page, time on television, placement in social media
Content analysis is formal and systematic. It lends structure to your research. Variables are categorised in a precise manner so you can count them and intercoder reliability is commonly reported with the results of content analysis studies. However, content analysis ignores context and multiple meanings.
Semiotics is a science that studies the life of signs in society. It is the opposite to the postivist method of content analysis. It is used a lot in media analysis.
In semiotics, the analyst seeks to connect the signifier (an expression which can be words, a picture or sound) with what is signified (another word, description or image). The use of language is noted as it is considered to be a description of actions. As part of language, certain signs match up with certain meanings. Semiotics seeks to understand the underlining messages in visual texts. It is related to discourse analysis and forms the basis for interpretive analysis.
Discourse Analysis
This is concerned with the production of meaning through talk and texts. Language is viewed as the topic of the research and how people use language to construct their accounts of the social world is important.
Intrepretative Analysis
This aims to capture hidden meaning and ambiguity. It looks how messages are encoded, latent or hidden. You are also acutely aware of who the audience is.
Conversation Analysis
This is concerned with the underlying structures of talk in interaction and with the achievement of interaction.
This is inductive, interpretative and can be social constructionalist. Central focus is on inductively generating novel theoretical ideas or hypotheses from the data. These new theories arise out of the data and are supported by the data. So they are said to be grounded.
Evaluation and Interpretation
Authenticity
Is it genuine, complete, reliable and of unquestioned authorship?
Credibility
Is the document free from error or distortion?
Representativeness
Can the documents available be said to constitute a representative sample of the documents that originally existed?
What is the surface meaning? Is there a deeper/semiotic meaning?
Further reading
Robson, C. Real World Research. 3rd edition. Chichester,Wiley:2011.
Richie, J, Lewis J, (eds). Qualitative Research Practice, London: 2003.
Berger A. Media Analysis Techniques. The Sage Commtext Series, Newbury Park: 1991.
Bryman A. Social Research Methods. Oxford University Press:2001. See chapters 17-19.
Gribbs G. Qualitative Data Analysis: Explorations with Nvivo. Open University Press:2002.
Leedy, P. Practical Research: Planning and Design. 6th Edition. Merril, New Jersey, 1997.
Seale, C. Researching Society and Culture. Sage:2001. See chapters 18 - 21.
Wimmer, R.D. & Dominick, J. R. Mass Media Research: An Introduction. Belmont:1983.
And an example of where I've used it:
Heffernan C. 2001. "The Irish media and the lack of public debate on new reproductive technologies (NRTs) in Ireland", Health, 5 (3):355-371. http://hea.sagepub.com/cgi/content/abstract/5/3/355
Quantitative Data Analysis 101
The lingo, methods and techniques, explained simply.
By: Derek Jansen (MBA) and Kerryn Warren (PhD) | December 2020
Quantitative data analysis is one of those things that often strikes fear in students. It’s totally understandable – quantitative analysis is a complex topic, full of daunting lingo , like medians, modes, correlation and regression. Suddenly we’re all wishing we’d paid a little more attention in math class…
The good news is that while quantitative data analysis is a mammoth topic, gaining a working understanding of the basics isn’t that hard , even for those of us who avoid numbers and math . In this post, we’ll break quantitative analysis down into simple , bite-sized chunks so you can approach your research with confidence.

Overview: Quantitative Data Analysis 101
- What (exactly) is quantitative data analysis?
- When to use quantitative analysis
- How quantitative analysis works
The two “branches” of quantitative analysis
- Descriptive statistics 101
- Inferential statistics 101
- How to choose the right quantitative methods
- Recap & summary
What is quantitative data analysis?
Despite being a mouthful, quantitative data analysis simply means analysing data that is numbers-based – or data that can be easily “converted” into numbers without losing any meaning.
For example, category-based variables like gender, ethnicity, or native language could all be “converted” into numbers without losing meaning – for example, English could equal 1, French 2, etc.
This contrasts against qualitative data analysis, where the focus is on words, phrases and expressions that can’t be reduced to numbers. If you’re interested in learning about qualitative analysis, check out our post and video here .
What is quantitative analysis used for?
Quantitative analysis is generally used for three purposes.
- Firstly, it’s used to measure differences between groups . For example, the popularity of different clothing colours or brands.
- Secondly, it’s used to assess relationships between variables . For example, the relationship between weather temperature and voter turnout.
- And third, it’s used to test hypotheses in a scientifically rigorous way. For example, a hypothesis about the impact of a certain vaccine.
Again, this contrasts with qualitative analysis , which can be used to analyse people’s perceptions and feelings about an event or situation. In other words, things that can’t be reduced to numbers.
How does quantitative analysis work?
Well, since quantitative data analysis is all about analysing numbers , it’s no surprise that it involves statistics . Statistical analysis methods form the engine that powers quantitative analysis, and these methods can vary from pretty basic calculations (for example, averages and medians) to more sophisticated analyses (for example, correlations and regressions).
Sounds like gibberish? Don’t worry. We’ll explain all of that in this post. Importantly, you don’t need to be a statistician or math wiz to pull off a good quantitative analysis. We’ll break down all the technical mumbo jumbo in this post.
Need a helping hand?
As I mentioned, quantitative analysis is powered by statistical analysis methods . There are two main “branches” of statistical methods that are used – descriptive statistics and inferential statistics . In your research, you might only use descriptive statistics, or you might use a mix of both , depending on what you’re trying to figure out. In other words, depending on your research questions, aims and objectives . I’ll explain how to choose your methods later.
So, what are descriptive and inferential statistics?
Well, before I can explain that, we need to take a quick detour to explain some lingo. To understand the difference between these two branches of statistics, you need to understand two important words. These words are population and sample .
First up, population . In statistics, the population is the entire group of people (or animals or organisations or whatever) that you’re interested in researching. For example, if you were interested in researching Tesla owners in the US, then the population would be all Tesla owners in the US.
However, it’s extremely unlikely that you’re going to be able to interview or survey every single Tesla owner in the US. Realistically, you’ll likely only get access to a few hundred, or maybe a few thousand owners using an online survey. This smaller group of accessible people whose data you actually collect is called your sample .
So, to recap – the population is the entire group of people you’re interested in, and the sample is the subset of the population that you can actually get access to. In other words, the population is the full chocolate cake , whereas the sample is a slice of that cake.
So, why is this sample-population thing important?
Well, descriptive statistics focus on describing the sample , while inferential statistics aim to make predictions about the population, based on the findings within the sample. In other words, we use one group of statistical methods – descriptive statistics – to investigate the slice of cake, and another group of methods – inferential statistics – to draw conclusions about the entire cake. There I go with the cake analogy again…
With that out the way, let’s take a closer look at each of these branches in more detail.

Branch 1: Descriptive Statistics
Descriptive statistics serve a simple but critically important role in your research – to describe your data set – hence the name. In other words, they help you understand the details of your sample . Unlike inferential statistics (which we’ll get to soon), descriptive statistics don’t aim to make inferences or predictions about the entire population – they’re purely interested in the details of your specific sample .
When you’re writing up your analysis, descriptive statistics are the first set of stats you’ll cover, before moving on to inferential statistics. But, that said, depending on your research objectives and research questions , they may be the only type of statistics you use. We’ll explore that a little later.
So, what kind of statistics are usually covered in this section?
Some common statistical tests used in this branch include the following:
- Mean – this is simply the mathematical average of a range of numbers.
- Median – this is the midpoint in a range of numbers when the numbers are arranged in numerical order. If the data set makes up an odd number, then the median is the number right in the middle of the set. If the data set makes up an even number, then the median is the midpoint between the two middle numbers.
- Mode – this is simply the most commonly occurring number in the data set.
- In cases where most of the numbers are quite close to the average, the standard deviation will be relatively low.
- Conversely, in cases where the numbers are scattered all over the place, the standard deviation will be relatively high.
- Skewness . As the name suggests, skewness indicates how symmetrical a range of numbers is. In other words, do they tend to cluster into a smooth bell curve shape in the middle of the graph, or do they skew to the left or right?
Feeling a bit confused? Let’s look at a practical example using a small data set.

On the left-hand side is the data set. This details the bodyweight of a sample of 10 people. On the right-hand side, we have the descriptive statistics. Let’s take a look at each of them.
First, we can see that the mean weight is 72.4 kilograms. In other words, the average weight across the sample is 72.4 kilograms. Straightforward.
Next, we can see that the median is very similar to the mean (the average). This suggests that this data set has a reasonably symmetrical distribution (in other words, a relatively smooth, centred distribution of weights, clustered towards the centre).
In terms of the mode , there is no mode in this data set. This is because each number is present only once and so there cannot be a “most common number”. If there were two people who were both 65 kilograms, for example, then the mode would be 65.
Next up is the standard deviation . 10.6 indicates that there’s quite a wide spread of numbers. We can see this quite easily by looking at the numbers themselves, which range from 55 to 90, which is quite a stretch from the mean of 72.4.
And lastly, the skewness of -0.2 tells us that the data is very slightly negatively skewed. This makes sense since the mean and the median are slightly different.
As you can see, these descriptive statistics give us some useful insight into the data set. Of course, this is a very small data set (only 10 records), so we can’t read into these statistics too much. Also, keep in mind that this is not a list of all possible descriptive statistics – just the most common ones.
But why do all of these numbers matter?
While these descriptive statistics are all fairly basic, they’re important for a few reasons:
- Firstly, they help you get both a macro and micro-level view of your data. In other words, they help you understand both the big picture and the finer details.
- Secondly, they help you spot potential errors in the data – for example, if an average is way higher than you’d expect, or responses to a question are highly varied, this can act as a warning sign that you need to double-check the data.
- And lastly, these descriptive statistics help inform which inferential statistical techniques you can use, as those techniques depend on the skewness (in other words, the symmetry and normality) of the data.
Simply put, descriptive statistics are really important , even though the statistical techniques used are fairly basic. All too often at Grad Coach, we see students skimming over the descriptives in their eagerness to get to the more exciting inferential methods, and then landing up with some very flawed results.
Don’t be a sucker – give your descriptive statistics the love and attention they deserve!

Branch 2: Inferential Statistics
As I mentioned, while descriptive statistics are all about the details of your specific data set – your sample – inferential statistics aim to make inferences about the population . In other words, you’ll use inferential statistics to make predictions about what you’d expect to find in the full population.
What kind of predictions, you ask? Well, there are two common types of predictions that researchers try to make using inferential stats:
- Firstly, predictions about differences between groups – for example, height differences between children grouped by their favourite meal or gender.
- And secondly, relationships between variables – for example, the relationship between body weight and the number of hours a week a person does yoga.
In other words, inferential statistics (when done correctly), allow you to connect the dots and make predictions about what you expect to see in the real world population, based on what you observe in your sample data. For this reason, inferential statistics are used for hypothesis testing – in other words, to test hypotheses that predict changes or differences.

Of course, when you’re working with inferential statistics, the composition of your sample is really important. In other words, if your sample doesn’t accurately represent the population you’re researching, then your findings won’t necessarily be very useful.
For example, if your population of interest is a mix of 50% male and 50% female , but your sample is 80% male , you can’t make inferences about the population based on your sample, since it’s not representative. This area of statistics is called sampling, but we won’t go down that rabbit hole here (it’s a deep one!) – we’ll save that for another post .
What statistics are usually used in this branch?
There are many, many different statistical analysis methods within the inferential branch and it’d be impossible for us to discuss them all here. So we’ll just take a look at some of the most common inferential statistical methods so that you have a solid starting point.
First up are T-Tests . T-tests compare the means (the averages) of two groups of data to assess whether they’re statistically significantly different. In other words, do they have significantly different means, standard deviations and skewness.
This type of testing is very useful for understanding just how similar or different two groups of data are. For example, you might want to compare the mean blood pressure between two groups of people – one that has taken a new medication and one that hasn’t – to assess whether they are significantly different.
Kicking things up a level, we have ANOVA, which stands for “analysis of variance”. This test is similar to a T-test in that it compares the means of various groups, but ANOVA allows you to analyse multiple groups , not just two groups So it’s basically a t-test on steroids…
Next, we have correlation analysis . This type of analysis assesses the relationship between two variables. In other words, if one variable increases, does the other variable also increase, decrease or stay the same. For example, if the average temperature goes up, do average ice creams sales increase too? We’d expect some sort of relationship between these two variables intuitively , but correlation analysis allows us to measure that relationship scientifically .
Lastly, we have regression analysis – this is quite similar to correlation in that it assesses the relationship between variables, but it goes a step further to understand cause and effect between variables, not just whether they move together. In other words, does the one variable actually cause the other one to move, or do they just happen to move together naturally thanks to another force? Just because two variables correlate doesn’t necessarily mean that one causes the other.
Stats overload…
I hear you. To make this all a little more tangible, let’s take a look at an example of a correlation in action.
Here’s a scatter plot demonstrating the correlation (relationship) between weight and height. Intuitively, we’d expect there to be some relationship between these two variables, which is what we see in this scatter plot. In other words, the results tend to cluster together in a diagonal line from bottom left to top right.

As I mentioned, these are are just a handful of inferential techniques – there are many, many more. Importantly, each statistical method has its own assumptions and limitations.
For example, some methods only work with normally distributed (parametric) data, while other methods are designed specifically for non-parametric data. And that’s exactly why descriptive statistics are so important – they’re the first step to knowing which inferential techniques you can and can’t use.

How to choose the right analysis method
To choose the right statistical methods, you need to think about two important factors :
- The type of quantitative data you have (specifically, level of measurement and the shape of the data). And,
- Your research questions and hypotheses
Let’s take a closer look at each of these.
Factor 1 – Data type
The first thing you need to consider is the type of data you’ve collected (or the type of data you will collect). By data types, I’m referring to the four levels of measurement – namely, nominal, ordinal, interval and ratio. If you’re not familiar with this lingo, check out the video below.
Why does this matter?
Well, because different statistical methods and techniques require different types of data. This is one of the “assumptions” I mentioned earlier – every method has its assumptions regarding the type of data.
For example, some techniques work with categorical data (for example, yes/no type questions, or gender or ethnicity), while others work with continuous numerical data (for example, age, weight or income) – and, of course, some work with multiple data types.
If you try to use a statistical method that doesn’t support the data type you have, your results will be largely meaningless . So, make sure that you have a clear understanding of what types of data you’ve collected (or will collect). Once you have this, you can then check which statistical methods would support your data types here .
If you haven’t collected your data yet, you can work in reverse and look at which statistical method would give you the most useful insights, and then design your data collection strategy to collect the correct data types.
Another important factor to consider is the shape of your data . Specifically, does it have a normal distribution (in other words, is it a bell-shaped curve, centred in the middle) or is it very skewed to the left or the right? Again, different statistical techniques work for different shapes of data – some are designed for symmetrical data while others are designed for skewed data.
This is another reminder of why descriptive statistics are so important – they tell you all about the shape of your data.
Factor 2: Your research questions
The next thing you need to consider is your specific research questions, as well as your hypotheses (if you have some). The nature of your research questions and research hypotheses will heavily influence which statistical methods and techniques you should use.
If you’re just interested in understanding the attributes of your sample (as opposed to the entire population), then descriptive statistics are probably all you need. For example, if you just want to assess the means (averages) and medians (centre points) of variables in a group of people.
On the other hand, if you aim to understand differences between groups or relationships between variables and to infer or predict outcomes in the population, then you’ll likely need both descriptive statistics and inferential statistics.
So, it’s really important to get very clear about your research aims and research questions, as well your hypotheses – before you start looking at which statistical techniques to use.
Never shoehorn a specific statistical technique into your research just because you like it or have some experience with it. Your choice of methods must align with all the factors we’ve covered here.
Time to recap…
You’re still with me? That’s impressive. We’ve covered a lot of ground here, so let’s recap on the key points:
- Quantitative data analysis is all about analysing number-based data (which includes categorical and numerical data) using various statistical techniques.
- The two main branches of statistics are descriptive statistics and inferential statistics . Descriptives describe your sample, whereas inferentials make predictions about what you’ll find in the population.
- Common descriptive statistical methods include mean (average), median , standard deviation and skewness .
- Common inferential statistical methods include t-tests , ANOVA , correlation and regression analysis.
- To choose the right statistical methods and techniques, you need to consider the type of data you’re working with , as well as your research questions and hypotheses.

Psst... there’s more!
This post was based on one of our popular Research Bootcamps . If you're working on a research project, you'll definitely want to check this out ...
You Might Also Like:
")
74 Comments

Hi, I have read your article. Such a brilliant post you have created.

Thank you for the feedback. Good luck with your quantitative analysis.

Thank you so much.

Thank you so much. I learnt much well. I love your summaries of the concepts. I had love you to explain how to input data using SPSS

Amazing and simple way of breaking down quantitative methods.

This is beautiful….especially for non-statisticians. I have skimmed through but I wish to read again. and please include me in other articles of the same nature when you do post. I am interested. I am sure, I could easily learn from you and get off the fear that I have had in the past. Thank you sincerely.

Send me every new information you might have.

i need every new information

Thank you for the blog. It is quite informative. Dr Peter Nemaenzhe PhD

It is wonderful. l’ve understood some of the concepts in a more compréhensive manner

Your article is so good! However, I am still a bit lost. I am doing a secondary research on Gun control in the US and increase in crime rates and I am not sure which analysis method I should use?

Based on the given learning points, this is inferential analysis, thus, use ‘t-tests, ANOVA, correlation and regression analysis’

Well explained notes. Am an MPH student and currently working on my thesis proposal, this has really helped me understand some of the things I didn’t know.

I like your page..helpful

wonderful i got my concept crystal clear. thankyou!!

This is really helpful , thank you

Thank you so much this helped

Wonderfully explained

thank u so much, it was so informative

THANKYOU, this was very informative and very helpful

This is great GRADACOACH I am not a statistician but I require more of this in my thesis
Include me in your posts.

This is so great and fully useful. I would like to thank you again and again.

Glad to read this article. I’ve read lot of articles but this article is clear on all concepts. Thanks for sharing.

Thank you so much. This is a very good foundation and intro into quantitative data analysis. Appreciate!

You have a very impressive, simple but concise explanation of data analysis for Quantitative Research here. This is a God-send link for me to appreciate research more. Thank you so much!

Avery good presentation followed by the write up. yes you simplified statistics to make sense even to a layman like me. Thank so much keep it up. The presenter did ell too. i would like more of this for Qualitative and exhaust more of the test example like the Anova.

This is a very helpful article, couldn’t have been clearer. Thank you.

Awesome and phenomenal information.Well done

The video with the accompanying article is super helpful to demystify this topic. Very well done. Thank you so much.

thank you so much, your presentation helped me a lot

I don’t know how should I express that ur article is saviour for me 🥺😍

It is well defined information and thanks for sharing. It helps me a lot in understanding the statistical data.

I gain a lot and thanks for sharing brilliant ideas, so wish to be linked on your email update.

Very helpful and clear .Thank you Gradcoach.

Thank for sharing this article, well organized and information presented are very clear.

VERY INTERESTING AND SUPPORTIVE TO NEW RESEARCHERS LIKE ME. AT LEAST SOME BASICS ABOUT QUANTITATIVE.

An outstanding, well explained and helpful article. This will help me so much with my data analysis for my research project. Thank you!

wow this has just simplified everything i was scared of how i am gonna analyse my data but thanks to you i will be able to do so

simple and constant direction to research. thanks

This is helpful

Great writing!! Comprehensive and very helpful.

Do you provide any assistance for other steps of research methodology like making research problem testing hypothesis report and thesis writing?

Thank you so much for such useful article!

Amazing article. So nicely explained. Wow

Very insightfull. Thanks

I am doing a quality improvement project to determine if the implementation of a protocol will change prescribing habits. Would this be a t-test?

The is a very helpful blog, however, I’m still not sure how to analyze my data collected. I’m doing a research on “Free Education at the University of Guyana”

tnx. fruitful blog!

So I am writing exams and would like to know how do establish which method of data analysis to use from the below research questions: I am a bit lost as to how I determine the data analysis method from the research questions.
Do female employees report higher job satisfaction than male employees with similar job descriptions across the South African telecommunications sector? – I though that maybe Chi Square could be used here. – Is there a gender difference in talented employees’ actual turnover decisions across the South African telecommunications sector? T-tests or Correlation in this one. – Is there a gender difference in the cost of actual turnover decisions across the South African telecommunications sector? T-tests or Correlation in this one. – What practical recommendations can be made to the management of South African telecommunications companies on leveraging gender to mitigate employee turnover decisions?
Your assistance will be appreciated if I could get a response as early as possible tomorrow

This was quite helpful. Thank you so much.

wow I got a lot from this article, thank you very much, keep it up

Thanks for yhe guidance. Can you send me this guidance on my email? To enable offline reading?

Thank you very much, this service is very helpful.

Every novice researcher needs to read this article as it puts things so clear and easy to follow. Its been very helpful.

Wonderful!!!! you explained everything in a way that anyone can learn. Thank you!!

I really enjoyed reading though this. Very easy to follow. Thank you

Many thanks for your useful lecture, I would be really appreciated if you could possibly share with me the PPT of presentation related to Data type?

Thank you very much for sharing, I got much from this article

This is a very informative write-up. Kindly include me in your latest posts.

Very interesting mostly for social scientists

Thank you so much, very helpfull
You’re welcome 🙂

woow, its great, its very informative and well understood because of your way of writing like teaching in front of me in simple languages.

I have been struggling to understand a lot of these concepts. Thank you for the informative piece which is written with outstanding clarity.

very informative article. Easy to understand

Beautiful read, much needed.

Always greet intro and summary. I learn so much from GradCoach

Quite informative. Simple and clear summary.

I thoroughly enjoyed reading your informative and inspiring piece. Your profound insights into this topic truly provide a better understanding of its complexity. I agree with the points you raised, especially when you delved into the specifics of the article. In my opinion, that aspect is often overlooked and deserves further attention.

Absolutely!!! Thank you

Thank you very much for this post. It made me to understand how to do my data analysis.
Submit a Comment Cancel reply
Your email address will not be published. Required fields are marked *
Save my name, email, and website in this browser for the next time I comment.
- Print Friendly
- Search Menu
- Advance Articles
- Editor's Choice
- Supplements
- Open Access Articles
- Research Collections
- Review Collections
- Author Guidelines
- Submission Site
- Open Access Options
- Self-Archiving Policy
- About Health Policy and Planning
- About the London School of Hygiene and Tropical Medicine
- HPP at a glance
- Editorial Board
- Advertising and Corporate Services
- Journals Career Network
- Journals on Oxford Academic
- Books on Oxford Academic

Article Contents
Introduction, what is document analysis, the read approach, supplementary data, acknowledgements.
- < Previous
Document analysis in health policy research: the READ approach
- Article contents
- Figures & tables
Sarah L Dalglish, Hina Khalid, Shannon A McMahon, Document analysis in health policy research: the READ approach, Health Policy and Planning , Volume 35, Issue 10, December 2020, Pages 1424–1431, https://doi.org/10.1093/heapol/czaa064
- Permissions Icon Permissions
Document analysis is one of the most commonly used and powerful methods in health policy research. While existing qualitative research manuals offer direction for conducting document analysis, there has been little specific discussion about how to use this method to understand and analyse health policy. Drawing on guidance from other disciplines and our own research experience, we present a systematic approach for document analysis in health policy research called the READ approach: (1) ready your materials, (2) extract data, (3) analyse data and (4) distil your findings. We provide practical advice on each step, with consideration of epistemological and theoretical issues such as the socially constructed nature of documents and their role in modern bureaucracies. We provide examples of document analysis from two case studies from our work in Pakistan and Niger in which documents provided critical insight and advanced empirical and theoretical understanding of a health policy issue. Coding tools for each case study are included as Supplementary Files to inspire and guide future research. These case studies illustrate the value of rigorous document analysis to understand policy content and processes and discourse around policy, in ways that are either not possible using other methods, or greatly enrich other methods such as in-depth interviews and observation. Given the central nature of documents to health policy research and importance of reading them critically, the READ approach provides practical guidance on gaining the most out of documents and ensuring rigour in document analysis.
Rigour in qualitative research is judged partly by the use of deliberate, systematic procedures; however, little specific guidance is available for analysing documents, a nonetheless common method in health policy research.
Document analysis is useful for understanding policy content across time and geographies, documenting processes, triangulating with interviews and other sources of data, understanding how information and ideas are presented formally, and understanding issue framing, among other purposes.
The READ (Ready materials, Extract data, Analyse data, Distil) approach provides a step-by-step guide to conducting document analysis for qualitative policy research.
The READ approach can be adapted to different purposes and types of research, two examples of which are presented in this article, with sample tools in the Supplementary Materials .
Document analysis (also called document review) is one of the most commonly used methods in health policy research; it is nearly impossible to conduct policy research without it. Writing in early 20th century, Weber (2015) identified the importance of formal, written documents as a key characteristic of the bureaucracies by which modern societies function, including in public health. Accordingly, critical social research has a long tradition of documentary review: Marx analysed official reports, laws, statues, census reports and newspapers and periodicals over a nearly 50-year period to come to his world-altering conclusions ( Harvey, 1990 ). Yet in much of social science research, ‘documents are placed at the margins of consideration,’ with privilege given to the spoken word via methods such as interviews, possibly due to the fact that many qualitative methods were developed in the anthropological tradition to study mainly pre-literate societies ( Prior, 2003 ). To date, little specific guidance is available to help health policy researchers make the most of these wells of information.
The term ‘documents’ is defined here broadly, following Prior, as physical or virtual artefacts designed by creators, for users, to function within a particular setting ( Prior, 2003 ). Documents exist not as standalone objects of study but must be understood in the social web of meaning within which they are produced and consumed. For example, some analysts distinguish between public documents (produced in the context of public sector activities), private documents (from business and civil society) and personal documents (created by or for individuals, and generally not meant for public consumption) ( Mogalakwe, 2009 ). Documents can be used in a number of ways throughout the research process ( Bowen, 2009 ). In the planning or study design phase, they can be used to gather background information and help refine the research question. Documents can also be used to spark ideas for disseminating research once it is complete, by observing the ways those who will use the research speak to and communicate ideas with one another.
Documents can also be used during data collection and analysis to help answer research questions. Recent health policy research shows that this can be done in at least four ways. Frequently, policy documents are reviewed to describe the content or categorize the approaches to specific health problems in existing policies, as in reviews of the composition of drowning prevention resources in the United States or policy responses to foetal alcohol spectrum disorder in South Africa ( Katchmarchi et al. , 2018 ; Adebiyi et al. , 2019 ). In other cases, non-policy documents are used to examine the implementation of health policies in real-world settings, as in a review of web sources and newspapers analysing the functioning of community health councils in New Zealand ( Gurung et al. , 2020 ). Perhaps less frequently, document analysis is used to analyse policy processes, as in an assessment of multi-sectoral planning process for nutrition in Burkina Faso ( Ouedraogo et al. , 2020 ). Finally, and most broadly, document analysis can be used to inform new policies, as in one study that assessed cigarette sticks as communication and branding ‘documents,’ to suggest avenues for further regulation and tobacco control activities ( Smith et al. , 2017 ).
This practice paper provides an overarching method for conducting document analysis, which can be adapted to a multitude of research questions and topics. Document analysis is used in most or all policy studies; the aim of this article is to provide a systematized method that will enhance procedural rigour. We provide an overview of document analysis, drawing on guidance from disciplines adjacent to public health, introduce the ‘READ’ approach to document analysis and provide two short case studies demonstrating how document analysis can be applied.
Document analysis is a systematic procedure for reviewing or evaluating documents, which can be used to provide context, generate questions, supplement other types of research data, track change over time and corroborate other sources ( Bowen, 2009 ). In one commonly cited approach in social research, Bowen recommends first skimming the documents to get an overview, then reading to identify relevant categories of analysis for the overall set of documents and finally interpreting the body of documents ( Bowen, 2009 ). Document analysis can include both quantitative and qualitative components: the approach presented here can be used with either set of methods, but we emphasize qualitative ones, which are more adapted to the socially constructed meaning-making inherent to collaborative exercises such as policymaking.
The study of documents as a research method is common to a number of social science disciplines—yet in many of these fields, including sociology ( Mogalakwe, 2009 ), anthropology ( Prior, 2003 ) and political science ( Wesley, 2010 ), document-based research is described as ill-considered and underutilized. Unsurprisingly, textual analysis is perhaps most developed in fields such as media studies, cultural studies and literary theory, all disciplines that recognize documents as ‘social facts’ that are created, consumed, shared and utilized in socially organized ways ( Atkinson and Coffey, 1997 ). Documents exist within social ‘fields of action,’ a term used to designate the environments within which individuals and groups interact. Documents are therefore not mere records of social life, but integral parts of it—and indeed can become agents in their own right ( Prior, 2003 ). Powerful entities also manipulate the nature and content of knowledge; therefore, gaps in available information must be understood as reflecting and potentially reinforcing societal power relations ( Bryman and Burgess, 1994 ).
Document analysis, like any research method, can be subject to concerns regarding validity, reliability, authenticity, motivated authorship, lack of representativity and so on. However, these can be mitigated or avoided using standard techniques to enhance qualitative rigour, such as triangulation (within documents and across methods and theoretical perspectives), ensuring adequate sample size or ‘engagement’ with the documents, member checking, peer debriefing and so on ( Maxwell, 2005 ).
Document analysis can be used as a standalone method, e.g. to analyse the contents of specific types of policy as they evolve over time and differ across geographies, but document analysis can also be powerfully combined with other types of methods to cross-validate (i.e. triangulate) and deepen the value of concurrent methods. As one guide to public policy research puts it, ‘almost all likely sources of information, data, and ideas fall into two general types: documents and people’ ( Bardach and Patashnik, 2015 ). Thus, researchers can ask interviewees to address questions that arise from policy documents and point the way to useful new documents. Bardach and Patashnik suggest alternating between documents and interviews as sources as information, as one tends to lead to the other, such as by scanning interviewees’ bookshelves and papers for titles and author names ( Bardach and Patashnik, 2015 ). Depending on your research questions, document analysis can be used in combination with different types of interviews ( Berner-Rodoreda et al. , 2018 ), observation ( Harvey, 2018 ), and quantitative analyses, among other common methods in policy research.
The READ approach to document analysis is a systematic procedure for collecting documents and gaining information from them in the context of health policy studies at any level (global, national, local, etc.). The steps consist of: (1) ready your materials, (2) extract data, (3) analyse data and (4) distil your findings. We describe each of these steps in turn.
Step 1. Ready your materials
At the outset, researchers must set parameters in terms of the nature and number (approximately) of documents they plan to analyse, based on the research question. How much time will you allocate to the document analysis, and what is the scope of your research question? Depending on the answers to these questions, criteria should be established around (1) the topic (a particular policy, programme, or health issue, narrowly defined according to the research question); (2) dates of inclusion (whether taking the long view of several decades, or zooming in on a specific event or period in time); and (3) an indicative list of places to search for documents (possibilities include databases such as Ministry archives; LexisNexis or other databases; online searches; and particularly interview subjects). For difficult-to-obtain working documents or otherwise non-public items, bringing a flash drive to interviews is one of the best ways to gain access to valuable documents.
For research focusing on a single policy or programme, you may review only a handful of documents. However, if you are looking at multiple policies, health issues, or contexts, or reviewing shorter documents (such as newspaper articles), you may look at hundreds, or even thousands of documents. When considering the number of documents you will analyse, you should make notes on the type of information you plan to extract from documents—i.e. what it is you hope to learn, and how this will help answer your research question(s). The initial criteria—and the data you seek to extract from documents—will likely evolve over the course of the research, as it becomes clear whether they will yield too few documents and information (a rare outcome), far too many documents and too much information (a much more common outcome) or documents that fail to address the research question; however, it is important to have a starting point to guide the search. If you find that the documents you need are unavailable, you may need to reassess your research questions or consider other methods of inquiry. If you have too many documents, you can either analyse a subset of these ( Panel 1 ) or adopt more stringent inclusion criteria.
Exploring the framing of diseases in Pakistani media
In Table 1 , we present a non-exhaustive list of the types of documents that can be included in document analyses of health policy issues. In most cases, this will mean written sources (policies, reports, articles). The types of documents to be analysed will vary by study and according to the research question, although in many cases, it will be useful to consult a mix of formal documents (such as official policies, laws or strategies), ‘gray literature’ (organizational materials such as reports, evaluations and white papers produced outside formal publication channels) and, whenever possible, informal or working documents (such as meeting notes, PowerPoint presentations and memoranda). These latter in particular can provide rich veins of insight into how policy actors are thinking through the issues under study, particularly for the lucky researcher who obtains working documents with ‘Track Changes.’ How you prioritize documents will depend on your research question: you may prioritize official policy documents if you are studying policy content, or you may prioritize informal documents if you are studying policy process.
Types of documents that can be consulted in studies of health policy
During this initial preparatory phase, we also recommend devising a file-naming system for your documents (e.g. Author.Date.Topic.Institution.PDF), so that documents can be easily retrieved throughout the research process. After extracting data and processing your documents the first time around, you will likely have additional ‘questions’ to ask your documents and need to consult them again. For this reason, it is important to clearly name source files and link filenames to the data that you are extracting (see sample naming conventions in the Supplementary Materials ).
Step 2. Extract data
Data can be extracted in a number of ways, and the method you select for doing so will depend on your research question and the nature of your documents. One simple way is to use an Excel spreadsheet where each row is a document and each column is a category of information you are seeking to extract, from more basic data such as the document title, author and date, to theoretical or conceptual categories deriving from your research question, operating theory or analytical framework (Panel 2). Documents can also be imported into thematic coding software such as Atlas.ti or NVivo, and data extracted that way. Alternatively, if the research question focuses on process, documents can be used to compile a timeline of events, to trace processes across time. Ask yourself, how can I organize these data in the most coherent manner? What are my priority categories? We have included two different examples of data extraction tools in the Supplementary Materials to this article to spark ideas.
Case study Documents tell part of the story in Niger
Document analyses are first and foremost exercises in close reading: documents should be read thoroughly, from start to finish, including annexes, which may seem tedious but which sometimes produce golden nuggets of information. Read for overall meaning as you extract specific data related to your research question. As you go along, you will begin to have ideas or build working theories about what you are learning and observing in the data. We suggest capturing these emerging theories in extended notes or ‘memos,’ as used in Grounded Theory methodology ( Charmaz, 2006 ); these can be useful analytical units in themselves and can also provide a basis for later report and article writing.
As you read more documents, you may find that your data extraction tool needs to be modified to capture all the relevant information (or to avoid wasting time capturing irrelevant information). This may require you to go back and seek information in documents you have already read and processed, which will be greatly facilitated by a coherent file-naming system. It is also useful to keep notes on other documents that are mentioned that should be tracked down (sometimes you can write the author for help). As a general rule, we suggest being parsimonious when selecting initial categories to extract from data. Simply reading the documents takes significant time in and of itself—make sure you think about how, exactly, the specific data you are extracting will be used and how it goes towards answering your research questions.
Step 3. Analyse data
As in all types of qualitative research, data collection and analysis are iterative and characterized by emergent design, meaning that developing findings continually inform whether and how to obtain and interpret data ( Creswell, 2013 ). In practice, this means that during the data extraction phase, the researcher is already analysing data and forming initial theories—as well as potentially modifying document selection criteria. However, only when data extraction is complete can one see the full picture. For example, are there any documents that you would have expected to find, but did not? Why do you think they might be missing? Are there temporal trends (i.e. similarities, differences or evolutions that stand out when documents are ordered chronologically)? What else do you notice? We provide a list of overarching questions you should think about when viewing your body of document as a whole ( Table 2 ).
Questions to ask your overall body of documents

HIV and viral hepatitis articles by main frames (%). Note: The percentage of articles is calculated by dividing the number of articles appearing in each frame for viral hepatitis and HIV by the respectivenumber of sampled articles for each disease (N = 137 for HIV; N = 117 for hepatitis). Time frame: 1 January 2006 to 30 September 2016

Representations of progress toward Millennium Development Goal 4 in Nigerien policy documents. Sources: clockwise from upper left: ( WHO 2006 ); ( Institut National de la Statistique 2010 ); ( Ministè re de la Santé Publique 2010 ); ( Unicef 2010 )
In addition to the meaning-making processes you are already engaged in during the data extraction process, in most cases, it will be useful to apply specific analysis methodologies to the overall corpus of your documents, such as policy analysis ( Buse et al. , 2005 ). An array of analysis methodologies can be used, both quantitative and qualitative, including case study methodology, thematic content analysis, discourse analysis, framework analysis and process tracing, which may require differing levels of familiarity and skills to apply (we highlight a few of these in the case studies below). Analysis can also be structured according to theoretical approaches. When it comes to analysing policies, process tracing can be particularly useful to combine multiple sources of information, establish a chronicle of events and reveal political and social processes, so as to create a narrative of the policy cycle ( Yin, 1994 ; Shiffman et al. , 2004 ). Practically, you will also want to take a holistic view of the documents’ ‘answers’ to the questions or analysis categories you applied during the data extraction phase. Overall, what did the documents ‘say’ about these thematic categories? What variation did you find within and between documents, and along which axes? Answers to these questions are best recorded by developing notes or memos, which again will come in handy as you write up your results.
As with all qualitative research, you will want to consider your own positionality towards the documents (and their sources and authors); it may be helpful to keep a ‘reflexivity’ memo documenting how your personal characteristics or pre-standing views might influence your analysis ( Watt, 2007 ).
Step 4. Distil your findings
You will know when you have completed your document review when one of the three things happens: (1) completeness (you feel satisfied you have obtained every document fitting your criteria—this is rare), (2) out of time (this means you should have used more specific criteria), and (3) saturation (you fully or sufficiently understand the phenomenon you are studying). In all cases, you should strive to make the third situation the reason for ending your document review, though this will not always mean you will have read and analysed every document fitting your criteria—just enough documents to feel confident you have found good answers to your research questions.
Now it is time to refine your findings. During the extraction phase, you did the equivalent of walking along the beach, noticing the beautiful shells, driftwood and sea glass, and picking them up along the way. During the analysis phase, you started sorting these items into different buckets (your analysis categories) and building increasingly detailed collections. Now you have returned home from the beach, and it is time to clean your objects, rinse them of sand and preserve only the best specimens for presentation. To do this, you can return to your memos, refine them, illustrate them with graphics and quotes and fill in any incomplete areas. It can also be illuminating to look across different strands of work: e.g. how did the content, style, authorship, or tone of arguments evolve over time? Can you illustrate which words, concepts or phrases were used by authors or author groups?
Results will often first be grouped by theoretical or analytic category, or presented as a policy narrative, interweaving strands from other methods you may have used (interviews, observation, etc.). It can also be helpful to create conceptual charts and graphs, especially as this corresponds to your analytical framework (Panels 1 and 2). If you have been keeping a timeline of events, you can seek out any missing information from other sources. Finally, ask yourself how the validity of your findings checks against what you have learned using other methods. The final products of the distillation process will vary by research study, but they will invariably allow you to state your findings relative to your research questions and to draw policy-relevant conclusions.
Document analysis is an essential component of health policy research—it is also relatively convenient and can be low cost. Using an organized system of analysis enhances the document analysis’s procedural rigour, allows for a fuller understanding of policy process and content and enhances the effectiveness of other methods such as interviews and non-participant observation. We propose the READ approach as a systematic method for interrogating documents and extracting study-relevant data that is flexible enough to accommodate many types of research questions. We hope that this article encourages discussion about how to make best use of data from documents when researching health policy questions.
Supplementary data are available at Health Policy and Planning online.
The data extraction tool in the Supplementary Materials for the iCCM case study (Panel 2) was conceived of by the research team for the multi-country study ‘Policy Analysis of Community Case Management for Childhood and Newborn Illnesses’. The authors thank Sara Bennett and Daniela Rodriguez for granting permission to publish this tool. S.M. was supported by The Olympia-Morata-Programme of Heidelberg University. The funders had no role in the decision to publish, or preparation of the manuscript. The content is the responsibility of the authors and does not necessarily represent the views of any funder.
Conflict of interest statement . None declared.
Ethical approval. No ethical approval was required for this study.
Abdelmutti N , Hoffman-Goetz L. 2009 . Risk messages about HPV, cervical cancer, and the HPV vaccine Gardasil: a content analysis of Canadian and U.S. national newspaper articles . Women & Health 49 : 422 – 40 .
Google Scholar
Adebiyi BO , Mukumbang FC , Beytell A-M. 2019 . To what extent is fetal alcohol spectrum disorder considered in policy-related documents in South Africa? A document review . Health Research Policy and Systems 17 :
Atkinson PA , Coffey A. 1997 . Analysing documentary realities. In: Silverman D (ed). Qualitative Research: Theory, Method and Practice . London : SAGE .
Google Preview
Bardach E , Patashnik EM. 2015 . Practical Guide for Policy Analysis: The Eightfold Path to More Effective Problem Solving . Los Angeles : SAGE .
Bennett S , Dalglish SL , Juma PA , Rodríguez DC. 2015 . Altogether now… understanding the role of international organizations in iCCM policy transfer . Health Policy and Planning 30 : ii26 – 35 .
Berner-Rodoreda A , Bärnighausen T , Kennedy C et al. 2018 . From doxastic to epistemic: a typology and critique of qualitative interview styles . Qualitative Inquiry 26 : 291 – 305 . 1077800418810724.
Bowen GA. 2009 . Document analysis as a qualitative research method . Qualitative Research Journal 9 : 27 – 40 .
Bryman A. 1994 . Analyzing Qualitative Data .
Buse K , Mays N , Walt G. 2005 . Making Health Policy . New York : Open University Press .
Charmaz K. 2006 . Constructing Grounded Theory: A Practical Guide through Qualitative Analysis . London : SAGE .
Claassen L , Smid T , Woudenberg F , Timmermans DRM. 2012 . Media coverage on electromagnetic fields and health: content analysis of Dutch newspaper articles and websites . Health, Risk & Society 14 : 681 – 96 .
Creswell JW. 2013 . Qualitative Inquiry and Research Design . Thousand Oaks, CA : SAGE .
Dalglish SL , Rodríguez DC , Harouna A , Surkan PJ. 2017 . Knowledge and power in policy-making for child survival in Niger . Social Science & Medicine 177 : 150 – 7 .
Dalglish SL , Surkan PJ , Diarra A , Harouna A , Bennett S. 2015 . Power and pro-poor policies: the case of iCCM in Niger . Health Policy and Planning 30 : ii84 – 94 .
Entman RM. 1993 . Framing: toward clarification of a fractured paradigm . Journal of Communication 43 : 51 – 8 .
Fournier G , Djermakoye IA. 1975 . Village health teams in Niger (Maradi Department). In: Newell KW (ed). Health by the People . Geneva : WHO .
Gurung G , Derrett S , Gauld R. 2020 . The role and functions of community health councils in New Zealand’s health system: a document analysis . The New Zealand Medical Journal 133 : 70 – 82 .
Harvey L. 1990 . Critical Social Research . London : Unwin Hyman .
Harvey SA. 2018 . Observe before you leap: why observation provides critical insights for formative research and intervention design that you’ll never get from focus groups, interviews, or KAP surveys . Global Health: Science and Practice 6 : 299 – 316 .
Institut National de la Statistique. 2010. Rapport National sur les Progrès vers l'atteinte des Objectifs du Millénaire pour le Développement. Niamey, Niger: INS.
Kamarulzaman A. 2013 . Fighting the HIV epidemic in the Islamic world . Lancet 381 : 2058 – 60 .
Katchmarchi AB , Taliaferro AR , Kipfer HJ. 2018 . A document analysis of drowning prevention education resources in the United States . International Journal of Injury Control and Safety Promotion 25 : 78 – 84 .
Krippendorff K. 2004 . Content Analysis: An Introduction to Its Methodology . SAGE .
Marten R. 2019 . How states exerted power to create the Millennium Development Goals and how this shaped the global health agenda: lessons for the sustainable development goals and the future of global health . Global Public Health 14 : 584 – 99 .
Maxwell JA. 2005 . Qualitative Research Design: An Interactive Approach , 2 nd edn. Thousand Oaks, CA : Sage Publications .
Mayring P. 2004 . Qualitative Content Analysis . In: Flick U, von Kardorff E, Steinke I (eds). A Companion to Qualitative Research . SAGE .
Ministère de la Santé Publique. 2010. Enquête nationale sur la survie des enfants de 0 à 59 mois et la mortalité au Niger 2010. Niamey, Niger: MSP.
Mogalakwe M. 2009 . The documentary research method—using documentary sources in social research . Eastern Africa Social Science Research Review 25 : 43 – 58 .
Nelkin D. 1991 . AIDS and the news media . The Milbank Quarterly 69 : 293 – 307 .
Ouedraogo O , Doudou MH , Drabo KM et al. 2020 . Policy overview of the multisectoral nutrition planning process: the progress, challenges, and lessons learned from Burkina Faso . The International Journal of Health Planning and Management 35 : 120 – 39 .
Prior L. 2003 . Using Documents in Social Research . London: SAGE .
Shiffman J , Stanton C , Salazar AP. 2004 . The emergence of political priority for safe motherhood in Honduras . Health Policy and Planning 19 : 380 – 90 .
Smith KC , Washington C , Welding K et al. 2017 . Cigarette stick as valuable communicative real estate: a content analysis of cigarettes from 14 low-income and middle-income countries . Tobacco Control 26 : 604 – 7 .
Strömbäck J , Dimitrova DV. 2011 . Mediatization and media interventionism: a comparative analysis of Sweden and the United States . The International Journal of Press/Politics 16 : 30 – 49 .
UNICEF. 2010. Maternal, Newborn & Child Surival Profile. Niamey, Niger: UNICEF
Watt D. 2007 . On becoming a qualitative researcher: the value of reflexivity . Qualitative Report 12 : 82 – 101 .
Weber M. 2015 . Bureaucracy. In: Waters T , Waters D (eds). Rationalism and Modern Society: New Translations on Politics, Bureaucracy, and Social Stratification . London : Palgrave MacMillan .
Wesley JJ. 2010 . Qualitative Document Analysis in Political Science.
World Health Organization. 2006. Country Health System Fact Sheet 2006: Niger. Niamey, Niger: WHO.
Yin R. 1994 . Case Study Research: Design and Methods . Thousand Oaks, CA : Sage .
Supplementary data
Email alerts, citing articles via.
- Recommend to Your Librarian
Affiliations
- Online ISSN 1460-2237
- Copyright © 2024 The London School of Hygiene and Tropical Medicine and Oxford University Press
- About Oxford Academic
- Publish journals with us
- University press partners
- What we publish
- New features
- Open access
- Institutional account management
- Rights and permissions
- Get help with access
- Accessibility
- Advertising
- Media enquiries
- Oxford University Press
- Oxford Languages
- University of Oxford
Oxford University Press is a department of the University of Oxford. It furthers the University's objective of excellence in research, scholarship, and education by publishing worldwide
- Copyright © 2024 Oxford University Press
- Cookie settings
- Cookie policy
- Privacy policy
- Legal notice
This Feature Is Available To Subscribers Only
Sign In or Create an Account
This PDF is available to Subscribers Only
For full access to this pdf, sign in to an existing account, or purchase an annual subscription.
Want to create or adapt books like this? Learn more about how Pressbooks supports open publishing practices.
17.7 Documents and other artifacts
Learning objectives.
Learners will be able to…
- Identify key considerations when planning to analyze documents and other artifacts as a strategy for qualitative data gathering, including preparations, tools, and skills to support it
- Assess whether analyzing documents and other artifacts is an effective approach to gather data for your qualitative research proposal
Qualitative researchers may also elect to utilize existing documents (e.g. reports, newspapers, blogs, minutes) or other artifacts (e.g. photos, videos, performances, works of art) as sources of data. Artifact analysis can provide important information on a specific topic, for instance, how same-sex couples are portrayed in the media. They also may provide contextual information regarding the values and popular sentiments of a given time and/or place. When choosing to utilize documents and other artifacts as a source of data for your project, remember that you are approaching these as a researcher, not just as a consumer of media. You need to thoughtfully plan what artifacts you will include, with a clear justification for their selection that is solidly linked to your research question, as well as a plan for systematically approaching these artifacts to identify and obtain relevant information from them.
Obtaining your artifacts
As you begin considering what artifacts you will be using for your research study, there are two points to consider: what will help you to answer your research question and what can you gain access to. In addressing the first of these considerations, you may already have a good idea about what artifacts are needed because you have done a substantial amount of preliminary work and you know this area well. However, if you are unsure, or you need to supplement your existing knowledge, some general sources can include: librarians, historians, community experts, topical experts, organizations or agencies that address the issue or serve the population you will be studying, and other researchers who study this area. In considering access, if the artifacts are public the answer may be a straightforward yes, but if the documents are privately held, you may need to be granted permission – and remember, this is permission to use them for research purposes, not just to view them. When obtaining permission, get something in writing, so that you have this handy to submit with your IRB application. While the types of artifacts you might include are almost endless (given they are relevant to your research question), Table 18.4 offers a list of some ideas for different sources you might consider.
Artifact analysis skills
Consistent with other areas of research, but perhaps especially salient to the use of artifacts, you will require organizational skills. Depending on what sources you choose to include, you may literally have volumes of data. Furthermore, you might not just be dealing with a large amount of data, but also a variety of types of data. Regardless of whether you are using physical or virtual data, you need to have a way to label and catalog (or file) each artifact so that you can easily track it down. As you collect specific information from each piece, make sure it is tagged with the appropriate label so that you can track it back down, as you very well may need to reference it later. This is also very important for honest and transparency in your work as a qualitative researcher – documenting a way to trace your findings back to the raw data .
In addition to staying organized, you also need to think specifically about what you are looking for in the artifacts. This might seem silly, but depending on the amount of data you are dealing with and how broad your research topic is, it might be hard to ‘separate the wheat from the chaff’ and figure out what is important or relevant information. Sometimes this is more clearly defined and we have a prescribed list of things we are looking for. This prescribed list may come from existing literature on the topic. This prescribed list may be based on peer-reviewed literature that is more conceptual, meaning that it focuses on defining concepts, putting together propositions, formulating early stage theories, and laying out professional wisdom, rather than reporting research findings. Drawing on this literature, we can then examine our data to see if there is evidence of these ideas and what this evidence tells us about these concepts. If this is the case, make sure you document this list somewhere, and on this list define each item and provide a code that you can attach when you see it in each document. This document then becomes your codebook .
However, if you aren’t clear ahead of time what this list might be, you may take an emergent approach, meaning that you have some general ideas of what you are seeking. In this event, you will actively create a codebook as you go, like the one described above, as you encounter these ideas in your artifacts. This helps you to gain a better understanding of what items should be included in your list, rather than coming in with preconceived notions about what they should be. There will be more about tracking this in our next chapter on qualitative analysis. Whether you have a prescribed list or use a more emergent design to develop your codebook, you will likely make modifications or corrections to it along the way as your knowledge evolves. When you make these changes, it is very important to have a way to document what changes you made, when, and why. Again, this helps to keep you honest, organized, and transparent. Just as another reminder, if you are using predetermined codes that you are looking for, this is reflective of a more deductive approach, whereas seeking emergent codes is more inductive .
Finally, when using artifacts, you may also need to bring in some creative, out-of-the-box thinking. You may be bringing together many different pieces of data that look and sound nothing alike, yet you are seeking information from them that will allow you tell a cohesive story. You may need to be fluid or flexible in how you are looking at things, and potentially challenge your preconceived notions.
Capturing the data
As alluded to above, you may have physical artifacts that you are dealing with, digital artifacts or representations of these artifacts (e.g. videos, photos, recordings), or even field notes about artifacts (for instance, if you take notes of a dramatic performance that can’t be recorded). A large part of what may drive your decisions about how to capture your data may be related to your level of access to those artifacts: can you look at it? Can you touch it, can you take it home with you, can you take a picture of it? Depending on what artifacts we are talking about, some of these may be important questions. Regardless of the answers to these questions, you will need to have a clearly articulated and well-documented plan for how you are obtaining the data and how you will reference it in the future.
What types of artifacts might you have access to that might help to answer your research question(s)?
- These could be artifacts available at your field placement, publicly available media, through school, or through public institutions
- These can be documents or they can be audiovisual materials
- Think outside the box, how can you gather direct or indirect indications of the thing you are studying
Generate a list of at least 3
Again, drawing on Creswell’s (2013) suggestion of capturing ‘descriptive’ and ‘reflective’ aspects in your field notes, Table 18.5 offers some more detailed description of what to include as your capture your data and corresponding examples when focusing on an artifact.
Resources to learn more about qualitative research with artifacts.
Bowen, G. A. (2009). Document analysis as a qualitative research method .
Rowsell, J. (2011). Carrying my family with me: Artifacts as emic perspectives .
Hammond, J., & McDermott, I. (n.d.). Policy document analysis .
Wang et al. (2017). Arts-based methods in socially engaged research practice: A classification framework .
A few exemplars of studies utilizing documents and other artifacts.
Casey, R. C. (2018). Hard time: A content analysis of incarcerated women’s personal accounts .
Green, K. R. (2018). Exploring the implications of shifting HIV prevention practice Ideologies on the Work of Community-Based Organizations: A Resource dependence perspective .
Sousa, P., & Almeida, J. L. (2016). Culturally sensitive social work: promoting cultural competence .
Secondary data analysis
I wanted to briefly provide some special attention to secondary data analysis at the end of this chapter. In the past two chapters we have focused our sights most often on what we would call raw data sources . However, you can of course conduct qualitative research with secondary data , which is data that was collected previously for another research project or other purpose; data is not originating from your research process. If you are fortunate enough to have access and permission to use qualitative data that had already been collected, you can pose a new research question that may be answered by analyzing this data. This saves you the time and energy from having to collect the data yourself!
You might procure this data because you know the researcher that collected the original data. For instance, as a student, perhaps there is a faculty member that allows you access to data they had previously collected for another project. Alternatively, maybe you locate a source of qualitative data that is publicly available. Examples of this might include interviews previously conducted with Holocaust survivors. Finally, you might register and join a research data repository . These are sites where contributing researchers can house data that other researchers can view and request permission to use. Syracuse University hosts a repository that is explicitly dedicated to qualitative data . While there are more of these emerging, it may be a challenge to find the specific data you are looking for in a repository. You should also anticipate that data from repositories will have all identifiable information removed. Sharing data you have collected with a repository is a good way to extend the potential usefulness and impact of data, but it also should be anticipated before you collect your data so that you can build it into any informed consent so participants are made aware of the possibility.
Computer Assisted Qualitative Data Analysis Software (CAQDAS)
Some qualitative researchers use software packages known as Computer Assisted Qualitative Data Analysis Software (CAQDAS) in their work. These are tools that can aid researchers in managing, organizing and manipulating/analyzing their data. Some of the more common tools include NVivo, Atlas.ti, and MAXQDA, which have licensing fees attached to them (although many have discounted student rates). However, there are also some free options available if you do some hunting. Taguette Project is the only free and open source CAQDAS project that is currently receiving updates, as previous projects like RQDA which built from the R library are not in active development. Taguette is a young project, and unlike the free alternatives for quantitative data analysis, it lacks the sophisticated analytical tools of commercial CAQDAS programs.
It is unlikely that you will be using a CAQDAS for a student project, mostly because of the additional time investment it will take to become familiar with the software and associated costs (if applicable). In fact the best way to avoid spending money on qualitative data analysis software is to do your analysis by hand or using word processing or spreadsheet software. If you continue on with other qualitative research projects, it may be worth some additional study to learn more about CAQDAS tools. If you do choose to use one of these products, it won’t magically do the analysis for you. You need to be clear about what you are using the software for and how it supports your analysis plan, which will be the focus of our next chapter.
Resources to learn more about CAQDAS.
Maher et al. (2018). Ensuring rigor in qualitative data analysis: A design research approach to coding combining NVivo with traditional material methods .
Woods et al. (2016). Advancing qualitative research using qualitative data analysis software (QDAS)? Reviewing potential versus practice in published studies using ATLAS. ti and NVivo, 1994–2013 .
Zamawe, F. C. (2015). The implication of using NVivo software in qualitative data analysis: Evidence-based reflections .
As you continue to plan your research proposal, make sure to give practical thought to how you will go about collecting your qualitative data. Hopefully this chapter helped you to consider which methods are appropriate and what skills might be required to apply that particular method well. Revisit the table in section 18.3 that summarizes each of these approaches and some of the strengths and challenges associated with each of them. Collecting qualitative data can be a labor-intensive process, to be sure. However, I personally find it very rewarding. In its very forms, we are bearing witness to people’s stories and experiences.
Key Takeaways
- Artifact analysis can be particularly useful for qualitative research as a means of studying existing data; meaning we aren’t having to collect the data ourselves, but we do have to gather it. As a limitation, we don’t have any control over how the data was created, since we weren’t involved in it.
- There are many sources of existing data that we can consider for artifact analysis. Think of all the things around us that can help to tell some story! Artifact analysis may be especially appealing as a potential time saver for student researchers if you can gain permission to use existing artifacts or use artifacts that are publicly available.
- Artifact analysis still requires a systematic and premeditated approach to how you will go about extract information from your artifacts.
Reflexive Journal Entry Prompt
Here are a few questions to get you thinking about the role that you play as you gather qualitative data.
- What are your initial thoughts about qualitative data collection?
- Why might that be?
- What excites you about this process?
- What worries you about this process?
- What aspects of yourself will strengthen or enhance this process?
- What aspects of yourself may hinder or challenge this process?
Decision Point: How will you go about qualitative data collection?
- Justify your choice(s) here in relation to your research question and availability of resources at your disposal
- who will be collecting data
- what will be involved
- how will it be safely stored and organized
- how are you protecting human participants
- if you have a team, how is communication being established so everyone is “on the same page”
- how will you know you are done
- What additional information do you need to know to use this approach?
- Harris, M. and Fallot, R. (2001). Using trauma theory to design service systems. New Directions for Mental Health Service s. Jossey Bass; Farragher, B. and Yanosy, S. (2005). Creating a trauma-sensitive culture in residential treatment. Therapeutic Communities, 26 (1), 93-109. ↵
The analysis of documents (or other existing artifacts) as a source of data.
unprocessed data that researchers can analyze using quantitative and qualitative methods (e.g., responses to a survey or interview transcripts)
A code is a label that we place on segment of data that seems to represent the main idea of that segment.
A document that we use to keep track of and define the codes that we have identified (or are using) in our qualitative data analysis.
starts by reading existing theories, then testing hypotheses and revising or confirming the theory
when a researcher starts with a set of observations and then moves from particular experiences to a more general set of propositions about those experiences
analyzing data that has been collected by another person or research group
in a literature review, a source that describes primary data collected and analyzed by the author, rather than only reviewing what other researchers have found
Data someone else has collected that you have permission to use in your research.
These are sites where contributing researchers can house data that other researchers can view and request permission to use
These are software tools that can aid qualitative researchers in managing, organizing and manipulating/analyzing their data.
Doctoral Research Methods in Social Work Copyright © by Mavs Open Press. All Rights Reserved.
Share This Book
IMAGES
VIDEO
COMMENTS
Documentary Analysis. Definition: Documentary analysis, also referred to as document analysis, is a systematic procedure for reviewing or evaluating documents.This method involves a detailed review of the documents to extract themes or patterns relevant to the research topic.. Documents used in this type of analysis can include a wide variety of materials such as text (words) and images that ...
Although often neglected in methodological research, unobtrusive research methods, such as document analysis, are increasingly recognized as particularly interesting and innovative strategies for collecting and assessing data (Berg, 2001).The flexibility of this method allows documents to be analyzed in a standalone fashion or in combination with other qualitative and quantitative methods as ...
Document analysis is a versatile method in qualitative research that offers a lens into the intricate layers of meaning, context, and perspective found within textual materials. Through careful and systematic examination, it unveils the richness and depth of the information housed in documents, providing a unique dimension to research findings.
Document analysis is a qualitative research technique used by researchers. The process involves evaluating electronic and physical documents to interpret them, gain an understanding of their meaning and develop upon the information they provide. Researchers use three main types of documents in their research:
The Basics of Document Analysis. Document analysis is the process of reviewing or evaluating documents both printed and electronic in a methodical manner. The document analysis method, like many other qualitative research methods, involves examining and interpreting data to uncover meaning, gain understanding, and come to a conclusion.
What is document analysis? Document analysis is a systematic procedure for reviewing or evaluating documents, which can be used to provide context, generate questions, supplement other types of research data, track change over time and corroborate other sources (Bowen, 2009).In one commonly cited approach in social research, Bowen recommends first skimming the documents to get an overview ...
a. Defining quantitative research and its key characteristics. Quantitative research is a systematic empirical approach that involves collecting and analyzing numerical data to answer research questions and test hypotheses. It seeks to understand phenomena by quantifying variables and examining the relationships between them.
Quantitative research is the opposite of qualitative research, which involves collecting and analyzing non-numerical data (e.g., text, video, or audio). Quantitative research is widely used in the natural and social sciences: biology, chemistry, psychology, economics, sociology, marketing, etc. Quantitative research question examples
A research question is what a study aims to answer after data analysis and interpretation. The answer is written in length in the discussion section of the paper. ... In quantitative research, hypotheses predict the expected relationships among variables.15 Relationships among variables that can be predicted include 1) ...
Document or Documentary analysis is a social research method and is an important research tool in its own right and is an invaluable part of most schemes of triangulation. It refers to the various procedures involved in analyzing and interpreting data generated from the examination of documents and records relevant to a particular study.
Quantitative data analysis is one of those things that often strikes fear in students. It's totally understandable - quantitative analysis is a complex topic, full of daunting lingo, like medians, modes, correlation and regression.Suddenly we're all wishing we'd paid a little more attention in math class…. The good news is that while quantitative data analysis is a mammoth topic ...
Document analysis is a qualitative research method involving a systematic procedure that researchers use to evaluate documents. This research methodology requires a repeat review of documentary evidence and data interpretation to get an empirical knowledge of the source documents in question. You may conduct document analyzes alone or as a part ...
The latter uses quantitative methods of document analysis (generally texts), which are based on mathematical and statistical techniques (sampling, decomposition, numbering, encoding, comparison, linking) and is aimed at discovering the properties of the document. Identifying these properties allows for a commentary on how that document makes ...
Content analysis is a research method used to identify patterns in recorded communication. To conduct content analysis, you systematically collect data from a set of texts, which can be written, oral, or visual: Books, newspapers and magazines. Speeches and interviews. Web content and social media posts. Photographs and films.
This article examines the function of documents as a data source in qualitative research and discusses document analysis procedure in the context of actual research experiences. Targeted to ...
novices, the article takes a nuts-and-bolts approach to document analysis. It describes the nature and forms of documents, outlines the advantages and limitations of document analysis, and offers specific examples of the use of documents in the research process. The application of document analysis to a grounded theory study is illustrated.
Document analysis, like any research method, can be subject to concerns regarding validity, reliability, authenticity, motivated authorship, lack of representativity and so on. ... An array of analysis methodologies can be used, both quantitative and qualitative, including case study methodology, thematic content analysis, discourse analysis ...
Quantitative research is the process of collecting and analyzing numerical data to describe, predict, or control variables of interest. This type of research helps in testing the causal relationships between variables, making predictions, and generalizing results to wider populations. The purpose of quantitative research is to test a predefined ...
Quantitative analysis is the use of mathematical and statistical techniques to assess the performance of a business. Before the advent of quantitative analysis, many company directors based their decisions on experience and gut. Business owners can now use quantitative methods to predict trends, determine the allocation of resources, and manage ...
Document study (also called document analysis) refers to the review by the researcher of written materials . These can include personal and non-personal documents such as archives, annual reports, guidelines, policy documents, diaries or letters. ... Being qualitative research instead of quantitative research should not be used as an assessment ...
Assess whether analyzing documents and other artifacts is an effective approach to gather data for your qualitative research proposal. Qualitative researchers may also elect to utilize existing documents (e.g. reports, newspapers, blogs, minutes) or other artifacts (e.g. photos, videos, performances, works of art) as sources of data.
Quantitative research Quantitative research is expressed in numbers and graphs. It is used to test or confirm theories and assumptions. This type of research can be used to establish generalizable facts. about a topic. Common quantitative methods include experiments, observations recorded as numbers, and surveys with closed-ended questions.
Document analysis is a valuable research method that has been used for many years. This method consists of analyzing various types of documents including books, newspaper ... Quantitative research focuses on measurements that facilitate comparison and statistical aggregation of data (Patton, 2015). Qualitative studies, however, do not emphasize ...