A Beginner’s Guide to Finding User Needs
Qualitative research on user motivations, activities, and problems
Jan Dittrich
A Beginner’s Guide to Finding User Needs shows you how to gain an in-depth understanding of motivations, activities, and problems of (potential) users. The book is written for UX researchers, UX designers and product managers.


Contributors
- lisacharlotterost
- Claudia Landivar
Additional information and co-documentation templates can be found at urbook.fordes.de
Suggestions and Feedback
This book is free/libre, if you help to improve it, it helps all other fellow readers. To point out mistakes you can:
- file an issue (If you are on GitHub)
- write me a mail: dittrich.c.jan AT gmail DOT com
Payed and free versions of this book
- If you/your team/your company wants to buy this book and pay for my coffees, visit its page on leanpub .
- You can read this book for free at github pages or download versions for ebook readers on urbook.fordes.de
Research focused on understanding
This chapter covers:
- What qualitative research is about
- In which projects you can use qualitative research methods
- Why research is not a linear process
Although I am a user researcher since a while, every research project still brings a lot of surprises. What me and my colleagues want to know seems rather simple in the beginning, yet often turns out to be complex and surprising: “Oh, I did not see it this way, but it makes a lot of sense now”. These surprises and complexities lead to a better understanding of why (potential) users of a product do what they do.
This book is about methods for understanding people you design for and about communicating what you learned. The methods used for this are interviews, observation and structuring the data into meaningful patterns. This is sometimes called design ethnography . In such research, you directly engage with people and data you analyze is language- or image-based. This means you use qualitative methods .
There are also research methods that use number-based data and focus on testing hypothesis using measurements and statistical analysis. These are often referred to as quantitative methods . A typical example for quantitative research is A/B testing: A/B testing compares two versions of an interface by measuring which of the versions performs better in a certain metrics e.g., how many people clicked the “buy”-button.
Note: Other research methods Maybe this book is not what you are interested in. Perhaps you rather want to learn about quantitative research using measurements and statistics. In this case, I recommend getting Jeff Sauro and James R. Lewis’ book “Quantifying the User Experience” . If you then crave yet more math and complex methods, try Andy Field’s “Discovering Statistics” and his “How to Design and Report Experiments” . If you are undecided whether you want to use qualitative or quantitative methods or just wonder what research methods exist, you can get an excellent overview and introduction to several methods with Erica Hall’s brief “Just Enough Research” or Goodman, Kuniavsky and Moed’s “Observing the User Experience”
Qualitative research helps you to get a holistic understanding of how a future product could be used by finding out about motivations, activities, and problems of users and gain an in-depth understanding for their activities, replacing stereotypical assumptions. For example, when people cook, it might be plausible to assume that:
- They decide what to eat
- Get a recipe for the meal
- Buy ingredients
- Cook following the recipe
But in everyday life, people often don’t follow this clear script: It will influence their actions that their kid or spouse prefer another food than they do; They might wish for variety; they might see something that they fancy even more than what they initially decided for; they might not trust their cooking skills… If you want to build a product that supports people when cooking or shopping groceries, it makes sense to understand how people actually do it. This does not mean that initial ideas or existing knowledge should be discarded: Concepts like “Programming is typing text that makes computers do stuff” or “Cooking is combining different groceries to get a meal” are not wrong . Such knowledge is just not rich enough to develop products based on it.
There are different ways in which such understanding can be helpful for a project. In the following sections, I show several typical setups in which qualitative research can help you to develop a product.
Types of projects you can use qualitative research in
It makes sense to understand motivations, activities, and problems of potential users before a lot of time and money has been invested in product development. You can do research to understand potential users without having a working product at all and find out what their motivations, activities, and problems are now.
Still, understanding-focused research can also make sense when product development is already ongoing, as long as this research can still influence the products further development. Depending on what is already set or not, there are different project types you can use understanding-focused research in.
Research for open topic exploration
Putting research at the very beginning of a project and having it as the primary driver puts the user needs first and gives you much freedom in your research, allowing you to focus directly on the user. An example would be to explore “Sharing recipes on the web” or “the future of cooking”. If you read case studies about design research led by famous agencies, you will read about this type of research. Such projects are not common: Often there are more constraints.
Research based on an idea for a new product or feature
You want to find out user motivations, activities, and problems that are important to consider when building a product or service. This is the scenario in which I use user need research most often, for example in tasks like “We would like to build an app that allows people to curate recipes and use recipes when cooking”. The research is shaped by the initial idea, but what will be created in the end is not yet certain.
Research based on an overhaul of a product or feature
If a team plans a substantial overhaul of a product, it makes sense to observe how users are using the product to find out where needs are not being met. A task could be “We provide an app for curating and reading recipes. It has not been updated in several years, and we want to increase its use among a younger target group by providing features that are attractive for them.” The research task is rather focused: What is to be done is already mostly set, but research shall shape the way it is done.
In all of these situations, understanding users can help to shape new products and features. But what the research focuses on, is shaped by the initial goals. These constraints are an important influence on your research project. Another important factor is the collaboration with others in the research project.
Researching alone and together
Researchers can collaborate with others in different ways: Researching as a contractor is different from the research as a member of a product team.
All methods in this book work well if you need to run the research on your own. But researching alone is not a requirement: Research can and should be done collaboratively, sharing both work load and gained knowledge.
The way of collaboration depends on your way of work. The following are three prototypical models for using the methods taught in this book: Research for you , research for a team, and research with a team.
Research for you
You can research even as a one-person-team—for example, if you are an entrepreneurial developer who wants to create a product yourself. Most entrepreneurial developers talk to others about the challenges they try to solve for their users and using the methods described in this book is similar, but more rigorous.
Researching by-you, for-you gives a lot of freedom but often has only tight resources and can easily lack structure.
Research for a team
Research for a team is a typical situation for many research contractors. You develop a research question, usually together with some key representatives of client; do the research; and deliver the results back to your client. Often, people hire contractors because they do not have a researcher on their team, because the workload is too high, or because they want an outsider to bring knowledge into the team. While there is some collaboration, particularly when creating a research question and when delivering the results, you will do a large part of the work by yourself.
Research with a team
Product development often involves several people and different roles. At least you have a product manager and developers, but you might also have UX designers, UI designers, market analysts, tech writers, and many more roles.
It is important to have a common direction. This is partly provided by communicating what you find out in your research. But even the best reports can not convey the rich impressions that one has when researching. Involving people directly as co-researchers can be very helpful: You can set them up with some simple tasks and as they learn, give them more responsibilities and help them to bring in their individual skills. For me, the most common way of collaboration is people being co-researchers in interviews. They help with taking notes, but depending on their skill and confidence, they also can shape the research themselves and, for example, ask questions.
Understanding is a messy process
In qualitative research, you are constantly dealing with new people and new situations. Uncertainty and surprises are therefore part of all projects. It has been my experience that dealing with these uncertainties is one of the biggest challenges for beginners.
University teachers, conference speakers, and agencies often present research as finding clear facts with rigorous methods and execution of research in clear subsequent steps. Such models are very helpful for giving structure to your plans and actions, but they are idealized. It is helpful to keep this in mind.
When you do an actual research project, it won’t always follow a clear and linear structure. It will need iterations and adjustments. Don’t think of it failing to do “good research” when something does not go as planned. In fact, it is often a good sign if you feel that you need to adjust plans: It shows that you have learned something new and are aware of it. Plan in time for such adjustments. If your research project is only possible if everything runs very smooth, it might be at the risk of going over time and budget. Also, you and the team might not learn a lot of new things as you can only do what you have expected anyway.
- The methods discussed in this book focus on understanding and documenting the activities of people to design better products for them
- Research projects can vary in their constraints they put on research: They can be very open and explorative or suggest a solution already
- Research projects can vary in how you collaborate with other roles (or not): You can research for yourself, you can be part of a team you do research for, or you can be brought in
- Understanding-focused research methods can be challenging: Be prepared to learn new, surprising things and to adjust your plans
Preparing your research
- Defining what you want to find out in the research project
- Writing the questions you want to ask participants
- Learning about your research field before going there
- Recruiting participants for your research
- Preparing research sessions
- Preventing to harm participants or yourself
- Writing a cheat-sheet
It would be awesome if you could start with learning from people immediately. But before you meet your research participants, you need to do some preparation. It might not be the most glamorous part of being a researcher, but it is crucial to be well-prepared. Planning the research is important for you and your collaborators to get a common understanding of the research goals. The preparation is also useful for learning about the field you are going to do research in. This prepares you for the next step: finding potential participants and asking them if they would like to participate. As a researcher, you are responsible for the impact of your research—on society, on participants and on you. Anticipating this in advance prevents harm.
A good preparation will enable you to focus on learning from participants when the time comes, as you, your team and your participants will be well-prepared for the research. A good way to start with your research preparation is to get a clear understanding of what you and stakeholders of the project want to learn.
What do you want to learn?
The question of what you want to learn leads to two kinds of questions: research project questions and research session questions . Research project questions are about what the goal of the research project itself is. You will work towards that goal by learning from participants in your research. For this, you will ask your participants questions. These are the research session questions . They are questions focused on what the participants do or feel.
Before you work on the research session questions that you ask the participants in the research sessions, you should clarify the overall goal of the research project with your research project question .
Imagine, you are asked to support a company in finding out more about a business area they potentially want to move in: They currently publish content and recipes for cooking enthusiasts online and in a paper magazine. They would like to explore improving their offers to younger people who might not be cooking enthusiasts yet. You were brought in by their product manager. While your contract outlines the topic you should research, it is not yet clear what exactly you will work on in practice. For this, you create a research project question.
Writing a research project question
A research project question briefly outlines the question you want to explore in the research project. It is helpful to start your research project by writing a research project question as it will help you to think about your research and communicate it.
Research project question examples “How and why do students use digital media to learn better?” “How and why do people become Wikipedia editors?” “How and why do developers use Docker images in collaborative software development?”
There will be many situations in which your research touches on other people’s concerns. At least they will be interested in the purpose of your research: Curious colleagues and research participants will be happy to know what it’s about. Telling them your research project question is an efficient way to describe why you do the research. Some people have a stake in your research. They will not only be curious but want to ensure that your research helps them. This is most obvious when you’re researching for a client, but also when you are researching as part of a product team in your organization. A clear research project question helps to communicate the project’s goal. It also ensures that everyone understands what the research will be about.
In the example I use throughout the book, I’m researching for a client and I have at least one person with whom I should have a shared understanding of the research project question: The product manager.
The initial task proposal you are approached with might be vague or very broad. For example, the initial question could be “We want to find out how to appeal to younger people” or “Explore if an app for recipes is right for us”. While these are questions that the client has, they are still focused on a future product—but a product that does not exist yet, can’t be researched, so it makes sense to focus on (potential) users and how and why they do.
Here are the questions you should be able to answer before proceeding:
- “I think we do this to learn how people actually cook in practice”
- “We have been thinking about using videos in our app since quite some time, but it seemed too expensive. I wonder if we will find out that we actually should be doing that.”
- “There was a discussion if we actually want to move in this field and be more ‘tech’ and have this app.”
- “According to research we had done so far, a lot of younger people seem to have an interest in learning to cook better. However, most people we cater to are in their 40s to 50s, so I am unsure if it works for us.”
Even if you are researching for your own project, without a team, it can be helpful to ask yourself these questions and write down the answers.
The research project question should be concise. This can be difficult to achieve when many people with different interests are involved. To allow for input while keeping the research question short and simple, keep a visible “research interest backlog”, a table of smaller, specific questions and who asked them. This prevents the research question from becoming a long list of individual questions.
I have already mentioned that initial questions for a research project might be focused on the product rather than on (potential) users. Instead of dismissing the initial product focus, you transform these initial ideas and use them as a starting point to create a user- and activity-focused research project question:
- Take the initial idea for a future product (or market, or feature)
- Ask yourself why the product would be good for an activity people do.
- Take the activity from 2. and ask yourself how and why people do this activity.
- Refine the question.
Here is an example:
- The initial idea the team wants to explore is “creating an app that offers recipes and teaches cooking skills.”
- The related meaningful activity can be “Learning new cooking skills when cooking with recipes”
- Asking how and why I got to “How do people learn new cooking skills when cooking from recipes?”
- We can then refine the question a bit. The people we work with may not want to focus on enthusiasts but on people who have less cooking skills yet, given that enthusiasts are probably a more saturated market. So, we can refine the research question to: “How do people with low to intermediate existing cooking skills learn new skills when cooking from recipes?”
Tip: In many research projects, you might not just have several people who need to be involved in shaping the research project question. In this case, a research planning workshop might be helpful to gather input and to help the team to gain a mutual understanding of their interests.
The research project question serves to align, communicate and plan the research project. It is relevant to you and the people you work with, but it is not relevant to your direct work with participants in research sessions. What matters in research sessions are the research session questions.
Writing research session questions
The research session questions are the questions you want to ask participants, for example, “Can you tell me about how you cook?” They can also be invitations you want to give, like “Can you show me some recipes you like to use?” or “Can you show me around your kitchen?” Some of your questions are not voiced at all, you ask them yourself to guide your attention, for example, “Are there annotations in their recipes?”
You may have noticed that such questions don’t target specific, short answers typical of surveys, like “How much do you like your job on a scale from 1(I hate it) to 5 (I love it)?” or “Please name your most frequently used app”. Such surveys are usually analyzed quantitatively. In this book, I focus on understanding how and why people do what they do—qualitative research. I show you how to ask questions to which you can get in longer and more descriptive answers. By this, you will learn what you did not know before. Such questions are called open questions because they don’t have a pre-determined (closed) set of answers. Open questions are, for example, “Describe how you started your work today” or “Why did you add sugar to the dough?”
It makes sense to write down your research session questions. This helps you to remember what to ask and allows you to review and improve your questions. Writing down the session questions is also useful for collaborating with co-researchers: They might have good ideas about what could be asked and collaborating on the questions will help you to understand the motivations and strengths of your co-researchers.
When I start writing my research session questions, I often structure them around three themes: Motivations , Activities and Problems . They are relevant for design, and easy to remember with the mnemonic M-A-P .
Questions about motivations are concerned with what the participant wants to achieve and what is important to them. Motivations can give you context to what the participants do.
- “What is the most annoying thing about cooking?”
- “Can you tell me why you chose this recipe?”
- “What is a meal that you have not cooked yourself but would like to try?”
Questions about activities are about what the participant is doing and how they are doing it. Activities are the core of research; this is where the action takes place.
- [Invitation] “Shall we start with cooking?”
- [while observing] “How did you know the pan was hot enough?”
- “You said you are going to replace that ingredient—can you tell me more about that?”
Questions about problems are about what is getting in the way of what the participant wants to do. They can show opportunities to improve existing designs and can surface activities that are so familiar that participants don’t think about them—until something gets in the way.
- [question] “What is getting in your way when you cook?”
- [observation] Watch out for participants abandoning plans and finding new ways.
- [question] “What makes a ‘bad’ recipe?”
The research session questions are flexible and should be treated as a tool for reflection and preparation. There are usually more questions than can get answers to in any single research session.
Your session questions are not static. You should revise them as you learn more about the field. This can be done even before you speak to participants: By speaking with experts and doing desk research, you can learn about the field before you go there.
Get to know the field without going there, yet
A basic understanding of the field will help you to interpret what is going on. Otherwise, what you hear and observe can easily seem like an overwhelming amount of new terms, puzzling behaviors, and unspoken expectations. I’ll show you two ways to learn about a field before you go there: desk research and talking to experts.
Desk research
Desk research means you can do it from your desk by reading and summarizing reports, books, websites, and so forth. Ideally, you can start with easy-to-grasp introductions. For our example project, you could get some cookbooks for beginners and see how they teach cooking. It may also be worth watching some videos of people explaining cooking techniques to get a feel for how participant observation might be like.
Some areas have a lot of “onboarding material” like books, tutorials, and brochures—for example, parenting or web development. In other areas, documentation might be lacking, for example, because the field is highly professionalized (like being a pilot or a medical doctor), because some procedures are considered bad practice (like shortcuts to get work done quickly), or because the topic is considered not actually part of the discipline (like managing your finances as a freelance designer). Particularly for information on what actually happens aside of what is documented, experts might be a good source of information.
Talk to experts
Although searching the web for information is quick and easy, talking to an expert can help you answer specific questions and get tips on what to consider in practice.
Frequently, the team you work with already has some connections to experts: A company creating digital design tools will have close contact with some designers, and a company producing medical devices will have contact with medical doctors. Very often you can use these existing connections to reach out to experts who already have an established connection to your team or organization.
If you need to contact the expert without knowing them beforehand, you might get lucky, and they’ll talk with you for free. Otherwise, you’ll pay them for their time. What you have to pay varies and some experts are really expensive. But in general, talking to an expert is an efficient way to get an overview of a field and the relevant issues for practitioners.
Find people who participate in your research
Once you have written your research questions and learned about the field you want to research in, it is time to find people who participate in the research sessions. To be able to do this, you need to get in contact with them, ask if they could participate, and organize that participation. This is often referred to as “recruiting” research participants. You do this by defining criteria that potential participants should meet and by reaching out to them. You also need to set what you can pay participants for their work. Paying makes it easier to find people and makes your research more fair.
Define recruiting criteria
You are probably familiar with demographic recruiting criteria like “30-40-year-old male, earning more than $60k/year and being interested in technology.” However, your interest is in what people do and the problems they encounter. Demographic criteria are only spuriously related to that. This is why you should describe the potential research participants based on the activity that is part of our research project question.
In my example project, the research project question is “How do people with low to intermediate existing cooking skills learn new skills when they cook with recipes?”, so the activity is “Learning new cooking skills when cooking with recipes.” This is a good start, but it could be a bit easier to understand though: “People who want to improve their cooking skills and use recipes” is probably better, since potential participants could more easily relate to it and think: “Seems they are looking for people like me!”
Recruiting your potential research participants based on activities does not mean that you should ignore criteria that are not activities. Age, gender, ethnicity, and other criteria have a large influence on how people act. It will make your research more interesting and potentially more equitable if you include potential participants from a wide range of such criteria. You can set criteria for the diversity of the participants you involve in your research.
In my example project, I know that cooking, as a domestic activity, is usually associated with women. I could say, that I want at least a quarter of the participants to not be women. Similarly, if I would do research with programmers, it is a reasonable guess that many programmers are young, male, and white. Again, I can set criteria to have some participants older than 35, some non-male, and some non-white.
By defining your recruitment criteria along with the activities that are interesting for you ensures that you recruit participants who actually do what you want to learn more about. While activities are the primary criterion, demographics should not be ignored: Having a demographically diverse group of people makes it more likely to observe a wider range of ways people go about their activities.
Where does the research happen?
Research should take place where the participants are doing the activity you want to learn about. In the example project, I’m interested in how the participants cook with recipes, so their kitchen would be the place to do the research: There, they can talk about the context and show me what they do. I can experience the context and see how much space they have in their kitchen, how they use the space when cooking, and where they keep their recipes. Researching at the place where participants do the activities you are interested in, is called a site visit .
However, it is not always feasible to do the research at the site of the activity. For example, some workplaces have a strict no-visitors policy. Some audiences are distributed globally and long flights to each single participant would be very resource-intensive. In-person site visits are also not always the best way to gather data. For example, if almost all relevant interaction happens on a screen, talking and observing via video chat and screen-sharing might give you better opportunities to observe than looking over somebody’s shoulder in their office.
Knowing what your research project will be like and where the research is going take place is helpful when trying to find your participants for the research. You may also learn more about the field and the participants in the process of finding people and adjust the planned setup accordingly.
Payment and incentives
Payment for research (also called compensation or incentive ) is important for two reasons: It makes participating more attractive to participants and allows some participants to participate at all, for example, if they could not afford to interrupt their usual job for talking to you.
There are several factors that influence the amount you should pay participants:
- Time spent with you, time spent with organizing, time spent traveling.
- Living expenses for the participants: A compensation that is considered just about okay in a Swedish city might be considered high in rural India.
- People who are hard to recruit might be swayed by a larger compensation.
As a starting point, you can use an online calculator, like this one by ethnio , that gives you a suggestion for a sum to pay.
Ideally, you should pay your participants in cash as this poses the fewest restrictions on participants and does not require being a user of a specific service (like using PayPal or having a bank account). It may not be very relevant to research involving middle-class people in a Western country, but not everyone in the world has a bank account.
However, paying in cash is infeasible for many organizations. It may not be allowed or only be permitted for very small sums. Gift cards or vouchers are a common alternative. Sometimes, pre-paid VISA cards can also be a good choice. If your participants already use a product of yours, you can also reduce their monthly service fees for it or give them a free upgrade of their plan.
People might reject your compensation. In this situation, explain to them that they spend time on your questions that they are experts in what you want to learn about, and that it is only fair for them to be paid. Participants may not be allowed to take any compensation, for example, because they work for the government. If people reject the compensation or are not allowed to take it, it can be a nice alternative to instead offer to donate the money instead and let them choose from a list of well-known charities to choose where the money should go.
Tip: Sarah Fathallah’s article “Why Design Researchers Should Compensate Participants” discusses not only the “why” of compensation but also typically raised objections to compensation.
If your work is commercial, pay your participants. However, if you do research as a student or for a small NGO you might only have a very tight budget and people might be supportive of your cause already. If this is the case, I’ve had good experiences with giving a small gift to people—some premium chocolate bars or the like. The costs are relatively small and participants enjoyed the gift a lot.
Plan how many participants you need
There are no clear rules as to how many participants you need. However, most of my projects had more than three and fewer than twenty participants.
If you have done quantitative research in the past, this will seem like a very small number of people. Indeed, it is plausible to assume that user research with more participants is generally better in qualitative research as well. However, unless you invest more resources, more participants would mean shortening each research session, asking fewer questions, and skipping participant observation. But you need time with each participant if you want to understand how and why they work the way they do. To this end, several sessions in a hurry yield less useful results than research with one participant done right.
Nevertheless, doing research on only a very few users restricts the range of behaviors and opinions that will be reflected in your research. For example, you may not notice that different people have different preferred ways of doing activity. Also, you may not see which patterns are consistent across different people and which patterns vary.
My rule of thumb is to have 3 to 7 participants in each user group. Our user group in our example project would be people who have low to medium cooking skills and who cook with recipes. This means that if you want to learn about many groups of people, you also need more participants to cover these different groups. Our research question is currently focused on beginners, but we would need to recruit more people if we would also be interested in people who consider themselves cooking enthusiasts.
When estimating how many participants you need, consider how much time or money you can spend on doing the research. Each additional participant gives you additional data and a broader view of your potential users. However, each research session needs time and adds to the amount of data to be analyzed.
An efficient way to include the “right” number of participants is to do your research iteratively: start with two or three participants and analyze the data (How to do this is described in the section on analyzing data ). Take a look at the preliminary findings: If the results seem clear and consistent, you can do research with a few additional participants to refine and check and explore details; or, if time is up, leave it as it is.
If preliminary findings are unclear or contradictory, you may need to include more participants.
Reasons for such unsatisfactory results can be:
- The participants encompass different groups of people with different needs—For example, for cooking it may be important whether participants are parents who cook for their kids or whether they just cook for themselves.
- The topic of your research is too broad—for example, “How and why do people cook” would be very, very broad.
- Even if your research is focused and involves only one single group of participants, the actual patterns may just vary.
In all these cases you can include more participants—but try to check beforehand whether you…
- …need to clarify your research topic (to focus your efforts)
- …need to specify the group(s) involved more clearly (to recruit the right participants)
Coming from research based on measurements and statistics, refinement of criteria during research will feel very unusual or even like cheating. But qualitative research follows a different paradigm. The research I describe here aims at understanding and describing. To do this, it is not only fine but advantageous to do our recruiting iteratively, since we can build upon our improved understanding.
Recruit with an agency
Recruiting participants through an agency costs money but saves your work. It also means that you relinquish control of recruiting details. You provide the agency with your recruitment criteria (also known as screener ), how many participants you need, and when you want to conduct the research sessions. The agency will get back to you and tell you the cost and an estimate of when they will have found your participants.
Agencies usually have databases of possible participants. They filter their databases according to your criteria for the desired participants and will talk with them to find a time that works for them. The agency will typically get in touch with you after a few days and give you a list of names, times, and contact details of the participants.
Each recruiting agency is a little different, but they will tell you what they need—and they can answer your questions if you are unsure about something.
Recruit by Yourself
Recruiting by yourself might be needed when you do not have the budget to pay an agency or when it is easier for you to find participants than it is for an agency—for example, because you are familiar with the group of people you would recruit your participants from.
Let’s see what needs to happen for people actually joining your research:
- They know about the possibility of participating in the study.
- They are motivated to actually participate.
It is motivating for potential participants when the research improves their lives: A shopkeeper will likely be interested if you work on making it easier to keep track of bills; neighbors will be motivated to help when you try to make living in the neighborhood better. Another important factor can be being reimbursed for time and effort.
When you know what you can offer to potential participants, you can write down what they can expect when they participate. This includes:
- What the research will be about
- How much time it will take to participate
- What the research will be like/what you will do
- How the research results might benefit them or others
- What they get as an incentive
You can use this information to reach out to potential participants.
After speaking to the team you learn that you could recruit potential participants through the company’s website. When talking to a web developer in another team, you find out that the company could add a small recruitment banner to existing content and limit showing it to the geographic area you are located in. So you ask them to add to all recipes of the “Beginner” category a little banner that says: Participate in a study on cooking and recipes This leads to a page that says this: We would like to learn more about how people use smartphones and tablets/iPads for recipes and for learning to cook better. We’re looking for people who do not yet consider themselves cooking enthusiasts—so if you are still learning, that’s not only fine with us, but actually helpful! In the research, a member of our product development team would visit you and look over your shoulder while you cook. This would take approximately 1:30h. If you like to participate, please fill out this form: [contact form]
In the previous example, it was easy to reach out to participants because they were already using a product of the company you work for. But sometimes, field access is harder than just putting up some notes or banners. Often, this is because you actually don’t know where to find potential research participants yet. In this case, you first need to do some research to find them.
Here is an example for a scenario where accessing potential participants is more complex: Working with an NGO on using citizen science for environmental protection, you want to find out how people use freely available data on air pollution data, published by the city administration. However, you don’t know anyone who does work with such data. You give it a try and post about your research project on Facebook. A friend of yours answers. He happens to know that a local hackspace is hosting a bi-weekly data for good -meeting. The friend sends you a link. On the linked page, you find the meeting organizer’s email address. You write them an email and ask if you could join the meeting and introduce your project.
In the previous example, I outlined a step-by-step process of reaching out: In each step, you try to be referred to a next person who is more knowledgeable and familiar with the people you want to do research with. You do this, until you are referred to possible participants.
At each step, you can learn how to approach the next one: If your friend refers you to a meeting of data hackers, that friend can probably also tell you how you should present yourself and what you should avoid doing. Implicit rules are also relevant: For the hacker meeting, it might make sense NOT to wear a suit. In other places, the smart clothes might be helpful.
Some people who could help you are in a position that allows them to give or deny you access to potential participants. The ethnographic jargon for them is gatekeepers . They can decide to help you and let you through the metaphorical “gate” to your research field and your participants—or they can stop you, if they have reasons to do so. In the preceding example, a gatekeeper could be the person who runs the “data hackers” meetup or the person being responsible for the city’s open data initiative.
Once you have found people who would like to be your research participants, you can ask them if they know others who would also like to participate. This is also called “snowball sampling”.
In any case, it is useful to consider different ways to get to your participants. If one way fails (for example, friends of friends), you may be successful in another (such as writing a mail to a contact person of a community). In case several approaches work, you get more potential participants. But more importantly, you now have a more diverse group of people, leading to richer results.
Invite participants to the research sessions
When you have found people who want to participate, you can schedule the research sessions with them. If you are recruiting with an agency, the agency can do this for you, but since there are varying levels of support from agencies and because you may be recruiting by yourself, I will guide you through the whole process.
Let participants know what to expect and ask for their consent
To help attendees decide whether to participate in the research session, share information about what to expect and what you’re going to do with what you’ve learned. After the participants are informed about the project, they can decide to give their consent by signing a consent form.
However, treating it as just a form-to-be-signed hides that consent and the information given for it are a vital part of the communication between researcher and participant. You should shape the process of informed consent so that the participant is always in charge.
You should share relevant information and ask for consent early on. For examples, you can send the information about your project and the consent form a week ahead of the research session. This is better than presenting the information and consent form the first time at the beginning of the research session, with the clock ticking and the researcher expecting a “yes” gives the participant little autonomy, although it might suffice legally.
When preparing the information about the research project, I usually include the following information:
- What the research is about
- What the research will be used for
- What the research will be like
- If there are any risks that I am aware of
- How much time the research session will take
- What the participant gets in return
- That the participant can ask me at any time if they have questions about the research and a contact to do so
- How they can consent (that is, should they sign it on paper? Send me a mail?)
In the following example, keep in mind that the correct way for your research may look different.
Hello [Name], You said you were interested in taking part in a study. My team and I are trying to learn more about how people use recipes on their smartphones, tablets, or iPads. The research sessions would take place in your home and take about 60-90min, at a time when you will cook. It is very important to me and my colleagues that we do not test you in any way. There are no wrong answers or wrong approaches. There are no known risks of this research, but still: You can end the research session at any time without giving a reason. You will still get the compensation. I will record our conversation, which will help me to focus on our conversation instead of taking notes. I will only use the recording to supplement my notes. I will be the only one accessing the recording. What I learn from you will only be used to improve our products and nowhere else. You can ask the researcher questions during and before the research session. You can contact them under: [email protected] I have attached our consent form to this email. Please fill in the date and sign it with your name and send it back to me.
If signing a paper is not possible—for example because you are doing the research remotely—you can also ask the participant to send you an email with the text, “I have read the forms attached” or by having them write their name in a shared document or something like that.
With the consent information and form, I also send out a short survey.
At the beginning I usually ask which pronouns they prefer. This helps in the research session to address people properly and to represent them faithfully in the research results. You may think that you can guess people’s pronouns correctly from the name they used in a contact mail or from their appearance. But guessing by looks and getting it wrong can be embarrassing for you and hurtful for the participant, and guessing from name has its limits, too. Some names are not clearly gendered, particularly if you research across different languages and cultures. For example, Andrea might signify female gender to you, but people from Italy would expect it to signify male gender. So, it is easier to just ask.
Asking for pronouns What are your pronouns? He/Him She/Her They/Them Self-describe: _ _ _ _ _ _ _ _ _ _ _
If there is no obvious risk associated with the research, I also ask how they want to be referred to in the study results. I usually give the choice between “Pick a name for me” and a free text field for their name with the note that it does not need to be their legal name.
Self-defining option for one’s name How would you like to be named when I talk about you in the research? Pick a name for me (pseudonymous) I would like to be named as: _ _ _ _ _ _ _ _ _ (can be legal name or a nickname or any other name you like to used)
In many cases, it can be helpful to check for basic demographic variables too, like age ranges or where they live to ensure that your research is not accidentally excluding certain demographics. What is important here depends on your research topic. When you research in higher education, for example, you might want to ask if a person’s parents have already attended college; if you research around mobile apps you might want to know how familiar a person is with certain technologies, and so on.
Tip: Creating surveys, even if they are short, is not easy. If you know people who have experience with this, ask them to review your questions. If not, you can find best practices online that demonstrate established ways to ask commonly used questions.
Setting the date and time for the research session
If you recruit through an agency, they will usually take care of the coordination for you. If not, it is up to you to ensure that participants remember the time and place to meet. The following are some relevant aspects to keep in mind:
- Be clear about time and date : Even if it is a bit awkward, I try to be very clear about time and date. I mention the day of the week, day, month, and time in my mails or phone calls. If I research internationally, I also mention the time zone I talk about. In an email, that might look like: I could meet you on Monday, the 8th of November, 1pm (“Berlin time”/CET) . Sending a calendar invite is also helpful as the calendar apps automatically convert times, and it makes it easy for participants to set a notification.
- For remote meetings, be clear about the technology used : Most video chat software runs also in any modern browser, so people do not need to install a special software. Let participants know how they can join the call. If you use a software you are not familiar with, give it a test run first.
- For real-life-meetings, find out if there are any special requirements : Places have their own rules in many cases. I share what I expect with participants, so they can fill me in if the expectations would not match: “I will come to Big Street 6 and ring the bell for ‘Miller’” and maybe they tell you: “Oh, right, the bell has the name of my flat mate, Nguyen. So, ring there.”
Getting clarity on date, time, technology, and place helps you start the research session without problems when time comes. In the next section, I want to cover some less obvious issues. However, they can have dire consequences, and it is important to consider them.
Bad things that can happen—and how to prevent them
Research should yield helpful results, but even more importantly, it should not cause harm to you or the participants. “Harmful research” probably conjures up images of non-consensual experiments in medical research which feels very far distant from the research you are doing. But your research can also cause harm. By considering possible risks and avoiding or mitigating them, you can research ethically and in a way that does not harm you nor the participants.
Preventing harm to participants
As a researcher, you have experience in doing research and you can determine how you carry out the research. Participants have no experience in being participants nor can they easily control how the research is conducted. This makes it essential for you to plan ahead to prevent harm and make the research a good experience for your participants.
Participants should be well-informed and feel prepared before the research, they should have a good experience when they are in the research session with you and there should be a positive outcome for them afterward.
The participant does actual work to help you learn. They take time to participate in your research, keep that time free of other commitments, take care that they are there on time and last, but not least, they also do share knowledge and skills that often take a long time to acquire. This work they do should be honored. Paying them is one aspect of this. Another is to use the data well and not do research for research’s sake or because someone said that “more participants are better”. In order for participants to judge whether your research is fair for them, you need to share what the purpose of the study is and how you will reimburse them.
Participant autonomy
People should be free to choose to participate in your research and also what to share with you and how. This means that you may not get answers to all of your questions or may not observe everything you like to observe. You have to accept that.
Participant safety
Much of user need research is not particularly dangerous. Nevertheless, research that can cause physical harm indirectly (imagine researching how people navigate in traffic—distractions could lead to accidents) or research topics that are particularly sensitive (for example, researching with victims of crime). The concerns for participant autonomy are particularly important here, as people often know when something will cause them harm. However, they might not act on it in order to be a “proper research participant.” If you research in fields where physical or psychological harm is a possibility, it makes sense to speak with domain experts, particularly those from the group of potential research participants to get an assessment of your plans.
Protection of identity
There are many reasons why participants do not want to be identifiable. They may just do not want others to know that they are “bad at computers.” It also could be that you observe real work processes that are not exactly like their bosses dictate. For vulnerable populations, it might be the case that they have a stigmatized cognition (for example people having schizophrenia) or targets of law enforcement (such as undocumented immigrants). Thus, the identity of your participants should be protected. This can be achieved by not using their usual name but a made-up one and by describing your observations in a way that context clues do not reveal their identity.
For example, pseudonymizing research is a standard procedure: You replace the names of the participants with other names to protect their identity. However, being credited and being shown with one’s own name can also be important and a matter of pride for the skilled participants. In many research projects, I thus give people the opportunity to self-define how they want to be referred to in the research reports.
Note: Laws to protect personal data: GDPR and CCPA There are laws that protect participants’ personal data in many jurisdictions. The most relevant regulations are probably the California Consumer Privacy Act (CCPA) and the EU’s General Data Protection Regulation . There are differences between them, but their basic idea is to give people control over their personal data and what can be done with it. This means that data can’t just be collected, stored, and used for whatever a company likes. Data needs to be collected for a specific purpose and then used for this purpose only. In addition, the personal data needs to be deleted again if it is not needed anymore or if former participants request it to be deleted. Personal data can be the person’s name, but also their email address, their age, and their gender. You use such data to get in contact with participants and to process incentive payments. Before you collect such data, you should have a plan for how to delete it. The organization you work with might also have faced similar questions before and a concept for handling personal data is already in place.
The safety of participants is essential. However, do not forget that research might also carry risks for you as a researcher.
Preventing harm to yourself
Just like the participants, you should not feel uncomfortable during the research. It is okay and professional to avoid research situations that are dangerous or just feel dangerous. Err on the side of caution.
In some situations, it may be safer to research together with another researcher or a colleague who likes to assist you. This way, you so can look out for each other. It is very common to have a main researcher and a note-taker, anyway. It is also fine to arrange to meet at places where you feel safer or to shift a meeting online so that both sides can call from whatever place they feel fine at.
Only a fraction of research topics are inherently debilitating, but in some projects, you might hear sad or shocking stories from participants. For example, if you are researching for a hospital you might hear about shocking diagnoses from participants. If you take on such a project, consider whether you are ready for it. It is professional to know your limits to refuse the job. If you are reading this book, you are probably a beginner in user research and may want to gather research experiences before researching inherently difficult topics. Personally, I would only take on such projects if I could collaborate with subject-matter-experts since there would be high risks for me and the participants.
Regardless of the topic of the research, it is important to take the time to process what you have learned. If you are conducting the research with other people, do a joint debrief after the research session and talk about what you learned. Hearing something sad or irritating can happen even with very mundane topics. Talking about it helps you to put it into context. Debriefs also jog one’s memory and you can use them to supplement notes without haste.
Beyond individual harm: Ethics of project outcome
Research can be a lot of fun and make you money. It can also be immensely motivating to be involved in the development of a new product. The culture of the tech industry is driven by the idea of being a force for good by creating greater efficiency, information, and connections with the technologies it introduces. User research is often part of creating these technologies—and what we enable with our research is also a question of ethics.
The technologies we help to develop also might do unjust things more efficiently, they might encourage the spread of false and inflammatory information or destroy existing social fabrics. User research can advance such developments, too. For example, research into people’s ideas of good social relationships can be used to make them spend more time on social media. Such research can be done perfectly ethically by itself, but its outcomes might not be ethical at all.
You too have to pay your bills and in many cases, it will not be possible only and always research on projects you are 100% aligned with. But be aware that technology has social consequences and that your research can be part of building that technology.
Write your cheat sheet
A cheat sheet is a little memory aid that you can take with you when you collect data. Most of the cheat sheet will be topics you want to explore and the questions that you want to ask.
Recipe use research cheat sheet User Code:_______ , Date: ________ Tell the reason for research: Learn about how people use their smartphones and tablets when cooking. Tell how the research session will be (asking, listening, observing; 60-90min) Ask to read the consent form again and sign if OK Intro [mutual introduction] “Can you tell me a bit about how and when you cook?” “Can you tell me about your use of recipes?” …
When writing the questions, start with the general topics and progress towards more specific ones. This is the order that makes sense over the course of a research session. Nevertheless, the sequence of questions is just a helpful guess. You will usually deviate a little (or a lot) from your cheat sheet.
I often include a checklist on the top, especially when it comes to legal matters, such as signing a consent form. That way, I can check off what I have already done and immediately see if I have forgotten anything.
You may be wondering about the “User Code” in the previous example. When I do research, I give every participant an identification code that can be used in place of their name (like “User2”). Later, when you publish the research, you want to retract all names and other identifying information. Such code allows you to identify participants without their names. This is useful for maintaining participant privacy. If you need to keep the names, you can keep a separate list that matches participant codes and legal names. This way, you can revert the codes if necessary. An alternative to codes is to ask participants how they would like to appear in the (published) research.
The cheat sheet is a tool that will support you during the interview and help you when your mind goes blank for a moment. It is not intended to ensure that you ask all questions in the same manner and in the same order. Rather than controlling the situation, qualitative research emphasizes exploring the situation. If the participant does or says something that is new to you, use it to learn, and feel free to come up with new questions that are not on the cheat sheet.
- Define what you want to learn in the research project by formulating your research project question .
- Define what you want to learn from participants by writing your research session questions .
- Get to know the field before you go there by desk research and asking experts.
- Recruit based on activities, not demographics.
- User need research is in-depth, with few participants.
- Pay users for helping you.
- Prevent harm by assessing the risks the research itself could pose to you and participants as well as the harm a product your research is helping to create could do.
- Write a cheat sheet with the questions you want to research, and what you want to observe and ask.
Learning from research participants
- Preparing your research sessions
- Observing, listening and co-documenting with research participants
- Collecting data for later analysis
You have prepared your research, arranged a meeting with a participant, and informed them of what to expect. Now you are ready to learn first-hand about the participant’s motivations, activities, and problems by meeting them, listening to their stories, and observing their work.
This chapter gives you guidance of how to learn best from your participant. A large part is about asking questions and guiding conversations. You are also interested in what people do . To learn about activities, your conversation is mixed with participants demonstrating their work. You take notes and pictures to aid your memory. Participants can take an active role and document their work: You can involve them in drawing diagrams of processes or social relations, to document their work together. At the end of the research session, you will summarize what you learned and give the participant an opportunity to ask questions. After the session ends, you will complement and organize your data. Only then is the research session over.
It is a common misconception about user research that it is asking what people want or how much they like a feature. But your research won’t delve into future ideas and designs—you are not going to ask “do you think that [a gadget] would help you?”
It is hard to guess if an imaginary thing would be great to have in the future. Instead of working with product ideas, you will learn the how and why of your participants’ activities. This allows you to evaluate your ideas (“Are my ideas consistent with what participants consider essential?”) and get inspiration for new ideas (“how can I support this activity?”).
See your participants as competent in what they do: they are experts in their daily work. This goes against the notion that people “don’t get it” and need help from designers and programmers. Assume participants have a reason for doing their work the way they do it. If you’re wondering about the actions of the participants, find out why they act the way they do.
Before you learn from the participant, let’s go over what you need to prepare.
Set up the research session
Preparing the research session prevents later problems. Send a reminder to participants and have your recording equipment ready.
Remind participants
It can be helpful for you and your participants to send a short reminder mail to participants the day before you meet them. (If you recruit via an agency, they might do it.) Here is an example:
Hello Sarah, I look forward to meeting you tomorrow at Small Avenue 123 at 12:00pm. If you have any questions, please feel free to reach contact me. Jan
If you are coming with a research partner, let the participant know, so they are not surprised if a second person comes. Also tell the participant know your research partner’s name and pronouns, so the participant can address them properly.
Prepare your note-taking and recording equipment
To collect data, you should have your recording equipment ready. This is what I usually bring along for in-person meetings:
- Printed Cheat sheet (I described how to write a cheat sheet in a previous section)
- Paper on clipboard : You might need to write on your lap or while standing.
- Pens or pencils : Whatever you like to use. If you plan to sketch or co-document with the participants, take some felt pens in black, red, and green along.
- Audio recorder : A simple device for about 50€ is sufficient. It should connect to your computer via USB or take micro SD cards, so you can transfer the files on your computer easily. More expensive models, like a Zoom H2 , have better microphones and more settings. You can also record with your phone if the quality is fine for you. Test it beforehand in an environment similar to where you will hold the research session.
When you meet online, the tools are different. In this situation, you should have the following prepared:
- Video-conferencing app : There are many of them. Which one you choose depends on your organization, potential legal restrictions (like GDPR ) and participant preferences.
- Headset : Often has better sound quality than the built-in microphone. If you want or need to use your built-in microphone, check how audible keystrokes and mouse clicks are—on some devices they drown out any other sounds!
- Printed cheat-sheet : Opening it on your computer would take up screen space that you might want to use for the video chat and notetaking.
- Writing on paper or computer : Both writing in a text file or writing on paper is fine. If you can touch-type, you can write notes and look at the camera.
- Whiteboarding-app : Whiteboarding apps like miro, mural, or tldraw are a remote equivalent to pens and sheets for collaborative activities. They’ve improved a lot in recent years, but ease of using pen and paper is still unmatched—your mileage may vary, especially for people who are not familiar with such tools.
Brief your research partner
If you are conducting research with a research partner, you should have a conversation about what you are going to do in the research session, how you want to divide tasks, and what you both should be aware of. Your research partner should also know when and where you are going to meet for the research session itself and if they should bring equipment.
It is common for research partners to be new to user research but curious about it. If your research partner does not have experience with user research, it is best if they start with supporting tasks like taking notes. In a later section I explain how to take notes, sketch, and make photos and audio recordings. It’s also good to show your research partner an example of notes from previous research. It may be unusual for them to make detailed notes instead of summarizing strongly. For example, they may only write “Likes the software” when the participant talks for a couple of minutes how they like to use a product. An example easily shows what you think the notes should look like.
As your research partner gains experience, they may take a more active role from time to time. If you think that your research partner can and should ask the participant questions, tell your research partner—otherwise they may not. Remember that, if the research partner takes an active role, you need to take the notes.
How to start the research session
When you arrive at the location you do the research at, greet the participant and take care the both you and your co-researcher (if present) are introduced to the participant. Usually, a short bit of small talk will follow. This is pretty normal and it happens intuitively. It helps to build trust and to get used to the research situation. But after a brief time both you and your participant will want to get started with your research session proper. You can initiate this by saying something like: “So… I’m happy that we can do this and that you could free some time for showing and telling me about your experiences with cooking with online recipes.”
Give some context of why that is interesting to you: “We are thinking about improving the usefulness of the recipes that we present to people. We have some enthusiasts in our community, but also a lot of people who do not consider themselves particularly good at cooking and we are wondering what we could do for them.”
Explain that you are here to learn—and not to judge the quality of the participant’s work: “…that’s why we would like to know more about how you cook and how you use recipes or videos for it. This is not a test. No matter if you cook elaborate meals or not: You are an expert in your kitchen, you know best what you need, and we like to learn more.”
Although you may have already described the time frame and the research method when recruiting the participant, tell them again what you will do: “We will talk about your work and will ask some questions. In addition, I’m interested in watching you cook. This is, as we talked when we had contact via mail, why we came slightly ahead of the usual time you prepare your meal. The whole process takes about an hour.”
In case they did not already agree to the consent form via email, you can use a written consent form and explain its purpose and content.
The participant must know how you record data and who will access it, even if they already agreed to recording before via mail. So, tell the participant: “I’d like to take notes, and, in addition, record audio—if you’re okay with that. The recording helps me to focus on your work, because then I don’t have to concentrate on writing everything down. A colleague and I will listen to the audio for transcription; We will anonymize the transcribed data before we share it with the product design team. If you feel uncomfortable with being recorded at any time, we can pause or stop the recording.”
In my experience, it is rare that someone does not agree to being recorded. If that happens, you can ask politely if they have any specific worries—they might agree when they have additional information about how the data is used and handled.
This is an example form an in-house research project, where I visited a programmer from another department in a larger company. After explaining the process, the participant said this: Participant : “Audio recording… I’m not sure…” Researcher : “That’s fine with me. May I ask what worries are?” Participant : “Hmm… yeah, aren’t you from HR?” Researcher : “I understand your concern. It is fine if you don’t agree to the audio recording. I can assure you that HR is a separate department. We work in the product department on internal tool, that is, we help to improve the applications you use to do your work. We do not share personal data and what we record today is not accessible to them. Also, any data that leaves my computer or the one of my colleague is anonymized, and we remove any data that points to you as person, including the names and so on.” Participant : “Oh, sure, them… I just assumed you were from HR and wouldn’t have liked the recording thing, you know.” It could have happened that the concerns of the participant were not resolved by me clarifying that I am not from Human Resources. If they were still fine with the research, but not with the recording—so be it. We would have taken notes instead: It’s their choice.
It goes without saying that it is important that you accommodate the participant’s wishes and respect their agency. There may be situations where the participant, for example, hesitates to respond or seems uneasy, possibly because of a question or a request of yours. Do not push them if they seem uncomfortable, even if you want to hear their answer. Offer them a way out of such situations if you unintentionally caused one. You can, for example suggest an alternative task or say that it is fine not to answer and go to the next question. The well-being of the participant is your primary concern.
Note: Dealing with difficult situations Most research sessions go smoothly—but if you are worried about being offhand in a sticky situation, I recommend “The Moderator’s Survival Guide” by Donna Tedesco and Fiona Tranquada: Bite-sized, actionable advice for all sorts of researcher problems.
Now you and the participant are ready to move into the conversation about the topics you want to learn about. To do this it’s helpful to consider how you can learn from the participant.
Methods to learn from participants
You can engage with participants in several ways: listening, observing, and co-documenting their activities. Each method has its own strengths, and provides insight into different aspects, so it’s common to combine different approaches.
Listening and asking questions
A common way of learning from a participant is by asking questions and listening to the participant’s answers. Aim for rich, story-like descriptions that about the user’s motivations, activities, and their context. To encourage the participant to provide such story-like answers, you often need to ask for descriptions of an activity and the reasons for doing it. So, your questions may be something like this: “Can you tell me why you chose this recipe?” or “You said you will brown the onions—how do you do that?”
Asking questions and getting answers from a participant is a very versatile tool. It can be done without many resources. In addition, you are not tied to a specific place, and you can talk about both past events and future plans.
However, it can happen that you hardly focus on actual experiences and instead talk about events in the abstract. Observations are therefore a good complement to asking questions and listening.
Only listening to people might not be the best way to understand what they are doing. Just like a picture is worth a thousand words, it is often helpful to ask participants to show what they talk about and to demonstrate how they work. Frequently, it is also easier for participant and researcher alike.
As you observe, you can notice things your participants would never consider to mentioning, because they’re second nature to them: The tools they use, how they apply these tools, and which problems they meet. But you can observe it. You also can learn about the context of their work, like means of communicating with colleagues or cues in the environment that point out problems—for example quick fixes on devices using tape and cardboard, or added instructions on machines.

It is not necessary to have observation as a separate step in the research process. It is best to interweave observation with asking questions and listening. For example, you can ask for a demonstration instead of a description.
If the participant tells you: “So, as I have the recipe opened here, and read through the list of things I need, I would now start getting out the ingredients” you could suggest: “Great—if it’s fine with you, let’s actually do that!”
Think of yourself as the participant’s apprentice. The participant is the expert who can teach you some of their skills. This means that understanding the participant by observing is not a passive process. Like an apprentice, you can and should ask questions.
You can ask about reasons , for example “You did measure the weight of the flour on the scale, but the for the water you just used a cup. Why?” Or ask about things you notice in the environment , for example: “Are there certain things you do at specific places?”
Teaching an apprentice is not a theoretical or artificially set-up process: The tasks you observe should be tasks that the participant is actually doing (and not something set up for you).
If the participant asks you “What should I do now?”, you can reply with “What would you do if I would not be here?”
Of course, what you observe should also be relevant to your interests. The conversation could continue in this way:
Participant : “I would either start to make this stir-fry vegetables, or actually, only heat something up for lunch and rather make some apple crumble for dessert” Researcher : “If you don’t have a preference, I would be curious to see how you make the apple crumble—I have not seen how people make dessert in our research, yet!”
From time to time, you might observe actions that seem wrong or at least not optimal: People might seem to ignore a feature that could make their work much more efficient, or they just never use a product that you focus your research interests on. Remain curious and don’t be judgmental. If you start judging and even possibly “correcting” their practices, you close yourself off to the reasons for the participant’s actions. Also, your participant would stop being open about showing you how they work.
Participants are experts in their work and have a reason for what they do. Maybe they do not want to be more effective because it would mean that their superiors would increase expectations, leaving no wiggle room for everyday contingencies. Maybe they routinely prevent situations from happening where they would need a certain technological solution and thus have no need for it.
Co-documenting
You can also document the work with the participant directly. I call this co-documenting because both you and the participant document some aspect of the participant’s life directly through drawing and writing. This can be as simple as asking the participant: “Draw a floor plan of your kitchen. Please highlight what is important for your work and write why!”
Here are examples of co-documenting results. Most of them are based on a template that guides the participant. To document the context of the participant, you can use a social space map as shown in the following figure . The participant is in the center, and they add who is relevant for them. Many participants do not limit themselves to people and might add institutions, roles, or technologies that are also important to them.

The timeline-diagram in the next figure is great for getting an overview of which parts of a longer process participants like and dislike.

The timeline-diagram usually covers a longer period of time from a bird’s eye view. Often, you also want to know details about a process. To do this, you can use a recipe-like list of steps, as shown in the next figure:

If you have the documentation in front of you and the participant, you can easily improve as you create it. You as a researcher, can refer to the documentation and ask for elaboration (“Is this the cupboard where you keep the ingredients?”).
The fact that researcher and participant both need to understand the documentation is a check against unclear terms, vague references, and sloppy handwriting. This makes the results accessible and useful.
A situation in which this is relevant could happen like this:
Researcher : “The line here seems to indicate that you were very happy at the beginning…” Participant : “Yes, the recipe just looked awesome, I really wanted to try it” Researcher : “Can you write this in the diagram, so I can understand it later?” Participant : [Writes as comment in the diagram] “Recipe looks awesome!”
Who does the drawing and writing depends on what is more convenient and provides more interesting data. When researching workflows, I write the documentation as a researcher, because the participant should be able to demonstrate their tasks directly, which is difficult when you have to constantly switch between demonstrating and writing. When the participants document a project on a timeline, they draw it directly, and I only ask questions.
For some participants, documenting their work by drawing and writing can be a bit unusual. It can be helpful to show a simple example of what the result of a co-documentation. The example can also reduce anxiety in drawing related tasks—some people assume they need to produce a work of art. Showing that a rough sketch is okay will help them to get started.
Tip: Try creating some diagrams about your work to get a feel for it. Select an activity and choose a diagram to document that activity. Review the result: what could it tell another person about that activity? What does it not tell? Try another diagram type for the same activity: where do both diagrams convey the same information? Where do they differ?
It can be easier for the participant if you provide a template instead of a blank page: It provides a basic structure. The template should have fields for name, date, title, and space for the participant’s diagram. Sometimes, I also print a small example in a corner of the template. The following figure is an example for a template that I use for timeline diagrams.

Co-documentation works well in combination with interviewing and observation: You can co-document workflows in combination with observing the workflows, or you can transition from interviewing to co-documenting a specific aspect (“That is interesting! I would like to remember it clearly later on, so I would like to write the steps down with you”) later, you can use the documentation to refer back to it (“You wrote… How does relate to…”) and add further details.
Co-documenting via lists, diagrams, and drawings may seem unusual at first. But they produce very useful and easy-to-interpret data by having the researcher and the participant work together. It can empower the participants that they do not only actively show and tell but also take part in recording.
Ways to capture data
Without recording data, you need to rely on memorizing what you saw and heard. As there is a lot to learn from participants, it makes sense to support your memory by capturing data in writing, photography and audio recordings. What you record is strongly connected to how you engage with the participant: A conversation lends itself to notes and audio recording, the work process to sketches, diagrams and maybe even short film clips. However, there is not a 1:1 match of a way to learn from participants and ways to record data: Sometimes a verbal description is helpful for an action focused activity, some people might record a conversation in a more diagram-like form to see central objects and conflicts.
If you have a research partner with you, it is a common division of labor that the research partner focuses on the recording. However, if needed, they can ask for clarifications as they may notice gaps in the data they record.
Even if you have a research partner taking care of the recording, you should be familiar with the equipment. It may happen that they are late or get sick, so you need to record the data yourself. If you have the opportunity to work with an experienced researcher, you could also take on the role of research partner and focus on recording.
Before you take photos or make an audio recording, ask the participant if they are okay with this.
Notes and sketches
While you observe or listen to the participant, you should take brief notes. It’s a bit like taking notes at school or university: you go into the gist of what’s being said in as much detail as possible, but you don’t write down the exact words (unless you personally find a particular phrase important). One utterance or observation concerning one topic goes in one line, bullet-point style.
When you’re looking down at your notes and are thinking about what to write, listening and observing don’t work well. Try to keep it as unobtrusive as possible. If you don’t care too much about your handwriting, you can write notes without much looking at the paper except for some occasional glances. When you do the meeting remotely you can do notes by handwriting, too, or use your computer. Just check for keyboard noises—they can be annoying, even if you use a microphone.
Taking notes alongside other activities can be challenging. That’s why it’s good if you have a co-researcher who can help you: One person can ask questions and guide through the research, the other person takes notes. Both observe and listen.

If you record audio in parallel, you can be more relaxed when writing what was said. However, you still need to take notes to record what you observed. Participants will also point to things and refer to them as “it” and “that”; without notes it can be difficult to reconstruct what the participant was talking about. In the previous example notes , I used little sketches to record what the participant was doing.
When taking notes in research, I often write about 1 page every 15 minutes. That’s why notes of a typical session won’t fit a single page or on the margins of your cheat sheet.
After data collection, you complete, transcribe, and analyze your notes. Between gathering the data and reviewing your notes, it is easy to forget the context.
For example, if you observe that someone tastes a bit of their dish and then adds a small amount of sugar, you might just write “sugar”. It could make perfect sense at the moment you write it, since you are watching what is going on, and you know what happened before and after. But without this implicit knowledge of the situation, the line “sugar” does make little sense. Instead, write something like “Tastes → Adds a bit of sugar”. It will help you a lot later when you read your notes.
Your observations will be visual and related to processes. A good way to support your memory of observations is to create sketches or small process diagrams.

It is not important that your sketches look realistic. Realism is better achieved by cameras. Take advantage of the fact that sketches are different from photos: Enlarge what is relevant, leave out what is irrelevant and make annotations with arrows and notes on what was happening.
Taking photos
Taking photos is easy and can capture a lot of information. For example, you can photograph the participant’s kitchen to aid your memory. Later, you can go back to the photo when you read your notes. Where was their fridge, where was the stove? Where did they put used utensils and cutting boards?
You can also photograph screens of computers and gadgets if you have the participant’s consent to do this. A software-based screenshot might, in theory, be superior—but if the user does not know how to take a screenshot, a camera is a handy way to capture the screen.
You should be able to take photos with your camera or phone quickly and reliably. Use a device you know. The only setting that I use is the exposure compensation. This function is useful when the automatic setting for exposure fails you and an important part of the image is totally dark or disappears in light. Exposure compensation allows adjusting for that.
Recording audio
I recommend using audio recordings—it is a useful complement to your notes. Audio recording allows you to listen to what was said in the research session.
Audio recordings are not a perfect capture of everything that happened: If the participant points to an ingredient or utensil and refers to “this”, the recording is not much of help. People use such expressions a lot when they talk about activities, so you need your notes to complement the audio.
Photos and audio records complement notes and sketches well. They are, however, not superior to manual recordings: They are different, and you can use that difference to combine their strengths.
Assure and encourage the participant
At the beginning of the research session, the participant may feel insecure. Most people do not have experience as research participants, so they might be concerned about doing something wrong or unhelpful. To make the participant feel comfortable, it is important to support the participant and show them that you are interested in their work and explanations.
Affirm that you listen
You ask questions that aim for descriptions and longer answers. This means, you listen to the participant most of the time. You probably have some intuitive reactions that signal that you are listening—like nodding or saying “yes” or “mm-mhh”. These are ways to ensure the participant that you are listening to what they are saying.
Asking follow-up questions also shows that you care about in what participants say and do. Follow-up questions can be about topics the participant mentioned or workflows that they demonstrated. You can also summarize what you heard and saw: “So, you said that…”. This allows you to check your understanding and show that you listened keenly—without judging what is being said.
Some participants may assume that you can not learn anything from them assuming you already know about their work. For example, if you are from the company that developed a product they use, they might assume that you know about everything they possibly could do with it. Even if you know the product well, you probably do not know how people use it in practice and what its limitations are in such situations. You can tell them: “Thanks, it can seem this way, but I only create a small part of (Product) development and I am not an expert on (whatever the product is used for). I think I can learn a lot about how (product) is actually used in the real world!”
Make a friendly impression through body language.
Probably, you would not make a bad impression anyway, but let’s go through it nevertheless: Don’t appear angry or stern by frowning and crossing arms and legs. Don’t look careless by leaning back and looking to the ceiling. During the interview, show reactions to what the participant says or does. If you take notes, looking at the participant is not possible all the time—but try to show that you are attentive when you can.
Be open to how the participant works and thinks
In user need research, you want to learn from participants. This is exciting as you have no way of knowing what you will learn. What you learn unexpectedly is often critical to developing your understanding of the participants and to recognizing potential risks and opportunities. However, it is not easy to be open to these experiences. Not knowing what you learn is unsettling. In our everyday lives, we often trade the openness for efficiency and predictable outcomes. To stay open to how the participant works and thinks is a skill that must be learned—but there are some basic principles that can be of great help: Asking open questions, not suggesting answers, and embracing the value of silence.
Ask open questions
Open questions are questions that do prompt longer, descriptive answers. You already read about open questions in the section on writing your research session questions . Open questions can be contrasted with closed questions, which have only a closed range of meaningful answers. Asking participants open questions will lead to concrete and descriptive answers and potentially lead to insights that you did not expect.
I’ll revisit the subject here because only a part of the questions you ask will be questions you wrote down previously. You will also come up with questions that are responding to what you hear or see when being with the participant. It often makes sense to ask these questions as open questions, too.
In order to be able to come up with open questions during the conversation, it can be helpful to have some easy-to-remember phrases that help to ask open questions:
- Starting your questions with “Can you tell me more about…” invites descriptive, longer answers: “Can you tell me more how cooking for a large family is like?”
- Asking “How”-Questions invites description or demonstration of activities: “How do you go about choosing recipes” or “How did you learn what ‘sautéing’ meant?”
These phrases are useful for asking open questions. There are also phrases you might want to avoid as they usually start closed questions.
When it comes to product development, it’s quite tempting to ask “would you…” questions, like “Would you like to bookmark recipes?” Such questions are problematic for two reasons:
- They ask the participant to make assumptions about their future, which is not very reliable.
- They often invite short answers like “yes” or “No”, like “Yes, bookmarks sound good.”
“Is” is another word that often leads to closed questions that are answered with “yes” or “no”: “Is it difficult to cook a risotto?”—“No, not really.”
Tip: Sometimes closed questions can be a stepping stone to asking open questions. “Would you like to bookmark recipes?” points to a relevant activity: About re-finding and organizing recipes. An open question based on this could be “How do you look up recipes again which you liked in the past?”
By using phrases like “Can you tell me more” or “How do you…” you can ask open questions in response to what participant says or does. While closed-ended questions are sometimes helpful, more often they are not. Rephrasing closed “Would you” and “Is…” questions can help you to get more interesting answers.
Do not suggest “right” or “wrong” answers or processes
A common concern of researchers is influencing the participants. One way to deal with this concern is to define how questions should be asked by giving a strict script.
But creating artificially constant conditions would cause you to lose the strengths of the methods described here: Being able to find out about new and unexpected things and gaining understanding of the how-and-why by reacting on the situation. Each participant and their context are different. You can accommodate this by adjusting the research to the context. This would not be possible if you would ask the same questions every time. Being able to react to situations is essential and a strength of the research method.
However, what I think is relevant, is to consider how your own assumptions and wishes can lead to suggesting favorable answers. Such influence in research takes different forms: “This is good, isn’t it?!” Is a very obvious influence, since it as it bluntly expresses what you think the answer should be: a “yes.”
There are also less obvious influences, for example by asking “Would you like a better version of this?”—who doesn’t want something better?! Again, the answer the participant is going to give is “yes”.
In addition to your questions, you could also suggest “right” ways of doing something with direct reactions. For example, if a participant says “I can’t read the recipes on the website, and there is no mobile view to make them readable”, it may be tempting to say: “No, there is!” if the participant did not notice the feature.
Remember, you want to find out what your participant is doing and why. Correcting the participant immediately rarely leads to new insights. Instead, you can simply ask “what do you do then?”, or, if talking about the function itself is important to you, you can ask “What is an example for a website that does it better?”
That being said, if you can clearly help the participant with a simple bit of information, explore the topic and share your knowledge immediately afterward —while not “correcting” the participant: “That was very helpful for me to learn! The team building the website will appreciate learning about such problems. What they assumed is that people trigger mobile view by…”
You may also be surprised or even annoyed by steps or actions in a workflow of the user that seem outright superfluous. Participant : “When I want to share a recipe, I take a photo of the screen like this… and then I can forward the image in a chat” You may think that this is pretty inefficient and be tempted to say “Why don’t you use the share-function or copy the web address?—that would be far more efficient!”
No one does inefficient actions because they are inefficient. Assume that the participant has a reason. Try to figure out what that reason might be.
Again, you could ask: “What’s the reason for you are doing it this way?”—and ask follow-up questions to further explore the issue. For example, they may prefer images because they show directly in chats and can easily be tapped to zoom in, whereas the original website would open in another app.
Don’t be afraid to react toward the participant and what they say or do. Adapting to the situation is essential in our research. But don’t judge the actions or answers of a participant. You are interested in the how and why of their work. When you judge what they are doing as right or wrong, questions that you could explore are cut off prematurely.
Silence feels strange, but it’s okay
Sometimes, the participant takes time to think before answering. Intuitively you might want to fill the silence to help the participant.
Researcher : “Can you tell me what happened after you put the pepper in the dish?” (pause) “…was it okay?” Participant : “Yeah, I think-”
It is tempting to fill the silence with suggestions for the answer. But it can turn an open question (“can you describe…?”) into a closed question (“can you describe… was it…?”) or prevent the participant coming up with their answer on their own.
Try to tolerate the silence. Usually the participant answers within a few seconds. If you notice silence which you want to fill, count to three or five before probing further. Then, ask about the question rather than giving suggestions: “What makes the question hard to answer?” or “Can you tell me what you are thinking about?”
This way, you can help the participant to continue with elaborating on the question you are asking, even if it takes them some though to answer it.
Take a closer look
Early in the research session, you only have some basic knowledge about what the participants do. You know some terms and what they describe. Later, you try to learn how it all connects, understand what the participant thinks is relevant and why, and see and experience easily glossed-over implicit knowledge about activities and skills.
To learn more, you can probe with follow-up-questions, check your understanding, and ask for demonstrations.
When I learn something new, I often have the feeling that this is just the beginning of a larger topic. In this case, I can “probe” for further information.
You already know one way to do this: silence. Just as you might intuitively want to fill the silence, the participant may just step in and fill the silence with further information.
Participant : “Well, I found that recipe and I tried it once, but it was so-so” (Short pause, researcher nods) Participant : “I don’t know what the problem was, I guess something about the timing. Everything was just mushy”
Alternatively, you can also repeat the most recent statement or words the participant has said.
Participant : “Well, I found that recipe and I tried it once, but it was so-so” Researcher : “So-so?” Participant :“I don’t know what the problem was, I guess something about the timing. Everything was just mushy.”
That way, you can help participants keep going without changing course by asking new questions.
If you want to know more about something specific, you can also ask directly: “Please tell me— What would you do if you had to wait?”
Asking directly can be useful if the participant has answered rather vaguely:
Participant : “Well, I try to get some more information and try to find out where it got stuck” Researcher : “Could you describe to me how you would do that?”
If you gather your data by observing or drawing diagrams with the participant, direct questions are very useful for exploring the work.
Researcher : “You added pepper without first tasting or checking the recipe—how did you know it was needed?” Or, when co-documenting with the participant in a diagram: Researcher : “This graph seems to indicate that you were in a pretty good mood here. Could you explain a little bit why you seem less happy here [Points]?”
These methods allow you to gain additional information and show the participant that you are listening and observing carefully. Following up on observations and information is important for learning. However, sometimes you want to check your understanding. Even if everything makes sense to you, it is often good to check if your understanding makes sense to them.
Check your understanding
To check my understanding, I often go back to what the participant talked about or showed me before. I tell them how I interpret a situation based on what I have learned from them and ask them if it makes sense to them. In this case, even closed (yes/no) questions are fine.
Researcher : “You said it looks good, now. Did you think the pasta is ready now…?” Participant : “No, I meant the sauce. It looks good, just like on the picture in the recipe.”
There are several benefits of checking your understanding:
- Avoid confusion and misinterpreted research due to misunderstandings.
- Show that you care about the participant’s expertise.
- Encourage participants to continue and tell you more.
For checking, you need to refer to something that you want to verify. You often need to describe it to the participant:
Researcher : “So: If I wanted to cook something, would you first see what ingredients you have and then try to match a recipe?” Participant : “Yes… I mean, somewhat. It matters. I don’t want things to go to waste.”
To refer to what you learned, use your notes as memory aid, and don’t be afraid to just point at things if you do not remember the correct term. The participant will tell you what the thing is called. For example, you could ask: “Can you tell me more about this does?” (points at a utensil)? Or when co-documenting: “Here (points to diagram) your motivation seemed to change quite quickly—can you tell me more about that?”
By checking your interpretations of the participant’s descriptions and activities, you can avoid misunderstandings and gain additional insights.
Ask for examples
When participants mention an activity or tool they use, ask them if you could observe the activity or tool in action. Seeing an example avoids misunderstandings and offers rich opportunities for further insights:
Participant : “…so I would just use the food processor for that.” Researcher : “Can you show me how you do this?”
This avoids ambiguity as to what they meant by “use.” It is easiest for researcher and participant to look at it together.
You can also ask for examples to dig deeper into a topic. The participant may have mentioned a process before, and you can build upon this and ask to learn more about it:
Researcher : “You said you would look on YouTube how to cut this. Can you show me how you do that?” Or, without asking for a demonstration: Researcher : “…what would you expect to find?”
Asking for examples provides a natural way to show your interest, expand on topics, and to move from a conversation to an observation. Switching methods and topics in your research is important to figuring out what is relevant to you, and that what I will cover in the next section.
We have already built something, why not use it?! When discussing project types in the first chapter , I wrote that user need research should be done early in projects. Often, however, people have already started designing something, such as a prototype or a concept document, and they will ask you if you can’t make this part of your research. You can, but some caveats apply. When you bring up an idea or prototype, steer the conversation towards the effects on the participant’s work. Do not focus on whether they like it or whether they find it useful. I introduce such ideas or prototypes by saying something like: “There are always a lot of ideas floating around. A colleague said they think about…” This reduces the risk of the participant assuming I am excited about the idea and wanting validation instead of learning from them. Then, I show them the prototype or the idea. Sometimes it is working user interface, sometimes a competitor’s tool, sometimes just a few sketches or diagrams. But keep it simple—the gist of it should fit on one screen or printout, otherwise you will only create confusion. After presenting the prototype or idea, focus your questions on how the participant expects it to affect their daily lives. You could ask: “How do you think would this fit into your work?” or “We do not know enough about your field of work, so we were wondering what the impact of such a product would be.” If the participant hesitates, it can be helpful to ask what other people might think: “What would your [peers/team/family…] think about using this?” This is sometimes easier to answer and can yield insights into the participant’s social environment. The participant’s response will help you to learn about their motivations, activities, and problems. For example, they might tell you: “Yeah, this idea keeps coming up. But it will not be used. Just doing it by browsing takes time, but it is fun. I do not want to make recipe selection more efficient!” or they tell you “I currently use Google Docs for this and only mention people there. But I’m having a hard time keeping track of all the feedback I got, and I sometimes wish it would be more orderly” You can then explore the topics deeper and ask: “Can you show me how your process works in Google Docs?” I also had people who directly dismissed or were indifferent to what I was showing. They could easily tell why. This is actually great, as it avoids wasting more time and money on an idea. If you use prototypes or ideas in your research, it should be clear to your colleagues that you do this to learn more about the participant’s work . When people ask you to “evaluate the concept” or “test the prototype” they want to learn about the concept or prototype and should do a usability test instead. Introducing existing ideas and prototypes can help you learn more about the participant and the context they work in. The results can inform you next steps in working on the prototype or idea. This can only work successfully when you and your colleagues agree that the focus is on learning about the participant, not the idea or the prototype itself.
Steer the course of research
A research session follows a structure: like in a film, you get to know the world and the protagonists before delving deeper into core issues. At the end you tie up loose ends and summarize what you learned. In order to navigate you and the participant smoothly from the beginning to the end of the research session, you need to provide guide topics and methods of the research session.
Changing between topics
During the research session, you cover different topics. You can set some topics in advance because you think they are important. In order to use your time efficiently and to learn about the topics that are relevant to you, you sometimes have to nudge the participant in the direction that is interests you.
You may want to switch between topics if:
- There is probably nothing more to be found out.
- You have covered enough and need to move to another topic before time runs out (If this happens, plan in more time in the future)
- The participant is focusing on a topic that is not in the focus of your research.
To switch between topics, you can express your interest in the next topic: “Can you tell me more about recipes that you use frequently?”
Before moving to the next topic, you can end the section by restating what you learned previously: “Let me briefly summarize: […]. So, what would also be interesting for me: You said you have recipes that you go back to again and again—can you tell me about this?”
Switching topics can be particularly useful when a participant gets carried away with a topic that is not relevant for you.: “…there is another topic is important to me: You said you have recipes that you go back to again and again—can you tell me about this?”
To make the change of topics less abrupt, and to show that you have been listening carefully, you can refer to a topic that has been mentioned, but not yet explored: “When drawing the diagram, you mentioned that you would ask your mom about cooking—what is it you ask her?” or “You mentioned that you sometimes prefer printed recipes on paper. What is useful about them?”
By switching the topic, you can cover the topics you need to know about and get your research back on track. But sometimes you do not want to switch the topic, but change the way you approach the topic.
Switch methods
Each method highlights different aspects of the participant’s motivations, activities, and problems. Therefore, it makes sense to transition between methods in your research. By using different methods on the same topic, you can gain new perspectives on it.
(Here is a possible switch from interview to observation) Researcher : “You told me your general process of cooking a meal. Do you think we could cook something now, so I get to see it in practice?” In this case, you already have a description of the activity. By observing the process, you can gain a less abstract, more specific, and contextual look at it.
The methods you use on the same topic can be intertwined. For example, during the demonstration of the activity, the participant may add to their description: “[During cooking]I did not mention this before—I add some annotations to the recipes, in case I found some variant that I like or which is useful.”
Often, a new topic also brings with it a different method. Perhaps, you have heard about motivations of the participant and now would like to explore an activity: “You said you enjoy getting inspiration from browsing the web. Could you show me how you do that?”
Or you might want to talk in detail about something a participant just sketched in a diagram: “In this diagram, you mentioned that it is important to know what foods your kids like. Can you tell me more about what happens when it goes wrong?”
Again, the methods can be intertwined, so that information from one method is brought in when using another method: “Your child would be cranky if they do not like the food, and that easily messes up the schedule… let me add that to the diagram.” I then write “kids cranky:bad” in the diagram, so I can remember it.
Using different methods and switching between them may seem like additional work. However, it can make your job easier while improving the outcome —just like choosing the right tools in manual crafts.
Wrapping up a research session
Research sessions often take place in scheduled time slots. This means you can plan ahead and start to wrap up when you have about 20 minutes left, giving you enough time to tie up loose ends, summarize your understanding and then formally close the session.
Ending the session is like starting the session, but in reverse order. Starting meant moving from the predictable to new experiences; ending a session means moving from the new experiences and learning to a formal end.
As the research session draws to a close, you will want to tie up loose threads: Consider what you could not yet make sense of. Ask the participant for what you still don’t know. Don’t be afraid to express your lack of understanding.
Researcher: “There is one thing that I still do not understand: You mentioned you collect online recipes, but we have not talked about how you store them, to come back to the ones you like. How does this work?”
You may not be able to tie up all loose ends. Focus on what is important to you on and what seems to be particularly interesting about this participant: You may be wondering about how the participants organizes recipes in general, but this participant cooks for their family on a regular basis. You haven’t spoken to many participants about cooking for others, so you could focus on that aspect provided you can still learn more about organizing recipes from other participants.
A good way to guide towards the end of the session is to summarize what you have learned. This allows you to demonstrate what you and the participant have achieved together. It also gives the participant the opportunity to correct you if there are any misunderstandings.
Researcher : “I see that we approach the end of our meeting time. Thanks for giving me these insights into your work. Let me summarize what I learned from you: …”
After listening to what the participant has to say about your summary and taking notes of it, thank the participant for their time and for what you learned. I also let participants know that they can contact me if they have any questions about the research itself or the use of the data and give them my email address to contact me if needed. In my experience, it is rare for participants follow up, and when they do, it’s often with helpful hints or an example for something that they could not easily explain in the research session.
Note: Oh, before you go, something very important! In some cases, the participant might start opening up a new and interesting topic just before the end of the research session. I don’t know why this happens. Maybe it is because they considered the topic to be important but were too polite to push for it themselves and hoped that the conversation would eventually get to the topic. You could expand the session time. It is great to learn more, and it seems that the participant would like to let you know about this. However, it might also expand the time beyond what the participant gets incentivized for or what they actually planned. The best solution is usually to ask the participant openly.
After the research session
After gathering data, we need to take care that we can use the rich data in our later analysis. To get the most out of your data, you should complement your notes, sketches, and diagrams and add some information about the context of the data gathering to fill gaps and to help you to organize the data.
There are two ways to complement your data: From memory and from audio recordings and photos.
Complementing your data should be done as soon as possible after the research session. I recommend scheduling the data gathering so that you have some time right after the session to complement your data.
Debrief with your research partner—or alone
In the debriefing you mentally go through the research session again and note important insights or new questions. This is easier and more interesting when you are researching together with a partner since you can share your impressions with each other.
Debriefs can vary in length. I suggest scheduling at least 10 minutes, but for an interesting session, you can also fill 20 to 30 minutes.
There is no set structure for a debrief, but there are some points to pay attention to:
- What was surprising? What led you to develop your understanding?
- What was similar to previous research sessions? What matched your expectations?
- Which questions could you not answer? What are new questions that you have?
- What would you do in the next research session that builds upon these experiences?
Debriefs are helpful to get an initial structure to what you learned. They also provide closure and are a first preparation to both future research sessions with participants and analyzing the data. They have their strongest effects when done with a research partner. Aside from the advantages of exchanging and combining your experiences, they are also a great social experience that gives a sense of mutual achievement.
Complementing data from memory
Complementing your notes, sketches, and diagrams is important: Some data may make perfect sense to you now, but since memory fades, it does not make sense anymore later. Complement and clarify your data, so you can still comprehend them after your memories of the experience are not fresh anymore.

In my notes I have the line “No Milk.” This can mean many things, so I give some context here. I add to my notes: “Needs recipes with No milk because: milk = stomachache. Dairy free recipes: Vegan blogs as go-to-source”.
Similarly, if my writing is rather messy, I rewrite some words to ensure that I can later decipher what I wrote (See the following figure ). I write and draw my complements in another color than the color of the original notes. When I wrote my notes during the interview with a blue pen, I use black for the complements or vice versa, since I like to keep track of what I did in which step of the process.

Using different colors is useful for another type of complement: Ideas or remarks in connection to your notes. When I go through the notes, I often have some ideas for a design or a question that I would like to explore in a future interview. I write them down in a third color, or I prefix the note with “IDEA:” or “QUESTION” to prevent myself from mixing my ideas with empirical data.
Transcribe notes
Because they are often written quickly, your notes will usually be rather incoherent: Single words, small sketches, and longer sentences will all be scattered on the paper.
![Clean transcript. Text: Person looking at the next step in the recipe, reads silently. I ask: What do you think?→ I now need to add the washed lentils. I wonder if I can do this before the onions are done. Looks at onions: I guess that’s fine[→she can make it in time]](https://jdittrich.github.io/images/03_dataGathering_transcribedNotes.png "user needs research")
Tidy your data and transcribe the notes in a digital document. In your digital document, put one statement in each line.
Avoid tying together two separate statements on one line. This needs to be balanced with another need: Making sure that the data you put into one line is meaningful on its own and is not just a single word or a description free of any context and thus hard to set in relation to other data.
Here are notes that are too short and not meaningful on its own:
making space shopping
If there is any way to add the actual context (from memory or by using other notes) these notes should be complemented with that context. This should help to learn why the person made space and why they went shopping. However, there can also be too much content in one line if it covers several topics at once.
For cooking, you need free space in the kitchen, which is often occupied by things, so you need to move stuff around to get the space you need for chopping or peeling vegetables. If they can plan ahead, they go shopping on Saturdays to buy what they need for the coming week, including groceries for cooking. More often though, they go spontaneously, since the supermarket is nearby.
Too much content in each line makes it hard to analyze the data later.
In most cases, you can split lines that cover different observations or statements to multiple lines that still deliver enough content to be understood:
Make free space in kitchen for cooking Chopping, Peeling needs free space. Go shopping on Saturdays for the coming week Spontaneous needs no large problem; supermarket nearby.
The notes from the research session and later added complements from my memory get the same formatting in my documents because they are all data I gathered by listening or observing the participant. But I take care that later added design ideas and research questions are still easily distinguishable from the actual data that I gathered in the research session.
Complement from audio recordings
If you made a recording of your research session, use it to complement and check data.
When the audio contains information which is not in the document or if it complements information that is already there, pause the playback and write the additional information in the document. The process is very similar to complementing your notes from memory.
The audio recording of participant is saying: “I’m kinda lazy, so I like to cook spontaneously and with the ingredients that are just there, you know?” The notes say: “cook spontaneously” So I add the information: “cook spontaneously. Use ingredients that are there. because ‘kinda lazy’”
If you need to save time, don’t listen to the full recording but go through your notes and see where they lack information. Jump to the parts of the audio that might complement these sections.
Pseudonymize your notes
When transcribing your notes, it is also a good point in time to pseudonymize them.
Pseudonymization means that you replace identifying information like names, places, or job titles with placeholders. So, the second user you talked to, “Abigail Miller”, might become P2 (a user code) or “Anna” (a pseudonym). This also depends on the participants’ wishes—some might want to choose a pseudonym or actually appear with the name they usually use. If there is nothing else specified, I use codes.
Aside from names, there might be other data that could identify the participant, for example names of places, institutions, or job titles. If they can identify the participant, replace them with more general placeholders: “Hannover” might become “A city in the north of Germany.”
Note: If you want to know more about pseudonymization, read “Anonymising interview data: challenges and compromise in practice” (2014) by Saunders, Kitzinger, and Kitzinger.
You can’t make pseudonymization absolutely safe. If your research involves people who need particular protection against identification, you also might want to use a more elaborate way of pseudonymization and data protection—explaining that is beyond the aims of the book and research with vulnerable people is not a good setting to get started with user need research in the first place, anyway.
Organize and archive your data
It should be easy to find out later which data was from which participant and how notes, sketches, diagrams, and possible audio recordings fit together.
Take care that all sheets of paper and files have the following:
- A participant code like P1 for the first, P2 for the second participant, etcetera. This way you can later trace back which data belongs together.
- The name of the project and the date. In your next or even a parallel project, you may have another “first” participant, and you don’t want to mix them up.
- The filenames (or the names of the folders they are in) should carry the participant code, project name and possibly the method too, which may lead to lengthy filenames like: LearnCooking_P3_diagram_shopping.png—“LearnCooking” being the project name, “P1” is the participant code, “diagram” is the method and “shopping” (by a client of a design) is the topic which is covered in the diagram.
- You should look for possible interconnections between different kinds of data. Maybe the participant mentioned their “messy” kitchen and you have a photo of it? Add a line in your transcript, referring to the photo. Or the participant talks about the problems of sending data to the print shop and the printing process was part of a workflow diagram you both created? Write a brief line in your notes and the diagram to connect both.
If you take these steps, you can still match project and participants later, and you don’t lose time or data because of some tangle.
As a result of these steps, you now have a transcript of your notes, diagrams, sketches, and photos with possible cross-referencing annotations, participant codes, and descriptive filenames.
After a few research sessions you will get the hang of it: The field you research in feels more familiar, and you can focus more on details and nuances rather than on grasping what people talk about at all. The basic steps for the research sessions however, will remain the same.
After some sessions, it makes sense to start with analysis, as your results in the analysis can inform upcoming sessions. While it is good practice to weave research sessions and analysis into each other, it might not always be possible.
- Introduce yourself, explain how the research will be like and ask for consent.
- There are three types of gathering data: Listening, Observing and Co-Documenting.
- There are four ways of recording data: Actively with notes or sketching, passively with audio recordings and photos.
- Affirm that you listen to the participant: Nodding, saying “uhm” and referring back to what they told you. This shows that you care.
- Be open to how the participant works—don’t impose your own views.
- Delve into topics more deeply by probing, checking your understanding and asking for examples.
- Switch topics and methods to match your research interests.
- After the research session, plan for time to debrief, complementing notes and organizing data.
Analyzing what you learned
- Learning the basic principles for analyzing and making sense of the data
- Making sense of diagrams and sketches
- Analyzing your notes
Data analysis might not sound exciting: You have already learned a lot from your participants, so why not just go ahead and skip the data analysis?
While you certainly have some really useful insights already, the full potential of the data isn’t immediately apparent. Some useful insight become apparent only when previously separate data comes together.
The analysis also gives you the opportunity to reflect and critically evaluate your impressions: Sure, some ideas from your research sessions seem great, but do they make sense in the light of other data?
The previous reasons for analysis focused on you and your insights , but research for understanding potential users is often done in and for teams . When collaborating with others, you need to be able to show how you came to your insights.
Research is often a team effort. Researching together helps to get a mutual understanding about the research. Analyzing together also gives your co-researchers a deep understanding of the research, even though they may not have attended the research sessions themselves.
Tip: You do not need to be finished with learning from participants before you start analyzing the data! It can actually be very helpful to start analyzing as soon as you have collected data from three or four participants. Analyzing the data can help you find under-explored topics. You can then adjust your questions and cheat-sheet accordingly to learn more about these topics.
Data analysis helps you find patterns in your data and establish research-based principles for product development. It allows you to reflect on your ideas and discover non-obvious patterns. The analysis also creates the foundations to show that your insights have a solid foundation when communicating them. Analyzing with others allows teaching collaborators about the research by direct involvement in it.
Commonalities and contrasts
You make sense of the data by constructing repeating patterns and principles from it. A core activity here is to compare data to other data and ask how they might fit together or not. This will help you to spot patterns, point out variations, and guide your research.
This is similar to what you do intuitively when confronted with something new: you ask how it makes sense given what you already know. Let’s say you go through your data and you read, “I cook meals that my kids like, but I’d like a bit more variety” and read another note that says “I can’t just cook anything—I should use the groceries I have already bought.” You can compare the notes and see there is a commonality: Both seem to deal with constraints and choice.
But not everything fits together. Insights can also come from contrasts: The constraints in the preceding notes are different—kids’ preferences in one case, the groceries a person already has in the other. With that in mind, you could create a list of different types of constraints.
The commonalities and contrasts you construct can also guide your research: They help to find interesting questions both to learn from the participants and to analyze what you learned. You could try to figure out how the constraints play out in a broader context: Maybe people are starting to plan for the long-term to avoid constraints? Maybe the person who uses what they have actually takes pride in being good at avoiding waste and the limitation is more of a resource for them?
Understanding your data by interpreting commonalities and contrasts is a fundamental activity in analyzing data. It can lead to insights into patterns and differences in your data. It also can raise questions that require more data or different perspectives to get answers.
Doing the “right” analysis
In “Learning from Research Participants” , I wrote about the issue of influence in interviews and observations. I have said that researchers can’t take themselves out of the research and that their approach has an impact on the results—but also that this is a strength of the method and not something we can and should avoid.
Your impact on the results of the analysis is similar. Even if the same data is analyzed, different people will come to different conclusions. This is because the result of the analysis depends on the reasonable, but still individual and debatable, interpretation of the data: You might think that an utterance like, “I add some sugar here, even though the recipe does not say so,” should be best interpreted as “loves sweetness.” But it could be that this should be seen rather as an expression of “personal creativity” or “need to improve the recipe.” There is no right or wrong interpretation; but your analysis needs to be plausible, comprehensible and based on the data you collected.
Imagine, as a kid, you had a pile of bricks you wanted to build a house with. These bricks were like the not-yet-analyzed data you start with. When you did build a house from these bricks, there is no single “right” building. But neither was it an arbitrary process of connecting bricks randomly.
Building a house from bricks is like analyzing data. Just as there is not one correct house to build, there is no one correct analysis. But it is also not an arbitrary process: There are many, many ways to combine the bricks in some way , but only a few of these ways will result in something that can plausibly be called a house.

What the house will look like in the end is not certain from the outset. You will change designs, move walls, and sometimes try to use the same piece in different parts of the building,

Almost the same applies to your analysis. You will move walls and bricks but will adjust interpretations and organize your data into different structures. As with the bricks, there are many ways to structure the data, but only some of them will create something meaningful to you and others. This creation of a meaningful structure is not set at the start but is a process, just like building the house from bricks. You will try, fail, try again, think it is somewhat okay, find improvements to it and gradually move closer to a structure you are happy with.
A process for making sense of diagrams
In the chapter on co-documenting I introduced (co-) documenting via:
- Lists and flowcharts, for example, the steps required to prepare an espresso.
- Charts, for example, how the mood changes over the day.
- Maps of places, for example, where something is in a kitchen.
- Maps of relations, for example, which people helped you to learn to cook.
Now, we focus on how to analyze them and put them into an easy-to-grasp form. The process has three steps:
Preparing diagrams
Finding commonalities and contrasts.
- Summarizing the diagrams in a diagram of your own.
Note: You can interweave both analyzing diagrams and analyzing your notes. Although I have described the methods of analysis in different sections of this book, you can use one to better make sense of the other.
Annotate the diagrams with potential interpretations to prepare for analysis. For this, you can photocopy the diagrams and write on the copies.
Note: If you like to keep it digital, you can use any application that can add text over images, for example Inkscape .
If you are collaborating with others, it makes sense to distribute the initial annotations among the group. After that, everyone shares their annotations and others can ask questions or suggest additions or changes. In this way you will receive diverse input and a common understanding.
My example in this section are diagrams where people have drawn their process of cooking or baking and what made them feel good or bad about it.

In this diagram, I made the following annotations:
- I highlight sections of the process with rectangles of different colors. In later steps I can see if these make sense in diagrams by other participants
- Early on, the participant was looking for recipes, which caused them ups and downs in quick succession. This is similar to what the participant experiences while cooking.
- Shopping is fun for our participant.
- There is an explicit gap between finding recipes and getting ingredients (I wonder if other participants will highlight something similar?).
- There is a setup phase before they started cooking (Again, will others have this, too?).
- Eating seems to be about as fun as cooking. The memories of the meal are what is positive (The explicit focus on memories is interesting!).
When you annotate multiple diagrams, you intuitively begin to compare diagrams with each other. I describe this in the next section, but in practice, both activities are intertwined.
When you have thought of possible interpretations of the diagrams you have, you can compare them among each other. Do they show the same pattern or do they differ? If yes, where and why? When doing this, you can overthrow or update your initial interpretations and find common patterns as well as highlight interesting features.

When comparing the diagram from the previous section to this the one here, there are similarities and differences:
- The participant here seems to base their decision on what ingredients they currently have at home. This also involves and iteration phase to figure out what to cook, similar to the initial iterations of the diagram in the previous section.
- The process of finding a meal to cook can have small successes and failures—the mood goes up and down. This is similar to “search a recipe” in the previous diagram.
- In both diagrams, cooking is a positive experience.
- Serving the food is the (positive) end of the process; the previous diagram actually ended with a focus on memories of the meal.
This also led to some questions I ask myself when looking at the few diagrams:
- Is the process of recipe selection usually described as iterative and trial and error? (Our two diagrams so far imply such a process)
- What is the last step for other participants? (Serving? Memories? Something else?)
- I am not sure about what happens during “cooking”. Maybe the diagrams are not the ideal way to get details there, but I am curious if there will be diagrams that tell me more.
This is just one comparison of several that would follow.
By constantly comparing what we learned from previous diagrams with additional diagrams, we learn about repeating patterns and possible variations. After comparing all the diagrams we currently have, it is time to summarize what we learned.
Summarize what you learned
You can summarize the results yourself in a diagram. It will look similar to the ones the participants drew. In this diagram, you will include insights that showed in several diagrams. Sometimes I also add data that I can’t necessarily confirm as repeating in the data, but that I find interesting.
Based on the diagrams used in the previous steps as well as diagrams from more participants, I created the following summary diagram:

- I could not find a consistent pattern for the preparation: Some participants did choose the recipe first and then bought the ingredients they needed, other participants chose recipes for the ingredients they had at home.
- There was also no consistency in what they liked or disliked about the preparation, for example, some loved shopping, others disliked it.
- Some participants planned their cooking and prepared it a few days before cooking.
- All participants enjoyed cooking.
- The participants often drew the cooking process with a slightly wiggly line: There were usually little problems or uncertainties that participants needed to solve.
- One participant spoke about a case that went wrong. Although it was only mentioned by one participant, I found it interesting for two reasons: the inclusion showed that processes are not predetermined, and it also showed that errors are not a general error, but are fixed.
By creating a summary diagram, you can present your findings in a form that is quick to grasp and maintains a link to the original diagrams that our participants drew.
I mentioned previously, that you can intertwine analysis of diagrams and notes. In this section I covered diagrams; next I show how to make sense of research notes.
A process for making sense of notes
Your notes are data in written form, maybe with some occasional sketches. I will demonstrate a method to analyze your notes in-depth. In contrast to the methods for analyzing diagrams, this is more complex. However, it is a very powerful method that allows going beyond the data to create meaningful interpretations that can guide future design work.
Organize notes hierarchically
The basic unit for our analysis are the utterances or observations which are usually represented by a line in your transcript. For example, a line in your transcript could be: “I usually try a new recipe when I think its fun and have a reason to bake a cake, birthdays, or something like that.”
You organize these notes hierarchically and create groups that share a common theme. You give each group a title that states the theme of the underlying of data.
Sometimes you will have multiple related themes that form a common theme. In this case, it makes sense to make a group of groups with a title stating the overarching theme of this group of groups.
Here is a part of an analysis showing data organized in themes and sub-themes:
- Data: Sometimes something baking-related pops up on YouTube
- Data: Online news sites sometimes have recipes
- Data: “I wanted to bring a cake for a party of a friend, so I looked for something with chocolate (they like it)”
- Data: “After going vegan, I looked for variants of non-vegan food I liked”
- Sub-Theme: Recommendations from friends
Such a hierarchical analysis could be done in two ways:
- Top-Down: You name the groups and write the titles first, and then sort pieces of data into the groups.
- Bottom-Up: You start by grouping data that appears to have a similar theme, and then give the group a comprehensive title which states the topic shared by the underlying data.
In this book, I will start by describing how to do the analysis bottom-up to develop themes based on data. Later, when you have created some themes, you can use both methods: You develop themes from data, but you also check where and how data matches with already developed themes.
Themes can grow over time as you add notes to the theme. Consider this group:
- Data: Sometimes, something baking-related pops up on YouTube
When I have this note: “I wanted to look up how much lentils go in the soup and while searching for the recipe, I saw a great photo of a chocolate nut cake” , it makes sense to group it under the “Finding recipes”-theme, too.
This is just a simple overview of the process. In practice, you will also spend time sifting through data, rewriting theme titles and may need to take a step back to find a new way to make sense of your data.
Create meaningful groups
I already talked about grouping notes by themes they have in common. A theme is a statement that describes an insight about the notes in its group. It should be meaningful on its own. In this section, I discuss what this means practice and how you can spot themes that need improvement.
One way to group notes and to derive a theme would be to go through the notes and see which utterances and observations mention the same thing or give the same assessment.
Let’s say, you collected this data in our research:
- I just search recipes again online
- My recipes are in this stack of paper.
- When I find a good recipe, I print it and put in a section in this folder.
- I bookmark recipes in my browser.
If you put the notes which mention the same things in the same group, you get these two groups:
- I just search recipes again online.
Organizing the notes by this same things mentioned -method would help us find notes concerned with a specific thing or assessment: If you want to see everything that related to recipes on paper, you can go through the notes in one group; If you would like to know about digital recipes, you could look it up in the other group.
However, organizing by the “same things mentioned”-method has its weaknesses: A theme named “digital recipes” only communicates that the underlying notes are somehow related to digital recipes. You still need to go through the underlying notes to find out what participants did with their digital recipes, what motivates them or which problems they face.
The names of themes created by organizing by the same things mentioned-method are just labels for the content and have no meaning on their own: “digital recipes” does not tell you anything interesting itself. However, you can create themes that stand on their own if you created them based on the insights you can draw from the notes in the group.
If you use the same notes but organize them based on insights, it might look like this:
- Data: I just search recipes again online
- Data: My recipes are in this stack of paper.
- Data: I bookmark recipes in my browser
- Data: When I find a good recipe, I print it and put in a section in this folder.
If you organize notes by themes based on insights about the participants and summarize those insights in the group’s titles, the title is a useful piece of information in itself, like “(Participants) avoided active organization”: The theme is not just useful for accessing the notes in it but an empirically-based principle can be considered when designing.
When designing, a theme based on an insight such as “Cooking is self-expression” can inspire the implementation of functions to present photos of meals, integration into social media and honing one’s skills. The insight that “people often have unique constraints to what they can or want to eat” may lead creating a feature that allows to filter recipes for according to different criteria. The app also would not teach vegetarians skills like deboning chickens, and may provide cues on how to alter recipes to meet individual requirements. If you have a new idea you can ask: “Does this idea follow what is stated in the group titles? Does it violate them?”.
Grouping your notes based on insights about your participants provides great benefits. But it can be difficult and may not be possible for all your data. Therefore, creating groups using the same-things-mentioned method is still useful. These groups may still evolve to insight-based themes. Usually, I have some “same-things-mentioned”-groups in the beginning and far fewer at the end—but my analysis will be a mixture of both styles.
Prepare your notes for analysis
When you create groups of data, it is good to know whether the theme of the group is relevant to several participants or only relates to one participant. To be able to check this, you should provide each note (=line in the transcript) with a participant code. You have already used this code in the section on archiving your data to indicate which participant the recorded data belongs to. A participant code works like a pseudonym: You identify the participant not by the name they usually use, but by a substitute identifier. I use neutral number codes: The first person I did a research session with is P1, the second is P2, etcetera.
You simply add the participant code at the end or beginning of each line. It is not the most exciting work, but it is done quickly: Copy the current code (like “P1”) to the computer’s clipboard (using the keyboard shortcut Ctrl+C ), place the cursor with the arrow keys and the end/home keys on your keyboard and paste the code ( Ctrl+V ).
Annotate your notes
After you added your participant codes, you can start to reviewing and annotating your notes to find possible interpretations, themes, and meanings in the observations and utterances. This will help you to familiarize yourself with the data.
Annotations can be complete sentences or short lists. Usually, they concern a line in the transcript, but you can also comment on whole sections or just at individual words.
As an example, here are annotations I added to two lines in my notes:
- “I don’t know how to make a sponge mixture” (she buys it ready-made) Note: Use of prepared/buy-able ingredients; possible group: “Externalization”
- “I rather add some more oil, here, this is not enough” Note: Expanding original recipe; expression of taste?; correction?
The annotations should be easy to distinguish from data you got directly from the observation or the participant’s answers.
You can print out your transcript with wide margins and write your comments in the margins. With pen and paper, you can quickly jot down your thoughts, circling and connecting interesting parts with lines. It will look messy, which is no problem, since your annotations are primarily intended for familiarizing yourself with the data, not for creating publishable comments on data.
If you prefer to work on the computer, you can annotate your data using a word processor with a comment function. Open your transcript, select the text you want to annotate, then click the “comment” button or menu entry. If you don’t use the comment function, but plain text, mark your comments by prefixing them with something like “COMMENT:” or “ANNOTATION:”
Annotating your data is a creative process. When in doubt, whether an annotation is relevant or not: choose to write it. It might be useful later. Because you keep data and comments distinct, you can always throw comments out. The goal is not to come up with great annotations, but to engage with the data and to find possible ways to interpret it.
Decide whether data should be held by lines or sticky notes
After annotating your data, you should decide which media you want to use for your analysis:
- In a word processor, where lines are the basic units of data
- Using analog or digital sticky notes that represent the basic units of data
The analysis methods described here can be used in both media. However, each media has different strengths.
Analysis in a word processor is lightweight: Any word processor will do the job. However, it does not lend itself very well to collaboration: Even when your software allows for collaborative editing, the process is a bit cumbersome. When it comes to collaboration, sticky notes shine: It is a very direct and intuitive process to move data around. This is especially true for using physical rather than digital sticky notes.

Note: There are also applications for qualitative data analysis. I do not discuss them here as they are often expensive and thus present a barrier for beginners. The approach I discuss here is based on moving and clustering notes under themes. Most qualitative data analysis applications do not reorganize data and move it around, but tag sections in the original data. The advantage is that you can more easily consider the data in its original context, and that you can retrieve data based on complex criteria like “all data tagged with cooking and failure ” However, this also means that tagging and retrieval are separate actions which can make it hard for beginners to develop their skills. My suggestion is starting with the grouping approach I discuss here. After you gained some experience, check out some qualitative analysis applications and see if their approach suits you.
Regardless of how you analyze, you will do similar activities: You need to get your data in an appropriate format, you need to know how to cluster data in groups, and you need to give the groups meaningful titles. In the next sections, I describe how you can do these basic activities in a word processor or using sticky notes.
Analysis in a word processor
To get your data in a suitable format for analysis using a word processor, I suggest the following steps:
- Create a new document
- Paste your transcript into this document
- Insert a page break before the transcript to separate ungrouped data from your (upcoming) thematically grouped data.
In a word processor, you group your data by moving lines close to each other. You can put them in a bulleted list for this. You can rearrange lines using copy-and-paste or drag-and-drop.
To name groups of notes, write a heading above the group. Create a hierarchy by using different paragraph styles—bigger headings for overarching themes-of-themes, smaller headings for themes. If you use paragraph styles to format your headings, you can use the word processor’s navigation tool jump to groups.
Analysis via sticky notes
For getting your data in a suitable format for sticky notes, you need to print out your notes. I describe one way to do this in the tip below.
To create sticky note groups, you simply move sticky notes closer together. This is great for expressing varying degrees of certainty. When you are confident in a group you can arrange the notes in clear rows or lines, while sticky notes you are not yet sure about might just be nearby, but not yet in the cluster.
For group titles, use sticky notes of a different color—write your group titles on sticky notes and add them to the group. Color-coding by hierarchy can be helpful: if you print your data points on white paper, you can use yellow sticky notes for group titles and pink ones for titles of a group of groups.
Tip: Print data for analyzing on sticky notes If you want to do your analysis on paper notes, you need to print them. Here is the setup I use: Create a table in a word processor with 2 columns and many rows on an A4 or Letter-sized page. Each table cell will be a note. In the table settings… …switch off “Allow row to break across pages”, so that one note/table cell will not be split between pages. … choose a decent padding around each cell, about 0.5 cm Choose a font size of 12-14pt: It must be legible from an arm’s length. Copy/paste all your data (line by line) from the transcript into the cells.
Then, you print it out and cut out the cells. The only thing missing is actually being able to stick the notes on the wall. You can use restickable glue or tape, though most of the time I use plain masking tape.
After annotating your notes and deciding between analyzing them on sticky notes or in a word processor, you can now start structuring your data.
Develop an initial structure
Structuring your notes means grouping similar data together, suggesting themes behind the data, naming those themes and deciding which data falls under which theme.
Structuring your notes is an iterative process and not done all at once. When you develop an initial structure, you don’t use all your data. You can start with what you find useful as you skim your notes, or you can use data from two participants first. The aim is to set up a preliminary structure.

If you are analyzing together with others, it usually makes sense for each researcher to start to work on a fraction of the notes themselves in parallel. Let others know when you create a group and consult co-researchers if you are unsure about how to interpret and group a note.
When developing an initial structure, there are two main activities: First you cluster notes into preliminary groups, then you give the groups provisional titles.
Move in proximity
The easiest way to start a structure, is to move similar data in proximity. You do not yet need to commit to a group title, and you can easily try out different ways to organize your data.
Here is a part the analysis where I just moved notes in proximity. Some notes seem vaguely related to be able to do something:
- I need to find time to cook and coordinate it with childcare
- Observation: Has a well-equipped kitchen, with almost all appliances needed.
- “I don’t know how to make a sponge mixture” (so she buys it ready-made)
Some notes that may be related to finding recipes:
- Trying a new diet, thus looking for new recipes
- Kids do not like mushrooms, I have to take this into account when planning meals
- I collect pizza dough recipes; this is my favorite at the moment
- Observation: Has Recipes bookmarked in the cookbook.
Moving notes in proximity can help you experiment with different ways of organizing notes. You may gain more confidence in some of these structures, and you can give them a title by stating the insight related to the group.
State insights
When you clustered some notes together, you can try to find a title for the group. Again, this can be changed later and is there to organize the data and to support your thinking.
Reading your notes and annotations can also lead to possible insight without forming a group first. This is great, too. Just write it down and assign the data to it. Even if you have only one or two pieces of data that fit the insight, don’t worry, just see if you find more data that strengthens the insight. If not, you can still revise the title or just get rid of the group and see where else the data might fit.
For example, these were my first group titles when structuring the data on learning and recipe use:
- customizing recipes
- learning new things with video
- how people choose recipes
- misc (So far I just put all the notes that did not seem to fit well in a large “misc” group)
When analyzing with others, try to review the groups you created until now. It is important that you have a common understanding of the existing structure. This ensures that the results do not fall apart into per-person subsections.
Now, you have some preliminary, data-based themes, each created based on a few data points. Next, try whether these themes are useful for organizing more than just a few data points.
Fill in the structure
Now you have to find out if the structure you created is viable. You created the first structure with only a part of your data. Now you can use all of your data and try to sort it into the themes. You do this just as you created the initial structure: Move data in proximity, add it to groups, give groups titles, or revise existing titles. The titles you write are ideally insights into the underlying data but if that does not work, just choose “same-things-mentioned”-group titles.
If the previous step was to build a (data-based) scaffold, now we try to build the actual walls.

Aim for 3 to 10 data points per theme. While it is okay to have very small groups temporarily, each theme should be derived from multiple data points rather than a single utterance. This does not mean that more is always better: If a theme has more than about 10 utterances or observations, consider splitting it into “sub-themes”.
Normally, I would go through all my notes chronologically, beginning with the first participant and ending with the most recent one—although any other scheme will do. Just make sure you know which data you have dealt with already.
As you add the data to the structure, you may find that you need to create additional themes. Some theme titles may also need to be renamed. Just go ahead and make these changes, if you feel they are necessary.
For example, a group I created early on was “customizing recipes”.
- This is too few oil. I rather add some more
- I added some lemon zest. I like the fresh taste
- It’s fun to tweak the recipe a bit!
This is a good start, but I need to test and improve the structure. There a few points that should be addressed. Based on the participant codes, I could see that the notes in “customizing recipes” came from one person. To see if theme works, I need to see if there are other notes from other research sessions.
As I read more of the notes, I realize that there are not many notes that fit “customizing recipes” in the sense of deliberately adding or changing ingredients: These were mostly from just one participant. But there are notes from research with other participants on not doing exactly what is written in the recipes, like:
- I didn’t have shallots, but I did use onions.
- It tastes good even if I don’t let it simmer for two hours.
I added these notes to the group “customizing recipes”. However, these notes were more about finding good compromises in terms of available ingredients or dietary preferences. I renamed the group to “modify recipes”, which I found to reflect the notes’ content better than “customizing recipes”.
Now your groups will each be informed about several data points. But there will be many themes that are created by the “same things mentioned”-Method, not stating insights. Also, there may be overlapping themes and groups encompassing many data points, while other groups may be informed by only a few data points from just one participant. It is time to revise the structure.
Revise the structure
After you went through your data and sorted it into themes, take a step back and review your results.

If you analyze collaboratively, take time for a review and collect a list of what is difficult and what works well so far. With this list, you can tackle the problems together.
If you have recently been involved with just a particular part of the analysis (like working on two specific themes), your view may be too narrow: Look at the full range of clustered data, and rediscover themes, which may be a better fit for some data.
Look at the themes in relation to the data they contain: Do they match the data? Revise the themes if there is only a weak match between the stated theme and the data.
Tip: As you create the structure of your analysis, you will keep looking at your notes, images, and diagrams again and again. Sometimes, you have data that is very helpful and expressive: a quote that phrases an insight very well or a photo that illustrates a problem. This data is not only useful for analysis, but also later for presenting your results. You can use it to illustrate how your s are based on concrete observations. As you come across such data, it makes sense to store copies in a separate location for later use when preparing the research report.
There are several typical activities when revising the structure of your analysis: Finding better names for groups, moving data to other groups and creating subgroups.
Find better titles for your themes
Groups based on commonalities or vague similarities will hopefully develop into insights about the participants. To achieve this, try to revise group titles: make them more concise, clear and meaningful. If you named a theme based on mere commonalities of the data in that group, try to state an actual insight for that group.
In my analysis, I had a group I called “recipe reading”, which contained notes like:
- Looks up how much flour to add.
- Proceeds to the next step without reading again.
- Read recipes before deciding what to cook.
- Read recipe when needed.
A more accurate title might be “Participants read recipes occasionally/only when needed”. It was a bit unwieldy, but it made an interesting point: Instead of following recipes like an algorithm, they served more as an occasionally used tool.
However, this new group title no longer fitted all notes anymore, though. I removed “Read recipes before deciding what to cook.” and put it into a temporary group called “misc”. Later, I added this note to the “picking recipes” theme.
Renaming groups usually requires moving some data between groups to accommodate the data to the improved structure, which I discuss in the next section.
Move data to other groups
As you improve your data’s organization, it may be necessary to remove data from groups, either by moving the data to a temporary “misc” group or to another, more appropriate group.
While you should try to use the data you have, the most important thing is to create helpful themes based on the data rather than putting everything in a group, no matter what.
It is possible that you can state an insight more clearly by rewriting the group’s title, but as a result, the clearer title may no longer encompass all data in the group. Make sure the group title is clear, even if it means that the theme does not describe all the data currently grouped under the title. Take out the data that does not fit the improved title and see if it might fit to another group better. If not, place it in a “not yet grouped” or “misc”-Group. Revise this “misc” group, when you made changes to your structure and see, if you can use the data to enhance other groups.
For example, I reviewed a group I called “Problems”. Initially, I put notes here where participants described problems as well as solutions:
- I thought risotto would be nice, but I did not have risotto rice.
- The pizza dough is a bit too cookie-like; I try to improve that.
- I forgot to add the salt (when making the yeast-dough), it obviously did not taste great in the end
- Recipes are difficult to use with dirty hands—in books as well as on the phone.
The group served its purpose well and provided me with structure early in the process. However, it had a fairly broad subject and the data was only related by addressing some sort of problem. I could have structured the problems in different subgroups, but I decided to dissolve the group and see if the data fits somewhere else or helps me to create new groups.
I might put the note on not having risotto rice in a group on altering recipes and the reasons for that. It turned out that missing ingredients and substituting them were really common and the note made sense there. The problematic pizza dough got moved to a group that was called “improving” (Also not an ideal title!). I was unsure what to do with the note on forgetting the salt. I put this note in a misc section where I placed the notes I was unsure about. It later became part of a group on accidental deviations from recipes. The note on recipes being hard to read with dirty hands made a lot of sense, particularly as one of the initial product ideas was to provide recipes and instructions. There were two similar notes by other participants in the “Problems” group. For now, I created a new group called “Recipe handling problems”.
By moving notes to other groups, you can place notes where they make the most sense. In many cases, this means dissolving old groups and creating new ones. But moving data can also be done without major restructuring, simply by moving one or two notes from one group to another because they make more sense there. Another case is not moving data between groups, but creating better structures within groups, which is the topic of the next section.
Create subgroups
When a theme contains a lot of notes, you can create subgroups within a theme. The process of developing subgroups is like in “Develop a first structure” but it only takes place within the group: Move similar data in proximity and try to create clear insight. In this process, you may also find a more appropriate way of framing the main group topic.
Here are the steps I used to break up a large group in my analysis that was called “Reasons to improve skills”. It contained notes like these:
- I looked up how to glaze onions after a recipe mentioned it and I did not know how
- A friend suggested I stir-fry the veggies, so I searched for a video explaining it.
- I want to be able to make a mousse au chocolate myself.
As the group grew and grew, it became apparent that it lacked structure.
Going through the notes, I extracted two subgroups. Notes like “I want to be able to make mousse au chocolate myself” and “The pizza dough is a bit too cookie-like; I try to improve that” went into a subgroup that I called “self-directed improvement”. I later renamed it to “Getting skills to cook a certain dish”, as almost all notes in the group mentioned that the participants wanted to create a specific dish themselves.
I created another subgroup with notes like “A friend suggested I stir-fry the vegetables, so I tried to learn about that.” and “I looked up how to glaze onions after a recipe mentioned it and I did not know how”. I originally named these “cooking words”, because learning skills was triggered by reading or hearing a term referring to something they could or should do (“Stir-fry”, “Glaze”)—but they did not know how. However, “Cooking word” is only understandable in context and to make the group title self-explanatory, I renamed it to “Learning skill triggered by learning about a special term.”
Moving notes in these subgroups made the “reasons to improve skills”- group’s content much less unwieldy. Not all notes fit into the subtopics, so I kept some right under the “reasons to improve skills”-group directly, but it was far easier to understand now.
When the structure of your analysis becomes more and more stable, it is time to wrap up your analysis.
Completing your analysis
The steps described above build on each other. But as with other creative tasks, there will be a lot of back and forth between the steps of creating groups, assigning data to them and revising those groups.
This process can take some time. The analysis may never come to an actual halt, but it will eventually slow down. Continuing to move data can still bring minor improvements, but there are no longer major changes.
If you research collaboratively, it is good if you explicitly point out that it might make sense to bring the analysis to an end. Co-researchers may step in and point out issues that need to be fixed before proceeding or just point out minor problems for which suggestions would be helpful. When you decide that your analysis work is complete, take a moment to pause and to celebrate. This is a great achievement after a lot of work.
If you used analog sticky notes, don’t forget to take photos of the wall(s) you did your analysis on. Sticky notes might fall off or colleagues might need the space and remove parts of your analysis, so it is good to make a backup, just in case.
Here is my analysis when I decided that it is complete:
- Deliberate adjustments (like cooking a vegan version)
- Spontaneous changes (like swapping ingredients in-action, or adding more of something you like)
- Accidental changes (like forgetting something)
- People do use recipes only occasionally in the process (parts remembered; looking up after steps)
- Watching YouTube channels
- Reading about it
- Asking friends
- Learning after reading “special cooking word”
- Knowing a dish and wanting to replicate it
- No reason, just came across it
- Washing hands
- It will just get dirty
- Compromises if something is not available
- Not choosing if something is not available
- based on ingredients available
- situation-specific
- Printing out
- Just remember/re-search
These are all the groups I created in my analysis. The results could be more concise and have fewer groups focussing on fewer themes. However, this would probably lead to more abstract insights which would be more difficult to use in design.
The groups of groups are partly not insights themselves, but titles for collections, such as “Reasons to improve skills”. Others are direct insights such as “People do use recipes only occasionally in the process”.
By analyzing your data, you structure what you learned in diagrams, notes, and sketches. This makes browsing the data easier, but also helps to gain insights from the data. It builds on the knowledge that you acquired through interviewing, observing and co-diagramming, but goes beyond that: The analysis helps you find non-obvious insights and to corroborate or discard initial assumptions. You and your co-researchers now have an in-depth understanding of the data. However, not everyone can participate in the research. The next step is to summarize your findings and share them with people who weren’t involved in the research, so they can benefit from your findings as well.
- Making sense of your data and analyzing it helps you to learn more than the obvious insights and to critically reflect your initial ideas.
- Finding commonalities and contrasts in data is a basic principle of analysis.
- There is no one correct result of analysis, but your analysis can be plausible or implausible.
- In the beginning, you organize data by surface similarities of the notes, but over time, you focus on the meaning for the user.
- Prepare your data: Annotate your notes and diagrams by writing down possible interpretations.
- Make sense of diagrams by finding commonalities and summarizing the results in a diagram of your own.
- Make sense of notes by finding possible interpretations, filling and testing your structure and revising it until you find a stable structure.
Sharing research results
- Understanding how research gets used
- Putting the most important information first
- Writing an easy-to-read style
- Creating helpful photos and diagrams
- Designing posters for quick and visual research summaries
- Creating slide decks to give an overview of your results
- Writing text-based reports to provide detailed information
After the analysis, your work is almost done. However, people who have not participated in the research do not know anything about the research yet. You need to share your results, so they can learn about potential user’s motivations, activities, and problems. The most visible result for others will be the report or slide deck you create.
Note: Sometimes the documents that are produced in user research are called deliverables —since these are the tangible results you can provide to a client after research.
Documenting your research also has other uses than sharing the results or having an artifact that clients pay for. Creating the documentation continues your sensemaking from data. Now the focus shifts away from themes to priorities and expression: what are the key results? How can you formulate insights succinctly? These questions can also be worked on collaboratively, helping to deepen you and your collaborators’ understanding of the results.
In order for people to engage with your research, they must assume that your research is useful for them. There are three areas where engaging in research can be helpful:
- Finding new directions for product development.
- Choosing between the directions, depending upon what is most promising in the light of the research results.
- Smaller, tactical decisions to be made in everyday design- and product management-work: Which of these features best fits the needs of existing users? What should be emphasized in a blog post promoting the update?
Your research should allow your audience to quickly understand and use the parts that are relevant to them. This will help them to use your research for both strategic and day-to-day decisions and to spread the word about the usefulness of research.
Reports should be easy and quick to understand
There are key principles that make communicating your research easier: a clear structure, easy-to-read style, and well-used visualizations help create reports that are fun to read, use, and share.
Putting first things first
Journalists put the most important information first and end with background information that is useful but not essential. This is known as the inverted pyramid style . You should try to do the same in your research reports. There are two reasons why this is useful to the readers:
- When readers are pressed for time, they get the most important information quickly.
- If the readers have time, it makes them curious to read the rest: you have shown that there are interesting insights, now they want to know more.
Keeping this principle in mind also helps you and your collaborators to think about priorities: There may be many insights, but which are the most relevant? How can they be expressed succinctly and usefully?
A visible expression of these principles are headings, which reflect the most relevant points of the section. Summaries at the beginning of a section serve a similar function. Putting first things first also gets its own section in many research reports: An “executive summary”, a brief overview of the most relevant points of the report.
After you set the priorities of what you want to communicate, let’s look at how you communicate: the writing style.
Easy-to-read style
Writing simple and vivid sentences will help your readers enjoy and understand your insights. A good text has actors and plot like a film scene you can imagine; Bad text feels static, describing gray concepts, arranged in lines of text. In your research, you observed participants in their activities and listened to them describing their motivations and problems. This is a great foundation for writing a text that is interesting to read.
One way to convey activity in your research is using “active” sentences. Active sentences make it clear who is acting: “Joe is looking for a recipe”. You could also write “The recipe retrieval process is initiated by the participant”—that puts the action in abstract, passive concepts and makes it hard to imagine what is going on. If you need an abstract principle, try to still frame it in terms of activities. Maybe you start writing something like “Existing skills are the foundation of the cooking process and are utilized as long as the situation makes sense for participants. Recipes are used when the local sensemaking process breaks down.” A long sentence with a lot of abstract words. However, the content could be interesting and much easier to read: “Participants use their existing skills. They fall back to recipes when they don’t know what to do next”.
As a researcher, you translate experiences of your research participants so that your clients or team members can understand them. “Translate” is not just a metaphor: Participants, clients and team members often use different words. Terms your participants use may be very specific to their context and need to be introduced first. Many people are familiar with cooking, but even in our research, we may need to provide an explanation when quoting a participant speaking about sauséeing . In written reports, I sometimes explain words directly in the text or in footnotes and have also used small glossaries at the end of the reports. In slidedecks, I put such information in the speaker notes and included them in my talk.
Your research reports will be more enjoyable to read when you use action-oriented sentences and think about how to best translate the experience of your participants for your audiences. However, not all content comes as text: it is also important to create good visuals
Clear and helpful graphics
Not all findings are best expressed in text, just as not all data is best collected via conversations. Graphics can be very useful for both showing examples (like a photo of a participant cooking) and conveying abstractions (like showing the workflow steps in a diagram).
Like text, graphics should focus on what is most important: Too many flourishes and elements are distracting. You can often improve graphics by cropping them to the most important parts: If you focus on how people choose recipes, visualize recipe selection, not something else. If your photo illustrates how people knead dough, show the dough and kneading hands almost filling the whole picture rather than a wide-angle shot of the kitchen with a small single person kneading a tiny lump of dough somewhere.
Even if your graphic focuses on the most important content, it can still look unpleasant. This is often the case when elements do not line up and colors differ: There are variations, but it is not clear if they have a purpose or are accidental, like in the next image.
Try to limit the different colors and fonts you use and pick ones that are obviously different. When arranging elements, align them with each other and make sure that repeating elements are evenly spaced. Following these hints will already lead to better looking diagrams:
Many tools like PowerPoint, Slides or Illustrator have distribution and alignment features that save you the work of moving all elements manually.
Tip: Designs, diagrams and picking photos needs expertise. If you can work with a visual designer, you can save yourself a lot of work and get high quality results.
Visual elements like diagrams and photos should, like text, be focused on a clear purpose and avoid elements that detract from this purpose. Avoid flourishes, crop images to their most important content and use few fonts and colors in diagrams. This looks good and helps readers to make sense of the content quickly.
Common forms of documentation
I will introduce you to three ways to summarize your research: Posters, slide decks and reports. These formats have different strengths, and complement each other. For a large project, you might create all three, while for a smaller project you might deliver only a slide deck or report.
The great thing about posters is that they can become part of the environment the design team works in. The poster can be a reminder of the most important results, and team members can refer and point to it in conversations.
Posters are the most compact way to summarize your research: Only the most important results get on a poster. Text should be short and structured with headings. You can use graphics to their full potential on a poster. Complex processes or diagrams often suffer from the limited space they get in other media. Here they shine.

Other formats of posters may focus on a specific finding and visualize in-depth. I did not do this for the research on using cooking instructions. The following image is an example from research I did on cleaning and transforming data before importing it into a public database, using multiple tools and skills from different domains:
Tip: Professional designers create posters in a desktop-publishing application like Adobe InDesign—but in many cases, a presentation application like PowerPoint works well too.
Tip: If you have an office printer that prints A3, you can use it for a small poster; Large format printers in print shops can print larger posters.
Posters can only provide limited information. This is a strength, as it helps you focus, but to provide background information and results that go beyond the essential findings, you can document your research in a slide deck.
Slide decks
Slide decks are versatile: they can serve both as a medium for documentation and provide important points and visualizations in a personal presentation. The limited space on each slide helps you to stay focused and write concisely. The slide format makes it possible to try different sequences and to put together longer or shorter decks depending on the information needs.
I often structure my slide decks like this:
- Research project question
- Executive summary: One slide with the most important results
- Brief research method description
- Takeaways (Similar to executive summary)
There are different ways to organize information on a slide. A lot of research insights can be presented in lists:

Research results can feel quite abstract. One way to convey what you saw and heard while researching is by sharing quotes and image examples:

You can use the slides to show diagrams and other forms of visualization. In the following slide, I visualize that recipes seem straightforward, almost like algorithms, but that the actions that people do based on the recipe are far more complex:

One format I haven’t used to present the results of recipe usage research, but that can be useful, is to compare, for example, which factors support and hinder the use of a tool.

Such a summary is useful for evaluating (product) decisions and you can place it after the executive summary.
Note: There is some contradiction between what should be on slides for documentation and what should be on slides for presenting in person . For presenting, slides should ideally avoid repeating points you are talking about—slide decks by professional speakers are often just illustrations and examples! If you want to deliver a top-notch presentation, consider creating a separate deck.
Slide decks are a standard format for documenting research results and are used beyond their original purpose of providing images and graphics for presentations. The format affords highly structured text and the use of illustrations and thus matches the needs of ad-hoc use and quick comprehension. However, it can be difficult to discuss complex issues and to provide background information for those who want to dig deeper. It is best to create a written report for these needs.
Written reports enable you to discuss results and methods in detail. They require concentrated reading. Depending on the research, a report can be about 15-50 pages long and can include a description of the methods, recruiting process and research session questions in an appendix. This makes them a good format for readers who need to deeply engage with the topic, but also for archiving and later reusing research results. The written report allows presenting the relevant context, motivations, and reasoning. This helps readers understand research results even years later.
The basic structure of a report can be the same as that of a slide deck. In the case of a written report, it can be useful to include an appendix with a description of the method and a more detailed discussion of the results.
- Executive summary listing results, research question and brief method description (see the following image )
- Result summary
- Detailed description of research methods
- Recruitment method and sample
- Research session questions (“interview guide”)

Even if written reports demand focused reading, they should still be easy to understand and provide important information quickly. They should have an executive summary, and you can also summarize key points of their sections, much like in the chapters of this book.
Reports allow you to detail your findings and provide background information for readers who want to delve deeply into the research and its methods. They are not the ideal medium for a quick overview. Your reports, no matter how extensive, will be built upon by their readers when they move beyond the immediate research results towards decisions and designs.
Beyond reporting research results
For you, the research project usually ends with you documenting your research and presenting it to the team or other stakeholders. But the use of the research results has only just begun: If all goes well, team members and other colleagues will read use your posters, slidedecks and reports and share them with colleagues. They will also use the research to create documents slightly removed from research and more focused on design or business decisions: Personas, empathy maps, scenarios, or story boards.
When your research reports are easy to understand and provide interesting information, product managers, designers, developers, and writers will use them to learn more about your participants and thereby creating products that match your user motivations, activities, and problems.
- Research results can be used for strategic decisions as well as for smaller tactical ones.
- Structure the information inverted-pyramid-style: The most important information comes first.
- Use an active, concrete style.
- Focus your graphics on their core message and avoid elements that do not contribute to it.
- Posters give quick and visual research summaries.
- Slides give an overview of your results that is easy to consume.
- Written reports give in-depth information.
Learn (even) more
Design focused.
These books are written for designers and user researchers. The methods and examples are immediately useful for design work.
- Observing the User Experience : A Practitioner’s Guide to User Research by Goodman, Elizabeth; Kuniavsky, Mike; Moed, Andrea. 2nd Edition. Amsterdam: Elsevier, 2012. ISBN 978-0-123-84870-3 Covers multiple user research methods as well as research planning, recruiting and communicating results. Particularly interesting are the chapters on recruiting and analysis of qualitative data.
- Interviewing Users : How to Uncover Compelling Insights by Portigal, Steve. 1. Edition. New York: Rosenfeld Media, LLC, 2013. ISBN 978-1-9-33-82-0 As the title suggests, it’s focused on asking questions and listening to answers, but it covers additional methods as well. Includes lots of useful tips.
- Rapid Contextual Design : A How-to Guide to Key Techniques for User-centered Design by Holtzblatt, Karen; Wendell, Jessamyn Burns; Wood, Shelley. Amsterdam: Elsevier, 2005. ISBN 978-0-123-54051-5 Describes a collection of methods for user research. It is aimed at bigger teams (with time and money, I assume). However, its mentioned here since the idea of grouping data as core activity of data analysis is from it.
- Mental Models: Aligning Design Strategy with Human Behavior by Indi Young. Rosenfeld Media. ISBN-13: 978-1-933-82006-4 Describes a research process with lots of useful methods and structures going from participant group selection up to sharing research based product feature opportunities. A particular focus is on user activities and recruiting based on them.
Academic focus
These are books written for academic researchers. Why should you bother with academic books if there are some specifically for designers? Books aimed for an academic audience also cover topics that are easily brushed over. This might be ethics, data analysis and different paradigms for it and the question if there are a “true findings”. All this can be very useful if you find yourself researching sensitive topics, need to come up with custom methods or if you need to explain and defend a particular approach.
- Shane, the Lone Ethnographer: A Beginner’s Guide to Ethnography by Galman, Sally Campbell. Lanham: Rowman Altamira. ISBN 978-0-759-10344-3 Lots of the methods I described originated in ethnography. This book gives a hands-on and thoughtful introduction to ethnography. Comes as a comic and is fun to read. Minor flaw: The lettering is a bit obscure
- The Good, the Bad, and the Data by Galman, Sally Campbell. Walnut Creek, California: Routledge, 2017. ISBN 978-1598746327 Shane is back and now she focuses on data analysis. Great overview of established paradigms. Like the “Lone Ethnographer” it is a comic and easy to understand. I think the lettering’s readability was improved a bit.
- Successful Qualitative Research : A Practical Guide for Beginners by Clarke, Victoria; Braun, Virginia. London: SAGE, 2013. ISBN 978-1-847-87581-5 This book is aimed at aspiring academic researchers. Hands-on, but covers the underlying (social science) theory as well. It inspired much of the analysis section in this book. Interesting for those who want to know more about doing thorough analysis of data (using the method of “Thematic Analysis”)
- The Ethnographic Interview by James P. Spradley. Waveland Press. ISBN-13: 978-1478632078 Focuses on understanding the participants’ language and jargon and consequently less on participants’ activities. Nevertheless, a great intro, particularly the annotated examples.
- Watch a demonstration of interviewing methods (by Graham R Gibbs, CC-BY-NC-SA)
- Example Interview Guides (by Erin Richey, CC0)
Forms and Templates
Co-documentation templates.
If you read this on a computer, you can download the templates via right-click → “save image as”
The Complete Guide To UX Research (User Research)

UX Research is a term that has been trending in the past few years. There's no surprise why it's so popular - User Experience Research is all about understanding your customer and their needs, which can help you greatly improve your conversion rate and user experience on your website. In this article, we're going to provide a complete guide to UX research as well as how to start implementing it in your organisation.Throughout this article we will give you a complete high-level overview of the entire UX Research meaning, supported by more in-depth articles for each topic.
Introduction to UX Research
Wether you're a grizzled UX Researcher who's been in the field for decades or a UX Novice who's just getting started, UX Research is an integral aspect of the UX Design process. Before diving into this article on UX research methods and tools, let's first take some time to break down what UX research actually entails.
Each of these UX Research Methods has its own strengths and weaknesses, so it's important to understand your goals for the UX Research activities you want to complete.
What is UX Research?
UX research begins with UX designers and UX researchers studying the real world needs of users. User Experience Research is a process --it's not just one thing-- that involves collecting data, conducting interviews, usability testing prototypes or website designs with human participants in order to deeply understand what people are looking for when they interact with a product or service.
By using different sorts of user-research techniques you can better understand not only people desires from their product of service, but a deeper human need which can serve as an incredibly powerful opportunity.
There's an incredible amount of different sorts of research methods. Most of them can be divided in two camps: Qualitative and Quantitative Research.
Qualitative research - Understanding needs can be accomplished through observation, in depth interviews and ethnographic studies. Quantitative Research focusses more on the numbers, analysing data and collecting measurable statistics.
Within these two groups there's an incredible amount of research activities such as Card Sorting, Competitive Analysis, User Interviews, Usability Tests, Personas & Customer Journeys and many more. We've created our The Curated List of Research Techniques to always give you an up-to-date overview.
Why is UX Research so important?
When I started my career as a digital designer over 15 years ago, I felt like I was always hired to design the client's idea. Simply translate what they had in their head into a UI without even thinking about changing the user experience. Needless to say: This is a recipe for disaster. An no, this isn't a "Client's don't know anything" story. Nobody knows! At least in the beginning. The client had "the perfect idea" for a new digital feature. The launch date was already set and the development process had to start as soon as possible.
When the feature launched, we expected support might get a few questions or even receive a few thank-you emails. We surely must've affected the user experience somehow!
But that didn't happen. Nothing happened. The feature wasn't used.
Because nobody needed it.
This is exactly what happens when you skip user experience research because you think you're solving a problem that "everybody" has, but nobody really does.
Conducting User Experience research can help you to have a better understanding of your stakeholders and what they need. This is incredibly valuable information from which you can create personas and customer journeys. It doesn't matter if you're creating a new product or service or are improving an existing once.
Five Steps for conducting User Research
Created by Eric Sanders , the Research Learning Spiral provides five main steps for your user research.
- Objectives: What are the knowledge gaps we need to fill?
- Hypotheses: What do we think we understand about our users?
- Methods: Based on time and manpower, what methods should we select?
- Conduct: Gather data through the selected methods.
- Synthesize: Fill in the knowledge gaps, prove or disprove our hypotheses, and discover opportunities for our design efforts.
1: Objectives: Define the Problem Statement
A problem statement is a concise description of an issue to be addressed or a condition to be improved upon. It identifies the gap between the current (problem) state and desired (goal) state of a process or product.
Problem statements are the first steps in your research because they help you to understand what's wrong or needs improving. For example, if your product is a mobile app and the problem statement says that customers are having difficulty paying for items within the application, then UX research will lead you (hopefully) down that path. Most likely it will involve some form of usability testing.
Check out this article if you'd like to learn more about Problem Statements.
2: Hypotheses: What we think we know about our user groups
After getting your Problem Statement right, there's one more thing to do before doing any research. Make sure you have created a clear research goal for yourself. How do you identify Research Objectives? By asking questions:
- Who are we doing this for? The starting point for your personas!
- What are we doing? What's happening right now? What do our user want? What does the company need?
- Think about When. If you're creating a project plan, you'll need a timeline. It also helps to keep in mind when people are using your products or service.
- Where is the logical next step. Where do people use your product? Why there? What limitations are there to that location? Where can you perform research? Where do your users live?
- Why are we doing this? Why should or shouldn't we be doing this? Why teaches you all about motivations from people and for the project.
- Last but not least: How? Besides thinking about the research activities itself, think about how people will test a product or feature. How will the user insights (outcome of the research) work be used in the User Centered Design - and development process?
3: Methods: Choose the right research method
UX research is about exploration, and you want to make sure that your method fits the needs of what you're trying to explore. There are many different methods. In a later chapter we'll go over the most common UX research methods .
For now, all you need to keep in mind that that there are a lot of different ways of doing research.
You definitely don't need to do every type of activity but it would be useful to have a decent understanding of the options you have available, so you pick the right tools for the job.
4. Conduct: Putting in the work
Apply your chosen user research methods to your Hypotheses and Objectives! The various techniques used by the senior product designer in the BTNG Design Process can definitely be overwhelming. The product development process is not a straight line from A to B. UX Researchers often discover new qualitative insights in the user experience due to uncovering new (or incorrect) user needs. So please do understand that UX Design is a lot more than simply creating a design.
5. Synthesise: Evaluating Research Outcome
So you started with your Problem Statement (Objectives), you drafted your hypotheses, chose the top research methods, conducted your research as stated in the research process and now "YOU ARE HERE".
The last step is to Synthesise what you've learned. Start by filling in the knowledge gaps. What unknowns are you now able to answer?
Which of your hypotheses are proven (or disproven)?
And lastly, which new exciting new opportunities did you discover!
Evaluating the outcome of the User Experience Research is an essential part of the work.
Make sure to keep them brief and to-the-point. A good rule of thumb is to include the top three positive comments and the top three problems.
UX Research Methods
Choosing the right ux research method.
Making sure you use the right types of user experience research in any project is essential. Since time and money is always limited, we need to make sure we always get the most bang-for-our-buck. This means we need to pick the UX research method that will give us the most insights as possible for a project.
Three things to keep in mind when making a choice among research methodologies:
- Stages of the product life cycle - Is it a new or existing product?
- Quantitative vs. Qualitative - In depth talk directly with people or data?
- Attitudinal vs. Behavioural - What people say vs what people do

Image from Nielsen Norman Group
Most frequently used methods of UX Research
- Card Sorting: Way before UX Research even was a "thing", psychological research originally used Card Sorting. With Card Sorting, you try to find out how people group things and what sort of hierarchies they use. The BTNG Research Team is specialised in remote research. So our modern Card Sorting user experience research have a few modern surprises.
- Usability Testing: Before launching a new feature or product it is important to do user testing. Give them tasks to complete and see how well the prototype works and learn more about user behaviours.
- Remote Usability Testing: During the COVID-19 lockdown, finding the appropriate ux research methods haven't always been that easy. Luckily, we've adopted plenty of modern solutions that help us with collecting customer feedback even with a remote usability test.
- Research-Based User Personas: A profile of a fictional character representing a specific stakeholder relevant to your product or service. Combine goals and objections with attitude and personality. The BTNG Research Team creates these personas for the target users after conducing both quantitative and qualitative user research.
- Field Studies: Yes, we actually like to go outside. What if your product isn't a B2B desktop application which is being used behind a computer during office hours? At BTNG we have different types of Field Studies which all help you gain valuable insights into human behaviour and the user experience.
- The Expert Interview: Combine your talent with that of one of BTNG's senior researcher. Conducting ux research without talking to the experts on your team would be a waste of time. In every organisation there are people who know a lot about their product or service and have unique insights. We always like to include them in the UX Research!
- Eye Movement Tracking: If you have an existing digital experience up and running - Eye Movement Tracking can help you to identify user experience challenges in your funnel. The outcome shows a heatmap of where the user looks (and doesn't).
Check out this article for a in-depth guide on UX Research Methods.
Qualitative vs. Quantitative UX research methods
Since this is a topic that we can on about for hours, we decided to split this section up in a few parts. First let's start with the difference.
Qualitative UX Research is based on an in-depth understanding of the human behaviour and needs. Qualitative user research includes interviews, observations (in natural settings), usability tests or contextual inquiry. More than often you'll obtain unexpected, valuable insights through this from of user experience research methods.
Quantitative UX Research relies on statistical analysis to make sense out of data (quantitative data) gathered from UX measurements: A/B Tests - Surveys etc. Quantitative UX Research is as you might have guessed, a lot more data-orientated.
If you'd like to learn more about these two types of research, check out these articles:
Get the most out of your User Research with Qualitative Research
Quantitative Research: The Science of Mining Data for Insights
Balancing qualitative and quantitative UX research
Both types of research have amazing benefits but also challenges. Depending on the research goal, it would be wise to have a good understanding which types of research you would like to be part of the ux design and would make the most impact.
The BTNG Research Team loves to start with Qualitative Research to first get a better understanding of the WHY and gain new insights. To validate these new learning they use Quantitative Research in your user experience research.
A handful of helpful UX Research Tools
The landscape of UX research tools has been growing rapidly. The BTNG Research team use a variety of UX research tools to help with well, almost everything. From running usability tests, creating prototypes and even for recruiting participants.
In the not-too-distant future, we'll create a Curated UX Research Tool article. For now, a handful of helpful UX Research Tools should do the trick.
- For surveys : Typeform
- For UX Research Recruitment: Dscout
- For analytics and heatmaps: VWO
- For documenting research: Notion & Airtable
- For Customer Journey Management : TheyDo
- For transcriptions: Descript
- For remote user testing: Maze
- For Calls : Zoom
Surveys: Typeform
What does it do? Survey Forms can be boring. Typeform is one of those ux research tools that helps you to create beautiful surveys with customisable templates and an online editor. For example, you can add videos to your survey or even let people draw their answers instead of typing them in a text box. Who is this for? Startup teams that want to quickly create engaging and modern looking surveys but don't know how to code it themselves.
Highlights: Amazing UX, looks and feel very modern, create forms with ease that match your branding, great reports and automation.
Why is it our top pick? Stop wasting time on ux research tools with too many buttons. Always keep the goal of your ux research methods in mind. Keep things lean, fast and simple with a product with amazing UX.
https://www.typeform.com/
UX Research Recruitment: Dscout
What does it do? Dscout is a remote research platform that helps you recruit participants for your ux research (the right ones). With a pool of +100.000 real users, our user researchers can hop on video calls and collect data for your qualitative user research. So test out those mobile apps user experience and collect all the data! Isn't remote research amazing?
Highlights: User Research Participant Recruitment, Live Sessions,Prototype feedback, competitive analysis, in-the-wild product discovery, field work supplementations, shopalongs.
Why is it our top pick? Finding the right people is more important than finding people fast. BTNG helps corporate clients in all types of industries which require a unique set of users, each time. Dscout helps us to quickly find the right people and make sure our user research is delivered on time and our research process stays in tact.
https://dscout.com/
Analytics and heatmaps: VWO
What does it do? When we were helping the Financial Times, our BTNG Research Team collaborated with FT Marketing Team who were already running experiments with VWO. 50% of the traffic would see one version of a certain page while 50% saw a different version. Which performed best? Perhaps you'd take a look at time-on-page. But more importantly: Which converts better!
Hotjar provides Product Experience Insights that show how users behave and what they feel strongly about, so product teams can deliver real value to them.
Highlights: VWO is an amazing suite that does it all:Automated Feedback, Heatmaps, EyeTracking, User Session Recordings (Participant Tracking) and one thing that Hotjar doesn't do: A/B Testing.
Why is it our top pick? Even tho it's an expensive product, it does give you value for money. Especially the reports with very black and white outcomes are great for presenting the results you've made.
https://vwo.com/
Documenting research: Notion
What does it do? Notion is our command center, where we store and constantly update our studio's aggregate wisdom. It is a super-flexible tool that helps to organise project documentation, prepare for interviews with either clients or their product users, accumulate feedback, or simply take notes.
Highlights: A very clean, structured way to write and share information with your team in a beautiful designed app with an amazing user experience.
Why is it our top pick? There's no better, more structured way to share information.
https://www.notion.so/
Customer Journey Management: TheyDo
What does it do? TheyDo is a modern Journey Management Platform. It centralises your journeys in an easy to manage system, where everyone has access to a single source of truth of the customer experience. It’s like a CMS for journeys.
Highlights: Customer Journey Map designer, Personas and 2x2 Persona Matrix, Opportunity & Solution Management & Prioritisation.
Why is it our top pick? TheyDo fits perfectly with BTNG's way of helping companies become more customer-centric. It helps to visualise the current experience of stakeholders. With those insight which we capture from interviews or usability testing, we discover new opportunities. A perfect starting point for creating solutions!
https://www.theydo.io/
Transcriptions: Descript
What does it do? Descript is an all-in-one solution for audio & video recording, editing and transcription. The editing is as easy as a doc. Imagine you’ve interviewed 20 different people about a new flavor of soda or a feature for your app. You just drop all those files into a Descript Project, and they show up in different “Compositions” (documents) in the sidebar. In a couple of minutes they’ll be transcribed, with speaker labels added automatically.
Highlights: Overdub, Filler Word Removal, Collaboration, Subtitles, Remote Recording and Studio Sound.
Why is it our top pick? Descript is an absolute monster when it comes to recording, editing and transcribing videos. It truly makes digesting the work after recording fast and even fun!
https://www.descript.com/
Remote user testing: Maze
What does it do? Maze is a-mazing remote user testing platform for unmoderated usability tests. With Maze, you can create and run in-depth usability tests and share them with your testers via a link to get actionable insights. Maze also generates a usability study report instantly so that you can share it with anyone.
It’s handy that the tool integrates directly with Figma, InVision, Marvel, and Sketch, thus, you can import a working prototype directly from the design tool you use. The BTNG Design Team with their Figma skills has an amazing chemistry with the Research Team due to that Figma/Maze integration.
Highlights: Besides unmoderated usability testing, Maze can help with different UX Research Methods, like card sorting, tree testing, 5-second testing, A/B testing, and more.
Why is it our top pick? Usability testing has been a time consuming way of qualitative research. Trying to find out how users interact (Task analysis) during an Interviews combined with keeping an eye on the prototype can be... a challenge. The way that Maze allows us to run (besides our hands on usability test) now also run unmoderated usability testing is a powerful weapon in our arsenal.
https://maze.co/
Calls: Zoom
What does it do? As the other video conferencing tools you can run video calls. But what makes Zoom a great tool? We feel that the integration with conferencing equipment is huge for our bigger clients. Now that there's also a Miro integration we can make our user interviews even more fun and interactive!
Highlights: Call Recording, Collaboration tools, Screen Sharing, Free trial, connects to conferencing equipment, host up to 500 people!
Why is it our top pick? Giving the research participants of your user interviews a pleasant experience is so important. Especially when you're looking for qualitative feedback on your ux design, you want to make sure they feel comfortable. And yes, you'll have to start using a paid version - but the user interface of Zoom alone is worth it. Even the Mobile App is really solid.
https://zoom.us/
In Conclusion
No matter what research methodology you rely on if it is qualitative research methods or perhaps quantitative data - keep in mind that user research is an essential part of the Design Process. Not only your UX designer will thank you, but also your users.
In every UX project we've spoken to multiple users - no matter if it was a task analysis, attitudinal research or focus groups... They all had one thing in common:
People thanked us for taking the time to listen to them.
So please, stop thinking about the potential UX research methods you might use in your design process and consider what it REALLY is about:
Solving the right problems for the right people.
And there's only one way to get there: Trying things out, listening, learning and improving.
Looking for help? Reach out!
See the Nielsen Norman Group’s list of user research tips: https://www.nngroup.com/articles/ux-research-cheat-sheet/
Find an extensive range of user research considerations, discussed in Smashing Magazine: https://www.smashingmagazine.com/2018/01/comprehensive-guide-ux-research/
Here’s a convenient and example-rich catalogue of user research tools: https://blog.airtable.com/43-ux-research-tools-for-optimizing-your-product/
Related Posts

How to generate UX Insights

The importance of User Research

How to recruit participants
What is ux research.

UX Research Tools

What Is User Research, and What Is Its Purpose?
User research, or UX research, is an absolutely vital part of the user experience design process.
Typically done at the start of a project, it encompasses different types of research methodologies to gather valuable data and feedback. When conducting user research, you’ll engage with and observe your target users, getting to know their needs, behaviors, and pain points in relation to the product or service you’re designing.
Ultimately, user research means the difference between designing based on guesswork and assumptions, and actually creating something that solves a real user problem. In other words: Do not skip the research phase!
If you’re new to user research, fear not. We’re going to explain exactly what UX research is and why it’s so important. We’ll also show you how to plan your user research and introduce you to some key user research methods .
We’ve divided this rather comprehensive guide into the following sections. Feel free to skip ahead using the menu below:
- What is user research?
- What is the purpose of user research?
- How to plan your user research.
- An introduction to different research methods—and when to use them.
Ready? Let’s jump in.
1. What is user research?
User experience research is the systematic investigation of your users in order to gather insights that will inform the design process. With the help of various user research techniques, you’ll set out to understand your users’ needs, attitudes, pain points, and behaviors (processes like task analyses look at how users actually navigate the product experience —not just how they should or how they say they do).
Typically done at the start of a project—but also extremely valuable throughout—it encompasses different types of research methodology to gather both qualitative and quantitative data in relation to your product or service.
Before we continue, let’s consider the difference between qualitative and quantitative data .
Qualitative vs. Quantitative data: What’s the difference?
Qualitative UX research results in descriptive data which looks more at how people think and feel. It helps to find your users’ opinions, problems, reasons, and motivations. You can learn all about in-depth in this video by professional UX designer Maureen Herben:
Quantitative UX research , on the other hand, generally produces numerical data that can be measured and analyzed, looking more at the statistics. Quantitative data is used to quantify the opinions and behaviors of your users.
User research rarely relies on just one form of data collection and often uses both qualitative and quantitative research methods together to form a bigger picture. The data can be applied to an existing product to gain insight to help improve the product experiences, or it can be applied to an entirely new product or service, providing a baseline for UX, design, and development.
From the data gathered during your user research phase, you should be able to understand the following areas within the context of your product or service:
- Who your users are
- What their needs are
- What they want
- How they currently do things
- How they’d like to do them
As you consider the why of user research, remember that it’s easier than you might realize to overlook entire groups of users. It’s important to ensure that you’re conducting inclusive UX research and that starts in the earliest stages!
2. What is the purpose of user research?
The purpose of user research is to put your design project into context. It helps you understand the problem you’re trying to solve; it tells you who your users are, in what context they’ll be using your product or service, and ultimately, what they need from you, the designer! UX research ensures that you are designing with the user in mind, which is key if you want to create a successful product.
Throughout the design process, your UX research will aid you in many ways. It’ll help you identify problems and challenges, validate or invalidate your assumptions, find patterns and commonalities across your target user groups, and shed plenty of light on your users’ needs, goals, and mental models.
Why is this so important? Let’s find out.
Why is it so important to conduct user research?
Without UX research, you are essentially basing your designs on assumptions. If you don’t take the time to engage with real users, it’s virtually impossible to know what needs and pain-points your design should address.
Here’s why conducting user research is absolutely crucial:
User research helps you to design better products!
There’s a misconception that it’s ok to just do a bit of research and testing at the end of your project. The truth is that you need UX research first, followed by usability testing and iteration throughout.
This is because research makes the design better. The end goal is to create products and services that people want to use. The mantra in UX design is that some user research is always better than none .
It’s likely at some point in your UX career that you will come across the first challenge of any UX designer—convincing a client or your team to include user research in a project.
User research keeps user stories at the center of your design process.
All too often, the user research phase is seen as optional or merely “nice-to-have”—but in reality, it’s crucial from both a design and a business perspective. This brings us to our next point…
User research saves time and money!
If you (or your client) decide to skip the research phase altogether, the chances are you’ll end up spending time and money developing a product that, when launched, has loads of usability issues and design flaws, or simply doesn’t meet a real user need. Through UX research, you’ll uncover such issues early on—saving time, money, and lots of frustration!
The research phase ensures you’re designing with real insights and facts — not guesswork! Imagine you release a product that has the potential to fill a gap in the market but, due to a lack of user research, is full of bugs and usability issues. At best, you’ll have a lot of unnecessary work to do to get the product up to scratch. At worst, the brand’s reputation will suffer.
UX research gives the product a competitive edge. Research shows you how your product will perform in a real-world context, highlighting any issues that need to be ironed out before you go ahead and develop it.
User research can be done on a budget
There are ways that you can conduct faster and less costly user research , utilizing Guerrilla research outlined later on in this article (also handy if budget and time are an issue). Even the smallest amount of user research will save time and money in the long run.
The second challenge is how often businesses think they know their users without having done any research. You’ll be surprised at how often a client will tell you that user research is not necessary because they know their users!
In a 2005 survey completed by Bain, a large global management consulting firm, they found some startling results. 80% of businesses thought they knew best about what they were delivering. Only 8% of those businesses’ customers agreed.
The survey may be getting old, but the principle and misperception still persist.

In some cases, businesses genuinely do know their customers and there may be previous data on hand to utilize. However, more often than not, ‘knowing the users’ comes down to personal assumptions and opinions.
“It’s only natural to assume that everyone uses the Web the same way we do, and—like everyone else—we tend to think that our own behavior is much more orderly and sensible than it really is.” (Don’t Make Me Think ‘Revisited’, Steve Krug, 2014.) A must on every UX Designer’s bookshelf!
What we think a user wants is not the same as what a user thinks they want. Without research, we inadvertently make decisions for ourselves instead of for our target audience. To summarize, the purpose of user research is to help us design to fulfill the user’s actual needs, rather than our own assumptions of their needs.
In a nutshell, UX research informs and opens up the realm of design possibilities. It saves time and money, ensures a competitive edge, and helps you to be a more effective, efficient, user-centric designer.
3. How to plan your user research
When planning your user research , it’s good to have a mix of both qualitative and quantitative data to draw from so you don’t run into issues from the value-action gap, which can at times make qualitative data unreliable.
The value-action gap is a well-known psychology principle outlining that people genuinely don’t do what they say they would do, and is commonly referred to as what people say vs. what people do.
More than 60% of participants said they were “likely” or “very likely” to buy a kitchen appliance in the next 3 months. 8 months later, only 12% had. How Customers Think, Gerald Zaltman, 2003
When planning your user research, you need to do more than just User Focus Groups—observation of your users really is the key. You need to watch what your users do.
Part of being a great user researcher is to be an expert at setting up the right questions and getting unbiased answers from your users.
To do this we need to think like the user.
Put yourself in your user’s shoes without your own preconceptions and assumptions on how it should work and what it should be. For this, we need empathy (and good listening skills) allowing you to observe and challenge assumptions of what you already think you know about your users.
Be open to some surprises!
4. When to use different user research methods
There’s a variety of different qualitative and quantitative research methods out there. If you’ve been doing the CareerFoundry UX Design course , you may have already covered some of the list below in your course.
It isn’t an exhaustive list, but covers some of the more popular methods of research. Our student team lead runs through many of them in the video below.
Qualitative Methods:
- Guerrilla testing: Fast and low-cost testing methods such as on-the-street videos, field observations, reviews of paper sketches, or online tools for remote usability testing.
- Interviews: One-on-one interviews that follow a preset selection of questions prompting the user to describe their interactions, thoughts, and feelings in relation to a product or service, or even the environment of the product/service.
- Focus groups: Participatory groups that are led through a discussion and activities to gather data on a particular product or service. If you’ve ever watched Mad Men you’ll be familiar with the Ponds’ cold cream Focus Group !
- Field Studies: Heading into the user’s environment and observing while taking notes (and photographs or videos if possible).
- In-lab testing: Observations of users completing particular tasks in a controlled environment. Users are often asked to describe out loud their actions, thoughts, and feelings and are videoed for later analysis
- Card sorting : Used to help understand Information Architecture and naming conventions better. Can be really handy to sort large amounts of content into logical groupings for users.
Quantitative Methods:
- User surveys: Questionnaires with a structured format, targeting your specific user personas. These can be a great way to get a large amount of data. Surveymonkey is a popular online tool.
- First click testing: A test set up to analyse what a user would click on first in order to complete their intended task. This can be done with paper prototypes, interactive wireframes or an existing website.
- Eye tracking: Measures the gaze of the eye, allowing the observer to ‘see’ what the user sees. This can be an expensive test and heatmapping is a good cheaper alternative.
- Heatmapping: Visual mapping of data showing how users click and scroll through your prototype or website. The most well-known online tool to integrate would be Crazyegg.
- Web analytics: Data that is gathered from a website or prototype it is integrated with, allowing you to see the demographics of users, page views, and funnels of how users move through your site and where they drop off. The most well-known online tool to integrate would be Google Analytics .
- A/B testing: Comparing two versions of a web page to see which one converts users more. This is a great way to test button placements, colors, banners, and other elements in your UI.
Further reading
Now you know what user research is and why it’s so important. If you’re looking for a way to get trained in this particular discipline, there’s good news—owing to demand and popularity, there’s a growing number of UX research bootcamps out there.
If you’d like to learn more about UX research, you may find the following articles useful:
- What Does A UX Researcher Actually Do? The Ultimate Career Guide
- How to Conduct User Research Like a Professional
- How to Build a UX Research Portfolio (Step-by-Step Guide)
User research is the process of understanding the needs, behaviors, and attitudes of users to inform the design and development of products or services. It involves collecting and analyzing data about users through various methods such as surveys, interviews, and usability testing.
2. How to conduct user research?
User research can be conducted through various methods such as surveys, interviews, observations, and usability testing. The method chosen depends on the research goals and the resources available. Typically, user research involves defining research objectives, recruiting participants, creating research protocols, conducting research activities, analyzing data, and reporting findings.
3. Is user research the same as UX?
User research is a part of the broader UX (User Experience) field, but they are not the same. UX encompasses a wide range of activities such as design, testing, and evaluation, while user research specifically focuses on understanding user needs and behaviors to inform UX decisions.
4. What makes good user research?
Good user research is characterized by clear research goals, well-defined research protocols, appropriate sampling methods, unbiased data collection, and rigorous data analysis. It also involves effective communication of research findings to stakeholders, as well as using the findings to inform design and development decisions.
5. Is user research a good career?
User research is a growing field with many opportunities for career growth and development. With the increasing importance of user-centered design, there is a high demand for skilled user researchers in various industries such as tech, healthcare, and finance. A career in user research can be fulfilling for those interested in understanding human behavior and designing products that meet user needs.
Integrations
What's new?
Prototype Testing
Live Website Testing
Feedback Surveys
Interview Studies
Card Sorting
Tree Testing
In-Product Prompts
Participant Management
Automated Reports
Templates Gallery
Choose from our library of pre-built mazes to copy, customize, and share with your own users
Browse all templates
Financial Services
Tech & Software
Product Designers
Product Managers
User Researchers
By use case
Concept & Idea Validation
Wireframe & Usability Test
Content & Copy Testing
Feedback & Satisfaction
Content Hub
Educational resources for product, research and design teams
Explore all resources
Question Bank
Research Maturity Model
Guides & Reports
Help Center
Future of User Research Report
The Optimal Path Podcast
Maze Guides | Resources Hub
What is UX Research: The Ultimate Guide for UX Researchers
0% complete
11 Key UX research methods: How and when to use them
After defining your objectives and planning your research framework, it’s time to choose the research technique that will best serve your project's goals and yield the right insights. While user research is often treated as an afterthought, it should inform every design decision. In this chapter, we walk you through the most common research methods and help you choose the right one for you.

What are UX research methods?
A UX research method is a way of generating insights about your users, their behavior, motivations, and needs. You can use methods like user interviews, surveys, focus groups, card sorting, usability testing to identify user challenges and turn them into opportunities to improve the user experience.
More of a visual learner? Check out this video for a speedy rundown. If you’re ready to get stuck in, jump straight to our full breakdown .
The most common types of user research
First, let’s talk about the types of UX research. Every individual research method falls under these types, which reflect different goals and objectives for conducting research.
Here’s a quick overview:

Qualitative vs. quantitative
All research methods are either quantitative or qualitative . Qualitative research focuses on capturing subjective insights into users' experiences. It aims to understand the underlying reasons, motivations, and behaviors of individuals. Quantitative research, on the other hand, involves collecting and analyzing numerical data to identify patterns, trends, and significance. It aims to quantify user behaviors, preferences, and attitudes, allowing for generalizations and statistical insights.
Qualitative research also typically involves a smaller sample size than quantitative research (40 participants, as recommended by Nielsen Norman Group ).
Attitudinal vs. behavioral
Attitudinal research is about understanding users' attitudes, perceptions, and beliefs. It delves into the 'why' behind user decisions and actions. It often involves surveys or interviews where users are asked about their feelings, preferences, or perceptions towards a product or service. It's subjective in nature, aiming to capture people's emotions and opinions.
Behavioral research is about what users do rather than what they say they do or would do. This kind of research is often based on observation methods like usability testing, eye-tracking, or heat maps to understand user behavior.
Generative vs. evaluative
Generative research is all about generating new ideas, concepts, and insights to fuel the design process. You might run brainstorming sessions with groups of users, card sorting, and co-design sessions to inspire creativity and guide the development of user-centered solutions.
On the other hand, evaluative research focuses on assessing the usability, effectiveness, and overall quality of existing designs or prototypes. Once you’ve developed a prototype of your product, it's time to evaluate its strengths and weaknesses. You can compare different versions of a product design or feature through A/B testing—ensuring your UX design meets user needs and expectations.
Remove the guesswork from product decisions
Collect both quantitative and qualitative insights from your customers and build truly user-centric products with Maze.

11 Best UX research methods and when to use them
There are various UX research techniques—each method serves a specific purpose and can provide unique insights into user behaviors and preferences. In this section, we’ll highlight the most common research techniques you need to know.
Read on for an at-a-glance table, and full breakdown of each method.
User interviews
User interviews are a qualitative research method that involves having open-ended and guided discussions with users to gather in-depth insights about their experiences, needs, motivations, and behaviors.
Typically, you would ask a few questions on a specific topic and analyze participants' answers. The results you get will depend on how well you form and ask questions, as well as follow up on participants’ answers.
“As a researcher, it's our responsibility to drive the user to their actual problems,” says Yuliya Martinavichene , User Experience Researcher at Zinio. She adds, “The narration of incidents can help you analyze a lot of hidden details with regard to user behavior.”
That’s why you should:
- Start with a wide context : Make sure that your questions don’t start with your product
- Ask questions that focus on the tasks that users are trying to complete
- Invest in analysis : Get transcripts done and share the findings with your team
Tanya Nativ , Design Researcher at Sketch recommends defining the goals and assumptions internally. “Our beliefs about our users’ behavior really help to structure good questions and get to the root of the problem and its solution,” she explains.
It's easy to be misunderstood if you don't have experience writing interview questions. You can get someone to review them for you or use our Question Bank of 350+ research questions .
When to conduct user interviews
This method is typically used at the start and end of your project. At the start of a project, you can establish a strong understanding of your target users, their perspectives, and the context in which they’ll interact with your product. By the end of your project, new user interviews—often with a different set of individuals—offer a litmus test for your product's usability and appeal, providing firsthand accounts of experiences, perceived strengths, and potential areas for refinement.
Field studies
Field studies are research activities that take place in the user’s environment rather than in your lab or office. They’re a great method for uncovering context, unknown motivations, or constraints that affect the user experience.
An advantage of field studies is observing people in their natural environment, giving you a glimpse at the context in which your product is used. It’s useful to understand the context in which users complete tasks, learn about their needs, and collect in-depth user stories.
When to conduct field studies
This method can be used at all stages of your project—two key times you may want to conduct field studies are:
- As part of the discovery and exploration stage to define direction and understand the context around when and how users interact with the product
- During usability testing, once you have a prototype, to evaluate the effectiveness of the solution or validate design assumptions in real-world contexts
3. Focus groups
A focus group is a qualitative research method that includes the study of a group of people, their beliefs, and opinions. It’s typically used for market research or gathering feedback on products and messaging.
Focus groups can help you better grasp:
- How users perceive your product
- What users believe are a product’s most important features
- What problems do users experience with the product
As with any qualitative research method, the quality of the data collected through focus groups is only as robust as the preparation. So, it’s important to prepare a UX research plan you can refer to during the discussion.
Here’s some things to consider:
- Write a script to guide the conversation
- Ask clear, open-ended questions focused on the topics you’re trying to learn about
- Include around five to ten participants to keep the sessions focused and organized
When to conduct focus groups
It’s easier to use this research technique when you're still formulating your concept, product, or service—to explore user preferences, gather initial reactions, and generate ideas. This is because, in the early stages, you have flexibility and can make significant changes without incurring high costs.
Another way some researchers employ focus groups is post-launch to gather feedback and identify potential improvements. However, you can also use other methods here which may be more effective for identifying usability issues. For example, a platform like Maze can provide detailed, actionable data about how users interact with your product. These quantitative results are a great accompaniment to the qualitative data gathered from your focus group.
4. Diary studies
Diary studies involve asking users to track their usage and thoughts on your product by keeping logs or diaries, taking photos, explaining their activities, and highlighting things that stood out to them.
“Diary studies are one of the few ways you can get a peek into how users interact with our product in a real-world scenario,” says Tanya.
A diary study helps you tell the story of how products and services fit into people’s daily lives, and the touch-points and channels they choose to complete their tasks.
There’s several key questions to consider before conducting diary research, from what kind of diary you want—freeform or structured, and digital or paper—to how often you want participants to log their thoughts.
- Open, ‘freeform’ diary: Users have more freedom to record what and when they like, but can also lead to missed opportunities to capture data users might overlook
- Closed, ‘structured; diary: Users follow a stricter entry-logging process and answer pre-set questions
Remember to determine the trigger: a signal that lets the participants know when they should log their feedback. Tanya breaks these triggers down into the following:
- Interval-contingent trigger : Participants fill out the diary at specific intervals such as one entry per day, or one entry per week
- Signal-contingent trigger : You tell the participant when to make an entry and how you would prefer them to communicate it to you as well as your preferred type of communication
- Event-contingent trigger : The participant makes an entry whenever a defined event occurs
When to conduct diary studies
Diary studies are often valuable when you need to deeply understand users' behaviors, routines, and pain points in real-life contexts. This could be when you're:
- Conceptualizing a new product or feature: Gain insights into user habits, needs, and frustrations to inspire your design
- Trying to enhance an existing product: Identify areas where users are having difficulties or where there are opportunities for better user engagement
Although surveys are primarily used for quantitative research, they can also provided qualitative data, depending on whether you use closed or open-ended questions:
- Closed-ended questions come with a predefined set of answers to choose from using formats like rating scales, rankings, or multiple choice. This results in quantitative data.
- Open-ended question s are typically open-text questions where test participants give their responses in a free-form style. This results in qualitative data.
Matthieu Dixte , Product Researcher at Maze, explains the benefit of surveys: “With open-ended questions, researchers get insight into respondents' opinions, experiences, and explanations in their own words. This helps explore nuances that quantitative data alone may not capture.”
So, how do you make sure you’re asking the right survey questions? Gregg Bernstein , UX Researcher at Signal, says that when planning online surveys, it’s best to avoid questions that begin with “How likely are you to…?” Instead, Gregg says asking questions that start with “Have you ever… ?” will prompt users to give more specific and measurable answers.
Make sure your questions:
- Are easy to understand
- Don't guide participants towards a particular answer
- Include both closed-ended and open-ended questions
- Respect users and their privacy
- Are consistent in terms of format
To learn more about survey design, check out this guide .
When to conduct surveys
While surveys can be used at all stages of project development, and are ideal for continuous product discovery , the specific timing and purpose may vary depending on the research goals. For example, you can run surveys at:
- Conceptualization phase to gather preliminary data, and identify patterns, trends, or potential user segments
- Post-launch or during iterative design cycles to gather feedback on user satisfaction, feature usage, or suggestions for improvements
6. Card sorting
Card sorting is an important step in creating an intuitive information architecture (IA) and user experience. It’s also a great technique to generate ideas, naming conventions, or simply see how users understand topics.
In this UX research method, participants are presented with cards featuring different topics or information, and tasked with grouping the cards into categories that make sense to them.
There are three types of card sorting:
- Open card sorting: Participants organize topics into categories that make sense to them and name those categories, thus generating new ideas and names
- Hybrid card sorting: Participants can sort cards into predefined categories, but also have the option to create their own categories
- Closed card sorting: Participants are given predefined categories and asked to sort the items into the available groups
You can run a card sorting session using physical index cards or digitally with a UX research tool like Maze to simulate the drag-and-drop activity of dividing cards into groups. Running digital card sorting is ideal for any type of card sort, and moderated or unmoderated sessions.
Read more about card sorting and learn how to run a card sorting session here .
When to conduct card sorting
Card sorting isn’t limited to a single stage of design or development—it can be employed anytime you need to explore how users categorize or perceive information. For example, you may want to use card sorting if you need to:
- Understand how users perceive ideas
- Evaluate and prioritize potential solutions
- Generate name ideas and understand naming conventions
- Learn how users expect navigation to work
- Decide how to group content on a new or existing site
- Restructure information architecture
7. Tree testing
During tree testing a text-only version of the site is given to your participants, who are asked to complete a series of tasks requiring them to locate items on the app or website.
The data collected from a tree test helps you understand where users intuitively navigate first, and is an effective way to assess the findability, labeling, and information architecture of a product.
We recommend keeping these sessions short, ranging from 15 to 20 minutes, and asking participants to complete no more than ten tasks. This helps ensure participants remain focused and engaged, leading to more reliable and accurate data, and avoiding fatigue.
If you’re using a platform like Maze to run remote testing, you can easily recruit participants based on various demographic filters, including industry and country. This way, you can uncover a broader range of user preferences, ensuring a more comprehensive understanding of your target audience.
To learn more about tree testing, check out this chapter .
When to conduct tree testing
Tree testing is often done at an early stage in the design or redesign process. That’s because it’s more cost-effective to address errors at the start of a project—rather than making changes later in the development process or after launch.
However, it can be helpful to employ tree testing as a method when adding new features, particularly alongside card sorting.
While tree testing and card sorting can both help you with categorizing the content on a website, it’s important to note that they each approach this from a different angle and are used at different stages during the research process. Ideally, you should use the two in tandem: card sorting is recommended when defining and testing a new website architecture, while tree testing is meant to help you test how the navigation performs with users.
8. Usability testing
Usability testing evaluates your product with people by getting them to complete tasks while you observe and note their interactions (either during or after the test). The goal of conducting usability testing is to understand if your design is intuitive and easy to use. A sign of success is if users can easily accomplish their goals and complete tasks with your product.
There are various usability testing methods that you can use, such as moderated vs. unmoderated or qualitative vs. quantitative —and selecting the right one depends on your research goals, resources, and timeline.
Usability testing is usually performed with functional mid or hi-fi prototypes . If you have a Figma, InVision, Sketch, or prototype ready, you can import it into a platform like Maze and start testing your design with users immediately.
The tasks you create for usability tests should be:
- Realistic, and describe a scenario
- Actionable, and use action verbs (create, sign up, buy, etc)
Be mindful of using leading words such as ‘click here’ or ‘go to that page’ in your tasks. These instructions bias the results by helping users complete their tasks—something that doesn’t happen in real life.
Product tip ✨
With Maze, you can test your prototype and live website with real users to filter out cognitive biases, and gather actionable insights that fuel product decisions.
When to conduct usability testing
To inform your design decisions, you should do usability testing early and often in the process . Here are some guidelines to help you decide when to do usability testing:
- Before you start designing
- Once you have a wireframe or prototype
- Prior to the launch of the product
- At regular intervals after launch
To learn more about usability testing, check out our complete guide to usability testing .
9. Five-second testing
In five-second testing , participants are (unsurprisingly) given five seconds to view an image like a design or web page, and then they’re asked questions about the design to gauge their first impressions.
Why five seconds? According to data , 55% of visitors spend less than 15 seconds on a website, so it;s essential to grab someone’s attention in the first few seconds of their visit. With a five-second test, you can quickly determine what information users perceive and their impressions during the first five seconds of viewing a design.
Product tip 💡
And if you’re using Maze, you can simply upload an image of the screen you want to test, or browse your prototype and select a screen. Plus, you can star individual comments and automatically add them to your report to share with stakeholders.
When to conduct five-second testing
Five-second testing is typically conducted in the early stages of the design process, specifically during initial concept testing or prototype development. This way, you can evaluate your design's initial impact and make early refinements or adjustments to ensure its effectiveness, before putting design to development.
To learn more, check out our chapter on five-second testing .
10. A/B testing
A/B testing , also known as split testing, compares two or more versions of a webpage, interface, or feature to determine which performs better regarding engagement, conversions, or other predefined metrics.
It involves randomly dividing users into different groups and giving each group a different version of the design element being tested. For example, let's say the primary call-to-action on the page is a button that says ‘buy now’.
You're considering making changes to its design to see if it can lead to higher conversions, so you create two versions:
- Version A : The original design with the ‘buy now’ button positioned below the product description—shown to group A
- Version B : A variation with the ‘buy now’ button now prominently displayed above the product description—shown to group B
Over a planned period, you measure metrics like click-through rates, add-to-cart rates, and actual purchases to assess the performance of each variation. You find that Group B had significantly higher click-through and conversion rates than Group A. This indicates that showing the button above the product description drove higher user engagement and conversions.
Check out our A/B testing guide for more in-depth examples and guidance on how to run these tests.
When to conduct A/B testing
A/B testing can be used at all stages of the design and development process—whenever you want to collect direct, quantitative data and confirm a suspicion, or settle a design debate. This iterative testing approach allows you to continually improve your website's performance and user experience based on data-driven insights.
11. Concept testing
Concept testing is a type of research that evaluates the feasibility, appeal, and potential success of a new product before you build it. It centers the user in the ideation process, using UX research methods like A/B testing, surveys, and customer interviews.
There’s no one way to run a concept test—you can opt for concept testing surveys, interviews, focus groups, or any other method that gets qualitative data on your concept.
*Dive into our complete guide to concept testing for more tips and tricks on getting started. *
When to conduct concept testing
Concept testing helps gauge your audience’s interest, understanding, and likelihood-to-purchase, before committing time and resources to a concept. However, it can also be useful further down the product development line—such as when defining marketing messaging or just before launching.
Which is the best UX research type?
The best research type varies depending on your project; what your objectives are, and what stage you’re in. Ultimately, the ideal type of research is one which provides the insights required, using the available resources.
For example, if you're at the early ideation or product discovery stage, generative research methods can help you generate new ideas, understand user needs, and explore possibilities. As you move to the design and development phase, evaluative research methods and quantitative data become crucial.
Discover the UX research trends shaping the future of the industry and why the best results come from a combination of different research methods.
How to choose the right user experience research method
In an ideal world, a combination of all the insights you gain from multiple types of user research methods would guide every design decision. In practice, this can be hard to execute due to resources.
Sometimes the right methodology is the one you can get buy-in, budget, and time for.

Gregg Bernstein , UX Researcher at Signal
UX research tools can help streamline the research process, making regular testing and application of diverse methods more accessible—so you always keep the user at the center of your design process. Some other key tips to remember when choosing your method are:
Define the goals and problems
A good way to inform your choice of user experience research method is to start by considering your goals. You might want to browse UX research templates or read about examples of research.
Michael Margolis , UX Research Partner at Google Ventures, recommends answering questions like:
- “What do your users need?”
- “What are your users struggling with?”
- “How can you help your users?”
Understand the design process stage
If your team is very early in product development, generative research —like field studies—make sense. If you need to test design mockups or a prototype, evaluative research methods—such as usability testing—will work best.
This is something they’re big on at Sketch, as we heard from Design Researcher, Tanya Nativ. She says, “In the discovery phase, we focus on user interviews and contextual inquiries. The testing phase is more about dogfooding, concept testing, and usability testing. Once a feature has been launched, it’s about ongoing listening.”
Consider the type of insights required
If you're looking for rich, qualitative data that delves into user behaviors, motivations, and emotions, then methods like user interviews or field studies are ideal. They’ll help you uncover the ‘why’ behind user actions.
On the other hand, if you need to gather quantitative data to measure user satisfaction or compare different design variations, methods like surveys or A/B testing are more suitable. These methods will help you get hard numbers and concrete data on preferences and behavior.
*Discover the UX research trends shaping the future of the industry and why the best results come from a combination of different research methods. *
Build a deeper understanding of your users with UX research
Think of UX research methods as building blocks that work together to create a well-rounded understanding of your users. Each method brings its own unique strengths, whether it's human empathy from user interviews or the vast data from surveys.
But it's not just about choosing the right UX research methods; the research platform you use is equally important. You need a platform that empowers your team to collect data, analyze, and collaborate seamlessly.
Simplifying product research is simple with Maze. From tree testing to card sorting, prototype testing to user interview analysis—Maze makes getting actionable insights easy, whatever method you opt for.
Meanwhile, if you want to know more about testing methods, head on to the next chapter all about tree testing .
Get valuable insights from real users
Conduct impactful UX research with Maze and improve your product experience and customer satisfaction.

Frequently asked questions
How do you choose the right UX research method?
Choosing the right research method depends on your goals. Some key things to consider are:
- The feature/product you’re testing
- The type of data you’re looking for
- The design stage
- The time and resources you have available
What is the best UX research method?
The best research method is the one you have the time, resources, and budget for that meets your specific needs and goals. Most research tools, like Maze, will accommodate a variety of UX research and testing techniques.
When to use which user experience research method?
Selecting which user research method to use—if budget and resources aren’t a factor—depends on your goals. UX research methods provide different types of data:
- Qualitative vs quantitative
- Attitudinal vs behavioral
- Generative vs evaluative
Identify your goals, then choose a research method that gathers the user data you need.
Tree Testing: Your Guide to Improve Navigation and UX
Skip navigation
World Leaders in Research-Based User Experience
UX Research Cheat Sheet

February 12, 2017 2017-02-12
- Email article
- Share on LinkedIn
- Share on Twitter
User-experience research methods are great at producing data and insights, while ongoing activities help get the right things done. Alongside R&D, ongoing UX activities can make everyone’s efforts more effective and valuable. At every stage in the design process, different UX methods can keep product-development efforts on the right track, in agreement with true user needs and not imaginary ones.
In This Article:
When to conduct user research.
One of the questions we get the most is, “When should I do user research on my project?” There are three different answers:
- Do user research at whatever stage you’re in right now . The earlier the research, the more impact the findings will have on your product, and by definition, the earliest you can do something on your current project (absent a time machine) is today.
- Do user research at all the stages . As we show below, there’s something useful to learn in every single stage of any reasonable project plan, and each research step will increase the value of your product by more than the cost of the research.
- Do most user research early in the project (when it’ll have the most impact), but conserve some budget for a smaller amount of supplementary research later in the project. This advice applies in the common case that you can’t get budget for all the research steps that would be useful.
The chart below describes UX methods and activities available in various project stages.

Each project is different, so the stages are not always neatly compartmentalized. The end of one cycle is the beginning of the next.
The important thing is not to execute a giant list of activities in rigid order, but to start somewhere and learn more and more as you go along.
When deciding where to start or what to focus on first, use some of these top UX methods. Some methods may be more appropriate than others, depending on time constraints, system maturity, type of product or service, and the current top concerns. It’s a good idea to use different or alternating methods each product cycle because they are aimed at different goals and types of insight. The chart below shows how often UX practitioners reported engaging in these methods in our survey on UX careers.

If you can do only one activity and aim to improve an existing system, do qualitative (think-aloud) usability testing , which is the most effective method to improve usability . If you are unable to test with users, analyze as much user data as you can. Data (obtained, for instance, from call logs, searches, or analytics) is not a great substitute for people, however, because data usually tells you what , but you often need to know why . So use the questions your data brings up to continue to push for usability testing.
The discovery stage is when you try to illuminate what you don’t know and better understand what people need. It’s especially important to do discovery activities before making a new product or feature, so you can find out whether it makes sense to do the project at all .
An important goal at this stage is to validate and discard assumptions, and then bring the data and insights to the team. Ideally this research should be done before effort is wasted on building the wrong things or on building things for the wrong people, but it can also be used to get back on track when you’re working with an existing product or service.
Good things to do during discovery:
- Conduct field studies and interview users : Go where the users are, watch, ask, and listen. Observe people in context interacting with the system or solving the problems you’re trying to provide solutions for.
- Run diary studies to understand your users’ information needs and behaviors.
- Interview stakeholders to gather and understand business requirements and constraints.
- Interview sales, support, and training staff. What are the most frequent problems and questions they hear from users? What are the worst problems people have? What makes people angry?
- Listen to sales and support calls. What do people ask about? What do they have problems understanding? How do the sales and support staff explain and help? What is the vocabulary mismatch between users and staff?
- Do competitive testing . Find the strengths and weaknesses in your competitors’ products. Discover what users like best.
Exploration methods are for understanding the problem space and design scope and addressing user needs appropriately.
- Compare features against competitors.
- Do design reviews.
- Use research to build user personas and write user stories.
- Analyze user tasks to find ways to save people time and effort.
- Show stakeholders the user journey and where the risky areas are for losing customers along the way. Decide together what an ideal user journey would look like.
- Explore design possibilities by imagining many different approaches, brainstorming, and testing the best ideas in order to identify best-of-breed design components to retain.
- Obtain feedback on early-stage task flows by walking through designs with stakeholders and subject-matter experts. Ask for written reactions and questions (silent brainstorming), to avoid groupthink and to enable people who might not speak up in a group to tell you what concerns them.
- Iterate designs by testing paper prototypes with target users, and then test interactive prototypes by watching people use them. Don’t gather opinions. Instead, note how well designs work to help people complete tasks and avoid errors. Let people show you where the problem areas are, then redesign and test again.
- Use card sorting to find out how people group your information, to help inform your navigation and information organization scheme.
Testing and validation methods are for checking designs during development and beyond, to make sure systems work well for the people who use them.
- Do qualitative usability testing . Test early and often with a diverse range of people, alone and in groups. Conduct an accessibility evaluation to ensure universal access.
- Ask people to self-report their interactions and any interesting incidents while using the system over time, for example with diary studies .
- Audit training classes and note the topics, questions people ask, and answers given. Test instructions and help systems.
- Talk with user groups.
- Staff social-media accounts and talk with users online. Monitor social media for kudos and complaints.
- Analyze user-forum posts. User forums are sources for important questions to address and answers that solve problems. Bring that learning back to the design and development team.
- Do benchmark testing: If you’re planning a major redesign or measuring improvement, test to determine time on task, task completion, and error rates of your current system, so you can gauge progress over time.
Listen throughout the research and design cycle to help understand existing problems and to look for new issues. Analyze gathered data and monitor incoming information for patterns and trends.
- Survey customers and prospective users.
- Monitor analytics and metrics to discover trends and anomalies and to gauge your progress.
- Analyze search queries: What do people look for and what do they call it? Search logs are often overlooked, but they contain important information.
- Make it easy to send in comments, bug reports, and questions. Analyze incoming feedback channels periodically for top usability issues and trouble areas. Look for clues about what people can’t find, their misunderstandings, and any unintended effects.
- Collect frequently asked questions and try to solve the problems they represent.
- Run booths at conferences that your customers and users attend so that they can volunteer information and talk with you directly.
- Give talks and demos: capture questions and concerns.
Ongoing and strategic activities can help you get ahead of problems and make systemic improvements.
- Find allies . It takes a coordinated effort to achieve design improvement. You’ll need collaborators and champions.
- Talk with experts . Learn from others’ successes and mistakes. Get advice from people with more experience.
- Follow ethical guidelines . The UXPA Code of Professional Conduct is a good starting point.
- Involve stakeholders . Don’t just ask for opinions; get people onboard and contributing, even in small ways. Share your findings, invite them to observe and take notes during research sessions.
- Hunt for data sources . Be a UX detective. Who has the information you need, and how can you gather it?
- Determine UX metrics. Find ways to measure how well the system is working for its users.
- Follow Tog's principles of interaction design .
- Use evidence-based design guidelines , especially when you can’t conduct your own research. Usability heuristics are high-level principles to follow.
- Design for universal access . Accessibility can’t be tacked onto the end or tested in during QA. Access is becoming a legal imperative, and expert help is available. Accessibility improvements make systems easier for everyone.
- Give users control . Provide the controls people need. Choice but not infinite choice.
- Prevent errors . Whenever an error occurs, consider how it might be eliminated through design change. What may appear to be user errors are often system-design faults. Prevent errors by understanding how they occur and design to lessen their impact.
- Improve error messages . For remaining errors, don’t just report system state. Say what happened from a user standpoint and explain what to do in terms that are easy for users to understand.
- Provide helpful defaults . Be prescriptive with the default settings, because many people expect you to make the hard choices for them. Allow users to change the ones they might need or want to change.
- Check for inconsistencies . Work-alike is important for learnability. People tend to interpret differences as meaningful, so make use of that in your design intentionally rather than introducing arbitrary differences. Adhere to the principle of least astonishment . Meet expectations instead.
- Map features to needs . User research can be tied to features to show where requirements come from. Such a mapping can help preserve design rationale for the next round or the next team.
- When designing software, ensure that installation and updating is easy . Make installation quick and unobtrusive. Allow people to control updating if they want to.
- When designing devices, plan for repair and recycling . Sustainability and reuse are more important than ever. Design for conservation.
- Avoid waste . Reduce and eliminate nonessential packaging and disposable parts. Avoid wasting people’s time, also. Streamline.
- Consider system usability in different cultural contexts . You are not your user. Plan how to ensure that your systems work for people in other countries . Translation is only part of the challenge.
- Look for perverse incentives . Perverse incentives lead to negative unintended consequences. How can people game the system or exploit it? How might you be able to address that? Consider how a malicious user might use the system in unintended ways or to harm others.
- Consider social implications . How will the system be used in groups of people, by groups of people, or against groups of people? Which problems could emerge from that group activity?
- Protect personal information . Personal information is like money. You can spend it unwisely only once. Many want to rob the bank. Plan how to keep personal information secure over time. Avoid collecting information that isn’t required, and destroy older data routinely.
- Keep data safe . Limit access to both research data and the data entrusted to the company by customers. Advocate for encryption of data at rest and secure transport. A data breach is a terrible user experience.
- Deliver both good and bad news . It’s human nature to be reluctant to tell people what they don’t want to hear, but it’s essential that UX raise the tough issues. The future of the product, or even the company, may depend on decisionmakers knowing what you know or suspect.
- Track usability over time . Use indicators such as number and types of support issues, error rates and task completion in usability testing, and customer satisfaction ratings, to show the effectiveness of design improvements.
- Include diverse users . People can be very different culturally and physically. They also have a range of abilities and language skills. Personas are not enough to prevent serious problems, so be sure your testing includes as wide a variety of people as you can.
- Track usability bugs . If usability bugs don’t have a place in the bug database, start your own database to track important issues.
- Pay attention to user sentiment . Social media is a great place for monitoring user problems, successes, frustrations, and word-of-mouth advertising. When competitors emerge, social media posts may be the first indication.
- Reduce the need for training . Training is often a workaround for difficult user interfaces, and it’s expensive. Use training and help topics to look for areas ripe for design changes.
- Communicate future directions . Customers and users depend on what they are able to do and what they know how to do with the products and services they use. Change can be good, even when disruptive, but surprise changes are often poorly received because they can break things that people are already doing. Whenever possible, ask, tell, test with, and listen to the customers and users you have. Consult with them rather than just announcing changes. Discuss major changes early, so what you hear can help you do a better job, and what they hear can help them prepare for the changes needed.
- Recruit people for future research and testing . Actively encourage people to join your pool of volunteer testers. Offer incentives for participation and make signing up easy to do via your website, your newsletter, and other points of contact.
Use this cheat-sheet to choose appropriate UX methods and activities for your projects and to get the most out of those efforts. It’s not necessary to do everything on every project, but it’s often helpful to use a mix of methods and tend to some ongoing needs during each iteration.
Free Downloads
Related courses, discovery: building the right thing.
Conduct successful discovery phases to ensure you build the best solution
User Research Methods: From Strategy to Requirements to Design
Pick the best UX research method for each stage in the design process
Personas: Turn User Data Into User-Centered Design
Successfully turn user data into user interfaces. Learn how to create, maintain and utilize personas throughout the UX design process.
Related Topics
- Research Methods Research Methods
- Design Process
Learn More:
Please accept marketing cookies to view the embedded video. https://www.youtube.com/watch?v=7_sFVYfatXY

Always Pilot Test User Research Studies
Kim Salazar · 3 min

Level Up Your Focus Groups
Therese Fessenden · 5 min

Inductively Analyzing Qualitative Data
Tanner Kohler · 3 min
Related Articles:
Project Management for User Research: The Plan
Susan Farrell · 7 min
Open-Ended vs. Closed Questions in User Research
Maria Rosala · 5 min
Formative vs. Summative Evaluations
Alita Joyce · 5 min
UX Research Methods: Glossary
Raluca Budiu · 12 min
What a UX Career Looks Like Today
Rachel Krause and Maria Rosala · 5 min
Pilot Testing: Getting It Right (Before) the First Time
Amy Schade · 5 min
- Set up your Design System Workshop
- Tečaj: oblikovalski sistem
- UI tečaj: od ideje do prototipa
- DSG Newsletter
- The Design Strategy Cards
- The Ultimate Design Strategy e-book
- Free Design Strategy Crash Course
No products in the cart.
How to conduct user research: A step-by-step guide

This is part one of a guide to User research.
Continue with part two: How to conduct user research: A Step-by-step guide
Continue with part three: What is exploratory research and why is it so exciting?
What user research did you conduct to reveal your ideal user?
Uh-oh. Not this question again. We both know the most common answer and it’s not great.
“Uhm, we talked to some users and had a brainstorming session with our team. It’s not much, but we don’t have time to do anything more right now. It’s better than nothing.”
Let’s be brutally honest about the meaning of that answer and rephrase it:
“ We don’t have time to get to know our actual user and maximize our chances of success. We’ll just assume that we know what they want and then wonder why the product fails at a later stage.”
If that sounds super bad, it’s because IT IS. You don’t want to end up in this situation. And you won’t.
After reading this guide, you’ll know exactly how to carry out the user research that will become your guiding star during product development.
On this page
Why is user research so important?
Step #1: define research objectives.
Go ahead – create that fake persona
Step #2: Pick your methods
Qualitative methods – the why, quantitative methods – the what, behavioral and attitudinal methods, step #3: find your participants, how to recruit participants, how many participants, step #4: conduct user research.
Focus groups
Competitive analysis
Field studies
What’s next?
User research can be a scary word. It may sound like money you don’t have, time you can’t spare, and expertise you need to find. That’s why some people convince themselves that it’s not that important.
Which is a HUGE mistake.
User research is crucial – without it, you’ll spend your energy, time and money on a product that is based around false assumptions that won’t work in the real world.
Let’s take a look at Segway, a technologically brilliant product with incredible introductory publicity. Although it’s still around, it simply didn’t reach initial expectations. Here are some of the reasons why:
- It brought mockery, not admiration. The user was always “that guy”, who often felt fat or lazy.
- Cities were not prepared for it. Neither users nor policemen knew if it should be used on the road or on the sidewalk.
- A large segment of the target market comprised of postal and security workers. However, postal workers need both hands while walking, and security workers prefer bikes that don’t have a limited range.
Segway mainly fell short because of issues that could’ve been foreseen and solved by better user research.
Tim Brown, the CEO of the innovation and design firm IDEO, sums it up nicely:
“Empathy is at the heart of design. Without the understanding of what others see, feel, and experience, design is a pointless task.”
? Bonus material Download User research checklist and a comparison table
Never forget – you are not your user.
You require proper user research to understand your user’s problems, pain points, needs, desires, feelings and behaviours.
Let’s start with the process!
Before you get in touch with your target users, you need to define why you are doing the research in the first place.
Establish clear objectives and agree with your team on your exact goals – this will make it much easier to gain valuable insights. Otherwise, your findings will be all over the place.
Here are some sample questions that will help you to define your objectives:
- What do you want to uncover?
- What are the knowledge gaps that you need to fill?
- What is already working and what isn’t?
- Is there a problem that needs to be fixed? What is that problem?
- What will the research bring to the business and/or your customers?
Once you start answering questions like these, it’s time to make a list of objectives. These should be specific and concise .
Let’s say you are making a travel recommendation app. Your research goals could be:
- Understand the end-to-end process of how participants are currently making travel decisions.
- Uncover the different tools that participants are using to make travel decisions.
- Identify problems or barriers that they encounter when making travel decisions.
I suggest that you prioritize your objectives and create an Excel table. It will come in handy later.
Go ahead, create that fake persona
A useful exercise for you to do at this stage is to write down some hypotheses about your target users.
Ask yourself:
What do we think we understand about our users that is relevant to our business or product?
Yes, brainstorm the heck out of this persona, but keep it relevant to the topic at hand.
Here’s my empathy map and empathy map canvas to really help you flesh out your imaginary user.
Once you’re finished, research any and every statement , need and desire with real people.
It’s a simple yet effective way to create questions for some of the research methods that you’ll be using.
However, you need to be prepared to throw some of your assumptions out of the window. If you think this persona may affect your bias, don’t bother with hypotheses and dive straight into research with a completely open mind.
Alright, you have your research goals. Now let’s see how you can reach them.
Here’s the main question you should be asking yourself at this step in the process:
Based on our time and manpower, what methods should we select?
It’s essential to pick the right method at the right time . I’ll delve into more details on specific methods in Step #4. For now, let’s take a quick look at what categories you can choose from.
Qualitative research tells you ‘why’ something occurs. It tells you the reasons behind the behavior, the problem or the desire. It answers questions like: “ Why do you prefer using app X instead of other similar apps?” or “What’s the hardest part about being a sales manager? Why?” .
Qualitative data comes in the form of actual insights and it’s fairly easy to understand.
Most of the methods we’ll look at in Step #4 are qualitative methods.
Quantitative research helps you to understand what is happening by providing different metrics.
It answers questions such as “What percentage of users left their shopping cart without completing the purchase?” or “Is it better to have a big or small subscription button?”.
Most quantitative methods come in handy when testing your product, but not so much when you’re researching your users. This is because they don’t tell you why particular trends or patterns occur.
There is a big difference between “what people do” and “what people say”.
As their names imply, attitudinal research is used to understand or measure attitudes and beliefs, whereas behavioral research is used to measure and observe behaviors.
Here’s a practical landscape that will help you choose the best methods for you. If it doesn’t make sense now, return to it once you’ve finished the guide and you’ll have a much better understanding.
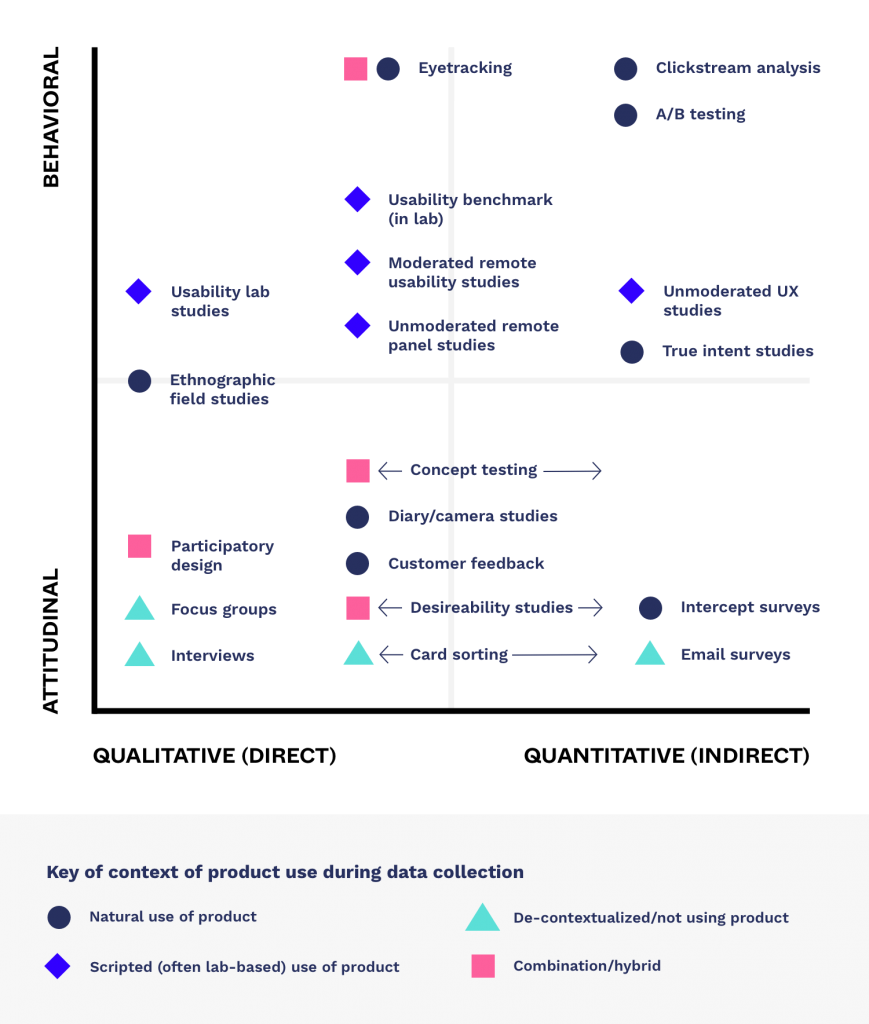
Source: Nielsen Norman Group
I’ll give you my own suggestions and tips about the most common and useful methods in Step #4 – Conducting research.
In general, if your objectives are specific enough, it shouldn’t be too hard to see which methods will help you achieve them.
Remember that Excel table? Choose a method or two that will fulfill each objective and type it in the column beside it.
It won’t always be possible to carry out everything you’ve written down. If this is the case, go with the method(s) that will give you most of the answers. With your table, it will be easy to pick and choose the most effective options for you.
Onto the next step!

This stage is all about channeling your inner Sherlock and finding the people with the secret intel for your product’s success.
Consider your niche, your objectives and your methods – this should give you a general idea of the group or groups you want to talk to and research further.
Here’s my advice for most cases.
If you’re building something from the ground up, the best participants might be:
- People you assume face the problem that your product aims to solve
- Your competitors’ customers
If you are developing something or solving a problem for an existing product, you should also take a look at:
- Advocates and super-users
- Customers who have recently churned
- Users who tried to sign up or buy but decided not to commit

There are plenty of ways to bring on participants, and you can get creative so long as you keep your desired target group in mind.
You can recruit them online – via social media, online forums or niche community sites.
You can publish an ad with requirements and offer some kind of incentive.
You can always use a recruitment agency, too. This can be costly, but it’s also efficient.
If you have a user database and are changing or improving your product, you can find your participants in there. Make sure that you contact plenty of your existing users, as most of them won’t respond.
You can even ask your friends to recommend the right kind of people who you wouldn’t otherwise know.
With that said, you should always be wary of including friends in your research . Sure, they’re the easiest people to reach, but your friendship can (and probably will) get in the way of obtaining honest answers. There are plenty of horror stories about people validating their “brilliant” ideas with their friends, only to lose a fortune in the future. Only consider them if you are 100% sure that they will speak their mind no matter what.
That depends on the method. If you’re not holding a massive online survey, you can usually start with 5 people in each segment . That’s enough to get the most important unique insights. You can then assess the situation and decide whether or not you need to expand your research.
Finally! Let’s go through some of the more common methods you’ll be using, including their pros and cons, some pro tips, and when you should use them.
Engaging in one-on-one discussions with users enables you to acquire detailed information about a user’s attitudes, desires, and experiences. Individual concerns and misunderstandings can be directly addressed and cleared up on the spot.
Interviews are time-consuming, especially on a per participant basis. You have to prepare for them, conduct them, analyze them and sometimes even transcribe them. They also limit your sample size, which can be problematic. The quality of your data will depend on the ability of your interviewer, and hiring an expert can be expensive.
- Prepare questions that stick to your main topics. Include follow-up questions for when you want to dig deeper into certain areas.
- Record the interview . Don’t rely on your notes. You don’t want to interrupt the flow of the interview by furiously scribbling down your answers, and you’ll need the recording for any potential in-depth analysis later on.
- Conduct at least one trial run of the interview to see if everything flows and feels right. Create a “playbook” on how the interview should move along and update it with your findings.
- If you are not comfortable with interviewing people, let someone else do it or hire an expert interviewer. You want to make people feel like they are talking to someone they know, rather than actually being interviewed. In my experience, psychologists are a great choice for an interviewer.
Interviews are not really time-sensitive, as long as you do them before the development process.
However, they can be a great supplement to online surveys and vice-versa. Conducting an interview beforehand helps you to create a more focused and relevant survey, while conducting an interview afterwards helps you to explain the survey answers.
Surveys are generally conducted online, which means that it’s possible to gather a lot of data in a very short time for a very low price . Surveys are usually anonymous, so users are often more honest in their responses.
It’s more difficult to get a representative sample because it’s tough to control who takes part in the survey – especially if you post it across social media channels or general forums. Surveys are quite rigid and if you don’t account for all possible answers, you might be missing out on valuable data. You have to be very careful when choosing your questions – poorly worded or leading ones can negatively influence how users respond. Length can also be an issue, as many people hate taking long surveys.
- Keep your surveys brief , particularly if participants won’t be compensated for their time. Only focus on what is truly important.
- Make sure that the questions can be easily understood. Unclear or ambiguous questions result in data on which you can’t depend. Keep the wording as simple as possible.
- Avoid using leading questions. Don’t ask questions that assume something, such as “What do you dislike about X?”. Replace this with “What’s your experience with X?”.
- Find engaged, niche online communities that fit your user profile. You’ll get more relevant data from these.
Similar to interviews. It depends on whether you want to use the survey as a preliminary method, or if you want a lot of answers to a few, very focused questions.

Focus Groups
Focus groups are moderated discussions with around 5 to 10 participants, the intention of which is to gain insight into the individuals’ attitudes, ideas and desires.
As focus groups include multiple people, they can quickly reveal the desires, experiences, and attitudes of your target audience . They are helpful when you require a lot of specific information in a short amount of time. When conducted correctly, they can act like interviews on steroids.
Focus groups can be tough to schedule and manage. If the moderator isn’t experienced, the discussion can quickly go off-topic. There might be an alpha participant that dictates the general opinion, and because it’s not one-on-one, people won’t always speak their mind.
- Find an experienced moderator who will lead the discussion. Having another person observing and taking notes is also highly recommended, as he or she can emphasize actionable insights and catch non-verbal clues that would otherwise be missed.
- Define the scope of your research . What questions will you ask? How in-depth do you want to go with the answers? How long do you want each discussion to last? This will determine how many people and groups should be tested.
- If possible, recruit potential or existing users who are likely to provide good feedback, yet will still allow others to speak their mind. You won’t know the participants most of the time, so having an experienced moderator is crucial.
Focus groups work best when you have a few clear topics that you want to focus on.
Competitive Analysis
A competitive analysis highlights the strengths and weaknesses of existing products . It explores how successful competitors act on the market. It gives you a solid basis for other user research methods and can also uncover business opportunities. It helps you to define your competitive advantage , as well as identify different user types.
A competitive analysis can tell you what exists, but not why it exists. You may collect a long feature list, but you won’t know which features are valued most by users and which they don’t use at all. In many cases, it’s impossible to tell how well a product is doing, which makes the data less useful. It also has limited use if you’re creating something that’s relatively new to the market.
- Create a list or table of information that you want to gather – market share, prices, features, visual design language, content, etc.
- Don’t let it go stale. Update it as the market changes so that you include new competitors.
- If you find something really interesting but don’t know the reason behind it, conduct research among your competitor’s users .
- After concluding your initial user research, go over the findings of your competitive analysis to see if you’ve discovered anything that’s missing on the market .
It can be a great first method, especially if you’re likely to talk to users of your competitors’ products

Field Studies
Field studies are research activities that take place in the user’s context, rather than at your company or office. Some are purely observational (the researcher is a “fly on the wall”), others are field interviews, and some act as a demonstration of pain points in existing systems.
You really get to see the big picture – field studies allow you to gain insights that will fundamentally change your product design . You see what people actually do instead of what they say they do. A field study can explain problems and behaviours that you don’t understand better than any other method.
It’s the most time-consuming and expensive method. The results rely on the observer more than any of the other options. It’s not appropriate for products that are used in rare and specific situations.
- Establish clear objectives. Always remember why you are doing the research. Field studies can provide a variety of insights and sometimes it can be hard to stay focused. This is especially true if you are participating in the observed activity.
- Be patient. Observation might take some time. If you rush, you might end up with biased results.
- Keep an open mind and don’t ask leading questions. Be prepared to abandon your preconceptions, assumptions and beliefs. When interviewing people, try to leave any predispositions or biases at the door.
- Be warm but professional. If you conduct interviews or participate in an activity, you won’t want people around you to feel awkward or tense. Instead, you’ll want to observe how they act naturally.
Use a field study when no other method will do or if it becomes clear that you don’t really understand your user. If needed, you should conduct this as soon as possible – it can lead to monumental changes.
We started with a user persona and we’ll finish on this topic, too. But yours will be backed by research 😉
A persona outlines your ideal user in a concise and understandable way. It includes the most important insights that you’ve discovered. It makes it easier to design products around your actual users and speak their language. It’s a great way to familiarize new people on your team with your target market.
A persona is only as good as the user research behind it. Many companies create a “should be” persona instead of an actual one. Not only can such a persona be useless, it can also be misleading.
- Keep personas brief. Avoid adding unnecessary details and omit information that does not aid your decision making. If a persona document is too long, it simply won’t be used.
- Make personas specific and realistic. Avoid exaggerating and include enough detail to help you find real people that represent your ideal user.
Create these after you’ve carried out all of the initial user research. Compile your findings and create a persona that will guide your development process.
Now you know who you are creating your product for – you’ve identified their problems, needs and desires. You’ve laid the groundwork, so now it’s time to design a product that will blow your target user away! But that’s a topic for a whole separate guide, one that will take you through the process of product development and testing 😉
PS. Don’t forget -> Here is your ? User Research Checklist and comparison table
About the author

Oh hey, I’m Romina Kavcic
I am a Design Strategist who holds a Master of Business Administration. I have 14+ years of career experience in design work and consulting across both tech startups and several marquee tech unicorns such as Stellar.org, Outfit7, Databox, Xamarin, Chipolo, Singularity.NET, etc. I currently advise, coach and consult with companies on design strategy & management, visual design and user experience. My work has been published on Forbes, Hackernoon, Blockgeeks, Newsbtc, Bizjournals, and featured on Apple iTunes Store.
More about me * Let’s connect on Linkedin * Let’s connect on Twitter

Explore more
Username or email address *
Password *
Remember me Log in
Lost your password?
Insert/edit link
Enter the destination URL
Or link to existing content
New NPM integration: design with fully interactive components from top libraries!
Top Methods of Identifying User Needs

User needs are the specific requirements and expectations of users that a product or service should fulfill to provide value and enhance their experience. These needs represent users’ perspectives, goals, motivations, pain points , and other human factors.
By identifying and addressing user needs, UX designers can create relevant, usable, and possible solutions for the target audience. User needs help define the scope and direction of the product development process, influencing key decisions such as functionality, features, layout, and interaction design.
Understanding user needs also enables designers to prioritize design elements, allocate resources effectively, and make informed design decisions . Make better design decisions with UXPin’s interactive prototypes. Sign up for a free trial to explore UXPin’s advanced features.
Build advanced prototypes
Design better products with States, Variables, Auto Layout and more.

Desk research
Desk research (secondary research) is valuable for gathering information and insights to understand user needs based on existing data from various internal and external sources. This data can come from published materials, academic papers, industry reports, social media, online resources, and other third-party data sources.
User interviews

Interviews are a widely used user research method that involves direct conversations with end users to gather insights, understand their perspectives, and uncover their needs.
Researchers ask questions and prompt participants to share their experiences, opinions, and expectations about a product or service. Interviews provide rich qualitative data and allow researchers to delve deeper into users’ thoughts and emotions.
- Structured interviews : follow a predetermined set of questions and a fixed order, allowing for consistency and comparability in data collection. They help gather specific information from participants systematically.
- Semi-structured interviews : offer more flexibility, combining predefined questions with the freedom to explore additional topics and follow up on participants’ responses. This approach encourages participants to express themselves more freely, providing richer insights.
- User story interviews : focus on understanding users’ goals, motivations, and behaviors by having them narrate their experiences through storytelling. These interviews capture the user’s journey and provide valuable context for understanding their needs and expectations.
Surveys and questionnaires

Surveys and questionnaires are popular user research methods that systematically collect data from many participants. Surveys typically consist of questions designed to gather quantitative or qualitative data about users’ preferences, opinions, behaviors, and demographics.
They provide researchers with a structured approach to gathering insights from a broader audience, allowing for statistical analysis and identification of trends.
- Surveys : allow researchers to reach a wide audience and collect data efficiently, providing quantitative insights. Surveys are beneficial for gathering feedback on specific features, user satisfaction, or demographic information.
- Likert scale questionnaires : use a series of statements or items with response options, allowing participants to rate their level of agreement or disagreement. This method provides researchers with quantitative data to statistically analyze user preferences, perceptions, or attitudes.
Observation and field studies

Observation and field studies are user research methods that directly observe users in their natural environment to gain insights into their behaviors, needs, and experiences.
Researchers can gather rich qualitative data that helps uncover user needs and understand the context in which people use products or services.
- Contextual inquiry : combines observation and interviewing techniques to understand users’ workflows and the context in which they perform tasks. Researchers observe users in their work or living environment and engage in conversations to gain deeper insights into their needs, motivations, and challenges.
- Ethnographic research : involves immersing oneself in the users’ cultural or social context to better understand their behaviors, values, and norms. Researchers spend an extended period with the users, observing and participating in their daily activities, to uncover deep insights that influence design decisions.
- Diary studies : involve participants documenting their experiences, behaviors, or interactions over time. Participants record their thoughts, activities, and emotions in a diary or journal, providing researchers with detailed and longitudinal data. Diary studies offer insights into users’ daily lives, habits, and pain points, helping to identify patterns and uncover unmet needs.
Focus groups

Focus groups are small groups of participants engaging in a guided discussion about a specific topic or product. This method allows researchers to collect qualitative data by leveraging group dynamics and participant interactions.
Participants can share their opinions, ideas, and experiences in a focus group, providing valuable insights into user needs and preferences.
- Plan and conduct effective focus groups by defining clear objectives, selecting appropriate participants, creating a discussion guide, and facilitating the session effectively. Creating a comfortable and inclusive environment encourages participants to express their thoughts and opinions freely.
- Analyze and synthesize focus group data to identify patterns, themes, and key insights. This analysis involves transcribing or reviewing the discussion, extracting meaningful data points, and organizing them into categories. Researchers can use affinity mapping or thematic analysis techniques to make sense of the data and draw meaningful conclusions.
Usability testing

Usability testing evaluates a product or interface’s usability and user experience. It involves observing users performing specific tasks and providing feedback on their interactions. Usability testing helps identify usability issues, understand user behavior, and gather insights for improving the design.
- Moderated usability testing : a researcher facilitates the session and guides participants through predefined tasks while observing their interactions and gathering feedback. The researcher can ask follow-up questions, clarify uncertainties, and delve deeper into participants’ thoughts and experiences.
- Remote usability testing : researchers use video conferencing or screen-sharing tools to observe their interactions and gather feedback.
- Thinking aloud : participants are encouraged to verbalize their thoughts, feelings, and decision-making processes as they navigate a digital product. This narration provides valuable insights into users’ cognitive processes and helps uncover usability issues.
Data Analysis and Synthesis

Data analysis and synthesis is a crucial step in user research that involves organizing, examining, and interpreting the collected data to derive meaningful insights.
Qualitative analysis
UX researchers use qualitative analysis methods to analyze and make sense of qualitative data , such as interview transcripts, observation notes, and open-ended survey responses.
- Thematic analysis involves identifying and categorizing recurring themes, patterns, and concepts within the qualitative data. Researchers review the data, generate codes or labels to represent key ideas, and then group similar codes into broader themes to identify meaningful patterns.
- Affinity diagrams organize qualitative data by grouping related ideas or concepts. Researchers write each finding on sticky notes and then arrange and rearrange them on a wall or board to discover connections and identify patterns or themes.
- Narrative analysis examines the structure, content, and meaning of individual stories participants share. Researchers analyze the storytelling elements, underlying themes, and narrative arcs to gain insights into users’ experiences, perspectives, and motivations.
Quantitative analysis
Quantitative analysis methods analyze numerical data and metrics collected through surveys, questionnaires, and quantitative research studies.
- Statistical analysis applies various statistical techniques to analyze and interpret quantitative data. Researchers use measures of central tendency, dispersion, correlation, and statistical tests to identify data relationships, trends, and patterns.
- Data visualization represents quantitative data using charts, graphs, and other visual representations. Visualizing data helps researchers and stakeholders easily understand patterns, trends, and relationships within the data.
- Pattern recognition helps identify recurring patterns, trends, or anomalies within quantitative data. Researchers look for clusters, outliers, or other patterns that can provide insights into user behavior, preferences, or trends.
Combining multiple methods
Combining multiple research methods enables researchers to validate ideas and identify user needs from various sources, providing more accurate and reliable data.
- Triangulation : Combining multiple user research methods, such as interviews, observations, and surveys, to cross-validate findings and increase the reliability and validity of the data.
- Mixed-methods approach : Integrating qualitative and quantitative research methods, such as combining interviews with surveys or usability testing with analytics, to comprehensively understand user needs and obtain richer insights.
Integrating User Needs into Design
Designers analyze and interpret user research findings to identify specific design requirements that address user needs. These requirements serve as guidelines for the design process, ensuring that the resulting solutions align with user expectations and user-centered design principles.
Designers create several documents and visualizations to guide the design process, including user need statements , personas , case studies , and other UX artifacts .
Design teams also meet with stakeholders to integrate business goals and user needs . They must consider user feedback, conduct usability testing, and incorporate iterative feedback loops to achieve the right balance. This iterative approach allows designers to continuously refine their solutions based on user needs, preferences, and feedback.
Advanced Prototyping and Testing With UXPin
UXPin’s advanced prototyping features enable design teams to build accurate replicas of the final product. These fully interactive prototypes allow designers to observe and analyze user behavior, preferences, and pain points, validating whether designs effectively address user needs.
Users and stakeholders can interact with user interfaces like they would the final product, giving designers meaningful, actionable insights to iterate and improve.
Whether you’re a startup looking to validate a new product idea or an enterprise team looking to scale your DesignOps, UXPin has a solution for your business. Sign up for a free trial to explore the world’s most advanced UX design tool.
Build prototypes that are as interactive as the end product. Try UXPin

by UXPin on 5th July, 2023
UXPin is a web-based design collaboration tool. We’re pleased to share our knowledge here.
UXPin is a product design platform used by the best designers on the planet. Let your team easily design, collaborate, and present from low-fidelity wireframes to fully-interactive prototypes.
No credit card required.
These e-Books might interest you

Design Systems & DesignOps in the Enterprise
Spot opportunities and challenges for increasing the impact of design systems and DesignOps in enterprises.

DesignOps Pillar: How We Work Together
Get tips on hiring, onboarding, and structuring a design team with insights from DesignOps leaders.
We use cookies to improve performance and enhance your experience. By using our website you agree to our use of cookies in accordance with our cookie policy.
- Reviews / Why join our community?
- For companies
- Frequently asked questions
UX Research
What is ux research.
UX (user experience) research is the systematic study of target users and their requirements, to add realistic contexts and insights to design processes. UX researchers adopt various methods to uncover problems and design opportunities. Doing so, they reveal valuable information which can be fed into the design process.
See why UX research is a critical part of the UX design process.
- Transcript loading…
UX Research is about Finding Insights to Guide Successful Designs
When you do UX research, you’ll be better able to give users the best solutions—because you can discover exactly what they need. You can apply UX research at any stage of the design process. UX researchers often begin with qualitative measures, to determine users’ motivations and needs . Later, they might use quantitative measures to test their results . To do UX research well, you must take a structured approach when you gather data from your users. It’s vital to use methods that 1) are right for the purpose of your research and 2) will give you the clearest information. Then, you can interpret your findings so you can build valuable insights into your design .
“I get very uncomfortable when someone makes a design decision without customer contact.” – Dan Ritzenthaler, Senior Product Designer at HubSpot
We can divide UX research into two subsets:
Qualitative research – Using methods such as interviews and ethnographic field studies, you work to get an in-depth understanding of why users do what they do (e.g., why they missed a call to action, why they feel how they do about a website). For example, you can do user interviews with a small number of users and ask open-ended questions to get personal insights into their exercise habits. Another aspect of qualitative research is usability testing , to monitor (e.g.) users’ stress responses. You should do qualitative research carefully. As it involves collecting non-numerical data (e.g., opinions, motivations), there’s a risk that your personal opinions will influence findings.
Quantitative research – Using more-structured methods (e.g., surveys, analytics), you gather measurable data about what users do and test assumptions you drew from qualitative research. For example, you can give users an online survey to answer questions about their exercise habits (e.g., “How many hours do you work out per week?”). With this data, you can discover patterns among a large user group. If you have a large enough sample of representative test users, you’ll have a more statistically reliable way of assessing the population of target users. Whatever the method, with careful research design you can gather objective data that’s unbiased by your presence, personality or assumptions. However, quantitative data alone can’t reveal deeper human insights.
We can additionally divide UX research into two approaches:
Attitudinal – you listen to what users say—e.g., in interviews.
Behavioral – you see what users do through observational studies.
When you use a mix of both quantitative and qualitative research as well as a mix of attitudinal and behavioral approaches, you can usually get the clearest view of a design problem.

© Interaction Design Foundation, CC BY-SA 4.0
Use UX Research Methods throughout Development
The Nielsen Norman Group—an industry-leading UX consulting organization—identifies appropriate UX research methods which you can use during a project’s four stages . Key methods are:
Discover – Determine what is relevant for users.
Contextual inquiries – Interview suitable users in their own environment to see how they perform the task/s in question.
Diary studies – Have users record their daily interactions with a design or log their performance of activities.
Explore – Examine how to address all users’ needs.
Card sorting – Write words and phrases on cards; then let participants organize them in the most meaningful way and label categories to ensure that your design is structured in a logical way.
Customer journey maps – Create user journeys to expose potential pitfalls and crucial moments.
Test – Evaluate your designs.
Usability testing – Ensure your design is easy to use.
Accessibility evaluations – Test your design to ensure it’s accessible to everyone.
Listen – Put issues in perspective, find any new problems and notice trends.
Surveys/Questionnaires – Use these to track how users’ feel about your product.
Analytics – Collect analytics/metrics to chart (e.g.) website traffic and build reports.
- Copyright holder: Unsplash. Copyright terms and license: CCO Public Domain. Link: https://pixabay.com/en/clay-hands-sculpting-art-69...
- Copyright holder: Unsplash. Copyright terms and license: CCO Public Domain. Link: https://www.pexels.com/photo/man-in-black-shirt-an...
- Copyright holder: Indecent Proposer. Copyright terms and license: CC BY-NC 2.0 Link: https://www.flickr.com/photos/indecent_proposal/14...
- Copyright holder: Anna Langova. Copyright terms and license: CC0 1.0 Link: http://www.publicdomainpictures.net/view-image.php...
- Copyright holder: Conmongt. Copyright terms and license: CC0 Public Domain Link: https://pixabay.com/en/hourglass-time-time-lapse-clock-1623517/
Whichever UX research method you choose, you need to consider the pros and cons of the different techniques . For instance, card sorting is cheap and easy, but you may find it time-consuming when it comes to analysis. Also, it might not give you in-depth contextual meaning. Another constraint is your available resources , which will dictate when, how much and which type of UX research you can do. So, decide carefully on the most relevant method/s for your research . Moreover, involve stakeholders from your organization early on . They can reveal valuable UX insights and help keep your research in line with business goals. Remember, a design team values UX research as a way to validate its assumptions about users in the field , slash the cost of the best deliverables and keep products in high demand —ahead of competitors’.

User research methods have different pros and cons,and vary from observations of users in context to controlled experiments in lab settings.
Learn More about UX Research
For a thorough grasp of UX research, take our course here: User Research – Methods and Best Practices
Read an extensive range of UX research considerations, discussed in Smashing Magazine: A Comprehensive Guide To UX Research
See the Nielsen Norman Group’s list of UX research tips: UX Research Cheat Sheet
Here’s a handy, example-rich catalog of UX research tools: 43 UX research tools for optimizing your product
Questions related to UX Research
UX research is a good career for those who enjoy working with a team and have strong communication skills. As a researcher, you play a crucial role in helping your team understand users and deliver valuable and delightful experiences. You will find a UX research career appealing if you enjoy scientific and creative pursuits.
Start exploring this career option; see the User Researcher Learning Path .
Studies suggest that companies are also willing to pay well for research roles. The average salary for a UX researcher ranges from $92,000 to $146,000 per year.
In smaller companies, user research may be one of the responsibilities of a generalist UX designer. How much can your salary vary based on your region? Find out in UI & UX Designer Salaries: How Much Can I Earn .
Research is one part of the overall UX design process. UX research helps inform the design strategy and decisions made at every step of the design process. In smaller teams, a generalist designer may end up conducting research.
A UX researcher aims to understand users and their needs. A UX designer seeks to create a product that meets those needs.
A UX researcher gathers information. A UX designer uses that information to create a user-friendly and visually appealing product.
Learn more about the relationship between UX research and UX design in the course:
User Experience: The Beginner’s Guide
If we consider a very broad definition of UX, then all user research is UX research.
However, in practice, there is a subtle difference between user research and UX research. While both involve understanding people, user research can involve users in any kind of research question, and some questions may not be that directly connected to user experience.
For example, you might do user research relating to a customer’s experience in relation to pricing, delivery or the experience across multiple channels.
Common UX research methods are usability testing, A/B testing, surveys, card sorting, user interviews, usage analytics and ethnographic research. Each method has its pros and cons and is useful in different scenarios. Hence, you must select the appropriate research method for the research question and target audience. Learn more about these methods in 7 Great, Tried and Tested UX Research Techniques .
Get started with user research. Download the User Research template bundle .

For a deep dive into usability testing—the most common research method, take the course Conducting Usability Testing .
Having a degree in a related field can give you an advantage. However, you don’t need a specific degree to become a UX researcher. A combination of relevant education, practical experience, and continuous learning can help you pursue a career in UX research. Many UX researchers come from diverse educational backgrounds, including psychology, statistics, human-computer interaction, information systems, design and anthropology.
Some employers may prefer candidates with at least a bachelor’s degree. However, it does not have to be in a UX-related field. There are relatively fewer degrees that focus solely on user research.
Data-Driven Design: Quantitative Research for UX
User Research – Methods and Best Practices
Every research project will vary. However, there are some common steps in conducting research, no matter which method or tool you decide to use:
Define the research question
Select the appropriate research method
Recruit participants
Conduct the research
Analyze the data
Present the findings
You can choose from various UX research tools . Your choice depends on your research question, how you're researching, the size of your organization, and your project. For instance:
Survey tools such as Typeform and Google Forms.
Card sorting tools such as Maze and UXtweak.
Heatmap tools such as HotJar and CrazyEgg
Usability testing (through first-click testing and tree-testing) tools such as Optimal Workshop and Loop 11
Diagramming applications such as Miro and Whimsical to analyze qualitative data through affinity diagramming.
Spreadsheet tools such as Google Sheets and Microsoft Excel for quantitative data analysis
Interface design and prototyping tools like Figma, Adobe XD, Sketch and Marvel to conduct usability testing.
Presentation tools such as Keynote, Google Slides and Microsoft PowerPoint.
Many of these tools offer additional features you can leverage for multiple purposes. To understand how you can make the most of these tools, we recommend these courses:
There are relatively fewer degrees that focus solely on user research.
While there are no universal research case study formats, here’s one suggested outline:
An overview of the project: Include the problem statement, goals and objectives.
The research methods and methodology: For example, surveys, interviews, or usability testing).
Research findings
The design process: How the research findings led to design decisions.
Impact of design decisions on users and the business: Include metrics such as conversion and error rates to demonstrate the impact.
Optionally, include notes on what you learned and how you can improve the process in the future.
Learn how to showcase your portfolio to wow your future employer/client in the How to Create a UX Portfolio course.
While AI can help automate tasks and help UX researchers, it will not completely replace them. AI lacks the creativity and empathy that human designers bring to the table.
Human researchers are better at understanding the nuances of human behavior and emotions. They can also think outside the box and develop creative solutions that AI cannot. So, AI can help researchers be more efficient and effective through data analysis, smart suggestions and automation. But it cannot replace them.
Watch AI-Powered UX Design: How to Elevate Your UX Career to learn how you can work with AI.
Agile teams often struggle to incorporate user research in their workflows due to the time pressure of short sprints. However, that doesn’t mean agile teams can’t conduct research. Instead of seeing research as one big project, teams can break it into bite-sized chunks. Researchers regularly conduct research and share their findings in every sprint.
Researchers can involve engineers and other stakeholders in decision-making to give everyone the context they need to make better decisions. When engineers participate in the decision-making process, they can ensure that the design will be technically feasible. There will also be lower chances of errors when the team actually builds the feature. Here’s more on how to make research a team effort .
For more on bite-sized research, see this Master Class: Continuous Product Discovery: The What and Why
For more practical tips and methods to work in an agile environment, take our Agile Methods for UX Design course.
User research is very important in designing products people will want and use. It helps us avoid designing based on what we think instead of what users actually want.
UX research helps designers understand their users’ needs, behaviors, attitudes and how they interact with a product or service. Research helps identify usability problems, gather feedback on design concepts, and validate design decisions. This ultimately benefits businesses by improving the product, brand reputation and loyalty. A good user experience provides a competitive edge and reduces the risk of product failure.
Learn more about the importance of user research in the design process in these courses:
Design Thinking: The Ultimate Guide
Answer a Short Quiz to Earn a Gift
What is the primary purpose of UX research in design processes?
- To ensure the product is visually appealing.
- To reduce the cost of marketing the product.
- To understand user needs and enhance design decisions.
Which type of UX research do designers use to collect non-numerical data such as opinions and motivations?
- Behavioral research
- Qualitative research
- Quantitative research
Which UX research method involves users sorting terms into categories to help structure design logically?
- Card sorting
- Information architecture
- Usability testing
What is a potential drawback of using card sorting in UX research?
- It can be expensive and requires special software.
- It may not provide deep contextual insights.
- It only works for digital products.
How does UX research primarily benefit a design team in a business context?
- It focuses exclusively on the aesthetic aspects of product design.
- It reduces dependency on technology.
- It validates design assumptions and keeps products competitive.
Better luck next time!
Do you want improve your UX / UI Design skills? Join us now
Congratulations! You did amazingly
We'd love to show our appreciation by sending you a special gift.
Check your inbox
We’ve emailed [email protected] with your gift.
Literature on UX Research
Here’s the entire UX literature on UX Research by the Interaction Design Foundation, collated in one place:
Learn more about UX Research
Take a deep dive into UX Research with our course User Research – Methods and Best Practices .
How do you plan to design a product or service that your users will love , if you don't know what they want in the first place? As a user experience designer, you shouldn't leave it to chance to design something outstanding; you should make the effort to understand your users and build on that knowledge from the outset. User research is the way to do this, and it can therefore be thought of as the largest part of user experience design .
In fact, user research is often the first step of a UX design process—after all, you cannot begin to design a product or service without first understanding what your users want! As you gain the skills required, and learn about the best practices in user research, you’ll get first-hand knowledge of your users and be able to design the optimal product—one that’s truly relevant for your users and, subsequently, outperforms your competitors’ .
This course will give you insights into the most essential qualitative research methods around and will teach you how to put them into practice in your design work. You’ll also have the opportunity to embark on three practical projects where you can apply what you’ve learned to carry out user research in the real world . You’ll learn details about how to plan user research projects and fit them into your own work processes in a way that maximizes the impact your research can have on your designs. On top of that, you’ll gain practice with different methods that will help you analyze the results of your research and communicate your findings to your clients and stakeholders—workshops, user journeys and personas, just to name a few!
By the end of the course, you’ll have not only a Course Certificate but also three case studies to add to your portfolio. And remember, a portfolio with engaging case studies is invaluable if you are looking to break into a career in UX design or user research!
We believe you should learn from the best, so we’ve gathered a team of experts to help teach this course alongside our own course instructors. That means you’ll meet a new instructor in each of the lessons on research methods who is an expert in their field—we hope you enjoy what they have in store for you!
All open-source articles on UX Research
7 great, tried and tested ux research techniques.

- 1.2k shares
- 3 years ago
The Ultimate Guide to Understanding UX Roles and Which One You Should Go For

Shadowing in User Research - Do You See What They See?

Contextual Interviews and How to Handle Them

15 Guiding Principles for UX Researchers

Ethnography

Porter’s 5 Forces Model - Design in Context, Understand the Market

- 7 years ago
Ideas for Conducting UX Research with Children

Laddering Questions Drilling Down Deep and Moving Sideways in UX Research

Action Research
4 common pitfalls in usability testing and how to avoid them to get more honest feedback.

Confirmation Bias – It’s Not What We Think We Know That Counts

User Research Methods for Mobile UX

- 10 mths ago
The Top UX Design Books You Need to Read in 2024: Beginner to Expert

6 Tips for Better International UX Research

Team Research

- 2 years ago
Adding Quality to Your Design Research with an SSQS Checklist

- 8 years ago
Common UX Research Interview Questions

How to Fit Quantitative Research into the Project Lifecycle

The Best Free UX Design Courses in 2024

Open Access—Link to us!
We believe in Open Access and the democratization of knowledge . Unfortunately, world-class educational materials such as this page are normally hidden behind paywalls or in expensive textbooks.
If you want this to change , cite this page , link to us, or join us to help us democratize design knowledge !
Privacy Settings
Our digital services use necessary tracking technologies, including third-party cookies, for security, functionality, and to uphold user rights. Optional cookies offer enhanced features, and analytics.
Experience the full potential of our site that remembers your preferences and supports secure sign-in.
Governs the storage of data necessary for maintaining website security, user authentication, and fraud prevention mechanisms.
Enhanced Functionality
Saves your settings and preferences, like your location, for a more personalized experience.
Referral Program
We use cookies to enable our referral program, giving you and your friends discounts.
Error Reporting
We share user ID with Bugsnag and NewRelic to help us track errors and fix issues.
Optimize your experience by allowing us to monitor site usage. You’ll enjoy a smoother, more personalized journey without compromising your privacy.
Analytics Storage
Collects anonymous data on how you navigate and interact, helping us make informed improvements.
Differentiates real visitors from automated bots, ensuring accurate usage data and improving your website experience.
Lets us tailor your digital ads to match your interests, making them more relevant and useful to you.
Advertising Storage
Stores information for better-targeted advertising, enhancing your online ad experience.
Personalization Storage
Permits storing data to personalize content and ads across Google services based on user behavior, enhancing overall user experience.
Advertising Personalization
Allows for content and ad personalization across Google services based on user behavior. This consent enhances user experiences.
Enables personalizing ads based on user data and interactions, allowing for more relevant advertising experiences across Google services.
Receive more relevant advertisements by sharing your interests and behavior with our trusted advertising partners.
Enables better ad targeting and measurement on Meta platforms, making ads you see more relevant.
Allows for improved ad effectiveness and measurement through Meta’s Conversions API, ensuring privacy-compliant data sharing.
LinkedIn Insights
Tracks conversions, retargeting, and web analytics for LinkedIn ad campaigns, enhancing ad relevance and performance.
LinkedIn CAPI
Enhances LinkedIn advertising through server-side event tracking, offering more accurate measurement and personalization.
Google Ads Tag
Tracks ad performance and user engagement, helping deliver ads that are most useful to you.
Share Knowledge, Get Respect!
or copy link
Cite according to academic standards
Simply copy and paste the text below into your bibliographic reference list, onto your blog, or anywhere else. You can also just hyperlink to this page.
New to UX Design? We’re Giving You a Free ebook!

Download our free ebook The Basics of User Experience Design to learn about core concepts of UX design.
In 9 chapters, we’ll cover: conducting user interviews, design thinking, interaction design, mobile UX design, usability, UX research, and many more!
.webp)
User Needs: Understanding and Prioritizing in Product Development

- User research is crucial for product success : Engaging directly with users to understand their needs can lead to more satisfying products and a competitive edge in the market.
- Online surveys minimize user friction : They quickly gather user needs and behaviors, aiding in identifying usability issues and informing feature evaluation.
- Translating user needs into possible solutions : Accurately interpreting user feedback is essential for creating clear, actionable specifications that guide design and engineering.
- Prioritization balances user needs with business goals : Employing methods like MoSCoW helps determine which features will deliver significant value to both users and the company.
- Continuous iteration and feedback are key : Regularly updating products based on user needs ensures they remain relevant and aligned with changing user expectations.

Have you ever felt like a product was designed just for you? That's the magic of prioritizing user needs in product development. It's like finding a perfect fit—a rare delight, but oh-so-satisfying when it happens.
This article is a must-read for product managers, designers, and developers who aim to create products that resonate with their users. We'll explore the significance of understanding user needs, the challenges of aligning them with business goals, and practical methods for uncovering these golden nuggets of insight.
By the end of this read, you'll be equipped with strategies to not only identify what your users truly want but also prioritize these needs to ensure your product hits the mark.
Understanding user needs
In designing any product, understanding user needs is paramount to ensure that the end result is practical, enjoyable, and successful in the marketplace.
What are user needs?
User needs are the requirements and expectations that you, the user, have when interacting with a product or service. These range from basic functionality to deeper emotional satisfaction. Here's a breakdown:
- Functionality : Does the product do what you need it to do?
- Usability : How easy and intuitive is it for you to use the product?
- Aesthetics : Does the product's design appeal to you visually?
- Accessibility : Can you use the product regardless of any physical or technological barriers?
- Emotional Satisfaction : Does using the product make you feel good?
Why is it important to identify and understand user needs?
Identifying and understanding your needs is crucial for the creation of successful products. Here's why:
- User Satisfaction : A product tailored to your needs is more satisfying to use.
- Market Success : Products that meet user needs more effectively can outperform competitors.
- Efficiency : Understanding your needs can guide focused and efficient design efforts.
- Innovation : Insights into your needs can spark innovative solutions that push the product beyond the ordinary.
User research to address user needs
Identifying user needs is a foundational step in creating products and services that are both useful and relevant to your target audience.
User-centered design prioritizes gathering information and deep insights from direct conversations with end users. By having the user problem on the plate, product managers can better plan the long term vision of the product.
Effective identification relies on various user research methods to gather comprehensive and valuable insights.
Online surveys
Running surveys is one of the most popular research methods. Online surveys are a quick and cost-effective method to reach a large audience. They can help you conduct quantitative and qualitative research about user preferences and behaviors.
Focused, concise questions are great for gathering information on any usability issues, or generally how your end users evaluate specific features.
Delve deeper with multiple-choice and open-ended formats to maximize response rates and capture a broad spectrum of user needs.
When choosing software, check if the solution offers AI-enhanced data analysis. For example Survicate will automatically categorize and group answers to open-ended questions . It will save time to reach a clear understanding of users thoughts.
Interviews allow an in-depth understanding of your users by engaging in one-on-one conversations. Prepare open-ended questions to encourage detailed responses, and pay attention to verbal and non-verbal cues .
Interviews can uncover not only explicit user needs but also the implicit ones that surveys might miss that will help to draw the empathy maps
User observation
Observing users interact with your product in their natural environment offers invaluable context that can clarify their needs. Note patterns in user behavior and identify any difficulties they encounter.
Ethnographic methods and usability tests fall under this category and can provide a layer of detail unattainable through other forms.
Focus groups
Focus groups provide a platform for users to discuss their needs in a group setting, which can stimulate conversation and ideas that might not surface individually. Facilitate a structured discussion while encouraging participants to interact with one another, ensuring that you capture a wide range of perspectives and needs.
Analyzing user data
Collecting user data is the first step in understanding user needs. You need to analyze it to turn raw user data into actionable insights that can drive the product development process.
Data interpretation
When you analyze user data, you aim to extract meaning from the raw numbers and facts. Data interpretation involves segmenting users based on behaviors and examining usage statistics to understand how different features are engaged.
For example:
- Time spent : Average time users spend on your product.
- Feature usage : Frequency of use for various features within your product.
Identifying patterns
Recognizing patterns in user data leads to informed decisions about product adjustments. You should look for:
- Trends over Time : Such as increasing or decreasing engagement with specific features.
- User Segmentation : Break down data by demographics, behavior, or other relevant user characteristics.
Creating personas
Personas are fictional characters that embody the traits of your user segments. They help humanize the data, making it easier to empathize with and design for your users. When crafting personas, include:
- Demographics : Age, location, employment.
- Behaviors : Purchase history, usage patterns.
- Preferences : Liked features, pain points.
Translating user needs into requirements
In this section, you will learn how to convert effectively user needs into concrete design requirements, which includes breaking them into specifications, prioritizing for impact , and crafting user stories to guide development.
From user needs to specifications
To transform user needs into specifications, you must first accurately interpret the need. For instance, if users express a need for "easy operation," this could translate into a requirement for a highly intuitive interface.
You'll delineate these user needs into detailed specifications that designers and engineers can work with. A typical decomposition might look like this:
- User Need: Easy operation
- Intuitive navigation layout
- Clear labeling of functions
- Minimal steps to perform a task
- Responsive design for quick feedback
Prioritization of requirements
Once you've established a set of specifications based on user needs, the next step is prioritizing these requirements.
Not all requirements are equal; some will be more critical to user satisfaction or system functionality than others. You may employ a method such as MoSCoW (Must have, Should have, Could have, Won't have this time) to guide your prioritization.
- Must-have: Requirements crucial for basic functionality.
- Should-have: Important but not vital features; enhance user experience.
- Could-have: Desired features that are not critical; could improve engagement.
- Won't have: Low-priority items to be considered in the future.
Balancing user needs and business goals
While prioritizing user needs, it’s crucial to keep in mind the overall business goals. Your product should not only satisfy user needs but also contribute to business objectives like revenue growth, market penetration, and brand reputation.
Evaluate each user need against its business impact to determine which features will offer significant value to both users and your company. Ensure there is alignment among stakeholders to support a unified direction for product development.
Remember, your success lies in striking the right equilibrium; user needs steer product relevance, while business goals drive overall sustainability.

User stories creation
Creating user stories is a powerful way to encapsulate a requirement in the context of user interaction. Each user story is a short, simple description of a feature, told from the perspective of the person who desires the new capability, typically a user or customer of the system. For example:
- User story format: As a [type of user], I want [an action] so that [a benefit/a value].
- Example: As a frequent traveler, I want to easily find information on local buses so that I can reduce transit time.
By constructing your requirements around user stories, you ensure that the focus remains firmly on fulfilling user needs and delivering true value with every feature you develop.
Designing for user needs
Designing for user needs is a practice centered around understanding and addressing the specific requirements, goals, and context of the end-users of a product or service.
Incorporating user feedback
To ensure your product aligns with user needs, actively seek and incorporate user feedback . Surveys, interviews, and usability testing provide direct insights into user preferences and pain points. Use these insights to guide your design decisions and prioritize features.
User-centered design
Adopt a user-centered design (UCD) approach to make your product intuitive and accessible. Focus on the following core principles :
- Understanding user needs, behaviors, and goals
- Involving users throughout the design and development process
- Evaluating designs against user feedback
Iterative design process
Implement an iterative design process comprised of repeated prototyping, testing, and refinement cycles. This lets you evolve your design incrementally, basing each iteration on concrete user feedback and usage data.
Document each iteration , noting changes made and the rationale behind them to maintain a clear view of your design evolution.
User needs validation
When designing products or services, validating user needs is essential to ensure solutions meet real-world requirements effectively.
Incorporating user feedback through various testing methods plays a critical role in achieving this fit between user needs and product design.
Usability testing
Usability testing allows you to evaluate a product by testing it on real users. This involves observing users as they attempt to complete tasks and can include the following methods:
- Evaluative testing: You perform this with your actual product in a controlled setting to identify where users encounter problems and experience confusion.
- Remote usability testing : You can conduct these tests remotely to gather data from users in their natural environment.
Ensure that both qualitative and quantitative data are collected to understand not only what issues are encountered but also why they occur.
A/B testing
A/B testing is a quantitative method of comparing two versions of a product or feature to determine which one performs better. It involves these steps:
- Hypothesis formation: You begin by formulating a hypothesis based on user needs you want to address.
- Variant freation: Create two or more variants of a single element of your product.
- Metrics selection: Decide on metrics that accurately reflect user behavior in relation to the tested elements.
- Experimentation: Randomly serve these variants to different user segments and measure performance.
Analysis of A/B test results should be statistically sound to make confident decisions about which variant best meets user needs.
Field Trials
Field trials involve testing a product in the user's environment, providing insight into how the product performs in real-world conditions and daily usage. Here’s what to keep in mind:
- Natural setting: Unlike lab-based tests, field trials let you see how your product integrates into users' lives.
- Longitudinal analysis: Over time, you can observe and measure how the product use evolves, revealing deeper insights into user needs and behaviors.
Data from field trials should be carefully recorded and analyzed to ensure that they provide a clear picture of how the product will be used after launch.
Adjusting to changing user needs
Staying agile and responsive to changing user needs is critical for success.
Market Trends Analysis
You must first understand the evolving market to adapt to changing user needs. Conduct thorough market trend analyses to uncover shifts in user behavior and preferences.
By analyzing social media, industry reports, and competitor offerings, you uncover patterns that indicate changes in user needs. For instance:
- Track hashtags and topics trending on platforms like Twitter to gauge interest shifts.
- Review industry reports for insights into emerging technologies and user needs and expectations .
- Evaluate competitor product updates and features to identify market responses.
Continuous feedback loop
Establish a continuous feedback loop to make timely adjustments to your products or services. This involves:
- Collecting data via surveys , user interviews , and usability tests .
- Analyzing feedback for patterns or recurring issues.
- Implementing changes based on user insights.
- Communicating updates to users and soliciting additional feedback for verification.
Iteratively refine your product by repeating these steps, ensuring that your modifications align with user needs and improve the overall experience. A/B testing can be a powerful tool for comparing different solutions and selecting the most effective one based on user behavior.
Measuring success
In assessing user needs, your ability to measure success is paramount. This ensures you meet objectives and improve user satisfaction with data-driven decisions.
Metrics and KPIs
To effectively gauge success, you must establish specific Metrics and KPIs (Key Performance Indicators) . Metrics like Task Success Rate , which reveals the percentage of users who can complete a given task, help you understand usability. Further, KPIs tied to the customer journey maps provide milestones and insights into whether your product aligns with your business goals. These might include the following:
- Conversion rate : The proportion of users who take a desired action.
- Retention rate : Indicates customer loyalty and product stickiness.
- Churn rate : Measures the rate customers stop doing business with you.
CSAT and NPS
Customer Satisfaction (CSAT) and Net Promoter Score (NPS) are valuable in getting direct feedback from users about their experience with your product or service.
CSAT scores reflect how products or services meet customer expectations on a scale, usually from 1 (not satisfied) to 5 (very satisfied).
NPS , on the other hand, asks customers how likely they are to recommend your product or service, typically on a scale of 0 to 10.
Responses categorize customers into Detractors (0-6), Passives (7-8), and Promoters (9-10). The NPS is derived by subtracting the percentage of Detractors from the percentage of Promoters.
Understand your users' needs better with Survicate
Understanding and prioritizing user needs is not just about collecting data; it's about nurturing a continuous dialogue with your audience to shape a product that truly resonates.
Gaining a deep understanding of your users' needs is also crucial for product development and customer satisfaction.
Survicate offers a suite of tools designed to facilitate this process. With Survicate , you can (for example):
- Create detailed buyer personas : Using surveys and feedback tools, detailed profiles of your typical customers can be developed. These personas help you understand key aspects such as user goals, challenges, and behavior patterns.
- Conduct insightful user research : Engaging with a diverse user base allows you to uncover barriers and pain points which could be hindering the full enjoyment of your product or service. Identifying such areas ensures you meet essential standards, including accessibility guidelines.
Steps for using Survicate:
- Identify the core needs of your users through initial surveys .
- Gather data across different user segments to ensure inclusivity.
- Refine your product based on continuous feedback to align better with user expectations.
- Optimize your website's UX through regular user testing and improvements.
By prioritizing user feedback and utilizing user research tools , Survicate empowers you to create experiences that foster user satisfaction and loyalty. Start improving your understanding of user needs with Survicate's easily deployable tools and see the difference it can make in your product engagement.
Discover how Survicate can enhance your user research efforts— sign up to the free 10-day trial of all Business Plan features.
User needs in the product development process FAQs
Understanding user needs is crucial for effective product design. This section will guide you through identifying, documenting, and analyzing user needs to achieve user-centric solutions.
What are the key methods for identifying user needs?
Employ qualitative research such as interviews, surveys, and user observations to identify user needs. Quantitative data from analytics can confirm patterns and preferences . Use these insights to define the user's goals, desires, and pain points.
How can user needs be effectively documented in a user needs statement?
Document user needs in clear, concise statements that capture what users require from your product to achieve their goals. These statements should be specific, actionable, and user-centric, avoiding technical jargon to align the design and development teams on what is needed.
What are the primary differences between user needs and user requirements?
User needs are the goals and objectives of the user, often qualitative and focused on experience and satisfaction. User requirements are the specific features or functions that a product must have to meet these needs, usually captured in technical language for development purposes.
How should user needs be incorporated into a Point of View statement?
Incorporate user needs into a Point of View (POV) statement by integrating your understanding of the user, the insights from their needs, and their challenges. This statement should inspire solutions that are empathetic to the user and reflect their needs.
What techniques are used to conduct a thorough user needs analysis?
Conduct a thorough user needs analysis using techniques such as personas, experience mapping, task analysis, and user journey mapping. These techniques help visualize the user's experience and identify opportunities to meet needs throughout their interaction with the product.
How can one differentiate between various types of user needs in product design?
Differentiate between types of user needs by categorizing them as either functional (what the product does), experiential (how the user feels using the product), or latent (unarticulated needs not yet realized). This ensures a holistic approach to product design that harbors innovation and user satisfaction.
We’re also there


6 User Research Methods & When To Use Them
Learn more about 6 common user research methods and how they can be used to strengthen your UX design process.
Stay in the know with The Brief
Get weekly insightful articles, ideas, & news on UI/ UX and related spaces – in to your inbox
User research is the process of understanding user needs and desires through observation and feedback.
It's one of the most important aspects of UX design, and it's used to inform all aspects of the design process, from initial sketches to the final product. Through user research, we can answer important questions about our design, such as Who are our users? and What do they need?
In this blog post, we will discuss six common user research methods, what they are, when to use them, and some common challenges associated with each one.
Let’s get started …
What is User Research?
Why is user research integral to the ux process, 6 common user research methods, how to get started with user research in ux design projects, key takeaways.
User research is a process of gathering data about users in order to design better products that meet their needs .
It's used in every part of the design process, from the initial market research and concepting stages, through the final interface design testing and iteration stages.
The goal: to gather data that will allow you to make informed decisions as you create design solutions.

Term Check: User Research vs. UX Research
Depending on what you read, you might come across the terms user research , UX research , or simply design research —all used interchangeably.
While they all tend to refer to the process of collecting user-centric data, there is some distinction that can be applied:
The term user research is often used when you want to learn more about the target audience for a product or service; who they are, how they think, what their goals are, etc.
UX research , on the other hand, tends to be used when you’re conducting research that focuses on how users interact with a product or service.
In this article, we’ll be looking at user research holistically, whether specifically talking about the users themselves, or learning more about how they interact with and experience your design work.
User research is an integral part of the design process: it ensures you have enough data and insights to make informed decisions about the design work you produce, reducing the risk of making assumptions and creating something no one truly wants.
Successful UX design requires a deep understanding of the people who will be using your product and how they interact with it. No matter how experienced you are as a designer, there is no way to validate your assumptions about design solutions without data. And the only way to acquire this understanding is by collecting data from the users themselves.
There are a variety of user research methods, each with its own strengths and weaknesses. Here are 6 common methodologies that are easy to incorporate into your UX design process.
1. User Interviews
Interviews are a type of user research method in which the researcher talks with participants to collect data. This method is used to gather insights about people's attitudes, beliefs, behaviors, and experiences. Interviews are a great way to gather in-depth, qualitative data from users.
Interviews are best conducted in a live conversation, whether that takes place in person, on a video call, or even on the phone. They can be structured or unstructured, depending on what best fits your research needs:
- Structured interviews follow a set list of questions
- Unstructured interviews are intended for more open-ended conversation
Challenges:
When deciding whether to use interviews as a user research method, it is important to consider the goals of the research, the target audience, and the availability of resources. Interviews are extremely time-consuming, both for the interviewer and the interviewee. However, if the goal of the research is to observe behavior in a natural setting, or if the target audience is not available to participate in interviews, then another user research method may be more appropriate.
Surveys are a user research method in which participants are asked to answer a series of questions, usually about a specific topic. Surveys are well suited for collecting data that can be quantified, but they are not as well suited for collecting qualitative data, since answers are often nuanced and lack appropriate context.
Surveys are best used when …
Since surveys can be easily distributed to a large number of people, they’re often a good choice for gathering information from people who might not be able—or willing—to participate in other types of user research (such as usability testing).
Since surveys rely on self-reported data, it’s important to avoid phrases or words that might influence the users’ answers. Furthermore, this type of user research often provides data without context, since you aren’t able to follow up and understand some of the nuances of the responses.
3. Focus Groups
Focus groups are a type of user research method in which a group of people are brought together to discuss a product, service, or experience. Focus groups provide an opportunity for users to discuss their experiences and opinions with each other in a guided setting. When done correctly, focus groups can provide valuable insights that can help shape both product design and marketing strategies.
Focus groups are best used when …
Focus groups can help uncover user needs and perspectives that may not be apparent through individual interviews or surveys.
Tips to make it work:
To get the most out of a focus group, it is important to carefully select participants that are representative of the target audience, as well as those who represent various accessibility needs, which might otherwise be overlooked or receive less consideration. The moderator should also be skilled in leading discussions and facilitating group dynamics to avoid participants from influencing each other.
4. A/B Testing
A/B testing is a user research method in which two versions of a design are created, then tested against each other to determine which is more effective.
These versions can be identical except for one small change, or they can be completely different. Once the two versions have been created, they are then assigned to users at random. The results of the test are then analyzed to see which version was more successful.
A/B testing is best used when …
You can incorporate A/B testing at any stage of the design process, but you might find you get the most helpful insights when you’re in a state of refinement, or are at a crossroads and need some data to help you decide which route to take.
Once you have your design variations ready to test, it’s up to the developers (or an A/B testing software program) to make the test live to users. It’s important to let the test run long enough so that any statistical significance is steady and repeatable. (If the test does not provide statistically significant results, it’s time to go back to the drawing board and try out a different variation.)
5. Card Sorting
Card sorting is a user research method that can be used to help understand how people think about the items in a given category. Card sorting involves providing users with a set of cards, each of which contains an item from the category, and asking them to sort the cards into groups. The groups can be based on any criteria that the users choose, and the sorted cards can then be analyzed to identify patterns in the way that the users think about the items. Card sorting can be used with both small and large sets of items, making it a versatile tool for user research.
Card sorting is best used when …
You are looking for insight into categorical questions like how to structure the information architecture of a website.
For example, if you were designing a website for a library, you might use card sorting to understand how users would expect the website's content to be organized.
Like the other research methods mentioned so far, a successful card sorting exercise requires a significant amount of thought and setup ahead of time. You might use an open sorting session , where the users create their own categories, if you want insight into the grouping logic of your users. In a closed sorting session , the categories are already defined, but it’s up to the participants to decide where to file each card.
6. Tree Test
Tree testing is a user research method that helps evaluate the findability and usability of website content. It is often used as a follow-up to card sorting, or when there are large amounts of website content, multiple website navigation structures, or changes to an existing website.
To conduct a tree test, participants are asked to find specific items on a website, starting from the home page. They are not told what the navigation options are, but are given hints if they get stuck. This helps researchers understand how users find and interact with the website content.
Tree testing is best used when ...
This method is most effective when combined with other user research methods, such as interviews, surveys, and focus groups. This is because it’s really a way to finesse the user’s experience at the end of the design process, rather than a method of collecting the preliminary data that’s needed to arrive at this point.
Tree testing can be a challenging method to conduct, as it requires specific instructions and data collection methods for each test. In addition, participants may not use the same navigation paths that you intended, making it difficult to analyze the results. To account for this, it’s important to have a large enough sample size to be able to differentiate between outliers and general trends.
User research is a critical part of any project or product development process. It helps you to understand the needs and expectations of your target users, and ensures that your final product meets their requirements.
There are many different ways to conduct user research, but the most important thing is to start early and to continually iterate throughout the development process.
For this, you’ll need to make sure that you have enough resources to incorporate the research successfully, which includes:
- A budget that accounts for the various expenses incurred during the research process, whether that’s subscribing to a user research tool or compensating participants for their time.
- An awareness of your own personal biases, and how they might affect the data you collect and the interpretation of results.
- Time for research and analysis , since you might need to adjust the research method, or number of participants, that you were initially planning on including.
- Buy-in from stakeholders , since the results might be jarring and contradict some of the assumptions that the project was built on.
Finally, it is important to be aware of your own personal biases. Despite these challenges, user research is an essential tool for designers, as it provides insights into how people interact with products and what their needs and wants are.
- User research is essential for designing products that meet the needs of your target audience.
- By understanding your users, you can design better products that meet user needs and improve the overall user experience.
- Getting started with user research can be daunting, but there are a few common methods that are easy to learn and incorporate into your design process.
- By being aware of the challenges involved in conducting user research, you can create a research plan that minimizes potential problems and maximizes the chances of obtaining valuable insights.
- Once you have collected your data, it is important to analyze and interpret it so that you can use it to improve your product or design process.
- User research can be challenging, but by following best practices and being prepared for common challenges, you can conduct successful user research studies that will help you create better products.
To learn more about establishing a UX design practice rooted in research and user-centered data, check out UX Academy Foundations , an introductory course that teaches design fundamentals with practical, hands-on projects and 1:1 mentorship with a professional designer.

Get weekly insightful articles, ideas,& news on UI/ UX and related spaces – in to your inbox
Launch a career in ux design with our top-rated program
Top Designers Use Data.
Gain confidence using product data to design better, justify design decisions, and win stakeholders. 6-week course for experienced UX designers.
%20(1)-min.png)
HOW TO BECOME A UX DESIGNER
Send me the ebook and sign me up for other offers and content on transitioning to a career in UX design.
Related posts

UX Design for Emerging Technologies: AR, VR, and MR

The Impact of Emotional Design on User Engagement

Voice User Interface (VUI) Design Best Practices
User Needs + Defining Success
Even the best ai will fail if it doesn’t provide unique value to users..
This chapter covers:
- Which user problems is AI uniquely positioned to solve?
- How can we augment human capabilities in addition to automating tasks?
- How can we ensure our reward function optimizes AI for the right thing?
Want to drive discussions, speed iteration, and avoid pitfalls? Use the worksheet .
Want to read the chapter offline? Download PDF
What’s new when working with AI
When building any product in a human-centered way, the most important decisions you’ll make are: Who are your users? What are their values? Which problem should you solve for them? How will you solve that problem? How will you know when the experience is “done”?
In this chapter, we’ll help you understand which user problems are good candidates for AI and how to define success. Key considerations:
➀ Find the intersection of user needs & AI strengths . Solve a real problem in ways in which AI adds unique value.
➁ Assess automation vs. augmentation . Automate tasks that are difficult, unpleasant, or where there’s a need for scale; and ideally ones where people who currently do it can agree on the “correct” way to do it. Augment tasks that people enjoy doing, that carry social capital, or where people don’t agree on the “correct” way to do it.
➂ Design & evaluate the reward function . The “reward function” is how an AI defines successes and failures. Deliberately design this function with a cross-functional team, optimizing for long-term user benefits by imagining the downstream effects of your product. Share this function with users when possible.
➀ Find the intersection of user needs & AI strengths
Like any human-centered design process, the time you spend identifying the right problem to solve is some of the most important in the entire effort. Talking to people, looking through data, and observing behaviors can shift your thinking from technology-first to people-first.
The first step is to identify real problems that people need help with. There are many ways to discover these problems and existing resources online to help you get started. We recommend looking through IDEO’s Design Kit methods section for examples of how to find problems and corresponding user needs.

Throughout the Guidebook we use an example app, RUN. For that app, user needs might be:
- The user wants to get more variety in their runs so they don’t get bored and quit running.
- The user wants to track their daily runs so that they can get ready for a 10k in six months.
- The user would like to meet other runners at their skill level so they can stay motivated to keep running.
You should always build and use AI in responsible ways. When deciding on which problem to solve, take a look at the Google AI Principles , and Responsible AI Practices for practical steps, to ensure you’re building with the greater good in mind. For starters, make sure to get input from a diverse set of users early on in your product development process. Hearing from many different points of view can help you avoid missing out on major market opportunities or creating designs that unintentionally exclude specific user groups.
Map existing workflows
Mapping the existing workflow for accomplishing a task can be a great way to find opportunities for AI to improve the experience. As you walk through how people currently complete a process, you’ll better understand the necessary steps and identify aspects that could be automated or augmented. If you already have a working AI-powered product, test your assumptions with user research. Try letting people use your product (or a “Wizard of Oz” test ) to automate certain aspects of the process, and see how they feel about the results.
Decide if AI adds unique value
Once you identify the aspect you want to improve, you’ll need to determine which of the possible solutions require AI, which are meaningfully enhanced by AI, and which solutions don’t benefit from AI or are even degraded by it.
It’s important to question whether adding AI to your product will improve it. Often a rule or heuristic-based solution will work just as well, if not better, than an AI version. A simpler solution has the added benefit of being easier to build, explain, debug, and maintain. Take time to critically consider how introducing AI to your product might improve, or regress, your user experience.
To get you started, here are some situations where an AI approach is probably better than a rule-based approach, and some in which it is not.
When AI is probably better
Recommending different content to different users . Such as providing personalized suggestions for movies to watch.
Prediction of future events . For example, showing flight prices for a trip to Denver in late November.
Personalization improves the user experience . Personalizing automated home thermostats makes homes more comfortable and the thermostats more efficient over time.
Natural language understanding . Dictation software requires AI to function well for different languages and speech styles.
Recognition of an entire class of entities . It’s not possible to program every single face into a photo tagging app — it uses AI to recognize two photos as the same person.
Detection of low occurrence events that change over time . Credit card fraud is constantly evolving and happens infrequently to individuals, but frequently across a large group. AI can learn these evolving patterns and detect new kinds of fraud as they emerge.
An agent or bot experience for a particular domain . Booking a hotel follows a similar pattern for a large number of users and can be automated to expedite the process.
Showing dynamic content is more efficient than a predictable interface . AI-generated suggestions from a streaming service surface new content that would be nearly impossible for a user to find otherwise.
When AI is probably not better
Maintaining predictability . Sometimes the most valuable part of the core experience is its predictability, regardless of context or additional user input. For example, a “Home” or “Cancel” button is easier to use as an escape hatch when it stays in the same place.
Providing static or limited information . For example, a credit card entry form is simple, standard, and doesn’t have highly varied information requirements for different users.
Minimizing costly errors . If the cost of errors is very high and outweighs the benefits of a small increase in success rate, such as a navigation guide that suggests an off-road route to save a few seconds of travel time.
Complete transparency . If users, customers, or developers need to understand precisely everything that happens in the code, like with Open Source Software. AI can’t always deliver that level of explainability.
Optimizing for high speed and low cost . If speed of development and getting to market first is more important than anything else to the business, including the value that adding AI would provide.
Automating high-value tasks . If people explicitly tell you they don’t want a task automated or augmented with AI, that’s a good task not to try to disrupt. We’ll talk more about how people value certain types of tasks below.
Key concept
Instead of asking “Can we use AI to _________?”, start exploring human-centered AI solutions by asking:
- How might we solve __________ ?
- Can AI solve this problem in a unique way?
Apply the concepts from this section in Exercise 1 in the worksheet
➁ Assess automation vs. augmentation
When you’ve found the problem you want to solve and have decided that using AI is the right approach, you’ll then evaluate the different ways AI can solve the problem and help users accomplish their goals. One large consideration is if you should use AI to automate a task or to augment a person’s ability to do that task themselves.
Some tasks, people would love for AI to handle, but there are many activities that people want to do themselves. In those latter cases, AI can help them perform the same tasks, but faster, more efficiently, or sometimes even more creatively. When done right, automation and augmentation work together to both simplify and improve the outcome of a long, complicated process.
When to automate
Automation is typically preferred when it allows people to avoid undesirable tasks entirely or when the time, money, or effort investment isn’t worth it to them. These are usually tasks people are happy to delegate to AI as they don’t require oversight, or they can be done just as well by someone (or something) else. Successful automation is often measured by the following:
- Increased efficiency
- Improved human safety
- Reduction of tedious tasks
- Enabling new experiences that weren’t possible without automation
Automation is often the best option for tasks that supplement human weaknesses with AI strengths. For example, it would take a human a very long time to sort through their photo library and group pictures by subject. AI can do that quickly and easily, without constant feedback. Consider automating experiences when:
People lack the knowledge or ability to do the task
There are many times when people would do something if they knew how, but they don’t so they can’t. Or they technically know how, but a machine is much better suited to the task — such as searching thousands of rows in a spreadsheet to find particular value.
There are also often temporary limitations on people, like needing to complete a task quickly, that can lead to preferences for giving up control. For example, one might save time by using the automated setting on their rice cooker when they’re rushed to make dinner during the week, but make their sushi rice by hand over the weekend.
Tasks are boring, repetitive, awkward, or dangerous
There’s little value in attempting to edit a document you wrote without using spell-check. It’s unwise to check for a gas leak in a building using your own nose when you could use a sensor to detect the leak. In both of these situations, most people would prefer to give up control to avoid tasks that don’t provide them value.
Even when you choose to automate a task, there should almost always be an option for human oversight — sometimes called “human-in-the-loop” — and intervention if necessary. Easy options for this are allowing users to preview, test, edit, or undo any functions that your AI automates.
When to augment
When building AI-powered products, it’s tempting to assume that the best thing you can do for your users is automate tasks they currently have to do manually. However, there are plenty of situations where people typically prefer for AI to augment their existing abilities and give them “superpowers” instead of automating a task away entirely.
Successful augmentation is often measured by the following:
- Increased user enjoyment of a task
- Higher levels of user control over automation
- Greater user responsibility and fulfillment
- Increased ability for the user to scale their efforts
- Increased creativity
Augmentation opportunities aren’t always easy to define as separate from automation, but they’re usually more complicated, inherently human, and personally valuable. For example, you may use tools that automate part of designing a t-shirt, like resizing your art or finding compatible colors. The design software, in this case, augments the task of t-shirt design, and unlocks limitless silliness and ingenuity. Consider augmenting people’s existing abilities when:
People enjoy the task
Not every task is a chore. If you enjoy writing music, you probably wouldn’t want an AI to write entire pieces for you. If an algorithm did it for you, you won’t get to participate in the creative process you love. However, using something like Magenta Studio could help you during the creative process without taking away the essential humanity of your artistic process.
Personal responsibility for the outcome is required or important
People exchange small favors all the time. Part of doing a favor for someone is the social capital you gain by giving up your time and energy. For tasks like these, people prefer to remain in control and responsible to fulfill the social obligations they take on. Other times, when there is no personal obligation, like paying tolls on roads, an automated system is typically preferred.
The stakes of the situation are high
People often want to, or have to, remain in control when the stakes are high for their role; for example pilots, doctors, or police officers. These can be physical stakes like ensuring someone gets off a tall ladder safely, emotional stakes like telling loved ones how you feel about them, or financial stakes like sharing credit card or banking information. Additionally, sometimes personal responsibility for a task is legally required. In low stakes situations, like getting song recommendations from a streaming service, people will often give up control because the prospect of discovery is more important than the low cost of error.
Specific preferences are hard to communicate
Sometimes people have a vision for how they want something done: a room decorated, a party planned, or a product designed. They can see it in their mind’s eye but can’t seem to do it justice in words. In these kinds of situations, people prefer staying in control so they can see their vision through. When people don’t have a vision or don’t have time to invest in one, they are more likely to prefer automation.
Below are some example research questions you can ask to learn about how your users think about automation and augmentation:
- If you were helping to train a new coworker for a similar role, what would be the most important tasks you would teach them first?
- Tell me more about that action you just took, about how often do you do that?
- If you had a human assistant to work with on this task, what, if any duties would you give them to carry out?
Apply the concepts from this section in Exercise 2 in the worksheet
➂ Design & evaluate the reward function
Any AI model you build or incorporate into your product is guided by a reward function, also called an “objective function”, or “loss function.” This is a mathematical formula, or set of formulas, that the AI model uses to determine “right” vs. “wrong” predictions. It determines the action or behavior your system will try to optimize for, and will be a major driver of the final user experience.
When designing your reward function, you must make a few key decisions that will dramatically affect the final experience for your users. We’ll cover those next, but remember that designing your reward function should be a collaborative process across disciplines. Your conversations should include UX, Product, and Engineering perspectives at the minimum. Throughout the process, spend time thinking about the possible outcomes, and bounce your ideas off other people. That will help reveal pitfalls where the reward function could optimize for the wrong outcomes.
Weigh false positives & negatives
Many AI models predict whether or not a given object or entity belongs to a certain category. These kind of models are called “binary classifiers”. We’ll use them as a simple example for understanding how AIs can be right or wrong.
When binary classifiers make predictions, there are four possible outcomes:
- True positives . When the model correctly predicts a positive outcome.
- True negatives . When the model correctly predicts a negative outcome.
- False positives . When the model incorrectly predicts a positive outcome.
- False negatives . When the model incorrectly predicts a negative outcome.

A generic confusion matrix illustrating the two kinds of successes — true positives and true negatives — and two kinds of errors — false positives and false negatives — any AI model can make.
Let’s walk through an example using our example app, RUN. Suppose RUN uses an AI model to recommend runs to users. Here’s how the different model outcomes would play out:
- True positives . The model suggested a run the user liked and chose to go on.
- True negatives . The model did not suggest a run the user would not have chosen to go on.
- False positives . The model suggested a run to the user that they did not want to go on.
- False negatives . The model did not suggest a run to the user that they would have wanted to go on if they knew about it.
When defining the reward function, you’ll be able to “weigh” outcomes differently. Weighing the cost of false positives and false negatives is a critical decision that will shape your users’ experiences. It is tempting to weigh both equally by default. However, that’s not likely to match the consequences in real life for users. For example, is a false alarm worse than one that doesn’t go off when there’s a fire? Both are incorrect, but one is much more dangerous. On the other hand, occasionally recommending a song that a person doesn’t like isn’t as lethal. They can just decide to skip it. You can mitigate the negative effects of these types of errors by including confidence indicators for a certain output or result.
Consider precision & recall tradeoffs
Precision and recall are the terms that describe the breadth and depth of results that your AI provides to users, and the types of errors that users see.
Precision refers to the proportion of true positives correctly categorized out of all the true and false positives .The higher the precision, the more confident you can be that any model output is correct. However, the tradeoff is that you will increase the number of false negatives by excluding possibly relevant results. For example, if the model above was optimized for precision, it wouldn’t recommend every single run that a user might choose to go on, but it would be highly confident that every run it did recommend would be accepted by the user. Users would see very few if any runs that didn’t match their preferences, but they might see fewer suggestions overall.
Recall refers to the proportion of true positives correctly categorized out of all the true positives and false negatives . The higher the recall, the more confident you can be that all the relevant results are included somewhere in the output. However, the tradeoff is that you will increase the number of false positives by including possibly irrelevant results. You can think of this as the model recommending every run a user might want to go on, and including other runs the user does not choose to go on. The user however, would always have suggestions for a run, even if those runs didn’t match their preferences as well.

A diagram showing the trade-offs when optimizing for precision or recall. On the left, optimizing for precision can reduce the number of false positives but may increase the number of false negatives. On the right, optimizing for recall catches more true positives but also increases the number of false positives.
You’ll need to design specifically for these tradeoffs — there’s no getting around them. Where along that spectrum your product falls should be based on what your users expect and what gives them the sense of task completeness. Sometimes, seeing some lower confidence results in addition to all of the 100% results can help users trust that the system isn’t missing anything. In other cases, showing lower confidence results could lead to users trusting the system less. Make sure to test the balance between precision and recall with your users.
Evaluate the reward function outcomes
The next step is evaluating your reward function. Like any definition of success, it will be tempting to make it very simple, narrow, and immediate. However, this isn’t the best approach: when you apply a simple, narrow, and immediate reward function to broad audiences over time, there can be negative effects.
Here are a few considerations when evaluating your reward function:
Assess inclusivity
You’ll want to make sure your reward function produces a great experience for all of your users. Being inclusive means taking the time to understand who is using your product and making sure the user experience is equitable for people from a variety of backgrounds and perspectives, and across dimensions such as race, gender, age, or body shape, among many others. Designing AI with fairness in mind from the beginning is an essential step toward building inclusively. Open source tools like Facets and the What-If Tool allow you to inspect your datasets for potential bias. There’s more on this in the Data Collection + Evaluation chapter.
While the Guidebook provides some advice related to fairness, it is not an exhaustive resource on the topic. Addressing fairness in AI is an active area of research. See Google’s Responsible AI Practices for our latest fairness guidance and recommended practices.
Monitor over time
You’ll also want to consider the implications of your chosen reward function over time. Optimizing for something like number of shares may seem like a good idea in the short term but over enough time, bombarding users with sharing notifications could create a very noisy experience. Imagine the best individual and collective user experience on their 100th or 1,000th day using your product as well as the first. Which behaviors and experiences should you optimize for in the long run?
Imagine potential pitfalls
Second-order effects are the consequences of the consequences of a certain action. These are notoriously difficult to predict but it’s still worth your time to consider them when designing your reward function. One useful question to ask is, “What would happen to our users/their friends & family/greater society if the reward function were perfectly optimized?” The result should be good. For example, optimizing to take people to the best web page for a search query is good, if it’s perfect. Optimizing to keep people’s attention continuously throughout the day may not provide them benefits in the long run.
Account for negative impact
As AI moves into higher stakes applications and use-cases, it becomes even more important to plan for and monitor negative impacts of your product’s decisions. Even if you complete all of the thought exercises in the worksheets, you probably won’t uncover every potential pitfall upfront. Instead, schedule a regular cadence for checking your impact metrics, and identifying additional potential bad outcomes and metrics to track.
It’s also useful to connect potential negative outcomes with changes to the user experience you could make to address them. For example, you could set the following standards and guidance for you and your team:
- If users’ average rate of rejection of smart playlists and routes goes above 20%, we should check our ML model .
- If over 60% of users download our app and never use it, we should revisit our marketing strategy .
- If users are opening the app frequently, but only completing runs 25% of the time, we’ll talk to users about their experiences and potentially revisit our notification frequency .
As your product matures, check in your product feedback for negative impacts on stakeholders you didn’t consider. If you find some stakeholders are experiencing negative effects on account of your product, talk to them to understand their situation. Based on these conversations, strategize ways to adapt your product to avoid continued negative impact.
An easy way to keep an eye on negative impacts is through social media or alert systems like Google Alerts . Make sure you’re listening to your users and identifying potential unintended consequences as early as possible.
Everyone on your team should feel aligned on what both success and failure look like for your feature, and how to alert the team if something goes wrong. Here’s an example framework for this:
If { specific success metric } for __ { your team’s AI-driven feature } { drops below/goes above }__ { meaningful threshold } we will { take a specific action } .
Apply the concepts from this section in Exercise 4 in the worksheet
Aligning your product with user needs is step one in any successful AI product. Once you’ve found a need, you should evaluate whether using AI will uniquely address the need. From there, consider whether some parts of the experience should be automated or augmented. Lastly, design your reward function to create a great user experience for all your users over the long run.
➀ Find the intersection of user needs & AI strengths . Make sure you’re solving a real problem in a way where AI is adding unique value. When deciding on which problem to solve, you should always build and use AI in responsible ways. Take a look at the Google AI Principles and Responsible AI Practices for practical steps to ensure you are building with the greater good in mind.
➁ Assess automation vs. augmentation . Automate tasks that are difficult or unpleasant, and ideally ones where people who do it currently can agree on the “correct” way to do it. Augment bigger processes that people enjoy doing or that carry social value.
➂ Design & evaluate the reward function . The “reward function” is how an AI defines successes and failures. You’ll want to deliberately design this function including optimizing for long-term user benefits by imagining the downstream effects of your product and limiting their potentially negative outcomes.
Want to drive discussions, speed iteration, and avoid pitfalls? Use the worksheet
In addition to the academic and industry references listed below, recommendations, best practices, and examples in the People + AI Guidebook draw from dozens of Google user research studies and design explorations. The details of these are proprietary, so they are not included in this list.
- Baxter, K. (2017, April 12). How to Meet User Expectations for Artificial Intelligence
- Ben, A. (2018, August 9). The How Vs. The Why Of AI
- Beyer, H., & Holtzblatt, K. (2017). Contextual design: Defining customer-centered systems. San Francisco, CA: Morgan Kaufmann.
- Farrell, S. (2017, January 1). 27 Tips and Tricks for Conducting Successful User Research in the Field
- Goodhart, C. A. E. (1975). “Problems of Monetary Management: The U.K. Experience”. Papers in Monetary Economics. I. Reserve Bank of Australia.
- Guszcza, J. (2018, January 22). Smarter together: Why artificial intelligence needs human-centered design . Deloitte Insights, 22.
- Hackos, J. T., & Redish, J. C. (1998). User and task analysis for interface design. New York, NY: Wiley Computer Publishing.
- Hammond, M. (2017, November 16). Deep Reinforcement Learning Models: Tips & Tricks for Writing Reward Functions
- Koehrsen, W. (2018, March 3). Beyond Accuracy: Precision and Recall [Web log post]. Retrieved from https://towardsdatascience.com/beyond-accuracy-precision-and-recall-3da06bea9f6c
- Kocielnik, R., Amershi, S., Bennett, P. N. (2019). Will You Accept an Imperfect AI? Exploring Designs for Adjusting End-user Expectations of AI Systems . CHI 2019.
- Li, Z., Kiseleva, J., Rijke, M. D., & Grotov, A. (2017). Towards Learning Reward Functions from User Interactions. Proceedings of the ACM SIGIR International Conference on Theory of Information Retrieval - ICTIR 17.
- Lovejoy, J., & Holbrook, J. (2017, July 9). Human-Centered Machine Learning
- McAuliffe, K. (2017, September 25). Reward Functions: Writing for Reinforcement Learning
- Mewald, C. (2018, August 16). No Machine Learning in your product? Start here Advice from the trenches of machine learning integration
- Nielsen, J. (1994, January 1). Goal Composition: Extending Task Analysis to Predict Things People May Want to Do
- Nundy, S., & Hodgkins, M. L. (2018, September 18). The Application Of AI To Augment Physicians And Reduce Burnout. Health Affairs.
- Opray, M. (2017, March 6). Brand human: Why efficient automation will not always be best for business . The Guardian.
- Penn, C. S. (2018, July 30). You Ask, I Answer: What Problems Can AI Solve?
- Rohrer, C. (2014, October 12). When to Use Which User-Experience Research Methods
- Sharon, T. (2016). Validating product ideas: Through lean user research. Brooklyn, NY: Rosenfeld Media.
- Yang, H., & Li, Y. (2013). Identifying User Needs from Social Media(Rep. No. RJ10513). Almaden, CA: IBM Research Division.
- Zhuo, J. (2017, August 9). How do you set metrics?

The user needs model f o r news
Audience-driven publishing

The User Needs Model 2.0 will help you choose the right content strategy and the best angle for every story. On this page, we try to explain what the user needs for news mean.
User needs are at the heart of building a true bond with your audience - one that is based on trust and value. Any newsroom can be successful as long as it finds its product-market fit and its output satisfies audience user needs strategically, consistently and creatively. Ultimately, we would like to give you tools, techniques and examples, showing you how the model can work for you and how it leads to various alternative and attractive stories.
User needs analysis in the newsroom is the first step to create more impactful content, that generates higher engagement and a stronger connection to your readers.
Related content about the user needs project with Dmitry Shishkin:
Explaining the user needs one by one
User Needs playbook: supercharge your content strategy
Your guide to start working with user needs
The added value of smart notifications
Questions and answers about the User Needs Model 2.0
We did a webinar about the User Needs Model 2.0. Watch the recording !
The user needs m o del is the ultimate guide for storytelling
What do people want from news?
Modern audiences are becoming more demanding when it comes to news. They're not simply looking for updates, they also want to be educated on certain topics, read inspiring stories and learn more about possible solutions to problems. Many readers are looking for stories that provide them the knowledge they need to participate in conversations, make decisions about things that affect them and keep a more positive outlook on current events.
The BBC World Service developed the user needs model after thorough research into the demands of their own audiences. When questioned, people offered different reasons why they consume news, which can be summed up in six 'user needs':
- Keep me on trend
- Give me perspective
New user needs (2023)
Helpfully, some publishers, like the BBC in its initial groundbreaking research, shared their insights publicly, and by doing so strengthened the trend. Amongst the early adopters were Buzzfeed , Wall Street Journal , Vogue , TRT and Culture Trip . Recently, Atlantic , Vox and LAist have become the latest publishers to write up their strategies.
Fundamentally, the new model distils the wisdom, experience and learnings from both our own research and development and those approaches used by other publishers and presents it into a rock-solid schema. The new model is both more comprehensive and more actionable than those before it, and its visualisation is strikingly clear. One of the original user needs has been reframed; two new user needs have been added.
- Keep me on trend is now: Keep me engaged. ( check this blog to see the difference )
- Help me ( check blog )
- Connect me ( check blog )
To do justice to all user needs that have been developed by various publishers in recent years, we added a final ring to the mother model, containing brand specific needs. In many cases, they define what visitors are looking for even more clearly - and they often give a brand more colour too. We created a dynamic document with all the user need models out there, brand specific needs included.
Outlets that spend time carefully considering their niche and their brand DNA - and then how user needs can and should be applied to it - are those that understand their product/market fit best.

we believe in impactful content and st o ries
Who's involved?

Rutger Verhoeven, CMO @ smartocto
"There’s no doubt that adopting a user-needs-first content strategy can help newsrooms boost engagement. We also know that smart notifications can have a transformative effect on the culture and workflow of editorial teams. The combination of the two should create a powerful solution to enable newsrooms to connect with their audiences better - and for longer."

Ton Mallo, Manager news @ Omroep Brabant
"The user needs model can help us to change the way we think, be more creative. The 'hard' news takes up 80% of our time, but generates just 20% of our reach. By thinking and commissioning differently we could reach a much bigger audience with that same news, which will strengthen our public duty: to make news available to as many people as possible."

Katja Fleischmann, product manager DRIVE @ dpa
If regional publishers want to grow their digital subscriber base, they have to get closer to the readers and need to understand their individual preferences. In the end newsrooms have to tailor stories to different user needs. Our DRIVE data shows impressively that readers not only want to consume classical news articles but they appreciate stories that inspire and help them to understand the context and build their own opinion about certain topics.

Dmitry Shishkin, digital innovation expert and user needs evangelist (formerly @ BBC)
"I'm hoping that we can give smartocto clients an interesting toolkit, combining data science, product and editorial, to make their output stronger to the benefit of the audience. This is an incredibly exciting project for me to be part of. I want to find out how data science, machine learning algorithms, and historical data can help journalists look towards the future."

Roy Wassink, Insights manager @ DPG Media, De Morgen
"For me the User Needs Model is a common language for our news organisation, it’s data in words. It provides editorial analysts with an additional dimension to learn more about our stories. It helps marketers to improve user profiles. But the User Needs Model can exist without all that fancy data. For journalists, it is above all a practical tool that they can use in their daily work. It helps them to focus, for example when writing a follow-up to a news story, while thinking about a good headline or a new intro. And that’s the most important thing in the end. Writing better stories by understanding our readers’ needs."

Yogie Fadila, Quality Control Editor @ IDN Times
"This project has been really promising for IDN Times. Already the user need approach has brought much to the newsroom; the insights from the first deep dive showed us how much more we can offer our audience. And the user needs notifications will definitely be helpful in directing us towards making our online efforts more relevant."
The News Needs Notifications
This is what's going to make all the difference in the newsroom: smart notifications that advise when to apply the user needs approach for a follow-up, and which perspective to choose, based on story performance and audience behaviour.

We have many more ways to help your organisation with the implementation of user needs. Please ask us if you need any help.
Project results
We started this project to integrate the news user needs approach in our tool, the notifications and our consultancy. That's how convinced we are that adopting this approach will benefit editorial rooms everywhere. Editors tend to overproduce the content that is performing the least. If you make the switch to other formats and needs, you can expect a major change. So we say, let's put all that effort towards creating content that performs demonstrably better. At the beginning we had the following hypotheses, and they have all been proven right.
- These user needs exist and are valid for newsrooms today
- We are able to recognise from the data if the audience wants a user need in relation to topics
- If we send out notifications in real time and they are followed up, the connection to the audience is much stronger
Do you want to implement the user needs approach but need help? We work together with consultants of FT Strategies to make sure you'll be able to change the workflow of your newsroom.
Get started with the user needs
If you see in the power of implementing the User Needs model into your newsroom, then we have lots of helpful content and packages to get you started. It's up to you if you want to start small, with printing a poster, or go big, with one of our User Needs Packages.
Go straight to the downloadable materials →
Go straight to the User Needs Packages →
Download the User Needs Playbook→
Read more about the pr o ject
Dmitry Shishkin: 5 years into the user needs story
In this guest blog, Dmitry takes us on a trip down memory lane and describes the impact the user needs model has had ever since it came into existence 5 years ago.

The user needs, explained by Dmitry Shishkin
What are the user needs for news, why are they so important and how do you apply them in the newsroom? We let Dmitry Shishkin explain, with tips and examples!

download whitepaper
Whitepaper: It's here! User Needs 2.0
Our whitepaper is the culmination of our research on the user needs, the measurements we did with our clients, and the results of experiments and growth hacks. We can't wait to share everything we've learned with you, use it to your advantage!
User Needs model 2.0 © 2023 by Smartocto is licensed under CC BY-SA 4.0 .
We worked on user needs before in our 'Triple N Project'. Here you can download the old whitepaper:
- smartocto.ai
- all features
- client cases
- knowledge base
These cookies are necessary for the correct functioning of the website. You cannot turn these off.
These anonymous cookies allow us to measure the usage of our website and implement the right features and optimisations.
These cookies allow our advertising and social media partners to tailor their advertisements to you, based on your preferences and online behaviour.
These cookies allow for embedding content from third-party websites, such as YouTube. Disabling these cookies might remove some functionality from the website.
Turning off certain categories can result in related functionality to stop working correctly. You can change your preferences at any time. More information
This website uses cookies and similar techniques to deliver an optimal end-user experience. More information Change preferences Refuse cookies
Cookies on GOV.UK
We use some essential cookies to make this website work.
We’d like to set additional cookies to understand how you use GOV.UK, remember your settings and improve government services.
We also use cookies set by other sites to help us deliver content from their services.
You have accepted additional cookies. You can change your cookie settings at any time.
You have rejected additional cookies. You can change your cookie settings at any time.
beta Contact the Service Manual team if you have feedback, questions or suggestions.
- Service manual
- User research
Learning about users and their needs
Give feedback about this page
When designing a government service, always start by learning about the people who will use it. If you do not understand who they are or what they need from your service, you cannot build the right thing.
Understanding user needs
People and businesses use government services to help them get something done (for example, register to vote, check if a vehicle is taxed or pay a VAT bill).
‘User needs’ are the needs that a user has of a service, and which that service must satisfy for the user to get the right outcome for them.
Services designed around users and their needs:
- are more likely to be used
- help more people get the right outcome for them - and so achieve their policy intent
- cost less to operate by reducing time and money spent on resolving problems
Researching users and their needs
You must keep researching throughout each development phase to make sure your service continues to meet user needs.
When to research
In the discovery phase , you should find out:
- who your likely users are and what they’re trying to do
- how they currently do it (for example, what services or channels they use)
- the problems or frustrations they experience
- what users need from your service to achieve their goal
In the alpha, beta and live phases , you should:
- improve your understanding of your users and their needs
- test design ideas and new features with likely users
- assess users’ experience of your service, to make sure it meets their needs
How to research
You can learn about users and their needs by:
- reviewing existing evidence (for example, analytics, search logs, call centre data, previous research reports, data from Citizens Advice etc)
- interviewing and observing actual or likely users
- talking to people inside and outside your organisation who work with actual or likely users (for example, caseworkers, call centre agents and charity workers)
Treat any opinions or suggestions that do not come from users as assumptions that have to be proven by doing research.
Who to research with
You must understand the needs of all kinds of users, not just ‘typical’ users. You also have to consider the needs of people who provide the service or support other users (for example, caseworkers, call centre agents, inspectors, lawyers and charity workers).
When researching, focus on users who have problems using existing services or getting the right outcome for them. This will help you create a simpler, clearer, faster service that more people can use.
Writing user needs
Once you have a good understanding of your users’ needs, you should write them down and add them to your descriptions of users.
User needs are usually written in the format:
I need/want/expect to… [what does the user want to do?]
So that… [why does the user want to do this?]
If it’s helpful, you can add:
As a… [which type of user has this need?]
When… [what triggers the user’s need?]
Because… [is the user constrained by any circumstances?]
As a [British person]
I need [to provide proof of my identity and visa permissions to border control]
So that [I can travel abroad and prove my identity]
Write user needs from a personal perspective using words that users would recognise and use themselves.
Focus on what’s most important for your users so you do not create an unmanageable list of user needs.
Validating user needs
Good user needs should:
- sound like something a real user might say
- be based on evidence from user research, not assumptions
- focus on the user’s problem rather than possible solutions (for example, needing a reminder rather than needing an email or letter)
As you progress through the development phases, use what you learn to continually validate and refine your user needs.
Share your user needs
Once you’ve learned about your users and their needs, you should share what you know with anyone who’s interested in your service, including colleagues, stakeholders, users and the public.
Present what you’ve learned in a way that’s easy for others to understand and share. For example:
- experience maps that show how users interact with existing or future services and the needs they have at each stage (register, apply, interview etc)
- user profiles or personas that describe groups of users with similar behaviour and needs (new parent, caseworker, small business etc)
The more you share, the more others will understand about your users and what they need from your service. They’ll also ask questions, spot gaps and comment on what you’re doing - all of which will help you design a better service.
Linking user needs to user stories
User needs tend to be high-level, broad in scope and stable over time.
As you design your service, you’ll use them to write user stories . These describe the specific features and content you need to create for your service to meet your users’ needs.
User stories are normally written in a more constrained format than user needs and include additional information like acceptance criteria, level of complexity and dependencies. Teams use them to organise work into manageable chunks that create tangible value.
When writing a user story, you should keep track of the user needs it relates to. This traceability allows you to track related activities and determine how well you’re meeting a particular user need.
Related guides
You may find the following guides useful:
- Plan user research for your service
- How user research improves service design
You might also want to read this blog post about understanding the needs of service data users .
Guidance first published
Is this page useful?
- Yes this page is useful
- No this page is not useful
Help us improve GOV.UK
Don’t include personal or financial information like your National Insurance number or credit card details.
To help us improve GOV.UK, we’d like to know more about your visit today. We’ll send you a link to a feedback form. It will take only 2 minutes to fill in. Don’t worry we won’t send you spam or share your email address with anyone.
- [email protected]
- Sign up for MAD News!
Putting User Needs on the Map
Mit sloan design club and evan chan bring human-centered design to the community.
In a collaborative workshop, participants learn to transform an interview and sticky notes into journey maps, a communicative tool of human-centered design.
By Michelle Luo
Apr 26, 2024.
Over forty attendees from MIT and the public joined the MIT Sloan Design Club and guest designer Evan Chan, founder and director of the Human-Centered Design (HCD) Lab, in the workshop “User Journeys” on April 8. In this first collaboration, Chan introduced journey mapping, a visualization tool in human-centered design which traces the experience of a person using steps, phases, and emotional peaks and valleys of a process.
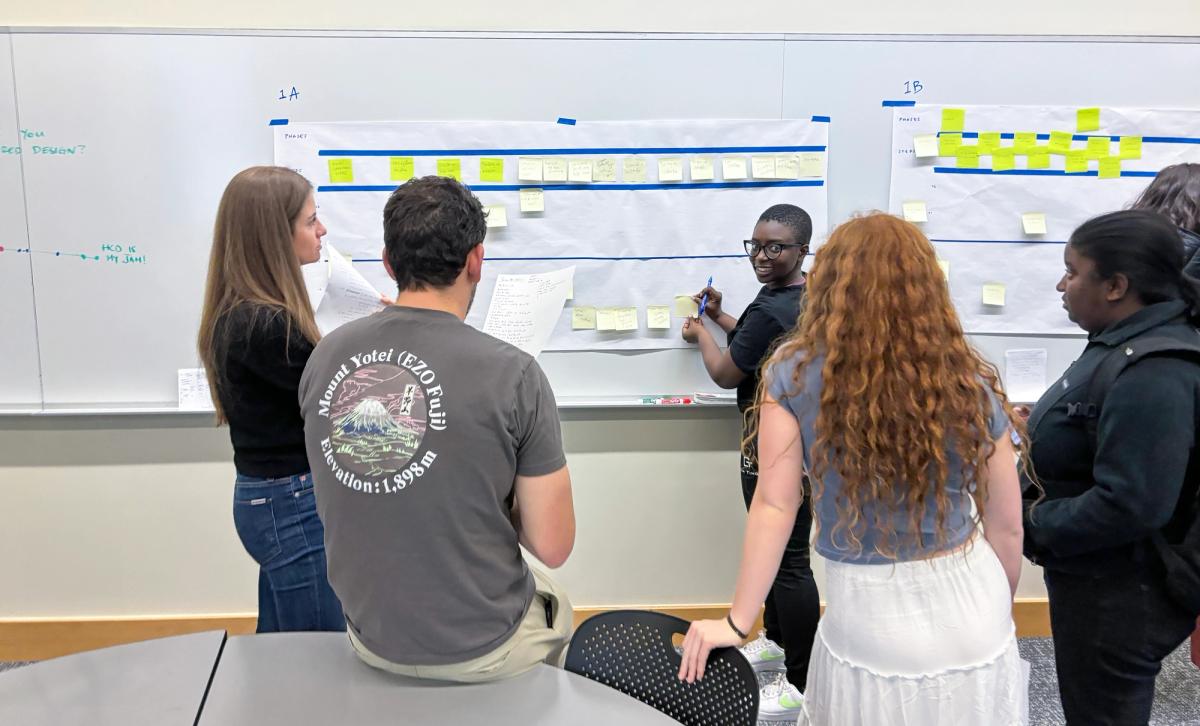
For the main activity of the evening, groups developed a “current state” journey map which charts a person’s current — often flawed — experience using sticky notes and large paper charts. Image courtesy of Sloan Design Club
Defining key terms, Chan differentiated HCD from similar fields like user experience and design thinking. In particular, HCD begins with understanding the needs of people experiencing a problem to be addressed — where journey mapping proves useful.
Participants with a shared interest in HCD came together in small groups and mingled over dinner. For the main activity of the evening, groups developed a “current state” journey map which charts a person’s current — often flawed — experience using sticky notes and large paper charts. The first step in developing the journey map is to hear from a user directly, taking detailed notes and quotes. In a live mock interview with Chan, Sloan Design Club Vice President Marissa Cui retold her rocky experience moving from New York to Cambridge. Cui scoped the extent of her moving process from the moment she decided to attend MIT Sloan to when she unpacked the last box.“Moving sucks!” says Cui, anticipating the move and dealing with delays from her movers. But by the end of the move, the gift basket that her family dropped off lifted her spirits.
In this exercise, Cui portrayed a user while Chan modeled insightful interviewing as an HCD designer. From their notes, participants broke out into groups and mapped out the scenario from beginning to end, enumerating steps, grouping steps into phases, and mapping emotions to steps using sticky notes, a useful material because of their ability to be placed and moved around as individuals chimed in to fill gaps, offer new ideas, and pose questions to their groups in service of a shared learning effort. Each group enriched its journey map with numerous details gained from a brief interview, lighting the room abuzz with discussion.
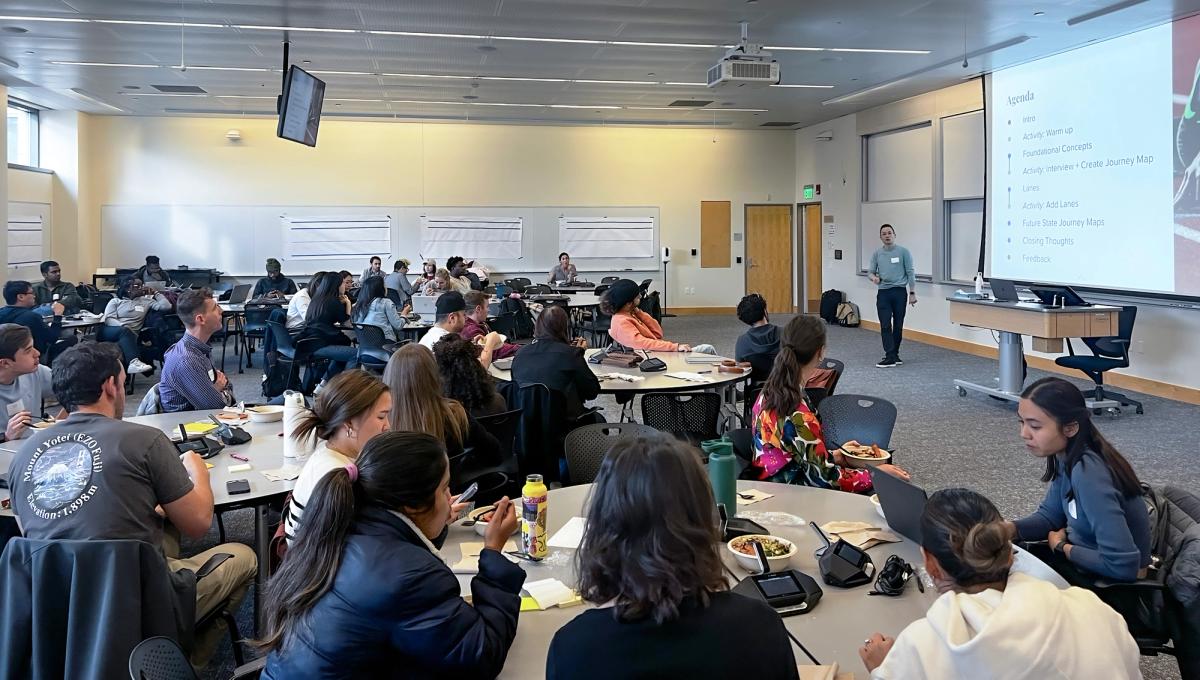
Over forty attendees from MIT and the public joined the MIT Sloan Design Club and guest designer Evan Chan, founder and director of the Human-Centered Design (HCD) Lab, in the workshop “User Journeys” on April 8. Photo courtesy of the Sloan Design Club
In an extension of the activity, participants ideated “lanes,” additional rows of the journey map that track useful information, depending on the audience or goals of the map. Lanes could include notable pain points, key dates, or time taken to complete a step.
In a final reflection and Q&A, a participant noted the challenge in detaching one’s own biases and predispositions during the journey mapping process. Foregrounding the importance of centering the end user’s needs, Chan advised taking careful notes and conducting multiple interviews, which can lead to the formulation of “archetypes,” another HCD tool that helps consider common user experiences.
At the same time, Chan emphasized the importance of “outliers” or “extreme users” — who are characterized by having the opposite experience of most users — as they can illuminate unique needs and gaps to be filled. Following the completion of a current state journey map, a designer could create a “future state” journey map to help envision and communicate a better experience.
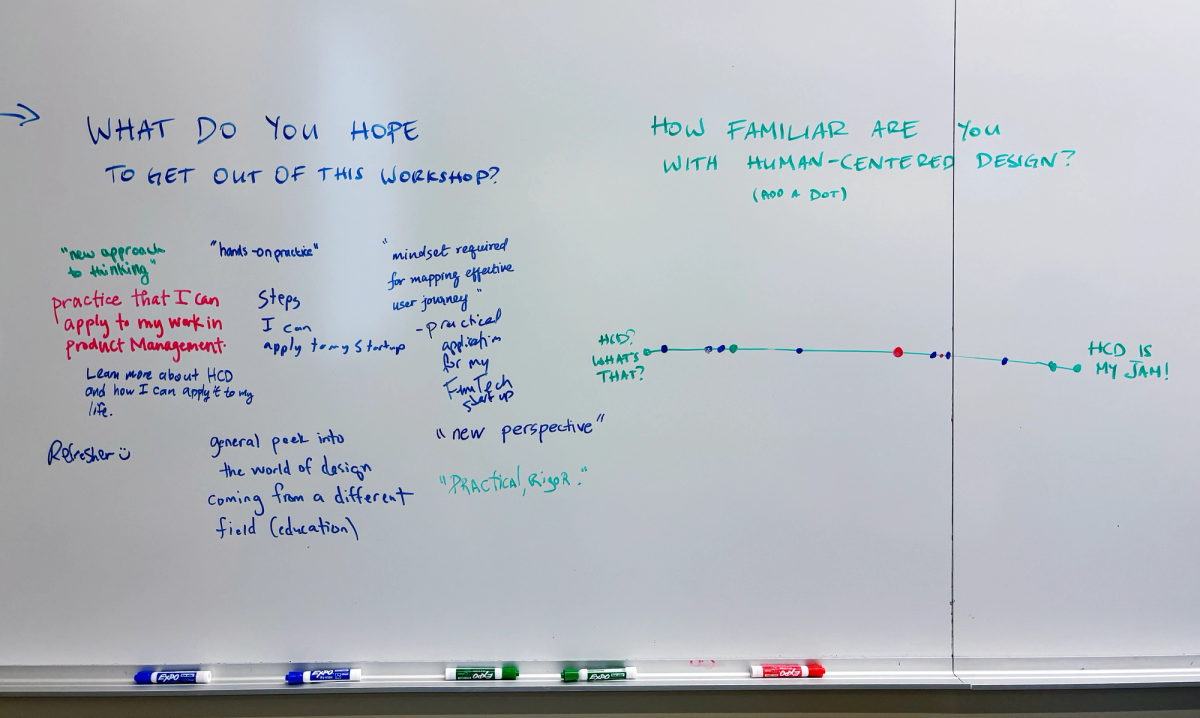
For the Sloan Design Club, students benefit from access to design education in order to “connect with others, broaden their understanding of design, and develop tangible design-related skills.” Photo courtesy of the Sloan Design Club
MIT Sloan Design Club leaders Marissa Cui, Becca Sandercock, 2022 Design Fellow Mariama N’diaye, and 2023 Fellow Jenny Cang co-organized the event. N’diaye and Cang serve as co-presidents of the MIT Sloan Design Club, leading the organization’s vision. Cui and Sandercock are incoming co-presidents and currently serve to publicize and facilitate events such as “User Journeys” and future hands-on workshops.
“As part of our mission, we have strived to bring design-based knowledge to MIT Sloan, which is unfortunately not available within the Sloan community,” say Sloan Design Club leaders. They highlight that students benefit from access to design education in order to “connect with others, broaden their understanding of design, and develop tangible design-related skills.” They add:

Through their programming, the MIT Sloan Design Club aims “to bridge the gap between the Sloan students curious in design and the greater MIT design ecosystem. Photo courtesy of the Sloan Design Club
As a human-centered designer and director of the Human-Centered Design Lab (HCD Lab), Chan works to facilitate conversation and collaboration for better design, bringing his experience from government and business contexts to MIT. Feedback from “User Journeys” attendees highlighted the dynamic and interactive learning experience facilitated by Chan. Kicking off his work as director of the HCD Lab by collaborating with the Sloan Design Club, Chan aims to help foster space for community-building around HCD, which he identifies as an “unmet need” in the Greater Boston area.
Featured People
Related news, related events.

DRS2024 BOSTON
The Power of Design

Designing Experience
Help | Advanced Search
Computer Science > Computation and Language
Title: a user-centric benchmark for evaluating large language models.
Abstract: Large Language Models (LLMs) are essential tools to collaborate with users on different tasks. Evaluating their performance to serve users' needs in real-world scenarios is important. While many benchmarks have been created, they mainly focus on specific predefined model abilities. Few have covered the intended utilization of LLMs by real users. To address this oversight, we propose benchmarking LLMs from a user perspective in both dataset construction and evaluation designs. We first collect 1846 real-world use cases with 15 LLMs from a user study with 712 participants from 23 countries. These self-reported cases form the User Reported Scenarios(URS) dataset with a categorization of 7 user intents. Secondly, on this authentic multi-cultural dataset, we benchmark 10 LLM services on their efficacy in satisfying user needs. Thirdly, we show that our benchmark scores align well with user-reported experience in LLM interactions across diverse intents, both of which emphasize the overlook of subjective scenarios. In conclusion, our study proposes to benchmark LLMs from a user-centric perspective, aiming to facilitate evaluations that better reflect real user needs. The benchmark dataset and code are available at this https URL .
Submission history
Access paper:.
- Other Formats
References & Citations
- Google Scholar
- Semantic Scholar
BibTeX formatted citation
Bibliographic and Citation Tools
Code, data and media associated with this article, recommenders and search tools.
- Institution
arXivLabs: experimental projects with community collaborators
arXivLabs is a framework that allows collaborators to develop and share new arXiv features directly on our website.
Both individuals and organizations that work with arXivLabs have embraced and accepted our values of openness, community, excellence, and user data privacy. arXiv is committed to these values and only works with partners that adhere to them.
Have an idea for a project that will add value for arXiv's community? Learn more about arXivLabs .
Numbers, Facts and Trends Shaping Your World
Read our research on:
Full Topic List
Regions & Countries
- Publications
- Our Methods
- Short Reads
- Tools & Resources
Read Our Research On:
About 1 in 5 U.S. teens who’ve heard of ChatGPT have used it for schoolwork

Roughly one-in-five teenagers who have heard of ChatGPT say they have used it to help them do their schoolwork, according to a new Pew Research Center survey of U.S. teens ages 13 to 17. With a majority of teens having heard of ChatGPT, that amounts to 13% of all U.S. teens who have used the generative artificial intelligence (AI) chatbot in their schoolwork.

Teens in higher grade levels are particularly likely to have used the chatbot to help them with schoolwork. About one-quarter of 11th and 12th graders who have heard of ChatGPT say they have done this. This share drops to 17% among 9th and 10th graders and 12% among 7th and 8th graders.
There is no significant difference between teen boys and girls who have used ChatGPT in this way.
The introduction of ChatGPT last year has led to much discussion about its role in schools , especially whether schools should integrate the new technology into the classroom or ban it .
Pew Research Center conducted this analysis to understand American teens’ use and understanding of ChatGPT in the school setting.
The Center conducted an online survey of 1,453 U.S. teens from Sept. 26 to Oct. 23, 2023, via Ipsos. Ipsos recruited the teens via their parents, who were part of its KnowledgePanel . The KnowledgePanel is a probability-based web panel recruited primarily through national, random sampling of residential addresses. The survey was weighted to be representative of U.S. teens ages 13 to 17 who live with their parents by age, gender, race and ethnicity, household income, and other categories.
This research was reviewed and approved by an external institutional review board (IRB), Advarra, an independent committee of experts specializing in helping to protect the rights of research participants.
Here are the questions used for this analysis , along with responses, and its methodology .
Teens’ awareness of ChatGPT
Overall, two-thirds of U.S. teens say they have heard of ChatGPT, including 23% who have heard a lot about it. But awareness varies by race and ethnicity, as well as by household income:

- 72% of White teens say they’ve heard at least a little about ChatGPT, compared with 63% of Hispanic teens and 56% of Black teens.
- 75% of teens living in households that make $75,000 or more annually have heard of ChatGPT. Much smaller shares in households with incomes between $30,000 and $74,999 (58%) and less than $30,000 (41%) say the same.
Teens who are more aware of ChatGPT are more likely to use it for schoolwork. Roughly a third of teens who have heard a lot about ChatGPT (36%) have used it for schoolwork, far higher than the 10% among those who have heard a little about it.
When do teens think it’s OK for students to use ChatGPT?
For teens, whether it is – or is not – acceptable for students to use ChatGPT depends on what it is being used for.
There is a fair amount of support for using the chatbot to explore a topic. Roughly seven-in-ten teens who have heard of ChatGPT say it’s acceptable to use when they are researching something new, while 13% say it is not acceptable.

However, there is much less support for using ChatGPT to do the work itself. Just one-in-five teens who have heard of ChatGPT say it’s acceptable to use it to write essays, while 57% say it is not acceptable. And 39% say it’s acceptable to use ChatGPT to solve math problems, while a similar share of teens (36%) say it’s not acceptable.
Some teens are uncertain about whether it’s acceptable to use ChatGPT for these tasks. Between 18% and 24% say they aren’t sure whether these are acceptable use cases for ChatGPT.
Those who have heard a lot about ChatGPT are more likely than those who have only heard a little about it to say it’s acceptable to use the chatbot to research topics, solve math problems and write essays. For instance, 54% of teens who have heard a lot about ChatGPT say it’s acceptable to use it to solve math problems, compared with 32% among those who have heard a little about it.
Note: Here are the questions used for this analysis , along with responses, and its methodology .
- Artificial Intelligence
- Technology Adoption
- Teens & Tech

Olivia Sidoti is a research assistant focusing on internet and technology research at Pew Research Center

Jeffrey Gottfried is an associate director focusing on internet and technology research at Pew Research Center
Many Americans think generative AI programs should credit the sources they rely on
Americans’ use of chatgpt is ticking up, but few trust its election information, q&a: how we used large language models to identify guests on popular podcasts, striking findings from 2023, what the data says about americans’ views of artificial intelligence, most popular.
1615 L St. NW, Suite 800 Washington, DC 20036 USA (+1) 202-419-4300 | Main (+1) 202-857-8562 | Fax (+1) 202-419-4372 | Media Inquiries
Research Topics
- Age & Generations
- Coronavirus (COVID-19)
- Economy & Work
- Family & Relationships
- Gender & LGBTQ
- Immigration & Migration
- International Affairs
- Internet & Technology
- Methodological Research
- News Habits & Media
- Non-U.S. Governments
- Other Topics
- Politics & Policy
- Race & Ethnicity
- Email Newsletters
ABOUT PEW RESEARCH CENTER Pew Research Center is a nonpartisan fact tank that informs the public about the issues, attitudes and trends shaping the world. It conducts public opinion polling, demographic research, media content analysis and other empirical social science research. Pew Research Center does not take policy positions. It is a subsidiary of The Pew Charitable Trusts .
Copyright 2024 Pew Research Center
Terms & Conditions
Privacy Policy
Cookie Settings
Reprints, Permissions & Use Policy
This paper is in the following e-collection/theme issue:
Published on 26.4.2024 in Vol 26 (2024)
Understanding Symptom Self-Monitoring Needs Among Postpartum Black Patients: Qualitative Interview Study
Authors of this article:
Original Paper
- Natalie Benda 1 , PhD ;
- Sydney Woode 2 , BSc ;
- Stephanie Niño de Rivera 1 , BS ;
- Robin B Kalish 3 , MD ;
- Laura E Riley 3 , MD ;
- Alison Hermann 4 , MD ;
- Ruth Masterson Creber 1 , MSc, PhD, RN ;
- Eric Costa Pimentel 5 , MS ;
- Jessica S Ancker 6 , MPH, PhD
1 School of Nursing, Columbia University, New York, NY, United States
2 Department of Radiology, Early Lung and Cardiac Action Program, The Mount Sinai Health System, New York, NY, United States
3 Department of Obstetrics and Gynecology, Weill Cornell Medicine, New York, NY, United States
4 Department of Psychiatry, Weill Cornell Medicine, New York, NY, United States
5 Department of Population Health Sciences, Weill Cornell Medicine, New York, NY, United States
6 Department of Biomedical Informatics, Vanderbilt University Medical Center, Nashville, TN, United States
Corresponding Author:
Natalie Benda, PhD
School of Nursing
Columbia University
560 West 168th Street
New York, NY, 10032
United States
Phone: 1 212 305 9547
Email: [email protected]
Background: Pregnancy-related death is on the rise in the United States, and there are significant disparities in outcomes for Black patients. Most solutions that address pregnancy-related death are hospital based, which rely on patients recognizing symptoms and seeking care from a health system, an area where many Black patients have reported experiencing bias. There is a need for patient-centered solutions that support and encourage postpartum people to seek care for severe symptoms.
Objective: We aimed to determine the design needs for a mobile health (mHealth) patient-reported outcomes and decision-support system to assist Black patients in assessing when to seek medical care for severe postpartum symptoms. These findings may also support different perinatal populations and minoritized groups in other clinical settings.
Methods: We conducted semistructured interviews with 36 participants—15 (42%) obstetric health professionals, 10 (28%) mental health professionals, and 11 (31%) postpartum Black patients. The interview questions included the following: current practices for symptom monitoring, barriers to and facilitators of effective monitoring, and design requirements for an mHealth system that supports monitoring for severe symptoms. Interviews were audio recorded and transcribed. We analyzed transcripts using directed content analysis and the constant comparative process. We adopted a thematic analysis approach, eliciting themes deductively using conceptual frameworks from health behavior and human information processing, while also allowing new themes to inductively arise from the data. Our team involved multiple coders to promote reliability through a consensus process.
Results: Our findings revealed considerations related to relevant symptom inputs for postpartum support, the drivers that may affect symptom processing, and the design needs for symptom self-monitoring and patient decision-support interventions. First, participants viewed both somatic and psychological symptom inputs as important to capture. Second, self-perception; previous experience; sociocultural, financial, environmental, and health systems–level factors were all perceived to impact how patients processed, made decisions about, and acted upon their symptoms. Third, participants provided recommendations for system design that involved allowing for user control and freedom. They also stressed the importance of careful wording of decision-support messages, such that messages that recommend them to seek care convey urgency but do not provoke anxiety. Alternatively, messages that recommend they may not need care should make the patient feel heard and reassured.
Conclusions: Future solutions for postpartum symptom monitoring should include both somatic and psychological symptoms, which may require combining existing measures to elicit symptoms in a nuanced manner. Solutions should allow for varied, safe interactions to suit individual needs. While mHealth or other apps may not be able to address all the social or financial needs of a person, they may at least provide information, so that patients can easily access other supportive resources.
Introduction
This study focused on designing a culturally congruent mobile health (mHealth) app to support postpartum symptom monitoring, as the current practice does not adequately support patients in identifying the warning signs of pregnancy-related death (PRD). First, we describe the public health case for symptom monitoring and decision support for PRD, specifically among US-based, Black patients, a group that faces severe disparities [ 1 , 2 ]. Next, we discuss why the current mechanisms for symptom monitoring and decision support are insufficient. We then outline the existing solutions while also emphasizing the need for new interventions, particularly why those using a combination of mHealth and patient-reported outcomes (PROs) may be appropriate. Finally, we introduce a conceptual model used to accomplish our study objectives.
PRD and Associated Health Disparities
The pregnancy-related mortality ratio has increased by >200% in the United States in the past 2 decades, and in a recent review of PRDs, experts estimated that 80% of the deaths were preventable [ 3 ]. The Centers for Disease Control and Prevention (CDC) defines PRD as “the death of a woman while pregnant or within 1 year of the end of pregnancy from any cause related to or aggravated by the pregnancy” [ 4 , 5 ]. Mental health conditions (22.7%), hemorrhage (13.7%), cardiac and coronary conditions (12.8%), infection (9.2%), thrombotic embolism (8.7%), and cardiomyopathy (8.5%) have been cited as the most common causes for PRD [ 3 ]. Although the global maternal mortality rate has declined, the global rates are still high with 287,000 people dying following childbirth in 2020. There are significant disparities in maternal mortality based on a country’s income, with almost 95% of the cases occurring in low- and middle-income countries [ 6 ]. Stark disparities in pregnancy-related outcomes in the United States, such as PRD, exist based on race. Specifically, Black or African American (henceforth, referred to as “Black”) perinatal patients experience PRD 3 times more than White perinatal patients [ 1 , 2 , 7 - 10 ].
The disparities in maternal health outcomes experienced by Black patients in the United States are based on inequitable access to care, biased treatment, and inadequate communication, driven by systemic racism and all the cascading effects it creates. Black perinatal patients are significantly more likely to be uninsured and significantly less likely to have a usual source of medical care (eg, a primary care clinician) than White patients [ 7 , 10 ]. When Black patients seek care, they face implicit biases that negatively affect care quality and health outcomes [ 1 , 7 , 10 - 12 ]. Unsurprisingly, these biases have led to reduced trust in the health care system among Black patients [ 13 - 17 ]. Black patients also receive less patient-centered communication and feel that they have poorer access to communication with their medical team [ 10 , 18 , 19 ]. Our study aimed to improve the patient centeredness of information and support for Black patients in the postpartum period through a participatory design, an approach by which representative end users are involved throughout the design process [ 20 - 23 ]. While this study focused on Black postpartum patients in the United States, we believe that our findings may provide insights for improving perinatal support for patients from minority groups globally.
Challenges to Supporting Symptom Recognition and Treatment Seeking Post Partum
Patients encounter several challenges recognizing concerning postpartum symptoms. First, the initial postpartum visit occurs 6 weeks after birth, and 86% of PRD cases occur within the first 6 weeks post partum [ 24 , 25 ]. Second, most strategies for improving postpartum outcomes focus on hospital-based solutions, which rely on people recognizing symptoms and contacting a health professional [ 7 ]. Most counseling regarding the warning signs of PRD occurs during the discharge process following delivery, when people are physically exhausted from childbirth and primarily focused on infant care [ 24 ]. As such, this is a suboptimal time for patient education about postpartum risk factors. Discharge nurses report spending <10 minutes on the warning signs of postpartum issues, and most nurses could not correctly identify the leading causes of PRD, making it unlikely that their patients could recognize the warning signs [ 26 ]. There are many measures for postpartum symptom reporting, but the most common instruments focus narrowly on specific mental health issues, many of which are not specific to postpartum mental health or postpartum health–related quality of life [ 27 ]. While these are helpful measures to use in a clinic or hospital setting, they do not provide real-time decision support regarding the full spectrum of severe symptoms that may be indicative of PRD.
Suitability of Different Solutions for Supporting Symptom Monitoring
mHealth can address the need for tailored, dynamic symptom monitoring and support. The Association of Women’s Health, Obstetric, and Neonatal Nurses and the CDC have developed 1-page summaries to help patients identify the warning signs of PRD, such as the Urgent Maternal Warning Signs (UWS) [ 28 , 29 ]. These tools represent a positive step toward improving symptom management, but these solutions do not provide real-time, tailored support. Telephone-based support staffed by health professionals has been demonstrated to decrease postpartum depression and improve maternal self-efficacy [ 30 - 33 ]. However, 24-hour hotlines can be resource intensive, and people may still experience bias when accessing these services. The goal of this study was to conduct a qualitative needs assessment for the Maternal Outcome Monitoring and Support app, an mHealth system using PROs to provide decision support for postpartum symptom monitoring.
Mobile phones offer a viable, inclusive option for intervention delivery for Black people of childbearing age. In 2020, data from the Pew Research Center indicate that 83% of Black people owned smartphones, which is comparable to smartphone ownership among White people (85%). Smartphone ownership is also higher among people aged <50 years (96%), which encompasses most postpartum patients [ 34 ]. However, Black people are twice as likely as White people to be dependent on smartphones for internet access [ 35 ]. mHealth-based apps for blood pressure and weight tracking during pregnancy have demonstrated success among diverse groups, providing evidence that mHealth may be an acceptable means for symptom reporting in the target population [ 36 - 38 ].
Symptom education and PRO-based interventions have demonstrated success in improving knowledge, self-efficacy, and outcomes. Use of PROs has improved symptom knowledge, health awareness, communication with health care professionals, and prioritization of symptoms in patients with chronic disease and cancer [ 39 - 44 ]. Multiple studies have also demonstrated that educational interventions regarding expected symptoms in the postpartum period can improve self-efficacy, resourcefulness, breastfeeding practices, and mental health [ 12 , 38 , 45 - 47 ]. However, given the issues related to trust and disparities in patient-centered communication, it is critical to understand Black patients’ perspectives about how such a system should be designed and implemented.
Conceptual Model
To study the issue of supporting symptom monitoring, we combined 2 theoretical frameworks ( Figure 1 ): the common sense model of self-regulation (health behavior) by Diefenbach and Leventhal [ 48 ] and the model of human information processing (human factors engineering) by Wickens [ 49 ]. The model by Diefenbach and Leventhal [ 48 ] depicts patients as active problem solvers with a mental model of their conditions. Patients process their symptoms, both cognitively and emotionally, and then evaluate whether action is needed [ 48 ]. The patient’s mental model of their condition, personal experiences, and sociocultural factors impact processing, evaluation, and action. In the information processing model by Wickens [ 49 ], action occurs in 2 steps—selection and execution [ 48 ]. Environmental or organizational factors also affect patients’ selection of actions and whether they can execute an action. For example, a patient may suspect that they should visit the emergency room but may not go because they do not have insurance, transportation, or childcare. Our qualitative inquiry investigated how to better support symptom processing and appropriate response selection, while also uncovering the barriers to action that may need to be mitigated.

The goal of this study was to identify the design and implementation needs of an mHealth-based symptom self-monitoring and decision-support system to support Black patients in determining when to seek care from a health professional for signs of PRD in the postpartum period. This tool will support both somatic and psychological symptoms given their complex, critical, and connected presentation. We used the described conceptual model in qualitative inquiry and pragmatic intervention design to provide contributions regarding the following: (1) relevant symptom inputs for postpartum support, (2) drivers that may affect symptom processing, and (3) how the previous 2 aspects highlight the design needs for symptom self-monitoring and patient decision support. To address our study objective, we conducted semistructured interviews with postpartum Black patients, obstetrics health professionals, and mental health professionals.
The study was conducted in 3 tertiary care hospitals and affiliated clinics within the same health system in New York City. The 3 hospitals, taken together, are involved in the delivery of >14,000 babies annually. All participants were either patients who received obstetric care in the included sites or health professionals affiliated with the sites.
Eligible patients were identified by the institutions’ research informatics team using electronic health record data. First, the patients’ providers consented to their patients being contacted, and patients’ charts were reviewed by the primary obstetrician or designate to ensure that the patient was eligible for the study and that they had a delivery experience that would allow them to participate in the interview without undue stress. Next, the patients were sent an invitation to participate via the email address listed in their record. We also posted fliers in 2 high-risk, outpatient obstetric clinics.
Obstetric and mental health professionals were eligible if they were affiliated with one of the institutions in the obstetrics or mental health department. Brief presentations were given at relevant faculty meetings, and participants were contacted individually via email or through departmental listserves.
Interested participants from all groups used a link to schedule a time to speak with a researcher.
Ethical Considerations
The study was approved by the affiliated medical schools’ institutional review board (protocol number 20-08022582). All participants provided written informed consent. Study data were coded (ie, all identifying information was removed) to protect participant privacy. Each participant was compensated US $50 for their time via a physical or electronic gift card.
Study Design and Sample
The study used semistructured interviews with 3 key stakeholder groups: recent postpartum Black patients, obstetric health professionals, and mental health professionals. Eligible patients were within 12 months post partum of a live birth, self-identified their race as Black or African American, and had at least 1 somatic or psychological high-risk feature associated with their pregnancy. High-risk features included attendance at a high-risk clinic for prenatal or postnatal care, inpatient hospitalization within 12 months post partum, a prescription of an antidepressant or benzodiazepine within 12 months of the pregnancy, or a new diagnosis of depression or anxiety within 12 months of the pregnancy. High-risk clinics treated various conditions, but the most common conditions were gestational hypertension and gestational diabetes.
We adopted an interpretivist qualitative research paradigm to study patient and health professionals’ perspectives of how symptom recognition and care seeking may be better supported [ 50 ]. Our methodological orientation involved directed content analysis, adopting an abductive reasoning approach. First, we used the previously specified conceptual model to construct questions and thematically categorize responses [ 48 ]. Then, we allowed unique subthemes to inductively emerge from the data collected [ 51 ].
Interview Guide Development
Interview guides were iteratively developed by our team of researchers with expertise in obstetrics, perinatal mental health, nursing, consumer informatics, inclusive design, and qualitative methods. The guide for each stakeholder group was reviewed and piloted before enrollment of the first participant. Interview guides were tailored for patients or health professionals but followed a similar structure, based on our conceptual model ( Figure 1 ), such that participants were first asked about barriers to and facilitators of processing symptoms cognitively and emotionally (eg, Do they notice the symptom or realize its severity?), making decisions about symptoms they are experiencing (ie, When to seek help from a health professional?), and taking action on problematic symptoms. Probing questions encouraged participants to elaborate on experiential, educational, sociocultural, organizational, environmental, or health systems–level drivers of patients’ symptom management. Then, participants were asked a series of questions related to their thoughts regarding the design of the mHealth system, including how to best report symptoms, the wording of system decision support, the desired level of involvement of the obstetrics health professionals, the means for facilitating outreach to a health professional, additional information resources, and preferences for sharing information included in the system with a trusted friend or family members. During this process, obstetrics and mental health professionals were also shown a handout that outlined the draft of the symptom management algorithm for the system being developed (CDC’s UWS) and asked if they would make any changes, additions, or deletions [ 29 ]. Full interview guides are included in Multimedia Appendix 1 .
Data Collection
All interviewees provided consent electronically before the interview. A PhD-trained qualitative research expert (NB) completing a postdoctoral study in health informatics and population health conducted all the interviews via Zoom (Zoom Video Communications) or telephone. Participants had the option to request an in-person interview, but none of them chose this option. Interviews lasted 30 to 60 minutes and were audio recorded. We explicitly described the study objectives to each participant before the interview. Following the interview, participants completed a demographics survey electronically. All electronic survey information was collected using REDCap (Research Electronic Data Capture; Vanderbilt University).
Data Preparation and Analysis
Audio recordings were converted into transcripts using an electronic software (NVivo Transcription; QSR International) and manually checked for accuracy by a study team member who did not conduct the initial interviews. We completed all data analyses using NVivo (versions 12 and 13), but we manually analyzed the data and did not use computer-aided techniques (eg, computerized emotion detection or autocoding).
Data were analyzed using thematic analysis and the constant comparative process [ 51 - 53 ]. Specifically, each analyst open coded the transcripts, by coding segments that pertained to the research questions, as opposed to coding all words and phrases. We used thematic analysis to detect the common and divergent needs for postpartum symptom monitoring. We chose this method over other approaches such as grounded theory or sentiment analysis because our needs were pragmatic to solution design, and we were not attempting to establish theory, describe phenomena, or represent collective feeling about a topic.
The first deductive analysis was conducted using an initial theoretical model derived from the common sense model by Diefenbach and Leventhal [ 48 ] and the model of human information processing by Wickens [ 49 ] ( Figure 1 ). To promote reliability, 2 coders in addition to the interviewer were involved in the analysis, and each transcript was first analyzed independently by at least 2 people (NB, SW, or SNdR), followed by meetings to resolve discrepancies based on consensus coding. The analysis team created initial codes based on the conceptual model and added new items to the codebook inductively (ie, post hoc instead of a priori, as they arose in the data). The team used NVivo to maintain a working codebook of themes, definitions, and relevant quotes derived from the data. The codebook was periodically presented to coinvestigators with expertise in obstetrics and perinatal psychiatry to improve external validity [ 51 , 52 ]. The sufficiency of sample size was assessed according to the theoretical saturation of themes encountered, specifically based on the need to add additional subthemes to the codebook [ 54 , 55 ]. After all the transcripts had been coded, at least 2 members of the coding team reviewed the data code by code to ensure that meaning remained consistent throughout the analysis and to derive key emerging themes [ 51 ].
Participant Characteristics
This study included 36 participants—15 (42%) obstetrics health professionals, 10 (28%) mental health professionals, and 11 (31%) recent postpartum Black patients. Table 1 presents the self-reported demographic information. As shown, 19% (7/36) of the health professionals and 11% (4/36) of the patients had missing data (ie, did not complete the questionnaire). Participants could also selectively choose not to answer questions. “Other” affiliations were possible for health professionals because those who had a secondary affiliation with one of the included sites but primary affiliation with another organization were eligible.
a N/A: not applicable.
b Health professionals’ self-reported role of resident psychiatrist, chief resident in psychiatry, psychologist, and patient care director was combined into the other category for analysis purposes.
Structure of Themes
Our initial theoretical model, derived from the common sense model by Diefenbach and Leventhal [ 48 ] and the model of human information processing by Wickens [ 49 ] ( Figure 1 ), described that patients experience some inputs (psychological and somatic symptoms of PRD). Then, there is a series of drivers that affect how patients cognitively and emotionally process (eg, notice and realize symptom severity), make decisions about, and act on symptoms they are experiencing. The nature of these symptoms, how they are processed, how decisions are made, and how they are acted upon then drive a conversation regarding the design needs for symptom monitoring and decision support for PRD. The emerging themes were organized into the following categories: (1) symptoms of PRD; (2) drivers of processing, decision-making, and action; and (3) design needs for a symptom-reporting and decision-support system. Quotes are labeled with study-specific identifiers: OB denotes obstetric health professional, MHP denotes mental health professional, and PT denotes patient.
Inputs: Psychological and Somatic Symptoms of PRD
Concerning and routine symptoms were reported both from a psychological and somatic perspective. Sometimes, the distinction between routine and concerning symptoms was clear. Other times, it was more challenging to differentiate routine versus concerning symptoms particularly because they were related to psychological health. Mental health professionals also noted the challenge that routine symptoms can progress to something more serious over time:
In my mind, like normal becomes abnormal, when there is any kind of functioning [loss] that like withstands two to three weeks. [MHP 04]
We really hear a lot about postpartum depression and stuff...A lot of women think...postpartum depression is you just don’t want to. You don’t have it. You go into depression where you can’t take care of your child and you don’t want to hold your child. You don’t feel connected to your child. And I learned...it can be so many different things. [PT 09]
A clear distinction was not always present between psychological and somatic symptoms:
If someone...has pain in their chest or shortness of breath, the first thing you want to think about is it sort of like clots and other kind of physiologic reasons for that. Those are also very implicated and sort of obviously [associated with] panic attacks and anxiety. So, I think though those symptoms are also relevant of physical symptoms, [they] are also relevant for mental health. [MHP 05]
Drivers of Processing, Decision-Making, and Action Based on the Symptoms Experienced
Several drivers were reported to affect symptom processing (ie, whether they noticed the symptom and its severity), patients’ capacity to decide what should be done (ie, make decisions), and whether they were able to act on concerning symptoms ( Table 2 ).
Table 2 presents exemplary quotes for emerging themes under a single driver, but many quotes were coded under multiple drivers in our analysis process. The following passage, for example, highlights how self-perception, sociocultural concerns, and the health system can overlap to present a complex set of factors that may prevent women from receiving the care they need for the symptoms they are experiencing:
A lot of times I think that does get overlooked because people feel like, well, you’re OK, you’re fine. But what research shows us is that especially for Black women, it really doesn’t matter how much money you make or your income level, like our postpartum and perinatal health outcomes are the same across the board, which is really detrimental. So, yeah, I think they get overlooked because of that. I think they get overlooked or we get overlooked in the health care system. But I also think we get overlooked by our family and friends because we’re the strong ones. So, if anybody can deal with this, it’s you. [MHP 10]
a MHP: mental health professional.
b PT: patient.
c OB: obstetric health professional.
Design Needs for a Symptom-Reporting and Decision-Support System
Obstetric health professionals, mental health professionals, and patients discussed multiple needs for improved PRD symptom reporting and decision support. The key design requirements are embedded and italicized in the following text.
Participants generally agreed that although the proposed system focuses on postpartum symptoms, it would be advantageous to introduce the system during pregnancy, particularly in the third trimester :
You have to reach women before they give birth. They might look, they might not look, they might look at it and be concerned. But then they might forget about it and not have time to call. Those first six weeks are really chaotic. [MHP 06]
I think in the third trimester would be great because often we don’t really have anything to talk about in the office. It’s very quick visits like blood pressure and you’re still pregnant and we’re just waiting. And so, I think and they start to have a lot of questions about like, well, when I get home and how’s this going to go? So, I think that time is a good time. We’re all kind of just waiting for labor to happen or full term to get there, and this kind of gives them something to feel like they can prepare for. [OB 08]
Patients were open to reminders regarding entering symptoms they were experiencing, and participants described a desire for just-in-time symptom reporting and decision support, so that they could get quick feedback as they were experiencing the symptoms:
When people get home so much in their life has changed. And it’s probably a very hectic time. So maybe I think that’s a great idea reaching out again, either a few days or a week later to make sure they’re really able to use it and engage with it to the extent that’s helpful to them. [OB 02]
I think it would be a good idea to have like a system where you can report whenever you want. [PT 03]
I think for me, I would say in the moment. But then also having something at the end of every week to just, you know, to check in with yourself. I think that would be good as well. [PT 09]
In addition to considerations about how symptoms would be recorded, participants stressed the importance of the wording of the decision-support messages that patients receive . For messages that inform the patient that their symptom did not seem to require immediate medical attention, it was important to ensure that the patient still felt heard and that they did not leave the interaction feeling stuck with nothing to do regarding a symptom that was concerning to them:
Reframe the message. You know...we apologize that you were experiencing this. We just want to reassure you that this is normal. [PT 01]
[You] don’t want to make anyone feel like their feelings aren’t valid because that’s a horrible thing, especially in health care, especially if a person is convinced that something is wrong with them and you’re telling them that it’s normal and is perfectly fine. So, in that situation, I would just, depending on what the issue is, I would also share information of what to look out for. [PT 05]
The first thing is that it’s normal, but also something that you want to be able to do for comfort. For me, I don’t have to do too much, especially if I’m having anxiety, like if I get a text back that says here are some things you can do in this very moment to handle it. And then also, here are some links or information that you can also look up. [PT 09]
In the events where a concerning symptom was reported and it was recommended that the patient should reach out to a health professional, importance of conveying a sense of urgency without scaring the patient:
You don’t want to scare people, but it’s kind of hard to get around that when something is serious, and you don’t want to dumb it down. [PT 01]
Participants wanted multiple, easy-to-do methods for connecting with their health professional team, including having the number to call pop up, scheduling a time for someone to call them, and being able to start a live web-based chat:
I like all the options, especially that form or chat you can have like, you know, those online chat where like you really chatting with someone for those who like the type. I’m the type of person I just want to make a phone call, right? So, like for me, [it] will be a call. Maybe say maybe if it’s five, five or ten minutes then that will be great. Like especially, it’s going to make me feel like, OK, there’s someone out there that will care about my health. [PT 06]
However, participants noted that they would prefer not to use a symptom-reporting and decision-support tool, but instead reach out directly via phone if they were experiencing issues.
Participants, particularly mental health professionals, described a need for improved nuance or details regarding the different psychological symptoms patients could experience that are indicative of severe mental health issues:
Thoughts of hurting yourself or someone else is a good one...I would say I would add difficulty bonding. It would add something about not being able to sleep, even if you could sleep, you know, like or your anxiety that doesn’t go away, that changes your behavior. So, it changes the way that you interact with the baby or kind of do childcare. I guess I would want to say something about. psychotic thoughts, like fear that someone else may be hurting you or...recurrent worries or anxieties that don’t go away. [MHP 02]
Patients had differing opinions regarding whether the system should be integrated with other health technologies, particularly the patient portal:
I love the patient portal. I was able to be traveling to reach out to my OB, to reach out to all, you know, the nurses and stuff like that and just experience things that I needed. [PT 09]
I feel like...it’s an integral part of my medical history. So, even if it may seem somewhat insignificant for whatever reason, I would still want to have access. [PT 09]
I didn’t find it [the patient portal] very helpful... [PT 03]
On the basis of the feedback from health professionals that it may be challenging for postpartum patients to process and recognize certain symptoms, especially those related to mental health, we explored whether patient participants would be open to sharing educational information about symptoms to expect (rather than sharing the actual symptom reports) with trusted friends or family members. Similar to other design considerations, results were mixed, but it seemed helpful to have a patient-driven option for sharing symptom-related educational information with chosen friends or family members :
I think that there’s so much going on it would help to have someone with a different perspective equipped with this information. [PT 02]
There’s a lot of shame that comes with this. I’m not sure people would actually want other people to know. I can’t speak for the majority, but I didn’t really want people to know because I don’t want the kind of energy that came with people knowing. [PT 05]
We also discovered the competing needs of balancing the patient’s desire for their health professionals to be involved in symptom reporting with the need to avoid significant increases to health professional workload :
I sort of wonder from the health care provider perspective, how involved is the provider in that in the app? Like, do they get like a PDF of all the information? Is that more work for the provider? How does the provider interpret that data? [MHP 03]
I feel like they [the health professional] should be super involved. Especially because I’m not just going off of my experience because, you know, I don’t want to feel like they’re not really like I’m experiencing. And so, it’s scaring me. So, I just want to know that, you know, you’re hands on with everything. [PT 01]
Finally, the participants desired information beyond PRD symptoms to entice them to use the system . They were supportive of including various types of information, such as breastfeeding support resources, milestones and information regarding their child, other websites and apps with trusted maternal and child health information, further support resources for how they feel mentally, and links to social services (eg, food, housing, or other assistance).
Principal Findings
In this qualitative study, we interviewed obstetric health professionals, mental health professionals, and Black postpartum patients. Our findings helped to identify the design and implementation needs of an mHealth-based, symptom self-monitoring and decision-support system designed to support Black patients in determining when to seek care from a health professional for signs of PRD in the postpartum period. We encountered important findings related to (1) inputs, including psychological and somatic symptoms; (2) drivers of processing, decision-making, and action based on the symptoms experienced; and (3) design needs for a symptom-reporting and decision-support system. We have discussed how our findings may be helpful to other postpartum populations as well as the implications of our study for patient decision-support in other clinical settings.
First, our findings related to symptom inputs revealed the challenges caused by the overlapping presentation of somatic and psychological symptoms. This provides support for our approach of including psychological and somatic issues in a single app, particularly given that mental health conditions are a leading cause of PRD. A 2021 review found 15 PRO measures for assessing postpartum recovery. The measures typically focused on mental health or health-related quality of life, but few included both psychological and somatic outcomes, and none were targeted for PRD, such as the system [ 56 ].
Moreover, related to symptom inputs, we found that current tools for pinpointing severe symptoms, such as the CDC’s UWS did not provide sufficient nuance for concerning psychological symptoms. Symptom-reporting tools for PRD will either need to consider incorporating structured assessments, such as the Edinburgh Postnatal Depression Scale (EPDS) [ 56 ], or incorporating additional symptoms. The latter approach may have advantages as the EPDS focuses on depression (while providing subscales for anxiety) and PROs evaluated for use with anxiety disorders have limitations [ 57 ]. Furthermore, the EPDS has been validated in in-person laboratory settings but not in community settings or for web-based entry [ 58 ]. We must also consider how mistrust in the health system may lead to less truthful answers. Issues expressed around stigma related to mental health indicate that the way in which these symptoms are elicited may require further assessment to promote the normalcy of the symptoms and improve candid reporting. Technology-based approaches for supporting perinatal mental health have been described as uniformly positive but having limited evidence for use [ 59 ], suggesting that further exploration is needed in this area, also considering how adding somatic issues may be perceived by patients.
Second, there were several drivers that affected symptom processing, decision-making, and action that cannot typically be solved through a symptom-reporting and decision-support system. Challenges related to self-perception and lack of experience or expectations may be addressed based on the wording for how the symptoms are elicited and by providing concise, easy-to-understand depictions of what should be expected versus what are the causes for concern. However, many of the other issues described related to sociocultural, financial, and environmental factors and the health systems’ systemic racism issues cannot be addressed directly in a simple PRO-based app and decision-support system. Directly addressing these issues will likely require more systematic, multipronged approaches. Therefore, it seems advisable to couple patient decision-support aids with other social support interventions for perinatal health [ 60 , 61 ].
Drivers of processing, decision-making, and action are still important contextual elements to be considered in the design of the system. Another study tailoring an mHealth app for Latina patients to support health during pregnancy also found it important to address issues related to financial barriers, social support, health care accessibility, and cultural differences [ 62 ]. Our best attempt to address these issues may be to promote information transparency and inclusive design. For example, there may be a “frequently asked questions” section of an app, where patients can explore things such as supportive resources for childcare while they seek medical attention or information they may show their friends or family members regarding postpartum symptoms of concern. The system may also use common human-computer interaction principles, such as information filtering [ 63 ] and organizing the suggested resources (eg, for mental health care) based on whether they accept the patient’s insurance. The built environment can also be changed through the system, but it may offer mechanisms for remote monitoring, such as telemedicine-based support or linking the system to a blood pressure cuff, when clinically appropriate [ 64 , 65 ]. As noted, the system obviously cannot address issues related to systematic racism directly [ 66 ]. Instead, we used a participatory design approach, with the hope that the nature of the information presented may be more patient centered, acceptable, and better aligned with the beliefs and values of Black patients [ 67 ]. Issues related to systematic racism have commonly been described in the US health care system, but structural inequities also exist on a global scale. Future studies should investigate how our findings regarding design needs may extend to other minoritized perinatal patient groups.
A systematic review of patient decision aids for socially disadvantaged populations across clinical settings found that such tools can improve knowledge, enhance patient-clinician communication, and reduce decisional conflict [ 68 ]. However, descriptions of patient decision aids focus on the type of tool (eg, paper vs digital), how it was delivered, when it was delivered, and by whom, as opposed to describing the content the aid provides. Therefore, it is challenging to determine how other decision-support tools have addressed information regarding environmental, financial, or health system–level factors that may affect care seeking based on the decision aid. Some tools seem to address sociocultural needs by tailoring to the target population, but the aforementioned systematic review did not find differential effects on outcomes when tools were tailored versus not tailored [ 16 ]. Future studies on patient decision aids may benefit from including non-symptom related information. Providing appropriate informational support may involve a deeper study of the systemic needs that patients may have, even if these needs may not directly be addressed by the decision aid.
Third, descriptions of the design needs for PRD symptom monitoring revealed that there is likely not a one-size-fits-all solution related to reminders, involvement of health professionals, and how the tool is incorporated with other systems (eg, the patient portal). “User control and freedom” and “flexibility of use” are two of the key items in commonly used heuristics for user interface design [ 69 ]; therefore, it is important to include options for customization and varied but safe pathways for interaction with the proposed system. For example, some participants described that they may not be likely to access the symptom-reporting system through the patient portal. Although there may be safety and convenience-related reasons for having the system as part of the patients’ medical record, if the patient chooses, the system could, on the front end, appear more like a stand-alone app than something that must be accessed through the patient portal. Patients also had varying opinions related to how they may want to reach out to a health professional if a problematic symptom was reported. These preferences may differ from instance to instance; therefore, it is helpful to ensure that patients have a choice regarding how to reach out, but system designers must also create workflows with feedback loop, so that patients who are reporting problematic symptoms are not missed (ie, if patients do not reach out themselves, they never receive attention). Patient-level customizations and options for interaction also respects patients as individuals and may promote patient-centered interactions.
Furthermore, related to design needs, participants indicated that the wording of the decision-support messages was critical. Specifically, for reports that did not include currently urgent symptoms, it was important that the message still conveyed support and validation, clarified that the patient could still reach out for help, and provided additional means for managing their symptoms, so the patient did not feel frustrated by their report [ 70 ]. Regarding messages that recommended patients to reach out to their health professional team, it was crucial to note what the symptom meant (eg, what kind of disease it could indicate), encourage the patient to reach out without increasing anxiety, and provide different avenues for easy outreach. Going forward, we plan to incorporate the aforementioned elements into the messages built into the system. We will then complete additional acceptance and comprehension testing with a larger sample of postpartum patients. These findings also indicate that care must be taken in translating such tools, and the translated materials should be reviewed with the target end user groups before implementation. This may mitigate unintended consequences or inadvertent inclusion of language that does not support the needs of minoritized groups.
Strengths and Limitations
Our study highlighted the limitations and areas that would benefit from further exploration. First, our study involved recruitment sites that were within a single health system in New York City. Second, while we achieved thematic saturation of qualitative themes (a means for determining sample sufficiency in qualitative studies) [ 54 , 55 ], our conclusions are based on a sample of 36 participants from 3 stakeholder groups. Third, given the documented disparities, we deliberately focused on the needs of Black postpartum patients, but this may not represent the needs of the postpartum patients of other races. Furthermore, our sample should not be viewed as encompassing the opinions of all Black postpartum patients. Our findings revealed the need for individual customization and varied interaction patterns on a case-by-case basis. Fourth, all interviews were conducted remotely (via Zoom or telephone), which can have effects on the interaction. On the one hand, it may be harder to connect with the interviewee, and on the other hand, people may feel more anonymous and comfortable with sharing information. Finally, although we attempted to promote external validity through the review of the coding scheme by a subject matter expert, we did not have the opportunity to perform triangulation of the findings by returning the results to participants. To address these limitations, it would be beneficial to survey a larger group of postpartum patients, powered to assess the differences based on race and ethnicity. This would allow us to come to a stronger consensus regarding design choices, assess whether there are differences in design needs or preferences, and gain feedback from patients in areas outside New York City. Future studies may also explore how other underserved groups, such as those with limited English proficiency, may benefit from tailored symptom self-monitoring and decision support.
Conclusions
In this qualitative study regarding postpartum symptom monitoring and decision support, we found that the current structured reporting measures do not include the combination of somatic and psychological symptoms that may be indicative of severe outcomes in the postpartum period. While not explicitly related to symptom reporting and decision support, patient decision aids, particularly those focusing on minoritized groups, should consider how the aids may be coupled with other structural support interventions or, at least, information about how other resources may be accessed. As stated in the commonly accepted design heuristics, we also found that user control and freedom unsurprisingly remain important for a patient decision-support aid for Black postpartum patients. Finally, decision aid–related phrases must take care to convey urgency without inducing anxiety when action may be indicated and consider respect and empathy for the patients’ symptoms when action may not be indicated to ensure that they do not feel unheard and are empowered to report new or worsening symptoms.
Acknowledgments
This study was supported by the National Institute on Minority Health and Health Disparities (K99MD015781; principal investigator: NB).
Data Availability
The data sets generated and analyzed during this study are not publicly available due to institutional review board regulations but are available from the corresponding author on reasonable request.
Authors' Contributions
NB conceptualized the study and acquired funding under the advisement of RBK, LER, AH, RMC, and JSA. NB collected the data. NB, SW, and SNdR analyzed the data with input from all other authors. ECP completed the literature review and descriptive analysis of participants’ characteristics. NB drafted the paper and received substantial inputs from all other authors.
Conflicts of Interest
LER is an Up to Date contributor and an advisory board member for the New English Journal of Medicine, and Contemporary OB/GYN. She has also been a speaker for Medscape is an an expert reviewer for Pfizer on the RSV Vaccine. AH is an Up to Date contributor, a co-founder and medical consultant for Iris Ob Health, and a consultant for Progyny.
Semistructured interview guide questions for patients and health professionals.
- Howell EA, Egorova NN, Janevic T, Brodman M, Balbierz A, Zeitlin J, et al. Race and ethnicity, medical insurance, and within-hospital severe maternal morbidity disparities. Obstet Gynecol. Feb 2020;135(2):285-293. [ FREE Full text ] [ CrossRef ] [ Medline ]
- Wisner KL, Sit DK, McShea MC, Rizzo DM, Zoretich RA, Hughes CL, et al. Onset timing, thoughts of self-harm, and diagnoses in postpartum women with screen-positive depression findings. JAMA Psychiatry. May 01, 2013;70(5):490-498. [ FREE Full text ] [ CrossRef ] [ Medline ]
- Pregnancy-related deaths: data from maternal mortality review committees in 36 US States, 2017-2019. Centers for Disease Control and Prevention. URL: https://www.cdc.gov/reproductivehealth/maternal-mortality/erase-mm/data-mmrc.html [accessed 2022-11-20]
- Pregnancy mortality surveillance system. Centers for Disease Control and Prevention. 2020. URL: https://tinyurl.com/356dwufh [accessed 2024-03-23]
- Creanga AA, Syverson C, Seed K, Callaghan WM. Pregnancy-related mortality in the United States, 2011-2013. Obstet Gynecol. Aug 2017;130(2):366-373. [ FREE Full text ] [ CrossRef ] [ Medline ]
- Home page. World Health Organization. URL: https://www.who.int/ [accessed 2024-03-21]
- Troiano NH, Witcher PM. Maternal mortality and morbidity in the United States: classification, causes, preventability, and critical care obstetric implications. J Perinat Neonatal Nurs. 2018;32(3):222-231. [ CrossRef ] [ Medline ]
- Creanga AA, Berg CJ, Ko JY, Farr SL, Tong VT, Bruce FC, et al. Maternal mortality and morbidity in the United States: where are we now? J Womens Health (Larchmt). Jan 2014;23(1):3-9. [ FREE Full text ] [ CrossRef ] [ Medline ]
- Campbell-Grossman C, Brage Hudson D, Keating-Lefler R, Ofe Fleck M. Community leaders' perceptions of single, low-income mothers' needs and concerns for social support. J Community Health Nurs. Dec 2005;22(4):241-257. [ CrossRef ] [ Medline ]
- New York State maternal mortality review report on pregnancy-associated deaths in 2018. New York State Department of Health. 2018. URL: https://www.health.ny.gov/community/adults/women/docs/maternal_mortality_review_2018.pdf [accessed 2024-03-23]
- Suplee PD, Kleppel L, Santa-Donato A, Bingham D. Improving postpartum education about warning signs of maternal morbidity and mortality. Nurs Womens Health. Dec 2017;20(6):552-567. [ CrossRef ] [ Medline ]
- Howell EA, Bodnar-Deren S, Balbierz A, Parides M, Bickell N. An intervention to extend breastfeeding among black and Latina mothers after delivery. Am J Obstet Gynecol. Mar 2014;210(3):239.e1-239.e5. [ FREE Full text ] [ CrossRef ] [ Medline ]
- Hall WJ, Chapman MV, Lee KM, Merino YM, Thomas TW, Payne BK, et al. Implicit racial/ethnic bias among health care professionals and its influence on health care outcomes: a systematic review. Am J Public Health. Dec 2015;105(12):e60-e76. [ CrossRef ]
- Stepanikova I, Mollborn S, Cook KS, Thom DH, Kramer RM. Patients' race, ethnicity, language, and trust in a physician. J Health Soc Behav. Dec 24, 2006;47(4):390-405. [ CrossRef ] [ Medline ]
- Schwei RJ, Kadunc K, Nguyen AL, Jacobs EA. Impact of sociodemographic factors and previous interactions with the health care system on institutional trust in three racial/ethnic groups. Patient Educ Couns. Sep 2014;96(3):333-338. [ FREE Full text ] [ CrossRef ] [ Medline ]
- Blair IV, Steiner JF, Fairclough DL, Hanratty R, Price DW, Hirsh HK, et al. Clinicians' implicit ethnic/racial bias and perceptions of care among Black and Latino patients. Ann Fam Med. 2013;11(1):43-52. [ FREE Full text ] [ CrossRef ] [ Medline ]
- Ayanian JZ, Zaslavsky AM, Guadagnoli E, Fuchs CS, Yost KJ, Creech CM, et al. Patients' perceptions of quality of care for colorectal cancer by race, ethnicity, and language. J Clin Oncol. Sep 20, 2005;23(27):6576-6586. [ CrossRef ] [ Medline ]
- Reyna VF, Nelson WL, Han PK, Dieckmann NF. How numeracy influences risk comprehension and medical decision making. Psychol Bull. Nov 2009;135(6):943-973. [ FREE Full text ] [ CrossRef ] [ Medline ]
- Language use in the United States: 2011. United States Census Bureau. 2011. URL: https://www.census.gov/library/publications/2013/acs/acs-22.html [accessed 2024-03-23]
- Valdez RS, Brennan PF. Exploring patients' health information communication practices with social network members as a foundation for consumer health IT design. Int J Med Inform. May 2015;84(5):363-374. [ CrossRef ] [ Medline ]
- Valdez RS, Gibbons MC, Siegel ER, Kukafka R, Brennan PF. Designing consumer health IT to enhance usability among different racial and ethnic groups within the United States. Health Technol. Jul 13, 2012;2(4):225-233. [ CrossRef ]
- Valdez RS, Holden RJ. Health care human factors/ergonomics fieldwork in home and community settings. Ergon Des. Oct 2016;24(4):4-9. [ FREE Full text ] [ CrossRef ] [ Medline ]
- Valdez RS, Holden RJ, Novak LL, Veinot TC. Transforming consumer health informatics through a patient work framework: connecting patients to context. J Am Med Inform Assoc. Jan 2015;22(1):2-10. [ FREE Full text ] [ CrossRef ] [ Medline ]
- Bingham D, Suplee PD, Morris MH, McBride M. Healthcare strategies for reducing pregnancy-related morbidity and mortality in the postpartum period. J Perinat Neonatal Nurs. 2018;32(3):241-249. [ CrossRef ] [ Medline ]
- Creanga AA, Berg CJ, Syverson C, Seed K, Bruce FC, Callaghan WM. Pregnancy-related mortality in the United States, 2006-2010. Obstet Gynecol. Jan 2015;125(1):5-12. [ CrossRef ] [ Medline ]
- Suplee PD, Bingham D, Kleppel L. Nurses' knowledge and teaching of possible postpartum complications. MCN Am J Matern Child Nurs. 2017;42(6):338-344. [ CrossRef ] [ Medline ]
- O'Byrne LJ, Bodunde EO, Maher GM, Khashan AS, Greene RM, Browne JP, et al. Patient-reported outcome measures evaluating postpartum maternal health and well-being: a systematic review and evaluation of measurement properties. Am J Obstet Gynecol MFM. Nov 2022;4(6):100743. [ FREE Full text ] [ CrossRef ] [ Medline ]
- Adler A, Conte TF, Illarraza T. Improvement of Postpartum Nursing Discharge Education Through Adaptation of AWHONN’s Post-Birth Education Program. J Obstet Gynecol Neonatal Nurs. Jun 2019;48(3):S54. [ CrossRef ]
- Urgent maternal warning signs. Centers for Disease Control and Prevention. URL: https://www.cdc.gov/hearher/maternal-warning-signs/index.html [accessed 2022-12-11]
- Hannan J. APN telephone follow up to low-income first time mothers. J Clin Nurs. Jan 30, 2013;22(1-2):262-270. [ CrossRef ] [ Medline ]
- Dennis CL, Kingston D. A systematic review of telephone support for women during pregnancy and the early postpartum period. J Obstet Gynecol Neonatal Nurs. May 2008;37(3):301-314. [ CrossRef ] [ Medline ]
- Letourneau N, Secco L, Colpitts J, Aldous S, Stewart M, Dennis CL. Quasi-experimental evaluation of a telephone-based peer support intervention for maternal depression. J Adv Nurs. Jul 23, 2015;71(7):1587-1599. [ CrossRef ] [ Medline ]
- Shamshiri Milani H, Azargashb E, Beyraghi N, Defaie S, Asbaghi T. Effect of telephone-based support on postpartum depression: a randomized controlled trial. Int J Fertil Steril. 2015;9(2):247-253. [ FREE Full text ] [ CrossRef ] [ Medline ]
- Mobile fact sheet. Pew Research Center. URL: https://www.pewresearch.org/internet/fact-sheet/mobile/ [accessed 2023-02-22]
- Anderson M. Digital divide persists even as lower-income Americans make gains in tech adoption. Pew Research Center. URL: https://www.urbanismnext.org/resources/digital-divide-persists-even-as-lower-income-americans-make-gains-in-tech-adoption [accessed 2024-03-23]
- Drexler K, Cheu L, Donelan E, Kominiarek M. 415: Remote self-monitoring of perinatal weight and perinatal outcomes in low-risk women. Am J Obstet Gynecol. Jan 2020;222(1):S272-S273. [ CrossRef ]
- Marko KI, Ganju N, Krapf JM, Gaba ND, Brown JA, Benham JJ, et al. A mobile prenatal care app to reduce in-person visits: prospective controlled trial. JMIR Mhealth Uhealth. May 01, 2019;7(5):e10520. [ FREE Full text ] [ CrossRef ] [ Medline ]
- Vernon MM, Yang FM. Implementing a self-monitoring application during pregnancy and postpartum for rural and underserved women: a qualitative needs assessment study. PLoS One. Jul 19, 2022;17(7):e0270190. [ FREE Full text ] [ CrossRef ] [ Medline ]
- Berry DL, Blumenstein BA, Halpenny B, Wolpin S, Fann JR, Austin-Seymour M, et al. Enhancing patient-provider communication with the electronic self-report assessment for cancer: a randomized trial. J Clin Oncol. Mar 10, 2011;29(8):1029-1035. [ FREE Full text ] [ CrossRef ] [ Medline ]
- Lordon RJ, Mikles SP, Kneale L, Evans HL, Munson SA, Backonja U, et al. How patient-generated health data and patient-reported outcomes affect patient-clinician relationships: a systematic review. Health Informatics J. Dec 20, 2020;26(4):2689-2706. [ FREE Full text ] [ CrossRef ] [ Medline ]
- Todd BL, Feuerstein M, Gehrke A, Hydeman J, Beaupin L. Identifying the unmet needs of breast cancer patients post-primary treatment: the Cancer Survivor Profile (CSPro). J Cancer Surviv. Jun 29, 2015;9(2):137-160. [ CrossRef ] [ Medline ]
- Basch E, Deal AM, Dueck AC, Scher HI, Kris MG, Hudis C, et al. Overall survival results of a trial assessing patient-reported outcomes for symptom monitoring during routine cancer treatment. JAMA. Jul 11, 2017;318(2):197-198. [ FREE Full text ] [ CrossRef ] [ Medline ]
- Basch E, Deal AM, Kris MG, Scher HI, Hudis CA, Sabbatini P, et al. Symptom monitoring with patient-reported outcomes during routine cancer treatment: a randomized controlled trial. J Clin Oncol. Feb 20, 2016;34(6):557-565. [ FREE Full text ] [ CrossRef ] [ Medline ]
- Denis F, Basch E, Septans A, Bennouna J, Urban T, Dueck AC, et al. Two-year survival comparing web-based symptom monitoring vs routine surveillance following treatment for lung cancer. JAMA. Jan 22, 2019;321(3):306-307. [ FREE Full text ] [ CrossRef ] [ Medline ]
- Howell EA, Balbierz A, Wang J, Parides M, Zlotnick C, Leventhal H. Reducing postpartum depressive symptoms among black and Latina mothers: a randomized controlled trial. Obstet Gynecol. May 2012;119(5):942-949. [ FREE Full text ] [ CrossRef ] [ Medline ]
- Ngai FW, Chan SW, Ip WY. The effects of a childbirth psychoeducation program on learned resourcefulness, maternal role competence and perinatal depression: a quasi-experiment. Int J Nurs Stud. Oct 2009;46(10):1298-1306. [ CrossRef ] [ Medline ]
- Shorey S, Chan SW, Chong YS, He HG. A randomized controlled trial of the effectiveness of a postnatal psychoeducation programme on self-efficacy, social support and postnatal depression among primiparas. J Adv Nurs. Jun 15, 2015;71(6):1260-1273. [ CrossRef ] [ Medline ]
- Diefenbach MA, Leventhal H. The common-sense model of illness representation: theoretical and practical considerations. J Soc Distress Homeless. Jul 07, 2016;5(1):11-38. [ CrossRef ]
- Wickens CD. Multiple resources and mental workload. Hum Factors. Jun 2008;50(3):449-455. [ CrossRef ] [ Medline ]
- Gadamer HG. Philosophical Hermeneutics. Oakland, CA. University of California Press; 1976.
- Saldana J. The Coding Manual for Qualitative Researchers. Thousand Oaks, CA. Sage Publications; 2012.
- Huberman AM, Miles M, Saldana J. Qualitative Data Analysis: A Methods Sourcebook. Thousand Oaks, CA. Sage Publications; 2014.
- Pope C, Ziebland S, Mays N. Analysing qualitative data. In: Pope C, Mays N, editors. Qualitative Research in Health Care. Hoboken, NJ. John Wiley & Sons; 2006;63-81.
- Fusch PI, Ness LR. Are we there yet? Data saturation in qualitative research. Qual Rep. Sep 8, 2015;20(9):1408-1416. [ FREE Full text ] [ CrossRef ]
- Morse JM. The significance of saturation. Qual Health Res. Jul 01, 2016;5(2):147-149. [ CrossRef ]
- Sultan P, Sharawi N, Blake L, Ando K, Sultan E, Aghaeepour N, et al. Use of patient-reported outcome measures to assess outpatient postpartum recovery: a systematic review. JAMA Netw Open. May 03, 2021;4(5):e2111600. [ FREE Full text ] [ CrossRef ] [ Medline ]
- O'Carroll J, Ando K, Yun R, Panelli D, Nicklin A, Kennedy N, et al. A systematic review of patient-reported outcome measures used in maternal postpartum anxiety. Am J Obstet Gynecol MFM. Sep 2023;5(9):101076. [ CrossRef ] [ Medline ]
- Cox J. Thirty years with the Edinburgh postnatal depression scale: voices from the past and recommendations for the future. Br J Psychiatry. Mar 18, 2019;214(3):127-129. [ CrossRef ] [ Medline ]
- Novick AM, Kwitowski M, Dempsey J, Cooke DL, Dempsey AG. Technology-based approaches for supporting perinatal mental health. Curr Psychiatry Rep. Sep 23, 2022;24(9):419-429. [ FREE Full text ] [ CrossRef ] [ Medline ]
- Guy Jr GP, Adams EK, Redd SK, Dunlop AL. Effects of Georgia's Medicaid family planning waiver on pregnancy characteristics and birth outcomes. Womens Health Issues. Dec 15, 2023. [ CrossRef ] [ Medline ]
- Zimmermann K, Haen LS, Desloge A, Handler A. The role of a local health department in advancing health equity: universal postpartum home visiting in a large urban setting. Health Equity. Oct 01, 2023;7(1):703-712. [ FREE Full text ] [ CrossRef ] [ Medline ]
- Castillo AF, Davis AL, Krishnamurti T. Adapting a pregnancy app to address disparities in healthcare access among an emerging Latino community: qualitative study using implementation science frameworks. Research Square. Preprint posted online April 27, 2022. [ FREE Full text ] [ CrossRef ]
- Shneiderman B. The eyes have it: a task by data type taxonomy for information visualizations. In: Bederson BB, Shneiderman B, editors. The Craft of Information Visualization: Readings and Reflections. Burlington, MA. Morgan Kaufmann; 2003;364-371.
- White KM, Williamson C, Bergou N, Oetzmann C, de Angel V, Matcham F, et al. A systematic review of engagement reporting in remote measurement studies for health symptom tracking. NPJ Digit Med. Jun 29, 2022;5(1):82. [ FREE Full text ] [ CrossRef ] [ Medline ]
- Walsh S, Golden E, Priebe S. Systematic review of patients' participation in and experiences of technology-based monitoring of mental health symptoms in the community. BMJ Open. Jun 21, 2016;6(6):e008362. [ FREE Full text ] [ CrossRef ] [ Medline ]
- Davidson KW, Mangione CM, Barry MJ, Cabana MD, Caughey AB, Davis EM, et al. Actions to transform US preventive services task force methods to mitigate systemic racism in clinical preventive services. JAMA. Dec 21, 2021;326(23):2405-2411. [ CrossRef ] [ Medline ]
- Im EO, Chee W, Hu Y, Kim S, Choi H, Hamajima Y, et al. What to consider in a culturally tailored technology-based intervention? Comput Inform Nurs. Sep 2018;36(9):424-429. [ FREE Full text ] [ CrossRef ] [ Medline ]
- Yen RW, Smith J, Engel J, Muscat DM, Smith SK, Mancini J, et al. A systematic review and meta-analysis of patient decision aids for socially disadvantaged populations: update from the international patient decision aid standards (IDPAS). Med Decis Making. Jun 21, 2021;41(7):870-896. [ CrossRef ]
- Nielsen J. 10 usability heuristics for user interface design. Nielsen Norman Group. 1994. URL: https://www.nngroup.com/articles/ten-usability-heuristics/ [accessed 2020-11-15]
- Ancker JS, Stabile C, Carter J, Chen LY, Stein D, Stetson PD, et al. Informing, reassuring, or alarming? Balancing patient needs in the development of a postsurgical symptom reporting system in cancer. AMIA Annu Symp Proc. 2018;2018:166-174. [ FREE Full text ] [ Medline ]
Abbreviations
Edited by A Mavragani; submitted 22.03.23; peer-reviewed by C Laranjeira; comments to author 15.01.24; revised version received 20.02.24; accepted 08.03.24; published 26.04.24.
©Natalie Benda, Sydney Woode, Stephanie Niño de Rivera, Robin B Kalish, Laura E Riley, Alison Hermann, Ruth Masterson Creber, Eric Costa Pimentel, Jessica S Ancker. Originally published in the Journal of Medical Internet Research (https://www.jmir.org), 26.04.2024.
This is an open-access article distributed under the terms of the Creative Commons Attribution License (https://creativecommons.org/licenses/by/4.0/), which permits unrestricted use, distribution, and reproduction in any medium, provided the original work, first published in the Journal of Medical Internet Research, is properly cited. The complete bibliographic information, a link to the original publication on https://www.jmir.org/, as well as this copyright and license information must be included.
Create an account
Create a free IEA account to download our reports or subcribe to a paid service.
Trends in electric cars
- Executive summary
Electric car sales
Electric car availability and affordability.
- Electric two- and three-wheelers
- Electric light commercial vehicles
- Electric truck and bus sales
- Electric heavy-duty vehicle model availability
- Charging for electric light-duty vehicles
- Charging for electric heavy-duty vehicles
- Battery supply and demand
- Battery prices
- Electric vehicle company strategy and market competition
- Electric vehicle and battery start-ups
- Vehicle outlook by mode
- Vehicle outlook by region
- The industry outlook
- Light-duty vehicle charging
- Heavy-duty vehicle charging
- Battery demand
- Electricity demand
- Oil displacement
- Well-to-wheel greenhouse gas emissions
- Lifecycle impacts of electric cars
Cite report
IEA (2024), Global EV Outlook 2024 , IEA, Paris https://www.iea.org/reports/global-ev-outlook-2024, Licence: CC BY 4.0
Share this report
- Share on Twitter Twitter
- Share on Facebook Facebook
- Share on LinkedIn LinkedIn
- Share on Email Email
- Share on Print Print
Report options
Nearly one in five cars sold in 2023 was electric.
Electric car sales neared 14 million in 2023, 95% of which were in China, Europe and the United States
Almost 14 million new electric cars 1 were registered globally in 2023, bringing their total number on the roads to 40 million, closely tracking the sales forecast from the 2023 edition of the Global EV Outlook (GEVO-2023). Electric car sales in 2023 were 3.5 million higher than in 2022, a 35% year-on-year increase. This is more than six times higher than in 2018, just 5 years earlier. In 2023, there were over 250 000 new registrations per week, which is more than the annual total in 2013, ten years earlier. Electric cars accounted for around 18% of all cars sold in 2023, up from 14% in 2022 and only 2% 5 years earlier, in 2018. These trends indicate that growth remains robust as electric car markets mature. Battery electric cars accounted for 70% of the electric car stock in 2023.
Global electric car stock, 2013-2023
While sales of electric cars are increasing globally, they remain significantly concentrated in just a few major markets. In 2023, just under 60% of new electric car registrations were in the People’s Republic of China (hereafter ‘China’), just under 25% in Europe, 2 and 10% in the United States – corresponding to nearly 95% of global electric car sales combined. In these countries, electric cars account for a large share of local car markets: more than one in three new car registrations in China was electric in 2023, over one in five in Europe, and one in ten in the United States. However, sales remain limited elsewhere, even in countries with developed car markets such as Japan and India. As a result of sales concentration, the global electric car stock is also increasingly concentrated. Nevertheless, China, Europe and the United States also represent around two-thirds of total car sales and stocks, meaning that the EV transition in these markets has major repercussions in terms of global trends.
In China, the number of new electric car registrations reached 8.1 million in 2023, increasing by 35% relative to 2022. Increasing electric car sales were the main reason for growth in the overall car market, which contracted by 8% for conventional (internal combustion engine) cars but grew by 5% in total, indicating that electric car sales are continuing to perform as the market matures. The year 2023 was the first in which China’s New Energy Vehicle (NEV) 3 industry ran without support from national subsidies for EV purchases, which have facilitated expansion of the market for more than a decade. Tax exemption for EV purchases and non-financial support remain in place, after an extension , as the automotive industry is seen as one of the key drivers of economic growth. Some province-led support and investment also remains in place and plays an important role in China’s EV landscape. As the market matures, the industry is entering a phase marked by increased price competition and consolidation. In addition, China exported over 4 million cars in 2023, making it the largest auto exporter in the world, among which 1.2 million were EVs. This is markedly more than the previous year – car exports were almost 65% higher than in 2022, and electric car exports were 80% higher. The main export markets for these vehicles were Europe and countries in the Asia Pacific region, such as Thailand and Australia.
In the United States, new electric car registrations totalled 1.4 million in 2023, increasing by more than 40% compared to 2022. While relative annual growth in 2023 was slower than in the preceding two years, demand for electric cars and absolute growth remained strong. The revised qualifications for the Clean Vehicle Tax Credit, alongside electric car price cuts, meant that some popular EV models became eligible for credit in 2023. Sales of the Tesla Model Y, for example, increased 50% compared to 2022 after it became eligible for the full USD 7 500 tax credit. Overall, the new criteria established by the Inflation Reduction Act (IRA) appear to have supported sales in 2023, despite earlier concerns that tighter domestic content requirements for EV and battery manufacturing could create immediate bottlenecks or delays, such as for the Ford F-150 Lightning . As of 2024, new guidance for the tax credits means the number of eligible models has fallen to less than 30 from about 45, 4 including several trim levels of the Tesla Model 3 becoming ineligible. However, in 2023 and 2024, leasing business models enable electric cars to qualify for the tax credits even if they do not fully meet the requirements, as leased cars can qualify for a less strict commercial vehicle tax credit and these tax credit savings can be passed to lease-holders. Such strategies have also contributed to sustained electric car roll-out.
In Europe, new electric car registrations reached nearly 3.2 million in 2023, increasing by almost 20% relative to 2022. In the European Union, sales amounted to 2.4 million, with similar growth rates. As in China, the high rates of electric car sales seen in Europe suggest that growth remains robust as markets mature, and several European countries reached important milestones in 2023. Germany, for example, became the third country after China and the United States to record half a million new battery electric car registrations in a single year, with 18% of car sales being battery electric (and another 6% plug-in hybrid).
However, the phase-out of several purchase subsidies in Germany slowed overall EV sales growth. At the start of 2023, PHEV subsidies were phased out, resulting in lower PHEV sales compared to 2022, and in December 2023, all EV subsidies ended after a ruling on the Climate and Transformation Fund. In Germany, the sales share for electric cars fell from 30% in 2022 to 25% in 2023. This had an impact on the overall electric car sales share in the region. In the rest of Europe, however, electric car sales and their sales share increased. Around 25% of all cars sold in France and the United Kingdom were electric, 30% in the Netherlands, and 60% in Sweden. In Norway, sales shares increased slightly despite the overall market contracting, and its sales share remains the highest in Europe, at almost 95%.
Electric car registrations and sales share in China, United States and Europe, 2018-2023
Sales in emerging markets are increasing, albeit from a low base, led by southeast asia and brazil.
Electric car sales continued to increase in emerging market and developing economies (EMDEs) outside China in 2023, but they remained low overall. In many cases, personal cars are not the most common means of passenger transport, especially compared with shared vans and minibuses, or two- and three-wheelers (2/3Ws), which are more prevalent and more often electrified, given their relative accessibility and affordability. The electrification of 2/3Ws and public or shared mobility will be key to achieve emissions reductions in such cases (see later sections in this report). While switching from internal combustion engine (ICE) to electric cars is important, the effect on overall emissions differs depending on the mode of transport that is displaced. Replacing 2/3Ws, public and shared mobility or more active forms of transport with personal cars may not be desirable in all cases.
In India, electric car registrations were up 70% year-on-year to 80 000, compared to a growth rate of under 10% for total car sales. Around 2% of all cars sold were electric. Purchase incentives under the Faster Adoption and Manufacturing of Electric Vehicles (FAME II) scheme, supply-side incentives under the Production Linked Incentive (PLI) scheme, tax benefits and the Go Electric campaign have all contributed to fostering demand in recent years. A number of new models also became popular in 2023, such as Mahindra’s XUV400, MG’s Comet, Citroën’s e-C3, BYD’s Yuan Plus, and Hyundai’s Ioniq 5, driving up growth compared to 2022. However, if the forthcoming FAME III scheme includes a subsidy reduction, as has been speculated in line with lower subsidy levels in the 2024 budget, future growth could be affected. Local carmakers have thus far maintained a strong foothold in the market, supported by advantageous import tariffs , and account for 80% of electric car sales in cumulative terms since 2010, led by Tata (70%) and Mahindra (10%).
In Thailand, electric car registrations more than quadrupled year-on-year to nearly 90 000, reaching a notable 10% sales share – comparable to the share in the United States. This is all the more impressive given that overall car sales in the country decreased from 2022 to 2023. New subsidies, including for domestic battery manufacturing, and lower import and excise taxes, combined with the growing presence of Chinese carmakers , have contributed to rapidly increasing sales. Chinese companies account for over half the sales to date, and they could become even more prominent given that BYD plans to start operating EV production facilities in Thailand in 2024, with an annual production capacity of 150 000 vehicles for an investment of just under USD 500 million . Thailand aims to become a major EV manufacturing hub for domestic and export markets, and is aiming to attract USD 28 billion in foreign investment within 4 years, backed by specific incentives to foster investment.
In Viet Nam, after an exceptional 2022 for the overall car market, car sales contracted by 25% in 2023, but electric car sales still recorded unprecedented growth: from under 100 in 2021, to 7 000 in 2022, and over 30 000 in 2023, reaching a 15% sales share. Domestic front-runner VinFast, established in 2017, accounted for nearly all domestic sales. VinFast also started selling electric sports utility vehicles (SUVs) in North America in 2023, as well as developing manufacturing facilities in order to unlock domestic content-linked subsidies under the US IRA. VinFast is investing around USD 2 billion and targets an annual production of 150 000 vehicles in the United States by 2025. The company went public in 2023, far exceeding expectations with a debut market valuation of around USD 85 billion, well beyond General Motors (GM) (USD 46 billion), Ford (USD 48 billion) or BMW (USD 68 billion), before it settled back down around USD 20 billion by the end of the year. VinFast also looks to enter regional markets, such as India and the Philippines .
In Malaysia, electric car registrations more than tripled to 10 000, supported by tax breaks and import duty exemptions, as well as an acceleration in charging infrastructure roll-out. In 2023, Mercedes-Benz marketed the first domestically assembled EV, and both BYD and Tesla also entered the market.
In Latin America, electric car sales reached almost 90 000 in 2023, with markets in Brazil, Colombia, Costa Rica and Mexico leading the region. In Brazil, electric car registrations nearly tripled year-on-year to more than 50 000, a market share of 3%. Growth in Brazil was underpinned by the entry of Chinese carmakers, such as BYD with its Song and Dolphin models, Great Wall with its H6, and Chery with its Tiggo 8, which immediately ranked among the best-selling models in 2023. Road transport electrification in Brazil could bring significant climate benefits given the largely low-emissions power mix, as well as reducing local air pollution. However, EV adoption has been slow thus far, given the national prioritisation of ethanol-based fuels since the late 1970s as a strategy to maintain energy security in the face of oil shocks. Today, biofuels are important alternative fuels available at competitive cost and aligned with the existing refuelling infrastructure. Brazil remains the world’s largest producer of sugar cane, and its agribusiness represents about one-fourth of GDP. At the end of 2023, Brazil launched the Green Mobility and Innovation Programme , which provides tax incentives for companies to develop and manufacture low-emissions road transport technology, aggregating to more than BRA 19 billion (Brazilian reals) (USD 3.8 billion) over the 2024-2028 period. Several major carmakers already in Brazil are developing hybrid ethanol-electric models as a result. China’s BYD and Great Wall are also planning to start domestic manufacturing, counting on local battery metal deposits, and plan to sell both fully electric and hybrid ethanol-electric models. BYD is investing over USD 600 million in its electric car plant in Brazil – its first outside Asia – for an annual capacity of 150 000 vehicles. BYD also partnered with Raízen to develop charging infrastructure in eight Brazilian cities starting in 2024. GM, on the other hand, plans to stop producing ICE (including ethanol) models and go fully electric, notably to produce for export markets. In 2024, Hyundai announced investments of USD 1.1 billion to 2032 to start local manufacturing of electric, hybrid and hydrogen cars.
In Mexico, electric car registrations were up 80% year-on-year to 15 000, a market share just above 1%. Given its proximity to the United States, Mexico’s automotive market is already well integrated with North American partners, and benefits from advantageous trade agreements, large existing manufacturing capacity, and eligibility for subsidies under the IRA. As a result, local EV supply chains are developing quickly, with expectations that this will spill over into domestic markets. Tesla, Ford, Stellantis, BMW, GM, Volkswagen (VW) and Audi have all either started manufacturing or announced plans to manufacture EVs in Mexico. Chinese carmakers such as BYD, Chery and SAIC are also considering expanding to Mexico. Elsewhere in the region, Colombia and Costa Rica are seeing increasing electric car sales, with around 6 000 and 5 000 in 2023, respectively, but sales remain limited in other Central and South American countries.
Throughout Africa, Eurasia and the Middle East, electric cars are still rare, accounting for less than 1% of total car sales. However, as Chinese carmakers look for opportunities abroad, new models – including those produced domestically – could boost EV sales. For example, in Uzbekistan , BYD set up a joint venture with UzAuto Motors in 2023 to produce 50 000 electric cars annually, and Chery International established a partnership with ADM Jizzakh. This partnership has already led to a steep increase in electric car sales in Uzbekistan, reaching around 10 000 in 2023. In the Middle East, Jordan boasts the highest electric car sales share, at more than 45%, supported by much lower import duties relative to ICE cars, followed by the United Arab Emirates, with 13%.
Strong electric car sales in the first quarter of 2024 surpass the annual total from just four years ago
Electric car sales remained strong in the first quarter of 2024, surpassing those of the same period in 2023 by around 25% to reach more than 3 million. This growth rate was similar to the increase observed for the same period in 2023 compared to 2022. The majority of the additional sales came from China, which sold about half a million more electric cars than over the same period in 2023. In relative terms, the most substantial growth was observed outside of the major EV markets, where sales increased by over 50%, suggesting that the transition to electromobility is picking up in an increasing number of countries worldwide.
Quarterly electric car sales by region, 2021-2024
From January to March of this year, nearly 1.9 million electric cars were sold in China, marking an almost 35% increase compared to sales in the first quarter of 2023. In March, NEV sales in China surpassed a share of 40% in overall car sales for the first time, according to retail sales reported by the China Passenger Car Association. As witnessed in 2023, sales of plug-in hybrid electric cars are growing faster than sales of pure battery electric cars. Plug-in hybrid electric car sales in the first quarter increased by around 75% year-on-year in China, compared to just 15% for battery electric car sales, though the former started from a lower base.
In Europe, the first quarter of 2024 saw year-on-year growth of over 5%, slightly above the growth in overall car sales and thereby stabilising the EV sales share at a similar level as last year. Electric car sales growth was particularly high in Belgium, where around 60 000 electric cars were sold, almost 35% more than the year before. However, Belgium represents less than 5% of total European car sales. In the major European markets – France, Germany, Italy and the United Kingdom (together representing about 60% of European car sales) – growth in electric car sales was lower. In France, overall EV sales in the first quarter grew by about 15%, with BEV sales growth being higher than for PHEVs. While this is less than half the rate as over the same period last year, total sales were nonetheless higher and led to a slight increase in the share of EVs in total car sales. The United Kingdom saw similar year-on-year growth (over 15%) in EV sales as France, about the same rate as over the same period last year. In Germany, where battery electric car subsidies ended in 2023, sales of electric cars fell by almost 5% in the first quarter of 2024, mainly as a result of a 20% year-on-year decrease in March. The share of EVs in total car sales was therefore slightly lower than last year. As in China, PHEV sales in both Germany and the United Kingdom were stronger than BEV sales. In Italy, sales of electric cars in the first three months of 2024 were more than 20% lower than over the same period in 2023, with the majority of the decrease taking place in the PHEV segment. However, this trend could be reversed based on the introduction of a new incentive scheme , and if Chinese automaker Chery succeeds in appealing to Italian consumers when it enters the market later this year.
In the United States, first-quarter sales reached around 350 000, almost 15% higher than over the same period the year before. As in other major markets, the sales growth of PHEVs was even higher, at 50%. While the BEV sales share in the United States appears to have fallen somewhat over the past few months, the sales share of PHEVs has grown.
In smaller EV markets, sales growth in the first months of 2024 was much higher, albeit from a low base. In January and February, electric car sales almost quadrupled in Brazil and increased more than sevenfold in Viet Nam. In India, sales increased more than 50% in the first quarter of 2024. These figures suggest that EVs are gaining momentum across diverse markets worldwide.
Since 2021, first-quarter electric car sales have typically accounted for 15-20% of the total global annual sales. Based on this observed trend, coupled with policy momentum and the seasonality that EV sales typically experience, we estimate that electric car sales could reach around 17 million in 2024. This indicates robust growth for a maturing market, with 2024 sales to surpass those of 2023 by more than 20% and EVs to reach a share in total car sales of more than one-fifth.
Electric car sales, 2012-2024
The majority of the additional 3 million electric car sales projected for 2024 relative to 2023 are from China. Despite the phase-out of NEV purchase subsidies last year, sales in China have remained robust, indicating that the market is maturing. With strong competition and relatively low-cost electric cars, sales are to grow by almost 25% in 2024 compared to last year, reaching around 10 million. If confirmed, this figure will come close to the total global electric car sales in 2022. As a result, electric car sales could represent around 45% of total car sales in China over 2024.
In 2024, electric car sales in the United States are projected to rise by 20% compared to the previous year, translating to almost half a million more sales, relative to 2023. Despite reporting of a rocky end to 2023 for electric cars in the United States, sales shares are projected to remain robust in 2024. Over the entire year, around one in nine cars sold are expected to be electric.
Based on recent trends, and considering that tightening CO 2 targets are due to come in only in 2025, the growth in electric car sales in Europe is expected to be the lowest of the three largest markets. Sales are projected to reach around 3.5 million units in 2024, reflecting modest growth of less than 10% compared to the previous year. In the context of a generally weak outlook for passenger car sales, electric cars would still represent about one in four cars sold in Europe.
Outside of the major EV markets, electric car sales are anticipated to reach the milestone of over 1 million units in 2024, marking a significant increase of over 40% compared to 2023. Recent trends showing the success of both homegrown and Chinese electric carmakers in Southeast Asia underscore that the region is set to make a strong contribution to the sales of emerging EV markets (see the section on Trends in the electric vehicle industry). Despite some uncertainty surrounding whether India’s forthcoming FAME III scheme will include subsidies for electric cars, we expect sales in India to remain robust, and to experience around 50% growth compared to 2023. Across all regions outside the three major EV markets, electric car sales are expected to represent around 5% of total car sales in 2024, which – considering the high growth rates seen in recent years – could indicate that a tipping point towards global mass adoption is getting closer.
There are of course downside risks to the 2024 outlook for electric car sales. Factors such as high interest rates and economic uncertainty could potentially reduce the growth of global electric car sales in 2024. Other challenges may come from the IRA restrictions on US electric car tax incentives, and the tightening of technical requirements for EVs to qualify for the purchase tax exemption in China. However, there are also upside potentials to consider. New markets may open up more rapidly than anticipated, as automakers expand their EV operations and new entrants compete for market share. This could lead to accelerated growth in electric car sales globally, surpassing the initial estimations.
More electric models are becoming available, but the trend is towards larger ones
The number of available electric car models nears 600, two-thirds of which are large vehicles and SUVs
In 2023, the number of available models for electric cars increased 15% year-on-year to nearly 590, as carmakers scaled up electrification plans, seeking to appeal to a growing consumer base. Meanwhile, the number of fully ICE models (i.e. excluding hybrids) declined for the fourth consecutive year, at an average of 2%. Based on recent original equipment manufacturer (OEM) announcements, the number of new electric car models could reach 1 000 by 2028. If all announced new electric models actually reach the market, and if the number of available ICE car models continues to decline by 2% annually, there could be as many electric as ICE car models before 2030.
As reported in GEVO-2023, the share of small and medium electric car models is decreasing among available electric models: in 2023, two-thirds of the battery-electric models on the market were SUVs, 5 pick-up trucks or large cars. Just 25% of battery electric car sales in the United States were for small and medium models, compared to 40% in Europe and 50% in China. Electric cars are following the same trend as conventional cars, and getting bigger on average. In 2023, SUVs, pick-up trucks and large models accounted for 65% of total ICE car sales worldwide, and more than 80% in the United States, 60% in China and 50% in Europe.
Several factors underpin the increase in the share of large models. Since the 2010s, conventional SUVs in the United States have benefited from less stringent tailpipe emissions rules than smaller models, creating an incentive for carmakers to market more vehicles in that segment. Similarly, in the European Union, CO 2 targets for passenger cars have included a compromise on weight, allowing CO 2 leeway for heavier vehicles in some cases. Larger vehicles also mean larger margins for carmakers. Given that incumbent carmakers are not yet making a profit on their EV offer in many cases, focusing on larger models enables them to increase their margins. Under the US IRA, electric SUVs can qualify for tax credits as long as they are priced under USD 80 000, whereas the limit stands at USD 55 000 for a sedan, creating an incentive to market SUVs if a greater margin can be gathered. On the demand side, there is now strong willingness to pay for SUVs or large models. Consumers are typically interested in longer-range and larger cars for their primary vehicles, even though small models are more suited to urban use. Higher marketing spend on SUVs compared to smaller models can also have an impact on consumer choices.
The progressive shift towards ICE SUVs has been dramatically limiting fuel savings. Over the 2010-2022 period, without the shift to SUVs, energy use per kilometre could have fallen at an average annual rate 30% higher than the actual rate. Switching to electric in the SUV and larger car segments can therefore achieve immediate and significant CO 2 emissions reductions, and electrification also brings considerable benefits in terms of reducing air pollution and non-tailpipe emissions, especially in urban settings. In 2023, if all ICE and HEV sales of SUVs had instead been BEV, around 770 Mt CO 2 could have been avoided globally over the cars’ lifetimes (see section 10 on lifecycle analysis). This is equivalent to the total road emissions of China in 2023.
Breakdown of battery electric car sales in selected countries and regions by segment, 2018-2023
Nevertheless, from a policy perspective, it is critical to mitigate the negative spillovers associated with an increase in larger electric cars in the fleet.
Larger electric car models have a significant impact on battery supply chains and critical mineral demand. In 2023, the sales-weighted average battery electric SUV in Europe had a battery almost twice as large as the one in the average small electric car, with a proportionate impact on critical mineral needs. Of course, the range of small cars is typically shorter than SUVs and large cars (see later section on ranges). However, when comparing electric SUVs and medium-sized electric cars, which in 2023 offered a similar range, the SUV battery was still 25% larger. This means that if all electric SUVs sold in 2023 had instead been medium-sized cars, around 60 GWh of battery equivalent could have been avoided globally, with limited impact on range. Accounting for the different chemistries used in China, Europe, and the United States, this would be equivalent to almost 6 000 tonnes of lithium, 30 000 tonnes of nickel, almost 7 000 tonnes of cobalt, and over 8 000 tonnes of manganese.
Larger batteries also require more power, or longer charging times. This can put pressure on electricity grids and charging infrastructure by increasing occupancy, which could create issues during peak utilisation, such as at highway charging points at high traffic times.
In addition, larger vehicles also require greater quantities of materials such as iron and steel, aluminium and plastics, with a higher environmental and carbon footprint for materials production, processing and assembly. Because they are heavier, larger models also have higher electricity consumption. The additional energy consumption resulting from the increased mass is mitigated by regenerative braking to some extent, but in 2022, the sales-weighted average electricity consumption of electric SUVs was 20% higher than that of other electric cars. 6
Major carmakers have announced launches of smaller and more affordable electric car models over the past few years. However, when all launch announcements are considered, far fewer smaller models are expected than SUVs, large models and pick-up trucks. Only 25% of the 400+ launches expected over the 2024-2028 period are small and medium models, which represents a smaller share of available models than in 2023. Even in China, where small and medium models have been popular, new launches are typically for larger cars.
Number of available car models in 2023 and expected new ones by powertrain, country or region and segment, 2024-2028
Several governments have responded by introducing policies to create incentives for smaller and lighter passenger cars. In Norway, for example, all cars are subject to a purchase tax based on weight, CO 2 and nitrogen oxides (NO x ) emissions, though electric cars were exempt from the weight-based tax prior to 2023. Any imported cars weighing more than 500 kg must also pay an entry fee for each additional kg. In France, a progressive weight-based tax applies to ICE and PHEV cars weighing above 1 600 kg, with a significant impact on price: weight tax for a Land Rover Defender 130 (2 550 kg) adds up to more than EUR 21 500, versus zero for a Renault Clio (1 100 kg). Battery electric cars have been exempted to date. In February 2024, a referendum held in Paris resulted in a tripling of city parking fees for visiting SUVs, applicable to ICE, hybrid and plug-in hybrid cars above 1 600 kg and battery electric ones above 2 000 kg, in an effort to limit the use of large and/or polluting vehicles. Other examples exist in Estonia, Finland, Switzerland and the Netherlands. A number of policy options may be used, such as caps and fleet averages for vehicle footprint, weight, and/or battery size; access to finance for smaller vehicles; and sustained support for public charging, enabling wider use of shorter-range cars.
Average range is increasing, but only moderately
Concerns about range compared to ICE vehicles, and about the availability of charging infrastructure for long-distance journeys, also contribute to increasing appetite for larger models with longer range.
With increasing battery size and improvements in battery technology and vehicle design, the sales-weighted average range of battery electric cars grew by nearly 75% between 2015 and 2023, although trends vary by segment. The average range of small cars in 2023 – around 150 km – is not much higher than it was in 2015, indicating that this range is already well suited for urban use (with the exception of taxis, which have much higher daily usage). Large, higher-end models already offered higher ranges than average in 2015, and their range has stagnated through 2023, averaging around 360-380 km. Meanwhile, significant improvements have been made for medium-sized cars and SUVs, the range of which now stands around 380 km, whereas it averaged around 150 km for medium cars and 270 km for SUVs in 2015. This is encouraging for consumers looking to purchase an electric car for longer journeys rather than urban use.
Since 2020, growth in the average range of vehicles has been slower than over the 2015-2020 period. This could result from a number of factors, including fluctuating battery prices, carmakers’ attempts to limit additional costs as competition intensifies, and technical constraints (e.g. energy density, battery size). It could also reflect that beyond a certain range at which most driving needs are met, consumers’ willingness to pay for a marginal increase in battery size and range is limited. Looking forward, however, the average range could start increasing again as novel battery technologies mature and prices fall.
More affordable electric cars are needed to reach a mass-market tipping point
An equitable and inclusive transition to electric mobility, both within countries and at the global level, hinges on the successful launch of affordable EVs (including but not limited to electric cars). In this section, we use historic sales and price data for electric and ICE models around the world to examine the total cost of owning an electric car, price trends over time, and the remaining electric premium, by country and vehicle size. 7 Specific models are used for illustration.
Total cost of ownership
Car purchase decisions typically involve consideration of retail price and available subsidies as well as lifetime operating costs, such as fuel costs, insurance, maintenance and depreciation, which together make up the total cost of ownership (TCO). Reaching TCO parity between electric and ICE cars creates important financial incentives to make the switch. This section examines the different components of the TCO, by region and car size.
In 2023, upfront retail prices for electric cars were generally higher than for their ICE equivalents, which increased their TCO in relative terms. On the upside, higher fuel efficiency and lower maintenance costs enable fuel cost savings for electric cars, lowering their TCO. This is especially true in periods when fuel prices are high, in places where electricity prices are not too closely correlated to fossil fuel prices. Depreciation is also a major factor in determining TCO: As a car ages, it loses value, and depreciation for electric cars tends to be faster than for ICE equivalents, further increasing their TCO. Accelerated depreciation could, however, prove beneficial for the development of second-hand markets.
However, the trend towards faster depreciation for electric vehicles might be reversed for multiple reasons. Firstly, consumers are gaining more confidence in electric battery lifetimes, thereby increasing the resale value of EVs. Secondly, strong demand and the positive brand image of some BEV models can mean they hold their value longer, as shown by Tesla models depreciating more slowly than the average petrol car in the United States. Finally, increasing fuel prices in some regions, the roll-out of low-emissions zones that restrict access for the most polluting vehicles, and taxes and parking fees specifically targeted at ICE vehicles could mean they experience faster depreciation rates than EVs in the future. In light of these two possible opposing depreciation trends, the same fixed annual depreciation rate for both BEVs and ICE vehicles has been applied in the following cost of ownership analysis.
Subsidies help lower the TCO of electric cars relative to ICE equivalents in multiple ways. A purchase subsidy lowers the original retail price, thereby lowering capital depreciation over time, and a lower retail price implies lower financing costs through cumulative interest. Subsidies can significantly reduce the number of years required to reach TCO parity between electric and ICE equivalents. As of 2022, we estimate that TCO parity could be reached in most cases in under 7 years in the three major EV markets, with significant variations across different car sizes. In comparison, for models purchased at 2018 prices, TCO parity was much harder to achieve.
In Germany, for example, we estimate that the sales-weighted average price of a medium-sized battery electric car in 2022 was 10-20% more expensive than its ICE equivalent, but 10-20% cheaper in cumulative costs of ownership after 5 years, thanks to fuel and maintenance costs savings. In the case of an electric SUV, we estimate that the average annual operating cost savings would amount to USD 1 800 when compared to the equivalent conventional SUV over a period of 10 years. In the United States, despite lower fuel prices with respect to electricity, the higher average annual mileage results in savings that are close to Germany at USD 1 600 per year. In China, lower annual distance driven reduces fuel cost savings potential, but the very low price of electricity enables savings of about USD 1 000 per year.
In EMDEs, some electric cars can also be cheaper than ICE equivalents over their lifetime. This is true in India , for example, although it depends on the financing instrument. Access to finance is typically much more challenging in EMDEs due to higher interest rates and the more limited availability of cheap capital. Passenger cars have also a significantly lower market penetration in the first place, and many car purchases are made in second-hand markets. Later sections of this report look at markets for used electric cars, as well as the TCO for electric and conventional 2/3Ws in EMDEs, where they are far more widespread than cars as a means of road transport.
Upfront retail price parity
Achieving price parity between electric and ICE cars will be an important tipping point. Even when the TCO for electric cars is advantageous, the upfront retail price plays a decisive role, and mass-market consumers are typically more sensitive to price premiums than wealthier buyers. This holds true not only in emerging and developing economies, which have comparatively high costs of capital and comparatively low household and business incomes, but also in advanced economies. In the United States, for example, surveys suggest affordability was the top concern for consumers considering EV adoption in 2023. Other estimates show that even among SUV and pick-up truck consumers, only 50% would be willing to purchase one above USD 50 000.
In this section, we examine historic price trends for electric and ICE cars over the 2018-2022 period, by country and car size, and for best-selling models in 2023.
Electric cars are generally getting cheaper as battery prices drop, competition intensifies, and carmakers achieve economies of scale. In most cases, however, they remain on average more expensive than ICE equivalents. In some cases, after adjusting for inflation, their price stagnated or even moderately increased between 2018 and 2022.
Larger batteries for longer ranges increase car prices, and so too do the additional options, equipment, digital technology and luxury features that are often marketed on top of the base model. A disproportionate focus on larger, premium models is pushing up the average price, which – added to the lack of available models in second-hand markets (see below) – limits potential to reach mass-market consumers. Importantly, geopolitical tension, trade and supply chain disruptions, increasing battery prices in 2022 relative to 2021, and rising inflation, have also significantly affected the potential for further cost declines.
Competition can also play an important role in bringing down electric car prices. Intensifying competition leads carmakers to cut prices to the minimum profit margin they can sustain, and – if needed – to do so more quickly than battery and production costs decline. For example, between mid-2022 and early-2024, Tesla cut the price of its Model Y from between USD 65 000 and USD 70 000 to between USD 45 000 and USD 55 000 in the United States. Battery prices for such a model dropped by only USD 3 000 over the same period in the United States, suggesting that a profit margin may still be made at a lower price. Similarly, in China, the price of the Base Model Y dropped from CNY 320 000 (Yuan renminbi) (USD 47 000) to CNY 250 000 (USD 38 000), while the corresponding battery price fell by only USD 1 000. Conversely, in cases where electric models remain niche or aimed at wealthier, less price-sensitive early adopters, their price may not fall as quickly as battery prices, if carmakers can sustain greater margins.
Price gap between the sales-weighted average price of conventional and electric cars in selected countries, before subsidy, by size, in 2018 and 2022
In China, where the sales share of electric cars has been high for several years, the sales-weighted average price of electric cars (before purchase subsidy) is already lower than that of ICE cars. This is true not only when looking at total sales, but also at the small cars segment, and is close for SUVs. After accounting for the EV exemption from the 10% vehicle purchase tax, electric SUVs were already on par with conventional ones in 2022, on average.
Electric car prices have dropped significantly since 2018. We estimate that around 55% of the electric cars sold in China in 2022 were cheaper than their average ICE equivalent, up from under 10% in 2018. Given the further price declines between 2022 and 2023, we estimate that this share increased to around 65% in 2023. These encouraging trends suggest that price parity between electric and ICE cars could also be reached in other countries in certain segments by 2030, if the sales share of electric cars continues to grow, and if supporting infrastructure – such as for charging – is sustained.
As reported in detail in GEVO-2023 , China remains a global exception in terms of available inexpensive electric models. Local carmakers already market nearly 50 small, affordable electric car models, many of which are priced under CNY 100 000 (USD 15 000). This is in the same range as best-selling small ICE cars in 2023, which cost from CNY 70 000 to CNY 100 000. In 2022, the best-selling electric car was SAIC’s small Wuling Hongguang Mini EV, which accounted for 10% of all BEV sales. It was priced around CNY 40 000, weighing under 700 kg for a 170-km range. In 2023, however, it was overtaken by Tesla models, among other larger models, as new consumers seek longer ranges and higher-end options and digital equipment.
United States
In the United States, the sales-weighted average price of electric cars decreased over the 2018-2022 period, primarily driven by a considerable drop in the price of Tesla cars, which account for a significant share of sales. The sales-weighted average retail price of electric SUVs fell slightly more quickly than the average SUV battery costs over the same period. The average price of small and medium models also decreased, albeit to a smaller extent.
Across all segments, electric models remained more expensive than conventional equivalents in 2022. However, the gap has since begun to close, as market size increases and competition leads carmakers to cut prices. For example, in 2023-2024, Tesla’s Model 3 could be found in the USD 39 000 to USD 42 000 range, which is comparable to the average price for new ICE cars, and a new Model Y priced under USD 50 000 was launched. Rivian is expecting to launch its R2 SUV in 2026 at USD 45 000, which is much less than previous vehicles. Average price parity between electric and conventional SUVs could be reached by 2030, but it may only be reached later for small and medium cars, given their lower availability and popularity.
Smaller, cheaper electric models have further to go to reach price parity in the United States. We estimate that in 2022, only about 5% of the electric cars sold in the United States were cheaper than their average ICE equivalent. In 2023, the cheapest electric cars were priced around USD 30 000 (e.g. Chevrolet Bolt, Nissan Leaf, Mini Cooper SE). To compare, best-selling small ICE options cost under USD 20 000 (e.g. Kia Rio, Mitsubishi Mirage), and many best-selling medium ICE options between USD 20 000 and USD 25 000 (e.g. Honda Civic, Toyota Corolla, Kia Forte, Hyundai Avante, Nissan Sentra).
Around 25 new all-electric car models are expected in 2024, but only 5 of them are expected below USD 50 000, and none under the USD 30 000 mark. Considering all the electric models expected to be available in 2024, about 75% are priced above USD 50 000, and fewer than 10 under USD 40 000, even after taking into account the USD 7 500 tax credit under the IRA for eligible cars as of February 2024. This means that despite the tax credit, few electric car models directly compete with small mass-market ICE models.
In December 2023, GM stopped production of its best-selling electric car, the Bolt, announcing it would introduce a new version in 2025. The Nissan Leaf (40 kWh) therefore remains the cheapest available electric car in 2024, at just under USD 30 000, but is not yet eligible for IRA tax credits. Ford announced in 2024 that it would move away from large and expensive electric cars as a way to convince more consumers to switch to electric, at the same time as increasing output of ICE models to help finance a transition to electric mobility. In 2024, Tesla announced it would start producing a next-generation, compact and affordable electric car in June 2025, but the company had already announced in 2020 that it would deliver a USD 25 000 model within 3 years. Some micro urban electric cars are already available between USD 5 000 and USD 20 000 (e.g. Arcimoto FUV, Nimbus One), but they are rare. In theory, such models could cover many use cases, since 80% of car journeys in the United States are under 10 miles .
Pricing trends differ across European countries, and typically vary by segment.
In Norway, after taking into account the EV sales tax exemption, electric cars are already cheaper than ICE equivalents across all segments. In 2022, we estimate that the electric premium stood around -15%, and even -30% for medium-sized cars. Five years earlier, in 2018, the overall electric premium was less advantageous, at around -5%. The progressive reintroduction of sales taxes on electric cars may change these estimates for 2023 onwards.
Germany’s electric premium ranks among the lowest in the European Union. Although the sales-weighted average electric premium increased slightly between 2018 and 2022, it stood at 15% in 2022. It is particularly low for medium-sized cars (10-15%) and SUVs (20%), but remains higher than 50% for small models. In the case of medium cars, the sales-weighted average electric premium was as low as EUR 5 000 in 2022. We estimate that in 2022, over 40% of the medium electric cars sold in Germany were cheaper than their average ICE equivalent. Looking at total sales, over 25% of the electric cars sold in 2022 were cheaper than their average ICE equivalent. In 2023, the cheapest models among the best-selling medium electric cars were priced between EUR 22 000 and EUR 35 000 (e.g. MG MG4, Dacia Spring, Renault Megane), far cheaper than the three front-runners priced above EUR 45 000 (VW ID.3, Cupra Born, and Tesla Model 3). To compare, best-selling ICE cars in the medium segment were also priced between EUR 30 000 and EUR 45 000 (e.g. VW Golf, VW Passat Santana, Skoda Octavia Laura, Audi A3, Audi A4). At the end of 2023, Germany phased out its subsidy for electric car purchases, but competition and falling model prices could compensate for this.
In France, the sales-weighted average electric premium stagnated between 2018 and 2022. The average price of ICE cars also increased over the same period, though more moderately than that of electric models. Despite a drop in the price of electric SUVs, which stood at a 30% premium over ICE equivalents in 2022, the former do not account for a high enough share of total electric car sales to drive down the overall average. The electric premium for small and medium cars remains around 40-50%.
These trends mirror those of some of the best-selling models. For example, when adjusting prices for inflation, the small Renault Zoe was sold at the same price on average in 2022-2023 as in 2018-2019, or EUR 30 000 (USD 32 000). It could be found for sale at as low as EUR 25 000 in 2015-2016. The earlier models, in 2015, had a battery size of around 20 kWh, which increased to around 40 kWh in 2018‑2019 and 50 kWh in newer models in 2022-2023. Yet European battery prices fell more quickly than the battery size increased over the same period, indicating that battery size alone does not explain car price dynamics.
In 2023, the cheapest electric cars in France were priced between EUR 22 000 and EUR 30 000 (e.g. Dacia Spring, Renault Twingo E-Tech, Smart EQ Fortwo), while best-selling small ICE models were available between EUR 10 000 and EUR 20 000 (e.g. Renault Clio, Peugeot 208, Citroën C3, Dacia Sandero, Opel Corsa, Skoda Fabia). Since mid-2024, subsidies of up to EUR 4 000 can be granted for electric cars priced under EUR 47 000, with an additional subsidy of up to EUR 3 000 for lower-income households.
In the United Kingdom, the sales-weighted average electric premium shrank between 2018 and 2022, thanks to a drop in prices for electric SUVs, as in the United States. Nonetheless, electric SUVs still stood at a 45% premium over ICE equivalents in 2022, which is similar to the premium for small models but far higher than for medium cars (20%).
In 2023, the cheapest electric cars in the United Kingdom were priced from GBP 27 000 to GBP 30 000 (USD 33 000 to 37 000) (e.g. MG MG4, Fiat 500, Nissan Leaf, Renault Zoe), with the exception of the Smart EQ Fortwo, priced at GBP 21 000. To compare, best-selling small ICE options could be found from GBP 10 000 to 17 000 (e.g. Peugeot 208, Fiat 500, Dacia Sandero) and medium options below GBP 25 000 (e.g. Ford Puma). Since July 2022, there has been no subsidy for the purchase of electric passenger cars.
Elsewhere in Europe, electric cars remain typically much more expensive than ICE equivalents. In Poland , for example, just a few electric car models could be found at prices competitive with ICE cars in 2023, under the PLN 150 000 (Polish zloty) (EUR 35 000) mark. Over 70% of electric car sales in 2023 were for SUVs, or large or more luxurious models, compared to less than 60% for ICE cars.
In 2023, there were several announcements by European OEMs for smaller models priced under EUR 25 000 in the near-term (e.g. Renault R5, Citroën e-C3, Fiat e-Panda, VW ID.2all). There is also some appetite for urban microcars (i.e. L6-L7 category), learning from the success of China’s Wuling. Miniature models bring important benefits if they displace conventional models, helping reduce battery and critical mineral demand. Their prices are often below USD 5 000 (e.g. Microlino, Fiat Topolino, Citroën Ami, Silence S04, Birò B2211).
In Europe and the United States, electric car prices are expected to come down as a result of falling battery prices, more efficient manufacturing, and competition. Independent analyses suggest that price parity between some electric and ICE car models in certain segments could be reached over the 2025-2028 period, for example for small electric cars in Europe in 2025 or soon after. However, many market variables could delay price parity, such as volatile commodity prices, supply chain bottlenecks, and the ability of carmakers to yield sufficient margins from cheaper electric models. The typical rule in which economies of scale bring down costs is being complicated by numerous other market forces. These include a dynamic regulatory context, geopolitical competition, domestic content incentives, and a continually evolving technology landscape, with competing battery chemistries that each have their own economies of scale and regional specificities.
Japan is a rare example of an advanced economy where small models – both for electric and ICE vehicles – appeal to a large consumer base, motivated by densely populated cities with limited parking space, and policy support. In 2023, about 60% of total ICE sales were for small models, and over half of total electric sales. Two electric cars from the smallest “Kei” category, the Nissan Sakura and Mitsubishi eK-X, accounted for nearly 50% of national electric car sales alone, and both are priced between JPY 2.3 million (Japanese yen) and JPY 3 million (USD 18 000 to USD 23 000). However, this is still more expensive than best-selling small ICE cars (e.g. Honda N Box, Daihatsu Hijet, Daihatsu Tanto, Suzuki Spacia, Daihatsu Move), priced between USD 13 000 and USD 18 000. In 2024, Nissan announced that it would aim to reach cost parity (of production, not retail price) between electric and ICE cars by 2030.
Emerging market and developing economies
In EMDEs, the absence of small and cheaper electric car models is a significant hindrance to wider market uptake. Many of the available car models are SUVs or large models, targeting consumers of high-end goods, and far too expensive for mass-market consumers, who often do not own a personal car in the first place (see later sections on second-hand car markets and 2/3Ws).
In India, while Tata’s small Tiago/Tigor models, which are priced between USD 10 000 and USD 15 000, accounted for about 20% of total electric car sales in 2023, the average best-selling small ICE car is priced around USD 7 000. Large models and SUVs accounted for over 65% of total electric car sales. While BYD announced in 2023 the goal of accounting for 40% of India’s EV market by 2030, all of its models available in India cost more than INR 3 million (Indian rupees) (USD 37 000), including the Seal, launched in 2024 for INR 4.1 million (USD 50 000).
Similarly, SUVs and large models accounted for the majority share of electric car sales in Thailand (60%), Indonesia (55%), Malaysia (over 85%) and Viet Nam (over 95%). In Indonesia, for example, Hyundai’s Ionic 5 was the most popular electric car in 2023, priced at around USD 50 000. Looking at launch announcements, most new models expected over the 2024-2028 period in EMDEs are SUVs or large models. However, more than 50 small and medium models could also be introduced, and the recent or forthcoming entry of Chinese carmakers suggests that cheaper models could hit the market in the coming years.
In 2022-2023, Chinese carmakers accounted for 40-75% of the electric car sales in Indonesia, Thailand and Brazil, with sales jumping as cheaper Chinese models were introduced. In Thailand, for example, Hozon launched its Neta V model in 2022 priced at THB 550 000 (Thai baht) (USD 15 600), which became a best-seller in 2023 given its relative affordability compared with the cheapest ICE equivalents at around USD 9 000. Similarly, in Indonesia, the market entry of Wuling’s Air EV in 2022-2023 was met with great success. In Colombia, the best-selling electric car in 2023 was the Chinese mini-car, Zhidou 2DS, which could be found at around USD 15 000, a competitive option relative to the country’s cheapest ICE car, the Kia Picanto, at USD 13 000.
Electric car sales in selected countries, by origin of carmaker, 2021-2023
Second-hand markets for electric cars are on the rise.
As electric vehicle markets mature, the second-hand market will become more important
In the same way as for other technology products, second-hand markets for used electric cars are now emerging as newer generations of vehicles progressively become available and earlier adopters switch or upgrade. Second-hand markets are critical to foster mass-market adoption, especially if new electric cars remain expensive, and used ones become cheaper. Just as for ICE vehicles – for which buying second-hand is often the primary method of acquiring a car in both emerging and advanced economies – a similar pattern will emerge with electric vehicles. It is estimated that eight out of ten EU citizens buy their car second-hand, and this share is even higher – around 90% – among low- and middle-income groups. Similarly, in the United States, about seven out of ten vehicles sold are second-hand, and only 17% of lower-income households buy a new car.
As major electric car markets reach maturity, more and more used electric cars are becoming available for resale. Our estimates suggest that in 2023, the market size for used electric cars amounted to nearly 800 000 in China , 400 000 in the United States and more than 450 000 for France, Germany, Italy, Spain, the Netherlands and the United Kingdom combined. Second-hand sales have not been included in the numbers presented in the previous section of this report, which focused on sales of new electric cars, but they are already significant. On aggregate, global second-hand electric car sales were roughly equal to new electric car sales in the United States in 2023. In the United States, used electric car sales are set to increase by 40% in 2024 relative to 2023. Of course, these volumes are dwarfed by second-hand ICE markets: 30 million in the European countries listed above combined, nearly 20 million in China, and 36 million in the United States . However, these markets have had decades to mature, indicating greater longer-term potential for used electric car markets.
Used car markets already provide more affordable electric options in China, Europe and the United States
Second-hand car markets are increasingly becoming a source of more affordable electric cars that can compete with used ICE equivalents. In the United States, for example, more than half of second-hand electric cars are already priced below USD 30 000. Moreover, the average price is expected to quickly fall towards USD 25 000, the price at which used electric cars become eligible for the federal used car rebate of USD 4 000, making them directly competitive with best-selling new and used ICE options. The price of a second-hand Tesla in the United States dropped from over USD 50 000 in early 2023 to just above USD 33 000 in early 2024, making it competitive with a second-hand SUV and many new models as well (either electric or conventional). In Europe , second-hand battery electric cars can be found between EUR 15 000 and EUR 25 000 (USD 16 000‑27 000), and second-hand plug-in hybrids around EUR 30 000 (USD 32 000). Some European countries also offer subsidies for second-hand electric cars, such as the Netherlands (EUR 2 000), where the subsidy for new cars has been steadily declining since 2020, while that for used cars remains constant, and France (EUR 1 000). In China , used electric cars were priced around CNY 75 000 on average in 2023 (USD 11 000).
In recent years, the resale value 8 of electric cars has been increasing. In Europe, the resale value of battery electric cars sold after 12 months has steadily increased over the 2017-2022 period, surpassing that of all other powertrains and standing at more than 70% in mid-2022. The resale value of battery electric cars sold after 36 months stood below 40% in 2017, but has since been closing the gap with other powertrains, reaching around 55% in mid-2022. This is the result of many factors, including higher prices of new electric cars, improving technology allowing vehicles and batteries to retain greater value over time, and increasing demand for second-hand electric cars. Similar trends have been observed in China.
High or low resale values have important implications for the development of second-hand electric car markets and their contributions to the transition to road transport electrification. High resale values primarily benefit consumers of new cars (who retain more of the value of their initial purchase), and carmakers, because many consumers are attracted by the possibility of reselling their car after a few years, thereby fostering demand for newer models. High resale values also benefit leasing companies, which seek to minimise depreciation and resell after a few years.
Leasing companies have a significant impact on second-hand markets because they own large volumes of vehicles for a shorter period (under three years, compared to 3 to 5 years for a private household). Their impact on markets for new cars can also be considerable: leasing companies accounted for over 20% of new cars sold in Europe in 2022.
Overall, a resale value for electric cars on par with or higher than that of ICE equivalents contributes to supporting demand for new electric cars. In the near term, however, a combination of high prices for new electric cars and high resale values could hinder widespread adoption of used EVs among mass-market consumers seeking affordable cars. In such cases, policy support can help bridge the gap with second-hand ICE prices.
International trade for used electric cars to emerging markets is expected to increase
As the EV stock ages in advanced markets, it is likely that more and more used EVs will be traded internationally, assuming that global standards enable technology compatibility (e.g. for charging infrastructure). Imported used vehicles present an opportunity for consumers in EMDEs, who may not have access to new models because they are either too expensive or not marketed in their countries.
Data on used car trade flows are scattered and often contradictory, but the history of ICE cars can be a useful guide to what may happen for electric cars. Many EMDEs have been importing used ICE vehicles for decades. UNEP estimates that Africa imports 40% of all used vehicles exported worldwide, with African countries typically becoming the ultimate destination for used imports. Typical trade flows include Western European Union member states to Eastern European Union member states and to African countries that drive on the right-hand side; Japan to Asia and to African countries that drive on the left-hand side; and the United States to the Middle East and Central America.
Used electric car exports from large EV markets have been growing in recent years. For China, this can be explained by the recent roll-back of a policy forbidding exports of used vehicles of any kind. Since 2019 , as part of a pilot project, the government has granted 27 cities and provinces the right to export second-hand cars. In 2022, China exported almost 70 000 used vehicles, a significant increase on 2021, when fewer than 20 000 vehicles were exported. About 70% of these were NEVs, of which over 45% were exported to the Middle East. In 2023, the Ministry of Commerce released a draft policy on second-hand vehicle export that, once approved, will allow the export of second-hand vehicles from all regions of China. Used car exports from China are expected to increase significantly as a result.
In the European Union, the number of used electric cars traded internationally is also increasing . In both 2021 and 2022, the market size grew by 70% year-on-year, reaching almost 120 000 electric cars in 2022. More than half of all trade takes place between EU member states, followed by trade with neighbouring countries such as Norway, the United Kingdom and Türkiye (accounting for 20% combined). The remainder of used EVs are exported to countries such as Mexico, Tunisia and the United States. As of 2023, the largest exporters are Belgium, Germany, the Netherlands, and Spain.
Last year, just over 1% of all used cars leaving Japan were electric. However these exports are growing and increased by 30% in 2023 relative to 2022, reaching 20 000 cars. The major second-hand electric car markets for Japanese vehicles are traditionally Russia and New Zealand (over 60% combined). After Russia’s invasion of Ukraine in 2022, second-hand trade of conventional cars from Japan to Russia jumped sharply following a halt in operations of local OEMs in Russia, but this trade was quickly restricted by the Japanese government, thereby bringing down the price of second-hand cars in Japan. New Zealand has very few local vehicle assembly or manufacturing facilities, and for this reason many cars entering New Zealand are used imports. In 2023, nearly 20% of all electric cars that entered New Zealand were used imports, compared to 50% for the overall car market.
In emerging economies, local policies play an important role in promoting or limiting trade flows for used cars. In the case of ICE vehicles, for example, some countries (e.g. Bolivia, Côte d’Ivoire, Peru) limit the maximum age of used car imports to prevent the dumping of highly polluting cars. Other countries (e.g. Brazil, Colombia, Egypt, India, South Africa) have banned used car imports entirely to protect their domestic manufacturing industries.
Just as for ICE vehicles, policy measures can either help or hinder the import of used electric cars, such as by setting emission standards for imported used cars. Importing countries will also need to simultaneously support roll-out of charging infrastructure to avoid problems with access like those reported in Sri Lanka after an incentive scheme significantly increased imports of used EVs in 2018.
The median age of vehicle imports tends to increase as the GDP per capita of a country decreases. In some African countries, the median age of imports is over 15 years. Beyond this timeframe, electric cars may require specific servicing to extend their lifetime. To support the availability of second-hand markets for electric cars, it will be important to develop strategies, technical capacity, and business models to swap very old batteries from used vehicles. Today, many countries that import ICE vehicles, including EMDEs, already have servicing capacity in place to extend the lifetimes of used ICE vehicles, but not used EVs. On the other hand, there are typically fewer parts in electric powertrains than in ICE ones, and these parts can even be more durable. Battery recycling capacity will also be needed, given that the importing country is likely to be where the imported EV eventually reaches end-of-life. Including end-of-life considerations in policy making today can help mitigate the risk of longer-term environmental harm that could result from the accumulation of obsolete EVs and associated waste in EMDEs.
Policy choices in more mature markets also have an impact on possible trade flows. For example, the current policy framework in the European Union for the circularity of EV batteries may prevent EVs and EV batteries from leaving the European Union, which brings energy security advantages but might limit reuse. In this regard, advanced economies and EMDEs should strengthen co-operation to facilitate second-hand trade while ensuring adequate end-of-life strategies. For example, there could be incentives or allowances associated with extended vehicle lifetimes via use in second-hand markets internationally before recycling, as long as recycling in the destination market is guaranteed, or the EV battery is returned at end of life.
Throughout this report, unless otherwise specified, “electric cars” refers to both battery electric and plug-in hybrid cars, and “electric vehicles” (EVs) refers to battery electric (BEV) and plug-in hybrid (PHEV) vehicles, excluding fuel cell electric vehicles (FCEV). Unless otherwise specified, EVs include all modes of road transport.
Throughout this report, unless otherwise specified, regional groupings refer to those described in the Annex.
In the Chinese context, the term New Energy Vehicles (NEVs) includes BEVs, PHEVs and FCEVs.
Based on model trim eligibility from the US government website as of 31 March 2024.
SUVs may be defined differently across regions, but broadly refer to vehicles that incorporate features commonly found in off-road vehicles (e.g. four-wheel drive, higher ground clearance, larger cargo area). In this report, small and large SUVs both count as SUVs. Crossovers are counted as SUVs if they feature an SUV body type; otherwise they are categorised as medium-sized vehicles.
Measured under the Worldwide Harmonised Light Vehicles Test Procedure using vehicle model sales data from IHS Markit.
Price data points collected from various data providers and ad-hoc sources cover 65-95% of both electric and ICE car sales globally. By “price”, we refer to the advertised price that the customer pays for the acquisition of the vehicle only, including legally required acquisition taxes (e.g. including Value-Added Tax and registration taxes but excluding consumer tax credits). Prices reflect not only the materials, components and manufacturing costs, but also the costs related to sales and marketing, administration, R&D and the profit margin. In the case of a small electric car in Europe, for example, these mark-up costs can account for around 40% of the final pre-tax price. They account for an even greater share of the final pre-tax price when consumers purchase additional options, or opt for larger models, for which margins can be higher. The price for the same model may differ across countries or regions (e.g. in 2023, a VW ID.3 could be purchased in China at half its price in Europe). Throughout the whole section, prices are adjusted for inflation and expressed in constant 2022 USD.
This metric of depreciation used in second-hand technology markets represents the value of the vehicle when being resold in relation to the value when originally purchased. A resale value of 70% means that a product purchased new will lose 30% of its original value, on average, and sell at such a discount relative to the original price.
Reference 1
Reference 2, reference 3, reference 4, reference 5, reference 6, reference 7, reference 8, subscription successful.
Thank you for subscribing. You can unsubscribe at any time by clicking the link at the bottom of any IEA newsletter.
IMAGES
VIDEO
COMMENTS
How: After completing individual research analysis, create a user need statement on your own. Compare this user need statement to that generated by peer researchers. Combine and remix the various needs statements until you have a user need statement that is the best objective representation of the interview insights.
User research is the methodic study of target users—including their needs and pain points—so designers have the sharpest possible insights to make the best designs. User researchers use various methods to expose problems and design opportunities and find crucial information to use in their design process. Discover why user research is a ...
By understanding the user's context, you can choose research methods that are better suited to capturing their experience. Evaluate the feasibility: Evaluate the feasibility of each research method. Consider factors such as the time, budget, and resources required to conduct the research, as well as the availability and willingness of ...
User needs refer to users' desires, goals, preferences and expectations when they interact with a product or service. These can encompass a wide range of factors such as functionality, usability, aesthetics, accessibility and emotional satisfaction. Designers research and understand needs to create user-centric designs that prioritize ...
User research is used to understand the user's needs, behaviors, experience and motivations through various qualitative and quantitative methods to inform the process of solving for user's problems. As Mike Kuniaysky puts it, user research is: "The process of understanding the impact of design on an audience.".
A Beginner's Guide to Finding User Needs. Qualitative research on user motivations, activities, and problems. Jan Dittrich. Research focused on understanding. Types of projects you can use qualitative research in. Research for open topic exploration; Research based on an idea for a new product or feature; Research based on an overhaul of a ...
The type of user research you should do depends on your work process as well as your reason for doing user research in the first place. Here are three excellent reasons for doing user research: 1. To Create Designs That are Truly Relevant. If you understand your users, you can make designs that are relevant for them.
This course is part of the User Experience (UX) Research and Design specialization offered on Coursera. What you'll learn: Find out what user needs assessments are, what qualitative research is, and how the two are related. Learn an end-to-end methodology for qualitative research that is suited for understanding user needs.
3: Methods: Choose the right research method. UX research is about exploration, and you want to make sure that your method fits the needs of what you're trying to explore. There are many different methods. In a later chapter we'll go over the most common UX research methods.
User research is an integral part of the UX design process. It provides insight into your users' needs and behaviors, so that you can create better products and experiences for them.
User experience research, or UX research, is the process of gathering insights about users' behaviors, needs, and pain points through observation techniques and feedback methodologies. It's a form of user research that looks at how users interact with your product, helping bridge the gaps between what you think users need, what users say they ...
User research, or UX research, is an absolutely vital part of the user experience design process. Typically done at the start of a project, it encompasses different types of research methodologies to gather valuable data and feedback. When conducting user research, you'll engage with and observe your target users, getting to know their needs ...
11. Concept testing. Concept testing is a type of research that evaluates the feasibility, appeal, and potential success of a new product before you build it. It centers the user in the ideation process, using UX research methods like A/B testing, surveys, and customer interviews.
UX Research Cheat Sheet. Susan Farrell. February 12, 2017. Summary: User research can be done at any point in the design cycle. This list of methods and activities can help you decide which to use when. User-experience research methods are great at producing data and insights, while ongoing activities help get the right things done.
Never forget - you are not your user. You require proper user research to understand your user's problems, pain points, needs, desires, feelings and behaviours. Let's start with the process! Step #1: Define research objectives. Before you get in touch with your target users, you need to define why you are doing the research in the first ...
Desk research. Desk research (secondary research) is valuable for gathering information and insights to understand user needs based on existing data from various internal and external sources. This data can come from published materials, academic papers, industry reports, social media, online resources, and other third-party data sources.
UX research reveals gaps in your knowledge. User researchers are human beings and human beings are flawed. Very, very flawed. In fact, user researchers often refer to a huge cognitive bias map to keep track of the various ways our brain can trick us into making decisions without enough information.
UX (user experience) research is the systematic study of target users and their requirements, to add realistic contexts and insights to design processes. UX researchers adopt various methods to uncover problems and design opportunities. Doing so, they reveal valuable information which can be fed into the design process.
User research to address user needs. Identifying user needs is a foundational step in creating products and services that are both useful and relevant to your target audience. User-centered design prioritizes gathering information and deep insights from direct conversations with end users. By having the user problem on the plate, product ...
Here are 6 common methodologies that are easy to incorporate into your UX design process. 1. User Interviews. Interviews are a type of user research method in which the researcher talks with participants to collect data. This method is used to gather insights about people's attitudes, beliefs, behaviors, and experiences.
Greater user responsibility and fulfillment. Increased ability for the user to scale their efforts. Increased creativity. Augmentation opportunities aren't always easy to define as separate from automation, but they're usually more complicated, inherently human, and personally valuable.
needs model. f. o. r. news. Audience-driven publishing. The User Needs Model 2.0 will help you choose the right content strategy and the best angle for every story. On this page, we try to explain what the user needs for news mean. User needs are at the heart of building a true bond with your audience - one that is based on trust and value.
Understanding user needs. People and businesses use government services to help them get something done (for example, register to vote, check if a vehicle is taxed or pay a VAT bill). 'User ...
Defining key terms, Chan differentiated HCD from similar fields like user experience and design thinking. In particular, HCD begins with understanding the needs of people experiencing a problem to be addressed — where journey mapping proves useful. Participants with a shared interest in HCD came together in small groups and mingled over dinner.
Validating your design decisions through user research is a critical step in the UX design process. It helps ensure that your design choices align with user needs and preferences. But how do you ...
Large Language Models (LLMs) are essential tools to collaborate with users on different tasks. Evaluating their performance to serve users' needs in real-world scenarios is important. While many benchmarks have been created, they mainly focus on specific predefined model abilities. Few have covered the intended utilization of LLMs by real users. To address this oversight, we propose ...
Roughly one-in-five teenagers who have heard of ChatGPT say they have used it to help them do their schoolwork, according to a new Pew Research Center survey of U.S. teens ages 13 to 17. With a majority of teens having heard of ChatGPT, that amounts to 13% of all U.S. teens who have used the generative artificial intelligence (AI) chatbot in ...
There is a need for patient-centered solutions that support and encourage postpartum people to seek care for severe symptoms. Objective: We aimed to determine the design needs for a mobile health (mHealth) patient-reported outcomes and decision-support system to assist Black patients in assessing when to seek medical care for severe postpartum ...
Electric car sales neared 14 million in 2023, 95% of which were in China, Europe and the United States. Almost 14 million new electric cars1 were registered globally in 2023, bringing their total number on the roads to 40 million, closely tracking the sales forecast from the 2023 edition of the Global EV Outlook (GEVO-2023). Electric car sales in 2023 were 3.5 million higher than in 2022, a 35 ...