Free Editable Graphic Organizer for Research Paper
If you are looking to learn more about how to come up with a graphic organizer for research papers , you are in the right place. In this post, along with looking at the basics of these organizers, we are also going to share some editable examples for free.

1. What is a Graphic Organizer for Research Paper
A graphic organizer in general can be defined as a graphical representation of the various elements in an activity/process. It also displays their relationship and/or chronological order. Not all organizers stick to the same pattern, but the gist remains the same. Similarly, a graphic organizer for research papers can be defined as a representation using which arguments, facts, and reasons pertaining to a research paper can be mapped out and displayed in an easily perusable form.
Coming up with a graphic organizer prior to actually writing out the research paper can be a highly useful and beneficial step. The quality of a research paper relies on being professionally and adroitly written, with little to be pointed out or corrected. In order to be written correctly, a proper pattern and order have to be followed. The arguments must be written one by one with their respective evidence and reasoning. This can be achieved if they (the arguments) are planned and assembled beforehand. Then the writer can simply tackle one part at a time. On the contrary, if the arguments are written all together, then the reasoning and the evidence can get jumbled up, leaving the reader confused.
2. The Graphic Organizer for Research Paper Examples
In order to better illustrate how these graphic organizers look like, we are going to look at some examples of the same. As we saw before, these organizers can be really important for the integrity and proficiency of the research paper. By giving the paper structure and order, the writer can make sure that each argument hits home and convinces the reader.
Example 1: Graphic Organizer for Research Paper
The core and crux of a graphic organizer for research papers can be understood from this example. This organizer features three sections in a vertical alignment. The top section is the introductory part where the title or topic of the discussion/research has to be mentioned. Similarly, the introduction points are also to be enumerated here. In the next segment, there are three columns. The details and evidence for each paragraph of the paper are to be filled in the spaces given in the columns.
In the end, there is a conclusion part where the summation of the arguments and their support can be given. This template is specifically for a paper that features three paragraphs. However, if you need to add more, you can simply increase the number of columns and structure your details according to your need.

Example 2: Graphic Organizer Research Paper Outline
In this outline, there is firstly the introductory part where the name of the topic and the stance/perspective is mentioned. Then, in substantiation of the stance, three reasons can be given in the oval-shaped sections. Each reason is to be further supported by a concrete example, and an explanation pertaining to that example and its relevance to the reason.
The concrete examples/explanations are given in a rectangular section. You can add as many examples as you need to support your reason. Similarly, you can take inspiration from this design and come up with a similar layout that has a larger number of included reasons/arguments.
This outline can help you understand how a research paper organizer has to be created. It can also help you when you actually want to write one out, and you want to divide your content separately and tackle it part by part.

Example 3: The Research Paper Graphic Organizer
This outline is much more elaborate and detail-oriented as compared to the last example. While the previous example was about planning and structuring the content of a research paper, this organizer focuses on the style, convention, and order that is to be featured in the paper.
The organizer starts off with the preliminary ‘Focus’ part, where the thesis statement has to be written. This is the part where the purpose of the paper and the aim of your argument is usually elucidated. Then there is the ‘Content’ part where the arguments or subtopics have to be separately mentioned and listed. Then comes the ‘Style’ section where you can plan out what sort of grabbers and zingers you are going to use in your content.
After that, there is the ‘Organization’ part where you can write out the order in which your arguments have to appear. The sequence of the arguments can have quite an impact on your paper. Last but not least, there is the ‘Conventions’ box that you can fill out.

Example 4: Graphic Organizer for Research Paper
In this example, the primary purpose of the outline is not to plan out how the research paper has to be written. Instead, this example is labeled as a ‘Research Note Taker’. This outline can be defined as a form that is used to gather relevant information about the research.
This organizer can affect the quality of your research paper despite not being a planner in the strictest of sense. Using this organizer, you can list various notes and points about your research along with their sources. This can help you by a) making the referencing easy and b) by giving you an order to follow while writing out the paper. You can, while taking the notes, place them in the order you would like them to appear in the writing.

Example 5: Research Paper Graphic Organizer
This research paper graphic organizer utilizes a distinct layout and method of planning. This organizer starts off with a ‘Sources’ section rather than jumping straight to the arguments, and the ‘why?’, ‘how?’ or ‘when?’ of the whole affair.
After mentioning the name of your topic in the upper right corner, you can write out the sources you are using for your research. By default, this layout has five boxes available for this purpose. Then follows the ‘Thesis Statement’. This is where the purpose and perspective of the arguments are mentioned. After that, the 'Notes' are to be mentioned, and then the paragraphs can be individually planned.
In the last example, we saw that the graphic organizer was about taking notes/quotes relevant to the research rather than organizing the paragraphs and content of the paper. In this Research Paper Graphic Organizer, we can see that it features both. It can be used as an organizer for the layout of the paper, and it can also be used to write the notes thanks to the dedicated ‘Notes’ section.

Example 6: Graphic Organizer for Research Paper PDF
Next comes the Research Paper Graphic Organizer PDF. This template can be used to plan out the various points and aspects of a particular research question. The drawing features a triangle in the middle, where the 'Main Research Question' has to be written. After that, there is a whole bunch of boxes circumscribing the center. This is where 'Questions' and 'Facts' have to be mentioned.
Unlike some other examples on this list, this organizer does not explain the order or sequence of the paper. It merely gives us the option of writing out different reasons and pieces of evidence in substantiation of our argument.

Source: EdrawMax Online Edit Now
Example 7: Graphic Organizer for Persuasive Writing
This template is a nice and simple example of what a graphic organizer should look like. There are three sections in this example. First is the part where the stance or opinion of the writer is mentioned. Then, there are three boxes underneath where the arguments will be listed and explained. And finally, the conclusion will wrap up the whole affair.
In contrast to some of the more complex structures we have seen in this list, this organizer looks really simple and straightforward. If you are just looking to create a plan for yourself using which you can organize different arguments and reasons in your research paper, this type of organizer can suffice for you.

Example 8: Graphic Organizer for Research Papers
If you are looking to plan out each paragraph of your paper with detail, this sort of graphic organizer is what you are looking for. Up till now, the examples we saw merely had a box or two for the paragraphs, where the contents could be lightly introduced and explained. However, in this organizer, each paragraph is written as a separate heading. For each paragraph, you can write the topic sentence, conclusion, and the included facts/details.
On the first page, you get a blank space which is where the crux or the introduction of the paper will go. After that, you can prepare your paragraphs in a sequence by numbering them and filling out their details one by one. In this particular example, the topic under discussion is ‘Natural Disasters’.

Example 9: Graphic Organizer for Insect Research Papers
While this example focuses particularly on insects, the included layout can be used for any topic of your choice. There is not a particular order or sequence in this graphic organizer. It simply features various boxes and containers where different pieces of information can be written about the subject.
In the example, the boxes are labeled ‘Where does this insect live?’ ‘What does it look like?’ and ‘What does this insect like to eat?’ etcetera. Since the subject is a June bug, these boxes are for details related to it. If you want to come up with a similar graphic organizer, you can simply choose your desired topic and then arrange bits of information such as ‘How does it occur?’, ‘Why does it happen?’ etcetera.

3. Online Graphic Organizer for Research Paper Maker
EdrawMax Online is a cloud-based software that allows users to come up with a variety of different diagrams, charts, drawings, and graphic organizers. By simply signing up, you can get access to a canvas where you can draw any organizer of your choice by dragging and dropping various shapes and symbols from the included library. You can also use EdrawMax Online to come up with graphic organizers for research papers. You can choose to create one from scratch or just use a template, albeit the latter option relies on the presence of a template in the template gallery .

Why Choose EdrawMax Online
- Create over 280 diagram types
- Supports team collaboration
- Personal cloud & data protection
- Print, share and download
- Powerful template community
4. Key Takeaways
Coming up with a graphic organizer for research papers can be very useful and beneficial. By organizing your ideas and arguments in a structured form, you can save yourself confusion and trouble when the time arrives to put everything in writing.
By using EdrawMax Online , you can create a graphic organizer easily by using existing shapes and symbols and filling them out with text. There are a bunch of features that you can use to personalize your drawings and give them a unique touch. The ease of use, availability and multiple-format support makes EdrawMax an excellent option for making drawings, diagrams, flowchart, UML diagram, graphic organizers and 280+ types of diagrams. You can find out more graphic organizer examples in the Template Gallery.
Related Articles

Using Graphic Organizers for Writing Essays, Summaries and Research

Ask any student – essay writing is one of the most despised tasks of their educational career. Perhaps there is so much displeasure associated with the task because it’s perceived as too linear – there isn’t enough visual and creative appeal. But if you use graphic organizer for writing essays then you can make writing enjoyable – or at least less terrible.
Not only enjoyable but graphic organizers (or diagrams) can make the writing process a snap. They’ll help you think outside the box, draw conclusions you wouldn’t normally observe, and make the entire process faster and more efficient.
Why Use Graphic Organizers for Writing
The phrase “graphic organizer” is just a fancy way of saying “diagram” or “visual aid.” Basically, they are a visual representation of the information you’ve acquired in the research process. There are quite a few reasons why you should use them when writing essays or summaries.
- Helps you visualize your research and how elements connect with each other
- Enhance your essays, summaries and research papers with visual elements
- Track correlations between your thoughts, observations, facts or general ideas
When it comes to essay writing, the most common graphic organizers are webs, mind maps, and concept maps .
Using Webs for Brainstorming
Webbing is a great way to see how various topics are interrelated. This graphic organizer is particularly useful during the brainstorming step of the writing process.
A web can sometimes get a bit messy. Usually, there are lots of arrows to connect overlapping ideas. However, even with lines crisscrossing every which way, it is still a great way to visualize your thoughts. If you’re using an online diagramming software like Creately you can overcome some of this because we automatically arrange the object for you.
Once you’ve created a map to document all your ideas and establish connections, you can easily transition to other forms of diagramming to better organize the information.
For example if you’re writing a research paper about the food web of the Australian bushes you can start creating a food web diagram similar to the one below. This way you can easily visualize the web while writing the paper. This is a simple example but graphic organizers become even more important when the subject gets complex.

Although simple this example shows the importance of using graphic organizers for writing summaries. A comprehensive diagram pretty much does the summation for you.
Using Mind Maps as Graphic Organizers
Mind maps are a great way to depict a hierarchy. What is hierarchical organization ? The concept is simple: a singular topic dominates with each subsequent idea decreasing in importance.
Usually, the mind map starts with the thesis (or main idea) at the center. From there, you can branch out with your supporting evidence.
Use this process to replace your traditional note taking technique – note cards, outlines, whatever. You’ll quickly realize a mind map is a great way to formulate the structure of your essay. The thing to note here is that the nature of the mind maps force you think about sub topics and how to organize your ideas. And once the ideas are organized writing the essay become very easy.

Above is a mind map of a research proposal. Click on it to see the full image or you can see the fully editable template via this link . As you can see in this mind map the difference areas of the research proposal is highlighted. Similarly when your writing the research paper you can use a mind map to break it down to sub topics. We have more mind map templates for you to get started.
Concept Maps
A concept map will help you visualize the connection between ideas. You can easily see cause and effect – how one concept leads to another. Often times, concept mapping includes the use of short words or phrases to depict the budding relationship between these concepts.
If you look closely you can see that its very similar to a mind map. But a concept maps gives more of a free reign compares to the rigid topic structure of a mind map. I’d say it’s the perfect graphic organizer for writing research papers where you have the license to explore.
By creating a concept map , you can also see how a broad subject can be narrowed down into specific ideas. This is a great way to counter writers block. Often, we look at the big picture and fail to see the specifics that lead to it. Identifying contributing factors and supporting evidence is difficult. But with a concept map, you can easily see how the smaller parts add up to the whole.

Why Bother With Graphic Organizers?
If you already detest the writing process, adding another step might seem insane. However, there really are several advantages of using them. If you haven’t already accepted the benefits of each individual diagram style, here are some more perks of graphic organizers in general:
- Quality essays are based on detail. No one is going to accept your opinions and reasoning just because you say so. You’ll need proof. And organizing that proof will require attention to detail. Graphic organizers can help you see that detail and how it contributes to the overall concept.
- Graphic organizers are flexible. You don’t need one of those giant pink erasers. You don’t need to restructure your outline. All you have to do is draw a few arrows and bam – the relationship has totally changed.
- No matter what you are writing about, a graphic organizer can help. They can be used to structure an essay on the Great Wall, theoretical physics, or Spanish speaking countries.
- If you write an outline, can you easily see how point A influences point X? Probably not. But if little thought bubble A is sitting out there all by itself, you can visualize the way it ties into point R, T and X.
- Some of us find it difficult to put our opinions, thoughts, and ideas into writing. However, communicating our feelings with little doodles and sketches is far less threatening.
- As a writer, our brain often feels like a 2-year-old’s toy box – a big jumbled mess. Taking that mess and putting it onto paper with some semblance of organization is challenging. Rather than trying to take your thoughts from total chaos to a perfectly structured list, just try to get them out of your brain and onto paper in the form of a diagram.
- A graphic organizer helps you establish validity and relevance. You can easily nix the ideas that don’t support or enhance your thesis.
The next time you are faced with a writing project, take a few minutes to explore the efficiency of graphic organizers. You can find a wealth of templates here.
Have you ever used a graphic organizer to structure an essay? How did it go? Do you have a diagram suggestion for the writing process that wasn’t mentioned here? Let us know!
Join over thousands of organizations that use Creately to brainstorm, plan, analyze, and execute their projects successfully.
More Related Articles

These are awesome guest posts contributed by our users and technology enthusiasts. Do you have something interesting to share? Want to get exposed to a massive tech audience? Check out our Guest Posting Guidelines to how to proceed.

How to Use Graphic Organizers to Write Better Essays
Lucid Content
Reading time: about 6 min
If you’re a student, there’s no way around the inevitable: You’re going to have to write essays. Lots of essays. In fact, the five-paragraph essay is so fundamental to the high school curriculum that it’s still used on the ACTs, and knowing how to recognize the organizational structure of essays will help you score higher on the SATs.
Even though it seems like a chore, knowing how to organize and write an essay can have a lasting effect on your life, from getting into a better college to scoring a better job to performing better in that job long after your high school days are over.
Here’s a secret: Using graphic organizers for writing essays can help you write better essays faster. (And don’t count yourself out if you’re an educator—you can offer these tools to help your students succeed.) We’ll show you exactly how to do it.
Why use graphic organizers
When ACT graders or teachers are looking your essay, they’re looking for very specific criteria; essentially, they’re looking at how well you’ve organized your thoughts. Many students don’t take the time to outline their essay structure before writing, and that always means a lower score on a test and a lower grade on the essay in class.
Using a writing template can feel like an unnecessary step in an already complicated process. If you need extra motivation to implement these organizers into your writing routine, consider all of their benefits. Graphic organizers can help you:
- Save time by showing you where each piece of the essay “lives.”
- Have more productive brainstorming sessions, either by yourself or with a group.
- Make connections between ideas and create a more cohesive argument.
- Pinpoint holes in your arguments and either adjust the thesis or find supporting statements.
- Keep track of your research.
- Organize your thoughts and come to interesting, more compelling conclusions.
- Stay in the right direction when you feel lost in a sea of words.
- Manage anxiety by converting the fear of a blank assignment into an action plan with a clear map.
With all those benefits, it’s hard to ignore how useful and vital graphic organizers are to writing. And once you’ve become adept at organizing your thoughts for something like a school essay, you’ll find that skill carries with you throughout your life, whether you’re trying to become a more intelligent debater to negotiate prices. It goes beyond just the essay to becoming a better thinker. And it starts with a simple template.
We’ll walk you through several use cases for graphic organizers and provide templates for you to download and fill in when you’re ready to write.
Brainstorming graphic organizers
Brainstorming is important, not only to come up with ideas for topics but to determine what information you need to include in the essay once you’ve determined your topic. Though many think of brainstorming as just freeflow thinking, brainstorming is most productive when you work within specific parameters.
That’s why essay brainstorming graphic organizers are useful, whether you’re using one to brainstorm on your own or you’re working with a group.
In Lucidchart, our mind map shapes and templates double as brainstorming graphic organizers. Start with an essay prompt as your central shape and then fill in the shapes that branch off your prompt with topic ideas. Alternatively, you can add your selected topic to the center and start brainstorming the different ideas you need to cover in your paper.
When the template is filled in, you’ll have a clear starting point for your essay or research paper.
Research paper graphic organizers
Nothing paralyzes students with fear quite like a research paper. These long-form papers require—as the name implies—quite a bit of research, and their purpose is to teach students how to look for valid sources to support their arguments.
But keeping track of all those sources and tying them into your argument can be tricky. That’s where a research paper graphic organizer can be a student’s greatest ally.

This template lays out the writing process itself. After you come up with a general topic, like “the disappearance of honey bees,” fill in the “Research Paper Topic” box.
Then, start looking for reputable sources (Wikipedia doesn’t count) and use the five sources boxes to hold the most relevant quotes and statistics you find. Using those quotes and statistics, you can then fill out a thesis statement that is supported by the research.
Then, you’ll be able to focus your paragraphs on a single topic each that supports the thesis statement and your overarching argument. After you’ve filled out the template, the backbone of the research paper is complete: All that’s left to do is fill in the spaces between sources and arguments.
5-paragraph essay graphic organizer
When it comes to writing the five-paragraph essay, writing diagrams are key. By using graphic organizers for writing, you’re no longer staring at a giant blank piece of paper with no idea how or where to begin. Your graphic organizer is your map.
Although using writing diagrams may seem time-consuming, the fact is that taking the time to fill a graphic organizer in before writing actually saves time. If there’s a problem with the argument, it will show up on the diagram, or if there’s not enough evidence to support your argument, you’ll know before you’ve wasted time writing the paper. And, as we said before, even if your writing is terrible, if your argument is sound, you’ll still score a decent grade.
Try this 5-paragraph essay template to get you started.

Don’t feel pressured to come up with a compelling title right away. Instead, it’s more important that you come up with a thesis statement that can be supported by three solid arguments. Fill in that thesis statement and your arguments. Then, for each argument, figure out three supporting details to support your case.
That’s it! You’ve got the most essential parts of your 5-paragraph essay completed.
Now, come up with an introduction that sets the stage for your argument and a conclusion that wraps up and restates your thesis and supporting arguments in a compelling way. Now you have a solid plan for your paper and can approach it with confidence.
If you’d like a more linear graphic that exactly follows the structure of the 5-paragraph, use the writing template below and follow the same process.

Visuals, such as graphic organizers for writing, can help you better understand concepts, think creatively, and collaborate with your classmates—and there are plenty of other templates where these came from.
Lucidchart offers hundreds of templates to help you through your studies, including timelines, Venn diagrams, word maps, and more. Sign up for Lucidchart and upgrade to an Educational account for free.
Resources for teachers
Providing graphic resources to students is essential; after all, many of your students will be visual learners, so while you may beautifully explain how the process works, there will be some who won’t understand until they see a template of the essay itself.
Lucidchart has many resources for teachers, from lesson plans to writing templates. While you’re teaching your students how to write essays or research papers, it’s useful to print out the templates and fill them out together (even using a completed template as a separate assignment with a separate grade) so that your students can get a feel for properly filling out graphic organizers before attempting it on their own.
Lucidchart, a cloud-based intelligent diagramming application, is a core component of Lucid Software's Visual Collaboration Suite. This intuitive, cloud-based solution empowers teams to collaborate in real-time to build flowcharts, mockups, UML diagrams, customer journey maps, and more. Lucidchart propels teams forward to build the future faster. Lucid is proud to serve top businesses around the world, including customers such as Google, GE, and NBC Universal, and 99% of the Fortune 500. Lucid partners with industry leaders, including Google, Atlassian, and Microsoft. Since its founding, Lucid has received numerous awards for its products, business, and workplace culture. For more information, visit lucidchart.com.
Related articles

Check out how Annika, a recent English graduate of the University of Michigan, used mind mapping in Lucidchart to develop her honors thesis.
Bring your bright ideas to life.
or continue with

K-12 Internet Resource Center
A totally free index of Internet resources for the K-12 Community.
Research Paper Graphic Organizer

Help students to plan and prepare their research paper with this graphic organizer template.
This printable research graphic organizer is designed to help students synthesize their sources and ideas in order to ensure that they are ready to write. The template includes sections for students to outline the introduction, body paragraphs, and conclusions, allowing them to organize and plan their research papers effectively.
Suitable for high school and middle school students and can be used for a variety of subjects and topics.
Attributes: 6-8 9-12
Resource Link: https://www.teachervision.com/research-paper-outline-graphic-organizer
- Try for free
Writing Research Papers Graphic Organizers
- Most Popular
- Most Recent

Graphic Organizer for Research Papers

Our multi-paragraph organizers and single-paragraph organizers for writing research papers can be helpful in many classrooms.
These are another free resource for teachers from the curriculum corner..
We have expanded our collection of multi-paragraph organizers for writing research papers.
Included in our collection are a range of options for you to choose from.
Our new set includes options for single-paragraph essays along with choices for multiple-paragraph essays.
A few years ago, my oldest son came home from school with a 10-paragraph research paper assignment.
After choosing The Holocaust as his topic, he set out to gather knowledge and facts.
His teacher gave the students an organizational tool which involved index cards. Basically, he was to brainstorm 10 broad topics related to The Holocaust. He then would write them on 10 different index cards.
Then as he set out to gather his research, he was to have at least 5 index cards for each broad topic. Those cards were for containing information and/or facts to go with each of the topic cards.
These would eventually help him to develop his 10 paragraphs for the research paper.
My first thought said it was a great organizational tool and a very concrete way to help the students stay on topic. I quickly realized that this method was probably not the easiest for all kids.
While he did fine, I would see him occasionally shuffling through cards and getting them mixed up.
It got me thinking about those students we all have in our classes who have true struggles with organization. Those students might lose research because they misplace or mix up their cards.
As a result, I set out to create an organizer for those students.
Graphic Organizers for Research Writing
One of our graphic organizers follows the same organizational pattern as the index cards.
Instead of separate cards, students write all facts for each paragraph on one sheet of paper.
So for my son’s research paper assignment, he would have had 10 pages to keep in a folder, as opposed to several index cards.
Obviously, students would have one organizer for each paragraph of their paper, no matter the length of the research paper that was assigned.
While my son’s work inspired me to create the first organizer, the collection has grown to include a range of planners. You can browse through the set and choose which fit your classroom best.
One of the great aspects of these organizers is that they provide scaffolding for your writers. Students can choose the tool that works and makes sense to them.
Sometimes we find that students benefit from being able to choose their own.
This is a great way to provide choice and help students be successful.
You can download this set of organizers here:
Multi-Paragraph Graphic Organizer
You might also like our unit of study for writing research papers: How to Write a Research Paper
As with all of our resources, The Curriculum Corner creates these for free classroom use. Our products may not be sold. You may print and copy for your personal classroom use. These are also great for home school families!
You may not modify and resell in any form. Please let us know if you have any questions.
Author Study: Meet Seymour Simon - The Curriculum Corner 4-5-6
Monday 6th of April 2020
[…] Research Graphic Organizers […]
What is a graphic organizer and how to create one?

TABLE OF CONTENTS
Organizing your thoughts and ideas isn't always easy – especially when working with complex topics, piles of information, or collaborative projects.
Use a graphic organizer tool is one of the easiest and most effective ways to organize ideas, list information, and identify trends visually. Using diagrams and visual aids has helped marketers, IT professionals, teachers, and just about anyone to convey complex ideas simply.
In this article, we'll cover the basics of graphic organizers, their types, use cases, and how to make one of your own. Read on to get started.
What is a graphic organizer?
Do you remember the last time you felt inspired and full of ideas? It's an exhilarating feeling, but it can also be overwhelming when trying to organize all the thoughts running wild through your mind.
That's where graphic organizers come in.
These visual tools help harness those complex concepts into a simple visual representation, such as a diagram or graph, that’s easy to understand.
Think of it like a map that connects and organizes your thoughts and ideas in a clear and structured path so that you can see how all the pieces fit together. These tools make it easier to see the big picture and identify connections between concepts that may have otherwise gone unnoticed.

In a collaborative environment, using graphic organizers can greatly enhance communication and teamwork. It's easier for team members to align on project goals and contribute their own insights when there's a visual representation of the ideas and information discussed. As a result, teams have constructive discussions that lead to more brilliant ideas.
Also, with digital collaborative workspaces like Miro, you can even use graphic organizers to collaborate remotely. Team members can brainstorm, organize, and work together from anywhere around the world in one shared space.
You can also treat a graphic organizer like a compass that helps you navigate a sea of information. It guides you towards a clearer path using visual aids so that you or your team can make informed decisions and ride a wave of productivity. But with all that said, how exactly can you put one to use?
Suppose a company that produces and sells handmade soap hasn't been doing well in sales in the last quarter. The marketing team needs help to identify the root cause. The project analyst on the team decides to use a graphic organizer to help analyze the problem and creates a diagram with potential causes, such as pricing, quality, and marketing strategy. Each category is then broken down into subcategories with specific details like customer reviews and competitors’ pricing.
Through this process, the analyst noticed key areas that needed improvement. For example, they noticed that the company’s pricing is significantly higher than competitors, and customer reviews mention that the new packaging makes it hard to understand product benefits.
With this information organized and visually presented, the analyst can present clear, data-driven information to the marketing team to improve sales. The team can then address these issues and track the changes made using the same graphic organizer.
Now that you’ve seen a practical example of applying one, we’ll explore ten types of graphic organizers used in various personal and professional situations.
10 types of graphic organizers
Take a look at how these graphic organizers can help you organize information, analyze problems, and spark new ideas.
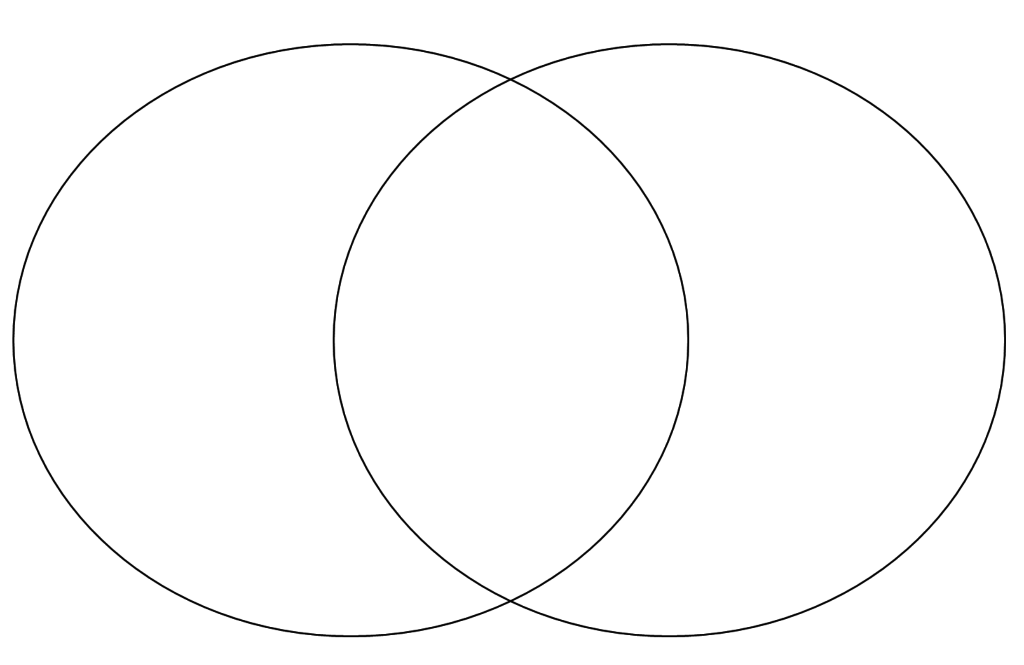
1. Venn diagram
A Venn diagram is a popular graphic organizer that compares and contrasts different topics or datasets using interlocking circles. It shows the similarities and differences between these topics so you can better understand their relationships and connections. The overlapping area in the middle of the circles indicates the similarities, while the separate circles highlight the differences between each.

Use a triple Venn diagram template to compare three different subjects.
2. Tree chart
Like its name, a tree chart is a graphic organizer that shows information in the structure of a tree, with the main topic at the top of the chart and subtopics branching off it. These charts are especially useful for organizing information in a hierarchical structure. For example, when breaking down a group project into smaller manageable items to delegate to the team.

Use a tree chart maker to track objectives and results with a hierarchical structure.
3. Cause and effect chart
You can easily see the connections between actions and results with a cause and effect chart. It’s a powerful tool for analyzing complex issues and identifying possible solutions. Breaking down complicated cause-and-effect relationships into bite-sized chunks helps you better understand how different factors interact and how to achieve your goals more accurately and precisely.

Pinpoint areas of improvement with a cause and effect chart .
4. Compare and contrast graph
Like a Venn diagram, a compare and contrast graph compares two or more things but in a more detailed and structured way. Instead of overlapping circles, you'll see tables or lists placed side by side to highlight the differences and similarities between the topics. This structure helps you quickly see how the topics relate to each other and identify key attributes from each topic.

Analyze prospective jobs with a compare and contrast graph .
5. Story map
A story map, also known as a plot diagram , is a convenient tool for analyzing and understanding the elements of a story, including the plot, setting, characters, and themes. It includes a visual representation of a story’s arc, such as the introduction, climax, and resolution. This graphic organizer is a favorite of educators to help students unravel complex stories. Marketers also use this to craft compelling presentations or proposals that tell a story to engage their audience.

Stay focused on a writing project by story mapping it effortless.
7. Sequence of events chart
If you need to get a clear sense of the chronological order of an event or process, a sequence of events chart is your best bet. By dividing an event into key moments that follow a sequential order, this graphic organizer makes it easy to understand what happened and when. Though often used in educational settings, project managers or event planners rely on it to determine the sequence of activities for their projects or events.

Clarify event logistics using a sequence chart .
8. Star diagram
A star diagram highlights key concepts by organizing related information around a central topic. It’s perfect for scenarios where you need to define a specific topic with detailed descriptions. For example, marketing teams can use this graphic organizer to define key selling features of a new product so they know what to promote. It’s also good for goal setting, with a goal in the center and actionable items in the arms of the star.

Define your problem in detail with a star diagram .
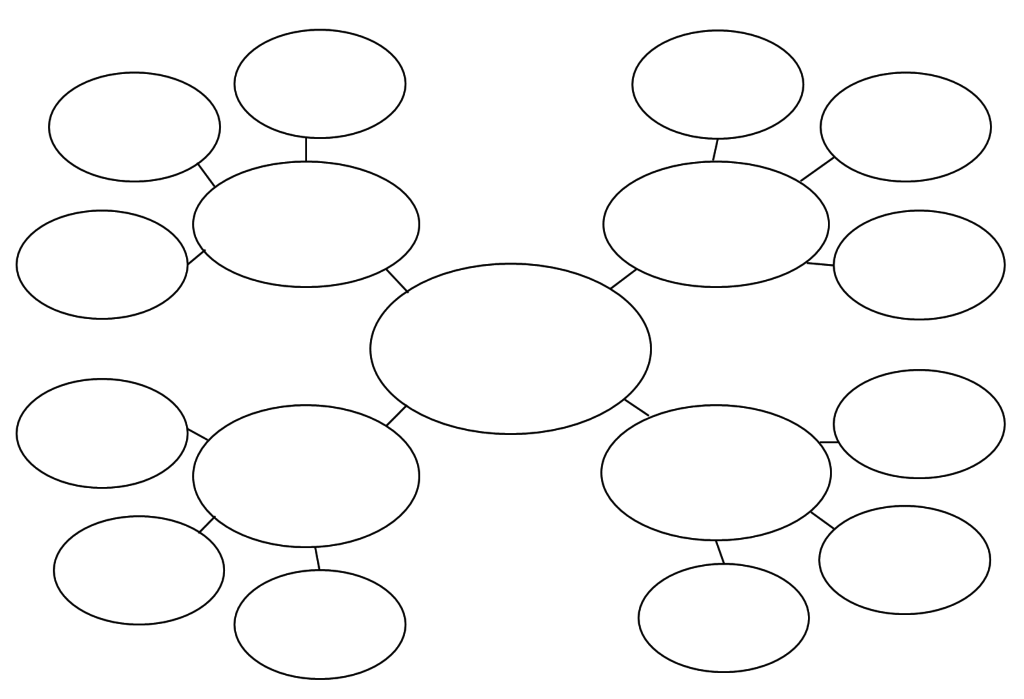
9. Circle map
A circle map is an effective visual tool for brainstorming and organizing ideas. A small circle inside a larger one allows for free-flowing thoughts to be connected to the central idea. Another variation is a concept map , with a main idea in the center and related information or subtopics surrounding it. This graphic organizer is your go-to for generating ideas, solving problems, and making connections between different concepts.

Boost creativity and generate ideas using a concept map maker .
10. Problem-solving chart
You can tackle complex and multi-layered issues with a problem-solving chart. A 5 Whys framework is a popular type of problem-solving chart. It's popular in business settings because it encourages critical and logical thinking and helps evaluate different options to choose the best solution. By dissecting a problem into smaller facets, it becomes easier to identify the root cause and possible solutions.

Get to the bottom of your problem with a 5 Whys problem solving chart .
Use cases for a graphic organizer
Look no further if you're wondering how these graphic organizers can be applied to your life or work. This section will explore how different people and professions can use graphic organizers to achieve their goals.
Marketing and Sales
The world of marketing and sales can be chaotic and overwhelming, but graphic organizers are a valuable tool for keeping things organized and on track. They also promote collaboration by letting teams share visuals and content in one place, making it convenient to view the big picture and expand on new ideas. A story map can help tell a compelling narrative about a product, while a star diagram can help identify and target specific audiences. Marketing and sales teams can stay creative, coordinated, and focused on achieving their goals.
IT and Technology
IT and Technology professionals have a lot of brainpower to share, and that's where graphic organizers shine. In an industry where data is everything, graphic organizers allow experts to visualize network topologies and other architecture quickly, saving time and improving communication with colleagues. They also make sharing concepts a breeze by finding the links between seemingly unrelated objects and ideas. Cause-and-effect charts and entity relationship diagrams are commonly used in the industry to identify the relationships between different events or actions that affect the performance of systems and networks.

Troubleshoot systems and databases using an ER diagram tool .
Business Administration
For a business administrator, the daunting task of managing the departmental structure and changes can be simplified with graphic organizers. Organizational charts, flowcharts, and other visual aids help communicate complex information to staff members. These tools optimize business operations, create more efficient teams, and foster collaboration between management and teams. By streamlining work processes with graphic organizers, departments can save time and resources so the company can run like a well-oiled machine.
Art and Design
As a creator, designer, or artist, it can be challenging to stay inspired, especially during a creative rut. A graphic organizer can break through creative barriers by quickly mapping out ideas, giving creative individuals more space to explore and refine them. Adding a graphic organizer to the creative process leads to more productive, fulfilling, and even out-of-the-box work as the artistic vision takes shape.
When it comes to teaching, graphic organizers are a game-changer. Not only do they help educators and students visually break down complex subjects, but they also promote engagement and collaboration in the classroom. By learning to organize their thoughts visually, students can more intuitively connect ideas, identify relationships, and give their own insights. This creates a more interactive learning environment that builds better comprehension, retention, and critical thinking skills. Whether it's a Venn diagram to compare and contrast, a timeline to sequence events, or a circle map to generate ideas, the possibilities for using graphic organizers in the classroom are endless.
How to make a graphic organizer
Now the question is, how to make a graphic organizer that works for you? Don’t worry - it's simpler than you think. You can create an effective tool for everything you need in just a few steps.
1. Decide what you want to organize
The first step in creating a graphic organizer is simple – decide what you want to organize. This could be anything from project tasks to brainstorming ideas. Before you begin, take a moment to identify the main ideas or concepts you want to capture and categorize. Clarify your goals and objectives to ensure your graphic organizer will be tailored to your needs.
2. Choose a type of graphic organizer
Once you have a clear idea of what you want to organize, it’s time to choose a graphic organizer. Everyone has a unique way of processing information, so a good tip is to find one that aligns with your thoughts. For example, if you prefer to approach tasks step-by-step, a sequence of events graphic organizer is a good fit. If you enjoy seeing the big picture, a circle map will work wonders. The ultimate goal is to find an organizer that complements your thinking process to achieve your purpose.
3. Set up a collaborative workspace
Set up a collaborative workspace to take your productivity to the next level. A collaborative workspace is a shared virtual or physical space where people can work together on a task or project. Online visual collaboration spaces, including popular options like Miro , let you use graphic organizers and other tools to share ideas, organize information, and work more efficiently with others wherever you are.
4. Brainstorm and collaborate
With a collaborative workspace, you can start brainstorming and working with others. A great way to add more depth to your graphic organizer is to generate a range of ideas related to your topic, so you can understand different perspectives or identify blindspots. Collaborating with others and pooling your ideas together further helps you create a detailed graphic organizer that reflects all the key ideas related to your topic.
5. Regularly review and revise
Review and revise your graphic organizer regularly to ensure it's still working for you. Stumbling upon new ideas and information while working on your project is natural, so update them as needed. Set aside time each week to go through your organizer to make any necessary changes so you stay on track and meet your goals. Plus, it's a great way to see your progress and feel motivated to keep going.
Build graphic organizers collaboratively with Miro
In this article, we explored how using graphic organizers helps you visually convey complex ideas, present information, dissect problems, and find solutions. With Miro, our collaborative online workspace, you can collaborate and create graphic organizers with others using tools like digital whiteboards and template libraries. We’re designed for professionals, educators, students, and anyone looking to spice up their workflow. Try Miro today to see how we transform the way you work.
Get on board in seconds
Join thousands of teams using Miro to do their best work yet.
- WordPress.org
- Documentation
- Learn WordPress
- Members Newsfeed
Graphic Organizers 101: Why and How To Use Them
- EdTech & Innovation
Introduction:
Visual learning has gained significant attention over the past few years, especially in the education sector. One such visual learning tool is a “graphic organizer.” This article will explore what graphic organizers are, why they are an essential learning tool, and how to use them effectively.
What are Graphic Organizers?
Simply put, graphic organizers are visual aids that help learners organize and present information visibly. They make use of diagrams, charts, mind maps, or other graphical elements to represent concepts and ideas in a structured manner. By doing so, graphic organizers enable learners to gain a deeper understanding of the subject matter by uncovering connections and relationships between various pieces of information.
Why Use Graphic Organizers?
1. Enhance Understanding: The human brain can process visual content more efficiently than textual data. Graphic organizers capitalize on this by visually representing complex ideas or concepts that might be difficult to understand through text alone.
2. Foster Critical Thinking: By breaking down complex ideas into smaller components, graphic organizers encourage learners to analyze each aspect individually and identify connections between them.
3. Improve Memory Retention: Studies show that information presented visually is retained better than verbal-only material. Thus, using graphic organizers can significantly improve memory retention and recall.
4. Aid in Organization and Planning: Graphic organizers offer an excellent way for students to structure their thoughts and ideas as they plan out essays, projects, or presentations.
5. Facilitate Differentiated Instruction: Since students learn at different paces and with varied styles, graphic organizers serve as a versatile learning tool that can be adapted to suit individual needs.
How To Use Graphic Organizers:
1. Choose the Right Organizer: Begin by selecting a graphic organizer suitable for your specific learning objectives. Some common types include Venn diagrams for comparing/contrasting ideas, timelines for chronological events, or flowcharts for processes.
2. Gather Your Material: Collect the necessary information related to your topic. This might include relevant facts, figures, quotes, or other critical pieces of data.
3. Break Down the Information: Analyze the gathered material and divide it into smaller components or subtopics. These will correspond to individual sections or elements of your graphic organizer.
4. Organize and Represent: Start building your graphic organizer by placing key ideas within their designated sections or boxes. Next, create connections and relationships using arrows, lines, or other visual aids.
5. Simplify and Refine: Finally, review your graphic organizer and simplify or refine the content wherever possible. Ensure that your final result is visually appealing and easy to read.
Conclusion:
Graphic organizers are a powerful tool that can enhance both teaching and learning. By incorporating these aids into classrooms, students can efficiently process information, improve critical thinking skills, memory retention, organizational skills, and cater to different learning styles. Start harnessing the power of these versatile tools today, and witness the positive impact they can have on your educational journey.
Related Articles

Incorporating technology in the classroom is an effective way to engage students…

In the educational arena, Bump It Up walls have become a popular…

Decision making is a critical life skill that allows individuals to navigate…
Pedagogue is a social media network where educators can learn and grow. It's a safe space where they can share advice, strategies, tools, hacks, resources, etc., and work together to improve their teaching skills and the academic performance of the students in their charge.
If you want to collaborate with educators from around the globe, facilitate remote learning, etc., sign up for a free account today and start making connections.
Pedagogue is Free Now, and Free Forever!
- New? Start Here
- Frequently Asked Questions
- Privacy Policy
- Terms of Service
- Registration
Don't you have an account? Register Now! it's really simple and you can start enjoying all the benefits!
We just sent you an Email. Please Open it up to activate your account.
I allow this website to collect and store submitted data.
The Great and Powerful Graphic Organizer
October 22, 2017

Can't find what you are looking for? Contact Us
Listen to this post as a podcast:
Sponsored by Write About and Peergrade
Some of our most powerful instructional tools have been hanging around forever, just waiting for us to notice them.
One of those tools is the graphic organizer. It’s so simple—just a few shapes and lines, nothing fabulous, no bells or whistles—and yet beneath its simplicity lies an absolute dynamo, a vehicle that can cement learning more firmly than a lot of the other stuff we try, in a lot less time.
Let’s look at why graphic organizers are so powerful, explore some ways to use them that you may not have tried, and consider a few important tips for using them with the greatest impact.
Why Graphic Organizers Work So Well
According to Allan Paivio’s theory of dual coding , humans process information in both visual and verbal form. When we see the word “book,” we picture a book in our minds, because we’ve had plenty of real-life experiences with books. When we’re learning new words or concepts, it’s helpful to try to form mental images for those ideas to reinforce their meanings.
While some approaches like doodling and the mind’s eye strategy apply this theory by having learners create physical and mental pictures of concepts, a graphic organizer keeps the words, but arranges them on a page visually so we better understand how concepts are related. Decades of research with various age groups and in different content areas has shown that in general, when graphic organizers are incorporated into instruction, student learning improves (Hall & Strangman, 2002).
Graphic organizers also help us meet the needs of all learners. Presenting information in both text and graphic formats is one of the most basic ways to make a lesson accessible to more students—the basis of Universal Design for Learning —and graphic organizers definitely fit the bill there. In fact, much of the research on graphic organizers has focused on how powerfully they can impact the learning of students with learning disabilities and special needs (Dexter, Park, & Hughes, 2011; Douglas, Ayres, Langone, & Bramlett, 2011).
10 Uses for Graphic Organizers
1. note taking.
Have students use graphic organizers to take notes on their reading, when doing research, while watching a film, or while listening to a podcast. If you are already familiar with the content and how it’s structured, you might choose or design an organizer ahead of time for students, which research says can be more effective and efficient than having students create their own. (See the Tips section below for more information on this.)
2. Lecture Support
Instead of giving a lecture with a standard PowerPoint or an outline, present your content in a graphic organizer. This will instantly give students a way to visualize how the concepts are related to each other. If students ever give their own presentations, have them try using graphic organizers to present their information.
3. Pre-Writing
Having students use graphic organizers to plan and structure their ideas before putting them into a draft is a common practice in English language arts classes. If you’ve never tried it, it’s worth adding this into your writing process, especially if you teach a content area where writing isn’t a regular part of student work. A warning: Do not treat the organizers as the writing piece ; have students just jot notes down in these, rather than complete sentences. The bulk of student writing time should be spent actually drafting their piece.
4. Text Illustrations
When students do expository or argumentative writing, consider having them add a graphic organizer to their finished product to illustrate a concept in their piece. In this case, the organizer would NOT be a pre-writing tool, but a supportive diagram to aid in their own readers’ comprehension. This may not work for all topics, but if a student is writing about how bees make honey, for example, a diagram that shows the process from flower to honey would go a lot further to help the reader understand than a downloaded image of a bee hovering over a flower. As students create diagrams to support their own texts, they will be more likely to pay attention to those that appear in the texts they read.
5. Pre-Reading
As students get older and are faced with more challenging texts, especially in content areas outside of English language arts, their comprehension gets a considerable boost if they are trained to identify the text structure prior to reading (Baxter & Reddy, 2007, p. 23). Some common text structures are compare and contrast, description, problem-solution, cause and effect, and sequence of events . Once the structure has been identified, students can complete a supporting graphic organizer while they read and fill in the components as they encounter them.
Another pre-reading graphic organizer is the KWL chart , which helps activate prior knowledge before reading and primes students to read with a purpose. KWL charts can work for any age group and can be used for single texts or at the beginning, middle, and end of an entire unit.
To read a comprehensive overview of research on graphic organizers as a reading strategy, see Manoli & Papadopoulou, 2012.
6. Assessment
Instead of assessing student learning with a quiz, try having students complete a graphic organizer that shows the relationships between various terms or concepts, or use this type of activity as one question on a quiz or assessment. Although this will not work for all content, it might be just right for evaluating whether a student understands the bigger picture of a body of content.
7. Thinking Tools
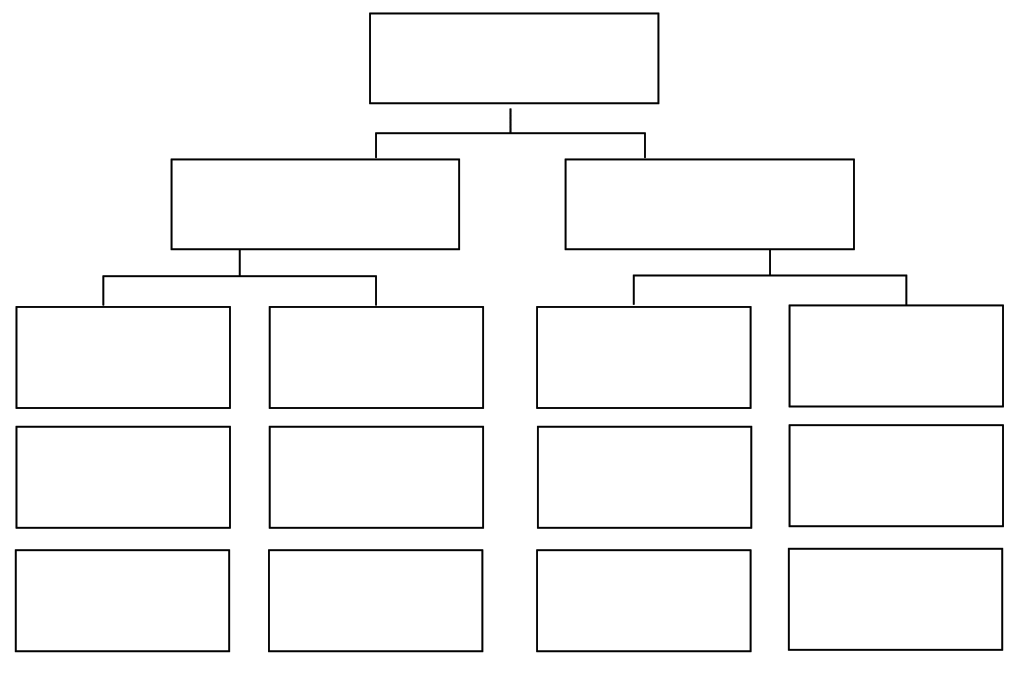
When we deliver content to students through lecture, readings, or video, our next step should be to have students interact with the content in some way. This can be accomplished with class discussions , lab work, or project-based learning . Another simple class activity that gives students a chance to grapple with the content is completing a graphic organizer: In groups, pairs, or even on their own, have students organize chunks of the content into graphic organizers, then compare their results to other groups. For example, if a foreign language class is studying vocabulary words for food, they could use a hierarchical organizer (like the one shown above) to organize “food” words into smaller groups, like meats, fruits, vegetables, and so on. This kind of sorting gives them more interaction with the terms and helps them work with similarities and differences, another powerful instructional strategy.
8. Unit Planning
When introducing a unit to students, show them how the parts of the unit fit together with a graphic organizer. Not only will this give them a sense of where you are in the unit at any given time, it should also help them understand why they are learning the individual parts. Bonus: Doing this exercise yourself could help you decide what concepts are most important for students to learn, and identify other things that may be “nice to know,” but aren’t necessarily vital to student understanding.
9. Classroom Management
Too often we hear “management” and think of dealing with problems, but a huge part of effectively managing a classroom is making your policies, procedures, and expectations crystal clear. Teachers often make signs listing class rules and procedures in writing, but putting the most important ones into graphic form will increase the likelihood that students will follow them.
10. Retrieval Practice
Just recently we covered the power of retrieval practice to help students learn and retain information more effectively. One retrieval practice technique is called a Brain Dump, where students try to recall as much as they can about a given topic, without the aid of any supporting texts. After doing the dump, students are then allowed to check their texts to confirm, correct, or add to the information they retrieved. But if we added a step—having students sort their dumped information into some kind of graphic organizer, possibly even working in pairs to do so— then have them go to the text, it could further solidify the benefit of the retrieval and help them get very clear on where they have gaps in their knowledge.
Tips for Using Graphic Organizers Effectively
- Model how to use the organizers. If students aren’t taught how to use graphic organizers through teacher modeling and guided practice, they won’t get much from them. So take the extra step and model their use.
- Avoid complete sentences. Unless you have a very good reason to insist that students use complete sentences on their organizers, don’t do it. Complete sentences take up too much space, they take longer to write, and the effort to hold students accountable misses the whole point of the organizer. Show students how to use bullet points and sentence fragments to get ideas down and show how they are related.
- For complex material, consider teacher-generated organizers. In a 2007 study, students who were presented with author-created graphic organizers along with reading materials produced evidence of deeper learning in less time than those who had to produce their own graphic organizers (Stull & Mayer, 2007). When you present these to students, consider filling them only partially and having students complete the rest ; this has been shown to help students recall information more effectively and teach them how to take graphic organizer notes on their own (Robinson et al., 2006).
- Let students color outside the lines. Literally. As sketchnotes grow in popularity, educators are starting to recognize the power of doodling as a learning tool. Graphic organizers can be enhanced with small doodles and other notes that fall outside the basic structure of the organizer. As long as the student can still see the original structure and the drawings make sense to him or her, these “enhanced” organizers can reinforce concepts even more deeply.
- Offer a variety of organizers for day-to-day use. Once students become familiar with a certain type of organizer, they may find other uses for it that you haven’t even thought of. If you make these available to them in the same way that you might provide dictionaries or pencil sharpeners, you might find that students start using them even when they haven’t been assigned.
Want Them Ready-Made?
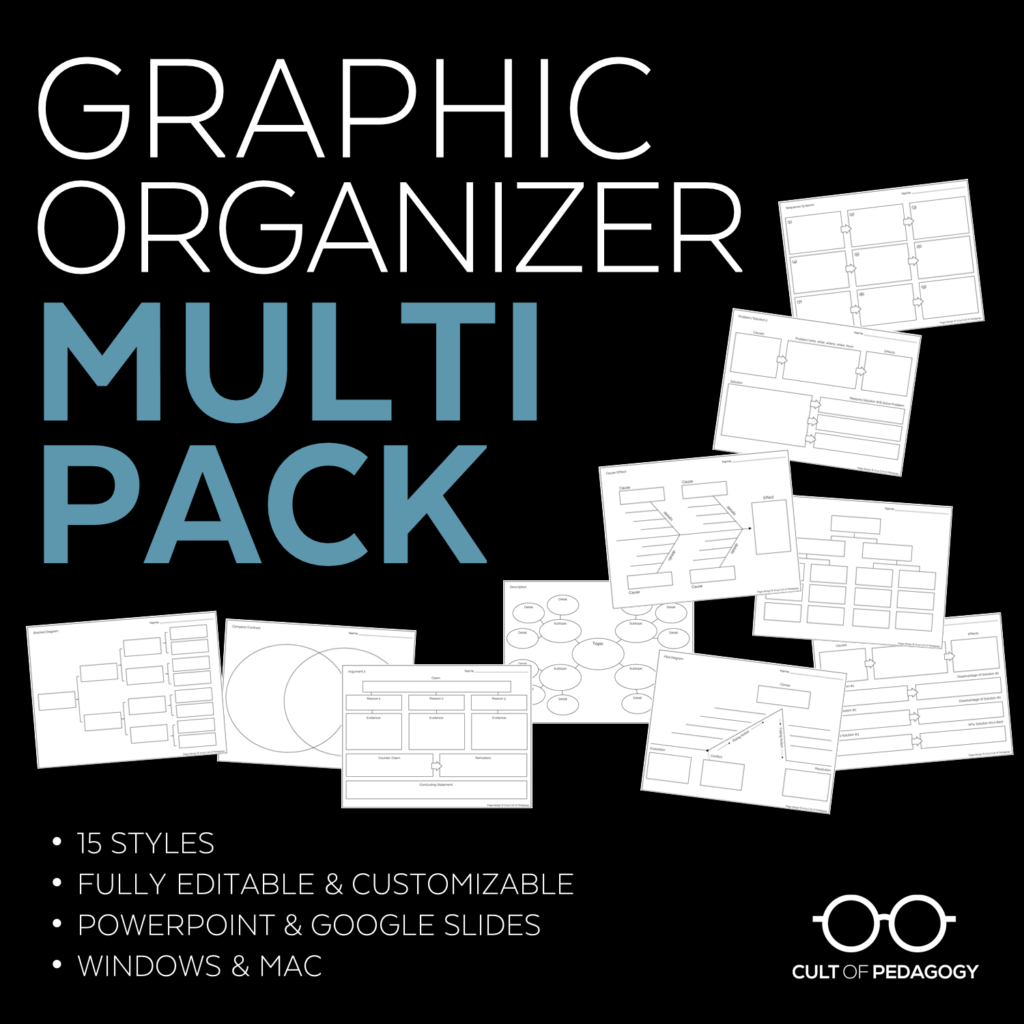
My Graphic Organizer Multi-Pack contains 15 beautiful designs, all done on editable PowerPoints and Google Slides, so you can customize them to suit your needs. The pack also includes video tutorials that show you exactly HOW to customize them. Click here to get a pack for your classroom!
References:
Baxter, S., & Reddy, L. (2007). What content-area teachers should know about adolescent literacy. National Institute for Literacy. Retrieved from https://lincs.ed.gov/publications/pdf/adolescent_literacy07.pdf. PDF
Dexter, D. D., Park, Y. J., & Hughes, C. A. (2011). A meta‐analytic review of graphic organizers and science instruction for adolescents with learning disabilities: Implications for the intermediate and secondary science classroom. Learning Disabilities Research & Practice , 26 (4), 204-213. PDF
Douglas, K. H., Ayres, K. M., Langone, J., & Bramlett, V. B. (2011). The effectiveness of electronic text and pictorial graphic organizers to improve comprehension related to functional skills. Journal of Special Education Technology, 26 (1), 43-56. PDF
Hall, T., & Strangman, N. (2002). Graphic organizers. Wakefield, MA: National Center on Accessing the General Curriculum. Retrieved March 20, 2009. PDF
Manoli, P., & Papadopoulou, M. (2012). Graphic organizers as a reading strategy: Research findings and issues. Creative education, 3 (03), 348. PDF
Robinson, D. H., Katayama, A. D., Beth, A., Odom, S., Hsieh, Y. P., & Vanderveen, A. (2006). Increasing text comprehension and graphic note taking using a partial graphic organizer. The Journal of Educational Research , 100 (2), 103-111. PDF
Stull, A. T., & Mayer, R. E. (2007). Learning by doing versus learning by viewing: Three experimental comparisons of learner-generated versus author-provided graphic organizers. Journal of Educational Psychology , 99 (4), 808. PDF
What to Read Next

Categories: Instruction , Learning Theory , Podcast
Tags: learning & memory , teaching strategies
28 Comments

Hi! I’m very interested in using graphic organizers in my classroom. Does this approach work well in a high school science classroom?

High school science would be a perfect place for graphic organizers! I would suggest starting with uses #2 and #7 if you haven’t used them with students before, but really, all ten would work great in high school science, so dive in!

Hi Chelsea and Jennifer, I teach secondary school science in the UK and love using graphic organisers to help the students make notes, understand the links between different things and make comparisons. e.g. we used Venn diagrams in Year 7 (age 11/12) recently to compare two different specialised cells; and a spider web style organiser to summarise structure and properties of small covalent molecules. Sometimes I prepare graphic organisers with prompts or questions in boxes to help the students complete them ‘independently’. Thank you for your work Jennifer, I love reading your posts, and can’t wait to try out your suggestions in the classroom!

I love your work! I work with new teachers and you have simplified the how and clarified the why. I recommend your work to everyone. I recently shared your Single-Point rubric at a state meeting. Thank you!

Hey Jenn, Another graphic organizer tool for students to use is SmartArt in MS Word or PowerPoint. These are simple shapes preset in various arrangements, but the power is the outline pane that allows you to easily increase or decrease the number of shapes. It’s great in the context of your article because there is not a preset number of “boxes” to fill in. While the teacher can determine which SmartArt arrangement to use, this allows the student to decide how many to make use of. Thanks for the article! I especially like the idea of using a Graphic Organizer as an assessment tool. I plan to try that this week. I’ve started to refer to your weekly topic often in my department meetings. It’s proven to be a great way to start an awesome discussion! –jeff

Jennifer, Thanks for posting this! I love graphic organizers and this is a wonderful resource. I wonder if you have come across David Hyerle’s Thinking Maps in your research on GAs? Here are a couple of links, if you haven’t. I think Hyerle has come up with something really powerful.
http://www.thinkingfoundation.org/ http://www.thebalancebetween.com/
Hyerle also has several books in print. I have no connection with Hyerle, just a big fan.
Thanks so much for these links, James. I have been referred to Thinking Maps over and over, and they seem wonderful. I have to admit, it’s been frustrating, because it’s like standing outside a beautiful store I can’t go into. Everything I’ve read about Thinking Maps indicates that the only way to learn about them is through an in-school training, and since I am no longer in the classroom, I can’t take advantage of that. I really wish they had some kind of online resources for people outside of school systems to learn. I would imagine homeschoolers must feel the same frustration! If you’re aware of how an ordinary Joe like myself can learn more, I’d love to take advantage of it. Thanks.

I’m not a teacher in a classroom, but I’ve started drawing mindmaps in organizing my always racing brain. It really helps to see my ideas laid out in picture form in a nice, logical flowchart. I can see how this technique would be invaluable in the classroom. Thanks for sharing!

Hi Jennifer! I’ve recently discovered your podcast and, as an instructional coach, have taken away great ideas/research to share with my teachers! Looking at your collection of graphic organizers on TPT, I noticed they are recommended for grades 6+. What’s the most effective way to use graphic organizers with elementary school kids? I’ve used them in the past, but always love when I can find research to back it up.

Hi, LeeAnn!
I work for Cult of Pedagogy, and also taught at the elementary level for many years. It’s funny because I remember years ago when I kind of stopped using graphic organizers, because I just didn’t see them making much of an impact on student learning. In hindsight, I think it’s mostly because I really didn’t know how to use them with intention or with an end goal in mind. I needed to be more purposeful and direct with my teaching, helping kids understand how organizers are a tool that helps them plan their ideas, make connections, and see how concepts are related. I think I was using them just to use them, or maybe because some of them looked kinda cute. Now I’m back to graphic organizers with a whole new intention! As with any tool, and with at any age, I think as long as teachers are doing lots of modeling, direct teaching, and being really clear on how and why we use organizers, they’ll be effective. Circles, lines, words, doodles…even with the youngest of kids, are effective when used with intention. As a side note, although Jenn’s organizers say for grades 6+, I’ve used them with younger kids too. In addition to Jenn’s post , here are a few other resources that may interest you. I hope this helps! Teaching and Learning with Graphic Organizers and How to Use Graphic Organizers to Enhance Learning .

Great resource!

Hi Jennifer, Thanks you for this great resource, and for all the great work you do in this space on the craft of teaching! I am a late-starter to the education sector but loving it!
Something that I would like more guidance in, and I think it is related to this area, is the issue of starting an extended response (essay).
A question I often get from students is how do I start the essay, to which my standard response (based on my “How to write an introduction” model: Thesis statement; Roadmap; Glimpse of my conclusion), is to use my classic Essay starter…”This essay offers a discussion / reflection / explanation on…” (This is how I actually used to begin all of my essays at University. I know – I’m just not very creative!). Other tips I would give my students is to use key words from the actual question provided, so that the language is correct, and that they address the question right away. I never suggest that they repeat the question.
I know there isn’t a simple formulaic response but if you can point me in the right direction I would be very grateful.
Kindest regards, Tivoli
I’m thinking that an inductive learning lesson could work really well with helping kids understand what goes into an effective introduction. See what you think!

I think this article is helpful and yet the irony is that there is no graphic organizer to show how this tool can be useful or how to develop them for your content. There are only lists and bullet ponits. Consider adding one?

This author reminded me of the power and effectiveness of graphic organizers in helping students organize, make meaning and see the connections to the items they are learning or thinking about.

This information was a great reminder on the power of GO’s!

I am a very visual person and so I like to use graphic organizers a lot. Good to know it can be beneficial for the students as well.

I teach highly gifted K2. I’m looking for a visual way to help my students (who may be smart, but don’t always like to write) organize their thoughts and get them onto paper (or digital doc)! Do you have suggestions?
If you haven’t already, take a look at the resources below and see what you think. They all offer a way for kids to visually organize and represent their thinking outside of the structure that graphic organizers typically provide.
Hexagonal Thinking: A Colorful Tool for Discussion A Simple Trick for Success with One-Pagers To Boost Higher-Order Thinking, Try Curation Note-Taking: A Research Roundup Dual Coding Strategy
Hope this helps!

These are so useful. I love using graphic organizers (not all fit every student). I love the jotting note part instead of using it as the whole paper!

Fantastic knowledge and reminders of how impactful graphic organizers can be for students to have as a resources to gather and collect their thoughts and ideas.

Great reminders.

This was such a great reminder of how powerful graphic organizers are. They are a simple tool with endless opportunities to enhance learning. I love the idea of having a student create a G.O. as a text illustration for a piece of writing that they do. This encourages reflection, metacognitive thinking, and deeper thinking.

We’re so glad you enjoyed the post, Erica!

What is more effective for grades 4-6, digital or paper graphic organizers. Same question for grades 6-8?
Hi Deb, Now that we have so many amazing digital resources, it can feel like we need to incorporate them into our lessons all the time. Though there doesn’t seem to be a definitive answer in terms of one being more effective, teachers can still use both. Certain activities might make sense with one over the other, or if given a choice, students might demonstrate a preference. If you’re looking for ideas on making your lessons more tech-friendly, try 16 Ideas for Student Projects Using Google Docs, Slides, and Forms . And if you’re thinking about whether your tech tools are actually helping your students meet their learning goals, this article, Quality-Check Your Tech: 6 Strategies might be helpful as well.

My students have a tendency to want to use graphic organizers as a first draft rather than a list of ideas. Do you have a strategy for teaching how to put ideas into bullet points rather than going straight to sentence writing?

Felicia, if you haven’t already, check out the section Tips for Using Graphic Organizers Effectively at the end of this post. One simple, but effective, strategy for teaching students how to capture their ideas using bullet points is modeling and guided practice. For instance, you might consider creating a partially-generated graphic organizer to accompany a complex text. This would serve not only to scaffold the text itself, but also to provide guided practice for students in the use of graphic organizers. I hope this helps!
Leave a Reply
Your email address will not be published.
Iowa Reading Research Center
Reading graphic organizers.
Asking Questions Graphic Organizer (PreK-Grade 4)
This organizer helps readers develop comprehension skills by learning how to ask questions and look for the answers in a text.
Asking Questions Graphic Organizer (Grades 5-12)
Book vs. Movie - Compare and Contrast
This graphic organizer helps children organize their thoughts about the similarities and differences between a book and a movie telling the same story. Comparing books and their movie adaptations can help motivate students to read and dig deeper into some elements of the text.
Cause and Effect Graphic Organizer
Students can be taught to use this graphic organizer to identify and record events that occur in a text (effect) and the reason why that event occurred (cause).
Compound Word Meaning
With this graphic organizer, children can identify and define the two words that were combined to make a compound word and use that information to define the compound word. This can help develop morphological knowledge, or the ability to identify and manipulate the smallest units of meaning within a word.
Context Clue Graphic Organizer
Students can identify and keep track of context clues using this graphic organizer by writing down the unfamiliar word, the type of context clue, and the word meaning. Context clues help readers determine the meaning of new words.
Forming Opinions
This tool helps users organize their thoughts and learn to form opinions about their reading.
"Forming Opinions" graphic organizer
Improve Your Writing Using Mentor Texts
Questions about a mentor text can guide discussion, help students organize their thoughts, and identify techniques and approaches from the example of good writing that students can use. The organizer can be used in a group or individual setting.
K-W-L Chart
This chart can be filled out by children when reading at home in order to support activation of background knowledge about the topic of a text they are reading. This is intended to help them better understand the text.
Making and Evaluating Predictions
This graphic organizer helps students write down evidence they find in a text, make a prediction based on that evidence, write down any new evidence they find, and evaluate the prediction they made. Making predictions is a way for students to better comprehend a given text.
Making Inferences
Using two prompts, users will be able to use this organizer to practice inferencing skills, which are critical for reading comprehension.
"Making Inferences" graphic organizer
POSSUM Graphic Organizer
Educators can use this graphic organizer in the classroom to structure vocabulary learning and help students work through all six elements of the POSSUM approach. Caregivers may also use this resource to support vocabulary learning while reading with their children at home.
Problem-Solution Text Structure Resources
The Problem-Soultion Text Structure Map is a graphic organizer that students can use to organize the structure of a text. This also includes a rubric for educators.
Sequencing Graphic Organizer
Children can use this graphic organizer for recording the characters, settings, and events of a story. This graphic organizer can be used to help your child identify the elements while reading or listening to a story.
Students can be taught to use this graphic organizer as a part of a comprehension strategy to show the elements of a narrative text and check themselves for understanding of those elements.
Suffix Dictionary
A graphic organizer to record the meaning of suffixes in words by writing down the word ending, whether the word is an adjective or a noun, and the meaning of the suffix.
Theme Development Tracker
Adolescents can use this resource to identify themes in literary texts and record textual details that introduce and develop the themes.
What Am I Thinking Organizer
Users of this tool are encouraged to write down their thoughts about a text in four different ways (opinion, reaction, connection, and visualization) and provide reasons from the text for their thoughts.
"What Am I Thinking" graphic organizer
Word Box Template
A graphic organizer designed to help students determine which letters represent the sounds heard in a given word. A graphic representing the word is provided with blank spaces for each sound to be filled in. Both a three-space and six-space word box are included.
Writing an Objective Summary
With this resource that includes a graphic organizer, children follow a step-by-step set of instructions that leads them to write an objective summary of a text. The summary does not include any opinions or judgments.
Argumentative Research Paper Introduction Paragraph Graphic Organizer
Description
When preparing to write an argumentative research paper, this resource is an excellent graphic organizer to prepare thoughts logically from beginning to end!
Questions & Answers
The crafted classroom - katie cooper.
- We're hiring
- Help & FAQ
- Privacy policy
- Student privacy
- Terms of service
- Tell us what you think
IMAGES
VIDEO
COMMENTS
In this Research Paper Graphic Organizer, we can see that it features both. It can be used as an organizer for the layout of the paper, and it can also be used to write the notes thanks to the dedicated 'Notes' section. ... On the first page, you get a blank space which is where the crux or the introduction of the paper will go. After that ...
Graphic Organizers for Research Papers, Spring 2023. 1 of 6 Graphic Organizers for Research Papers A graphic organizer (also referred to as a research matrix) is a useful tool for compiling detailed notes during the research process. These types of note-taking systems can take a long time to
Research Paper Graphic Organizer . Introduction 3-4 general facts about topic: Thesis statement: Body Paragraph 1 Topic Sentence: ... introduction and restate it in your conclusion. Include topic sentences and transition/concluding sentences for each body paragraph. Each
Helps you visualize your research and how elements connect with each other. Enhance your essays, summaries and research papers with visual elements. Track correlations between your thoughts, observations, facts or general ideas. When it comes to essay writing, the most common graphic organizers are webs, mind maps, and concept maps.
Research PaperResearch Paper Graphic Organizer Graphic Organizer OUTLINE. Outlining Your Introduction Paragraph Hook sentence (Get the reader's attention): ... Microsoft Word - Research Paper Graphic Organizer.doc Author: jsanchez
That's where a research paper graphic organizer can be a student's greatest ally. Research Paper Graphic Organizer (Click on image to modify online) ... Now, come up with an introduction that sets the stage for your argument and a conclusion that wraps up and restates your thesis and supporting arguments in a compelling way. Now you have a ...
Help students to plan and prepare their research paper with this graphic organizer template. This printable research graphic organizer is designed to help students synthesize their sources and ideas in order to ensure that they are ready to write. The template includes sections for students to outline the introduction, body paragraphs, and ...
Table of contents. Step 1: Introduce your topic. Step 2: Describe the background. Step 3: Establish your research problem. Step 4: Specify your objective (s) Step 5: Map out your paper. Research paper introduction examples. Frequently asked questions about the research paper introduction.
This printable research graphic organizer is designed to help students synthesize their sources and ideas in order to ensure that they are ready to write. The template includes sections for students to outline the introduction, body paragraphs, and conclusions, allowing them to organize and plan their research papers effectively.
Writing a Group Research Report (Gr. 1) Use this printable writing packet to teach your students how to write a group research report. A graphic organizer…. Browse our printable Writing Research Papers Graphic Organizers resources for your classroom. Download free today!
Graphic Organizers for Research Writing. One of our graphic organizers follows the same organizational pattern as the index cards. Instead of separate cards, students write all facts for each paragraph on one sheet of paper. So for my son's research paper assignment, he would have had 10 pages to keep in a folder, as opposed to several index ...
Through use of graphic organizers, students have a structure for abstract ideas. Graphic organizers can be categorized in many ways according to the way they arrange information: hierarchical, conceptual, sequential, or cyclical (Bromley, Irwin-DeVitis, & Modlo, 1995). Some graphic organizers focus on one particular content area.
This study looked at the outcome of using graphic organizers to improve student. outcomes in the content area of science for students with special needs in an inclusion. class in a high school in New Jersey. In total, there were five participants in this study. who were all eligible for special education services.
1. Decide what you want to organize. The first step in creating a graphic organizer is simple - decide what you want to organize. This could be anything from project tasks to brainstorming ideas. Before you begin, take a moment to identify the main ideas or concepts you want to capture and categorize.
Simply put, graphic organizers are visual aids that help learners organize and present information visibly. They make use of diagrams, charts, mind maps, or other graphical elements to represent concepts and ideas in a structured manner. By doing so, graphic organizers enable learners to gain a deeper understanding of the subject matter by ...
Hi Chelsea and Jennifer, I teach secondary school science in the UK and love using graphic organisers to help the students make notes, understand the links between different things and make comparisons. e.g. we used Venn diagrams in Year 7 (age 11/12) recently to compare two different specialised cells; and a spider web style organiser to summarise structure and properties of small covalent ...
Student Research Submissions Spring 5-4-2015 The Effectiveness of Graphic Organizers on Students' Attitudes Towards, Approaches to, and Accuracy When Solving Word Problems Kelly Glazebrook ... EFFECTIVENESS OF GRAPHIC ORGANIZERS 3 . Introduction . Over the past few years, mathematics education has begun to shift away from the classic ...
visuals, graphic organizers. show relationships and. connections between. concepts, terms, and facts. Benefits of graphic organiz ers. • Help visualize or present information in a way that is ...
Graphic organizers are visual elements with which readers indicate clusters of ideas or concepts in the form of words, phrases or sentences (McKnight, 2010; McLaughlin & Overturf, 2013; Tarquin & Walker, 1997). In its basic form of a graphic organizer, readers draw a concept or word in the middle of a piece of paper or a screen and add related ...
The first instrument was a graphic observation checklist comprising seven graphic organizers (GOs); these were the Big Question Map, Circle Organizer, Discussion Map, Compare-Contrast Matrix, Venn Diagram, Cause and Effect, Story Map and Time Line (Alshatti, 2012). They were introduced to the literature teachers in the two GBS by the researchers.
Word Box Template. A graphic organizer designed to help students determine which letters represent the sounds heard in a given word. A graphic representing the word is provided with blank spaces for each sound to be filled in. Both a three-space and six-space word box are included. Word Box Template.
CCSS CCRA.W.1. Write arguments to support claims in an analysis of substantive topics or texts, using valid reasoning and relevant and sufficient evidence. See all 6 resources. When preparing to write an argumentative research paper, this resource is an excellent graphic organizer to prepare thoughts logically from beginning to end!