
Research Design 101
Everything You Need To Get Started (With Examples)
By: Derek Jansen (MBA) | Reviewers: Eunice Rautenbach (DTech) & Kerryn Warren (PhD) | April 2023

Navigating the world of research can be daunting, especially if you’re a first-time researcher. One concept you’re bound to run into fairly early in your research journey is that of “ research design ”. Here, we’ll guide you through the basics using practical examples , so that you can approach your research with confidence.
Overview: Research Design 101
What is research design.
- Research design types for quantitative studies
- Video explainer : quantitative research design
- Research design types for qualitative studies
- Video explainer : qualitative research design
- How to choose a research design
- Key takeaways
Research design refers to the overall plan, structure or strategy that guides a research project , from its conception to the final data analysis. A good research design serves as the blueprint for how you, as the researcher, will collect and analyse data while ensuring consistency, reliability and validity throughout your study.
Understanding different types of research designs is essential as helps ensure that your approach is suitable given your research aims, objectives and questions , as well as the resources you have available to you. Without a clear big-picture view of how you’ll design your research, you run the risk of potentially making misaligned choices in terms of your methodology – especially your sampling , data collection and data analysis decisions.
The problem with defining research design…
One of the reasons students struggle with a clear definition of research design is because the term is used very loosely across the internet, and even within academia.
Some sources claim that the three research design types are qualitative, quantitative and mixed methods , which isn’t quite accurate (these just refer to the type of data that you’ll collect and analyse). Other sources state that research design refers to the sum of all your design choices, suggesting it’s more like a research methodology . Others run off on other less common tangents. No wonder there’s confusion!
In this article, we’ll clear up the confusion. We’ll explain the most common research design types for both qualitative and quantitative research projects, whether that is for a full dissertation or thesis, or a smaller research paper or article.

Research Design: Quantitative Studies
Quantitative research involves collecting and analysing data in a numerical form. Broadly speaking, there are four types of quantitative research designs: descriptive , correlational , experimental , and quasi-experimental .
Descriptive Research Design
As the name suggests, descriptive research design focuses on describing existing conditions, behaviours, or characteristics by systematically gathering information without manipulating any variables. In other words, there is no intervention on the researcher’s part – only data collection.
For example, if you’re studying smartphone addiction among adolescents in your community, you could deploy a survey to a sample of teens asking them to rate their agreement with certain statements that relate to smartphone addiction. The collected data would then provide insight regarding how widespread the issue may be – in other words, it would describe the situation.
The key defining attribute of this type of research design is that it purely describes the situation . In other words, descriptive research design does not explore potential relationships between different variables or the causes that may underlie those relationships. Therefore, descriptive research is useful for generating insight into a research problem by describing its characteristics . By doing so, it can provide valuable insights and is often used as a precursor to other research design types.
Correlational Research Design
Correlational design is a popular choice for researchers aiming to identify and measure the relationship between two or more variables without manipulating them . In other words, this type of research design is useful when you want to know whether a change in one thing tends to be accompanied by a change in another thing.
For example, if you wanted to explore the relationship between exercise frequency and overall health, you could use a correlational design to help you achieve this. In this case, you might gather data on participants’ exercise habits, as well as records of their health indicators like blood pressure, heart rate, or body mass index. Thereafter, you’d use a statistical test to assess whether there’s a relationship between the two variables (exercise frequency and health).
As you can see, correlational research design is useful when you want to explore potential relationships between variables that cannot be manipulated or controlled for ethical, practical, or logistical reasons. It is particularly helpful in terms of developing predictions , and given that it doesn’t involve the manipulation of variables, it can be implemented at a large scale more easily than experimental designs (which will look at next).
That said, it’s important to keep in mind that correlational research design has limitations – most notably that it cannot be used to establish causality . In other words, correlation does not equal causation . To establish causality, you’ll need to move into the realm of experimental design, coming up next…
Need a helping hand?
Experimental Research Design
Experimental research design is used to determine if there is a causal relationship between two or more variables . With this type of research design, you, as the researcher, manipulate one variable (the independent variable) while controlling others (dependent variables). Doing so allows you to observe the effect of the former on the latter and draw conclusions about potential causality.
For example, if you wanted to measure if/how different types of fertiliser affect plant growth, you could set up several groups of plants, with each group receiving a different type of fertiliser, as well as one with no fertiliser at all. You could then measure how much each plant group grew (on average) over time and compare the results from the different groups to see which fertiliser was most effective.
Overall, experimental research design provides researchers with a powerful way to identify and measure causal relationships (and the direction of causality) between variables. However, developing a rigorous experimental design can be challenging as it’s not always easy to control all the variables in a study. This often results in smaller sample sizes , which can reduce the statistical power and generalisability of the results.
Moreover, experimental research design requires random assignment . This means that the researcher needs to assign participants to different groups or conditions in a way that each participant has an equal chance of being assigned to any group (note that this is not the same as random sampling ). Doing so helps reduce the potential for bias and confounding variables . This need for random assignment can lead to ethics-related issues . For example, withholding a potentially beneficial medical treatment from a control group may be considered unethical in certain situations.
Quasi-Experimental Research Design
Quasi-experimental research design is used when the research aims involve identifying causal relations , but one cannot (or doesn’t want to) randomly assign participants to different groups (for practical or ethical reasons). Instead, with a quasi-experimental research design, the researcher relies on existing groups or pre-existing conditions to form groups for comparison.
For example, if you were studying the effects of a new teaching method on student achievement in a particular school district, you may be unable to randomly assign students to either group and instead have to choose classes or schools that already use different teaching methods. This way, you still achieve separate groups, without having to assign participants to specific groups yourself.
Naturally, quasi-experimental research designs have limitations when compared to experimental designs. Given that participant assignment is not random, it’s more difficult to confidently establish causality between variables, and, as a researcher, you have less control over other variables that may impact findings.
All that said, quasi-experimental designs can still be valuable in research contexts where random assignment is not possible and can often be undertaken on a much larger scale than experimental research, thus increasing the statistical power of the results. What’s important is that you, as the researcher, understand the limitations of the design and conduct your quasi-experiment as rigorously as possible, paying careful attention to any potential confounding variables .

Research Design: Qualitative Studies
There are many different research design types when it comes to qualitative studies, but here we’ll narrow our focus to explore the “Big 4”. Specifically, we’ll look at phenomenological design, grounded theory design, ethnographic design, and case study design.
Phenomenological Research Design
Phenomenological design involves exploring the meaning of lived experiences and how they are perceived by individuals. This type of research design seeks to understand people’s perspectives , emotions, and behaviours in specific situations. Here, the aim for researchers is to uncover the essence of human experience without making any assumptions or imposing preconceived ideas on their subjects.
For example, you could adopt a phenomenological design to study why cancer survivors have such varied perceptions of their lives after overcoming their disease. This could be achieved by interviewing survivors and then analysing the data using a qualitative analysis method such as thematic analysis to identify commonalities and differences.
Phenomenological research design typically involves in-depth interviews or open-ended questionnaires to collect rich, detailed data about participants’ subjective experiences. This richness is one of the key strengths of phenomenological research design but, naturally, it also has limitations. These include potential biases in data collection and interpretation and the lack of generalisability of findings to broader populations.
Grounded Theory Research Design
Grounded theory (also referred to as “GT”) aims to develop theories by continuously and iteratively analysing and comparing data collected from a relatively large number of participants in a study. It takes an inductive (bottom-up) approach, with a focus on letting the data “speak for itself”, without being influenced by preexisting theories or the researcher’s preconceptions.
As an example, let’s assume your research aims involved understanding how people cope with chronic pain from a specific medical condition, with a view to developing a theory around this. In this case, grounded theory design would allow you to explore this concept thoroughly without preconceptions about what coping mechanisms might exist. You may find that some patients prefer cognitive-behavioural therapy (CBT) while others prefer to rely on herbal remedies. Based on multiple, iterative rounds of analysis, you could then develop a theory in this regard, derived directly from the data (as opposed to other preexisting theories and models).
Grounded theory typically involves collecting data through interviews or observations and then analysing it to identify patterns and themes that emerge from the data. These emerging ideas are then validated by collecting more data until a saturation point is reached (i.e., no new information can be squeezed from the data). From that base, a theory can then be developed .
As you can see, grounded theory is ideally suited to studies where the research aims involve theory generation , especially in under-researched areas. Keep in mind though that this type of research design can be quite time-intensive , given the need for multiple rounds of data collection and analysis.

Ethnographic Research Design
Ethnographic design involves observing and studying a culture-sharing group of people in their natural setting to gain insight into their behaviours, beliefs, and values. The focus here is on observing participants in their natural environment (as opposed to a controlled environment). This typically involves the researcher spending an extended period of time with the participants in their environment, carefully observing and taking field notes .
All of this is not to say that ethnographic research design relies purely on observation. On the contrary, this design typically also involves in-depth interviews to explore participants’ views, beliefs, etc. However, unobtrusive observation is a core component of the ethnographic approach.
As an example, an ethnographer may study how different communities celebrate traditional festivals or how individuals from different generations interact with technology differently. This may involve a lengthy period of observation, combined with in-depth interviews to further explore specific areas of interest that emerge as a result of the observations that the researcher has made.
As you can probably imagine, ethnographic research design has the ability to provide rich, contextually embedded insights into the socio-cultural dynamics of human behaviour within a natural, uncontrived setting. Naturally, however, it does come with its own set of challenges, including researcher bias (since the researcher can become quite immersed in the group), participant confidentiality and, predictably, ethical complexities . All of these need to be carefully managed if you choose to adopt this type of research design.
Case Study Design
With case study research design, you, as the researcher, investigate a single individual (or a single group of individuals) to gain an in-depth understanding of their experiences, behaviours or outcomes. Unlike other research designs that are aimed at larger sample sizes, case studies offer a deep dive into the specific circumstances surrounding a person, group of people, event or phenomenon, generally within a bounded setting or context .
As an example, a case study design could be used to explore the factors influencing the success of a specific small business. This would involve diving deeply into the organisation to explore and understand what makes it tick – from marketing to HR to finance. In terms of data collection, this could include interviews with staff and management, review of policy documents and financial statements, surveying customers, etc.
While the above example is focused squarely on one organisation, it’s worth noting that case study research designs can have different variation s, including single-case, multiple-case and longitudinal designs. As you can see in the example, a single-case design involves intensely examining a single entity to understand its unique characteristics and complexities. Conversely, in a multiple-case design , multiple cases are compared and contrasted to identify patterns and commonalities. Lastly, in a longitudinal case design , a single case or multiple cases are studied over an extended period of time to understand how factors develop over time.
As you can see, a case study research design is particularly useful where a deep and contextualised understanding of a specific phenomenon or issue is desired. However, this strength is also its weakness. In other words, you can’t generalise the findings from a case study to the broader population. So, keep this in mind if you’re considering going the case study route.

How To Choose A Research Design
Having worked through all of these potential research designs, you’d be forgiven for feeling a little overwhelmed and wondering, “ But how do I decide which research design to use? ”. While we could write an entire post covering that alone, here are a few factors to consider that will help you choose a suitable research design for your study.
Data type: The first determining factor is naturally the type of data you plan to be collecting – i.e., qualitative or quantitative. This may sound obvious, but we have to be clear about this – don’t try to use a quantitative research design on qualitative data (or vice versa)!
Research aim(s) and question(s): As with all methodological decisions, your research aim and research questions will heavily influence your research design. For example, if your research aims involve developing a theory from qualitative data, grounded theory would be a strong option. Similarly, if your research aims involve identifying and measuring relationships between variables, one of the experimental designs would likely be a better option.
Time: It’s essential that you consider any time constraints you have, as this will impact the type of research design you can choose. For example, if you’ve only got a month to complete your project, a lengthy design such as ethnography wouldn’t be a good fit.
Resources: Take into account the resources realistically available to you, as these need to factor into your research design choice. For example, if you require highly specialised lab equipment to execute an experimental design, you need to be sure that you’ll have access to that before you make a decision.
Keep in mind that when it comes to research, it’s important to manage your risks and play as conservatively as possible. If your entire project relies on you achieving a huge sample, having access to niche equipment or holding interviews with very difficult-to-reach participants, you’re creating risks that could kill your project. So, be sure to think through your choices carefully and make sure that you have backup plans for any existential risks. Remember that a relatively simple methodology executed well generally will typically earn better marks than a highly-complex methodology executed poorly.

Recap: Key Takeaways
We’ve covered a lot of ground here. Let’s recap by looking at the key takeaways:
- Research design refers to the overall plan, structure or strategy that guides a research project, from its conception to the final analysis of data.
- Research designs for quantitative studies include descriptive , correlational , experimental and quasi-experimenta l designs.
- Research designs for qualitative studies include phenomenological , grounded theory , ethnographic and case study designs.
- When choosing a research design, you need to consider a variety of factors, including the type of data you’ll be working with, your research aims and questions, your time and the resources available to you.
If you need a helping hand with your research design (or any other aspect of your research), check out our private coaching services .

Psst... there’s more!
This post was based on one of our popular Research Bootcamps . If you're working on a research project, you'll definitely want to check this out ...
You Might Also Like:

Is there any blog article explaining more on Case study research design? Is there a Case study write-up template? Thank you.

Thanks this was quite valuable to clarify such an important concept.

Thanks for this simplified explanations. it is quite very helpful.

This was really helpful. thanks

Thank you for your explanation. I think case study research design and the use of secondary data in researches needs to be talked about more in your videos and articles because there a lot of case studies research design tailored projects out there.
Please is there any template for a case study research design whose data type is a secondary data on your repository?

This post is very clear, comprehensive and has been very helpful to me. It has cleared the confusion I had in regard to research design and methodology.

This post is helpful, easy to understand, and deconstructs what a research design is. Thanks

how to cite this page

Thank you very much for the post. It is wonderful and has cleared many worries in my mind regarding research designs. I really appreciate .
Submit a Comment Cancel reply
Your email address will not be published. Required fields are marked *
Save my name, email, and website in this browser for the next time I comment.
- Print Friendly
- Privacy Policy
Home » Research Design – Types, Methods and Examples
Research Design – Types, Methods and Examples
Table of Contents

Research Design
Definition:
Research design refers to the overall strategy or plan for conducting a research study. It outlines the methods and procedures that will be used to collect and analyze data, as well as the goals and objectives of the study. Research design is important because it guides the entire research process and ensures that the study is conducted in a systematic and rigorous manner.
Types of Research Design
Types of Research Design are as follows:
Descriptive Research Design
This type of research design is used to describe a phenomenon or situation. It involves collecting data through surveys, questionnaires, interviews, and observations. The aim of descriptive research is to provide an accurate and detailed portrayal of a particular group, event, or situation. It can be useful in identifying patterns, trends, and relationships in the data.
Correlational Research Design
Correlational research design is used to determine if there is a relationship between two or more variables. This type of research design involves collecting data from participants and analyzing the relationship between the variables using statistical methods. The aim of correlational research is to identify the strength and direction of the relationship between the variables.
Experimental Research Design
Experimental research design is used to investigate cause-and-effect relationships between variables. This type of research design involves manipulating one variable and measuring the effect on another variable. It usually involves randomly assigning participants to groups and manipulating an independent variable to determine its effect on a dependent variable. The aim of experimental research is to establish causality.
Quasi-experimental Research Design
Quasi-experimental research design is similar to experimental research design, but it lacks one or more of the features of a true experiment. For example, there may not be random assignment to groups or a control group. This type of research design is used when it is not feasible or ethical to conduct a true experiment.
Case Study Research Design
Case study research design is used to investigate a single case or a small number of cases in depth. It involves collecting data through various methods, such as interviews, observations, and document analysis. The aim of case study research is to provide an in-depth understanding of a particular case or situation.
Longitudinal Research Design
Longitudinal research design is used to study changes in a particular phenomenon over time. It involves collecting data at multiple time points and analyzing the changes that occur. The aim of longitudinal research is to provide insights into the development, growth, or decline of a particular phenomenon over time.
Structure of Research Design
The format of a research design typically includes the following sections:
- Introduction : This section provides an overview of the research problem, the research questions, and the importance of the study. It also includes a brief literature review that summarizes previous research on the topic and identifies gaps in the existing knowledge.
- Research Questions or Hypotheses: This section identifies the specific research questions or hypotheses that the study will address. These questions should be clear, specific, and testable.
- Research Methods : This section describes the methods that will be used to collect and analyze data. It includes details about the study design, the sampling strategy, the data collection instruments, and the data analysis techniques.
- Data Collection: This section describes how the data will be collected, including the sample size, data collection procedures, and any ethical considerations.
- Data Analysis: This section describes how the data will be analyzed, including the statistical techniques that will be used to test the research questions or hypotheses.
- Results : This section presents the findings of the study, including descriptive statistics and statistical tests.
- Discussion and Conclusion : This section summarizes the key findings of the study, interprets the results, and discusses the implications of the findings. It also includes recommendations for future research.
- References : This section lists the sources cited in the research design.
Example of Research Design
An Example of Research Design could be:
Research question: Does the use of social media affect the academic performance of high school students?
Research design:
- Research approach : The research approach will be quantitative as it involves collecting numerical data to test the hypothesis.
- Research design : The research design will be a quasi-experimental design, with a pretest-posttest control group design.
- Sample : The sample will be 200 high school students from two schools, with 100 students in the experimental group and 100 students in the control group.
- Data collection : The data will be collected through surveys administered to the students at the beginning and end of the academic year. The surveys will include questions about their social media usage and academic performance.
- Data analysis : The data collected will be analyzed using statistical software. The mean scores of the experimental and control groups will be compared to determine whether there is a significant difference in academic performance between the two groups.
- Limitations : The limitations of the study will be acknowledged, including the fact that social media usage can vary greatly among individuals, and the study only focuses on two schools, which may not be representative of the entire population.
- Ethical considerations: Ethical considerations will be taken into account, such as obtaining informed consent from the participants and ensuring their anonymity and confidentiality.
How to Write Research Design
Writing a research design involves planning and outlining the methodology and approach that will be used to answer a research question or hypothesis. Here are some steps to help you write a research design:
- Define the research question or hypothesis : Before beginning your research design, you should clearly define your research question or hypothesis. This will guide your research design and help you select appropriate methods.
- Select a research design: There are many different research designs to choose from, including experimental, survey, case study, and qualitative designs. Choose a design that best fits your research question and objectives.
- Develop a sampling plan : If your research involves collecting data from a sample, you will need to develop a sampling plan. This should outline how you will select participants and how many participants you will include.
- Define variables: Clearly define the variables you will be measuring or manipulating in your study. This will help ensure that your results are meaningful and relevant to your research question.
- Choose data collection methods : Decide on the data collection methods you will use to gather information. This may include surveys, interviews, observations, experiments, or secondary data sources.
- Create a data analysis plan: Develop a plan for analyzing your data, including the statistical or qualitative techniques you will use.
- Consider ethical concerns : Finally, be sure to consider any ethical concerns related to your research, such as participant confidentiality or potential harm.
When to Write Research Design
Research design should be written before conducting any research study. It is an important planning phase that outlines the research methodology, data collection methods, and data analysis techniques that will be used to investigate a research question or problem. The research design helps to ensure that the research is conducted in a systematic and logical manner, and that the data collected is relevant and reliable.
Ideally, the research design should be developed as early as possible in the research process, before any data is collected. This allows the researcher to carefully consider the research question, identify the most appropriate research methodology, and plan the data collection and analysis procedures in advance. By doing so, the research can be conducted in a more efficient and effective manner, and the results are more likely to be valid and reliable.
Purpose of Research Design
The purpose of research design is to plan and structure a research study in a way that enables the researcher to achieve the desired research goals with accuracy, validity, and reliability. Research design is the blueprint or the framework for conducting a study that outlines the methods, procedures, techniques, and tools for data collection and analysis.
Some of the key purposes of research design include:
- Providing a clear and concise plan of action for the research study.
- Ensuring that the research is conducted ethically and with rigor.
- Maximizing the accuracy and reliability of the research findings.
- Minimizing the possibility of errors, biases, or confounding variables.
- Ensuring that the research is feasible, practical, and cost-effective.
- Determining the appropriate research methodology to answer the research question(s).
- Identifying the sample size, sampling method, and data collection techniques.
- Determining the data analysis method and statistical tests to be used.
- Facilitating the replication of the study by other researchers.
- Enhancing the validity and generalizability of the research findings.
Applications of Research Design
There are numerous applications of research design in various fields, some of which are:
- Social sciences: In fields such as psychology, sociology, and anthropology, research design is used to investigate human behavior and social phenomena. Researchers use various research designs, such as experimental, quasi-experimental, and correlational designs, to study different aspects of social behavior.
- Education : Research design is essential in the field of education to investigate the effectiveness of different teaching methods and learning strategies. Researchers use various designs such as experimental, quasi-experimental, and case study designs to understand how students learn and how to improve teaching practices.
- Health sciences : In the health sciences, research design is used to investigate the causes, prevention, and treatment of diseases. Researchers use various designs, such as randomized controlled trials, cohort studies, and case-control studies, to study different aspects of health and healthcare.
- Business : Research design is used in the field of business to investigate consumer behavior, marketing strategies, and the impact of different business practices. Researchers use various designs, such as survey research, experimental research, and case studies, to study different aspects of the business world.
- Engineering : In the field of engineering, research design is used to investigate the development and implementation of new technologies. Researchers use various designs, such as experimental research and case studies, to study the effectiveness of new technologies and to identify areas for improvement.
Advantages of Research Design
Here are some advantages of research design:
- Systematic and organized approach : A well-designed research plan ensures that the research is conducted in a systematic and organized manner, which makes it easier to manage and analyze the data.
- Clear objectives: The research design helps to clarify the objectives of the study, which makes it easier to identify the variables that need to be measured, and the methods that need to be used to collect and analyze data.
- Minimizes bias: A well-designed research plan minimizes the chances of bias, by ensuring that the data is collected and analyzed objectively, and that the results are not influenced by the researcher’s personal biases or preferences.
- Efficient use of resources: A well-designed research plan helps to ensure that the resources (time, money, and personnel) are used efficiently and effectively, by focusing on the most important variables and methods.
- Replicability: A well-designed research plan makes it easier for other researchers to replicate the study, which enhances the credibility and reliability of the findings.
- Validity: A well-designed research plan helps to ensure that the findings are valid, by ensuring that the methods used to collect and analyze data are appropriate for the research question.
- Generalizability : A well-designed research plan helps to ensure that the findings can be generalized to other populations, settings, or situations, which increases the external validity of the study.
Research Design Vs Research Methodology
About the author.

Muhammad Hassan
Researcher, Academic Writer, Web developer
You may also like

How to Cite Research Paper – All Formats and...

Data Collection – Methods Types and Examples

Delimitations in Research – Types, Examples and...

Research Paper Format – Types, Examples and...

Research Process – Steps, Examples and Tips

Institutional Review Board – Application Sample...
Leave a comment x.
Save my name, email, and website in this browser for the next time I comment.
Have a language expert improve your writing
Run a free plagiarism check in 10 minutes, automatically generate references for free.
- Knowledge Base
- Methodology
Research Design | Step-by-Step Guide with Examples
Published on 5 May 2022 by Shona McCombes . Revised on 20 March 2023.
A research design is a strategy for answering your research question using empirical data. Creating a research design means making decisions about:
- Your overall aims and approach
- The type of research design you’ll use
- Your sampling methods or criteria for selecting subjects
- Your data collection methods
- The procedures you’ll follow to collect data
- Your data analysis methods
A well-planned research design helps ensure that your methods match your research aims and that you use the right kind of analysis for your data.
Table of contents
Step 1: consider your aims and approach, step 2: choose a type of research design, step 3: identify your population and sampling method, step 4: choose your data collection methods, step 5: plan your data collection procedures, step 6: decide on your data analysis strategies, frequently asked questions.
- Introduction
Before you can start designing your research, you should already have a clear idea of the research question you want to investigate.
There are many different ways you could go about answering this question. Your research design choices should be driven by your aims and priorities – start by thinking carefully about what you want to achieve.
The first choice you need to make is whether you’ll take a qualitative or quantitative approach.
Qualitative research designs tend to be more flexible and inductive , allowing you to adjust your approach based on what you find throughout the research process.
Quantitative research designs tend to be more fixed and deductive , with variables and hypotheses clearly defined in advance of data collection.
It’s also possible to use a mixed methods design that integrates aspects of both approaches. By combining qualitative and quantitative insights, you can gain a more complete picture of the problem you’re studying and strengthen the credibility of your conclusions.
Practical and ethical considerations when designing research
As well as scientific considerations, you need to think practically when designing your research. If your research involves people or animals, you also need to consider research ethics .
- How much time do you have to collect data and write up the research?
- Will you be able to gain access to the data you need (e.g., by travelling to a specific location or contacting specific people)?
- Do you have the necessary research skills (e.g., statistical analysis or interview techniques)?
- Will you need ethical approval ?
At each stage of the research design process, make sure that your choices are practically feasible.
Prevent plagiarism, run a free check.
Within both qualitative and quantitative approaches, there are several types of research design to choose from. Each type provides a framework for the overall shape of your research.
Types of quantitative research designs
Quantitative designs can be split into four main types. Experimental and quasi-experimental designs allow you to test cause-and-effect relationships, while descriptive and correlational designs allow you to measure variables and describe relationships between them.
With descriptive and correlational designs, you can get a clear picture of characteristics, trends, and relationships as they exist in the real world. However, you can’t draw conclusions about cause and effect (because correlation doesn’t imply causation ).
Experiments are the strongest way to test cause-and-effect relationships without the risk of other variables influencing the results. However, their controlled conditions may not always reflect how things work in the real world. They’re often also more difficult and expensive to implement.
Types of qualitative research designs
Qualitative designs are less strictly defined. This approach is about gaining a rich, detailed understanding of a specific context or phenomenon, and you can often be more creative and flexible in designing your research.
The table below shows some common types of qualitative design. They often have similar approaches in terms of data collection, but focus on different aspects when analysing the data.
Your research design should clearly define who or what your research will focus on, and how you’ll go about choosing your participants or subjects.
In research, a population is the entire group that you want to draw conclusions about, while a sample is the smaller group of individuals you’ll actually collect data from.
Defining the population
A population can be made up of anything you want to study – plants, animals, organisations, texts, countries, etc. In the social sciences, it most often refers to a group of people.
For example, will you focus on people from a specific demographic, region, or background? Are you interested in people with a certain job or medical condition, or users of a particular product?
The more precisely you define your population, the easier it will be to gather a representative sample.
Sampling methods
Even with a narrowly defined population, it’s rarely possible to collect data from every individual. Instead, you’ll collect data from a sample.
To select a sample, there are two main approaches: probability sampling and non-probability sampling . The sampling method you use affects how confidently you can generalise your results to the population as a whole.
Probability sampling is the most statistically valid option, but it’s often difficult to achieve unless you’re dealing with a very small and accessible population.
For practical reasons, many studies use non-probability sampling, but it’s important to be aware of the limitations and carefully consider potential biases. You should always make an effort to gather a sample that’s as representative as possible of the population.
Case selection in qualitative research
In some types of qualitative designs, sampling may not be relevant.
For example, in an ethnography or a case study, your aim is to deeply understand a specific context, not to generalise to a population. Instead of sampling, you may simply aim to collect as much data as possible about the context you are studying.
In these types of design, you still have to carefully consider your choice of case or community. You should have a clear rationale for why this particular case is suitable for answering your research question.
For example, you might choose a case study that reveals an unusual or neglected aspect of your research problem, or you might choose several very similar or very different cases in order to compare them.
Data collection methods are ways of directly measuring variables and gathering information. They allow you to gain first-hand knowledge and original insights into your research problem.
You can choose just one data collection method, or use several methods in the same study.
Survey methods
Surveys allow you to collect data about opinions, behaviours, experiences, and characteristics by asking people directly. There are two main survey methods to choose from: questionnaires and interviews.
Observation methods
Observations allow you to collect data unobtrusively, observing characteristics, behaviours, or social interactions without relying on self-reporting.
Observations may be conducted in real time, taking notes as you observe, or you might make audiovisual recordings for later analysis. They can be qualitative or quantitative.
Other methods of data collection
There are many other ways you might collect data depending on your field and topic.
If you’re not sure which methods will work best for your research design, try reading some papers in your field to see what data collection methods they used.
Secondary data
If you don’t have the time or resources to collect data from the population you’re interested in, you can also choose to use secondary data that other researchers already collected – for example, datasets from government surveys or previous studies on your topic.
With this raw data, you can do your own analysis to answer new research questions that weren’t addressed by the original study.
Using secondary data can expand the scope of your research, as you may be able to access much larger and more varied samples than you could collect yourself.
However, it also means you don’t have any control over which variables to measure or how to measure them, so the conclusions you can draw may be limited.
As well as deciding on your methods, you need to plan exactly how you’ll use these methods to collect data that’s consistent, accurate, and unbiased.
Planning systematic procedures is especially important in quantitative research, where you need to precisely define your variables and ensure your measurements are reliable and valid.
Operationalisation
Some variables, like height or age, are easily measured. But often you’ll be dealing with more abstract concepts, like satisfaction, anxiety, or competence. Operationalisation means turning these fuzzy ideas into measurable indicators.
If you’re using observations , which events or actions will you count?
If you’re using surveys , which questions will you ask and what range of responses will be offered?
You may also choose to use or adapt existing materials designed to measure the concept you’re interested in – for example, questionnaires or inventories whose reliability and validity has already been established.
Reliability and validity
Reliability means your results can be consistently reproduced , while validity means that you’re actually measuring the concept you’re interested in.
For valid and reliable results, your measurement materials should be thoroughly researched and carefully designed. Plan your procedures to make sure you carry out the same steps in the same way for each participant.
If you’re developing a new questionnaire or other instrument to measure a specific concept, running a pilot study allows you to check its validity and reliability in advance.
Sampling procedures
As well as choosing an appropriate sampling method, you need a concrete plan for how you’ll actually contact and recruit your selected sample.
That means making decisions about things like:
- How many participants do you need for an adequate sample size?
- What inclusion and exclusion criteria will you use to identify eligible participants?
- How will you contact your sample – by mail, online, by phone, or in person?
If you’re using a probability sampling method, it’s important that everyone who is randomly selected actually participates in the study. How will you ensure a high response rate?
If you’re using a non-probability method, how will you avoid bias and ensure a representative sample?
Data management
It’s also important to create a data management plan for organising and storing your data.
Will you need to transcribe interviews or perform data entry for observations? You should anonymise and safeguard any sensitive data, and make sure it’s backed up regularly.
Keeping your data well organised will save time when it comes to analysing them. It can also help other researchers validate and add to your findings.
On their own, raw data can’t answer your research question. The last step of designing your research is planning how you’ll analyse the data.
Quantitative data analysis
In quantitative research, you’ll most likely use some form of statistical analysis . With statistics, you can summarise your sample data, make estimates, and test hypotheses.
Using descriptive statistics , you can summarise your sample data in terms of:
- The distribution of the data (e.g., the frequency of each score on a test)
- The central tendency of the data (e.g., the mean to describe the average score)
- The variability of the data (e.g., the standard deviation to describe how spread out the scores are)
The specific calculations you can do depend on the level of measurement of your variables.
Using inferential statistics , you can:
- Make estimates about the population based on your sample data.
- Test hypotheses about a relationship between variables.
Regression and correlation tests look for associations between two or more variables, while comparison tests (such as t tests and ANOVAs ) look for differences in the outcomes of different groups.
Your choice of statistical test depends on various aspects of your research design, including the types of variables you’re dealing with and the distribution of your data.
Qualitative data analysis
In qualitative research, your data will usually be very dense with information and ideas. Instead of summing it up in numbers, you’ll need to comb through the data in detail, interpret its meanings, identify patterns, and extract the parts that are most relevant to your research question.
Two of the most common approaches to doing this are thematic analysis and discourse analysis .
There are many other ways of analysing qualitative data depending on the aims of your research. To get a sense of potential approaches, try reading some qualitative research papers in your field.
A sample is a subset of individuals from a larger population. Sampling means selecting the group that you will actually collect data from in your research.
For example, if you are researching the opinions of students in your university, you could survey a sample of 100 students.
Statistical sampling allows you to test a hypothesis about the characteristics of a population. There are various sampling methods you can use to ensure that your sample is representative of the population as a whole.
Operationalisation means turning abstract conceptual ideas into measurable observations.
For example, the concept of social anxiety isn’t directly observable, but it can be operationally defined in terms of self-rating scores, behavioural avoidance of crowded places, or physical anxiety symptoms in social situations.
Before collecting data , it’s important to consider how you will operationalise the variables that you want to measure.
The research methods you use depend on the type of data you need to answer your research question .
- If you want to measure something or test a hypothesis , use quantitative methods . If you want to explore ideas, thoughts, and meanings, use qualitative methods .
- If you want to analyse a large amount of readily available data, use secondary data. If you want data specific to your purposes with control over how they are generated, collect primary data.
- If you want to establish cause-and-effect relationships between variables , use experimental methods. If you want to understand the characteristics of a research subject, use descriptive methods.
Cite this Scribbr article
If you want to cite this source, you can copy and paste the citation or click the ‘Cite this Scribbr article’ button to automatically add the citation to our free Reference Generator.
McCombes, S. (2023, March 20). Research Design | Step-by-Step Guide with Examples. Scribbr. Retrieved 22 April 2024, from https://www.scribbr.co.uk/research-methods/research-design/
Is this article helpful?

Shona McCombes
- How it works
How to Write a Research Design – Guide with Examples
Published by Alaxendra Bets at August 14th, 2021 , Revised On October 3, 2023
A research design is a structure that combines different components of research. It involves the use of different data collection and data analysis techniques logically to answer the research questions .
It would be best to make some decisions about addressing the research questions adequately before starting the research process, which is achieved with the help of the research design.
Below are the key aspects of the decision-making process:
- Data type required for research
- Research resources
- Participants required for research
- Hypothesis based upon research question(s)
- Data analysis methodologies
- Variables (Independent, dependent, and confounding)
- The location and timescale for conducting the data
- The time period required for research
The research design provides the strategy of investigation for your project. Furthermore, it defines the parameters and criteria to compile the data to evaluate results and conclude.
Your project’s validity depends on the data collection and interpretation techniques. A strong research design reflects a strong dissertation , scientific paper, or research proposal .

Step 1: Establish Priorities for Research Design
Before conducting any research study, you must address an important question: “how to create a research design.”
The research design depends on the researcher’s priorities and choices because every research has different priorities. For a complex research study involving multiple methods, you may choose to have more than one research design.
Multimethodology or multimethod research includes using more than one data collection method or research in a research study or set of related studies.
If one research design is weak in one area, then another research design can cover that weakness. For instance, a dissertation analyzing different situations or cases will have more than one research design.
For example:
- Experimental research involves experimental investigation and laboratory experience, but it does not accurately investigate the real world.
- Quantitative research is good for the statistical part of the project, but it may not provide an in-depth understanding of the topic .
- Also, correlational research will not provide experimental results because it is a technique that assesses the statistical relationship between two variables.
While scientific considerations are a fundamental aspect of the research design, It is equally important that the researcher think practically before deciding on its structure. Here are some questions that you should think of;
- Do you have enough time to gather data and complete the write-up?
- Will you be able to collect the necessary data by interviewing a specific person or visiting a specific location?
- Do you have in-depth knowledge about the different statistical analysis and data collection techniques to address the research questions or test the hypothesis ?
If you think that the chosen research design cannot answer the research questions properly, you can refine your research questions to gain better insight.
Step 2: Data Type you Need for Research
Decide on the type of data you need for your research. The type of data you need to collect depends on your research questions or research hypothesis. Two types of research data can be used to answer the research questions:
Primary Data Vs. Secondary Data
Qualitative vs. quantitative data.
Also, see; Research methods, design, and analysis .
Need help with a thesis chapter?
- Hire an expert from ResearchProspect today!
- Statistical analysis, research methodology, discussion of the results or conclusion – our experts can help you no matter how complex the requirements are.

Step 3: Data Collection Techniques
Once you have selected the type of research to answer your research question, you need to decide where and how to collect the data.
It is time to determine your research method to address the research problem . Research methods involve procedures, techniques, materials, and tools used for the study.
For instance, a dissertation research design includes the different resources and data collection techniques and helps establish your dissertation’s structure .
The following table shows the characteristics of the most popularly employed research methods.
Research Methods
Step 4: Procedure of Data Analysis
Use of the correct data and statistical analysis technique is necessary for the validity of your research. Therefore, you need to be certain about the data type that would best address the research problem. Choosing an appropriate analysis method is the final step for the research design. It can be split into two main categories;
Quantitative Data Analysis
The quantitative data analysis technique involves analyzing the numerical data with the help of different applications such as; SPSS, STATA, Excel, origin lab, etc.
This data analysis strategy tests different variables such as spectrum, frequencies, averages, and more. The research question and the hypothesis must be established to identify the variables for testing.
Qualitative Data Analysis
Qualitative data analysis of figures, themes, and words allows for flexibility and the researcher’s subjective opinions. This means that the researcher’s primary focus will be interpreting patterns, tendencies, and accounts and understanding the implications and social framework.
You should be clear about your research objectives before starting to analyze the data. For example, you should ask yourself whether you need to explain respondents’ experiences and insights or do you also need to evaluate their responses with reference to a certain social framework.
Step 5: Write your Research Proposal
The research design is an important component of a research proposal because it plans the project’s execution. You can share it with the supervisor, who would evaluate the feasibility and capacity of the results and conclusion .
Read our guidelines to write a research proposal if you have already formulated your research design. The research proposal is written in the future tense because you are writing your proposal before conducting research.
The research methodology or research design, on the other hand, is generally written in the past tense.
How to Write a Research Design – Conclusion
A research design is the plan, structure, strategy of investigation conceived to answer the research question and test the hypothesis. The dissertation research design can be classified based on the type of data and the type of analysis.
Above mentioned five steps are the answer to how to write a research design. So, follow these steps to formulate the perfect research design for your dissertation .
ResearchProspect writers have years of experience creating research designs that align with the dissertation’s aim and objectives. If you are struggling with your dissertation methodology chapter, you might want to look at our dissertation part-writing service.
Our dissertation writers can also help you with the full dissertation paper . No matter how urgent or complex your need may be, ResearchProspect can help. We also offer PhD level research paper writing services.
Frequently Asked Questions
What is research design.
Research design is a systematic plan that guides the research process, outlining the methodology and procedures for collecting and analysing data. It determines the structure of the study, ensuring the research question is answered effectively, reliably, and validly. It serves as the blueprint for the entire research project.
How to write a research design?
To write a research design, define your research question, identify the research method (qualitative, quantitative, or mixed), choose data collection techniques (e.g., surveys, interviews), determine the sample size and sampling method, outline data analysis procedures, and highlight potential limitations and ethical considerations for the study.
How to write the design section of a research paper?
In the design section of a research paper, describe the research methodology chosen and justify its selection. Outline the data collection methods, participants or samples, instruments used, and procedures followed. Detail any experimental controls, if applicable. Ensure clarity and precision to enable replication of the study by other researchers.
How to write a research design in methodology?
To write a research design in methodology, clearly outline the research strategy (e.g., experimental, survey, case study). Describe the sampling technique, participants, and data collection methods. Detail the procedures for data collection and analysis. Justify choices by linking them to research objectives, addressing reliability and validity.
You May Also Like
This article is a step-by-step guide to how to write statement of a problem in research. The research problem will be half-solved by defining it correctly.
Find how to write research questions with the mentioned steps required for a perfect research question. Choose an interesting topic and begin your research.
Make sure that your selected topic is intriguing, manageable, and relevant. Here are some guidelines to help understand how to find a good dissertation topic.
USEFUL LINKS
LEARNING RESOURCES

COMPANY DETAILS

- How It Works
Want to create or adapt books like this? Learn more about how Pressbooks supports open publishing practices.
5 Research design
Research design is a comprehensive plan for data collection in an empirical research project. It is a ‘blueprint’ for empirical research aimed at answering specific research questions or testing specific hypotheses, and must specify at least three processes: the data collection process, the instrument development process, and the sampling process. The instrument development and sampling processes are described in the next two chapters, and the data collection process—which is often loosely called ‘research design’—is introduced in this chapter and is described in further detail in Chapters 9–12.
Broadly speaking, data collection methods can be grouped into two categories: positivist and interpretive. Positivist methods , such as laboratory experiments and survey research, are aimed at theory (or hypotheses) testing, while interpretive methods, such as action research and ethnography, are aimed at theory building. Positivist methods employ a deductive approach to research, starting with a theory and testing theoretical postulates using empirical data. In contrast, interpretive methods employ an inductive approach that starts with data and tries to derive a theory about the phenomenon of interest from the observed data. Often times, these methods are incorrectly equated with quantitative and qualitative research. Quantitative and qualitative methods refers to the type of data being collected—quantitative data involve numeric scores, metrics, and so on, while qualitative data includes interviews, observations, and so forth—and analysed (i.e., using quantitative techniques such as regression or qualitative techniques such as coding). Positivist research uses predominantly quantitative data, but can also use qualitative data. Interpretive research relies heavily on qualitative data, but can sometimes benefit from including quantitative data as well. Sometimes, joint use of qualitative and quantitative data may help generate unique insight into a complex social phenomenon that is not available from either type of data alone, and hence, mixed-mode designs that combine qualitative and quantitative data are often highly desirable.
Key attributes of a research design
The quality of research designs can be defined in terms of four key design attributes: internal validity, external validity, construct validity, and statistical conclusion validity.
Internal validity , also called causality, examines whether the observed change in a dependent variable is indeed caused by a corresponding change in a hypothesised independent variable, and not by variables extraneous to the research context. Causality requires three conditions: covariation of cause and effect (i.e., if cause happens, then effect also happens; if cause does not happen, effect does not happen), temporal precedence (cause must precede effect in time), and spurious correlation, or there is no plausible alternative explanation for the change. Certain research designs, such as laboratory experiments, are strong in internal validity by virtue of their ability to manipulate the independent variable (cause) via a treatment and observe the effect (dependent variable) of that treatment after a certain point in time, while controlling for the effects of extraneous variables. Other designs, such as field surveys, are poor in internal validity because of their inability to manipulate the independent variable (cause), and because cause and effect are measured at the same point in time which defeats temporal precedence making it equally likely that the expected effect might have influenced the expected cause rather than the reverse. Although higher in internal validity compared to other methods, laboratory experiments are by no means immune to threats of internal validity, and are susceptible to history, testing, instrumentation, regression, and other threats that are discussed later in the chapter on experimental designs. Nonetheless, different research designs vary considerably in their respective level of internal validity.
External validity or generalisability refers to whether the observed associations can be generalised from the sample to the population (population validity), or to other people, organisations, contexts, or time (ecological validity). For instance, can results drawn from a sample of financial firms in the United States be generalised to the population of financial firms (population validity) or to other firms within the United States (ecological validity)? Survey research, where data is sourced from a wide variety of individuals, firms, or other units of analysis, tends to have broader generalisability than laboratory experiments where treatments and extraneous variables are more controlled. The variation in internal and external validity for a wide range of research designs is shown in Figure 5.1.

Some researchers claim that there is a trade-off between internal and external validity—higher external validity can come only at the cost of internal validity and vice versa. But this is not always the case. Research designs such as field experiments, longitudinal field surveys, and multiple case studies have higher degrees of both internal and external validities. Personally, I prefer research designs that have reasonable degrees of both internal and external validities, i.e., those that fall within the cone of validity shown in Figure 5.1. But this should not suggest that designs outside this cone are any less useful or valuable. Researchers’ choice of designs are ultimately a matter of their personal preference and competence, and the level of internal and external validity they desire.
Construct validity examines how well a given measurement scale is measuring the theoretical construct that it is expected to measure. Many constructs used in social science research such as empathy, resistance to change, and organisational learning are difficult to define, much less measure. For instance, construct validity must ensure that a measure of empathy is indeed measuring empathy and not compassion, which may be difficult since these constructs are somewhat similar in meaning. Construct validity is assessed in positivist research based on correlational or factor analysis of pilot test data, as described in the next chapter.
Statistical conclusion validity examines the extent to which conclusions derived using a statistical procedure are valid. For example, it examines whether the right statistical method was used for hypotheses testing, whether the variables used meet the assumptions of that statistical test (such as sample size or distributional requirements), and so forth. Because interpretive research designs do not employ statistical tests, statistical conclusion validity is not applicable for such analysis. The different kinds of validity and where they exist at the theoretical/empirical levels are illustrated in Figure 5.2.

Improving internal and external validity
The best research designs are those that can ensure high levels of internal and external validity. Such designs would guard against spurious correlations, inspire greater faith in the hypotheses testing, and ensure that the results drawn from a small sample are generalisable to the population at large. Controls are required to ensure internal validity (causality) of research designs, and can be accomplished in five ways: manipulation, elimination, inclusion, and statistical control, and randomisation.
In manipulation , the researcher manipulates the independent variables in one or more levels (called ‘treatments’), and compares the effects of the treatments against a control group where subjects do not receive the treatment. Treatments may include a new drug or different dosage of drug (for treating a medical condition), a teaching style (for students), and so forth. This type of control is achieved in experimental or quasi-experimental designs, but not in non-experimental designs such as surveys. Note that if subjects cannot distinguish adequately between different levels of treatment manipulations, their responses across treatments may not be different, and manipulation would fail.
The elimination technique relies on eliminating extraneous variables by holding them constant across treatments, such as by restricting the study to a single gender or a single socioeconomic status. In the inclusion technique, the role of extraneous variables is considered by including them in the research design and separately estimating their effects on the dependent variable, such as via factorial designs where one factor is gender (male versus female). Such technique allows for greater generalisability, but also requires substantially larger samples. In statistical control , extraneous variables are measured and used as covariates during the statistical testing process.
Finally, the randomisation technique is aimed at cancelling out the effects of extraneous variables through a process of random sampling, if it can be assured that these effects are of a random (non-systematic) nature. Two types of randomisation are: random selection , where a sample is selected randomly from a population, and random assignment , where subjects selected in a non-random manner are randomly assigned to treatment groups.
Randomisation also ensures external validity, allowing inferences drawn from the sample to be generalised to the population from which the sample is drawn. Note that random assignment is mandatory when random selection is not possible because of resource or access constraints. However, generalisability across populations is harder to ascertain since populations may differ on multiple dimensions and you can only control for a few of those dimensions.
Popular research designs
As noted earlier, research designs can be classified into two categories—positivist and interpretive—depending on the goal of the research. Positivist designs are meant for theory testing, while interpretive designs are meant for theory building. Positivist designs seek generalised patterns based on an objective view of reality, while interpretive designs seek subjective interpretations of social phenomena from the perspectives of the subjects involved. Some popular examples of positivist designs include laboratory experiments, field experiments, field surveys, secondary data analysis, and case research, while examples of interpretive designs include case research, phenomenology, and ethnography. Note that case research can be used for theory building or theory testing, though not at the same time. Not all techniques are suited for all kinds of scientific research. Some techniques such as focus groups are best suited for exploratory research, others such as ethnography are best for descriptive research, and still others such as laboratory experiments are ideal for explanatory research. Following are brief descriptions of some of these designs. Additional details are provided in Chapters 9–12.
Experimental studies are those that are intended to test cause-effect relationships (hypotheses) in a tightly controlled setting by separating the cause from the effect in time, administering the cause to one group of subjects (the ‘treatment group’) but not to another group (‘control group’), and observing how the mean effects vary between subjects in these two groups. For instance, if we design a laboratory experiment to test the efficacy of a new drug in treating a certain ailment, we can get a random sample of people afflicted with that ailment, randomly assign them to one of two groups (treatment and control groups), administer the drug to subjects in the treatment group, but only give a placebo (e.g., a sugar pill with no medicinal value) to subjects in the control group. More complex designs may include multiple treatment groups, such as low versus high dosage of the drug or combining drug administration with dietary interventions. In a true experimental design , subjects must be randomly assigned to each group. If random assignment is not followed, then the design becomes quasi-experimental . Experiments can be conducted in an artificial or laboratory setting such as at a university (laboratory experiments) or in field settings such as in an organisation where the phenomenon of interest is actually occurring (field experiments). Laboratory experiments allow the researcher to isolate the variables of interest and control for extraneous variables, which may not be possible in field experiments. Hence, inferences drawn from laboratory experiments tend to be stronger in internal validity, but those from field experiments tend to be stronger in external validity. Experimental data is analysed using quantitative statistical techniques. The primary strength of the experimental design is its strong internal validity due to its ability to isolate, control, and intensively examine a small number of variables, while its primary weakness is limited external generalisability since real life is often more complex (i.e., involving more extraneous variables) than contrived lab settings. Furthermore, if the research does not identify ex ante relevant extraneous variables and control for such variables, such lack of controls may hurt internal validity and may lead to spurious correlations.
Field surveys are non-experimental designs that do not control for or manipulate independent variables or treatments, but measure these variables and test their effects using statistical methods. Field surveys capture snapshots of practices, beliefs, or situations from a random sample of subjects in field settings through a survey questionnaire or less frequently, through a structured interview. In cross-sectional field surveys , independent and dependent variables are measured at the same point in time (e.g., using a single questionnaire), while in longitudinal field surveys , dependent variables are measured at a later point in time than the independent variables. The strengths of field surveys are their external validity (since data is collected in field settings), their ability to capture and control for a large number of variables, and their ability to study a problem from multiple perspectives or using multiple theories. However, because of their non-temporal nature, internal validity (cause-effect relationships) are difficult to infer, and surveys may be subject to respondent biases (e.g., subjects may provide a ‘socially desirable’ response rather than their true response) which further hurts internal validity.
Secondary data analysis is an analysis of data that has previously been collected and tabulated by other sources. Such data may include data from government agencies such as employment statistics from the U.S. Bureau of Labor Services or development statistics by countries from the United Nations Development Program, data collected by other researchers (often used in meta-analytic studies), or publicly available third-party data, such as financial data from stock markets or real-time auction data from eBay. This is in contrast to most other research designs where collecting primary data for research is part of the researcher’s job. Secondary data analysis may be an effective means of research where primary data collection is too costly or infeasible, and secondary data is available at a level of analysis suitable for answering the researcher’s questions. The limitations of this design are that the data might not have been collected in a systematic or scientific manner and hence unsuitable for scientific research, since the data was collected for a presumably different purpose, they may not adequately address the research questions of interest to the researcher, and interval validity is problematic if the temporal precedence between cause and effect is unclear.
Case research is an in-depth investigation of a problem in one or more real-life settings (case sites) over an extended period of time. Data may be collected using a combination of interviews, personal observations, and internal or external documents. Case studies can be positivist in nature (for hypotheses testing) or interpretive (for theory building). The strength of this research method is its ability to discover a wide variety of social, cultural, and political factors potentially related to the phenomenon of interest that may not be known in advance. Analysis tends to be qualitative in nature, but heavily contextualised and nuanced. However, interpretation of findings may depend on the observational and integrative ability of the researcher, lack of control may make it difficult to establish causality, and findings from a single case site may not be readily generalised to other case sites. Generalisability can be improved by replicating and comparing the analysis in other case sites in a multiple case design .
Focus group research is a type of research that involves bringing in a small group of subjects (typically six to ten people) at one location, and having them discuss a phenomenon of interest for a period of one and a half to two hours. The discussion is moderated and led by a trained facilitator, who sets the agenda and poses an initial set of questions for participants, makes sure that the ideas and experiences of all participants are represented, and attempts to build a holistic understanding of the problem situation based on participants’ comments and experiences. Internal validity cannot be established due to lack of controls and the findings may not be generalised to other settings because of the small sample size. Hence, focus groups are not generally used for explanatory or descriptive research, but are more suited for exploratory research.
Action research assumes that complex social phenomena are best understood by introducing interventions or ‘actions’ into those phenomena and observing the effects of those actions. In this method, the researcher is embedded within a social context such as an organisation and initiates an action—such as new organisational procedures or new technologies—in response to a real problem such as declining profitability or operational bottlenecks. The researcher’s choice of actions must be based on theory, which should explain why and how such actions may cause the desired change. The researcher then observes the results of that action, modifying it as necessary, while simultaneously learning from the action and generating theoretical insights about the target problem and interventions. The initial theory is validated by the extent to which the chosen action successfully solves the target problem. Simultaneous problem solving and insight generation is the central feature that distinguishes action research from all other research methods, and hence, action research is an excellent method for bridging research and practice. This method is also suited for studying unique social problems that cannot be replicated outside that context, but it is also subject to researcher bias and subjectivity, and the generalisability of findings is often restricted to the context where the study was conducted.
Ethnography is an interpretive research design inspired by anthropology that emphasises that research phenomenon must be studied within the context of its culture. The researcher is deeply immersed in a certain culture over an extended period of time—eight months to two years—and during that period, engages, observes, and records the daily life of the studied culture, and theorises about the evolution and behaviours in that culture. Data is collected primarily via observational techniques, formal and informal interaction with participants in that culture, and personal field notes, while data analysis involves ‘sense-making’. The researcher must narrate her experience in great detail so that readers may experience that same culture without necessarily being there. The advantages of this approach are its sensitiveness to the context, the rich and nuanced understanding it generates, and minimal respondent bias. However, this is also an extremely time and resource-intensive approach, and findings are specific to a given culture and less generalisable to other cultures.
Selecting research designs
Given the above multitude of research designs, which design should researchers choose for their research? Generally speaking, researchers tend to select those research designs that they are most comfortable with and feel most competent to handle, but ideally, the choice should depend on the nature of the research phenomenon being studied. In the preliminary phases of research, when the research problem is unclear and the researcher wants to scope out the nature and extent of a certain research problem, a focus group (for an individual unit of analysis) or a case study (for an organisational unit of analysis) is an ideal strategy for exploratory research. As one delves further into the research domain, but finds that there are no good theories to explain the phenomenon of interest and wants to build a theory to fill in the unmet gap in that area, interpretive designs such as case research or ethnography may be useful designs. If competing theories exist and the researcher wishes to test these different theories or integrate them into a larger theory, positivist designs such as experimental design, survey research, or secondary data analysis are more appropriate.
Regardless of the specific research design chosen, the researcher should strive to collect quantitative and qualitative data using a combination of techniques such as questionnaires, interviews, observations, documents, or secondary data. For instance, even in a highly structured survey questionnaire, intended to collect quantitative data, the researcher may leave some room for a few open-ended questions to collect qualitative data that may generate unexpected insights not otherwise available from structured quantitative data alone. Likewise, while case research employ mostly face-to-face interviews to collect most qualitative data, the potential and value of collecting quantitative data should not be ignored. As an example, in a study of organisational decision-making processes, the case interviewer can record numeric quantities such as how many months it took to make certain organisational decisions, how many people were involved in that decision process, and how many decision alternatives were considered, which can provide valuable insights not otherwise available from interviewees’ narrative responses. Irrespective of the specific research design employed, the goal of the researcher should be to collect as much and as diverse data as possible that can help generate the best possible insights about the phenomenon of interest.
Social Science Research: Principles, Methods and Practices (Revised edition) Copyright © 2019 by Anol Bhattacherjee is licensed under a Creative Commons Attribution-NonCommercial-ShareAlike 4.0 International License , except where otherwise noted.
Share This Book
- Skip to main content
- Skip to primary sidebar
- Skip to footer
- QuestionPro

- Solutions Industries Gaming Automotive Sports and events Education Government Travel & Hospitality Financial Services Healthcare Cannabis Technology Use Case NPS+ Communities Audience Contactless surveys Mobile LivePolls Member Experience GDPR Positive People Science 360 Feedback Surveys
- Resources Blog eBooks Survey Templates Case Studies Training Help center
Home Market Research Research Tools and Apps
Research Design: What it is, Elements & Types

Can you imagine doing research without a plan? Probably not. When we discuss a strategy to collect, study, and evaluate data, we talk about research design. This design addresses problems and creates a consistent and logical model for data analysis. Let’s learn more about it.
What is Research Design?
Research design is the framework of research methods and techniques chosen by a researcher to conduct a study. The design allows researchers to sharpen the research methods suitable for the subject matter and set up their studies for success.
Creating a research topic explains the type of research (experimental, survey research , correlational , semi-experimental, review) and its sub-type (experimental design, research problem , descriptive case-study).
There are three main types of designs for research:
- Data collection
- Measurement
- Data Analysis
The research problem an organization faces will determine the design, not vice-versa. The design phase of a study determines which tools to use and how they are used.
The Process of Research Design
The research design process is a systematic and structured approach to conducting research. The process is essential to ensure that the study is valid, reliable, and produces meaningful results.
- Consider your aims and approaches: Determine the research questions and objectives, and identify the theoretical framework and methodology for the study.
- Choose a type of Research Design: Select the appropriate research design, such as experimental, correlational, survey, case study, or ethnographic, based on the research questions and objectives.
- Identify your population and sampling method: Determine the target population and sample size, and choose the sampling method, such as random , stratified random sampling , or convenience sampling.
- Choose your data collection methods: Decide on the data collection methods , such as surveys, interviews, observations, or experiments, and select the appropriate instruments or tools for collecting data.
- Plan your data collection procedures: Develop a plan for data collection, including the timeframe, location, and personnel involved, and ensure ethical considerations.
- Decide on your data analysis strategies: Select the appropriate data analysis techniques, such as statistical analysis , content analysis, or discourse analysis, and plan how to interpret the results.
The process of research design is a critical step in conducting research. By following the steps of research design, researchers can ensure that their study is well-planned, ethical, and rigorous.
Research Design Elements
Impactful research usually creates a minimum bias in data and increases trust in the accuracy of collected data. A design that produces the slightest margin of error in experimental research is generally considered the desired outcome. The essential elements are:
- Accurate purpose statement
- Techniques to be implemented for collecting and analyzing research
- The method applied for analyzing collected details
- Type of research methodology
- Probable objections to research
- Settings for the research study
- Measurement of analysis
Characteristics of Research Design
A proper design sets your study up for success. Successful research studies provide insights that are accurate and unbiased. You’ll need to create a survey that meets all of the main characteristics of a design. There are four key characteristics:

- Neutrality: When you set up your study, you may have to make assumptions about the data you expect to collect. The results projected in the research should be free from research bias and neutral. Understand opinions about the final evaluated scores and conclusions from multiple individuals and consider those who agree with the results.
- Reliability: With regularly conducted research, the researcher expects similar results every time. You’ll only be able to reach the desired results if your design is reliable. Your plan should indicate how to form research questions to ensure the standard of results.
- Validity: There are multiple measuring tools available. However, the only correct measuring tools are those which help a researcher in gauging results according to the objective of the research. The questionnaire developed from this design will then be valid.
- Generalization: The outcome of your design should apply to a population and not just a restricted sample . A generalized method implies that your survey can be conducted on any part of a population with similar accuracy.
The above factors affect how respondents answer the research questions, so they should balance all the above characteristics in a good design. If you want, you can also learn about Selection Bias through our blog.
Research Design Types
A researcher must clearly understand the various types to select which model to implement for a study. Like the research itself, the design of your analysis can be broadly classified into quantitative and qualitative.
Qualitative research
Qualitative research determines relationships between collected data and observations based on mathematical calculations. Statistical methods can prove or disprove theories related to a naturally existing phenomenon. Researchers rely on qualitative observation research methods that conclude “why” a particular theory exists and “what” respondents have to say about it.
Quantitative research
Quantitative research is for cases where statistical conclusions to collect actionable insights are essential. Numbers provide a better perspective for making critical business decisions. Quantitative research methods are necessary for the growth of any organization. Insights drawn from complex numerical data and analysis prove to be highly effective when making decisions about the business’s future.
Qualitative Research vs Quantitative Research
Here is a chart that highlights the major differences between qualitative and quantitative research:
In summary or analysis , the step of qualitative research is more exploratory and focuses on understanding the subjective experiences of individuals, while quantitative research is more focused on objective data and statistical analysis.
You can further break down the types of research design into five categories:

1. Descriptive: In a descriptive composition, a researcher is solely interested in describing the situation or case under their research study. It is a theory-based design method created by gathering, analyzing, and presenting collected data. This allows a researcher to provide insights into the why and how of research. Descriptive design helps others better understand the need for the research. If the problem statement is not clear, you can conduct exploratory research.
2. Experimental: Experimental research establishes a relationship between the cause and effect of a situation. It is a causal research design where one observes the impact caused by the independent variable on the dependent variable. For example, one monitors the influence of an independent variable such as a price on a dependent variable such as customer satisfaction or brand loyalty. It is an efficient research method as it contributes to solving a problem.
The independent variables are manipulated to monitor the change it has on the dependent variable. Social sciences often use it to observe human behavior by analyzing two groups. Researchers can have participants change their actions and study how the people around them react to understand social psychology better.
3. Correlational research: Correlational research is a non-experimental research technique. It helps researchers establish a relationship between two closely connected variables. There is no assumption while evaluating a relationship between two other variables, and statistical analysis techniques calculate the relationship between them. This type of research requires two different groups.
A correlation coefficient determines the correlation between two variables whose values range between -1 and +1. If the correlation coefficient is towards +1, it indicates a positive relationship between the variables, and -1 means a negative relationship between the two variables.
4. Diagnostic research: In diagnostic design, the researcher is looking to evaluate the underlying cause of a specific topic or phenomenon. This method helps one learn more about the factors that create troublesome situations.
This design has three parts of the research:
- Inception of the issue
- Diagnosis of the issue
- Solution for the issue
5. Explanatory research : Explanatory design uses a researcher’s ideas and thoughts on a subject to further explore their theories. The study explains unexplored aspects of a subject and details the research questions’ what, how, and why.
Benefits of Research Design
There are several benefits of having a well-designed research plan. Including:
- Clarity of research objectives: Research design provides a clear understanding of the research objectives and the desired outcomes.
- Increased validity and reliability: To ensure the validity and reliability of results, research design help to minimize the risk of bias and helps to control extraneous variables.
- Improved data collection: Research design helps to ensure that the proper data is collected and data is collected systematically and consistently.
- Better data analysis: Research design helps ensure that the collected data can be analyzed effectively, providing meaningful insights and conclusions.
- Improved communication: A well-designed research helps ensure the results are clean and influential within the research team and external stakeholders.
- Efficient use of resources: reducing the risk of waste and maximizing the impact of the research, research design helps to ensure that resources are used efficiently.
A well-designed research plan is essential for successful research, providing clear and meaningful insights and ensuring that resources are practical.
QuestionPro offers a comprehensive solution for researchers looking to conduct research. With its user-friendly interface, robust data collection and analysis tools, and the ability to integrate results from multiple sources, QuestionPro provides a versatile platform for designing and executing research projects.
Our robust suite of research tools provides you with all you need to derive research results. Our online survey platform includes custom point-and-click logic and advanced question types. Uncover the insights that matter the most.
FREE TRIAL LEARN MORE
MORE LIKE THIS

NPS Survey Platform: Types, Tips, 11 Best Platforms & Tools
Apr 26, 2024

User Journey vs User Flow: Differences and Similarities

Best 7 Gap Analysis Tools to Empower Your Business
Apr 25, 2024

12 Best Employee Survey Tools for Organizational Excellence
Other categories.
- Academic Research
- Artificial Intelligence
- Assessments
- Brand Awareness
- Case Studies
- Communities
- Consumer Insights
- Customer effort score
- Customer Engagement
- Customer Experience
- Customer Loyalty
- Customer Research
- Customer Satisfaction
- Employee Benefits
- Employee Engagement
- Employee Retention
- Friday Five
- General Data Protection Regulation
- Insights Hub
- Life@QuestionPro
- Market Research
- Mobile diaries
- Mobile Surveys
- New Features
- Online Communities
- Question Types
- Questionnaire
- QuestionPro Products
- Release Notes
- Research Tools and Apps
- Revenue at Risk
- Survey Templates
- Training Tips
- Uncategorized
- Video Learning Series
- What’s Coming Up
- Workforce Intelligence

Want to create or adapt books like this? Learn more about how Pressbooks supports open publishing practices.
Capstone Components
12 Research Design
The story continues….
“So, how do we go about answering our research questions?” asked Harry.
Physicus explained that they will have to analyze their questions to see what types of answers are required. Knowing this will guide their decisions about how to design the needs assessment to answer their questions.
“There are two basic types of answers to research questions, quantitative and qualitative. The types of answers the questions require tell us what type of research design we need,” said Physicus.
“I guess if I ask how we decide which type of research design we should choose, you will say, ‘It depends?'” uttered Harry.
Physicus’ face brightened as he blurted out, “Absolutely not! Negative!” Physicus continued, “If the research questions are stated well, there will only be two ways in which they can be answered. The research questions are king; they make all the decisions.”
“How come?” Harry appeared confused.
“Well, let us see. Think about our first question. How many mice will Pickles attack at one time? What type of answer does this question require? It requires a numeric answer, correct?” Physicus asked.
“Yes, that is correct,” Harry said.
Physicus continued, “Good. So, does our second question also require a numeric answer?”
“The second question is also answered with a number,” replied Harry
Physicus blurted, “Correct! This means we need to use a quantitative research design!”
Physicus continued, “Now if we had research questions that could not be answered with numbers, we would need to use a qualitative research design to answer our questions with words or phrases instead.”
Harry now appeared relieved, “I get it. So in designing a research project, we simply look for a way to answer the research questions. That’s easy!”
“Well, it depends,” answered Physicus smiling.
Interpreting the Story
There are qualitative, quantitative, mixed methods, and applied research designs. Based on the research questions, the research design will be obvious. Physicus led Harry in determining their investigation would need a quantitative design, because they only needed numerical data to answer their research questions. If Harry’s questions could only be answered with words or phrases, then a qualitative design would be needed. If the friends had questions needing to be answered with numbers and phrases, then either a mixed methods or an applied research design would have been the choice.
Research Design
The Research Design explains what type of research is being conducted in the needs assessment. The writing in this heading also explains why this type of research is needed to obtain the answers to the research or guiding questions for the project. The design provides a blueprint for the methodology. Articulating the nature of the research design is critical for explaining the Methodology (see the next chapter).
There are four categories of research designs used in educational research and a variety of specific research designs in each category. The first step in determining which category to use is to identify what type of data will answer the research questions. As in our story, Harry and Physicus had research questions that required quantitative answers, so the category of their research design is quantitative.
The next step in finding the specific research design is to consider the purpose (goal) of the research project. The research design must support the purpose. In our story, Harry and Physicus need a quantitative research design that supports their goal of determining the effect of the number of mice Pickles encounters at one time on his behavior. A causal-comparative or quasi-experimental research design is the best choice for the friends because these are specific quantitative designs used to find a cause-and-effect relationship.
Quantitative Research Designs
Quantitative research designs seek results based on statistical analyses of the collected numerical data. The primary quantitative designs used in educational research include descriptive, correlational, causal-comparative, and quasi-experimental designs. Numerical data are collected and analyzed using statistical calculations appropriate for the design. For example, analyses like mean, median, mode, range, etc. are used to describe or explain a phenomenon observed in a descriptive research design. A correlational research design uses statistics, such as correlation coefficient or regression analyses to explain how two phenomena are related. Causal-comparative and quasi-experimental designs use analyses needed to establish causal relationships, such as pre-post testing, or behavior change (like in our story).
The use of numerical data guides both the methodology and the analysis protocols. The design also guides and limits how the results are interpreted. Examples of quantitative data found in educational research include test scores, grade point averages, and dropout rates.
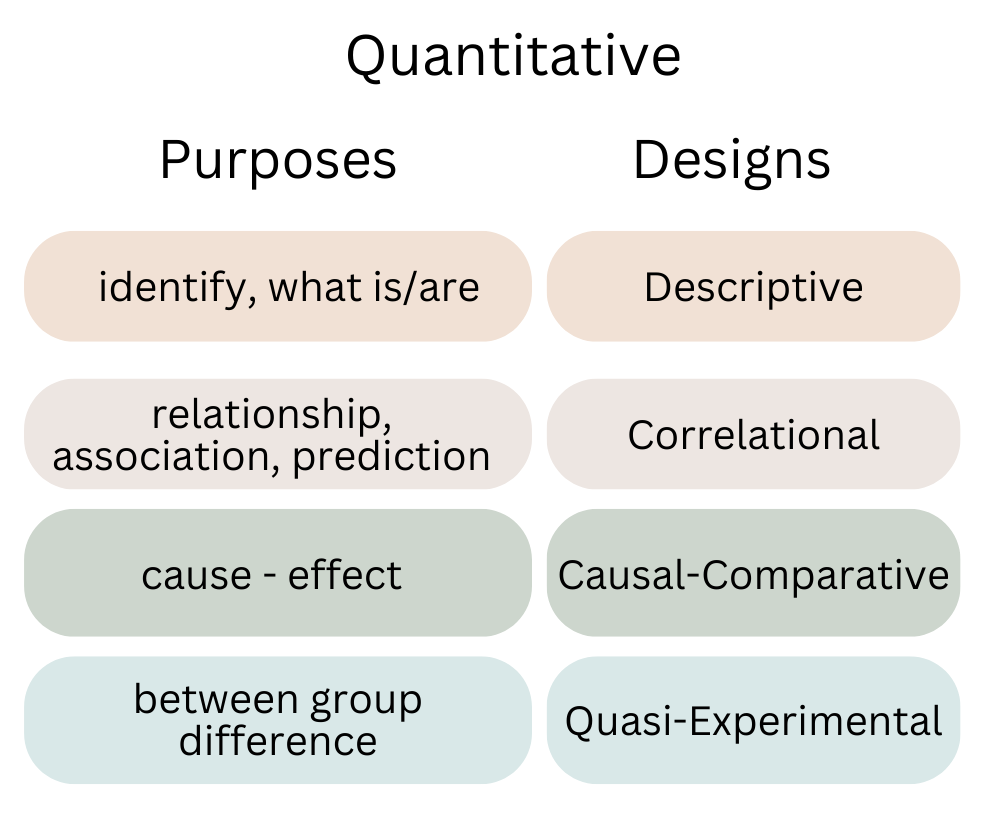
Qualitative Research Designs
Qualitative research designs involve obtaining verbal, perspective, and/or visual results using code-based analyses of collected data. Typical qualitative designs used in educational research include the case study, phenomenological, grounded theory, and ethnography. These designs involve exploring behaviors, perceptions/feelings, and social/cultural phenomena found in educational settings.
Qualitative designs result in a written description of the findings. Data collection strategies include observations, interviews, focus groups, surveys, and documentation reviews. The data are recorded as words, phrases, sentences, and paragraphs. Data are then grouped together to form themes. The process of grouping data to form themes is called coding. The labeled themes become the “code” used to interpret the data. The coding can be determined ahead of time before data are collected, or the coding emerges from the collected data. Data collection strategies often include media such as video and audio recordings. These recordings are transcribed into words to allow for the coding analysis.
The use of qualitative data guides both the methodology and the analysis protocols. The “squishy” nature of qualitative data (words vs. numbers) and the data coding analysis limits the interpretation and conclusions made from the results. It is important to explain the coding analysis used to provide clear reasoning for the themes and how these relate to the research questions.
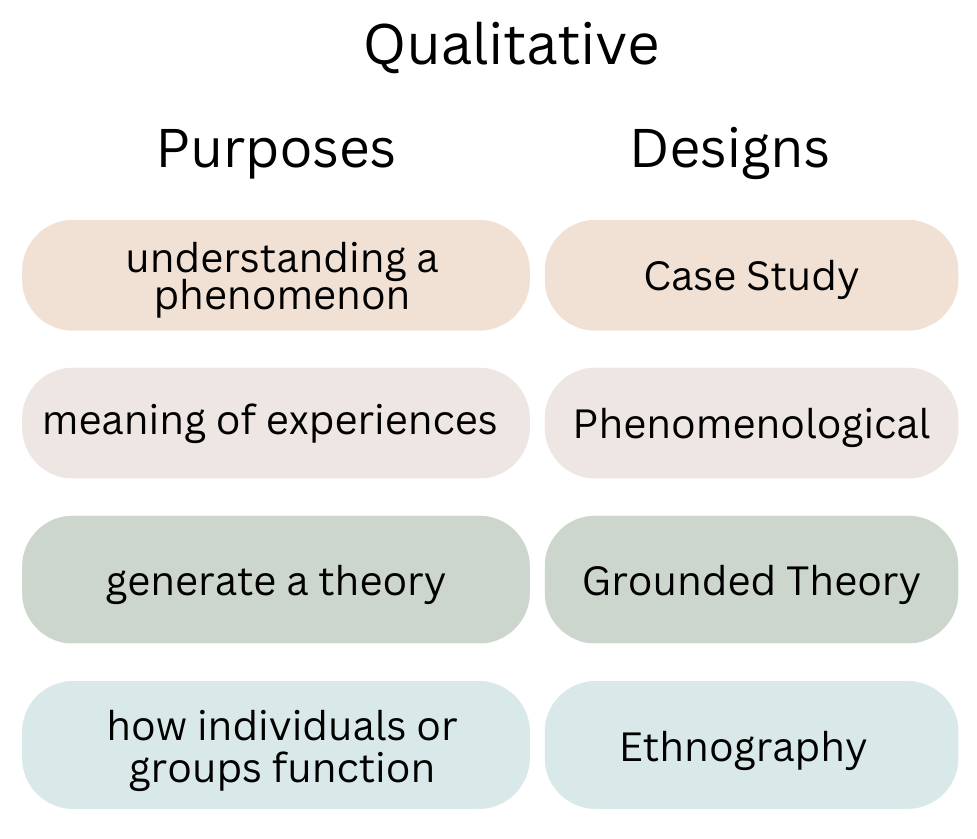
Mixed Method Designs
Mixed Methods research designs are used when the research questions must be answered with results that are both quantitative and qualitative. These designs integrate the data results to arrive at conclusions. A mixed method design is used when there are greater benefits to using multiple data types, sources, and analyses. Examples of typical mixed methods design approaches in education include convergent, explanatory, exploratory, and embedded designs. Using mixed methods approaches in educational research allows the researcher to triangulate, complement, or expand understanding using multiple types of data.
The use of mixed methods data guides the methodology, analysis, and interpretation of the results. Using both qualitative (quant) and quantitative (qual) data analyses provides a clearer or more balanced picture of the results. Data are analyzed sequentially or concurrently depending on the design. While the quantitative and qualitative data are analyzed independently, the results are interpreted integratively. The findings are a synthesis of the quantitative and qualitative analyses.
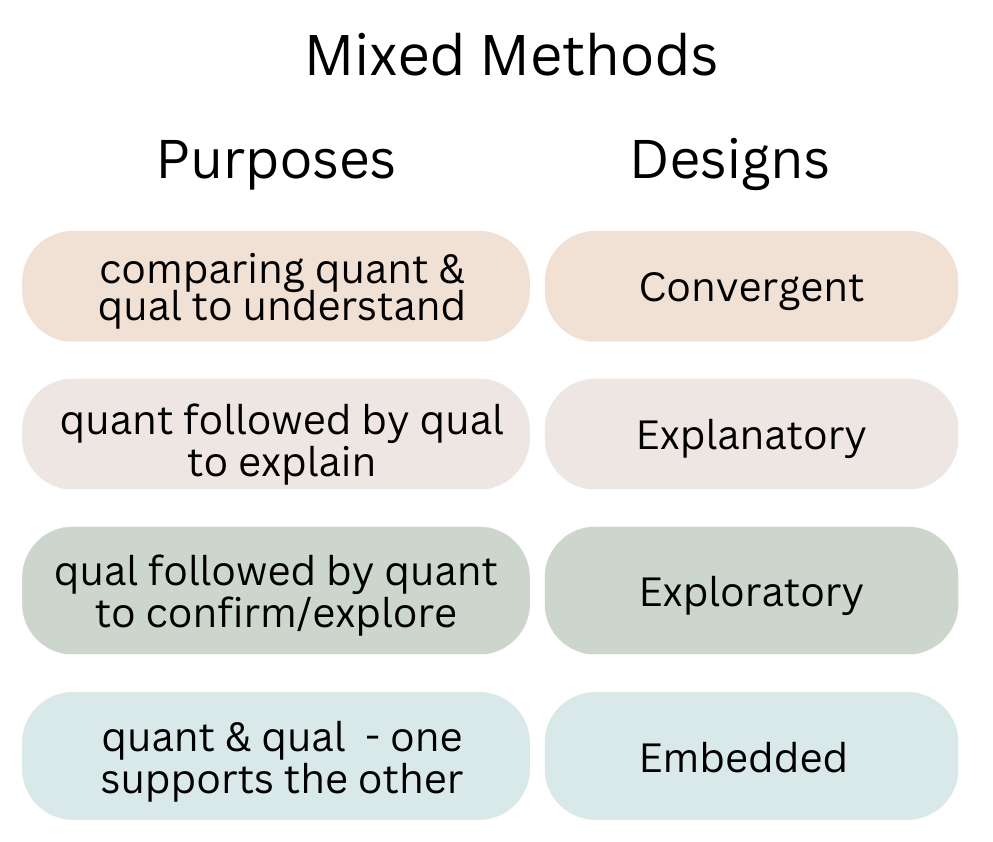
Applied Research Designs
Applied research designs seek both quantitative and qualitative results to address issues of educational practice. Applied research designs include evaluation, design and development, and action research. The purposes of applied research are to identify best practices, to innovate or improve current practices or policies, to test pedagogy, and to evaluate effectiveness. The results of applied research designs provide practical solutions to problems in educational practice.
Applied designs use both theoretical and empirical data. Theoretical data are collected from published theories or other research. Empirical data are obtained by conducting a needs assessment or other data collection methods. Data analyses include both quantitative and qualitative procedures. The findings are interpreted integratively as in mixed methods approaches, and then “applied” to the problem to form a solution.
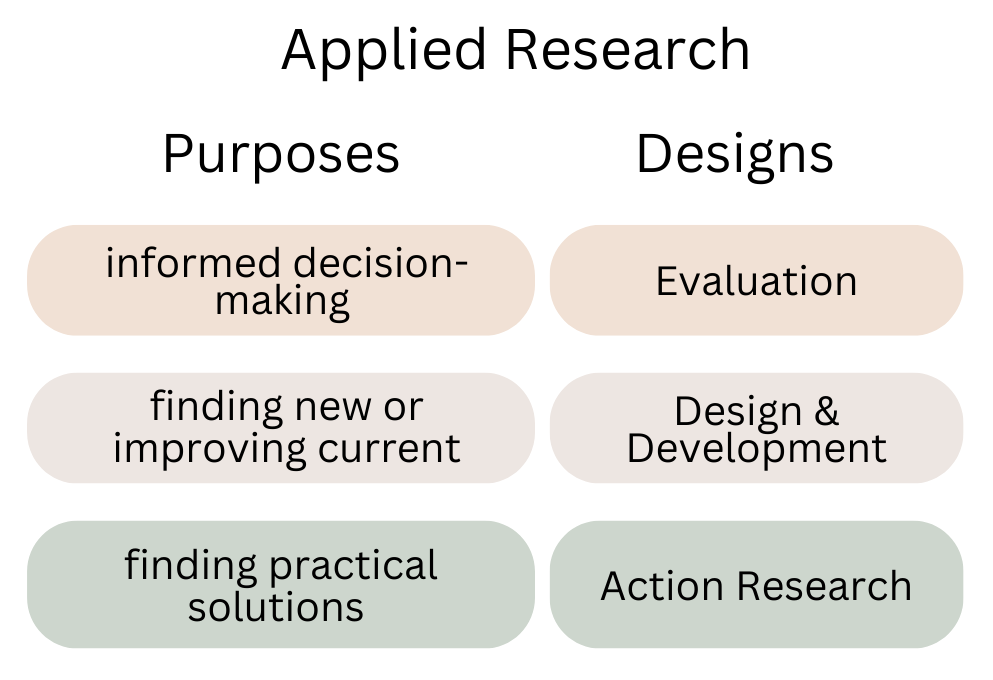
Telling the research story
The Research Design in a research project tells the story of what direction the plot of the story will take. The writing in this heading sets the stage for the rising action of the plot in the research story. The Research Design describes the journey that is about to take place. It functions to guide the reader in understanding the type of path the story will follow. The Research Design is the overall direction of the research story and is determined before deciding on the specific steps to take in obtaining and analyzing the data.
The Research Design heading appears in Chapter 2 of a capstone project. In the capstone project, the Research Design explains the type of design used for conducting the needs assessment.
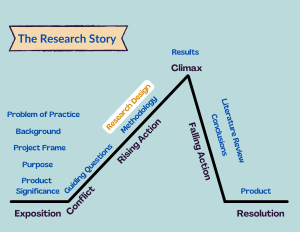
Capstone Projects in Education: Learning the Research Story Copyright © 2023 by Kimberly Chappell and Greg I. Voykhansky is licensed under a Creative Commons Attribution-NonCommercial-ShareAlike 4.0 International License , except where otherwise noted.

Project Planning for the Beginner: Research Design
- Defining a Topic
- Reviewing the Literature
- Developing a Researchable Question
Research Design
- Planning, Data, Writing and Dissemination
What Is a Research Plan?
This refers to the overall plan for your research, and will be used by you and your supervisor to indicate your intentions for your research and the method(s) you’ll use to carry it out. It includes:
• A specification of your research questions
• An outline of your proposed research methods
• A timetable for doing the work
What Is Research Design?
The term “ research design “ is usually used in reference to experimental research, and refers to the design of your experiment. However, you will also see the term “research design” used in other types of research. Below is a list of possible research designs you might encounter or adopt for your research:
• Descriptive or exploratory (e.g., case study , naturalistic observation )
• Correlational (e.g., case-control study, observational study )
• Quasi-experimental (e.g., field experiment , quasi-experiment )
• Experimental (experiment with random allocation and a control and test group )
• Review (e.g. literature review , systematic review )
• Meta-analytic (e.g. meta-analysis )
Research Design Choices
How do i match my research method to my research question.
The method(s) you use must be capable of answering the research questions you have set. Here are some things you may have to consider:
• Often questions can be answered in different ways using different methods
• You may be working with multiple methods
• Methods can answer different sorts of questions
• Questions can be answered in different ways.
The matching of method(s) to questions always matters . Some methods work better for particular sorts of questions.
If your question is a hypothesis which must be falsifiable, you can answer it using the following possible methods:
• An experimental method using statistical methods to test your hypothesis.
• Survey data (either generated by you or secondary data) using statistical methods to test your hypothesis.
If your question requires you to describe a social context and/or process, then you can answer it using the following possible methods:
• You can use data from your own surveys and/or secondary data to carry out descriptive statistics and numerical taxonomy methods for classification .
• You can use qualitative material derived from:
• Documentary research
• Qualitative interviews
• Focus groups
• Visual research
• Ethnographic methods
• Any combination of the above may be deployed.
If your question(s) require you to make causal statements about how certain things have come to be as they are, then you might consider using the following:
• You can build quantitative causal models using techniques which derive from statistical regression analysis and seeing if the models “fit” your quantitative data set.
• You can do this through building simulations .
• You can do this by using figurational methods, particularly qualitative comparative analysis , which start either with the construction of quantitative descriptions of cases from qualitative accounts of those cases, or with an existing data set which contains quantitative descriptions of cases.
• You can combine both approaches.
If your question(s) require you to produce interpretive accounts of human social actions with a focus on the meanings actors have attached to those actions, then you might consider using the following:
• You can use documentary resources which include accounts of action(s) and the meanings actors have attached to those actions. This is a key approach in historical research.
• You can conduct qualitative interviews .
• You can hold focus groups .
• You can do this using ethnographic observation .
• You can combine any or all of above approaches.
If your question(s) are evaluative, this could mean that you have to find out if some intervention has worked, how it has worked if it has, and why it didn’t work if it didn’t. You might then consider using the following:
• Any combination of quantitative and qualitative methods which fit the data you have.
• You should always use process tracing to generate a careful historical account of the intervention and its context(s).
Checklist: Question to Ask When Deciding On a Method
Here are seven questions you should be able to answer about the methods you have chosen for your research.
- Does your method/do your methods fit the research question(s)?
- Do you understand how the methods relate to your methodological position?
- Do you know how to use the method(s) ? If not, can you learn how to use the method(s)?
- Do you have the resources you need to use the methods? For example:
• statistical software
• qualitative data analysis software
• an adequate computer
• access to secondary data sets
• audio-visual equipment
• language training
• transport You need to work through this list and add anything else that you need.
- If you are using multiple methods, do you know how you are going to combine them to carry out the research?
- If you are using multiple methods, do you know how you are going to combine the products of using them when writing up your research?
- << Previous: Developing a Researchable Question
- Next: Planning, Data, Writing and Dissemination >>
- Last Updated: May 11, 2022 2:56 PM
- URL: https://libguides.sph.uth.tmc.edu/c.php?g=949457
- USC Libraries
- Research Guides
Organizing Your Social Sciences Research Paper
- Types of Research Designs
- Purpose of Guide
- Design Flaws to Avoid
- Independent and Dependent Variables
- Glossary of Research Terms
- Reading Research Effectively
- Narrowing a Topic Idea
- Broadening a Topic Idea
- Extending the Timeliness of a Topic Idea
- Academic Writing Style
- Applying Critical Thinking
- Choosing a Title
- Making an Outline
- Paragraph Development
- Research Process Video Series
- Executive Summary
- The C.A.R.S. Model
- Background Information
- The Research Problem/Question
- Theoretical Framework
- Citation Tracking
- Content Alert Services
- Evaluating Sources
- Primary Sources
- Secondary Sources
- Tiertiary Sources
- Scholarly vs. Popular Publications
- Qualitative Methods
- Quantitative Methods
- Insiderness
- Using Non-Textual Elements
- Limitations of the Study
- Common Grammar Mistakes
- Writing Concisely
- Avoiding Plagiarism
- Footnotes or Endnotes?
- Further Readings
- Generative AI and Writing
- USC Libraries Tutorials and Other Guides
- Bibliography
Introduction
Before beginning your paper, you need to decide how you plan to design the study .
The research design refers to the overall strategy and analytical approach that you have chosen in order to integrate, in a coherent and logical way, the different components of the study, thus ensuring that the research problem will be thoroughly investigated. It constitutes the blueprint for the collection, measurement, and interpretation of information and data. Note that the research problem determines the type of design you choose, not the other way around!
De Vaus, D. A. Research Design in Social Research . London: SAGE, 2001; Trochim, William M.K. Research Methods Knowledge Base. 2006.
General Structure and Writing Style
The function of a research design is to ensure that the evidence obtained enables you to effectively address the research problem logically and as unambiguously as possible . In social sciences research, obtaining information relevant to the research problem generally entails specifying the type of evidence needed to test the underlying assumptions of a theory, to evaluate a program, or to accurately describe and assess meaning related to an observable phenomenon.
With this in mind, a common mistake made by researchers is that they begin their investigations before they have thought critically about what information is required to address the research problem. Without attending to these design issues beforehand, the overall research problem will not be adequately addressed and any conclusions drawn will run the risk of being weak and unconvincing. As a consequence, the overall validity of the study will be undermined.
The length and complexity of describing the research design in your paper can vary considerably, but any well-developed description will achieve the following :
- Identify the research problem clearly and justify its selection, particularly in relation to any valid alternative designs that could have been used,
- Review and synthesize previously published literature associated with the research problem,
- Clearly and explicitly specify hypotheses [i.e., research questions] central to the problem,
- Effectively describe the information and/or data which will be necessary for an adequate testing of the hypotheses and explain how such information and/or data will be obtained, and
- Describe the methods of analysis to be applied to the data in determining whether or not the hypotheses are true or false.
The research design is usually incorporated into the introduction of your paper . You can obtain an overall sense of what to do by reviewing studies that have utilized the same research design [e.g., using a case study approach]. This can help you develop an outline to follow for your own paper.
NOTE : Use the SAGE Research Methods Online and Cases and the SAGE Research Methods Videos databases to search for scholarly resources on how to apply specific research designs and methods . The Research Methods Online database contains links to more than 175,000 pages of SAGE publisher's book, journal, and reference content on quantitative, qualitative, and mixed research methodologies. Also included is a collection of case studies of social research projects that can be used to help you better understand abstract or complex methodological concepts. The Research Methods Videos database contains hours of tutorials, interviews, video case studies, and mini-documentaries covering the entire research process.
Creswell, John W. and J. David Creswell. Research Design: Qualitative, Quantitative, and Mixed Methods Approaches . 5th edition. Thousand Oaks, CA: Sage, 2018; De Vaus, D. A. Research Design in Social Research . London: SAGE, 2001; Gorard, Stephen. Research Design: Creating Robust Approaches for the Social Sciences . Thousand Oaks, CA: Sage, 2013; Leedy, Paul D. and Jeanne Ellis Ormrod. Practical Research: Planning and Design . Tenth edition. Boston, MA: Pearson, 2013; Vogt, W. Paul, Dianna C. Gardner, and Lynne M. Haeffele. When to Use What Research Design . New York: Guilford, 2012.
Action Research Design
Definition and Purpose
The essentials of action research design follow a characteristic cycle whereby initially an exploratory stance is adopted, where an understanding of a problem is developed and plans are made for some form of interventionary strategy. Then the intervention is carried out [the "action" in action research] during which time, pertinent observations are collected in various forms. The new interventional strategies are carried out, and this cyclic process repeats, continuing until a sufficient understanding of [or a valid implementation solution for] the problem is achieved. The protocol is iterative or cyclical in nature and is intended to foster deeper understanding of a given situation, starting with conceptualizing and particularizing the problem and moving through several interventions and evaluations.
What do these studies tell you ?
- This is a collaborative and adaptive research design that lends itself to use in work or community situations.
- Design focuses on pragmatic and solution-driven research outcomes rather than testing theories.
- When practitioners use action research, it has the potential to increase the amount they learn consciously from their experience; the action research cycle can be regarded as a learning cycle.
- Action research studies often have direct and obvious relevance to improving practice and advocating for change.
- There are no hidden controls or preemption of direction by the researcher.
What these studies don't tell you ?
- It is harder to do than conducting conventional research because the researcher takes on responsibilities of advocating for change as well as for researching the topic.
- Action research is much harder to write up because it is less likely that you can use a standard format to report your findings effectively [i.e., data is often in the form of stories or observation].
- Personal over-involvement of the researcher may bias research results.
- The cyclic nature of action research to achieve its twin outcomes of action [e.g. change] and research [e.g. understanding] is time-consuming and complex to conduct.
- Advocating for change usually requires buy-in from study participants.
Coghlan, David and Mary Brydon-Miller. The Sage Encyclopedia of Action Research . Thousand Oaks, CA: Sage, 2014; Efron, Sara Efrat and Ruth Ravid. Action Research in Education: A Practical Guide . New York: Guilford, 2013; Gall, Meredith. Educational Research: An Introduction . Chapter 18, Action Research. 8th ed. Boston, MA: Pearson/Allyn and Bacon, 2007; Gorard, Stephen. Research Design: Creating Robust Approaches for the Social Sciences . Thousand Oaks, CA: Sage, 2013; Kemmis, Stephen and Robin McTaggart. “Participatory Action Research.” In Handbook of Qualitative Research . Norman Denzin and Yvonna S. Lincoln, eds. 2nd ed. (Thousand Oaks, CA: SAGE, 2000), pp. 567-605; McNiff, Jean. Writing and Doing Action Research . London: Sage, 2014; Reason, Peter and Hilary Bradbury. Handbook of Action Research: Participative Inquiry and Practice . Thousand Oaks, CA: SAGE, 2001.
Case Study Design
A case study is an in-depth study of a particular research problem rather than a sweeping statistical survey or comprehensive comparative inquiry. It is often used to narrow down a very broad field of research into one or a few easily researchable examples. The case study research design is also useful for testing whether a specific theory and model actually applies to phenomena in the real world. It is a useful design when not much is known about an issue or phenomenon.
- Approach excels at bringing us to an understanding of a complex issue through detailed contextual analysis of a limited number of events or conditions and their relationships.
- A researcher using a case study design can apply a variety of methodologies and rely on a variety of sources to investigate a research problem.
- Design can extend experience or add strength to what is already known through previous research.
- Social scientists, in particular, make wide use of this research design to examine contemporary real-life situations and provide the basis for the application of concepts and theories and the extension of methodologies.
- The design can provide detailed descriptions of specific and rare cases.
- A single or small number of cases offers little basis for establishing reliability or to generalize the findings to a wider population of people, places, or things.
- Intense exposure to the study of a case may bias a researcher's interpretation of the findings.
- Design does not facilitate assessment of cause and effect relationships.
- Vital information may be missing, making the case hard to interpret.
- The case may not be representative or typical of the larger problem being investigated.
- If the criteria for selecting a case is because it represents a very unusual or unique phenomenon or problem for study, then your interpretation of the findings can only apply to that particular case.
Case Studies. Writing@CSU. Colorado State University; Anastas, Jeane W. Research Design for Social Work and the Human Services . Chapter 4, Flexible Methods: Case Study Design. 2nd ed. New York: Columbia University Press, 1999; Gerring, John. “What Is a Case Study and What Is It Good for?” American Political Science Review 98 (May 2004): 341-354; Greenhalgh, Trisha, editor. Case Study Evaluation: Past, Present and Future Challenges . Bingley, UK: Emerald Group Publishing, 2015; Mills, Albert J. , Gabrielle Durepos, and Eiden Wiebe, editors. Encyclopedia of Case Study Research . Thousand Oaks, CA: SAGE Publications, 2010; Stake, Robert E. The Art of Case Study Research . Thousand Oaks, CA: SAGE, 1995; Yin, Robert K. Case Study Research: Design and Theory . Applied Social Research Methods Series, no. 5. 3rd ed. Thousand Oaks, CA: SAGE, 2003.
Causal Design
Causality studies may be thought of as understanding a phenomenon in terms of conditional statements in the form, “If X, then Y.” This type of research is used to measure what impact a specific change will have on existing norms and assumptions. Most social scientists seek causal explanations that reflect tests of hypotheses. Causal effect (nomothetic perspective) occurs when variation in one phenomenon, an independent variable, leads to or results, on average, in variation in another phenomenon, the dependent variable.
Conditions necessary for determining causality:
- Empirical association -- a valid conclusion is based on finding an association between the independent variable and the dependent variable.
- Appropriate time order -- to conclude that causation was involved, one must see that cases were exposed to variation in the independent variable before variation in the dependent variable.
- Nonspuriousness -- a relationship between two variables that is not due to variation in a third variable.
- Causality research designs assist researchers in understanding why the world works the way it does through the process of proving a causal link between variables and by the process of eliminating other possibilities.
- Replication is possible.
- There is greater confidence the study has internal validity due to the systematic subject selection and equity of groups being compared.
- Not all relationships are causal! The possibility always exists that, by sheer coincidence, two unrelated events appear to be related [e.g., Punxatawney Phil could accurately predict the duration of Winter for five consecutive years but, the fact remains, he's just a big, furry rodent].
- Conclusions about causal relationships are difficult to determine due to a variety of extraneous and confounding variables that exist in a social environment. This means causality can only be inferred, never proven.
- If two variables are correlated, the cause must come before the effect. However, even though two variables might be causally related, it can sometimes be difficult to determine which variable comes first and, therefore, to establish which variable is the actual cause and which is the actual effect.
Beach, Derek and Rasmus Brun Pedersen. Causal Case Study Methods: Foundations and Guidelines for Comparing, Matching, and Tracing . Ann Arbor, MI: University of Michigan Press, 2016; Bachman, Ronet. The Practice of Research in Criminology and Criminal Justice . Chapter 5, Causation and Research Designs. 3rd ed. Thousand Oaks, CA: Pine Forge Press, 2007; Brewer, Ernest W. and Jennifer Kubn. “Causal-Comparative Design.” In Encyclopedia of Research Design . Neil J. Salkind, editor. (Thousand Oaks, CA: Sage, 2010), pp. 125-132; Causal Research Design: Experimentation. Anonymous SlideShare Presentation; Gall, Meredith. Educational Research: An Introduction . Chapter 11, Nonexperimental Research: Correlational Designs. 8th ed. Boston, MA: Pearson/Allyn and Bacon, 2007; Trochim, William M.K. Research Methods Knowledge Base. 2006.
Cohort Design
Often used in the medical sciences, but also found in the applied social sciences, a cohort study generally refers to a study conducted over a period of time involving members of a population which the subject or representative member comes from, and who are united by some commonality or similarity. Using a quantitative framework, a cohort study makes note of statistical occurrence within a specialized subgroup, united by same or similar characteristics that are relevant to the research problem being investigated, rather than studying statistical occurrence within the general population. Using a qualitative framework, cohort studies generally gather data using methods of observation. Cohorts can be either "open" or "closed."
- Open Cohort Studies [dynamic populations, such as the population of Los Angeles] involve a population that is defined just by the state of being a part of the study in question (and being monitored for the outcome). Date of entry and exit from the study is individually defined, therefore, the size of the study population is not constant. In open cohort studies, researchers can only calculate rate based data, such as, incidence rates and variants thereof.
- Closed Cohort Studies [static populations, such as patients entered into a clinical trial] involve participants who enter into the study at one defining point in time and where it is presumed that no new participants can enter the cohort. Given this, the number of study participants remains constant (or can only decrease).
- The use of cohorts is often mandatory because a randomized control study may be unethical. For example, you cannot deliberately expose people to asbestos, you can only study its effects on those who have already been exposed. Research that measures risk factors often relies upon cohort designs.
- Because cohort studies measure potential causes before the outcome has occurred, they can demonstrate that these “causes” preceded the outcome, thereby avoiding the debate as to which is the cause and which is the effect.
- Cohort analysis is highly flexible and can provide insight into effects over time and related to a variety of different types of changes [e.g., social, cultural, political, economic, etc.].
- Either original data or secondary data can be used in this design.
- In cases where a comparative analysis of two cohorts is made [e.g., studying the effects of one group exposed to asbestos and one that has not], a researcher cannot control for all other factors that might differ between the two groups. These factors are known as confounding variables.
- Cohort studies can end up taking a long time to complete if the researcher must wait for the conditions of interest to develop within the group. This also increases the chance that key variables change during the course of the study, potentially impacting the validity of the findings.
- Due to the lack of randominization in the cohort design, its external validity is lower than that of study designs where the researcher randomly assigns participants.
Healy P, Devane D. “Methodological Considerations in Cohort Study Designs.” Nurse Researcher 18 (2011): 32-36; Glenn, Norval D, editor. Cohort Analysis . 2nd edition. Thousand Oaks, CA: Sage, 2005; Levin, Kate Ann. Study Design IV: Cohort Studies. Evidence-Based Dentistry 7 (2003): 51–52; Payne, Geoff. “Cohort Study.” In The SAGE Dictionary of Social Research Methods . Victor Jupp, editor. (Thousand Oaks, CA: Sage, 2006), pp. 31-33; Study Design 101. Himmelfarb Health Sciences Library. George Washington University, November 2011; Cohort Study. Wikipedia.
Cross-Sectional Design
Cross-sectional research designs have three distinctive features: no time dimension; a reliance on existing differences rather than change following intervention; and, groups are selected based on existing differences rather than random allocation. The cross-sectional design can only measure differences between or from among a variety of people, subjects, or phenomena rather than a process of change. As such, researchers using this design can only employ a relatively passive approach to making causal inferences based on findings.
- Cross-sectional studies provide a clear 'snapshot' of the outcome and the characteristics associated with it, at a specific point in time.
- Unlike an experimental design, where there is an active intervention by the researcher to produce and measure change or to create differences, cross-sectional designs focus on studying and drawing inferences from existing differences between people, subjects, or phenomena.
- Entails collecting data at and concerning one point in time. While longitudinal studies involve taking multiple measures over an extended period of time, cross-sectional research is focused on finding relationships between variables at one moment in time.
- Groups identified for study are purposely selected based upon existing differences in the sample rather than seeking random sampling.
- Cross-section studies are capable of using data from a large number of subjects and, unlike observational studies, is not geographically bound.
- Can estimate prevalence of an outcome of interest because the sample is usually taken from the whole population.
- Because cross-sectional designs generally use survey techniques to gather data, they are relatively inexpensive and take up little time to conduct.
- Finding people, subjects, or phenomena to study that are very similar except in one specific variable can be difficult.
- Results are static and time bound and, therefore, give no indication of a sequence of events or reveal historical or temporal contexts.
- Studies cannot be utilized to establish cause and effect relationships.
- This design only provides a snapshot of analysis so there is always the possibility that a study could have differing results if another time-frame had been chosen.
- There is no follow up to the findings.
Bethlehem, Jelke. "7: Cross-sectional Research." In Research Methodology in the Social, Behavioural and Life Sciences . Herman J Adèr and Gideon J Mellenbergh, editors. (London, England: Sage, 1999), pp. 110-43; Bourque, Linda B. “Cross-Sectional Design.” In The SAGE Encyclopedia of Social Science Research Methods . Michael S. Lewis-Beck, Alan Bryman, and Tim Futing Liao. (Thousand Oaks, CA: 2004), pp. 230-231; Hall, John. “Cross-Sectional Survey Design.” In Encyclopedia of Survey Research Methods . Paul J. Lavrakas, ed. (Thousand Oaks, CA: Sage, 2008), pp. 173-174; Helen Barratt, Maria Kirwan. Cross-Sectional Studies: Design Application, Strengths and Weaknesses of Cross-Sectional Studies. Healthknowledge, 2009. Cross-Sectional Study. Wikipedia.
Descriptive Design
Descriptive research designs help provide answers to the questions of who, what, when, where, and how associated with a particular research problem; a descriptive study cannot conclusively ascertain answers to why. Descriptive research is used to obtain information concerning the current status of the phenomena and to describe "what exists" with respect to variables or conditions in a situation.
- The subject is being observed in a completely natural and unchanged natural environment. True experiments, whilst giving analyzable data, often adversely influence the normal behavior of the subject [a.k.a., the Heisenberg effect whereby measurements of certain systems cannot be made without affecting the systems].
- Descriptive research is often used as a pre-cursor to more quantitative research designs with the general overview giving some valuable pointers as to what variables are worth testing quantitatively.
- If the limitations are understood, they can be a useful tool in developing a more focused study.
- Descriptive studies can yield rich data that lead to important recommendations in practice.
- Appoach collects a large amount of data for detailed analysis.
- The results from a descriptive research cannot be used to discover a definitive answer or to disprove a hypothesis.
- Because descriptive designs often utilize observational methods [as opposed to quantitative methods], the results cannot be replicated.
- The descriptive function of research is heavily dependent on instrumentation for measurement and observation.
Anastas, Jeane W. Research Design for Social Work and the Human Services . Chapter 5, Flexible Methods: Descriptive Research. 2nd ed. New York: Columbia University Press, 1999; Given, Lisa M. "Descriptive Research." In Encyclopedia of Measurement and Statistics . Neil J. Salkind and Kristin Rasmussen, editors. (Thousand Oaks, CA: Sage, 2007), pp. 251-254; McNabb, Connie. Descriptive Research Methodologies. Powerpoint Presentation; Shuttleworth, Martyn. Descriptive Research Design, September 26, 2008; Erickson, G. Scott. "Descriptive Research Design." In New Methods of Market Research and Analysis . (Northampton, MA: Edward Elgar Publishing, 2017), pp. 51-77; Sahin, Sagufta, and Jayanta Mete. "A Brief Study on Descriptive Research: Its Nature and Application in Social Science." International Journal of Research and Analysis in Humanities 1 (2021): 11; K. Swatzell and P. Jennings. “Descriptive Research: The Nuts and Bolts.” Journal of the American Academy of Physician Assistants 20 (2007), pp. 55-56; Kane, E. Doing Your Own Research: Basic Descriptive Research in the Social Sciences and Humanities . London: Marion Boyars, 1985.
Experimental Design
A blueprint of the procedure that enables the researcher to maintain control over all factors that may affect the result of an experiment. In doing this, the researcher attempts to determine or predict what may occur. Experimental research is often used where there is time priority in a causal relationship (cause precedes effect), there is consistency in a causal relationship (a cause will always lead to the same effect), and the magnitude of the correlation is great. The classic experimental design specifies an experimental group and a control group. The independent variable is administered to the experimental group and not to the control group, and both groups are measured on the same dependent variable. Subsequent experimental designs have used more groups and more measurements over longer periods. True experiments must have control, randomization, and manipulation.
- Experimental research allows the researcher to control the situation. In so doing, it allows researchers to answer the question, “What causes something to occur?”
- Permits the researcher to identify cause and effect relationships between variables and to distinguish placebo effects from treatment effects.
- Experimental research designs support the ability to limit alternative explanations and to infer direct causal relationships in the study.
- Approach provides the highest level of evidence for single studies.
- The design is artificial, and results may not generalize well to the real world.
- The artificial settings of experiments may alter the behaviors or responses of participants.
- Experimental designs can be costly if special equipment or facilities are needed.
- Some research problems cannot be studied using an experiment because of ethical or technical reasons.
- Difficult to apply ethnographic and other qualitative methods to experimentally designed studies.
Anastas, Jeane W. Research Design for Social Work and the Human Services . Chapter 7, Flexible Methods: Experimental Research. 2nd ed. New York: Columbia University Press, 1999; Chapter 2: Research Design, Experimental Designs. School of Psychology, University of New England, 2000; Chow, Siu L. "Experimental Design." In Encyclopedia of Research Design . Neil J. Salkind, editor. (Thousand Oaks, CA: Sage, 2010), pp. 448-453; "Experimental Design." In Social Research Methods . Nicholas Walliman, editor. (London, England: Sage, 2006), pp, 101-110; Experimental Research. Research Methods by Dummies. Department of Psychology. California State University, Fresno, 2006; Kirk, Roger E. Experimental Design: Procedures for the Behavioral Sciences . 4th edition. Thousand Oaks, CA: Sage, 2013; Trochim, William M.K. Experimental Design. Research Methods Knowledge Base. 2006; Rasool, Shafqat. Experimental Research. Slideshare presentation.
Exploratory Design
An exploratory design is conducted about a research problem when there are few or no earlier studies to refer to or rely upon to predict an outcome . The focus is on gaining insights and familiarity for later investigation or undertaken when research problems are in a preliminary stage of investigation. Exploratory designs are often used to establish an understanding of how best to proceed in studying an issue or what methodology would effectively apply to gathering information about the issue.
The goals of exploratory research are intended to produce the following possible insights:
- Familiarity with basic details, settings, and concerns.
- Well grounded picture of the situation being developed.
- Generation of new ideas and assumptions.
- Development of tentative theories or hypotheses.
- Determination about whether a study is feasible in the future.
- Issues get refined for more systematic investigation and formulation of new research questions.
- Direction for future research and techniques get developed.
- Design is a useful approach for gaining background information on a particular topic.
- Exploratory research is flexible and can address research questions of all types (what, why, how).
- Provides an opportunity to define new terms and clarify existing concepts.
- Exploratory research is often used to generate formal hypotheses and develop more precise research problems.
- In the policy arena or applied to practice, exploratory studies help establish research priorities and where resources should be allocated.
- Exploratory research generally utilizes small sample sizes and, thus, findings are typically not generalizable to the population at large.
- The exploratory nature of the research inhibits an ability to make definitive conclusions about the findings. They provide insight but not definitive conclusions.
- The research process underpinning exploratory studies is flexible but often unstructured, leading to only tentative results that have limited value to decision-makers.
- Design lacks rigorous standards applied to methods of data gathering and analysis because one of the areas for exploration could be to determine what method or methodologies could best fit the research problem.
Cuthill, Michael. “Exploratory Research: Citizen Participation, Local Government, and Sustainable Development in Australia.” Sustainable Development 10 (2002): 79-89; Streb, Christoph K. "Exploratory Case Study." In Encyclopedia of Case Study Research . Albert J. Mills, Gabrielle Durepos and Eiden Wiebe, editors. (Thousand Oaks, CA: Sage, 2010), pp. 372-374; Taylor, P. J., G. Catalano, and D.R.F. Walker. “Exploratory Analysis of the World City Network.” Urban Studies 39 (December 2002): 2377-2394; Exploratory Research. Wikipedia.
Field Research Design
Sometimes referred to as ethnography or participant observation, designs around field research encompass a variety of interpretative procedures [e.g., observation and interviews] rooted in qualitative approaches to studying people individually or in groups while inhabiting their natural environment as opposed to using survey instruments or other forms of impersonal methods of data gathering. Information acquired from observational research takes the form of “ field notes ” that involves documenting what the researcher actually sees and hears while in the field. Findings do not consist of conclusive statements derived from numbers and statistics because field research involves analysis of words and observations of behavior. Conclusions, therefore, are developed from an interpretation of findings that reveal overriding themes, concepts, and ideas. More information can be found HERE .
- Field research is often necessary to fill gaps in understanding the research problem applied to local conditions or to specific groups of people that cannot be ascertained from existing data.
- The research helps contextualize already known information about a research problem, thereby facilitating ways to assess the origins, scope, and scale of a problem and to gage the causes, consequences, and means to resolve an issue based on deliberate interaction with people in their natural inhabited spaces.
- Enables the researcher to corroborate or confirm data by gathering additional information that supports or refutes findings reported in prior studies of the topic.
- Because the researcher in embedded in the field, they are better able to make observations or ask questions that reflect the specific cultural context of the setting being investigated.
- Observing the local reality offers the opportunity to gain new perspectives or obtain unique data that challenges existing theoretical propositions or long-standing assumptions found in the literature.
What these studies don't tell you
- A field research study requires extensive time and resources to carry out the multiple steps involved with preparing for the gathering of information, including for example, examining background information about the study site, obtaining permission to access the study site, and building trust and rapport with subjects.
- Requires a commitment to staying engaged in the field to ensure that you can adequately document events and behaviors as they unfold.
- The unpredictable nature of fieldwork means that researchers can never fully control the process of data gathering. They must maintain a flexible approach to studying the setting because events and circumstances can change quickly or unexpectedly.
- Findings can be difficult to interpret and verify without access to documents and other source materials that help to enhance the credibility of information obtained from the field [i.e., the act of triangulating the data].
- Linking the research problem to the selection of study participants inhabiting their natural environment is critical. However, this specificity limits the ability to generalize findings to different situations or in other contexts or to infer courses of action applied to other settings or groups of people.
- The reporting of findings must take into account how the researcher themselves may have inadvertently affected respondents and their behaviors.
Historical Design
The purpose of a historical research design is to collect, verify, and synthesize evidence from the past to establish facts that defend or refute a hypothesis. It uses secondary sources and a variety of primary documentary evidence, such as, diaries, official records, reports, archives, and non-textual information [maps, pictures, audio and visual recordings]. The limitation is that the sources must be both authentic and valid.
- The historical research design is unobtrusive; the act of research does not affect the results of the study.
- The historical approach is well suited for trend analysis.
- Historical records can add important contextual background required to more fully understand and interpret a research problem.
- There is often no possibility of researcher-subject interaction that could affect the findings.
- Historical sources can be used over and over to study different research problems or to replicate a previous study.
- The ability to fulfill the aims of your research are directly related to the amount and quality of documentation available to understand the research problem.
- Since historical research relies on data from the past, there is no way to manipulate it to control for contemporary contexts.
- Interpreting historical sources can be very time consuming.
- The sources of historical materials must be archived consistently to ensure access. This may especially challenging for digital or online-only sources.
- Original authors bring their own perspectives and biases to the interpretation of past events and these biases are more difficult to ascertain in historical resources.
- Due to the lack of control over external variables, historical research is very weak with regard to the demands of internal validity.
- It is rare that the entirety of historical documentation needed to fully address a research problem is available for interpretation, therefore, gaps need to be acknowledged.
Howell, Martha C. and Walter Prevenier. From Reliable Sources: An Introduction to Historical Methods . Ithaca, NY: Cornell University Press, 2001; Lundy, Karen Saucier. "Historical Research." In The Sage Encyclopedia of Qualitative Research Methods . Lisa M. Given, editor. (Thousand Oaks, CA: Sage, 2008), pp. 396-400; Marius, Richard. and Melvin E. Page. A Short Guide to Writing about History . 9th edition. Boston, MA: Pearson, 2015; Savitt, Ronald. “Historical Research in Marketing.” Journal of Marketing 44 (Autumn, 1980): 52-58; Gall, Meredith. Educational Research: An Introduction . Chapter 16, Historical Research. 8th ed. Boston, MA: Pearson/Allyn and Bacon, 2007.
Longitudinal Design
A longitudinal study follows the same sample over time and makes repeated observations. For example, with longitudinal surveys, the same group of people is interviewed at regular intervals, enabling researchers to track changes over time and to relate them to variables that might explain why the changes occur. Longitudinal research designs describe patterns of change and help establish the direction and magnitude of causal relationships. Measurements are taken on each variable over two or more distinct time periods. This allows the researcher to measure change in variables over time. It is a type of observational study sometimes referred to as a panel study.
- Longitudinal data facilitate the analysis of the duration of a particular phenomenon.
- Enables survey researchers to get close to the kinds of causal explanations usually attainable only with experiments.
- The design permits the measurement of differences or change in a variable from one period to another [i.e., the description of patterns of change over time].
- Longitudinal studies facilitate the prediction of future outcomes based upon earlier factors.
- The data collection method may change over time.
- Maintaining the integrity of the original sample can be difficult over an extended period of time.
- It can be difficult to show more than one variable at a time.
- This design often needs qualitative research data to explain fluctuations in the results.
- A longitudinal research design assumes present trends will continue unchanged.
- It can take a long period of time to gather results.
- There is a need to have a large sample size and accurate sampling to reach representativness.
Anastas, Jeane W. Research Design for Social Work and the Human Services . Chapter 6, Flexible Methods: Relational and Longitudinal Research. 2nd ed. New York: Columbia University Press, 1999; Forgues, Bernard, and Isabelle Vandangeon-Derumez. "Longitudinal Analyses." In Doing Management Research . Raymond-Alain Thiétart and Samantha Wauchope, editors. (London, England: Sage, 2001), pp. 332-351; Kalaian, Sema A. and Rafa M. Kasim. "Longitudinal Studies." In Encyclopedia of Survey Research Methods . Paul J. Lavrakas, ed. (Thousand Oaks, CA: Sage, 2008), pp. 440-441; Menard, Scott, editor. Longitudinal Research . Thousand Oaks, CA: Sage, 2002; Ployhart, Robert E. and Robert J. Vandenberg. "Longitudinal Research: The Theory, Design, and Analysis of Change.” Journal of Management 36 (January 2010): 94-120; Longitudinal Study. Wikipedia.
Meta-Analysis Design
Meta-analysis is an analytical methodology designed to systematically evaluate and summarize the results from a number of individual studies, thereby, increasing the overall sample size and the ability of the researcher to study effects of interest. The purpose is to not simply summarize existing knowledge, but to develop a new understanding of a research problem using synoptic reasoning. The main objectives of meta-analysis include analyzing differences in the results among studies and increasing the precision by which effects are estimated. A well-designed meta-analysis depends upon strict adherence to the criteria used for selecting studies and the availability of information in each study to properly analyze their findings. Lack of information can severely limit the type of analyzes and conclusions that can be reached. In addition, the more dissimilarity there is in the results among individual studies [heterogeneity], the more difficult it is to justify interpretations that govern a valid synopsis of results. A meta-analysis needs to fulfill the following requirements to ensure the validity of your findings:
- Clearly defined description of objectives, including precise definitions of the variables and outcomes that are being evaluated;
- A well-reasoned and well-documented justification for identification and selection of the studies;
- Assessment and explicit acknowledgment of any researcher bias in the identification and selection of those studies;
- Description and evaluation of the degree of heterogeneity among the sample size of studies reviewed; and,
- Justification of the techniques used to evaluate the studies.
- Can be an effective strategy for determining gaps in the literature.
- Provides a means of reviewing research published about a particular topic over an extended period of time and from a variety of sources.
- Is useful in clarifying what policy or programmatic actions can be justified on the basis of analyzing research results from multiple studies.
- Provides a method for overcoming small sample sizes in individual studies that previously may have had little relationship to each other.
- Can be used to generate new hypotheses or highlight research problems for future studies.
- Small violations in defining the criteria used for content analysis can lead to difficult to interpret and/or meaningless findings.
- A large sample size can yield reliable, but not necessarily valid, results.
- A lack of uniformity regarding, for example, the type of literature reviewed, how methods are applied, and how findings are measured within the sample of studies you are analyzing, can make the process of synthesis difficult to perform.
- Depending on the sample size, the process of reviewing and synthesizing multiple studies can be very time consuming.
Beck, Lewis W. "The Synoptic Method." The Journal of Philosophy 36 (1939): 337-345; Cooper, Harris, Larry V. Hedges, and Jeffrey C. Valentine, eds. The Handbook of Research Synthesis and Meta-Analysis . 2nd edition. New York: Russell Sage Foundation, 2009; Guzzo, Richard A., Susan E. Jackson and Raymond A. Katzell. “Meta-Analysis Analysis.” In Research in Organizational Behavior , Volume 9. (Greenwich, CT: JAI Press, 1987), pp 407-442; Lipsey, Mark W. and David B. Wilson. Practical Meta-Analysis . Thousand Oaks, CA: Sage Publications, 2001; Study Design 101. Meta-Analysis. The Himmelfarb Health Sciences Library, George Washington University; Timulak, Ladislav. “Qualitative Meta-Analysis.” In The SAGE Handbook of Qualitative Data Analysis . Uwe Flick, editor. (Los Angeles, CA: Sage, 2013), pp. 481-495; Walker, Esteban, Adrian V. Hernandez, and Micheal W. Kattan. "Meta-Analysis: It's Strengths and Limitations." Cleveland Clinic Journal of Medicine 75 (June 2008): 431-439.
Mixed-Method Design
- Narrative and non-textual information can add meaning to numeric data, while numeric data can add precision to narrative and non-textual information.
- Can utilize existing data while at the same time generating and testing a grounded theory approach to describe and explain the phenomenon under study.
- A broader, more complex research problem can be investigated because the researcher is not constrained by using only one method.
- The strengths of one method can be used to overcome the inherent weaknesses of another method.
- Can provide stronger, more robust evidence to support a conclusion or set of recommendations.
- May generate new knowledge new insights or uncover hidden insights, patterns, or relationships that a single methodological approach might not reveal.
- Produces more complete knowledge and understanding of the research problem that can be used to increase the generalizability of findings applied to theory or practice.
- A researcher must be proficient in understanding how to apply multiple methods to investigating a research problem as well as be proficient in optimizing how to design a study that coherently melds them together.
- Can increase the likelihood of conflicting results or ambiguous findings that inhibit drawing a valid conclusion or setting forth a recommended course of action [e.g., sample interview responses do not support existing statistical data].
- Because the research design can be very complex, reporting the findings requires a well-organized narrative, clear writing style, and precise word choice.
- Design invites collaboration among experts. However, merging different investigative approaches and writing styles requires more attention to the overall research process than studies conducted using only one methodological paradigm.
- Concurrent merging of quantitative and qualitative research requires greater attention to having adequate sample sizes, using comparable samples, and applying a consistent unit of analysis. For sequential designs where one phase of qualitative research builds on the quantitative phase or vice versa, decisions about what results from the first phase to use in the next phase, the choice of samples and estimating reasonable sample sizes for both phases, and the interpretation of results from both phases can be difficult.
- Due to multiple forms of data being collected and analyzed, this design requires extensive time and resources to carry out the multiple steps involved in data gathering and interpretation.
Burch, Patricia and Carolyn J. Heinrich. Mixed Methods for Policy Research and Program Evaluation . Thousand Oaks, CA: Sage, 2016; Creswell, John w. et al. Best Practices for Mixed Methods Research in the Health Sciences . Bethesda, MD: Office of Behavioral and Social Sciences Research, National Institutes of Health, 2010Creswell, John W. Research Design: Qualitative, Quantitative, and Mixed Methods Approaches . 4th edition. Thousand Oaks, CA: Sage Publications, 2014; Domínguez, Silvia, editor. Mixed Methods Social Networks Research . Cambridge, UK: Cambridge University Press, 2014; Hesse-Biber, Sharlene Nagy. Mixed Methods Research: Merging Theory with Practice . New York: Guilford Press, 2010; Niglas, Katrin. “How the Novice Researcher Can Make Sense of Mixed Methods Designs.” International Journal of Multiple Research Approaches 3 (2009): 34-46; Onwuegbuzie, Anthony J. and Nancy L. Leech. “Linking Research Questions to Mixed Methods Data Analysis Procedures.” The Qualitative Report 11 (September 2006): 474-498; Tashakorri, Abbas and John W. Creswell. “The New Era of Mixed Methods.” Journal of Mixed Methods Research 1 (January 2007): 3-7; Zhanga, Wanqing. “Mixed Methods Application in Health Intervention Research: A Multiple Case Study.” International Journal of Multiple Research Approaches 8 (2014): 24-35 .
Observational Design
This type of research design draws a conclusion by comparing subjects against a control group, in cases where the researcher has no control over the experiment. There are two general types of observational designs. In direct observations, people know that you are watching them. Unobtrusive measures involve any method for studying behavior where individuals do not know they are being observed. An observational study allows a useful insight into a phenomenon and avoids the ethical and practical difficulties of setting up a large and cumbersome research project.
- Observational studies are usually flexible and do not necessarily need to be structured around a hypothesis about what you expect to observe [data is emergent rather than pre-existing].
- The researcher is able to collect in-depth information about a particular behavior.
- Can reveal interrelationships among multifaceted dimensions of group interactions.
- You can generalize your results to real life situations.
- Observational research is useful for discovering what variables may be important before applying other methods like experiments.
- Observation research designs account for the complexity of group behaviors.
- Reliability of data is low because seeing behaviors occur over and over again may be a time consuming task and are difficult to replicate.
- In observational research, findings may only reflect a unique sample population and, thus, cannot be generalized to other groups.
- There can be problems with bias as the researcher may only "see what they want to see."
- There is no possibility to determine "cause and effect" relationships since nothing is manipulated.
- Sources or subjects may not all be equally credible.
- Any group that is knowingly studied is altered to some degree by the presence of the researcher, therefore, potentially skewing any data collected.
Atkinson, Paul and Martyn Hammersley. “Ethnography and Participant Observation.” In Handbook of Qualitative Research . Norman K. Denzin and Yvonna S. Lincoln, eds. (Thousand Oaks, CA: Sage, 1994), pp. 248-261; Observational Research. Research Methods by Dummies. Department of Psychology. California State University, Fresno, 2006; Patton Michael Quinn. Qualitiative Research and Evaluation Methods . Chapter 6, Fieldwork Strategies and Observational Methods. 3rd ed. Thousand Oaks, CA: Sage, 2002; Payne, Geoff and Judy Payne. "Observation." In Key Concepts in Social Research . The SAGE Key Concepts series. (London, England: Sage, 2004), pp. 158-162; Rosenbaum, Paul R. Design of Observational Studies . New York: Springer, 2010;Williams, J. Patrick. "Nonparticipant Observation." In The Sage Encyclopedia of Qualitative Research Methods . Lisa M. Given, editor.(Thousand Oaks, CA: Sage, 2008), pp. 562-563.
Philosophical Design
Understood more as an broad approach to examining a research problem than a methodological design, philosophical analysis and argumentation is intended to challenge deeply embedded, often intractable, assumptions underpinning an area of study. This approach uses the tools of argumentation derived from philosophical traditions, concepts, models, and theories to critically explore and challenge, for example, the relevance of logic and evidence in academic debates, to analyze arguments about fundamental issues, or to discuss the root of existing discourse about a research problem. These overarching tools of analysis can be framed in three ways:
- Ontology -- the study that describes the nature of reality; for example, what is real and what is not, what is fundamental and what is derivative?
- Epistemology -- the study that explores the nature of knowledge; for example, by what means does knowledge and understanding depend upon and how can we be certain of what we know?
- Axiology -- the study of values; for example, what values does an individual or group hold and why? How are values related to interest, desire, will, experience, and means-to-end? And, what is the difference between a matter of fact and a matter of value?
- Can provide a basis for applying ethical decision-making to practice.
- Functions as a means of gaining greater self-understanding and self-knowledge about the purposes of research.
- Brings clarity to general guiding practices and principles of an individual or group.
- Philosophy informs methodology.
- Refine concepts and theories that are invoked in relatively unreflective modes of thought and discourse.
- Beyond methodology, philosophy also informs critical thinking about epistemology and the structure of reality (metaphysics).
- Offers clarity and definition to the practical and theoretical uses of terms, concepts, and ideas.
- Limited application to specific research problems [answering the "So What?" question in social science research].
- Analysis can be abstract, argumentative, and limited in its practical application to real-life issues.
- While a philosophical analysis may render problematic that which was once simple or taken-for-granted, the writing can be dense and subject to unnecessary jargon, overstatement, and/or excessive quotation and documentation.
- There are limitations in the use of metaphor as a vehicle of philosophical analysis.
- There can be analytical difficulties in moving from philosophy to advocacy and between abstract thought and application to the phenomenal world.
Burton, Dawn. "Part I, Philosophy of the Social Sciences." In Research Training for Social Scientists . (London, England: Sage, 2000), pp. 1-5; Chapter 4, Research Methodology and Design. Unisa Institutional Repository (UnisaIR), University of South Africa; Jarvie, Ian C., and Jesús Zamora-Bonilla, editors. The SAGE Handbook of the Philosophy of Social Sciences . London: Sage, 2011; Labaree, Robert V. and Ross Scimeca. “The Philosophical Problem of Truth in Librarianship.” The Library Quarterly 78 (January 2008): 43-70; Maykut, Pamela S. Beginning Qualitative Research: A Philosophic and Practical Guide . Washington, DC: Falmer Press, 1994; McLaughlin, Hugh. "The Philosophy of Social Research." In Understanding Social Work Research . 2nd edition. (London: SAGE Publications Ltd., 2012), pp. 24-47; Stanford Encyclopedia of Philosophy . Metaphysics Research Lab, CSLI, Stanford University, 2013.
Sequential Design
- The researcher has a limitless option when it comes to sample size and the sampling schedule.
- Due to the repetitive nature of this research design, minor changes and adjustments can be done during the initial parts of the study to correct and hone the research method.
- This is a useful design for exploratory studies.
- There is very little effort on the part of the researcher when performing this technique. It is generally not expensive, time consuming, or workforce intensive.
- Because the study is conducted serially, the results of one sample are known before the next sample is taken and analyzed. This provides opportunities for continuous improvement of sampling and methods of analysis.
- The sampling method is not representative of the entire population. The only possibility of approaching representativeness is when the researcher chooses to use a very large sample size significant enough to represent a significant portion of the entire population. In this case, moving on to study a second or more specific sample can be difficult.
- The design cannot be used to create conclusions and interpretations that pertain to an entire population because the sampling technique is not randomized. Generalizability from findings is, therefore, limited.
- Difficult to account for and interpret variation from one sample to another over time, particularly when using qualitative methods of data collection.
Betensky, Rebecca. Harvard University, Course Lecture Note slides; Bovaird, James A. and Kevin A. Kupzyk. "Sequential Design." In Encyclopedia of Research Design . Neil J. Salkind, editor. (Thousand Oaks, CA: Sage, 2010), pp. 1347-1352; Cresswell, John W. Et al. “Advanced Mixed-Methods Research Designs.” In Handbook of Mixed Methods in Social and Behavioral Research . Abbas Tashakkori and Charles Teddle, eds. (Thousand Oaks, CA: Sage, 2003), pp. 209-240; Henry, Gary T. "Sequential Sampling." In The SAGE Encyclopedia of Social Science Research Methods . Michael S. Lewis-Beck, Alan Bryman and Tim Futing Liao, editors. (Thousand Oaks, CA: Sage, 2004), pp. 1027-1028; Nataliya V. Ivankova. “Using Mixed-Methods Sequential Explanatory Design: From Theory to Practice.” Field Methods 18 (February 2006): 3-20; Bovaird, James A. and Kevin A. Kupzyk. “Sequential Design.” In Encyclopedia of Research Design . Neil J. Salkind, ed. Thousand Oaks, CA: Sage, 2010; Sequential Analysis. Wikipedia.
Systematic Review
- A systematic review synthesizes the findings of multiple studies related to each other by incorporating strategies of analysis and interpretation intended to reduce biases and random errors.
- The application of critical exploration, evaluation, and synthesis methods separates insignificant, unsound, or redundant research from the most salient and relevant studies worthy of reflection.
- They can be use to identify, justify, and refine hypotheses, recognize and avoid hidden problems in prior studies, and explain data inconsistencies and conflicts in data.
- Systematic reviews can be used to help policy makers formulate evidence-based guidelines and regulations.
- The use of strict, explicit, and pre-determined methods of synthesis, when applied appropriately, provide reliable estimates about the effects of interventions, evaluations, and effects related to the overarching research problem investigated by each study under review.
- Systematic reviews illuminate where knowledge or thorough understanding of a research problem is lacking and, therefore, can then be used to guide future research.
- The accepted inclusion of unpublished studies [i.e., grey literature] ensures the broadest possible way to analyze and interpret research on a topic.
- Results of the synthesis can be generalized and the findings extrapolated into the general population with more validity than most other types of studies .
- Systematic reviews do not create new knowledge per se; they are a method for synthesizing existing studies about a research problem in order to gain new insights and determine gaps in the literature.
- The way researchers have carried out their investigations [e.g., the period of time covered, number of participants, sources of data analyzed, etc.] can make it difficult to effectively synthesize studies.
- The inclusion of unpublished studies can introduce bias into the review because they may not have undergone a rigorous peer-review process prior to publication. Examples may include conference presentations or proceedings, publications from government agencies, white papers, working papers, and internal documents from organizations, and doctoral dissertations and Master's theses.
Denyer, David and David Tranfield. "Producing a Systematic Review." In The Sage Handbook of Organizational Research Methods . David A. Buchanan and Alan Bryman, editors. ( Thousand Oaks, CA: Sage Publications, 2009), pp. 671-689; Foster, Margaret J. and Sarah T. Jewell, editors. Assembling the Pieces of a Systematic Review: A Guide for Librarians . Lanham, MD: Rowman and Littlefield, 2017; Gough, David, Sandy Oliver, James Thomas, editors. Introduction to Systematic Reviews . 2nd edition. Los Angeles, CA: Sage Publications, 2017; Gopalakrishnan, S. and P. Ganeshkumar. “Systematic Reviews and Meta-analysis: Understanding the Best Evidence in Primary Healthcare.” Journal of Family Medicine and Primary Care 2 (2013): 9-14; Gough, David, James Thomas, and Sandy Oliver. "Clarifying Differences between Review Designs and Methods." Systematic Reviews 1 (2012): 1-9; Khan, Khalid S., Regina Kunz, Jos Kleijnen, and Gerd Antes. “Five Steps to Conducting a Systematic Review.” Journal of the Royal Society of Medicine 96 (2003): 118-121; Mulrow, C. D. “Systematic Reviews: Rationale for Systematic Reviews.” BMJ 309:597 (September 1994); O'Dwyer, Linda C., and Q. Eileen Wafford. "Addressing Challenges with Systematic Review Teams through Effective Communication: A Case Report." Journal of the Medical Library Association 109 (October 2021): 643-647; Okoli, Chitu, and Kira Schabram. "A Guide to Conducting a Systematic Literature Review of Information Systems Research." Sprouts: Working Papers on Information Systems 10 (2010); Siddaway, Andy P., Alex M. Wood, and Larry V. Hedges. "How to Do a Systematic Review: A Best Practice Guide for Conducting and Reporting Narrative Reviews, Meta-analyses, and Meta-syntheses." Annual Review of Psychology 70 (2019): 747-770; Torgerson, Carole J. “Publication Bias: The Achilles’ Heel of Systematic Reviews?” British Journal of Educational Studies 54 (March 2006): 89-102; Torgerson, Carole. Systematic Reviews . New York: Continuum, 2003.
- << Previous: Purpose of Guide
- Next: Design Flaws to Avoid >>
- Last Updated: Apr 24, 2024 10:51 AM
- URL: https://libguides.usc.edu/writingguide

An official website of the United States government
The .gov means it’s official. Federal government websites often end in .gov or .mil. Before sharing sensitive information, make sure you’re on a federal government site.
The site is secure. The https:// ensures that you are connecting to the official website and that any information you provide is encrypted and transmitted securely.
- Publications
- Account settings
Preview improvements coming to the PMC website in October 2024. Learn More or Try it out now .
- Advanced Search
- Journal List
- Perspect Clin Res
- v.9(4); Oct-Dec 2018
Study designs: Part 1 – An overview and classification
Priya ranganathan.
Department of Anaesthesiology, Tata Memorial Centre, Mumbai, Maharashtra, India
Rakesh Aggarwal
1 Department of Gastroenterology, Sanjay Gandhi Postgraduate Institute of Medical Sciences, Lucknow, Uttar Pradesh, India
There are several types of research study designs, each with its inherent strengths and flaws. The study design used to answer a particular research question depends on the nature of the question and the availability of resources. In this article, which is the first part of a series on “study designs,” we provide an overview of research study designs and their classification. The subsequent articles will focus on individual designs.
INTRODUCTION
Research study design is a framework, or the set of methods and procedures used to collect and analyze data on variables specified in a particular research problem.
Research study designs are of many types, each with its advantages and limitations. The type of study design used to answer a particular research question is determined by the nature of question, the goal of research, and the availability of resources. Since the design of a study can affect the validity of its results, it is important to understand the different types of study designs and their strengths and limitations.
There are some terms that are used frequently while classifying study designs which are described in the following sections.
A variable represents a measurable attribute that varies across study units, for example, individual participants in a study, or at times even when measured in an individual person over time. Some examples of variables include age, sex, weight, height, health status, alive/dead, diseased/healthy, annual income, smoking yes/no, and treated/untreated.
Exposure (or intervention) and outcome variables
A large proportion of research studies assess the relationship between two variables. Here, the question is whether one variable is associated with or responsible for change in the value of the other variable. Exposure (or intervention) refers to the risk factor whose effect is being studied. It is also referred to as the independent or the predictor variable. The outcome (or predicted or dependent) variable develops as a consequence of the exposure (or intervention). Typically, the term “exposure” is used when the “causative” variable is naturally determined (as in observational studies – examples include age, sex, smoking, and educational status), and the term “intervention” is preferred where the researcher assigns some or all participants to receive a particular treatment for the purpose of the study (experimental studies – e.g., administration of a drug). If a drug had been started in some individuals but not in the others, before the study started, this counts as exposure, and not as intervention – since the drug was not started specifically for the study.
Observational versus interventional (or experimental) studies
Observational studies are those where the researcher is documenting a naturally occurring relationship between the exposure and the outcome that he/she is studying. The researcher does not do any active intervention in any individual, and the exposure has already been decided naturally or by some other factor. For example, looking at the incidence of lung cancer in smokers versus nonsmokers, or comparing the antenatal dietary habits of mothers with normal and low-birth babies. In these studies, the investigator did not play any role in determining the smoking or dietary habit in individuals.
For an exposure to determine the outcome, it must precede the latter. Any variable that occurs simultaneously with or following the outcome cannot be causative, and hence is not considered as an “exposure.”
Observational studies can be either descriptive (nonanalytical) or analytical (inferential) – this is discussed later in this article.
Interventional studies are experiments where the researcher actively performs an intervention in some or all members of a group of participants. This intervention could take many forms – for example, administration of a drug or vaccine, performance of a diagnostic or therapeutic procedure, and introduction of an educational tool. For example, a study could randomly assign persons to receive aspirin or placebo for a specific duration and assess the effect on the risk of developing cerebrovascular events.
Descriptive versus analytical studies
Descriptive (or nonanalytical) studies, as the name suggests, merely try to describe the data on one or more characteristics of a group of individuals. These do not try to answer questions or establish relationships between variables. Examples of descriptive studies include case reports, case series, and cross-sectional surveys (please note that cross-sectional surveys may be analytical studies as well – this will be discussed in the next article in this series). Examples of descriptive studies include a survey of dietary habits among pregnant women or a case series of patients with an unusual reaction to a drug.
Analytical studies attempt to test a hypothesis and establish causal relationships between variables. In these studies, the researcher assesses the effect of an exposure (or intervention) on an outcome. As described earlier, analytical studies can be observational (if the exposure is naturally determined) or interventional (if the researcher actively administers the intervention).
Directionality of study designs
Based on the direction of inquiry, study designs may be classified as forward-direction or backward-direction. In forward-direction studies, the researcher starts with determining the exposure to a risk factor and then assesses whether the outcome occurs at a future time point. This design is known as a cohort study. For example, a researcher can follow a group of smokers and a group of nonsmokers to determine the incidence of lung cancer in each. In backward-direction studies, the researcher begins by determining whether the outcome is present (cases vs. noncases [also called controls]) and then traces the presence of prior exposure to a risk factor. These are known as case–control studies. For example, a researcher identifies a group of normal-weight babies and a group of low-birth weight babies and then asks the mothers about their dietary habits during the index pregnancy.
Prospective versus retrospective study designs
The terms “prospective” and “retrospective” refer to the timing of the research in relation to the development of the outcome. In retrospective studies, the outcome of interest has already occurred (or not occurred – e.g., in controls) in each individual by the time s/he is enrolled, and the data are collected either from records or by asking participants to recall exposures. There is no follow-up of participants. By contrast, in prospective studies, the outcome (and sometimes even the exposure or intervention) has not occurred when the study starts and participants are followed up over a period of time to determine the occurrence of outcomes. Typically, most cohort studies are prospective studies (though there may be retrospective cohorts), whereas case–control studies are retrospective studies. An interventional study has to be, by definition, a prospective study since the investigator determines the exposure for each study participant and then follows them to observe outcomes.
The terms “prospective” versus “retrospective” studies can be confusing. Let us think of an investigator who starts a case–control study. To him/her, the process of enrolling cases and controls over a period of several months appears prospective. Hence, the use of these terms is best avoided. Or, at the very least, one must be clear that the terms relate to work flow for each individual study participant, and not to the study as a whole.
Classification of study designs
Figure 1 depicts a simple classification of research study designs. The Centre for Evidence-based Medicine has put forward a useful three-point algorithm which can help determine the design of a research study from its methods section:[ 1 ]

Classification of research study designs
- Does the study describe the characteristics of a sample or does it attempt to analyze (or draw inferences about) the relationship between two variables? – If no, then it is a descriptive study, and if yes, it is an analytical (inferential) study
- If analytical, did the investigator determine the exposure? – If no, it is an observational study, and if yes, it is an experimental study
- If observational, when was the outcome determined? – at the start of the study (case–control study), at the end of a period of follow-up (cohort study), or simultaneously (cross sectional).
In the next few pieces in the series, we will discuss various study designs in greater detail.
Financial support and sponsorship
Conflicts of interest.
There are no conflicts of interest.
Root out friction in every digital experience, super-charge conversion rates, and optimize digital self-service
Uncover insights from any interaction, deliver AI-powered agent coaching, and reduce cost to serve
Increase revenue and loyalty with real-time insights and recommendations delivered to teams on the ground
Know how your people feel and empower managers to improve employee engagement, productivity, and retention
Take action in the moments that matter most along the employee journey and drive bottom line growth
Whatever they’re are saying, wherever they’re saying it, know exactly what’s going on with your people
Get faster, richer insights with qual and quant tools that make powerful market research available to everyone
Run concept tests, pricing studies, prototyping + more with fast, powerful studies designed by UX research experts
Track your brand performance 24/7 and act quickly to respond to opportunities and challenges in your market
Explore the platform powering Experience Management
- Free Account
- For Digital
- For Customer Care
- For Human Resources
- For Researchers
- Financial Services
- All Industries
Popular Use Cases
- Customer Experience
- Employee Experience
- Employee Exit Interviews
- Net Promoter Score
- Voice of Customer
- Customer Success Hub
- Product Documentation
- Training & Certification
- XM Institute
- Popular Resources
- Customer Stories
Market Research
- Artificial Intelligence
- Partnerships
- Marketplace
The annual gathering of the experience leaders at the world’s iconic brands building breakthrough business results, live in Salt Lake City.
- English/AU & NZ
- Español/Europa
- Español/América Latina
- Português Brasileiro
- REQUEST DEMO
What is design research methodology and why is it important?
What is design research.
Design research is the process of gathering, analyzing and interpreting data and insights to inspire, guide and provide context for designs. It’s a research discipline that applies both quantitative and qualitative research methods to help make well-informed design decisions.
Not to be confused with user experience research – focused on the usability of primarily digital products and experiences – design research is a broader discipline that informs the entire design process across various design fields. Beyond focusing solely on researching with users, design research can also explore aesthetics, cultural trends, historical context and more.
Design research has become more important in business, as brands place greater emphasis on building high-quality customer experiences as a point of differentiation.
Elevate Your Brand's Potential with Qualtrics
Design research vs. market research
The two may seem like the same thing at face value, but really they use different methods, serve different purposes and produce different insights.
Design research focuses on understanding user needs, behaviors and experiences to inform and improve product or service design. Market research , on the other hand, is more concerned with the broader market dynamics, identifying opportunities, and maximizing sales and profitability.
Both are essential for the success of a product or service, but cater to different aspects of its lifecycle.
Design research in action: A mini mock case study
A popular furniture brand, known for its sleek and simple designs, faced an unexpected challenge: dropping sales in some overseas markets. To address this, they turned to design research – using quantitative and qualitative methods – to build a holistic view of the issue.
Company researchers visited homes in these areas to interview members of their target audience and understand local living spaces and preferences. Through these visits, they realized that while the local customers appreciated quality, their choices in furniture were heavily influenced by traditions and regional aesthetics, which the company's portfolio wasn’t addressing.
To further their understanding, the company rolled out surveys, asking people about their favorite materials, colors and furniture functionalities. They discovered a consistent desire for versatile furniture pieces that could serve multiple purposes. Additionally, the preference leaned towards certain regional colors and patterns that echoed local culture.
Armed with these insights, the company took to the drawing board. They worked on combining their minimalist style with the elements people in those markets valued. The result was a refreshed furniture line that seamlessly blended the brand's signature simplicity with local tastes. As this new line hit the market, it resonated deeply with customers in the markets, leading to a notable recovery in sales and even attracting new buyers.

When to use design research
Like most forms of research, design research should be used whenever there are gaps in your understanding of your audience’s needs, behaviors or preferences. It’s most valuable when used throughout the product development and design process.
When differing opinions within a team can derail a design process, design research provides concrete data and evidence-based insights, preventing decisions based on assumptions.
Design research brings value to any product development and design process, but it’s especially important in larger, resource intensive projects to minimize risk and create better outcomes for all.
The benefits of design research
Design research may be perceived as time-consuming, but in reality it’s often a time – and money – saver that can. easily prove to be the difference between strong product-market fit and a product with no real audience.
Deeper customer knowledge
Understanding your audience on a granular level is paramount – without tapping into the nuances of their desires, preferences and pain points, you run the risk of misalignment.
Design research dives deep into these intricacies, ensuring that products and services don't just meet surface level demands. Instead, they can resonate and foster a bond between the user and the brand, building foundations for lasting loyalty .
Efficiency and cost savings
More often than not, designing products or services based on assumptions or gut feelings leads to costly revisions, underwhelming market reception and wasted resources.
Design research offers a safeguard against these pitfalls by grounding decisions in real, tangible insights directly from the target market – streamlining the development process and ensuring that every dollar spent yields maximum value.
New opportunities
Design research often brings to light overlooked customer needs and emerging trends. The insights generated can shift the trajectory of product development, open doors to new and novel solutions, and carve out fresh market niches.
Sometimes it's not just about avoiding mistakes – it can be about illuminating new paths of innovation.
Enhanced competitive edge
In today’s world, one of the most powerful ways to stand out as a business is to be relentlessly user focused. By ensuring that products and services are continuously refined based on user feedback, businesses can maintain a step ahead of competitors.
Whether it’s addressing pain points competitors might overlook, or creating user experiences that are not just satisfactory but delightful, design research can be the foundations for a sharpened competitive edge.
Design research methods
The broad scope of design research means it demands a variety of research tools, with both numbers-driven and people-driven methods coming into play. There are many methods to choose from, so we’ve outlined those that are most common and can have the biggest impact.

This stage is about gathering initial insights to set a clear direction.
Literature review
Simply put, this research method involves investigating existing secondary research, like studies and articles, in your design area. It's a foundational method that helps you understand current knowledge and identify any gaps – think of it like surveying the landscape before navigating through it.
Field observations
By observing people's interactions in real-world settings, we gather genuine insights. Field observations are about connecting the dots between observed behaviors and your design's intended purpose. This method proves invaluable as it can reveal how design choices can impact everyday experiences.
Stakeholder interviews
Talking to those invested in the design's outcome, be it users or experts, is key. These discussions provide first-hand feedback that can clarify user expectations and illuminate the path towards a design that resonates with its audience.
This stage is about delving deeper and starting to shape your design concepts based on what you’ve already discovered.
Design review
This is a closer look at existing designs in the market or other related areas. Design reviews are very valuable because they can provide an understanding of current design trends and standards – helping you see where there's room for innovation or improvement.
Without a design review, you could be at risk of reinventing the wheel.
Persona building
This involves creating detailed profiles representing different groups in your target audience using real data and insights.
Personas help bring to life potential users, ensuring your designs address actual needs and scenarios. By having these "stand-in" users, you can make more informed design choices tailored to specific user experiences.
Putting your evolving design ideas to the test and gauging their effectiveness in the real world.
Usability testing
This is about seeing how real users interact with a design.
In usability testing you observe this process, note where they face difficulties and moments of satisfaction. It's a hands-on way to ensure that the design is intuitive and meets user needs.
Benchmark testing
Benchmark testing is about comparing your design's performance against set standards or competitor products.
Doing this gives a clearer idea of where your design stands in the broader context and highlights areas for improvement or differentiation. With these insights you can make informed decisions to either meet or exceed those benchmarks.
This final stage is about gathering feedback once your design is out in the world, ensuring it stays relevant and effective.
Feedback surveys
After users have interacted with the design for some time, use feedback surveys to gather their thoughts. The results of these surveys will help to ensure that you have your finger on the pulse of user sentiment – enabling iterative improvements.
Remember, simple questions can reveal a lot about what's working and where improvements might be needed.
Focus groups
These are structured, moderator-led discussions with a small group of users . The aim is for the conversation to dive deep into their experiences with the design and extract rich insights – not only capturing what users think but also why.
Start your free 30-day trial of DesignXM® today
Understanding what your market wants before they even know it can set your business apart in a saturated market. That's where DesignXM by Qualtrics® comes in – offering a top-tier platform designed for those who want to lead, not just follow.
Why dive into DesignXM?
- Quick insights: Get to the heart of the matter faster and make informed decisions swiftly
- Cost-effective research: Cut back on outsourced studies and get more bang for your buck, all while ensuring top-notch quality
- Premium quality: Stand shoulder to shoulder with leading brands, using best-in-class research methods
Qualtrics // Experience Management
Qualtrics, the leader and creator of the experience management category, is a cloud-native software platform that empowers organizations to deliver exceptional experiences and build deep relationships with their customers and employees.
With insights from Qualtrics, organizations can identify and resolve the greatest friction points in their business, retain and engage top talent, and bring the right products and services to market. Nearly 20,000 organizations around the world use Qualtrics’ advanced AI to listen, understand, and take action. Qualtrics uses its vast universe of experience data to form the largest database of human sentiment in the world. Qualtrics is co-headquartered in Provo, Utah and Seattle.
Related Articles
December 20, 2023
Top market research analyst skills for 2024
November 7, 2023
Brand Experience
The 4 market research trends redefining insights in 2024
September 14, 2023
How BMG and Loop use data to make critical decisions
August 21, 2023
Designing for safety: Making user consent and trust an organizational asset
June 27, 2023
The fresh insights people: Scaling research at Woolworths Group
June 20, 2023
Bank less, delight more: How Bankwest built an engine room for customer obsession
June 16, 2023
How Qualtrics Helps Three Local Governments Drive Better Outcomes Through Data Insights
April 1, 2023
Academic Experience
How to write great survey questions (with examples)
Stay up to date with the latest xm thought leadership, tips and news., request demo.
Ready to learn more about Qualtrics?
Numbers, Facts and Trends Shaping Your World
Read our research on:
Full Topic List
Regions & Countries
- Publications
- Our Methods
- Short Reads
- Tools & Resources
Read Our Research On:
U.S. Surveys
Pew Research Center has deep roots in U.S. public opinion research. Launched initially as a project focused primarily on U.S. policy and politics in the early 1990s, the Center has grown over time to study a wide range of topics vital to explaining America to itself and to the world. Our hallmarks: a rigorous approach to methodological quality, complete transparency as to our methods, and a commitment to exploring and evaluating ongoing developments in data collection. Learn more about how we conduct our domestic surveys here .
The American Trends Panel
Try our email course on polling
Want to know more about polling? Take your knowledge to the next level with a short email mini-course from Pew Research Center. Sign up now .
From the 1980s until relatively recently, most national polling organizations conducted surveys by telephone, relying on live interviewers to call randomly selected Americans across the country. Then came the internet. While it took survey researchers some time to adapt to the idea of online surveys, a quick look at the public polls on an issue like presidential approval reveals a landscape now dominated by online polls rather than phone polls.
Most of our U.S. surveys are conducted on the American Trends Panel (ATP), Pew Research Center’s national survey panel of over 10,000 randomly selected U.S. adults. ATP participants are recruited offline using random sampling from the U.S. Postal Service’s residential address file. Survey length is capped at 15 minutes, and respondents are reimbursed for their time. Respondents complete the surveys online using smartphones, tablets or desktop devices. We provide tablets and data plans to adults without home internet. Learn more about how people in the U.S. take Pew Research Center surveys.

Methods 101
Our video series helps explain the fundamental concepts of survey research including random sampling , question wording , mode effects , non probability surveys and how polling is done around. the world.
The Center also conducts custom surveys of special populations (e.g., Muslim Americans , Jewish Americans , Black Americans , Hispanic Americans , teenagers ) that are not readily studied using national, general population sampling. The Center’s survey research is sometimes paired with demographic or organic data to provide new insights. In addition to our U.S. survey research, you can also read more details on our international survey research , our demographic research and our data science methods.
Our survey researchers are committed to contributing to the larger community of survey research professionals, and are active in AAPOR and is a charter member of the American Association of Public Opinion Research (AAPOR) Transparency Initiative .
Frequently asked questions about surveys
- Why am I never asked to take a poll?
- Can I volunteer to be polled?
- Why should I participate in surveys?
- What good are polls?
- Do pollsters have a code of ethics? If so, what is in the code?
- How are your surveys different from market research?
- Do you survey Asian Americans?
- How are people selected for your polls?
- Do people lie to pollsters?
- Do people really have opinions on all of those questions?
- How can I tell a high-quality poll from a lower-quality one?
Reports on the state of polling
- Key Things to Know about Election Polling in the United States
- A Field Guide to Polling: 2020 Edition
- Confronting 2016 and 2020 Polling Limitations
- What 2020’s Election Poll Errors Tell Us About the Accuracy of Issue Polling
- Q&A: After misses in 2016 and 2020, does polling need to be fixed again? What our survey experts say
- Understanding how 2020 election polls performed and what it might mean for other kinds of survey work
- Can We Still Trust Polls?
- Political Polls and the 2016 Election
- Flashpoints in Polling: 2016
Sign up for our Methods newsletter
The latest on survey methods, data science and more, delivered quarterly.
OTHER RESEARCH METHODS
Sign up for our weekly newsletter.
Fresh data delivered Saturday mornings
1615 L St. NW, Suite 800 Washington, DC 20036 USA (+1) 202-419-4300 | Main (+1) 202-857-8562 | Fax (+1) 202-419-4372 | Media Inquiries
Research Topics
- Age & Generations
- Coronavirus (COVID-19)
- Economy & Work
- Family & Relationships
- Gender & LGBTQ
- Immigration & Migration
- International Affairs
- Internet & Technology
- Methodological Research
- News Habits & Media
- Non-U.S. Governments
- Other Topics
- Politics & Policy
- Race & Ethnicity
- Email Newsletters
ABOUT PEW RESEARCH CENTER Pew Research Center is a nonpartisan fact tank that informs the public about the issues, attitudes and trends shaping the world. It conducts public opinion polling, demographic research, media content analysis and other empirical social science research. Pew Research Center does not take policy positions. It is a subsidiary of The Pew Charitable Trusts .
Copyright 2024 Pew Research Center
Terms & Conditions
Privacy Policy
Cookie Settings
Reprints, Permissions & Use Policy
Thank you for visiting nature.com. You are using a browser version with limited support for CSS. To obtain the best experience, we recommend you use a more up to date browser (or turn off compatibility mode in Internet Explorer). In the meantime, to ensure continued support, we are displaying the site without styles and JavaScript.
- View all journals
- Explore content
- About the journal
- Publish with us
- Sign up for alerts
- Perspective
- Published: 26 June 2023
GREENER principles for environmentally sustainable computational science
- Loïc Lannelongue ORCID: orcid.org/0000-0002-9135-1345 1 , 2 , 3 , 4 ,
- Hans-Erik G. Aronson ORCID: orcid.org/0000-0002-1702-1671 5 ,
- Alex Bateman 6 ,
- Ewan Birney 6 ,
- Talia Caplan ORCID: orcid.org/0000-0001-8990-1435 7 ,
- Martin Juckes ORCID: orcid.org/0000-0003-1770-2132 8 ,
- Johanna McEntyre 6 ,
- Andrew D. Morris 5 ,
- Gerry Reilly 5 &
- Michael Inouye 1 , 2 , 3 , 4 , 9 , 10 , 11
Nature Computational Science volume 3 , pages 514–521 ( 2023 ) Cite this article
7586 Accesses
8 Citations
103 Altmetric
Metrics details
- Computational science
- Environmental impact
- Scientific community
The carbon footprint of scientific computing is substantial, but environmentally sustainable computational science (ESCS) is a nascent field with many opportunities to thrive. To realize the immense green opportunities and continued, yet sustainable, growth of computer science, we must take a coordinated approach to our current challenges, including greater awareness and transparency, improved estimation and wider reporting of environmental impacts. Here, we present a snapshot of where ESCS stands today and introduce the GREENER set of principles, as well as guidance for best practices moving forward.
Improving microbial phylogeny with citizen science within a mass-market video game

Artificial intelligence and illusions of understanding in scientific research

brainlife.io: a decentralized and open-source cloud platform to support neuroscience research
Scientific research and development have transformed and immeasurably improved the human condition, whether by building instruments to unveil the mysteries of the universe, developing treatments to fight cancer or improving our understanding of the human genome. Yet, science can, and frequently does, impact the environment, and the magnitude of these impacts is not always well understood. Given the connection between climate change and human health, it is becoming increasingly apparent to biomedical researchers in particular, as well as their funders, that the environmental effects of research should be taken into account 1 , 2 , 3 , 4 , 5 .
Recent studies have begun to elucidate the environmental impacts of scientific research, with an initial focus on scientific conferences and experimental laboratories 6 . The 2019 Fall Meeting of the American Geophysical Union was estimated to emit 80,000 metric tonnes of CO 2 equivalent (tCO 2 e), equivalent to the average weekly emissions of the city of Edinburgh, UK 7 (CO 2 e, or CO 2 -equivalent, summarizes the global warming impacts of a range of greenhouse gases (GHGs) and is the standard metric for carbon footprints, although its accuracy is sometimes debated 8 ) The annual meeting of the Society for Neuroscience was estimated to emit 22,000 tCO 2 e, approximately the annual carbon footprint of 1,000 medium-sized laboratories 9 . The life-cycle impact (including construction and usage) of university buildings has been estimated at ~0.125 tCO 2 e m −2 yr −1 (ref. 10 ), and the yearly carbon footprint of a typical life-science laboratory at ~20 tCO 2 e (ref. 9 ). The Laboratory Efficiency Assessment Framework (LEAF) is a widely adopted standard to monitor and reduce the carbon footprint of laboratory-based research 11 . Other recent frameworks can help to raise awareness: GES 1point5 12 provides an open-source tool to estimate the carbon footprint of research laboratories and covers buildings, procurement, commuting and travel, and the Environmental Responsibility 5-R Framework provides guidelines for ecologically conscious research 13 .
With the increasing scale of high-performance and cloud computing, the computational sciences are susceptible to having silent and unintended environmental impacts. The sector of information and communication technologies (ICT) was responsible for between 1.8% and 2.8% of global GHG emissions in 2020 14 —more than aviation (1.9% 15 )—and, if unchecked, the ICT carbon footprint could grow exponentially in coming years 14 . Although the environmental impact of experimental ‘wet’ laboratories is more immediately obvious, with their large pieces of equipment and high plastic and reagent usage, the impact of algorithms is less clear and often underestimated. The risks of seeking performance at any cost and the importance of considering energy usage and sustainability when developing new hardware for high-performance computing (HPC) was raised as early as 2007 16 . Since then, continuous improvements have been made by developing new hardware, building lower-energy data centers and implementing more efficient HPC systems 17 , 18 . However, it is only in the past five years that these concerns have reached HPC users, in particular researchers. Notably, the field of artificial intelligence (AI) has first taken note of its environmental impacts, in particular those of the very large language models developed 19 , 20 , 21 , 22 , 23 . It is unclear, however, to what extent this has led the field towards more sustainable research practices. A small number of studies have also been performed in other fields, including bioinformatics 24 , astronomy and astrophysics 25 , 26 , 27 , 28 , particle physics 29 , neuroscience 30 and computational social sciences 31 . Health data science is starting to address the subject, but a recent systematic review found only 25 publications in the field over the past 12 years 32 . In addition to the environmental effects of electricity usage, manufacturing and disposal of hardware, there are also concerns around data centers’ water usage and land footprint 33 . Notably, computational science, in particular AI, has the potential to help fight climate change, for example, by improving the efficiency of wind farms, by facilitating low-carbon urban mobility and by better understanding and anticipating severe weather events 34 .
In this Perspective we highlight the nascent field of environmentally sustainable computational science (ESCS)—what we have learned from the research so far, and what scientists can do to mitigate their environmental impacts. In doing so, we present GREENER (Governance, Responsibility, Estimation, Energy and embodied impacts, New collaborations, Education and Research; Fig. 1 ), a set of principles for how the computational science community could lead the way in sustainable research practices, maximizing computational science’s benefit to both humanity and the environment.

The GREENER principles enable cultural change (blue arrows), which in turn facilitates their implementation (green arrows) and triggers a virtuous circle.
Environmental impacts of the computational sciences
The past three years have seen increased concerns regarding the carbon footprint of computations, and only recently have tools 21 , 35 , 36 , 37 and guidelines 38 been widely available to computational scientists to allow them to estimate their carbon footprint and be more environmentally sustainable.
Most calculators that estimate the carbon footprint of computations are targeted at machine learning tasks and so are primarily suited to Python pipelines, graphics processing units (GPUs) and/or cloud computing 36 , 37 , 39 , 40 . Python libraries have the benefit of integrating well into machine learning pipelines or online calculators for cloud GPUs 21 , 41 . Recently, a flexible online tool, the Green Algorithms calculator 35 , enabled the estimation of the carbon footprint for nearly any computational task, empowering sustainability metrics across fields, hardware, computing platforms and locations.
Some publications, such as ref. 38 , have listed simple actions that computational scientists can take regarding their environmental impact, including estimating the carbon footprint of running algorithms, both a posteriori to acknowledge the impact of a project and before starting as part of a cost–benefit analysis. A 2020 report from The Royal Society formalizes this with the notion of ‘energy proportionality’, meaning the environmental impacts of an innovation must be outweighed by its environmental or societal benefits 34 . It is also important to minimize electronic waste by keeping devices for longer and using second-hand hardware when possible. A 2021 report by the World Health Organization 42 warns of the dramatic effect of e-waste on population health, particularly children. The unregulated informal recycling industry, which handles more than 80% of the 53 million tonnes of e-waste, causes a high level of water, soil and air pollution, often in low- and middle-income countries 43 . The up to 56 million informal waste workers are also exposed to hazardous chemicals such as heavy metals and persistent organic pollutants 42 . Scientists can also choose energy-efficient hardware and computing facilities, while favoring those powered by green energy. Writing efficient code can substantially reduce the carbon footprint as well, and this can be done alongside making hardware requirements and carbon footprints clear when releasing new software. The Green Software Foundation ( https://greensoftware.foundation ) promotes carbon-aware coding to reduce the operational carbon footprint of the softwares used in all aspects of society. There is, however, a rebound effect to making algorithms and hardware more efficient: instead of reducing computing usage, increased efficiency encourages more analyses to be performed, which leads to a revaluation of the cost–benefit but often results in increased carbon footprints. The rebound effect is a key example of why research practice should adapt to technological advances so that they lead to carbon footprint reductions.
GREENER computational science
ESCS is an emerging field, but one that is of rapidly increasing importance given the climate crisis. In the following, our proposed set of principles (Fig. 1 ) outlines the main axes where progress is needed, where opportunities lie and where we believe efforts should be concentrated.
Governance and responsibility
Everyone involved in computational science has a role to play in making the field more sustainable, and many do already, from grassroots movements to large institutions. Individual and institutional responsibility is a necessary step to ensure transparency and reduction of GHG emission. Here we highlight key stakeholders alongside existing initiatives and future opportunities for involvement.
Grassroots initiatives led by graduate students, early career researchers and laboratory technicians have shown great success in tackling the carbon footprint of laboratory work, including Green Labs Netherlands 44 , the Nottingham Technical Sustainability Working Group or the Digital Humanities Climate Coalition 45 . International coalitions such as the Sustainable Research (SuRe) Symposium, initially set up for wet laboratories, have started to address the impact of computing as well. IT teams in HPC centers are naturally key, both in terms of training and ensuring that the appropriate information is logged so that scientists can follow the carbon footprints of their work. Principal investigators can encourage their teams to think about this issue and provide access to suitable training when needed.
Simultaneously, top–down approaches are needed, with funding bodies and journals occupying key positions in both incentivizing carbon-footprint reduction and in promoting transparency. Funding bodies can directly influence the researchers they fund and those applying for funding via their funding policies. They can require estimates of carbon footprints to be included in funding applications as part of ‘environmental impacts statements’. Many funding bodies include sustainability in their guidelines already; see, for example, the UK’s NIHR carbon reduction guidelines 1 , the brief mention of the environment in UKRI’s terms and conditions 46 , and the Wellcome Trust’s carbon-offsetting travel policy 47 .
Although these are important first steps, bolder action is needed to meet the urgency of climate change. For example, UKRI’s digital research infrastructure scoping project 48 , which seeks to provide a roadmap to net zero for its digital infrastructure, sends a clear message that sustainable research includes minimizing the GHG emissions from computation. The project not only raises awareness but will hopefully result in reductions in GHG emissions.
Large research institutes are key to managing and expanding centralized data infrastructures and trusted research environments (TREs). For example, EMBL’s European Bioinformatics Institute manages more than 40 data resources 49 , including AlphaFold DB 50 , which contains over 200,000,000 predicted protein structures that can be searched, browsed and retrieved according to the FAIR principles (findable, accessible, interoperable, reusable) 51 . As a consequence, researchers do not need to run the carbon-intensive AlphaFold algorithm for themselves and instead can just query the database. AlphaFold DB was queried programmatically over 700 million times and the web page was accessed 2.4 million times between August 2021 and October 2022. Institutions also have a role in making procurement decisions carefully, taking into account both the manufacturing and operational footprint of hardware purchases. This is critical, as the lifetime footprint of a computational facility is largely determined by the date it is purchased. Facilities could also better balance investment decisions, with a focus on attracting staff based on sustainable and efficient working environments, rather than high-powered hardware 52 .
However, increases in the efficiencies of digital technology alone are unlikely to prove sufficient in ensuring sustainable resource use 53 . Alongside these investments, funding bodies should support a shift towards more positive, inclusive and green research cultures, recognizing that more data or bigger models do not always translate into greater insights and that a ‘fit for purpose’ approach can ultimately be more efficient. Organizations such as Health Data Research UK and the UK Health Data Research Alliance have a key convening role in ensuring that awareness is raised around the climate impact of both infrastructure investment and computational methods.
Journals may incentivize authors to acknowledge and indeed estimate the carbon footprint of the work presented. Some authors already do this voluntarily (for example, refs. 54 , 55 , 56 , 57 , 58 , 59 ), mostly in bioinformatics and machine learning so far, but there is potential to expand it to other areas of computational science. In some instances, showing that a new tool is greener can be an argument in support of a new method 60 .
International societies in charge of organizing annual conferences may help scientists reduce the carbon footprint of presenting their work by offering hybrid options. The COVID-19 pandemic boosted virtual and hybrid meetings, which have a lower carbon footprint while increasing access and diversity 7 , 61 . Burtscher and colleagues found that running the annual meeting of the European Astronomical Society online emitted >3,000-fold less CO 2 e than the in-person meeting (0.582 tCO 2 e compared to 1,855 tCO 2 e) 25 . Institutions are starting to tackle this; for example, the University of Cambridge has released new travel guidelines encouraging virtual meetings whenever feasible and restricting flights to essential travel, while also acknowledging that different career stages have different needs 62 .
Industry partners will also need to be part of the discussion. Acknowledging and reducing computing environmental impact comes with added challenges in industry, such as shareholder interests and/or public relations. While the EU has backed some initiatives helping ICT-reliant companies to address their carbon footprint, such as ICTfootprint.eu, other major stakeholders have expressed skepticism regarding the environmental issues of machine learning models 63 , 64 . Although challenging, tech industry engagement and inclusion is nevertheless essential for tackling GHG emissions.
Estimate and report the energy consumption of algorithms
Estimating and monitoring the carbon footprint of computations is an essential step towards sustainable research as it identifies inefficiencies and opportunities for improvement. User-level metrics are crucial to understanding environmental impacts and promoting personal responsibility. In some HPC situations, particularly in academia, the financial cost of running computations is negligible and scientists may have the impression of unlimited and inconsequential computing capacity. Quantifying the carbon footprint of individual projects helps raise awareness of the true costs of research.
Although progress has been made in estimating energy usage and carbon footprints over the past few years, there are still barriers that prevent the routine estimation of environmental impacts. From task-agnostic, general-purpose calculators 35 and task-specific packages 36 , 37 , 65 to server-side softwares 66 , 67 , each estimation tool is a trade-off between ease of use and accuracy. A recent primer 68 discusses these different options in more detail and provides recommendations as to which approach fits a particular need.
Regardless of the calculator used, for these tools to work effectively and for scientists to have an accurate representation of their energy consumption, it is important to understand the power management for different components. For example, the power usage of processing cores such as central processing units (CPUs) and GPUs is not a readily available metric; instead, thermal design power (meaning, how much heat the chip can be expected to dissipate in a normal setting) is used. Although an acceptable approximation, it has also been shown to substantially underestimate power usage in some situations 69 . The efficiency of data centers is measured by the power usage effectiveness (PUE), which quantifies how much energy is needed for non-computing tasks, mainly cooling (efficient data centers have PUEs close to 1). This metric is widely used, with large cloud providers reporting low PUEs (for example, 1.11 for Google 70 compared to a global average of 1.57 71 ), but discrepancies in how it is calculated can limit PUE interpretation and thus its impact 72 , 73 , 74 . A standard from the International Organization for Standardization is trying to address this 75 . Unfortunately, the PUE of a particular data center, whether cloud or institutional, is rarely publicly documented. Thus, an important step is the data science and infrastructure community making both hardware and data centers’ energy consumption metrics available to their users and the public. Ultimately, tackling unnecessary carbon footprints will require transparency 34 .
Tackling energy and embodied impacts through new collaborations
Minimizing carbon intensity (meaning the carbon footprint of producing electricity) is one of the most immediately impactful ways to reduce GHG emissions. Carbon intensities depend largely on geographical location, with up to three orders of magnitude between the top and bottom performing high-income countries in terms of low carbon energies (from 0.10 gCO 2 e kWh −1 in Iceland to 770 gCO 2 e kWh −1 in Australia 76 ). Changing the carbon intensity of a local state or national government is nearly always impractical as it would necessitate protracted campaigns to change energy policies. An alternative is to relocate computations to low-carbon settings and countries, but, depending on the type of facility or the sensitivity of the data, this may not always be possible. New inter-institutional cooperation may open up opportunities to enable access to low-carbon data centers in real time.
It is, however, essential to recognize and account for inequalities between countries in terms of access to green energy sources. International cooperation is key to providing scientists from low- and middle-income countries (LMICs), who frequently only have high-carbon-intensity options available to them, access to low-carbon computing infrastructures for their work. In the longer term, international partnerships between organizations and nations can help build low-carbon computing capacity in LMICs.
Furthermore, the footprint of user devices should not be forgotten. In one estimate, the energy footprint of streaming a video to a laptop is mainly on the laptop (72%), with 23% used in transmission and a mere 5% at the data center 77 . Zero clients (user devices with no compute or storage capacity) can be used in some research use cases and drastically reduce the client-side footprint 78 .
It can be tempting to reduce the environmental impacts of computing to electricity needs, as these are the easiest ones to estimate. However, water usage, ecological impacts and embodied carbon footprints from manufacturing should also be addressed. For example, for personal hardware, such as laptops, 70–80% of the life-cycle impact of these devices comes from manufacturing only 79 , as it involves mining raw materials and assembling the different components, which require water and energy. Moreover, manufacturing often takes place in countries that have a higher carbon intensity for power generation and a slower transition to zero-carbon power 80 . Currently, hardware renewal policies, either for work computers or servers in data centers, are often closely dependent on warranties and financial costs, with environmental costs rarely considered. For hardware used in data centers, regular updates may be both financially and environmentally friendly, as efficiency gains may offset manufacturing impacts. Estimating these environmental impacts will allow HPC teams to know for sure. Reconditioned and remanufactured laptops and servers are available, but growth of this sector is currently limited by negative consumer perception 81 . Major suppliers of hardware are making substantial commitments, such as 100% renewable energy supply by 2030 82 or net zero by 2050 83 .
Another key consideration is data storage. Scientific datasets are now measured in petabytes (PB). In genomics, the popular UK Biobank cohort 84 is expected to reach 15 PB by 2025 85 , and the first image of a black hole required the collection of 5 PB of data 86 . The carbon footprint of storing data depends on numerous factors, but based on some manufacturers’ estimations, the order of magnitude of the life-cycle footprint of storing 1 TB of data for a year is ~10 kg CO 2 e (refs. 87 , 88 ). This issue is exacerbated by the duplication of such datasets in order for each institution, and sometimes each research group, to have a copy. Centralized and collaborative computing resources (such as TREs) holding both data and computing hardware may help alleviate redundant resources. TRE efforts in the UK span both health (for example, NHS Digital 89 ) and administrative data (for example, the SAIL databank on the UK Secure Research Platform 90 and the Office for National Statistics Secure Research Service 91 ). Large (hyperscale) data centers are expected to be more energy-efficient 92 , but they may also encourage unnecessary increases in the scale of computing (rebound effect).
The importance of dedicated education and research efforts for ESCS
Education is essential to raise awareness with different stakeholders. In lieu of incorporating some aspects into more formal undergraduate programs, integrating sustainability into computational training courses is a tangible first step toward reducing carbon footprints. An example is the ‘Green Computing’ Workshop on Education at the 2022 conference on Intelligent Systems for Molecular Biology.
Investing in research that will catalyze innovation in the field of ESCS is a crucial role for funders and institutions to play. Although global data centers’ workloads have increased more than sixfold between 2010 and 2018, their total electricity usage has been approximately stable due to the use of power-efficient hardware 93 , but environmentally sustainable investments will be needed to perpetuate this trend. Initiatives like Wellcome’s Research Sustainability project 94 , which look to highlight key gaps where investment could deliver the next generation of ESCS tools and technology, are key to ensuring that growth in energy demand beyond current efficiency trends can be managed in a sustainable way. Similarly, the UKRI Data and Analytics Research Environments UK program (DARE UK) needs to ensure that sustainability is a key evaluation criterion for funding and infrastructure investments for the next generation of TREs.
Recent studies found that the most widely used programming languages in research, such as R and Python 95 , tend to be the least energy-efficient ones 96 , 97 , and, although it is unlikely that forcing the community to switch to more efficient languages would benefit the environment in the short term (due to inefficient coding for example), this highlights the importance of having trained research software engineers within research groups to ensure that the algorithms used are efficiently implemented. There is also scope to use current tools more efficiently by better understanding and monitoring how coding choices impact carbon footprints. Algorithms also come with high memory requirements, sometimes using more energy than processors 98 . Unfortunately, memory power usage remains poorly optimized, as speed of access is almost always favored over energy efficiency 99 . Providing users and software engineers with the flexibility to opt for energy efficiency would present an opportunity for a reduction in GHG emissions 100 , 101 .
Cultural change
In parallel to the technological reductions in energy usage and carbon footprints, research practices will also need to change to avoid rebound effects 38 . Similar to the aviation industry, there is a tendency to count on technology to solve sustainability concerns without having to change usage 102 (that is, waiting on computing to become zero-carbon rather than acting on how we use it). Cultural change in the computing community to reconsider how we think about computing costs will be necessary. Research strategies at all levels will need to consider environmental impacts and corresponding approaches to carbon footprint minimization. The upcoming extension of the LEAF standard for computational laboratories will provide researchers with tangible tools to do so. Day to day, there is a need to solve trade-offs between the speed of computation, accuracy and GHG emissions, keeping in mind the goal of GHG reduction. These changes in scientific practices are challenging, but, importantly, there are synergies between open computational science and green computing 103 . For example, making code, data and models FAIR so that other scientists avoid unnecessary computations can increase the reach and impact of a project. FAIR practices can result in highly efficient code implementations, reduce the need to retrain models, and reduce unnecessary data generation/storage, thus reducing the overall carbon footprint. As a result, green computing and FAIR practices may both stimulate innovation and reduce financial costs.
Moreover, computational science has downstream effects on carbon footprints in other areas. In the biomedical sciences, developments in machine learning and computer vision impact the speed and scale of medical imaging processing. Discoveries in health data science make their way to clinicians and patients through, for example, connected devices. In each of these cases and many others, environmental impacts propagate through the whole digital health sector 32 . Yet, here too synergies exist. In many cases, such as telemedicine, there may be a net benefit in terms of both carbon and patient care, provided that all impacts have been carefully accounted for. These questions are beginning to be tackled in medicine, such as assessments of the environmental impact of telehealth 104 or studies into ways to sustainably handle large volumes of medical imaging data 105 . For the latter, NHS Digital (the UK’s national provider of information, data and IT systems for health and social care) has released guidelines to this effect 106 . Outside the biomedical field, there are immense but, so far, unrealized opportunities for similar efforts.
The computational sciences have an opportunity to lead the way in sustainability, which may be achieved through the GREENER principles for ESCS (Fig. 1 ): Governance, Responsibility, Estimation, Energy and embodied impacts, New collaborations, Education and Research. This will require more transparency on environmental impacts. Although some tools already exist to estimate carbon footprints, more specialized ones will be needed alongside a clearer understanding of the carbon footprint of hardware and facilities, as well as more systematic monitoring and acknowledgment of carbon footprints. Measurement is a first step, followed by a reduction in GHG emissions. This can be achieved with better training and sensible policies for renewing hardware and storing data. Cooperation, open science and equitable access to low-carbon computing facilities will also be crucial 107 . Computing practices will need to adapt to include carbon footprints in cost–benefit analyses, as well as consider the environmental impacts of downstream applications. The development of sustainable solutions will need particularly careful consideration, as they frequently have the least benefit for populations, often in LMICs, who suffer the most from climate change 22 , 108 . All stakeholders have a role to play, from funding bodies, journals and institutions to HPC teams and early career researchers. There is now a window of time and an immense opportunity to transform computational science into an exemplar of broad societal impact and sustainability.
NIHR Carbon Reduction Guidelines (National Institute for Health and Care Research, 2019); https://www.nihr.ac.uk/documents/nihr-carbon-reduction-guidelines/21685
NHS Becomes the World’s First National Health System to Commit to Become ‘Carbon Net Zero’, Backed by Clear Deliverables and Milestones (NHS England, 2020); https://www.england.nhs.uk/2020/10/nhs-becomes-the-worlds-national-health-system-to-commit-to-become-carbon-net-zero-backed-by-clear-deliverables-and-milestones/
Climate and COVID-19: converging crises. Lancet 397 , 71 (2021).
Marazziti, D. et al. Climate change, environment pollution, COVID-19 pandemic and mental health. Sci. Total Environ. 773 , 145182 (2021).
Article Google Scholar
Wellcome Commissions Report on Science’s Environmental Impact (Wellcome, 2022); https://wellcome.org/news/wellcome-commissions-report-sciences-environmental-impact
Towards Climate Sustainability of the Academic System in Europe and Beyond (ALLEA, 2022); https://doi.org/10.26356/climate-sust-acad
Klöwer, M., Hopkins, D., Allen, M. & Higham, J. An analysis of ways to decarbonize conference travel after COVID-19. Nature 583 , 356–359 (2020).
Allen, M. R. et al. A solution to the misrepresentations of CO 2 -equivalent emissions of short-lived climate pollutants under ambitious mitigation. npj Clim. Atmos. Sci. 1 , 16 (2018).
Nathans, J. & Sterling, P. How scientists can reduce their carbon footprint. eLife 5 , e15928 (2016).
Helmers, E., Chang, C. C. & Dauwels, J. Carbon footprinting of universities worldwide part II: first quantification of complete embodied impacts of two campuses in Germany and Singapore. Sustainability 14 , 3865 (2022).
Marshall-Cook, J. & Farley, M. Sustainable Science and the Laboratory Efficiency Assessment Framework ( LEAF ) (UCL, 2023).
Mariette, J. et al. An open-source tool to assess the carbon footprint of research. Environ. Res. Infrastruct. Sustain. 2 , 035008 (2022).
Murray, D. S. et al. The environmental responsibility framework: a toolbox for recognizing and promoting ecologically conscious research. Earth’s Future 11 , e2022EF002964 (2023).
Freitag, C. et al. The real climate and transformative impact of ICT: a critique of estimates, trends and regulations. Patterns 2 , 100340 (2021).
Ritchie, H. Climate change and flying: what share of global CO 2 emissions come from aviation? Our World in Data (22 October 2022); https://ourworldindata.org/co2-emissions-from-aviation
Feng, W. & Cameron, K. The Green500 list: encouraging sustainable supercomputing. Computer 40 , 50–55 (2007).
Garg, S. K., Yeo, C. S., Anandasivam, A. & Buyya, R. Environment-conscious scheduling of HPC applications on distributed cloud-oriented data centers. J. Parallel Distrib. Comput. 71 , 732–749 (2011).
Article MATH Google Scholar
Katal, A., Dahiya, S. & Choudhury, T. Energy efficiency in cloud computing data centers: a survey on software technologies. Clust. Comput. https://doi.org/10.1007/s10586-022-03713-0 (2022).
Strubell, E., Ganesh, A. & McCallum, A. Energy and policy considerations for deep learning in NLP. In Proc. 57th Annual Meeting of the Association for Computational Linguistics 3645–3650 (Association for Computational Linguistics, 2019); https://doi.org/10.18653/v1/P19-1355
Schwartz, R., Dodge, J., Smith, N. A. & Etzioni, O. Green AI. Preprint at https://arxiv.org/abs/1907.10597 (2019).
Lacoste, A., Luccioni, A., Schmidt, V. & Dandres, T. Quantifying the carbon emissions of machine learning. Preprint at https://arxiv.org/abs/1910.09700 (2019).
Bender, E. M., Gebru, T., McMillan-Major, A. & Shmitchell, S. On the dangers of stochastic parrots: can language models be too big? In Proc. 2021 ACM Conference on Fairness , Accountability and Transparency 610–623 (Association for Computing Machinery, 2021); https://doi.org/10.1145/3442188.3445922
Memmel, E., Menzen, C., Schuurmans, J., Wesel, F. & Batselier, K. Towards Green AI with tensor networks—sustainability and innovation enabled by efficient algorithms. Preprint at https://doi.org/10.48550/arXiv.2205.12961 (2022).
Grealey, J. et al. The carbon footprint of bioinformatics. Mol. Biol. Evol. 39 , msac034 (2022).
Burtscher, L. et al. The carbon footprint of large astronomy meetings. Nat. Astron. 4 , 823–825 (2020).
Jahnke, K. et al. An astronomical institute’s perspective on meeting the challenges of the climate crisis. Nat. Astron. 4 , 812–815 (2020).
Stevens, A. R. H., Bellstedt, S., Elahi, P. J. & Murphy, M. T. The imperative to reduce carbon emissions in astronomy. Nat. Astron. 4 , 843–851 (2020).
Portegies Zwart, S. The ecological impact of high-performance computing in astrophysics. Nat. Astron. 4 , 819–822 (2020).
Bloom, K. et al. Climate impacts of particle physics. Preprint at https://arxiv.org/abs/2203.12389 (2022).
Aron, A. R. et al. How can neuroscientists respond to the climate emergency? Neuron 106 , 17–20 (2020).
Leslie, D. Don’t ‘ Research Fast and Break Things ’: on the Ethics of Computational Social Science (Zenodo, 2022); https://doi.org/10.5281/zenodo.6635569
Samuel, G. & Lucassen, A. M. The environmental sustainability of data-driven health research: a scoping review. Digit. Health 8 , 205520762211112 (2022).
Al Kez, D., Foley, A. M., Laverty, D., Del Rio, D. F. & Sovacool, B. Exploring the sustainability challenges facing digitalization and internet data centers. J. Clean. Prod. 371 , 133633 (2022).
Digital Technology and the Planet—Harnessing Computing to Achieve Net Zero (The Royal Society, 2020); https://royalsociety.org/topics-policy/projects/digital-technology-and-the-planet/
Lannelongue, L., Grealey, J. & Inouye, M. Green algorithms: quantifying the carbon footprint of computation. Adv. Sci. 8 , 2100707 (2021).
Henderson, P. et al. Towards the systematic reporting of the energy and carbon footprints of machine learning. J. Mach. Learn. Res. 21 , 10039–10081 (2020).
MathSciNet Google Scholar
Anthony, L. F. W., Kanding, B. & Selvan, R. Carbontracker: tracking and predicting the carbon footprint of training deep learning models. Preprint at https://arxiv.org/abs/2007.03051 (2020).
Lannelongue, L., Grealey, J., Bateman, A. & Inouye, M. Ten simple rules to make your computing more environmentally sustainable. PLoS Comput. Biol. 17 , e1009324 (2021).
Valeye, F. Tracarbon. GitHub https://github.com/fvaleye/tracarbon (2022).
Trébaol, T. CUMULATOR—a Tool to Quantify and Report the Carbon Footprint of Machine Learning Computations and Communication in Academia and Healthcare (École Polytechnique Fédérale de Lausanne, 2020).
Cloud Carbon Footprint —An open source tool to measure and analyze cloud carbon emissions. https://www.cloudcarbonfootprint.org/ (2023).
Children and Digital Dumpsites: E-Waste Exposure and Child Health (World Health Organization, 2021); https://apps.who.int/iris/handle/10665/341718
Sepúlveda, A. et al. A review of the environmental fate and effects of hazardous substances released from electrical and electronic equipments during recycling: examples from China and India. Environ. Impact Assess. Rev. 30 , 28–41 (2010).
Franssen, T. & Johnson, H. The Implementation of LEAF at Public Research Organisations in the Biomedical Sciences: a Report on Organisational Dynamics (Zenodo, 2021); https://doi.org/10.5281/ZENODO.5771609
DHCC Information, Measurement and Practice Action Group. A Researcher Guide to Writing a Climate Justice Oriented Data Management Plan (Zenodo, 2022); https://doi.org/10.5281/ZENODO.6451499
UKRI. UKRI Grant Terms and Conditions (UKRI, 2022); https://www.ukri.org/wp-content/uploads/2022/04/UKRI-050422-FullEconomicCostingGrantTermsConditionsGuidance-Apr2022.pdf
Carbon Offset Policy for Travel—Grant Funding (Wellcome, 2021); https://wellcome.org/grant-funding/guidance/carbon-offset-policy-travel
Juckes, M., Pascoe, C., Woodward, L., Vanderbauwhede, W. & Weiland, M. Interim Report: Complexity, Challenges and Opportunities for Carbon Neutral Digital Research (Zenodo, 2022); https://zenodo.org/record/7016952
Thakur, M. et al. EMBL’s European Bioinformatics Institute (EMBL-EBI) in 2022. Nucleic Acids Res 51 , D9–D17 (2022).
Varadi, M. et al. AlphaFold Protein Structure Database: massively expanding the structural coverage of protein-sequence space with high-accuracy models. Nucleic Acids Res. 50 , D439–D444 (2022).
Wilkinson, M. D. et al. The FAIR Guiding Principles for scientific data management and stewardship. Sci. Data 3 , 160018 (2016).
Bichsel, J. Research Computing : The Enabling Role of Information Technology (Educause, 2012); https://library.educause.edu/resources/2012/11/research-computing-the-enabling-role-of-information-technology
Creutzig, F. et al. Digitalization and the Anthropocene. Annu. Rev. Environ. Resour. 47 , 479–509 (2022).
Yang, L. & Chen, J. A comprehensive evaluation of microbial differential abundance analysis methods: current status and potential solutions. Microbiome 10 , 130 (2022).
Qin, Y. et al. Combined effects of host genetics and diet on human gut microbiota and incident disease in a single population cohort. Nat. Genet. 54 , 134–142 (2022).
Lannelongue, L. & Inouye, M. Inference Mechanisms and Prediction of Protein-Protein Interactions . Preprint at http://biorxiv.org/lookup/doi/10.1101/2022.02.07.479382 (2022).
Dubois, F. The Vehicle Routing Problem for Flash Floods Relief Operations (Univ. Paul Sabatier, 2022).
Thiele, L., Cranmer, M., Coulton, W., Ho, S. & Spergel, D. N. Predicting the thermal Sunyaev-Zel'dovich field using modular and equivariant set-based neural networks. Preprint at https://arxiv.org/abs/2203.00026 (2022).
Armstrong, G. et al. Efficient computation of Faith’s phylogenetic diversity with applications in characterizing microbiomes. Genome Res. 31 , 2131–2137 (2021).
Mbatchou, J. et al. Computationally efficient whole-genome regression for quantitative and binary traits. Nat. Genet. 53 , 1097–1103 (2021).
Estien, C. O., Myron, E. B., Oldfield, C. A. & Alwin, A. & Ecological Society of America Student Section Virtual scientific conferences: benefits and how to support underrepresented students. Bull. Ecol. Soc. Am. 102 , e01859 (2021).
University of Cambridge. Guidelines for Sustainable Business Travel (Univ. Cambridge, 2022); https://www.environment.admin.cam.ac.uk/files/guidelines_for_sustainable_business_travel_approved.pdf
Patterson, D. et al. Carbon emissions and large neural network training. Preprint at https://arxiv.org/abs/2104.10350 (2021).
Patterson, D. et al. The carbon footprint of machine learning training will plateau, then shrink. Computer 55 , 18–28 (2022).
Neuroimaging Pipeline Carbon Tracker Toolboxes (OHBM SEA-SIG, 2023); https://ohbm-environment.org/carbon-tracker-toolboxes/
Lannelongue, L. Green Algorithms for High Performance Computing (GitHub, 2022); https://github.com/Llannelongue/GreenAlgorithms4HPC
Carbon Footprint Reporting—Customer Carbon Footprint Tool (Amazon Web Services, 2023); https://aws.amazon.com/aws-cost-management/aws-customer-carbon-footprint-tool/
Lannelongue, L. & Inouye, M. Carbon footprint estimation for computational research. Nat. Rev. Methods Prim. 3 , 9 (2023).
Cutress, I. Why Intel Processors Draw More Power Than Expected : TDP and Turbo Explained (Anandtech, 2018); https://www.anandtech.com/show/13544/why-intel-processors-draw-more-power-than-expected-tdp-turbo
Efficiency. Google Data Centers https://www.google.com/about/datacenters/efficiency/
Uptime Institute Releases 2021 Global Data Center Survey (Facility Executive, 2021); https://facilityexecutive.com/2021/09/uptime-institute-releases-2021-global-data-center-survey/
Zoie, R. C., Mihaela, R. D. & Alexandru, S. An analysis of the power usage effectiveness metric in data centers. In Proc. 2017 5th International Symposium on Electrical and Electronics Engineering ( ISEEE ) 1–6 (IEEE, 2017); https://doi.org/10.1109/ISEEE.2017.8170650
Yuventi, J. & Mehdizadeh, R. A critical analysis of power usage effectiveness and its use in communicating data center energy consumption. Energy Build. 64 , 90–94 (2013).
Avelar, V., Azevedo, D. & French, A. (eds) PUE: A Comprehensive Examination of the Metric White Paper No. 49 (Green Grid, 2012).
Power Usage Effectiveness (PUE) (ISO/IEC); https://www.iso.org/obp/ui/#iso:std:iso-iec:30134:-2:ed-1:v1:en
2022 Country Specific Electricity Grid Greenhouse Gas Emission Factors (Carbon Footprint, 2023); https://www.carbonfootprint.com/docs/2023_02_emissions_factors_sources_for_2022_electricity_v10.pdf
Kamiya, G. The Carbon Footprint of Streaming Video: Fact-Checking the Headlines—Analysis (IEA, 2020); https://www.iea.org/commentaries/the-carbon-footprint-of-streaming-video-fact-checking-the-headlines
Rot, A., Chrobak, P. & Sobinska, M. Optimisation of the use of IT infrastructure resources in an institution of higher education: a case study. In Proc. 2019 9th International Conference on Advanced Computer Information Technologies ( ACIT ) 171–174 (IEEE, 2019); https://doi.org/10.1109/ACITT.2019.8780018
Clément, L.-P. P.-V. P., Jacquemotte, Q. E. S. & Hilty, L. M. Sources of variation in life cycle assessments of smartphones and tablet computers. Environ. Impact Assess. Rev. 84 , 106416 (2020).
Kamal, K. Y. The silicon age: trends in semiconductor devices industry. JESTR 15 , 110–115 (2022).
Gåvertsson, I., Milios, L. & Dalhammar, C. Quality labelling for re-used ICT equipment to support consumer choice in the circular economy. J. Consum. Policy 43 , 353–377 (2020).
Intel Corporate Responsibility Report 2021–2022 (Intel, 2022); https://csrreportbuilder.intel.com/pdfbuilder/pdfs/CSR-2021-22-Full-Report.pdf
TSMC Task Force on Climate-related Financial Disclosures (TSMC, 2020); https://esg.tsmc.com/download/file/TSMC_TCFD_Report_E.pdf
Bycroft, C. et al. The UK Biobank resource with deep phenotyping and genomic data. Nature 562 , 203–209 (2018).
UK Biobank Creates Cloud-Based Health Data Analysis Platform to Unleash the Imaginations of the World’s Best Scientific Minds (UK Biobank, 2020); https://www.ukbiobank.ac.uk/learn-more-about-uk-biobank/news/uk-biobank-creates-cloud-based-health-data-analysis-platform-to-unleash-the-imaginations-of-the-world-s-best-scientific-minds
Jackson, K. A picture is worth a petabyte of data. Science Node (5 June 2019).
Nguyen, B. H. et al. Architecting datacenters for sustainability: greener data storage using synthetic DNA. In Proc. Electronics Goes Green 2020 (ed. Schneider-Ramelow, F.) 105 (Fraunhofer, 2020).
Seagate Product Sustainability (Seagate, 2023); https://www.seagate.com/gb/en/global-citizenship/product-sustainability/
Madden, S. & Pollard, C. Principles and Best Practices for Trusted Research Environments (NHS England, 2021); https://transform.england.nhs.uk/blogs/principles-and-practice-for-trusted-research-environments/
Jones, K. H., Ford, D. V., Thompson, S. & Lyons, R. A profile of the SAIL Databank on the UK secure research platform. Int. J. Popul. Data Sci. 4 , 1134 (2020).
Google Scholar
About the Secure Research Service (Office for National Statistics); https://www.ons.gov.uk/aboutus/whatwedo/statistics/requestingstatistics/secureresearchservice/aboutthesecureresearchservice
Shehabi, A. et al. United States Data Center Energy Usage Report Report no. LBNL-1005775, 1372902 (Office of Scientific and Technical Information, 2016); http://www.osti.gov/servlets/purl/1372902/
Masanet, E., Shehabi, A., Lei, N., Smith, S. & Koomey, J. Recalibrating global data center energy-use estimates. Science 367 , 984–986 (2020).
Caplan, T. Help Us Advance Environmentally Sustainable Research (Wellcome, 2022); https://medium.com/wellcome-data/help-us-advance-environmentally-sustainable-research-3c11fe2a8298
Choueiry, G. Programming Languages Popularity in 12,086 Research Papers (Quantifying Health, 2023); https://quantifyinghealth.com/programming-languages-popularity-in-research/
Pereira, R. et al. Ranking programming languages by energy efficiency. Sci. Comput. Program. 205 , 102609 (2021).
Lin, Y. & Danielsson, J. Choosing a Numerical Programming Language for Economic Research: Julia, MATLAB, Python or R (Centre for Economic Policy Research, 2022); https://cepr.org/voxeu/columns/choosing-numerical-programming-language-economic-research-julia-matlab-python-or-r
Appuswamy, R., Olma, M. & Ailamaki, A. Scaling the memory power wall with DRAM-aware data management. In Proc. 11th International Workshop on Data Management on New Hardware 1–9 (ACM, 2015); https://doi.org/10.1145/2771937.2771947
Guo, B., Yu, J., Yang, D., Leng, H. & Liao, B. Energy-efficient database systems: a systematic survey. ACM Comput. Surv. 55 , 111 (2022).
Karyakin, A. & Salem, K. An analysis of memory power consumption in database systems. In Proc. 13th International Workshop on Data Management on New Hardware—DAMON ’ 17 1–9 (ACM Press, 2017); https://doi.org/10.1145/3076113.3076117
Karyakin, A. & Salem, K. DimmStore: memory power optimization for database systems. Proc. VLDB Endow. 12 , 1499–1512 (2019).
Caset, F., Boussauw, K. & Storme, T. Meet & fly: sustainable transport academics and the elephant in the room. J. Transp. Geogr. 70 , 64–67 (2018).
Govaart, G. H., Hofmann, S. M. & Medawar, E. The sustainability argument for open science. Collabra Psychol. 8 , 35903 (2022).
Cockrell, H. C. et al. Environmental impact of telehealth use for pediatric surgery. J. Pediatr. Surg. 57 , 865–869 (2022).
Alshqaqeeq, F., McGuire, C., Overcash, M., Ali, K. & Twomey, J. Choosing radiology imaging modalities to meet patient needs with lower environmental impact. Resour. Conserv. Recycl. 155 , 104657 (2020).
Sustainability Annual Report 2020–2021 (NHS, 2021); https://digital.nhs.uk/about-nhs-digital/corporate-information-and-documents/sustainability/sustainability-reports/sustainability-annual-report-2020-21
UNESCO Recommendation on Open Science (UNESCO, 2021); https://en.unesco.org/science-sustainable-future/open-science/recommendation
Samuel, G. & Richie, C. Reimagining research ethics to include environmental sustainability: a principled approach, including a case study of data-driven health research. J. Med. Ethics https://doi.org/10.1136/jme-2022-108489 (2022).
Download references
Acknowledgements
L.L. was supported by the University of Cambridge MRC DTP (MR/S502443/1) and the BHF program grant (RG/18/13/33946). M.I. was supported by the Munz Chair of Cardiovascular Prediction and Prevention and the NIHR Cambridge Biomedical Research Centre (BRC-1215-20014; NIHR203312). M.I. was also supported by the UK Economic and Social Research 878 Council (ES/T013192/1). This work was supported by core funding from the British Heart Foundation (RG/13/13/30194; RG/18/13/33946) and the NIHR Cambridge Biomedical Research Centre (BRC-1215-20014; NIHR203312). The views expressed are those of the author(s) and not necessarily those of the NIHR or the Department of Health and Social Care. This work was also supported by Health Data Research UK, which is funded by the UK Medical Research Council, Engineering and Physical Sciences Research Council, Economic and Social Research Council, Department of Health and Social Care (England), Chief Scientist Office of the Scottish Government Health and Social Care Directorates, Health and Social Care Research and Development Division (Welsh Government), Public Health Agency (Northern Ireland) and the British Heart Foundation and Wellcome.
Author information
Authors and affiliations.
Cambridge Baker Systems Genomics Initiative, Department of Public Health and Primary Care, University of Cambridge, Cambridge, UK
Loïc Lannelongue & Michael Inouye
British Heart Foundation Cardiovascular Epidemiology Unit, Department of Public Health and Primary Care, University of Cambridge, Cambridge, UK
Victor Phillip Dahdaleh Heart and Lung Research Institute, University of Cambridge, Cambridge, UK
Health Data Research UK Cambridge, Wellcome Genome Campus and University of Cambridge, Cambridge, UK
Health Data Research (HDR) UK, London, UK
Hans-Erik G. Aronson, Andrew D. Morris & Gerry Reilly
European Molecular Biology Laboratory, European Bioinformatics Institute (EMBL-EBI), Wellcome Genome Campus, Hinxton, UK
Alex Bateman, Ewan Birney & Johanna McEntyre
Wellcome Trust, London, UK
Talia Caplan
RAL Space, Science and Technology Facilities Council, Harwell Campus, Didcot, UK
Martin Juckes
Cambridge Baker Systems Genomics Initiative, Baker Heart and Diabetes Institute, Melbourne, Victoria, Australia
Michael Inouye
British Heart Foundation Centre of Research Excellence, University of Cambridge, Cambridge, UK
The Alan Turing Institute, London, UK
You can also search for this author in PubMed Google Scholar
Contributions
L.L. conceived and coordinated the manuscript. M.I. organized and edited the manuscript. All authors contributed to the writing and revision of the manuscript.
Corresponding author
Correspondence to Loïc Lannelongue .
Ethics declarations
Competing interests.
The authors declare no competing interests.
Peer review
Peer review information.
Nature Computational Science thanks Bernabe Dorronsoro and Kirk Cameron for their contribution to the peer review of this work. Primary Handling Editors: Kaitlin McCardle and Ananya Rastogi, in collaboration with the Nature Computational Science team.
Additional information
Publisher’s note Springer Nature remains neutral with regard to jurisdictional claims in published maps and institutional affiliations.
Rights and permissions
Springer Nature or its licensor (e.g. a society or other partner) holds exclusive rights to this article under a publishing agreement with the author(s) or other rightsholder(s); author self-archiving of the accepted manuscript version of this article is solely governed by the terms of such publishing agreement and applicable law.
Reprints and permissions
About this article
Cite this article.
Lannelongue, L., Aronson, HE.G., Bateman, A. et al. GREENER principles for environmentally sustainable computational science. Nat Comput Sci 3 , 514–521 (2023). https://doi.org/10.1038/s43588-023-00461-y
Download citation
Received : 06 November 2022
Accepted : 09 May 2023
Published : 26 June 2023
Issue Date : June 2023
DOI : https://doi.org/10.1038/s43588-023-00461-y
Share this article
Anyone you share the following link with will be able to read this content:
Sorry, a shareable link is not currently available for this article.
Provided by the Springer Nature SharedIt content-sharing initiative
This article is cited by
Prioritize environmental sustainability in use of ai and data science methods.
- Caroline Jay
- David Topping
Nature Geoscience (2024)
A holistic approach to environmentally sustainable computing
- Andrea Pazienza
- Giovanni Baselli
- Maria Vittoria Trussoni
Innovations in Systems and Software Engineering (2024)
The carbon footprint of computational research
Nature Computational Science (2023)
Quick links
- Explore articles by subject
- Guide to authors
- Editorial policies
Sign up for the Nature Briefing: Anthropocene newsletter — what matters in anthropocene research, free to your inbox weekly.

FHSU interdisciplinary team empowers survivors through art and storytelling

By FHSU University Communications
HAYS, Kan. - FHSU students and faculty from Criminal Justice, Clinical Psychology, and Art and Design recently created a pilot research project to explore the often-neglected facets of gender-based violence through art illustration and storytelling. Through this innovative project, researchers and artists use art and storytelling as tools to empower survivors and individuals navigating trauma, fostering resilience along the way.
An interdisciplinary team presented their pilot project research at ResilienceCon in Nashville, Tenn., April 14-17. The project was funded through FHSU’s Undergraduate Research Experience and Education Opportunity Fund.
“Working with other people’s stories has taught me a lot about the universal language of art,” said Jenny Cox, senior art and design student. “The majority of people we presented to, though they weren’t artists, found connection with our work.”
The team’s project invites survivors to reclaim their narratives and find strength in shared experiences. Through the transformative power of storytelling and art, survivors are building bridges of empathy and understanding.
Tasanya Rowe, a research team member pursuing a master’s in clinical psychology, was recognized with the Life Promising Scholar Honorable Mention, an accolade typically reserved for doctoral candidates and established scholars.
“Presenting our findings at ResilienceCon was an incredibly rewarding experience that allowed us to share our passion for understanding and addressing gender-based violence through the lens of illustrations and resilience,” Rowe said. “Engaging with fellow researchers and practitioners at the conference provided valuable feedback and perspectives, enriching our understanding and shaping future directions for our work.”
Team members attending ResilienceCon included: Matthias Pearce (Criminal Justice, B.S.); Tasanya Rowe (Clinical Psychology, MS); Emily Schoeppner, (Art Education with an emphasis in painting and drawing, B.A.); Jenny Cox (Drawing, B.F.A); Lexis Beesley (Painting and Drawing, B.F.A.); Amy Schmierbach; (Art and Design, M.F.A.); Ziwei Qi (Criminal Justice, Ph. D).
For information on the team’s research and upcoming initiatives, please contact Dr. Ziwei Qi at [email protected] or Amy Schmierbach at [email protected] .
University Communications Fort Hays State University 600 Park Street Hays, KS 67601 785-628-4208
© HKS Inc 2024
- Privacy Policy
- Terms of Use

CUNY Lehman College Nursing Education, Research, and Practice Center City University of New York Helps Heal Nursing Shortage Gap
Bronx, New York USA
The Challenge
The Department of Nursing at Lehman College was located within an older classroom building that was never intended to house nursing skills training. Instructors created makeshift patient rooms and simulation environments, but the real-life environment setting that benefits nursing students was missing. Their space also did not meet current health care standards for minimum room areas and bedside clearances, making bedside training difficult, especially when multiple students were involved. As the only 4-year college in the Bronx, with nursing being one of the top five- majors at the school, CUNY asked HKS to give the nursing program the physical prominence on campus to match the critical nature of educating nurses. The goal was to impact local health outcomes in the disparity-challenged Bronx and to make strides toward mitigating the area’s nursing shortage.
The Design Solution
The Lehman College Nursing Education, Research, and Practice Center promotes student success by providing real-life immersive learning environments lacking in their previous facilities. The first level of the new 4-story building is dedicated to a lobby, computer lab, classrooms and a student lounge. Levels 2 and 3 house graduate research labs, faculty offices, dean’s suite, conference rooms and more classrooms. The inclusion of graduate labs for supporting and furthering doctoral research reinforces Lehman’s commitment to creating leaders in nursing. In the basement, students find state-of-the-art nursing skills labs and simulation lab. The basement level was built into the hillside, allowing daylighting from the north, so all skills and simulation rooms are daylit and have exterior views, as a true patient room would in a hospital. These improved learning environments are tailored to the pedagogy and student needs.
A central theme of the healing power of nature is reflected in the interior color palette of green and natural tones, with daylighting and views to nature promoted on all levels of the building. The nursing labs are adjacent to each other, which is convenient for students and faculty, and allows for training in the continuum of care and interdisciplinary scenarios.
The Design Impact
The Nursing Education, Research, and Practice Center features leading technologies to support the education of nurses capable of caring for the underserved population of the Bronx. College administrators emphasized the importance of having trained nurses in the local workforce who can speak the various second languages prevalent in the Bronx, and who can understand the culture of their patient population, such as diet and cultural traditions.
The college is a leading institution for social mobility in New York state and the Northeast. Earning a degree in nursing and passing the NCLEX sets a student up for a $70,000 annual salary, which can boost a low-income family into the middle class.
The impact on recruitment and retention of nursing students positively impacts local health outcomes and helps resolve the critical local nursing shortage situation.

Project Features
- Simulation center
- Nursing skills lab
- Faculty/staff offices
- Physical assessment lab
- Computer laboratories
- Student lounge and support space

Explore Further
Related Content

Jennifer McKeel
Senior Designer
AIA, LEED AP, NCARB

U.S. Food and Drug Administration Laboratory

University of Miami Medical Education and Research Building

Eric Thomas
Office Director
AIA, LEED AP

Life Science

Emory Executive Park Musculoskeletal Institute

Pamela Basch
Senior Project Manager
Cookies on the HKS website We use cookies on our website. By continuing to use this site, without changing your settings, you consent to our use of cookies in accordance with our privacy policy.

Renderings Revealed for New Columbia University Biomedical Research Building in Washington Heights, Manhattan

By: Max Gillespie 7:30 am on April 24, 2024
Renderings have been revealed for a new biomedical research building on Columbia University ‘s medical campus in Washington Heights , Manhattan . Designed by Kohn Pedersen Fox , the eight-story structure will house biomedical research and lab facilities, as well as symposium and community spaces for the university’s Vagelos College of Physicians and Surgeons. The property is located at the corner of Audubon Avenue and 167th Street.

Rendering of exterior for new biomedical research building at Columbia University, by RGB
Engineered with sustainability as a core priority, the facility incorporates an all-electric design, including air source heat pumps and air-side energy recovery systems working together to reduce the total energy needed to condition the building. The façade features an optimized window-to-wall-ratio below 50 percent, strategic exterior shading, and a system of louvers to minimize solar heat gain and glare. As a result of these decisions, the building is set to outperform emission limits set by New York City’s Local Law 97 and support Columbia University’s Plan 2030 greenhouse gas reduction goals.

Rendering of new biomedical research building at Columbia University, by RGB

Rendering of conference space inside new biomedical research building at Columbia University, by RGB
KPF developed an integrated design process to address the unique challenges of developing a first-of-its-kind electric research laboratory in New York City. The project team introduced a pre-design sustainability and energy charrette to evaluate alternative building options and validate project goals, which shaped every subsequent phase of the design process.

Rendering of workspace inside new biomedical research building at Columbia University, by RGB
The building’s design also integrates organic elements such as green walls and natural, renewable materials in collaboration spaces, while a large connecting staircase encourages active circulation. Light shelves are designed to minimize glare and reflect natural light into the labs.

Rendering of lab space inside new biomedical research building at Columbia University, by RGB
The new biomedical research building is partially funded by a Regional Economic Development Council Grant from the New York State Energy Research and Development Authority that supports low-carbon developments in underserved neighborhoods. Construction on the project is expected to begin this summer.
Subscribe to YIMBY’s daily e-mail Follow YIMBYgram for real-time photo updates Like YIMBY on Facebook Follow YIMBY’s Twitter for the latest in YIMBYnews
6 Comments on "Renderings Revealed for New Columbia University Biomedical Research Building in Washington Heights, Manhattan"
Sexy and sterile
Not much space for setting up tents… Am I really the only one that thought about that? Otherwise looks very nice.
It’s nice to have some beautiful medical structures like this, especially considering how many super ugly hospitals exist in the NY area.
Human could no longer withstand the tension from climate change, within the plan is in case of prepare to emerge: Thanks.
Leave a comment Cancel reply
Your email address will not be published.
Related Articles

January 13, 2023
NYCHA Kicks Off Modernization Projects at Three Affordable Housing Properties in Upper Manhattan

December 9, 2022
Permits Filed for 528 West 162nd Street in Washington Heights, Manhattan

October 27, 2022
Permits Filed for 1986 Amsterdam Avenue in Washington Heights, Manhattan

October 6, 2022
Radio Tower & Hotel Now Open at 2420 Amsterdam Avenue in Washington Heights, Manhattan

What’s happening in your backyard?
IMAGES
VIDEO
COMMENTS
A research design is a strategy for answering your research question using empirical data. Creating a research design means making decisions about: Your overall research objectives and approach. Whether you'll rely on primary research or secondary research. Your sampling methods or criteria for selecting subjects. Your data collection methods.
Research design refers to the overall plan, structure or strategy that guides a research project, from its conception to the final analysis of data. Research designs for quantitative studies include descriptive, correlational, experimental and quasi-experimenta l designs. Research designs for qualitative studies include phenomenological ...
Research design: The research design will be a quasi-experimental design, with a pretest-posttest control group design. ... Helps to ensure that the research project is feasible, relevant, and ethical. Helps to ensure that the data collected is accurate, valid, and reliable, and that the research findings can be interpreted and generalized to ...
A well-planned research design helps ensure that your methods match your research aims and that you use the right kind of analysis for your data. You might have to write up a research design as a standalone assignment, or it might be part of a larger research proposal or other project. In either case, you should carefully consider which methods ...
Step 1: Establish Priorities for Research Design. Before conducting any research study, you must address an important question: "how to create a research design.". The research design depends on the researcher's priorities and choices because every research has different priorities.
Research design methods refer to the systematic approaches and techniques used to plan, structure, and conduct a research study. The choice of research design method depends on the research questions, objectives, and the nature of the study. Here are some key research design methods commonly used in various fields: 1.
Step 4: Create a research design. The research design is a practical framework for answering your research questions. It involves making decisions about the type of data you need, the methods you'll use to collect and analyze it, and the location and timescale of your research. There are often many possible paths you can take to answering ...
Research design is a comprehensive plan for data collection in an empirical research project. It is a 'blueprint' for empirical research aimed at answering specific research questions or testing specific hypotheses, and must specify at least three processes: the data collection process, the instrument development process, and the sampling process.
A research design typically outlines the theories and models underlying a project; the research question (s) of a project; a strategy for gathering data and information; and a strategy for producing answers from the data. [1] A strong research design yields valid answers to research questions while weak designs yield unreliable, imprecise or ...
Research design is the framework of research methods and techniques chosen by a researcher to conduct a study. The design allows researchers to sharpen the research methods suitable for the subject matter and set up their studies for success. Creating a research topic explains the type of research (experimental,survey research,correlational ...
The Research Design in a research project tells the story of what direction the plot of the story will take. The writing in this heading sets the stage for the rising action of the plot in the research story. The Research Design describes the journey that is about to take place. It functions to guide the reader in understanding the type of path ...
What Is Research Design? The term "research design" is usually used in reference to experimental research, and refers to the design of your experiment. However, you will also see the term "research design" used in other types of research. Below is a list of possible research designs you might encounter or adopt for your research:
Interdisciplinary research design starts with the "conceptual design" which addresses the 'why' and 'what' of a research project at a conceptual level to ascertain the common goals pivotal to interdisciplinary collaboration (Fischer et al. 2011). The conceptual design includes mostly activities such as thinking, exchanging ...
While many books and articles guide various qualitative research methods and analyses, there is currently no concise resource that explains and differentiates among the most common qualitative approaches. We believe novice qualitative researchers, students planning the design of a qualitative study or taking an introductory qualitative research course, and faculty teaching such courses can ...
Research Design: Creating Robust Approaches for the Social Sciences. Thousand Oaks, CA: Sage, 2013; Kemmis, Stephen and Robin McTaggart. "Participatory Action Research." ... but a self-contained research project that explores a clearly defined research problem using existing studies. The design of a systematic review differs from other ...
A design is used to structure the research, to show how all of the major parts of the research project work together to try to address the central research questions." The research design is like a recipe. Just as a recipe provides a list of ingredients and the instructions for preparing a dish, the research design provides the components and ...
for validity and reliability. Design is basically concerned with the aims, uses, purposes, intentions and plans within the. pr actical constraint of location, time, money and the researcher's ...
The study design used to answer a particular research question depends on the nature of the question and the availability of resources. In this article, which is the first part of a series on "study designs," we provide an overview of research study designs and their classification. The subsequent articles will focus on individual designs.
<button>Click to continue</button>
Research design and methods. Following the literature review, restate your main objectives. This brings the focus back to your own project. Next, your research design or methodology section will describe your overall approach, and the practical steps you will take to answer your research questions.
Design research focuses on understanding user needs, behaviors and experiences to inform and improve product or service design. Market research, on the other hand, is more concerned with the broader market dynamics, identifying opportunities, and maximizing sales and profitability. Both are essential for the success of a product or service, but ...
Pew Research Center has deep roots in U.S. public opinion research. Launched initially as a project focused primarily on U.S. policy and politics in the early 1990s, the Center has grown over time to study a wide range of topics vital to explaining America to itself and to the world.Our hallmarks: a rigorous approach to methodological quality, complete transparency as to our methods, and a ...
For example, UKRI's digital research infrastructure scoping project 48, which seeks to provide a roadmap to net zero for its digital infrastructure, sends a clear message that sustainable ...
FHSU students and faculty from Criminal Justice, Clinical Psychology, and Art and Design recently created a pilot research project to explore the often-neglected facets of gender-based violence through art illustration and storytelling. Through this innovative project, researchers and artists use art and storytelling as tools to empower survivors and individuals navigating trauma, fostering ...
The projects are created as part of BME's capstone senior design course, instructed by Dale Feldman, Ph.D., and Alan Eberhardt, Ph.D. Students are required to present a solution to a clinical problem provided by a client and develop a functional prototype and plan for product commercialization.
The Design Solution. The Lehman College Nursing Education, Research, and Practice Center promotes student success by providing real-life immersive learning environments lacking in their previous facilities. The first level of the new 4-story building is dedicated to a lobby, computer lab, classrooms and a student lounge.
Table of contents. Step 1: Define your variables. Step 2: Write your hypothesis. Step 3: Design your experimental treatments. Step 4: Assign your subjects to treatment groups. Step 5: Measure your dependent variable. Other interesting articles. Frequently asked questions about experiments.
KPF developed an integrated design process to address the unique challenges of developing a first-of-its-kind electric research laboratory in New York City. The project team introduced a pre-design sustainability and energy charrette to evaluate alternative building options and validate project goals, which shaped every subsequent phase of the ...
This project aims to collaborate with prominent community members in the USVI to incorporate diverse ways of knowing into the design and testing of different vegetated buffer strips to promote reef-safe landscapes and the restoration of culturally significant landscapes in the US Virgin Islands.