- Privacy Policy
Buy Me a Coffee
Home » Research Methodology – Types, Examples and writing Guide

Research Methodology – Types, Examples and writing Guide
Table of Contents

Research Methodology
Definition:
Research Methodology refers to the systematic and scientific approach used to conduct research, investigate problems, and gather data and information for a specific purpose. It involves the techniques and procedures used to identify, collect , analyze , and interpret data to answer research questions or solve research problems . Moreover, They are philosophical and theoretical frameworks that guide the research process.
Structure of Research Methodology
Research methodology formats can vary depending on the specific requirements of the research project, but the following is a basic example of a structure for a research methodology section:
I. Introduction
- Provide an overview of the research problem and the need for a research methodology section
- Outline the main research questions and objectives
II. Research Design
- Explain the research design chosen and why it is appropriate for the research question(s) and objectives
- Discuss any alternative research designs considered and why they were not chosen
- Describe the research setting and participants (if applicable)
III. Data Collection Methods
- Describe the methods used to collect data (e.g., surveys, interviews, observations)
- Explain how the data collection methods were chosen and why they are appropriate for the research question(s) and objectives
- Detail any procedures or instruments used for data collection
IV. Data Analysis Methods
- Describe the methods used to analyze the data (e.g., statistical analysis, content analysis )
- Explain how the data analysis methods were chosen and why they are appropriate for the research question(s) and objectives
- Detail any procedures or software used for data analysis
V. Ethical Considerations
- Discuss any ethical issues that may arise from the research and how they were addressed
- Explain how informed consent was obtained (if applicable)
- Detail any measures taken to ensure confidentiality and anonymity
VI. Limitations
- Identify any potential limitations of the research methodology and how they may impact the results and conclusions
VII. Conclusion
- Summarize the key aspects of the research methodology section
- Explain how the research methodology addresses the research question(s) and objectives
Research Methodology Types
Types of Research Methodology are as follows:
Quantitative Research Methodology
This is a research methodology that involves the collection and analysis of numerical data using statistical methods. This type of research is often used to study cause-and-effect relationships and to make predictions.
Qualitative Research Methodology
This is a research methodology that involves the collection and analysis of non-numerical data such as words, images, and observations. This type of research is often used to explore complex phenomena, to gain an in-depth understanding of a particular topic, and to generate hypotheses.
Mixed-Methods Research Methodology
This is a research methodology that combines elements of both quantitative and qualitative research. This approach can be particularly useful for studies that aim to explore complex phenomena and to provide a more comprehensive understanding of a particular topic.
Case Study Research Methodology
This is a research methodology that involves in-depth examination of a single case or a small number of cases. Case studies are often used in psychology, sociology, and anthropology to gain a detailed understanding of a particular individual or group.
Action Research Methodology
This is a research methodology that involves a collaborative process between researchers and practitioners to identify and solve real-world problems. Action research is often used in education, healthcare, and social work.
Experimental Research Methodology
This is a research methodology that involves the manipulation of one or more independent variables to observe their effects on a dependent variable. Experimental research is often used to study cause-and-effect relationships and to make predictions.
Survey Research Methodology
This is a research methodology that involves the collection of data from a sample of individuals using questionnaires or interviews. Survey research is often used to study attitudes, opinions, and behaviors.
Grounded Theory Research Methodology
This is a research methodology that involves the development of theories based on the data collected during the research process. Grounded theory is often used in sociology and anthropology to generate theories about social phenomena.
Research Methodology Example
An Example of Research Methodology could be the following:
Research Methodology for Investigating the Effectiveness of Cognitive Behavioral Therapy in Reducing Symptoms of Depression in Adults
Introduction:
The aim of this research is to investigate the effectiveness of cognitive-behavioral therapy (CBT) in reducing symptoms of depression in adults. To achieve this objective, a randomized controlled trial (RCT) will be conducted using a mixed-methods approach.
Research Design:
The study will follow a pre-test and post-test design with two groups: an experimental group receiving CBT and a control group receiving no intervention. The study will also include a qualitative component, in which semi-structured interviews will be conducted with a subset of participants to explore their experiences of receiving CBT.
Participants:
Participants will be recruited from community mental health clinics in the local area. The sample will consist of 100 adults aged 18-65 years old who meet the diagnostic criteria for major depressive disorder. Participants will be randomly assigned to either the experimental group or the control group.
Intervention :
The experimental group will receive 12 weekly sessions of CBT, each lasting 60 minutes. The intervention will be delivered by licensed mental health professionals who have been trained in CBT. The control group will receive no intervention during the study period.
Data Collection:
Quantitative data will be collected through the use of standardized measures such as the Beck Depression Inventory-II (BDI-II) and the Generalized Anxiety Disorder-7 (GAD-7). Data will be collected at baseline, immediately after the intervention, and at a 3-month follow-up. Qualitative data will be collected through semi-structured interviews with a subset of participants from the experimental group. The interviews will be conducted at the end of the intervention period, and will explore participants’ experiences of receiving CBT.
Data Analysis:
Quantitative data will be analyzed using descriptive statistics, t-tests, and mixed-model analyses of variance (ANOVA) to assess the effectiveness of the intervention. Qualitative data will be analyzed using thematic analysis to identify common themes and patterns in participants’ experiences of receiving CBT.
Ethical Considerations:
This study will comply with ethical guidelines for research involving human subjects. Participants will provide informed consent before participating in the study, and their privacy and confidentiality will be protected throughout the study. Any adverse events or reactions will be reported and managed appropriately.
Data Management:
All data collected will be kept confidential and stored securely using password-protected databases. Identifying information will be removed from qualitative data transcripts to ensure participants’ anonymity.
Limitations:
One potential limitation of this study is that it only focuses on one type of psychotherapy, CBT, and may not generalize to other types of therapy or interventions. Another limitation is that the study will only include participants from community mental health clinics, which may not be representative of the general population.
Conclusion:
This research aims to investigate the effectiveness of CBT in reducing symptoms of depression in adults. By using a randomized controlled trial and a mixed-methods approach, the study will provide valuable insights into the mechanisms underlying the relationship between CBT and depression. The results of this study will have important implications for the development of effective treatments for depression in clinical settings.
How to Write Research Methodology
Writing a research methodology involves explaining the methods and techniques you used to conduct research, collect data, and analyze results. It’s an essential section of any research paper or thesis, as it helps readers understand the validity and reliability of your findings. Here are the steps to write a research methodology:
- Start by explaining your research question: Begin the methodology section by restating your research question and explaining why it’s important. This helps readers understand the purpose of your research and the rationale behind your methods.
- Describe your research design: Explain the overall approach you used to conduct research. This could be a qualitative or quantitative research design, experimental or non-experimental, case study or survey, etc. Discuss the advantages and limitations of the chosen design.
- Discuss your sample: Describe the participants or subjects you included in your study. Include details such as their demographics, sampling method, sample size, and any exclusion criteria used.
- Describe your data collection methods : Explain how you collected data from your participants. This could include surveys, interviews, observations, questionnaires, or experiments. Include details on how you obtained informed consent, how you administered the tools, and how you minimized the risk of bias.
- Explain your data analysis techniques: Describe the methods you used to analyze the data you collected. This could include statistical analysis, content analysis, thematic analysis, or discourse analysis. Explain how you dealt with missing data, outliers, and any other issues that arose during the analysis.
- Discuss the validity and reliability of your research : Explain how you ensured the validity and reliability of your study. This could include measures such as triangulation, member checking, peer review, or inter-coder reliability.
- Acknowledge any limitations of your research: Discuss any limitations of your study, including any potential threats to validity or generalizability. This helps readers understand the scope of your findings and how they might apply to other contexts.
- Provide a summary: End the methodology section by summarizing the methods and techniques you used to conduct your research. This provides a clear overview of your research methodology and helps readers understand the process you followed to arrive at your findings.
When to Write Research Methodology
Research methodology is typically written after the research proposal has been approved and before the actual research is conducted. It should be written prior to data collection and analysis, as it provides a clear roadmap for the research project.
The research methodology is an important section of any research paper or thesis, as it describes the methods and procedures that will be used to conduct the research. It should include details about the research design, data collection methods, data analysis techniques, and any ethical considerations.
The methodology should be written in a clear and concise manner, and it should be based on established research practices and standards. It is important to provide enough detail so that the reader can understand how the research was conducted and evaluate the validity of the results.
Applications of Research Methodology
Here are some of the applications of research methodology:
- To identify the research problem: Research methodology is used to identify the research problem, which is the first step in conducting any research.
- To design the research: Research methodology helps in designing the research by selecting the appropriate research method, research design, and sampling technique.
- To collect data: Research methodology provides a systematic approach to collect data from primary and secondary sources.
- To analyze data: Research methodology helps in analyzing the collected data using various statistical and non-statistical techniques.
- To test hypotheses: Research methodology provides a framework for testing hypotheses and drawing conclusions based on the analysis of data.
- To generalize findings: Research methodology helps in generalizing the findings of the research to the target population.
- To develop theories : Research methodology is used to develop new theories and modify existing theories based on the findings of the research.
- To evaluate programs and policies : Research methodology is used to evaluate the effectiveness of programs and policies by collecting data and analyzing it.
- To improve decision-making: Research methodology helps in making informed decisions by providing reliable and valid data.
Purpose of Research Methodology
Research methodology serves several important purposes, including:
- To guide the research process: Research methodology provides a systematic framework for conducting research. It helps researchers to plan their research, define their research questions, and select appropriate methods and techniques for collecting and analyzing data.
- To ensure research quality: Research methodology helps researchers to ensure that their research is rigorous, reliable, and valid. It provides guidelines for minimizing bias and error in data collection and analysis, and for ensuring that research findings are accurate and trustworthy.
- To replicate research: Research methodology provides a clear and detailed account of the research process, making it possible for other researchers to replicate the study and verify its findings.
- To advance knowledge: Research methodology enables researchers to generate new knowledge and to contribute to the body of knowledge in their field. It provides a means for testing hypotheses, exploring new ideas, and discovering new insights.
- To inform decision-making: Research methodology provides evidence-based information that can inform policy and decision-making in a variety of fields, including medicine, public health, education, and business.
Advantages of Research Methodology
Research methodology has several advantages that make it a valuable tool for conducting research in various fields. Here are some of the key advantages of research methodology:
- Systematic and structured approach : Research methodology provides a systematic and structured approach to conducting research, which ensures that the research is conducted in a rigorous and comprehensive manner.
- Objectivity : Research methodology aims to ensure objectivity in the research process, which means that the research findings are based on evidence and not influenced by personal bias or subjective opinions.
- Replicability : Research methodology ensures that research can be replicated by other researchers, which is essential for validating research findings and ensuring their accuracy.
- Reliability : Research methodology aims to ensure that the research findings are reliable, which means that they are consistent and can be depended upon.
- Validity : Research methodology ensures that the research findings are valid, which means that they accurately reflect the research question or hypothesis being tested.
- Efficiency : Research methodology provides a structured and efficient way of conducting research, which helps to save time and resources.
- Flexibility : Research methodology allows researchers to choose the most appropriate research methods and techniques based on the research question, data availability, and other relevant factors.
- Scope for innovation: Research methodology provides scope for innovation and creativity in designing research studies and developing new research techniques.
Research Methodology Vs Research Methods
About the author.

Muhammad Hassan
Researcher, Academic Writer, Web developer
You may also like

How to Cite Research Paper – All Formats and...

Data Collection – Methods Types and Examples

Delimitations in Research – Types, Examples and...

Research Paper Format – Types, Examples and...

Research Process – Steps, Examples and Tips

Research Design – Types, Methods and Examples
- USC Libraries
- Research Guides
Organizing Your Social Sciences Research Paper
- 6. The Methodology
- Purpose of Guide
- Design Flaws to Avoid
- Independent and Dependent Variables
- Glossary of Research Terms
- Reading Research Effectively
- Narrowing a Topic Idea
- Broadening a Topic Idea
- Extending the Timeliness of a Topic Idea
- Academic Writing Style
- Choosing a Title
- Making an Outline
- Paragraph Development
- Research Process Video Series
- Executive Summary
- The C.A.R.S. Model
- Background Information
- The Research Problem/Question
- Theoretical Framework
- Citation Tracking
- Content Alert Services
- Evaluating Sources
- Primary Sources
- Secondary Sources
- Tiertiary Sources
- Scholarly vs. Popular Publications
- Qualitative Methods
- Quantitative Methods
- Insiderness
- Using Non-Textual Elements
- Limitations of the Study
- Common Grammar Mistakes
- Writing Concisely
- Avoiding Plagiarism
- Footnotes or Endnotes?
- Further Readings
- Generative AI and Writing
- USC Libraries Tutorials and Other Guides
- Bibliography
The methods section describes actions taken to investigate a research problem and the rationale for the application of specific procedures or techniques used to identify, select, process, and analyze information applied to understanding the problem, thereby, allowing the reader to critically evaluate a study’s overall validity and reliability. The methodology section of a research paper answers two main questions: How was the data collected or generated? And, how was it analyzed? The writing should be direct and precise and always written in the past tense.
Kallet, Richard H. "How to Write the Methods Section of a Research Paper." Respiratory Care 49 (October 2004): 1229-1232.
Importance of a Good Methodology Section
You must explain how you obtained and analyzed your results for the following reasons:
- Readers need to know how the data was obtained because the method you chose affects the results and, by extension, how you interpreted their significance in the discussion section of your paper.
- Methodology is crucial for any branch of scholarship because an unreliable method produces unreliable results and, as a consequence, undermines the value of your analysis of the findings.
- In most cases, there are a variety of different methods you can choose to investigate a research problem. The methodology section of your paper should clearly articulate the reasons why you have chosen a particular procedure or technique.
- The reader wants to know that the data was collected or generated in a way that is consistent with accepted practice in the field of study. For example, if you are using a multiple choice questionnaire, readers need to know that it offered your respondents a reasonable range of answers to choose from.
- The method must be appropriate to fulfilling the overall aims of the study. For example, you need to ensure that you have a large enough sample size to be able to generalize and make recommendations based upon the findings.
- The methodology should discuss the problems that were anticipated and the steps you took to prevent them from occurring. For any problems that do arise, you must describe the ways in which they were minimized or why these problems do not impact in any meaningful way your interpretation of the findings.
- In the social and behavioral sciences, it is important to always provide sufficient information to allow other researchers to adopt or replicate your methodology. This information is particularly important when a new method has been developed or an innovative use of an existing method is utilized.
Bem, Daryl J. Writing the Empirical Journal Article. Psychology Writing Center. University of Washington; Denscombe, Martyn. The Good Research Guide: For Small-Scale Social Research Projects . 5th edition. Buckingham, UK: Open University Press, 2014; Lunenburg, Frederick C. Writing a Successful Thesis or Dissertation: Tips and Strategies for Students in the Social and Behavioral Sciences . Thousand Oaks, CA: Corwin Press, 2008.
Structure and Writing Style
I. Groups of Research Methods
There are two main groups of research methods in the social sciences:
- The e mpirical-analytical group approaches the study of social sciences in a similar manner that researchers study the natural sciences . This type of research focuses on objective knowledge, research questions that can be answered yes or no, and operational definitions of variables to be measured. The empirical-analytical group employs deductive reasoning that uses existing theory as a foundation for formulating hypotheses that need to be tested. This approach is focused on explanation.
- The i nterpretative group of methods is focused on understanding phenomenon in a comprehensive, holistic way . Interpretive methods focus on analytically disclosing the meaning-making practices of human subjects [the why, how, or by what means people do what they do], while showing how those practices arrange so that it can be used to generate observable outcomes. Interpretive methods allow you to recognize your connection to the phenomena under investigation. However, the interpretative group requires careful examination of variables because it focuses more on subjective knowledge.
II. Content
The introduction to your methodology section should begin by restating the research problem and underlying assumptions underpinning your study. This is followed by situating the methods you used to gather, analyze, and process information within the overall “tradition” of your field of study and within the particular research design you have chosen to study the problem. If the method you choose lies outside of the tradition of your field [i.e., your review of the literature demonstrates that the method is not commonly used], provide a justification for how your choice of methods specifically addresses the research problem in ways that have not been utilized in prior studies.
The remainder of your methodology section should describe the following:
- Decisions made in selecting the data you have analyzed or, in the case of qualitative research, the subjects and research setting you have examined,
- Tools and methods used to identify and collect information, and how you identified relevant variables,
- The ways in which you processed the data and the procedures you used to analyze that data, and
- The specific research tools or strategies that you utilized to study the underlying hypothesis and research questions.
In addition, an effectively written methodology section should:
- Introduce the overall methodological approach for investigating your research problem . Is your study qualitative or quantitative or a combination of both (mixed method)? Are you going to take a special approach, such as action research, or a more neutral stance?
- Indicate how the approach fits the overall research design . Your methods for gathering data should have a clear connection to your research problem. In other words, make sure that your methods will actually address the problem. One of the most common deficiencies found in research papers is that the proposed methodology is not suitable to achieving the stated objective of your paper.
- Describe the specific methods of data collection you are going to use , such as, surveys, interviews, questionnaires, observation, archival research. If you are analyzing existing data, such as a data set or archival documents, describe how it was originally created or gathered and by whom. Also be sure to explain how older data is still relevant to investigating the current research problem.
- Explain how you intend to analyze your results . Will you use statistical analysis? Will you use specific theoretical perspectives to help you analyze a text or explain observed behaviors? Describe how you plan to obtain an accurate assessment of relationships, patterns, trends, distributions, and possible contradictions found in the data.
- Provide background and a rationale for methodologies that are unfamiliar for your readers . Very often in the social sciences, research problems and the methods for investigating them require more explanation/rationale than widely accepted rules governing the natural and physical sciences. Be clear and concise in your explanation.
- Provide a justification for subject selection and sampling procedure . For instance, if you propose to conduct interviews, how do you intend to select the sample population? If you are analyzing texts, which texts have you chosen, and why? If you are using statistics, why is this set of data being used? If other data sources exist, explain why the data you chose is most appropriate to addressing the research problem.
- Provide a justification for case study selection . A common method of analyzing research problems in the social sciences is to analyze specific cases. These can be a person, place, event, phenomenon, or other type of subject of analysis that are either examined as a singular topic of in-depth investigation or multiple topics of investigation studied for the purpose of comparing or contrasting findings. In either method, you should explain why a case or cases were chosen and how they specifically relate to the research problem.
- Describe potential limitations . Are there any practical limitations that could affect your data collection? How will you attempt to control for potential confounding variables and errors? If your methodology may lead to problems you can anticipate, state this openly and show why pursuing this methodology outweighs the risk of these problems cropping up.
NOTE : Once you have written all of the elements of the methods section, subsequent revisions should focus on how to present those elements as clearly and as logically as possibly. The description of how you prepared to study the research problem, how you gathered the data, and the protocol for analyzing the data should be organized chronologically. For clarity, when a large amount of detail must be presented, information should be presented in sub-sections according to topic. If necessary, consider using appendices for raw data.
ANOTHER NOTE : If you are conducting a qualitative analysis of a research problem , the methodology section generally requires a more elaborate description of the methods used as well as an explanation of the processes applied to gathering and analyzing of data than is generally required for studies using quantitative methods. Because you are the primary instrument for generating the data [e.g., through interviews or observations], the process for collecting that data has a significantly greater impact on producing the findings. Therefore, qualitative research requires a more detailed description of the methods used.
YET ANOTHER NOTE : If your study involves interviews, observations, or other qualitative techniques involving human subjects , you may be required to obtain approval from the university's Office for the Protection of Research Subjects before beginning your research. This is not a common procedure for most undergraduate level student research assignments. However, i f your professor states you need approval, you must include a statement in your methods section that you received official endorsement and adequate informed consent from the office and that there was a clear assessment and minimization of risks to participants and to the university. This statement informs the reader that your study was conducted in an ethical and responsible manner. In some cases, the approval notice is included as an appendix to your paper.
III. Problems to Avoid
Irrelevant Detail The methodology section of your paper should be thorough but concise. Do not provide any background information that does not directly help the reader understand why a particular method was chosen, how the data was gathered or obtained, and how the data was analyzed in relation to the research problem [note: analyzed, not interpreted! Save how you interpreted the findings for the discussion section]. With this in mind, the page length of your methods section will generally be less than any other section of your paper except the conclusion.
Unnecessary Explanation of Basic Procedures Remember that you are not writing a how-to guide about a particular method. You should make the assumption that readers possess a basic understanding of how to investigate the research problem on their own and, therefore, you do not have to go into great detail about specific methodological procedures. The focus should be on how you applied a method , not on the mechanics of doing a method. An exception to this rule is if you select an unconventional methodological approach; if this is the case, be sure to explain why this approach was chosen and how it enhances the overall process of discovery.
Problem Blindness It is almost a given that you will encounter problems when collecting or generating your data, or, gaps will exist in existing data or archival materials. Do not ignore these problems or pretend they did not occur. Often, documenting how you overcame obstacles can form an interesting part of the methodology. It demonstrates to the reader that you can provide a cogent rationale for the decisions you made to minimize the impact of any problems that arose.
Literature Review Just as the literature review section of your paper provides an overview of sources you have examined while researching a particular topic, the methodology section should cite any sources that informed your choice and application of a particular method [i.e., the choice of a survey should include any citations to the works you used to help construct the survey].
It’s More than Sources of Information! A description of a research study's method should not be confused with a description of the sources of information. Such a list of sources is useful in and of itself, especially if it is accompanied by an explanation about the selection and use of the sources. The description of the project's methodology complements a list of sources in that it sets forth the organization and interpretation of information emanating from those sources.
Azevedo, L.F. et al. "How to Write a Scientific Paper: Writing the Methods Section." Revista Portuguesa de Pneumologia 17 (2011): 232-238; Blair Lorrie. “Choosing a Methodology.” In Writing a Graduate Thesis or Dissertation , Teaching Writing Series. (Rotterdam: Sense Publishers 2016), pp. 49-72; Butin, Dan W. The Education Dissertation A Guide for Practitioner Scholars . Thousand Oaks, CA: Corwin, 2010; Carter, Susan. Structuring Your Research Thesis . New York: Palgrave Macmillan, 2012; Kallet, Richard H. “How to Write the Methods Section of a Research Paper.” Respiratory Care 49 (October 2004):1229-1232; Lunenburg, Frederick C. Writing a Successful Thesis or Dissertation: Tips and Strategies for Students in the Social and Behavioral Sciences . Thousand Oaks, CA: Corwin Press, 2008. Methods Section. The Writer’s Handbook. Writing Center. University of Wisconsin, Madison; Rudestam, Kjell Erik and Rae R. Newton. “The Method Chapter: Describing Your Research Plan.” In Surviving Your Dissertation: A Comprehensive Guide to Content and Process . (Thousand Oaks, Sage Publications, 2015), pp. 87-115; What is Interpretive Research. Institute of Public and International Affairs, University of Utah; Writing the Experimental Report: Methods, Results, and Discussion. The Writing Lab and The OWL. Purdue University; Methods and Materials. The Structure, Format, Content, and Style of a Journal-Style Scientific Paper. Department of Biology. Bates College.
Writing Tip
Statistical Designs and Tests? Do Not Fear Them!
Don't avoid using a quantitative approach to analyzing your research problem just because you fear the idea of applying statistical designs and tests. A qualitative approach, such as conducting interviews or content analysis of archival texts, can yield exciting new insights about a research problem, but it should not be undertaken simply because you have a disdain for running a simple regression. A well designed quantitative research study can often be accomplished in very clear and direct ways, whereas, a similar study of a qualitative nature usually requires considerable time to analyze large volumes of data and a tremendous burden to create new paths for analysis where previously no path associated with your research problem had existed.
To locate data and statistics, GO HERE .
Another Writing Tip
Knowing the Relationship Between Theories and Methods
There can be multiple meaning associated with the term "theories" and the term "methods" in social sciences research. A helpful way to delineate between them is to understand "theories" as representing different ways of characterizing the social world when you research it and "methods" as representing different ways of generating and analyzing data about that social world. Framed in this way, all empirical social sciences research involves theories and methods, whether they are stated explicitly or not. However, while theories and methods are often related, it is important that, as a researcher, you deliberately separate them in order to avoid your theories playing a disproportionate role in shaping what outcomes your chosen methods produce.
Introspectively engage in an ongoing dialectic between the application of theories and methods to help enable you to use the outcomes from your methods to interrogate and develop new theories, or ways of framing conceptually the research problem. This is how scholarship grows and branches out into new intellectual territory.
Reynolds, R. Larry. Ways of Knowing. Alternative Microeconomics . Part 1, Chapter 3. Boise State University; The Theory-Method Relationship. S-Cool Revision. United Kingdom.
Yet Another Writing Tip
Methods and the Methodology
Do not confuse the terms "methods" and "methodology." As Schneider notes, a method refers to the technical steps taken to do research . Descriptions of methods usually include defining and stating why you have chosen specific techniques to investigate a research problem, followed by an outline of the procedures you used to systematically select, gather, and process the data [remember to always save the interpretation of data for the discussion section of your paper].
The methodology refers to a discussion of the underlying reasoning why particular methods were used . This discussion includes describing the theoretical concepts that inform the choice of methods to be applied, placing the choice of methods within the more general nature of academic work, and reviewing its relevance to examining the research problem. The methodology section also includes a thorough review of the methods other scholars have used to study the topic.
Bryman, Alan. "Of Methods and Methodology." Qualitative Research in Organizations and Management: An International Journal 3 (2008): 159-168; Schneider, Florian. “What's in a Methodology: The Difference between Method, Methodology, and Theory…and How to Get the Balance Right?” PoliticsEastAsia.com. Chinese Department, University of Leiden, Netherlands.
- << Previous: Scholarly vs. Popular Publications
- Next: Qualitative Methods >>
- Last Updated: Apr 1, 2024 9:56 AM
- URL: https://libguides.usc.edu/writingguide
- Resources Home 🏠
- Try SciSpace Copilot
- Search research papers
- Add Copilot Extension
- Try AI Detector
- Try Paraphraser
- Try Citation Generator
- April Papers
- June Papers
- July Papers

Here's What You Need to Understand About Research Methodology

Table of Contents
Research methodology involves a systematic and well-structured approach to conducting scholarly or scientific inquiries. Knowing the significance of research methodology and its different components is crucial as it serves as the basis for any study.
Typically, your research topic will start as a broad idea you want to investigate more thoroughly. Once you’ve identified a research problem and created research questions , you must choose the appropriate methodology and frameworks to address those questions effectively.
What is the definition of a research methodology?
Research methodology is the process or the way you intend to execute your study. The methodology section of a research paper outlines how you plan to conduct your study. It covers various steps such as collecting data, statistical analysis, observing participants, and other procedures involved in the research process
The methods section should give a description of the process that will convert your idea into a study. Additionally, the outcomes of your process must provide valid and reliable results resonant with the aims and objectives of your research. This thumb rule holds complete validity, no matter whether your paper has inclinations for qualitative or quantitative usage.
Studying research methods used in related studies can provide helpful insights and direction for your own research. Now easily discover papers related to your topic on SciSpace and utilize our AI research assistant, Copilot , to quickly review the methodologies applied in different papers.

The need for a good research methodology
While deciding on your approach towards your research, the reason or factors you weighed in choosing a particular problem and formulating a research topic need to be validated and explained. A research methodology helps you do exactly that. Moreover, a good research methodology lets you build your argument to validate your research work performed through various data collection methods, analytical methods, and other essential points.
Just imagine it as a strategy documented to provide an overview of what you intend to do.
While undertaking any research writing or performing the research itself, you may get drifted in not something of much importance. In such a case, a research methodology helps you to get back to your outlined work methodology.
A research methodology helps in keeping you accountable for your work. Additionally, it can help you evaluate whether your work is in sync with your original aims and objectives or not. Besides, a good research methodology enables you to navigate your research process smoothly and swiftly while providing effective planning to achieve your desired results.
What is the basic structure of a research methodology?
Usually, you must ensure to include the following stated aspects while deciding over the basic structure of your research methodology:
1. Your research procedure
Explain what research methods you’re going to use. Whether you intend to proceed with quantitative or qualitative, or a composite of both approaches, you need to state that explicitly. The option among the three depends on your research’s aim, objectives, and scope.
2. Provide the rationality behind your chosen approach
Based on logic and reason, let your readers know why you have chosen said research methodologies. Additionally, you have to build strong arguments supporting why your chosen research method is the best way to achieve the desired outcome.
3. Explain your mechanism
The mechanism encompasses the research methods or instruments you will use to develop your research methodology. It usually refers to your data collection methods. You can use interviews, surveys, physical questionnaires, etc., of the many available mechanisms as research methodology instruments. The data collection method is determined by the type of research and whether the data is quantitative data(includes numerical data) or qualitative data (perception, morale, etc.) Moreover, you need to put logical reasoning behind choosing a particular instrument.
4. Significance of outcomes
The results will be available once you have finished experimenting. However, you should also explain how you plan to use the data to interpret the findings. This section also aids in understanding the problem from within, breaking it down into pieces, and viewing the research problem from various perspectives.
5. Reader’s advice
Anything that you feel must be explained to spread more awareness among readers and focus groups must be included and described in detail. You should not just specify your research methodology on the assumption that a reader is aware of the topic.
All the relevant information that explains and simplifies your research paper must be included in the methodology section. If you are conducting your research in a non-traditional manner, give a logical justification and list its benefits.
6. Explain your sample space
Include information about the sample and sample space in the methodology section. The term "sample" refers to a smaller set of data that a researcher selects or chooses from a larger group of people or focus groups using a predetermined selection method. Let your readers know how you are going to distinguish between relevant and non-relevant samples. How you figured out those exact numbers to back your research methodology, i.e. the sample spacing of instruments, must be discussed thoroughly.
For example, if you are going to conduct a survey or interview, then by what procedure will you select the interviewees (or sample size in case of surveys), and how exactly will the interview or survey be conducted.
7. Challenges and limitations
This part, which is frequently assumed to be unnecessary, is actually very important. The challenges and limitations that your chosen strategy inherently possesses must be specified while you are conducting different types of research.
The importance of a good research methodology
You must have observed that all research papers, dissertations, or theses carry a chapter entirely dedicated to research methodology. This section helps maintain your credibility as a better interpreter of results rather than a manipulator.
A good research methodology always explains the procedure, data collection methods and techniques, aim, and scope of the research. In a research study, it leads to a well-organized, rationality-based approach, while the paper lacking it is often observed as messy or disorganized.
You should pay special attention to validating your chosen way towards the research methodology. This becomes extremely important in case you select an unconventional or a distinct method of execution.
Curating and developing a strong, effective research methodology can assist you in addressing a variety of situations, such as:
- When someone tries to duplicate or expand upon your research after few years.
- If a contradiction or conflict of facts occurs at a later time. This gives you the security you need to deal with these contradictions while still being able to defend your approach.
- Gaining a tactical approach in getting your research completed in time. Just ensure you are using the right approach while drafting your research methodology, and it can help you achieve your desired outcomes. Additionally, it provides a better explanation and understanding of the research question itself.
- Documenting the results so that the final outcome of the research stays as you intended it to be while starting.
Instruments you could use while writing a good research methodology
As a researcher, you must choose which tools or data collection methods that fit best in terms of the relevance of your research. This decision has to be wise.
There exists many research equipments or tools that you can use to carry out your research process. These are classified as:
a. Interviews (One-on-One or a Group)
An interview aimed to get your desired research outcomes can be undertaken in many different ways. For example, you can design your interview as structured, semi-structured, or unstructured. What sets them apart is the degree of formality in the questions. On the other hand, in a group interview, your aim should be to collect more opinions and group perceptions from the focus groups on a certain topic rather than looking out for some formal answers.
In surveys, you are in better control if you specifically draft the questions you seek the response for. For example, you may choose to include free-style questions that can be answered descriptively, or you may provide a multiple-choice type response for questions. Besides, you can also opt to choose both ways, deciding what suits your research process and purpose better.
c. Sample Groups
Similar to the group interviews, here, you can select a group of individuals and assign them a topic to discuss or freely express their opinions over that. You can simultaneously note down the answers and later draft them appropriately, deciding on the relevance of every response.
d. Observations
If your research domain is humanities or sociology, observations are the best-proven method to draw your research methodology. Of course, you can always include studying the spontaneous response of the participants towards a situation or conducting the same but in a more structured manner. A structured observation means putting the participants in a situation at a previously decided time and then studying their responses.
Of all the tools described above, it is you who should wisely choose the instruments and decide what’s the best fit for your research. You must not restrict yourself from multiple methods or a combination of a few instruments if appropriate in drafting a good research methodology.
Types of research methodology
A research methodology exists in various forms. Depending upon their approach, whether centered around words, numbers, or both, methodologies are distinguished as qualitative, quantitative, or an amalgamation of both.
1. Qualitative research methodology
When a research methodology primarily focuses on words and textual data, then it is generally referred to as qualitative research methodology. This type is usually preferred among researchers when the aim and scope of the research are mainly theoretical and explanatory.
The instruments used are observations, interviews, and sample groups. You can use this methodology if you are trying to study human behavior or response in some situations. Generally, qualitative research methodology is widely used in sociology, psychology, and other related domains.
2. Quantitative research methodology
If your research is majorly centered on data, figures, and stats, then analyzing these numerical data is often referred to as quantitative research methodology. You can use quantitative research methodology if your research requires you to validate or justify the obtained results.
In quantitative methods, surveys, tests, experiments, and evaluations of current databases can be advantageously used as instruments If your research involves testing some hypothesis, then use this methodology.
3. Amalgam methodology
As the name suggests, the amalgam methodology uses both quantitative and qualitative approaches. This methodology is used when a part of the research requires you to verify the facts and figures, whereas the other part demands you to discover the theoretical and explanatory nature of the research question.
The instruments for the amalgam methodology require you to conduct interviews and surveys, including tests and experiments. The outcome of this methodology can be insightful and valuable as it provides precise test results in line with theoretical explanations and reasoning.
The amalgam method, makes your work both factual and rational at the same time.
Final words: How to decide which is the best research methodology?
If you have kept your sincerity and awareness intact with the aims and scope of research well enough, you must have got an idea of which research methodology suits your work best.
Before deciding which research methodology answers your research question, you must invest significant time in reading and doing your homework for that. Taking references that yield relevant results should be your first approach to establishing a research methodology.
Moreover, you should never refrain from exploring other options. Before setting your work in stone, you must try all the available options as it explains why the choice of research methodology that you finally make is more appropriate than the other available options.
You should always go for a quantitative research methodology if your research requires gathering large amounts of data, figures, and statistics. This research methodology will provide you with results if your research paper involves the validation of some hypothesis.
Whereas, if you are looking for more explanations, reasons, opinions, and public perceptions around a theory, you must use qualitative research methodology.The choice of an appropriate research methodology ultimately depends on what you want to achieve through your research.
Frequently Asked Questions (FAQs) about Research Methodology
1. how to write a research methodology.
You can always provide a separate section for research methodology where you should specify details about the methods and instruments used during the research, discussions on result analysis, including insights into the background information, and conveying the research limitations.
2. What are the types of research methodology?
There generally exists four types of research methodology i.e.
- Observation
- Experimental
- Derivational
3. What is the true meaning of research methodology?
The set of techniques or procedures followed to discover and analyze the information gathered to validate or justify a research outcome is generally called Research Methodology.
4. Where lies the importance of research methodology?
Your research methodology directly reflects the validity of your research outcomes and how well-informed your research work is. Moreover, it can help future researchers cite or refer to your research if they plan to use a similar research methodology.
You might also like

Consensus GPT vs. SciSpace GPT: Choose the Best GPT for Research

Literature Review and Theoretical Framework: Understanding the Differences

Using AI for research: A beginner’s guide

Have a language expert improve your writing
Run a free plagiarism check in 10 minutes, automatically generate references for free.
- Knowledge Base
- Dissertation
- What Is a Research Methodology? | Steps & Tips
What Is a Research Methodology? | Steps & Tips
Published on 25 February 2019 by Shona McCombes . Revised on 10 October 2022.
Your research methodology discusses and explains the data collection and analysis methods you used in your research. A key part of your thesis, dissertation, or research paper, the methodology chapter explains what you did and how you did it, allowing readers to evaluate the reliability and validity of your research.
It should include:
- The type of research you conducted
- How you collected and analysed your data
- Any tools or materials you used in the research
- Why you chose these methods
- Your methodology section should generally be written in the past tense .
- Academic style guides in your field may provide detailed guidelines on what to include for different types of studies.
- Your citation style might provide guidelines for your methodology section (e.g., an APA Style methods section ).
Instantly correct all language mistakes in your text
Be assured that you'll submit flawless writing. Upload your document to correct all your mistakes.

Table of contents
How to write a research methodology, why is a methods section important, step 1: explain your methodological approach, step 2: describe your data collection methods, step 3: describe your analysis method, step 4: evaluate and justify the methodological choices you made, tips for writing a strong methodology chapter, frequently asked questions about methodology.
Prevent plagiarism, run a free check.
Your methods section is your opportunity to share how you conducted your research and why you chose the methods you chose. It’s also the place to show that your research was rigorously conducted and can be replicated .
It gives your research legitimacy and situates it within your field, and also gives your readers a place to refer to if they have any questions or critiques in other sections.
You can start by introducing your overall approach to your research. You have two options here.
Option 1: Start with your “what”
What research problem or question did you investigate?
- Aim to describe the characteristics of something?
- Explore an under-researched topic?
- Establish a causal relationship?
And what type of data did you need to achieve this aim?
- Quantitative data , qualitative data , or a mix of both?
- Primary data collected yourself, or secondary data collected by someone else?
- Experimental data gathered by controlling and manipulating variables, or descriptive data gathered via observations?
Option 2: Start with your “why”
Depending on your discipline, you can also start with a discussion of the rationale and assumptions underpinning your methodology. In other words, why did you choose these methods for your study?
- Why is this the best way to answer your research question?
- Is this a standard methodology in your field, or does it require justification?
- Were there any ethical considerations involved in your choices?
- What are the criteria for validity and reliability in this type of research ?
Once you have introduced your reader to your methodological approach, you should share full details about your data collection methods .
Quantitative methods
In order to be considered generalisable, you should describe quantitative research methods in enough detail for another researcher to replicate your study.
Here, explain how you operationalised your concepts and measured your variables. Discuss your sampling method or inclusion/exclusion criteria, as well as any tools, procedures, and materials you used to gather your data.
Surveys Describe where, when, and how the survey was conducted.
- How did you design the questionnaire?
- What form did your questions take (e.g., multiple choice, Likert scale )?
- Were your surveys conducted in-person or virtually?
- What sampling method did you use to select participants?
- What was your sample size and response rate?
Experiments Share full details of the tools, techniques, and procedures you used to conduct your experiment.
- How did you design the experiment ?
- How did you recruit participants?
- How did you manipulate and measure the variables ?
- What tools did you use?
Existing data Explain how you gathered and selected the material (such as datasets or archival data) that you used in your analysis.
- Where did you source the material?
- How was the data originally produced?
- What criteria did you use to select material (e.g., date range)?
The survey consisted of 5 multiple-choice questions and 10 questions measured on a 7-point Likert scale.
The goal was to collect survey responses from 350 customers visiting the fitness apparel company’s brick-and-mortar location in Boston on 4–8 July 2022, between 11:00 and 15:00.
Here, a customer was defined as a person who had purchased a product from the company on the day they took the survey. Participants were given 5 minutes to fill in the survey anonymously. In total, 408 customers responded, but not all surveys were fully completed. Due to this, 371 survey results were included in the analysis.
Qualitative methods
In qualitative research , methods are often more flexible and subjective. For this reason, it’s crucial to robustly explain the methodology choices you made.
Be sure to discuss the criteria you used to select your data, the context in which your research was conducted, and the role you played in collecting your data (e.g., were you an active participant, or a passive observer?)
Interviews or focus groups Describe where, when, and how the interviews were conducted.
- How did you find and select participants?
- How many participants took part?
- What form did the interviews take ( structured , semi-structured , or unstructured )?
- How long were the interviews?
- How were they recorded?
Participant observation Describe where, when, and how you conducted the observation or ethnography .
- What group or community did you observe? How long did you spend there?
- How did you gain access to this group? What role did you play in the community?
- How long did you spend conducting the research? Where was it located?
- How did you record your data (e.g., audiovisual recordings, note-taking)?
Existing data Explain how you selected case study materials for your analysis.
- What type of materials did you analyse?
- How did you select them?
In order to gain better insight into possibilities for future improvement of the fitness shop’s product range, semi-structured interviews were conducted with 8 returning customers.
Here, a returning customer was defined as someone who usually bought products at least twice a week from the store.
Surveys were used to select participants. Interviews were conducted in a small office next to the cash register and lasted approximately 20 minutes each. Answers were recorded by note-taking, and seven interviews were also filmed with consent. One interviewee preferred not to be filmed.
Mixed methods
Mixed methods research combines quantitative and qualitative approaches. If a standalone quantitative or qualitative study is insufficient to answer your research question, mixed methods may be a good fit for you.
Mixed methods are less common than standalone analyses, largely because they require a great deal of effort to pull off successfully. If you choose to pursue mixed methods, it’s especially important to robustly justify your methods here.
Next, you should indicate how you processed and analysed your data. Avoid going into too much detail: you should not start introducing or discussing any of your results at this stage.
In quantitative research , your analysis will be based on numbers. In your methods section, you can include:
- How you prepared the data before analysing it (e.g., checking for missing data , removing outliers , transforming variables)
- Which software you used (e.g., SPSS, Stata or R)
- Which statistical tests you used (e.g., two-tailed t test , simple linear regression )
In qualitative research, your analysis will be based on language, images, and observations (often involving some form of textual analysis ).
Specific methods might include:
- Content analysis : Categorising and discussing the meaning of words, phrases and sentences
- Thematic analysis : Coding and closely examining the data to identify broad themes and patterns
- Discourse analysis : Studying communication and meaning in relation to their social context
Mixed methods combine the above two research methods, integrating both qualitative and quantitative approaches into one coherent analytical process.
Above all, your methodology section should clearly make the case for why you chose the methods you did. This is especially true if you did not take the most standard approach to your topic. In this case, discuss why other methods were not suitable for your objectives, and show how this approach contributes new knowledge or understanding.
In any case, it should be overwhelmingly clear to your reader that you set yourself up for success in terms of your methodology’s design. Show how your methods should lead to results that are valid and reliable, while leaving the analysis of the meaning, importance, and relevance of your results for your discussion section .
- Quantitative: Lab-based experiments cannot always accurately simulate real-life situations and behaviours, but they are effective for testing causal relationships between variables .
- Qualitative: Unstructured interviews usually produce results that cannot be generalised beyond the sample group , but they provide a more in-depth understanding of participants’ perceptions, motivations, and emotions.
- Mixed methods: Despite issues systematically comparing differing types of data, a solely quantitative study would not sufficiently incorporate the lived experience of each participant, while a solely qualitative study would be insufficiently generalisable.
Remember that your aim is not just to describe your methods, but to show how and why you applied them. Again, it’s critical to demonstrate that your research was rigorously conducted and can be replicated.
1. Focus on your objectives and research questions
The methodology section should clearly show why your methods suit your objectives and convince the reader that you chose the best possible approach to answering your problem statement and research questions .
2. Cite relevant sources
Your methodology can be strengthened by referencing existing research in your field. This can help you to:
- Show that you followed established practice for your type of research
- Discuss how you decided on your approach by evaluating existing research
- Present a novel methodological approach to address a gap in the literature
3. Write for your audience
Consider how much information you need to give, and avoid getting too lengthy. If you are using methods that are standard for your discipline, you probably don’t need to give a lot of background or justification.
Regardless, your methodology should be a clear, well-structured text that makes an argument for your approach, not just a list of technical details and procedures.
Methodology refers to the overarching strategy and rationale of your research. Developing your methodology involves studying the research methods used in your field and the theories or principles that underpin them, in order to choose the approach that best matches your objectives.
Methods are the specific tools and procedures you use to collect and analyse data (e.g. interviews, experiments , surveys , statistical tests ).
In a dissertation or scientific paper, the methodology chapter or methods section comes after the introduction and before the results , discussion and conclusion .
Depending on the length and type of document, you might also include a literature review or theoretical framework before the methodology.
Quantitative research deals with numbers and statistics, while qualitative research deals with words and meanings.
Quantitative methods allow you to test a hypothesis by systematically collecting and analysing data, while qualitative methods allow you to explore ideas and experiences in depth.
A sample is a subset of individuals from a larger population. Sampling means selecting the group that you will actually collect data from in your research.
For example, if you are researching the opinions of students in your university, you could survey a sample of 100 students.
Statistical sampling allows you to test a hypothesis about the characteristics of a population. There are various sampling methods you can use to ensure that your sample is representative of the population as a whole.
Cite this Scribbr article
If you want to cite this source, you can copy and paste the citation or click the ‘Cite this Scribbr article’ button to automatically add the citation to our free Reference Generator.
McCombes, S. (2022, October 10). What Is a Research Methodology? | Steps & Tips. Scribbr. Retrieved 2 April 2024, from https://www.scribbr.co.uk/thesis-dissertation/methodology/
Is this article helpful?

Shona McCombes
Other students also liked, how to write a dissertation proposal | a step-by-step guide, what is a literature review | guide, template, & examples, what is a theoretical framework | a step-by-step guide.
Reference management. Clean and simple.
What is research methodology?

The basics of research methodology
Why do you need a research methodology, what needs to be included, why do you need to document your research method, what are the different types of research instruments, qualitative / quantitative / mixed research methodologies, how do you choose the best research methodology for you, frequently asked questions about research methodology, related articles.
When you’re working on your first piece of academic research, there are many different things to focus on, and it can be overwhelming to stay on top of everything. This is especially true of budding or inexperienced researchers.
If you’ve never put together a research proposal before or find yourself in a position where you need to explain your research methodology decisions, there are a few things you need to be aware of.
Once you understand the ins and outs, handling academic research in the future will be less intimidating. We break down the basics below:
A research methodology encompasses the way in which you intend to carry out your research. This includes how you plan to tackle things like collection methods, statistical analysis, participant observations, and more.
You can think of your research methodology as being a formula. One part will be how you plan on putting your research into practice, and another will be why you feel this is the best way to approach it. Your research methodology is ultimately a methodological and systematic plan to resolve your research problem.
In short, you are explaining how you will take your idea and turn it into a study, which in turn will produce valid and reliable results that are in accordance with the aims and objectives of your research. This is true whether your paper plans to make use of qualitative methods or quantitative methods.
The purpose of a research methodology is to explain the reasoning behind your approach to your research - you'll need to support your collection methods, methods of analysis, and other key points of your work.
Think of it like writing a plan or an outline for you what you intend to do.
When carrying out research, it can be easy to go off-track or depart from your standard methodology.
Tip: Having a methodology keeps you accountable and on track with your original aims and objectives, and gives you a suitable and sound plan to keep your project manageable, smooth, and effective.
With all that said, how do you write out your standard approach to a research methodology?
As a general plan, your methodology should include the following information:
- Your research method. You need to state whether you plan to use quantitative analysis, qualitative analysis, or mixed-method research methods. This will often be determined by what you hope to achieve with your research.
- Explain your reasoning. Why are you taking this methodological approach? Why is this particular methodology the best way to answer your research problem and achieve your objectives?
- Explain your instruments. This will mainly be about your collection methods. There are varying instruments to use such as interviews, physical surveys, questionnaires, for example. Your methodology will need to detail your reasoning in choosing a particular instrument for your research.
- What will you do with your results? How are you going to analyze the data once you have gathered it?
- Advise your reader. If there is anything in your research methodology that your reader might be unfamiliar with, you should explain it in more detail. For example, you should give any background information to your methods that might be relevant or provide your reasoning if you are conducting your research in a non-standard way.
- How will your sampling process go? What will your sampling procedure be and why? For example, if you will collect data by carrying out semi-structured or unstructured interviews, how will you choose your interviewees and how will you conduct the interviews themselves?
- Any practical limitations? You should discuss any limitations you foresee being an issue when you’re carrying out your research.
In any dissertation, thesis, or academic journal, you will always find a chapter dedicated to explaining the research methodology of the person who carried out the study, also referred to as the methodology section of the work.
A good research methodology will explain what you are going to do and why, while a poor methodology will lead to a messy or disorganized approach.
You should also be able to justify in this section your reasoning for why you intend to carry out your research in a particular way, especially if it might be a particularly unique method.
Having a sound methodology in place can also help you with the following:
- When another researcher at a later date wishes to try and replicate your research, they will need your explanations and guidelines.
- In the event that you receive any criticism or questioning on the research you carried out at a later point, you will be able to refer back to it and succinctly explain the how and why of your approach.
- It provides you with a plan to follow throughout your research. When you are drafting your methodology approach, you need to be sure that the method you are using is the right one for your goal. This will help you with both explaining and understanding your method.
- It affords you the opportunity to document from the outset what you intend to achieve with your research, from start to finish.
A research instrument is a tool you will use to help you collect, measure and analyze the data you use as part of your research.
The choice of research instrument will usually be yours to make as the researcher and will be whichever best suits your methodology.
There are many different research instruments you can use in collecting data for your research.
Generally, they can be grouped as follows:
- Interviews (either as a group or one-on-one). You can carry out interviews in many different ways. For example, your interview can be structured, semi-structured, or unstructured. The difference between them is how formal the set of questions is that is asked of the interviewee. In a group interview, you may choose to ask the interviewees to give you their opinions or perceptions on certain topics.
- Surveys (online or in-person). In survey research, you are posing questions in which you ask for a response from the person taking the survey. You may wish to have either free-answer questions such as essay-style questions, or you may wish to use closed questions such as multiple choice. You may even wish to make the survey a mixture of both.
- Focus Groups. Similar to the group interview above, you may wish to ask a focus group to discuss a particular topic or opinion while you make a note of the answers given.
- Observations. This is a good research instrument to use if you are looking into human behaviors. Different ways of researching this include studying the spontaneous behavior of participants in their everyday life, or something more structured. A structured observation is research conducted at a set time and place where researchers observe behavior as planned and agreed upon with participants.
These are the most common ways of carrying out research, but it is really dependent on your needs as a researcher and what approach you think is best to take.
It is also possible to combine a number of research instruments if this is necessary and appropriate in answering your research problem.
There are three different types of methodologies, and they are distinguished by whether they focus on words, numbers, or both.
➡️ Want to learn more about the differences between qualitative and quantitative research, and how to use both methods? Check out our guide for that!
If you've done your due diligence, you'll have an idea of which methodology approach is best suited to your research.
It’s likely that you will have carried out considerable reading and homework before you reach this point and you may have taken inspiration from other similar studies that have yielded good results.
Still, it is important to consider different options before setting your research in stone. Exploring different options available will help you to explain why the choice you ultimately make is preferable to other methods.
If proving your research problem requires you to gather large volumes of numerical data to test hypotheses, a quantitative research method is likely to provide you with the most usable results.
If instead you’re looking to try and learn more about people, and their perception of events, your methodology is more exploratory in nature and would therefore probably be better served using a qualitative research methodology.
It helps to always bring things back to the question: what do I want to achieve with my research?
Once you have conducted your research, you need to analyze it. Here are some helpful guides for qualitative data analysis:
➡️ How to do a content analysis
➡️ How to do a thematic analysis
➡️ How to do a rhetorical analysis
Research methodology refers to the techniques used to find and analyze information for a study, ensuring that the results are valid, reliable and that they address the research objective.
Data can typically be organized into four different categories or methods: observational, experimental, simulation, and derived.
Writing a methodology section is a process of introducing your methods and instruments, discussing your analysis, providing more background information, addressing your research limitations, and more.
Your research methodology section will need a clear research question and proposed research approach. You'll need to add a background, introduce your research question, write your methodology and add the works you cited during your data collecting phase.
The research methodology section of your study will indicate how valid your findings are and how well-informed your paper is. It also assists future researchers planning to use the same methodology, who want to cite your study or replicate it.

When you choose to publish with PLOS, your research makes an impact. Make your work accessible to all, without restrictions, and accelerate scientific discovery with options like preprints and published peer review that make your work more Open.
- PLOS Biology
- PLOS Climate
- PLOS Complex Systems
- PLOS Computational Biology
- PLOS Digital Health
- PLOS Genetics
- PLOS Global Public Health
- PLOS Medicine
- PLOS Mental Health
- PLOS Neglected Tropical Diseases
- PLOS Pathogens
- PLOS Sustainability and Transformation
- PLOS Collections
- How to Write Your Methods

Ensure understanding, reproducibility and replicability
What should you include in your methods section, and how much detail is appropriate?
Why Methods Matter
The methods section was once the most likely part of a paper to be unfairly abbreviated, overly summarized, or even relegated to hard-to-find sections of a publisher’s website. While some journals may responsibly include more detailed elements of methods in supplementary sections, the movement for increased reproducibility and rigor in science has reinstated the importance of the methods section. Methods are now viewed as a key element in establishing the credibility of the research being reported, alongside the open availability of data and results.
A clear methods section impacts editorial evaluation and readers’ understanding, and is also the backbone of transparency and replicability.
For example, the Reproducibility Project: Cancer Biology project set out in 2013 to replicate experiments from 50 high profile cancer papers, but revised their target to 18 papers once they understood how much methodological detail was not contained in the original papers.

What to include in your methods section
What you include in your methods sections depends on what field you are in and what experiments you are performing. However, the general principle in place at the majority of journals is summarized well by the guidelines at PLOS ONE : “The Materials and Methods section should provide enough detail to allow suitably skilled investigators to fully replicate your study. ” The emphases here are deliberate: the methods should enable readers to understand your paper, and replicate your study. However, there is no need to go into the level of detail that a lay-person would require—the focus is on the reader who is also trained in your field, with the suitable skills and knowledge to attempt a replication.
A constant principle of rigorous science
A methods section that enables other researchers to understand and replicate your results is a constant principle of rigorous, transparent, and Open Science. Aim to be thorough, even if a particular journal doesn’t require the same level of detail . Reproducibility is all of our responsibility. You cannot create any problems by exceeding a minimum standard of information. If a journal still has word-limits—either for the overall article or specific sections—and requires some methodological details to be in a supplemental section, that is OK as long as the extra details are searchable and findable .
Imagine replicating your own work, years in the future
As part of PLOS’ presentation on Reproducibility and Open Publishing (part of UCSF’s Reproducibility Series ) we recommend planning the level of detail in your methods section by imagining you are writing for your future self, replicating your own work. When you consider that you might be at a different institution, with different account logins, applications, resources, and access levels—you can help yourself imagine the level of specificity that you yourself would require to redo the exact experiment. Consider:
- Which details would you need to be reminded of?
- Which cell line, or antibody, or software, or reagent did you use, and does it have a Research Resource ID (RRID) that you can cite?
- Which version of a questionnaire did you use in your survey?
- Exactly which visual stimulus did you show participants, and is it publicly available?
- What participants did you decide to exclude?
- What process did you adjust, during your work?
Tip: Be sure to capture any changes to your protocols
You yourself would want to know about any adjustments, if you ever replicate the work, so you can surmise that anyone else would want to as well. Even if a necessary adjustment you made was not ideal, transparency is the key to ensuring this is not regarded as an issue in the future. It is far better to transparently convey any non-optimal methods, or methodological constraints, than to conceal them, which could result in reproducibility or ethical issues downstream.
Visual aids for methods help when reading the whole paper
Consider whether a visual representation of your methods could be appropriate or aid understanding your process. A visual reference readers can easily return to, like a flow-diagram, decision-tree, or checklist, can help readers to better understand the complete article, not just the methods section.
Ethical Considerations
In addition to describing what you did, it is just as important to assure readers that you also followed all relevant ethical guidelines when conducting your research. While ethical standards and reporting guidelines are often presented in a separate section of a paper, ensure that your methods and protocols actually follow these guidelines. Read more about ethics .
Existing standards, checklists, guidelines, partners
While the level of detail contained in a methods section should be guided by the universal principles of rigorous science outlined above, various disciplines, fields, and projects have worked hard to design and develop consistent standards, guidelines, and tools to help with reporting all types of experiment. Below, you’ll find some of the key initiatives. Ensure you read the submission guidelines for the specific journal you are submitting to, in order to discover any further journal- or field-specific policies to follow, or initiatives/tools to utilize.
Tip: Keep your paper moving forward by providing the proper paperwork up front
Be sure to check the journal guidelines and provide the necessary documents with your manuscript submission. Collecting the necessary documentation can greatly slow the first round of peer review, or cause delays when you submit your revision.
Randomized Controlled Trials – CONSORT The Consolidated Standards of Reporting Trials (CONSORT) project covers various initiatives intended to prevent the problems of inadequate reporting of randomized controlled trials. The primary initiative is an evidence-based minimum set of recommendations for reporting randomized trials known as the CONSORT Statement .
Systematic Reviews and Meta-Analyses – PRISMA The Preferred Reporting Items for Systematic Reviews and Meta-Analyses ( PRISMA ) is an evidence-based minimum set of items focusing on the reporting of reviews evaluating randomized trials and other types of research.
Research using Animals – ARRIVE The Animal Research: Reporting of In Vivo Experiments ( ARRIVE ) guidelines encourage maximizing the information reported in research using animals thereby minimizing unnecessary studies. (Original study and proposal , and updated guidelines , in PLOS Biology .)
Laboratory Protocols Protocols.io has developed a platform specifically for the sharing and updating of laboratory protocols , which are assigned their own DOI and can be linked from methods sections of papers to enhance reproducibility. Contextualize your protocol and improve discovery with an accompanying Lab Protocol article in PLOS ONE .
Consistent reporting of Materials, Design, and Analysis – the MDAR checklist A cross-publisher group of editors and experts have developed, tested, and rolled out a checklist to help establish and harmonize reporting standards in the Life Sciences . The checklist , which is available for use by authors to compile their methods, and editors/reviewers to check methods, establishes a minimum set of requirements in transparent reporting and is adaptable to any discipline within the Life Sciences, by covering a breadth of potentially relevant methodological items and considerations. If you are in the Life Sciences and writing up your methods section, try working through the MDAR checklist and see whether it helps you include all relevant details into your methods, and whether it reminded you of anything you might have missed otherwise.
Summary Writing tips
The main challenge you may find when writing your methods is keeping it readable AND covering all the details needed for reproducibility and replicability. While this is difficult, do not compromise on rigorous standards for credibility!

- Keep in mind future replicability, alongside understanding and readability.
- Follow checklists, and field- and journal-specific guidelines.
- Consider a commitment to rigorous and transparent science a personal responsibility, and not just adhering to journal guidelines.
- Establish whether there are persistent identifiers for any research resources you use that can be specifically cited in your methods section.
- Deposit your laboratory protocols in Protocols.io, establishing a permanent link to them. You can update your protocols later if you improve on them, as can future scientists who follow your protocols.
- Consider visual aids like flow-diagrams, lists, to help with reading other sections of the paper.
- Be specific about all decisions made during the experiments that someone reproducing your work would need to know.

Don’t
- Summarize or abbreviate methods without giving full details in a discoverable supplemental section.
- Presume you will always be able to remember how you performed the experiments, or have access to private or institutional notebooks and resources.
- Attempt to hide constraints or non-optimal decisions you had to make–transparency is the key to ensuring the credibility of your research.
- How to Write a Great Title
- How to Write an Abstract
- How to Report Statistics
- How to Write Discussions and Conclusions
- How to Edit Your Work
The contents of the Peer Review Center are also available as a live, interactive training session, complete with slides, talking points, and activities. …
The contents of the Writing Center are also available as a live, interactive training session, complete with slides, talking points, and activities. …
There’s a lot to consider when deciding where to submit your work. Learn how to choose a journal that will help your study reach its audience, while reflecting your values as a researcher…
Research Methodology Example
Detailed Walkthrough + Free Methodology Chapter Template
If you’re working on a dissertation or thesis and are looking for an example of a research methodology chapter , you’ve come to the right place.
In this video, we walk you through a research methodology from a dissertation that earned full distinction , step by step. We start off by discussing the core components of a research methodology by unpacking our free methodology chapter template . We then progress to the sample research methodology to show how these concepts are applied in an actual dissertation, thesis or research project.
If you’re currently working on your research methodology chapter, you may also find the following resources useful:
- Research methodology 101 : an introductory video discussing what a methodology is and the role it plays within a dissertation
- Research design 101 : an overview of the most common research designs for both qualitative and quantitative studies
- Variables 101 : an introductory video covering the different types of variables that exist within research.
- Sampling 101 : an overview of the main sampling methods
- Methodology tips : a video discussion covering various tips to help you write a high-quality methodology chapter
- Private coaching : Get hands-on help with your research methodology

FAQ: Research Methodology Example
Research methodology example: frequently asked questions, is the sample research methodology real.
Yes. The chapter example is an extract from a Master’s-level dissertation for an MBA program. A few minor edits have been made to protect the privacy of the sponsoring organisation, but these have no material impact on the research methodology.
Can I replicate this methodology for my dissertation?
As we discuss in the video, every research methodology will be different, depending on the research aims, objectives and research questions. Therefore, you’ll need to tailor your literature review to suit your specific context.
You can learn more about the basics of writing a research methodology chapter here .
Where can I find more examples of research methodologies?
The best place to find more examples of methodology chapters would be within dissertation/thesis databases. These databases include dissertations, theses and research projects that have successfully passed the assessment criteria for the respective university, meaning that you have at least some sort of quality assurance.
The Open Access Thesis Database (OATD) is a good starting point.
How do I get the research methodology chapter template?
You can access our free methodology chapter template here .
Is the methodology template really free?
Yes. There is no cost for the template and you are free to use it as you wish.
You Might Also Like:

Submit a Comment Cancel reply
Your email address will not be published. Required fields are marked *
Save my name, email, and website in this browser for the next time I comment.
- Print Friendly

An official website of the United States government
The .gov means it’s official. Federal government websites often end in .gov or .mil. Before sharing sensitive information, make sure you’re on a federal government site.
The site is secure. The https:// ensures that you are connecting to the official website and that any information you provide is encrypted and transmitted securely.
- Publications
- Account settings
Preview improvements coming to the PMC website in October 2024. Learn More or Try it out now .
- Advanced Search
- Journal List
- BMC Med Res Methodol
A tutorial on methodological studies: the what, when, how and why
Lawrence mbuagbaw.
1 Department of Health Research Methods, Evidence and Impact, McMaster University, Hamilton, ON Canada
2 Biostatistics Unit/FSORC, 50 Charlton Avenue East, St Joseph’s Healthcare—Hamilton, 3rd Floor Martha Wing, Room H321, Hamilton, Ontario L8N 4A6 Canada
3 Centre for the Development of Best Practices in Health, Yaoundé, Cameroon
Daeria O. Lawson
Livia puljak.
4 Center for Evidence-Based Medicine and Health Care, Catholic University of Croatia, Ilica 242, 10000 Zagreb, Croatia
David B. Allison
5 Department of Epidemiology and Biostatistics, School of Public Health – Bloomington, Indiana University, Bloomington, IN 47405 USA
Lehana Thabane
6 Departments of Paediatrics and Anaesthesia, McMaster University, Hamilton, ON Canada
7 Centre for Evaluation of Medicine, St. Joseph’s Healthcare-Hamilton, Hamilton, ON Canada
8 Population Health Research Institute, Hamilton Health Sciences, Hamilton, ON Canada
Associated Data
Data sharing is not applicable to this article as no new data were created or analyzed in this study.
Methodological studies – studies that evaluate the design, analysis or reporting of other research-related reports – play an important role in health research. They help to highlight issues in the conduct of research with the aim of improving health research methodology, and ultimately reducing research waste.
We provide an overview of some of the key aspects of methodological studies such as what they are, and when, how and why they are done. We adopt a “frequently asked questions” format to facilitate reading this paper and provide multiple examples to help guide researchers interested in conducting methodological studies. Some of the topics addressed include: is it necessary to publish a study protocol? How to select relevant research reports and databases for a methodological study? What approaches to data extraction and statistical analysis should be considered when conducting a methodological study? What are potential threats to validity and is there a way to appraise the quality of methodological studies?
Appropriate reflection and application of basic principles of epidemiology and biostatistics are required in the design and analysis of methodological studies. This paper provides an introduction for further discussion about the conduct of methodological studies.
The field of meta-research (or research-on-research) has proliferated in recent years in response to issues with research quality and conduct [ 1 – 3 ]. As the name suggests, this field targets issues with research design, conduct, analysis and reporting. Various types of research reports are often examined as the unit of analysis in these studies (e.g. abstracts, full manuscripts, trial registry entries). Like many other novel fields of research, meta-research has seen a proliferation of use before the development of reporting guidance. For example, this was the case with randomized trials for which risk of bias tools and reporting guidelines were only developed much later – after many trials had been published and noted to have limitations [ 4 , 5 ]; and for systematic reviews as well [ 6 – 8 ]. However, in the absence of formal guidance, studies that report on research differ substantially in how they are named, conducted and reported [ 9 , 10 ]. This creates challenges in identifying, summarizing and comparing them. In this tutorial paper, we will use the term methodological study to refer to any study that reports on the design, conduct, analysis or reporting of primary or secondary research-related reports (such as trial registry entries and conference abstracts).
In the past 10 years, there has been an increase in the use of terms related to methodological studies (based on records retrieved with a keyword search [in the title and abstract] for “methodological review” and “meta-epidemiological study” in PubMed up to December 2019), suggesting that these studies may be appearing more frequently in the literature. See Fig. 1 .

Trends in the number studies that mention “methodological review” or “meta-
epidemiological study” in PubMed.
The methods used in many methodological studies have been borrowed from systematic and scoping reviews. This practice has influenced the direction of the field, with many methodological studies including searches of electronic databases, screening of records, duplicate data extraction and assessments of risk of bias in the included studies. However, the research questions posed in methodological studies do not always require the approaches listed above, and guidance is needed on when and how to apply these methods to a methodological study. Even though methodological studies can be conducted on qualitative or mixed methods research, this paper focuses on and draws examples exclusively from quantitative research.
The objectives of this paper are to provide some insights on how to conduct methodological studies so that there is greater consistency between the research questions posed, and the design, analysis and reporting of findings. We provide multiple examples to illustrate concepts and a proposed framework for categorizing methodological studies in quantitative research.
What is a methodological study?
Any study that describes or analyzes methods (design, conduct, analysis or reporting) in published (or unpublished) literature is a methodological study. Consequently, the scope of methodological studies is quite extensive and includes, but is not limited to, topics as diverse as: research question formulation [ 11 ]; adherence to reporting guidelines [ 12 – 14 ] and consistency in reporting [ 15 ]; approaches to study analysis [ 16 ]; investigating the credibility of analyses [ 17 ]; and studies that synthesize these methodological studies [ 18 ]. While the nomenclature of methodological studies is not uniform, the intents and purposes of these studies remain fairly consistent – to describe or analyze methods in primary or secondary studies. As such, methodological studies may also be classified as a subtype of observational studies.
Parallel to this are experimental studies that compare different methods. Even though they play an important role in informing optimal research methods, experimental methodological studies are beyond the scope of this paper. Examples of such studies include the randomized trials by Buscemi et al., comparing single data extraction to double data extraction [ 19 ], and Carrasco-Labra et al., comparing approaches to presenting findings in Grading of Recommendations, Assessment, Development and Evaluations (GRADE) summary of findings tables [ 20 ]. In these studies, the unit of analysis is the person or groups of individuals applying the methods. We also direct readers to the Studies Within a Trial (SWAT) and Studies Within a Review (SWAR) programme operated through the Hub for Trials Methodology Research, for further reading as a potential useful resource for these types of experimental studies [ 21 ]. Lastly, this paper is not meant to inform the conduct of research using computational simulation and mathematical modeling for which some guidance already exists [ 22 ], or studies on the development of methods using consensus-based approaches.
When should we conduct a methodological study?
Methodological studies occupy a unique niche in health research that allows them to inform methodological advances. Methodological studies should also be conducted as pre-cursors to reporting guideline development, as they provide an opportunity to understand current practices, and help to identify the need for guidance and gaps in methodological or reporting quality. For example, the development of the popular Preferred Reporting Items of Systematic reviews and Meta-Analyses (PRISMA) guidelines were preceded by methodological studies identifying poor reporting practices [ 23 , 24 ]. In these instances, after the reporting guidelines are published, methodological studies can also be used to monitor uptake of the guidelines.
These studies can also be conducted to inform the state of the art for design, analysis and reporting practices across different types of health research fields, with the aim of improving research practices, and preventing or reducing research waste. For example, Samaan et al. conducted a scoping review of adherence to different reporting guidelines in health care literature [ 18 ]. Methodological studies can also be used to determine the factors associated with reporting practices. For example, Abbade et al. investigated journal characteristics associated with the use of the Participants, Intervention, Comparison, Outcome, Timeframe (PICOT) format in framing research questions in trials of venous ulcer disease [ 11 ].
How often are methodological studies conducted?
There is no clear answer to this question. Based on a search of PubMed, the use of related terms (“methodological review” and “meta-epidemiological study”) – and therefore, the number of methodological studies – is on the rise. However, many other terms are used to describe methodological studies. There are also many studies that explore design, conduct, analysis or reporting of research reports, but that do not use any specific terms to describe or label their study design in terms of “methodology”. This diversity in nomenclature makes a census of methodological studies elusive. Appropriate terminology and key words for methodological studies are needed to facilitate improved accessibility for end-users.
Why do we conduct methodological studies?
Methodological studies provide information on the design, conduct, analysis or reporting of primary and secondary research and can be used to appraise quality, quantity, completeness, accuracy and consistency of health research. These issues can be explored in specific fields, journals, databases, geographical regions and time periods. For example, Areia et al. explored the quality of reporting of endoscopic diagnostic studies in gastroenterology [ 25 ]; Knol et al. investigated the reporting of p -values in baseline tables in randomized trial published in high impact journals [ 26 ]; Chen et al. describe adherence to the Consolidated Standards of Reporting Trials (CONSORT) statement in Chinese Journals [ 27 ]; and Hopewell et al. describe the effect of editors’ implementation of CONSORT guidelines on reporting of abstracts over time [ 28 ]. Methodological studies provide useful information to researchers, clinicians, editors, publishers and users of health literature. As a result, these studies have been at the cornerstone of important methodological developments in the past two decades and have informed the development of many health research guidelines including the highly cited CONSORT statement [ 5 ].
Where can we find methodological studies?
Methodological studies can be found in most common biomedical bibliographic databases (e.g. Embase, MEDLINE, PubMed, Web of Science). However, the biggest caveat is that methodological studies are hard to identify in the literature due to the wide variety of names used and the lack of comprehensive databases dedicated to them. A handful can be found in the Cochrane Library as “Cochrane Methodology Reviews”, but these studies only cover methodological issues related to systematic reviews. Previous attempts to catalogue all empirical studies of methods used in reviews were abandoned 10 years ago [ 29 ]. In other databases, a variety of search terms may be applied with different levels of sensitivity and specificity.
Some frequently asked questions about methodological studies
In this section, we have outlined responses to questions that might help inform the conduct of methodological studies.
Q: How should I select research reports for my methodological study?
A: Selection of research reports for a methodological study depends on the research question and eligibility criteria. Once a clear research question is set and the nature of literature one desires to review is known, one can then begin the selection process. Selection may begin with a broad search, especially if the eligibility criteria are not apparent. For example, a methodological study of Cochrane Reviews of HIV would not require a complex search as all eligible studies can easily be retrieved from the Cochrane Library after checking a few boxes [ 30 ]. On the other hand, a methodological study of subgroup analyses in trials of gastrointestinal oncology would require a search to find such trials, and further screening to identify trials that conducted a subgroup analysis [ 31 ].
The strategies used for identifying participants in observational studies can apply here. One may use a systematic search to identify all eligible studies. If the number of eligible studies is unmanageable, a random sample of articles can be expected to provide comparable results if it is sufficiently large [ 32 ]. For example, Wilson et al. used a random sample of trials from the Cochrane Stroke Group’s Trial Register to investigate completeness of reporting [ 33 ]. It is possible that a simple random sample would lead to underrepresentation of units (i.e. research reports) that are smaller in number. This is relevant if the investigators wish to compare multiple groups but have too few units in one group. In this case a stratified sample would help to create equal groups. For example, in a methodological study comparing Cochrane and non-Cochrane reviews, Kahale et al. drew random samples from both groups [ 34 ]. Alternatively, systematic or purposeful sampling strategies can be used and we encourage researchers to justify their selected approaches based on the study objective.
Q: How many databases should I search?
A: The number of databases one should search would depend on the approach to sampling, which can include targeting the entire “population” of interest or a sample of that population. If you are interested in including the entire target population for your research question, or drawing a random or systematic sample from it, then a comprehensive and exhaustive search for relevant articles is required. In this case, we recommend using systematic approaches for searching electronic databases (i.e. at least 2 databases with a replicable and time stamped search strategy). The results of your search will constitute a sampling frame from which eligible studies can be drawn.
Alternatively, if your approach to sampling is purposeful, then we recommend targeting the database(s) or data sources (e.g. journals, registries) that include the information you need. For example, if you are conducting a methodological study of high impact journals in plastic surgery and they are all indexed in PubMed, you likely do not need to search any other databases. You may also have a comprehensive list of all journals of interest and can approach your search using the journal names in your database search (or by accessing the journal archives directly from the journal’s website). Even though one could also search journals’ web pages directly, using a database such as PubMed has multiple advantages, such as the use of filters, so the search can be narrowed down to a certain period, or study types of interest. Furthermore, individual journals’ web sites may have different search functionalities, which do not necessarily yield a consistent output.
Q: Should I publish a protocol for my methodological study?
A: A protocol is a description of intended research methods. Currently, only protocols for clinical trials require registration [ 35 ]. Protocols for systematic reviews are encouraged but no formal recommendation exists. The scientific community welcomes the publication of protocols because they help protect against selective outcome reporting, the use of post hoc methodologies to embellish results, and to help avoid duplication of efforts [ 36 ]. While the latter two risks exist in methodological research, the negative consequences may be substantially less than for clinical outcomes. In a sample of 31 methodological studies, 7 (22.6%) referenced a published protocol [ 9 ]. In the Cochrane Library, there are 15 protocols for methodological reviews (21 July 2020). This suggests that publishing protocols for methodological studies is not uncommon.
Authors can consider publishing their study protocol in a scholarly journal as a manuscript. Advantages of such publication include obtaining peer-review feedback about the planned study, and easy retrieval by searching databases such as PubMed. The disadvantages in trying to publish protocols includes delays associated with manuscript handling and peer review, as well as costs, as few journals publish study protocols, and those journals mostly charge article-processing fees [ 37 ]. Authors who would like to make their protocol publicly available without publishing it in scholarly journals, could deposit their study protocols in publicly available repositories, such as the Open Science Framework ( https://osf.io/ ).
Q: How to appraise the quality of a methodological study?
A: To date, there is no published tool for appraising the risk of bias in a methodological study, but in principle, a methodological study could be considered as a type of observational study. Therefore, during conduct or appraisal, care should be taken to avoid the biases common in observational studies [ 38 ]. These biases include selection bias, comparability of groups, and ascertainment of exposure or outcome. In other words, to generate a representative sample, a comprehensive reproducible search may be necessary to build a sampling frame. Additionally, random sampling may be necessary to ensure that all the included research reports have the same probability of being selected, and the screening and selection processes should be transparent and reproducible. To ensure that the groups compared are similar in all characteristics, matching, random sampling or stratified sampling can be used. Statistical adjustments for between-group differences can also be applied at the analysis stage. Finally, duplicate data extraction can reduce errors in assessment of exposures or outcomes.
Q: Should I justify a sample size?
A: In all instances where one is not using the target population (i.e. the group to which inferences from the research report are directed) [ 39 ], a sample size justification is good practice. The sample size justification may take the form of a description of what is expected to be achieved with the number of articles selected, or a formal sample size estimation that outlines the number of articles required to answer the research question with a certain precision and power. Sample size justifications in methodological studies are reasonable in the following instances:
- Comparing two groups
- Determining a proportion, mean or another quantifier
- Determining factors associated with an outcome using regression-based analyses
For example, El Dib et al. computed a sample size requirement for a methodological study of diagnostic strategies in randomized trials, based on a confidence interval approach [ 40 ].
Q: What should I call my study?
A: Other terms which have been used to describe/label methodological studies include “ methodological review ”, “methodological survey” , “meta-epidemiological study” , “systematic review” , “systematic survey”, “meta-research”, “research-on-research” and many others. We recommend that the study nomenclature be clear, unambiguous, informative and allow for appropriate indexing. Methodological study nomenclature that should be avoided includes “ systematic review” – as this will likely be confused with a systematic review of a clinical question. “ Systematic survey” may also lead to confusion about whether the survey was systematic (i.e. using a preplanned methodology) or a survey using “ systematic” sampling (i.e. a sampling approach using specific intervals to determine who is selected) [ 32 ]. Any of the above meanings of the words “ systematic” may be true for methodological studies and could be potentially misleading. “ Meta-epidemiological study” is ideal for indexing, but not very informative as it describes an entire field. The term “ review ” may point towards an appraisal or “review” of the design, conduct, analysis or reporting (or methodological components) of the targeted research reports, yet it has also been used to describe narrative reviews [ 41 , 42 ]. The term “ survey ” is also in line with the approaches used in many methodological studies [ 9 ], and would be indicative of the sampling procedures of this study design. However, in the absence of guidelines on nomenclature, the term “ methodological study ” is broad enough to capture most of the scenarios of such studies.
Q: Should I account for clustering in my methodological study?
A: Data from methodological studies are often clustered. For example, articles coming from a specific source may have different reporting standards (e.g. the Cochrane Library). Articles within the same journal may be similar due to editorial practices and policies, reporting requirements and endorsement of guidelines. There is emerging evidence that these are real concerns that should be accounted for in analyses [ 43 ]. Some cluster variables are described in the section: “ What variables are relevant to methodological studies?”
A variety of modelling approaches can be used to account for correlated data, including the use of marginal, fixed or mixed effects regression models with appropriate computation of standard errors [ 44 ]. For example, Kosa et al. used generalized estimation equations to account for correlation of articles within journals [ 15 ]. Not accounting for clustering could lead to incorrect p -values, unduly narrow confidence intervals, and biased estimates [ 45 ].
Q: Should I extract data in duplicate?
A: Yes. Duplicate data extraction takes more time but results in less errors [ 19 ]. Data extraction errors in turn affect the effect estimate [ 46 ], and therefore should be mitigated. Duplicate data extraction should be considered in the absence of other approaches to minimize extraction errors. However, much like systematic reviews, this area will likely see rapid new advances with machine learning and natural language processing technologies to support researchers with screening and data extraction [ 47 , 48 ]. However, experience plays an important role in the quality of extracted data and inexperienced extractors should be paired with experienced extractors [ 46 , 49 ].
Q: Should I assess the risk of bias of research reports included in my methodological study?
A : Risk of bias is most useful in determining the certainty that can be placed in the effect measure from a study. In methodological studies, risk of bias may not serve the purpose of determining the trustworthiness of results, as effect measures are often not the primary goal of methodological studies. Determining risk of bias in methodological studies is likely a practice borrowed from systematic review methodology, but whose intrinsic value is not obvious in methodological studies. When it is part of the research question, investigators often focus on one aspect of risk of bias. For example, Speich investigated how blinding was reported in surgical trials [ 50 ], and Abraha et al., investigated the application of intention-to-treat analyses in systematic reviews and trials [ 51 ].
Q: What variables are relevant to methodological studies?
A: There is empirical evidence that certain variables may inform the findings in a methodological study. We outline some of these and provide a brief overview below:
- Country: Countries and regions differ in their research cultures, and the resources available to conduct research. Therefore, it is reasonable to believe that there may be differences in methodological features across countries. Methodological studies have reported loco-regional differences in reporting quality [ 52 , 53 ]. This may also be related to challenges non-English speakers face in publishing papers in English.
- Authors’ expertise: The inclusion of authors with expertise in research methodology, biostatistics, and scientific writing is likely to influence the end-product. Oltean et al. found that among randomized trials in orthopaedic surgery, the use of analyses that accounted for clustering was more likely when specialists (e.g. statistician, epidemiologist or clinical trials methodologist) were included on the study team [ 54 ]. Fleming et al. found that including methodologists in the review team was associated with appropriate use of reporting guidelines [ 55 ].
- Source of funding and conflicts of interest: Some studies have found that funded studies report better [ 56 , 57 ], while others do not [ 53 , 58 ]. The presence of funding would indicate the availability of resources deployed to ensure optimal design, conduct, analysis and reporting. However, the source of funding may introduce conflicts of interest and warrant assessment. For example, Kaiser et al. investigated the effect of industry funding on obesity or nutrition randomized trials and found that reporting quality was similar [ 59 ]. Thomas et al. looked at reporting quality of long-term weight loss trials and found that industry funded studies were better [ 60 ]. Kan et al. examined the association between industry funding and “positive trials” (trials reporting a significant intervention effect) and found that industry funding was highly predictive of a positive trial [ 61 ]. This finding is similar to that of a recent Cochrane Methodology Review by Hansen et al. [ 62 ]
- Journal characteristics: Certain journals’ characteristics may influence the study design, analysis or reporting. Characteristics such as journal endorsement of guidelines [ 63 , 64 ], and Journal Impact Factor (JIF) have been shown to be associated with reporting [ 63 , 65 – 67 ].
- Study size (sample size/number of sites): Some studies have shown that reporting is better in larger studies [ 53 , 56 , 58 ].
- Year of publication: It is reasonable to assume that design, conduct, analysis and reporting of research will change over time. Many studies have demonstrated improvements in reporting over time or after the publication of reporting guidelines [ 68 , 69 ].
- Type of intervention: In a methodological study of reporting quality of weight loss intervention studies, Thabane et al. found that trials of pharmacologic interventions were reported better than trials of non-pharmacologic interventions [ 70 ].
- Interactions between variables: Complex interactions between the previously listed variables are possible. High income countries with more resources may be more likely to conduct larger studies and incorporate a variety of experts. Authors in certain countries may prefer certain journals, and journal endorsement of guidelines and editorial policies may change over time.
Q: Should I focus only on high impact journals?
A: Investigators may choose to investigate only high impact journals because they are more likely to influence practice and policy, or because they assume that methodological standards would be higher. However, the JIF may severely limit the scope of articles included and may skew the sample towards articles with positive findings. The generalizability and applicability of findings from a handful of journals must be examined carefully, especially since the JIF varies over time. Even among journals that are all “high impact”, variations exist in methodological standards.
Q: Can I conduct a methodological study of qualitative research?
A: Yes. Even though a lot of methodological research has been conducted in the quantitative research field, methodological studies of qualitative studies are feasible. Certain databases that catalogue qualitative research including the Cumulative Index to Nursing & Allied Health Literature (CINAHL) have defined subject headings that are specific to methodological research (e.g. “research methodology”). Alternatively, one could also conduct a qualitative methodological review; that is, use qualitative approaches to synthesize methodological issues in qualitative studies.
Q: What reporting guidelines should I use for my methodological study?
A: There is no guideline that covers the entire scope of methodological studies. One adaptation of the PRISMA guidelines has been published, which works well for studies that aim to use the entire target population of research reports [ 71 ]. However, it is not widely used (40 citations in 2 years as of 09 December 2019), and methodological studies that are designed as cross-sectional or before-after studies require a more fit-for purpose guideline. A more encompassing reporting guideline for a broad range of methodological studies is currently under development [ 72 ]. However, in the absence of formal guidance, the requirements for scientific reporting should be respected, and authors of methodological studies should focus on transparency and reproducibility.
Q: What are the potential threats to validity and how can I avoid them?
A: Methodological studies may be compromised by a lack of internal or external validity. The main threats to internal validity in methodological studies are selection and confounding bias. Investigators must ensure that the methods used to select articles does not make them differ systematically from the set of articles to which they would like to make inferences. For example, attempting to make extrapolations to all journals after analyzing high-impact journals would be misleading.
Many factors (confounders) may distort the association between the exposure and outcome if the included research reports differ with respect to these factors [ 73 ]. For example, when examining the association between source of funding and completeness of reporting, it may be necessary to account for journals that endorse the guidelines. Confounding bias can be addressed by restriction, matching and statistical adjustment [ 73 ]. Restriction appears to be the method of choice for many investigators who choose to include only high impact journals or articles in a specific field. For example, Knol et al. examined the reporting of p -values in baseline tables of high impact journals [ 26 ]. Matching is also sometimes used. In the methodological study of non-randomized interventional studies of elective ventral hernia repair, Parker et al. matched prospective studies with retrospective studies and compared reporting standards [ 74 ]. Some other methodological studies use statistical adjustments. For example, Zhang et al. used regression techniques to determine the factors associated with missing participant data in trials [ 16 ].
With regard to external validity, researchers interested in conducting methodological studies must consider how generalizable or applicable their findings are. This should tie in closely with the research question and should be explicit. For example. Findings from methodological studies on trials published in high impact cardiology journals cannot be assumed to be applicable to trials in other fields. However, investigators must ensure that their sample truly represents the target sample either by a) conducting a comprehensive and exhaustive search, or b) using an appropriate and justified, randomly selected sample of research reports.
Even applicability to high impact journals may vary based on the investigators’ definition, and over time. For example, for high impact journals in the field of general medicine, Bouwmeester et al. included the Annals of Internal Medicine (AIM), BMJ, the Journal of the American Medical Association (JAMA), Lancet, the New England Journal of Medicine (NEJM), and PLoS Medicine ( n = 6) [ 75 ]. In contrast, the high impact journals selected in the methodological study by Schiller et al. were BMJ, JAMA, Lancet, and NEJM ( n = 4) [ 76 ]. Another methodological study by Kosa et al. included AIM, BMJ, JAMA, Lancet and NEJM ( n = 5). In the methodological study by Thabut et al., journals with a JIF greater than 5 were considered to be high impact. Riado Minguez et al. used first quartile journals in the Journal Citation Reports (JCR) for a specific year to determine “high impact” [ 77 ]. Ultimately, the definition of high impact will be based on the number of journals the investigators are willing to include, the year of impact and the JIF cut-off [ 78 ]. We acknowledge that the term “generalizability” may apply differently for methodological studies, especially when in many instances it is possible to include the entire target population in the sample studied.
Finally, methodological studies are not exempt from information bias which may stem from discrepancies in the included research reports [ 79 ], errors in data extraction, or inappropriate interpretation of the information extracted. Likewise, publication bias may also be a concern in methodological studies, but such concepts have not yet been explored.
A proposed framework
In order to inform discussions about methodological studies, the development of guidance for what should be reported, we have outlined some key features of methodological studies that can be used to classify them. For each of the categories outlined below, we provide an example. In our experience, the choice of approach to completing a methodological study can be informed by asking the following four questions:
- What is the aim?
A methodological study may be focused on exploring sources of bias in primary or secondary studies (meta-bias), or how bias is analyzed. We have taken care to distinguish bias (i.e. systematic deviations from the truth irrespective of the source) from reporting quality or completeness (i.e. not adhering to a specific reporting guideline or norm). An example of where this distinction would be important is in the case of a randomized trial with no blinding. This study (depending on the nature of the intervention) would be at risk of performance bias. However, if the authors report that their study was not blinded, they would have reported adequately. In fact, some methodological studies attempt to capture both “quality of conduct” and “quality of reporting”, such as Richie et al., who reported on the risk of bias in randomized trials of pharmacy practice interventions [ 80 ]. Babic et al. investigated how risk of bias was used to inform sensitivity analyses in Cochrane reviews [ 81 ]. Further, biases related to choice of outcomes can also be explored. For example, Tan et al investigated differences in treatment effect size based on the outcome reported [ 82 ].
Methodological studies may report quality of reporting against a reporting checklist (i.e. adherence to guidelines) or against expected norms. For example, Croituro et al. report on the quality of reporting in systematic reviews published in dermatology journals based on their adherence to the PRISMA statement [ 83 ], and Khan et al. described the quality of reporting of harms in randomized controlled trials published in high impact cardiovascular journals based on the CONSORT extension for harms [ 84 ]. Other methodological studies investigate reporting of certain features of interest that may not be part of formally published checklists or guidelines. For example, Mbuagbaw et al. described how often the implications for research are elaborated using the Evidence, Participants, Intervention, Comparison, Outcome, Timeframe (EPICOT) format [ 30 ].
Sometimes investigators may be interested in how consistent reports of the same research are, as it is expected that there should be consistency between: conference abstracts and published manuscripts; manuscript abstracts and manuscript main text; and trial registration and published manuscript. For example, Rosmarakis et al. investigated consistency between conference abstracts and full text manuscripts [ 85 ].
In addition to identifying issues with reporting in primary and secondary studies, authors of methodological studies may be interested in determining the factors that are associated with certain reporting practices. Many methodological studies incorporate this, albeit as a secondary outcome. For example, Farrokhyar et al. investigated the factors associated with reporting quality in randomized trials of coronary artery bypass grafting surgery [ 53 ].
Methodological studies may also be used to describe methods or compare methods, and the factors associated with methods. Muller et al. described the methods used for systematic reviews and meta-analyses of observational studies [ 86 ].
Some methodological studies synthesize results from other methodological studies. For example, Li et al. conducted a scoping review of methodological reviews that investigated consistency between full text and abstracts in primary biomedical research [ 87 ].
Some methodological studies may investigate the use of names and terms in health research. For example, Martinic et al. investigated the definitions of systematic reviews used in overviews of systematic reviews (OSRs), meta-epidemiological studies and epidemiology textbooks [ 88 ].
In addition to the previously mentioned experimental methodological studies, there may exist other types of methodological studies not captured here.
- 2. What is the design?
Most methodological studies are purely descriptive and report their findings as counts (percent) and means (standard deviation) or medians (interquartile range). For example, Mbuagbaw et al. described the reporting of research recommendations in Cochrane HIV systematic reviews [ 30 ]. Gohari et al. described the quality of reporting of randomized trials in diabetes in Iran [ 12 ].
Some methodological studies are analytical wherein “analytical studies identify and quantify associations, test hypotheses, identify causes and determine whether an association exists between variables, such as between an exposure and a disease.” [ 89 ] In the case of methodological studies all these investigations are possible. For example, Kosa et al. investigated the association between agreement in primary outcome from trial registry to published manuscript and study covariates. They found that larger and more recent studies were more likely to have agreement [ 15 ]. Tricco et al. compared the conclusion statements from Cochrane and non-Cochrane systematic reviews with a meta-analysis of the primary outcome and found that non-Cochrane reviews were more likely to report positive findings. These results are a test of the null hypothesis that the proportions of Cochrane and non-Cochrane reviews that report positive results are equal [ 90 ].
- 3. What is the sampling strategy?
Methodological reviews with narrow research questions may be able to include the entire target population. For example, in the methodological study of Cochrane HIV systematic reviews, Mbuagbaw et al. included all of the available studies ( n = 103) [ 30 ].
Many methodological studies use random samples of the target population [ 33 , 91 , 92 ]. Alternatively, purposeful sampling may be used, limiting the sample to a subset of research-related reports published within a certain time period, or in journals with a certain ranking or on a topic. Systematic sampling can also be used when random sampling may be challenging to implement.
- 4. What is the unit of analysis?
Many methodological studies use a research report (e.g. full manuscript of study, abstract portion of the study) as the unit of analysis, and inferences can be made at the study-level. However, both published and unpublished research-related reports can be studied. These may include articles, conference abstracts, registry entries etc.
Some methodological studies report on items which may occur more than once per article. For example, Paquette et al. report on subgroup analyses in Cochrane reviews of atrial fibrillation in which 17 systematic reviews planned 56 subgroup analyses [ 93 ].
This framework is outlined in Fig. 2 .

A proposed framework for methodological studies
Conclusions
Methodological studies have examined different aspects of reporting such as quality, completeness, consistency and adherence to reporting guidelines. As such, many of the methodological study examples cited in this tutorial are related to reporting. However, as an evolving field, the scope of research questions that can be addressed by methodological studies is expected to increase.
In this paper we have outlined the scope and purpose of methodological studies, along with examples of instances in which various approaches have been used. In the absence of formal guidance on the design, conduct, analysis and reporting of methodological studies, we have provided some advice to help make methodological studies consistent. This advice is grounded in good contemporary scientific practice. Generally, the research question should tie in with the sampling approach and planned analysis. We have also highlighted the variables that may inform findings from methodological studies. Lastly, we have provided suggestions for ways in which authors can categorize their methodological studies to inform their design and analysis.
Acknowledgements
Abbreviations, authors’ contributions.
LM conceived the idea and drafted the outline and paper. DOL and LT commented on the idea and draft outline. LM, LP and DOL performed literature searches and data extraction. All authors (LM, DOL, LT, LP, DBA) reviewed several draft versions of the manuscript and approved the final manuscript.
This work did not receive any dedicated funding.
Availability of data and materials
Ethics approval and consent to participate.
Not applicable.
Consent for publication
Competing interests.
DOL, DBA, LM, LP and LT are involved in the development of a reporting guideline for methodological studies.
Publisher’s Note
Springer Nature remains neutral with regard to jurisdictional claims in published maps and institutional affiliations.
- Open access
- Published: 07 September 2020
A tutorial on methodological studies: the what, when, how and why
- Lawrence Mbuagbaw ORCID: orcid.org/0000-0001-5855-5461 1 , 2 , 3 ,
- Daeria O. Lawson 1 ,
- Livia Puljak 4 ,
- David B. Allison 5 &
- Lehana Thabane 1 , 2 , 6 , 7 , 8
BMC Medical Research Methodology volume 20 , Article number: 226 ( 2020 ) Cite this article
37k Accesses
52 Citations
58 Altmetric
Metrics details
Methodological studies – studies that evaluate the design, analysis or reporting of other research-related reports – play an important role in health research. They help to highlight issues in the conduct of research with the aim of improving health research methodology, and ultimately reducing research waste.
We provide an overview of some of the key aspects of methodological studies such as what they are, and when, how and why they are done. We adopt a “frequently asked questions” format to facilitate reading this paper and provide multiple examples to help guide researchers interested in conducting methodological studies. Some of the topics addressed include: is it necessary to publish a study protocol? How to select relevant research reports and databases for a methodological study? What approaches to data extraction and statistical analysis should be considered when conducting a methodological study? What are potential threats to validity and is there a way to appraise the quality of methodological studies?
Appropriate reflection and application of basic principles of epidemiology and biostatistics are required in the design and analysis of methodological studies. This paper provides an introduction for further discussion about the conduct of methodological studies.
Peer Review reports
The field of meta-research (or research-on-research) has proliferated in recent years in response to issues with research quality and conduct [ 1 , 2 , 3 ]. As the name suggests, this field targets issues with research design, conduct, analysis and reporting. Various types of research reports are often examined as the unit of analysis in these studies (e.g. abstracts, full manuscripts, trial registry entries). Like many other novel fields of research, meta-research has seen a proliferation of use before the development of reporting guidance. For example, this was the case with randomized trials for which risk of bias tools and reporting guidelines were only developed much later – after many trials had been published and noted to have limitations [ 4 , 5 ]; and for systematic reviews as well [ 6 , 7 , 8 ]. However, in the absence of formal guidance, studies that report on research differ substantially in how they are named, conducted and reported [ 9 , 10 ]. This creates challenges in identifying, summarizing and comparing them. In this tutorial paper, we will use the term methodological study to refer to any study that reports on the design, conduct, analysis or reporting of primary or secondary research-related reports (such as trial registry entries and conference abstracts).
In the past 10 years, there has been an increase in the use of terms related to methodological studies (based on records retrieved with a keyword search [in the title and abstract] for “methodological review” and “meta-epidemiological study” in PubMed up to December 2019), suggesting that these studies may be appearing more frequently in the literature. See Fig. 1 .

Trends in the number studies that mention “methodological review” or “meta-
epidemiological study” in PubMed.
The methods used in many methodological studies have been borrowed from systematic and scoping reviews. This practice has influenced the direction of the field, with many methodological studies including searches of electronic databases, screening of records, duplicate data extraction and assessments of risk of bias in the included studies. However, the research questions posed in methodological studies do not always require the approaches listed above, and guidance is needed on when and how to apply these methods to a methodological study. Even though methodological studies can be conducted on qualitative or mixed methods research, this paper focuses on and draws examples exclusively from quantitative research.
The objectives of this paper are to provide some insights on how to conduct methodological studies so that there is greater consistency between the research questions posed, and the design, analysis and reporting of findings. We provide multiple examples to illustrate concepts and a proposed framework for categorizing methodological studies in quantitative research.
What is a methodological study?
Any study that describes or analyzes methods (design, conduct, analysis or reporting) in published (or unpublished) literature is a methodological study. Consequently, the scope of methodological studies is quite extensive and includes, but is not limited to, topics as diverse as: research question formulation [ 11 ]; adherence to reporting guidelines [ 12 , 13 , 14 ] and consistency in reporting [ 15 ]; approaches to study analysis [ 16 ]; investigating the credibility of analyses [ 17 ]; and studies that synthesize these methodological studies [ 18 ]. While the nomenclature of methodological studies is not uniform, the intents and purposes of these studies remain fairly consistent – to describe or analyze methods in primary or secondary studies. As such, methodological studies may also be classified as a subtype of observational studies.
Parallel to this are experimental studies that compare different methods. Even though they play an important role in informing optimal research methods, experimental methodological studies are beyond the scope of this paper. Examples of such studies include the randomized trials by Buscemi et al., comparing single data extraction to double data extraction [ 19 ], and Carrasco-Labra et al., comparing approaches to presenting findings in Grading of Recommendations, Assessment, Development and Evaluations (GRADE) summary of findings tables [ 20 ]. In these studies, the unit of analysis is the person or groups of individuals applying the methods. We also direct readers to the Studies Within a Trial (SWAT) and Studies Within a Review (SWAR) programme operated through the Hub for Trials Methodology Research, for further reading as a potential useful resource for these types of experimental studies [ 21 ]. Lastly, this paper is not meant to inform the conduct of research using computational simulation and mathematical modeling for which some guidance already exists [ 22 ], or studies on the development of methods using consensus-based approaches.
When should we conduct a methodological study?
Methodological studies occupy a unique niche in health research that allows them to inform methodological advances. Methodological studies should also be conducted as pre-cursors to reporting guideline development, as they provide an opportunity to understand current practices, and help to identify the need for guidance and gaps in methodological or reporting quality. For example, the development of the popular Preferred Reporting Items of Systematic reviews and Meta-Analyses (PRISMA) guidelines were preceded by methodological studies identifying poor reporting practices [ 23 , 24 ]. In these instances, after the reporting guidelines are published, methodological studies can also be used to monitor uptake of the guidelines.
These studies can also be conducted to inform the state of the art for design, analysis and reporting practices across different types of health research fields, with the aim of improving research practices, and preventing or reducing research waste. For example, Samaan et al. conducted a scoping review of adherence to different reporting guidelines in health care literature [ 18 ]. Methodological studies can also be used to determine the factors associated with reporting practices. For example, Abbade et al. investigated journal characteristics associated with the use of the Participants, Intervention, Comparison, Outcome, Timeframe (PICOT) format in framing research questions in trials of venous ulcer disease [ 11 ].
How often are methodological studies conducted?
There is no clear answer to this question. Based on a search of PubMed, the use of related terms (“methodological review” and “meta-epidemiological study”) – and therefore, the number of methodological studies – is on the rise. However, many other terms are used to describe methodological studies. There are also many studies that explore design, conduct, analysis or reporting of research reports, but that do not use any specific terms to describe or label their study design in terms of “methodology”. This diversity in nomenclature makes a census of methodological studies elusive. Appropriate terminology and key words for methodological studies are needed to facilitate improved accessibility for end-users.
Why do we conduct methodological studies?
Methodological studies provide information on the design, conduct, analysis or reporting of primary and secondary research and can be used to appraise quality, quantity, completeness, accuracy and consistency of health research. These issues can be explored in specific fields, journals, databases, geographical regions and time periods. For example, Areia et al. explored the quality of reporting of endoscopic diagnostic studies in gastroenterology [ 25 ]; Knol et al. investigated the reporting of p -values in baseline tables in randomized trial published in high impact journals [ 26 ]; Chen et al. describe adherence to the Consolidated Standards of Reporting Trials (CONSORT) statement in Chinese Journals [ 27 ]; and Hopewell et al. describe the effect of editors’ implementation of CONSORT guidelines on reporting of abstracts over time [ 28 ]. Methodological studies provide useful information to researchers, clinicians, editors, publishers and users of health literature. As a result, these studies have been at the cornerstone of important methodological developments in the past two decades and have informed the development of many health research guidelines including the highly cited CONSORT statement [ 5 ].
Where can we find methodological studies?
Methodological studies can be found in most common biomedical bibliographic databases (e.g. Embase, MEDLINE, PubMed, Web of Science). However, the biggest caveat is that methodological studies are hard to identify in the literature due to the wide variety of names used and the lack of comprehensive databases dedicated to them. A handful can be found in the Cochrane Library as “Cochrane Methodology Reviews”, but these studies only cover methodological issues related to systematic reviews. Previous attempts to catalogue all empirical studies of methods used in reviews were abandoned 10 years ago [ 29 ]. In other databases, a variety of search terms may be applied with different levels of sensitivity and specificity.
Some frequently asked questions about methodological studies
In this section, we have outlined responses to questions that might help inform the conduct of methodological studies.
Q: How should I select research reports for my methodological study?
A: Selection of research reports for a methodological study depends on the research question and eligibility criteria. Once a clear research question is set and the nature of literature one desires to review is known, one can then begin the selection process. Selection may begin with a broad search, especially if the eligibility criteria are not apparent. For example, a methodological study of Cochrane Reviews of HIV would not require a complex search as all eligible studies can easily be retrieved from the Cochrane Library after checking a few boxes [ 30 ]. On the other hand, a methodological study of subgroup analyses in trials of gastrointestinal oncology would require a search to find such trials, and further screening to identify trials that conducted a subgroup analysis [ 31 ].
The strategies used for identifying participants in observational studies can apply here. One may use a systematic search to identify all eligible studies. If the number of eligible studies is unmanageable, a random sample of articles can be expected to provide comparable results if it is sufficiently large [ 32 ]. For example, Wilson et al. used a random sample of trials from the Cochrane Stroke Group’s Trial Register to investigate completeness of reporting [ 33 ]. It is possible that a simple random sample would lead to underrepresentation of units (i.e. research reports) that are smaller in number. This is relevant if the investigators wish to compare multiple groups but have too few units in one group. In this case a stratified sample would help to create equal groups. For example, in a methodological study comparing Cochrane and non-Cochrane reviews, Kahale et al. drew random samples from both groups [ 34 ]. Alternatively, systematic or purposeful sampling strategies can be used and we encourage researchers to justify their selected approaches based on the study objective.
Q: How many databases should I search?
A: The number of databases one should search would depend on the approach to sampling, which can include targeting the entire “population” of interest or a sample of that population. If you are interested in including the entire target population for your research question, or drawing a random or systematic sample from it, then a comprehensive and exhaustive search for relevant articles is required. In this case, we recommend using systematic approaches for searching electronic databases (i.e. at least 2 databases with a replicable and time stamped search strategy). The results of your search will constitute a sampling frame from which eligible studies can be drawn.
Alternatively, if your approach to sampling is purposeful, then we recommend targeting the database(s) or data sources (e.g. journals, registries) that include the information you need. For example, if you are conducting a methodological study of high impact journals in plastic surgery and they are all indexed in PubMed, you likely do not need to search any other databases. You may also have a comprehensive list of all journals of interest and can approach your search using the journal names in your database search (or by accessing the journal archives directly from the journal’s website). Even though one could also search journals’ web pages directly, using a database such as PubMed has multiple advantages, such as the use of filters, so the search can be narrowed down to a certain period, or study types of interest. Furthermore, individual journals’ web sites may have different search functionalities, which do not necessarily yield a consistent output.
Q: Should I publish a protocol for my methodological study?
A: A protocol is a description of intended research methods. Currently, only protocols for clinical trials require registration [ 35 ]. Protocols for systematic reviews are encouraged but no formal recommendation exists. The scientific community welcomes the publication of protocols because they help protect against selective outcome reporting, the use of post hoc methodologies to embellish results, and to help avoid duplication of efforts [ 36 ]. While the latter two risks exist in methodological research, the negative consequences may be substantially less than for clinical outcomes. In a sample of 31 methodological studies, 7 (22.6%) referenced a published protocol [ 9 ]. In the Cochrane Library, there are 15 protocols for methodological reviews (21 July 2020). This suggests that publishing protocols for methodological studies is not uncommon.
Authors can consider publishing their study protocol in a scholarly journal as a manuscript. Advantages of such publication include obtaining peer-review feedback about the planned study, and easy retrieval by searching databases such as PubMed. The disadvantages in trying to publish protocols includes delays associated with manuscript handling and peer review, as well as costs, as few journals publish study protocols, and those journals mostly charge article-processing fees [ 37 ]. Authors who would like to make their protocol publicly available without publishing it in scholarly journals, could deposit their study protocols in publicly available repositories, such as the Open Science Framework ( https://osf.io/ ).
Q: How to appraise the quality of a methodological study?
A: To date, there is no published tool for appraising the risk of bias in a methodological study, but in principle, a methodological study could be considered as a type of observational study. Therefore, during conduct or appraisal, care should be taken to avoid the biases common in observational studies [ 38 ]. These biases include selection bias, comparability of groups, and ascertainment of exposure or outcome. In other words, to generate a representative sample, a comprehensive reproducible search may be necessary to build a sampling frame. Additionally, random sampling may be necessary to ensure that all the included research reports have the same probability of being selected, and the screening and selection processes should be transparent and reproducible. To ensure that the groups compared are similar in all characteristics, matching, random sampling or stratified sampling can be used. Statistical adjustments for between-group differences can also be applied at the analysis stage. Finally, duplicate data extraction can reduce errors in assessment of exposures or outcomes.
Q: Should I justify a sample size?
A: In all instances where one is not using the target population (i.e. the group to which inferences from the research report are directed) [ 39 ], a sample size justification is good practice. The sample size justification may take the form of a description of what is expected to be achieved with the number of articles selected, or a formal sample size estimation that outlines the number of articles required to answer the research question with a certain precision and power. Sample size justifications in methodological studies are reasonable in the following instances:
Comparing two groups
Determining a proportion, mean or another quantifier
Determining factors associated with an outcome using regression-based analyses
For example, El Dib et al. computed a sample size requirement for a methodological study of diagnostic strategies in randomized trials, based on a confidence interval approach [ 40 ].
Q: What should I call my study?
A: Other terms which have been used to describe/label methodological studies include “ methodological review ”, “methodological survey” , “meta-epidemiological study” , “systematic review” , “systematic survey”, “meta-research”, “research-on-research” and many others. We recommend that the study nomenclature be clear, unambiguous, informative and allow for appropriate indexing. Methodological study nomenclature that should be avoided includes “ systematic review” – as this will likely be confused with a systematic review of a clinical question. “ Systematic survey” may also lead to confusion about whether the survey was systematic (i.e. using a preplanned methodology) or a survey using “ systematic” sampling (i.e. a sampling approach using specific intervals to determine who is selected) [ 32 ]. Any of the above meanings of the words “ systematic” may be true for methodological studies and could be potentially misleading. “ Meta-epidemiological study” is ideal for indexing, but not very informative as it describes an entire field. The term “ review ” may point towards an appraisal or “review” of the design, conduct, analysis or reporting (or methodological components) of the targeted research reports, yet it has also been used to describe narrative reviews [ 41 , 42 ]. The term “ survey ” is also in line with the approaches used in many methodological studies [ 9 ], and would be indicative of the sampling procedures of this study design. However, in the absence of guidelines on nomenclature, the term “ methodological study ” is broad enough to capture most of the scenarios of such studies.
Q: Should I account for clustering in my methodological study?
A: Data from methodological studies are often clustered. For example, articles coming from a specific source may have different reporting standards (e.g. the Cochrane Library). Articles within the same journal may be similar due to editorial practices and policies, reporting requirements and endorsement of guidelines. There is emerging evidence that these are real concerns that should be accounted for in analyses [ 43 ]. Some cluster variables are described in the section: “ What variables are relevant to methodological studies?”
A variety of modelling approaches can be used to account for correlated data, including the use of marginal, fixed or mixed effects regression models with appropriate computation of standard errors [ 44 ]. For example, Kosa et al. used generalized estimation equations to account for correlation of articles within journals [ 15 ]. Not accounting for clustering could lead to incorrect p -values, unduly narrow confidence intervals, and biased estimates [ 45 ].
Q: Should I extract data in duplicate?
A: Yes. Duplicate data extraction takes more time but results in less errors [ 19 ]. Data extraction errors in turn affect the effect estimate [ 46 ], and therefore should be mitigated. Duplicate data extraction should be considered in the absence of other approaches to minimize extraction errors. However, much like systematic reviews, this area will likely see rapid new advances with machine learning and natural language processing technologies to support researchers with screening and data extraction [ 47 , 48 ]. However, experience plays an important role in the quality of extracted data and inexperienced extractors should be paired with experienced extractors [ 46 , 49 ].
Q: Should I assess the risk of bias of research reports included in my methodological study?
A : Risk of bias is most useful in determining the certainty that can be placed in the effect measure from a study. In methodological studies, risk of bias may not serve the purpose of determining the trustworthiness of results, as effect measures are often not the primary goal of methodological studies. Determining risk of bias in methodological studies is likely a practice borrowed from systematic review methodology, but whose intrinsic value is not obvious in methodological studies. When it is part of the research question, investigators often focus on one aspect of risk of bias. For example, Speich investigated how blinding was reported in surgical trials [ 50 ], and Abraha et al., investigated the application of intention-to-treat analyses in systematic reviews and trials [ 51 ].
Q: What variables are relevant to methodological studies?
A: There is empirical evidence that certain variables may inform the findings in a methodological study. We outline some of these and provide a brief overview below:
Country: Countries and regions differ in their research cultures, and the resources available to conduct research. Therefore, it is reasonable to believe that there may be differences in methodological features across countries. Methodological studies have reported loco-regional differences in reporting quality [ 52 , 53 ]. This may also be related to challenges non-English speakers face in publishing papers in English.
Authors’ expertise: The inclusion of authors with expertise in research methodology, biostatistics, and scientific writing is likely to influence the end-product. Oltean et al. found that among randomized trials in orthopaedic surgery, the use of analyses that accounted for clustering was more likely when specialists (e.g. statistician, epidemiologist or clinical trials methodologist) were included on the study team [ 54 ]. Fleming et al. found that including methodologists in the review team was associated with appropriate use of reporting guidelines [ 55 ].
Source of funding and conflicts of interest: Some studies have found that funded studies report better [ 56 , 57 ], while others do not [ 53 , 58 ]. The presence of funding would indicate the availability of resources deployed to ensure optimal design, conduct, analysis and reporting. However, the source of funding may introduce conflicts of interest and warrant assessment. For example, Kaiser et al. investigated the effect of industry funding on obesity or nutrition randomized trials and found that reporting quality was similar [ 59 ]. Thomas et al. looked at reporting quality of long-term weight loss trials and found that industry funded studies were better [ 60 ]. Kan et al. examined the association between industry funding and “positive trials” (trials reporting a significant intervention effect) and found that industry funding was highly predictive of a positive trial [ 61 ]. This finding is similar to that of a recent Cochrane Methodology Review by Hansen et al. [ 62 ]
Journal characteristics: Certain journals’ characteristics may influence the study design, analysis or reporting. Characteristics such as journal endorsement of guidelines [ 63 , 64 ], and Journal Impact Factor (JIF) have been shown to be associated with reporting [ 63 , 65 , 66 , 67 ].
Study size (sample size/number of sites): Some studies have shown that reporting is better in larger studies [ 53 , 56 , 58 ].
Year of publication: It is reasonable to assume that design, conduct, analysis and reporting of research will change over time. Many studies have demonstrated improvements in reporting over time or after the publication of reporting guidelines [ 68 , 69 ].
Type of intervention: In a methodological study of reporting quality of weight loss intervention studies, Thabane et al. found that trials of pharmacologic interventions were reported better than trials of non-pharmacologic interventions [ 70 ].
Interactions between variables: Complex interactions between the previously listed variables are possible. High income countries with more resources may be more likely to conduct larger studies and incorporate a variety of experts. Authors in certain countries may prefer certain journals, and journal endorsement of guidelines and editorial policies may change over time.
Q: Should I focus only on high impact journals?
A: Investigators may choose to investigate only high impact journals because they are more likely to influence practice and policy, or because they assume that methodological standards would be higher. However, the JIF may severely limit the scope of articles included and may skew the sample towards articles with positive findings. The generalizability and applicability of findings from a handful of journals must be examined carefully, especially since the JIF varies over time. Even among journals that are all “high impact”, variations exist in methodological standards.
Q: Can I conduct a methodological study of qualitative research?
A: Yes. Even though a lot of methodological research has been conducted in the quantitative research field, methodological studies of qualitative studies are feasible. Certain databases that catalogue qualitative research including the Cumulative Index to Nursing & Allied Health Literature (CINAHL) have defined subject headings that are specific to methodological research (e.g. “research methodology”). Alternatively, one could also conduct a qualitative methodological review; that is, use qualitative approaches to synthesize methodological issues in qualitative studies.
Q: What reporting guidelines should I use for my methodological study?
A: There is no guideline that covers the entire scope of methodological studies. One adaptation of the PRISMA guidelines has been published, which works well for studies that aim to use the entire target population of research reports [ 71 ]. However, it is not widely used (40 citations in 2 years as of 09 December 2019), and methodological studies that are designed as cross-sectional or before-after studies require a more fit-for purpose guideline. A more encompassing reporting guideline for a broad range of methodological studies is currently under development [ 72 ]. However, in the absence of formal guidance, the requirements for scientific reporting should be respected, and authors of methodological studies should focus on transparency and reproducibility.
Q: What are the potential threats to validity and how can I avoid them?
A: Methodological studies may be compromised by a lack of internal or external validity. The main threats to internal validity in methodological studies are selection and confounding bias. Investigators must ensure that the methods used to select articles does not make them differ systematically from the set of articles to which they would like to make inferences. For example, attempting to make extrapolations to all journals after analyzing high-impact journals would be misleading.
Many factors (confounders) may distort the association between the exposure and outcome if the included research reports differ with respect to these factors [ 73 ]. For example, when examining the association between source of funding and completeness of reporting, it may be necessary to account for journals that endorse the guidelines. Confounding bias can be addressed by restriction, matching and statistical adjustment [ 73 ]. Restriction appears to be the method of choice for many investigators who choose to include only high impact journals or articles in a specific field. For example, Knol et al. examined the reporting of p -values in baseline tables of high impact journals [ 26 ]. Matching is also sometimes used. In the methodological study of non-randomized interventional studies of elective ventral hernia repair, Parker et al. matched prospective studies with retrospective studies and compared reporting standards [ 74 ]. Some other methodological studies use statistical adjustments. For example, Zhang et al. used regression techniques to determine the factors associated with missing participant data in trials [ 16 ].
With regard to external validity, researchers interested in conducting methodological studies must consider how generalizable or applicable their findings are. This should tie in closely with the research question and should be explicit. For example. Findings from methodological studies on trials published in high impact cardiology journals cannot be assumed to be applicable to trials in other fields. However, investigators must ensure that their sample truly represents the target sample either by a) conducting a comprehensive and exhaustive search, or b) using an appropriate and justified, randomly selected sample of research reports.
Even applicability to high impact journals may vary based on the investigators’ definition, and over time. For example, for high impact journals in the field of general medicine, Bouwmeester et al. included the Annals of Internal Medicine (AIM), BMJ, the Journal of the American Medical Association (JAMA), Lancet, the New England Journal of Medicine (NEJM), and PLoS Medicine ( n = 6) [ 75 ]. In contrast, the high impact journals selected in the methodological study by Schiller et al. were BMJ, JAMA, Lancet, and NEJM ( n = 4) [ 76 ]. Another methodological study by Kosa et al. included AIM, BMJ, JAMA, Lancet and NEJM ( n = 5). In the methodological study by Thabut et al., journals with a JIF greater than 5 were considered to be high impact. Riado Minguez et al. used first quartile journals in the Journal Citation Reports (JCR) for a specific year to determine “high impact” [ 77 ]. Ultimately, the definition of high impact will be based on the number of journals the investigators are willing to include, the year of impact and the JIF cut-off [ 78 ]. We acknowledge that the term “generalizability” may apply differently for methodological studies, especially when in many instances it is possible to include the entire target population in the sample studied.
Finally, methodological studies are not exempt from information bias which may stem from discrepancies in the included research reports [ 79 ], errors in data extraction, or inappropriate interpretation of the information extracted. Likewise, publication bias may also be a concern in methodological studies, but such concepts have not yet been explored.
A proposed framework
In order to inform discussions about methodological studies, the development of guidance for what should be reported, we have outlined some key features of methodological studies that can be used to classify them. For each of the categories outlined below, we provide an example. In our experience, the choice of approach to completing a methodological study can be informed by asking the following four questions:
What is the aim?
Methodological studies that investigate bias
A methodological study may be focused on exploring sources of bias in primary or secondary studies (meta-bias), or how bias is analyzed. We have taken care to distinguish bias (i.e. systematic deviations from the truth irrespective of the source) from reporting quality or completeness (i.e. not adhering to a specific reporting guideline or norm). An example of where this distinction would be important is in the case of a randomized trial with no blinding. This study (depending on the nature of the intervention) would be at risk of performance bias. However, if the authors report that their study was not blinded, they would have reported adequately. In fact, some methodological studies attempt to capture both “quality of conduct” and “quality of reporting”, such as Richie et al., who reported on the risk of bias in randomized trials of pharmacy practice interventions [ 80 ]. Babic et al. investigated how risk of bias was used to inform sensitivity analyses in Cochrane reviews [ 81 ]. Further, biases related to choice of outcomes can also be explored. For example, Tan et al investigated differences in treatment effect size based on the outcome reported [ 82 ].
Methodological studies that investigate quality (or completeness) of reporting
Methodological studies may report quality of reporting against a reporting checklist (i.e. adherence to guidelines) or against expected norms. For example, Croituro et al. report on the quality of reporting in systematic reviews published in dermatology journals based on their adherence to the PRISMA statement [ 83 ], and Khan et al. described the quality of reporting of harms in randomized controlled trials published in high impact cardiovascular journals based on the CONSORT extension for harms [ 84 ]. Other methodological studies investigate reporting of certain features of interest that may not be part of formally published checklists or guidelines. For example, Mbuagbaw et al. described how often the implications for research are elaborated using the Evidence, Participants, Intervention, Comparison, Outcome, Timeframe (EPICOT) format [ 30 ].
Methodological studies that investigate the consistency of reporting
Sometimes investigators may be interested in how consistent reports of the same research are, as it is expected that there should be consistency between: conference abstracts and published manuscripts; manuscript abstracts and manuscript main text; and trial registration and published manuscript. For example, Rosmarakis et al. investigated consistency between conference abstracts and full text manuscripts [ 85 ].
Methodological studies that investigate factors associated with reporting
In addition to identifying issues with reporting in primary and secondary studies, authors of methodological studies may be interested in determining the factors that are associated with certain reporting practices. Many methodological studies incorporate this, albeit as a secondary outcome. For example, Farrokhyar et al. investigated the factors associated with reporting quality in randomized trials of coronary artery bypass grafting surgery [ 53 ].
Methodological studies that investigate methods
Methodological studies may also be used to describe methods or compare methods, and the factors associated with methods. Muller et al. described the methods used for systematic reviews and meta-analyses of observational studies [ 86 ].
Methodological studies that summarize other methodological studies
Some methodological studies synthesize results from other methodological studies. For example, Li et al. conducted a scoping review of methodological reviews that investigated consistency between full text and abstracts in primary biomedical research [ 87 ].
Methodological studies that investigate nomenclature and terminology
Some methodological studies may investigate the use of names and terms in health research. For example, Martinic et al. investigated the definitions of systematic reviews used in overviews of systematic reviews (OSRs), meta-epidemiological studies and epidemiology textbooks [ 88 ].
Other types of methodological studies
In addition to the previously mentioned experimental methodological studies, there may exist other types of methodological studies not captured here.
What is the design?
Methodological studies that are descriptive
Most methodological studies are purely descriptive and report their findings as counts (percent) and means (standard deviation) or medians (interquartile range). For example, Mbuagbaw et al. described the reporting of research recommendations in Cochrane HIV systematic reviews [ 30 ]. Gohari et al. described the quality of reporting of randomized trials in diabetes in Iran [ 12 ].
Methodological studies that are analytical
Some methodological studies are analytical wherein “analytical studies identify and quantify associations, test hypotheses, identify causes and determine whether an association exists between variables, such as between an exposure and a disease.” [ 89 ] In the case of methodological studies all these investigations are possible. For example, Kosa et al. investigated the association between agreement in primary outcome from trial registry to published manuscript and study covariates. They found that larger and more recent studies were more likely to have agreement [ 15 ]. Tricco et al. compared the conclusion statements from Cochrane and non-Cochrane systematic reviews with a meta-analysis of the primary outcome and found that non-Cochrane reviews were more likely to report positive findings. These results are a test of the null hypothesis that the proportions of Cochrane and non-Cochrane reviews that report positive results are equal [ 90 ].
What is the sampling strategy?
Methodological studies that include the target population
Methodological reviews with narrow research questions may be able to include the entire target population. For example, in the methodological study of Cochrane HIV systematic reviews, Mbuagbaw et al. included all of the available studies ( n = 103) [ 30 ].
Methodological studies that include a sample of the target population
Many methodological studies use random samples of the target population [ 33 , 91 , 92 ]. Alternatively, purposeful sampling may be used, limiting the sample to a subset of research-related reports published within a certain time period, or in journals with a certain ranking or on a topic. Systematic sampling can also be used when random sampling may be challenging to implement.
What is the unit of analysis?
Methodological studies with a research report as the unit of analysis
Many methodological studies use a research report (e.g. full manuscript of study, abstract portion of the study) as the unit of analysis, and inferences can be made at the study-level. However, both published and unpublished research-related reports can be studied. These may include articles, conference abstracts, registry entries etc.
Methodological studies with a design, analysis or reporting item as the unit of analysis
Some methodological studies report on items which may occur more than once per article. For example, Paquette et al. report on subgroup analyses in Cochrane reviews of atrial fibrillation in which 17 systematic reviews planned 56 subgroup analyses [ 93 ].
This framework is outlined in Fig. 2 .

A proposed framework for methodological studies
Conclusions
Methodological studies have examined different aspects of reporting such as quality, completeness, consistency and adherence to reporting guidelines. As such, many of the methodological study examples cited in this tutorial are related to reporting. However, as an evolving field, the scope of research questions that can be addressed by methodological studies is expected to increase.
In this paper we have outlined the scope and purpose of methodological studies, along with examples of instances in which various approaches have been used. In the absence of formal guidance on the design, conduct, analysis and reporting of methodological studies, we have provided some advice to help make methodological studies consistent. This advice is grounded in good contemporary scientific practice. Generally, the research question should tie in with the sampling approach and planned analysis. We have also highlighted the variables that may inform findings from methodological studies. Lastly, we have provided suggestions for ways in which authors can categorize their methodological studies to inform their design and analysis.
Availability of data and materials
Data sharing is not applicable to this article as no new data were created or analyzed in this study.
Abbreviations
Consolidated Standards of Reporting Trials
Evidence, Participants, Intervention, Comparison, Outcome, Timeframe
Grading of Recommendations, Assessment, Development and Evaluations
Participants, Intervention, Comparison, Outcome, Timeframe
Preferred Reporting Items of Systematic reviews and Meta-Analyses
Studies Within a Review
Studies Within a Trial
Chalmers I, Glasziou P. Avoidable waste in the production and reporting of research evidence. Lancet. 2009;374(9683):86–9.
PubMed Google Scholar
Chan AW, Song F, Vickers A, Jefferson T, Dickersin K, Gotzsche PC, Krumholz HM, Ghersi D, van der Worp HB. Increasing value and reducing waste: addressing inaccessible research. Lancet. 2014;383(9913):257–66.
PubMed PubMed Central Google Scholar
Ioannidis JP, Greenland S, Hlatky MA, Khoury MJ, Macleod MR, Moher D, Schulz KF, Tibshirani R. Increasing value and reducing waste in research design, conduct, and analysis. Lancet. 2014;383(9912):166–75.
Higgins JP, Altman DG, Gotzsche PC, Juni P, Moher D, Oxman AD, Savovic J, Schulz KF, Weeks L, Sterne JA. The Cochrane Collaboration's tool for assessing risk of bias in randomised trials. BMJ. 2011;343:d5928.
Moher D, Schulz KF, Altman DG. The CONSORT statement: revised recommendations for improving the quality of reports of parallel-group randomised trials. Lancet. 2001;357.
Liberati A, Altman DG, Tetzlaff J, Mulrow C, Gotzsche PC, Ioannidis JP, Clarke M, Devereaux PJ, Kleijnen J, Moher D. The PRISMA statement for reporting systematic reviews and meta-analyses of studies that evaluate health care interventions: explanation and elaboration. PLoS Med. 2009;6(7):e1000100.
Shea BJ, Hamel C, Wells GA, Bouter LM, Kristjansson E, Grimshaw J, Henry DA, Boers M. AMSTAR is a reliable and valid measurement tool to assess the methodological quality of systematic reviews. J Clin Epidemiol. 2009;62(10):1013–20.
Shea BJ, Reeves BC, Wells G, Thuku M, Hamel C, Moran J, Moher D, Tugwell P, Welch V, Kristjansson E, et al. AMSTAR 2: a critical appraisal tool for systematic reviews that include randomised or non-randomised studies of healthcare interventions, or both. Bmj. 2017;358:j4008.
Lawson DO, Leenus A, Mbuagbaw L. Mapping the nomenclature, methodology, and reporting of studies that review methods: a pilot methodological review. Pilot Feasibility Studies. 2020;6(1):13.
Puljak L, Makaric ZL, Buljan I, Pieper D. What is a meta-epidemiological study? Analysis of published literature indicated heterogeneous study designs and definitions. J Comp Eff Res. 2020.
Abbade LPF, Wang M, Sriganesh K, Jin Y, Mbuagbaw L, Thabane L. The framing of research questions using the PICOT format in randomized controlled trials of venous ulcer disease is suboptimal: a systematic survey. Wound Repair Regen. 2017;25(5):892–900.
Gohari F, Baradaran HR, Tabatabaee M, Anijidani S, Mohammadpour Touserkani F, Atlasi R, Razmgir M. Quality of reporting randomized controlled trials (RCTs) in diabetes in Iran; a systematic review. J Diabetes Metab Disord. 2015;15(1):36.
Wang M, Jin Y, Hu ZJ, Thabane A, Dennis B, Gajic-Veljanoski O, Paul J, Thabane L. The reporting quality of abstracts of stepped wedge randomized trials is suboptimal: a systematic survey of the literature. Contemp Clin Trials Commun. 2017;8:1–10.
Shanthanna H, Kaushal A, Mbuagbaw L, Couban R, Busse J, Thabane L: A cross-sectional study of the reporting quality of pilot or feasibility trials in high-impact anesthesia journals Can J Anaesthesia 2018, 65(11):1180–1195.
Kosa SD, Mbuagbaw L, Borg Debono V, Bhandari M, Dennis BB, Ene G, Leenus A, Shi D, Thabane M, Valvasori S, et al. Agreement in reporting between trial publications and current clinical trial registry in high impact journals: a methodological review. Contemporary Clinical Trials. 2018;65:144–50.
Zhang Y, Florez ID, Colunga Lozano LE, Aloweni FAB, Kennedy SA, Li A, Craigie S, Zhang S, Agarwal A, Lopes LC, et al. A systematic survey on reporting and methods for handling missing participant data for continuous outcomes in randomized controlled trials. J Clin Epidemiol. 2017;88:57–66.
CAS PubMed Google Scholar
Hernández AV, Boersma E, Murray GD, Habbema JD, Steyerberg EW. Subgroup analyses in therapeutic cardiovascular clinical trials: are most of them misleading? Am Heart J. 2006;151(2):257–64.
Samaan Z, Mbuagbaw L, Kosa D, Borg Debono V, Dillenburg R, Zhang S, Fruci V, Dennis B, Bawor M, Thabane L. A systematic scoping review of adherence to reporting guidelines in health care literature. J Multidiscip Healthc. 2013;6:169–88.
Buscemi N, Hartling L, Vandermeer B, Tjosvold L, Klassen TP. Single data extraction generated more errors than double data extraction in systematic reviews. J Clin Epidemiol. 2006;59(7):697–703.
Carrasco-Labra A, Brignardello-Petersen R, Santesso N, Neumann I, Mustafa RA, Mbuagbaw L, Etxeandia Ikobaltzeta I, De Stio C, McCullagh LJ, Alonso-Coello P. Improving GRADE evidence tables part 1: a randomized trial shows improved understanding of content in summary-of-findings tables with a new format. J Clin Epidemiol. 2016;74:7–18.
The Northern Ireland Hub for Trials Methodology Research: SWAT/SWAR Information [ https://www.qub.ac.uk/sites/TheNorthernIrelandNetworkforTrialsMethodologyResearch/SWATSWARInformation/ ]. Accessed 31 Aug 2020.
Chick S, Sánchez P, Ferrin D, Morrice D. How to conduct a successful simulation study. In: Proceedings of the 2003 winter simulation conference: 2003; 2003. p. 66–70.
Google Scholar
Mulrow CD. The medical review article: state of the science. Ann Intern Med. 1987;106(3):485–8.
Sacks HS, Reitman D, Pagano D, Kupelnick B. Meta-analysis: an update. Mount Sinai J Med New York. 1996;63(3–4):216–24.
CAS Google Scholar
Areia M, Soares M, Dinis-Ribeiro M. Quality reporting of endoscopic diagnostic studies in gastrointestinal journals: where do we stand on the use of the STARD and CONSORT statements? Endoscopy. 2010;42(2):138–47.
Knol M, Groenwold R, Grobbee D. P-values in baseline tables of randomised controlled trials are inappropriate but still common in high impact journals. Eur J Prev Cardiol. 2012;19(2):231–2.
Chen M, Cui J, Zhang AL, Sze DM, Xue CC, May BH. Adherence to CONSORT items in randomized controlled trials of integrative medicine for colorectal Cancer published in Chinese journals. J Altern Complement Med. 2018;24(2):115–24.
Hopewell S, Ravaud P, Baron G, Boutron I. Effect of editors' implementation of CONSORT guidelines on the reporting of abstracts in high impact medical journals: interrupted time series analysis. BMJ. 2012;344:e4178.
The Cochrane Methodology Register Issue 2 2009 [ https://cmr.cochrane.org/help.htm ]. Accessed 31 Aug 2020.
Mbuagbaw L, Kredo T, Welch V, Mursleen S, Ross S, Zani B, Motaze NV, Quinlan L. Critical EPICOT items were absent in Cochrane human immunodeficiency virus systematic reviews: a bibliometric analysis. J Clin Epidemiol. 2016;74:66–72.
Barton S, Peckitt C, Sclafani F, Cunningham D, Chau I. The influence of industry sponsorship on the reporting of subgroup analyses within phase III randomised controlled trials in gastrointestinal oncology. Eur J Cancer. 2015;51(18):2732–9.
Setia MS. Methodology series module 5: sampling strategies. Indian J Dermatol. 2016;61(5):505–9.
Wilson B, Burnett P, Moher D, Altman DG, Al-Shahi Salman R. Completeness of reporting of randomised controlled trials including people with transient ischaemic attack or stroke: a systematic review. Eur Stroke J. 2018;3(4):337–46.
Kahale LA, Diab B, Brignardello-Petersen R, Agarwal A, Mustafa RA, Kwong J, Neumann I, Li L, Lopes LC, Briel M, et al. Systematic reviews do not adequately report or address missing outcome data in their analyses: a methodological survey. J Clin Epidemiol. 2018;99:14–23.
De Angelis CD, Drazen JM, Frizelle FA, Haug C, Hoey J, Horton R, Kotzin S, Laine C, Marusic A, Overbeke AJPM, et al. Is this clinical trial fully registered?: a statement from the International Committee of Medical Journal Editors*. Ann Intern Med. 2005;143(2):146–8.
Ohtake PJ, Childs JD. Why publish study protocols? Phys Ther. 2014;94(9):1208–9.
Rombey T, Allers K, Mathes T, Hoffmann F, Pieper D. A descriptive analysis of the characteristics and the peer review process of systematic review protocols published in an open peer review journal from 2012 to 2017. BMC Med Res Methodol. 2019;19(1):57.
Grimes DA, Schulz KF. Bias and causal associations in observational research. Lancet. 2002;359(9302):248–52.
Porta M (ed.): A dictionary of epidemiology, 5th edn. Oxford: Oxford University Press, Inc.; 2008.
El Dib R, Tikkinen KAO, Akl EA, Gomaa HA, Mustafa RA, Agarwal A, Carpenter CR, Zhang Y, Jorge EC, Almeida R, et al. Systematic survey of randomized trials evaluating the impact of alternative diagnostic strategies on patient-important outcomes. J Clin Epidemiol. 2017;84:61–9.
Helzer JE, Robins LN, Taibleson M, Woodruff RA Jr, Reich T, Wish ED. Reliability of psychiatric diagnosis. I. a methodological review. Arch Gen Psychiatry. 1977;34(2):129–33.
Chung ST, Chacko SK, Sunehag AL, Haymond MW. Measurements of gluconeogenesis and Glycogenolysis: a methodological review. Diabetes. 2015;64(12):3996–4010.
CAS PubMed PubMed Central Google Scholar
Sterne JA, Juni P, Schulz KF, Altman DG, Bartlett C, Egger M. Statistical methods for assessing the influence of study characteristics on treatment effects in 'meta-epidemiological' research. Stat Med. 2002;21(11):1513–24.
Moen EL, Fricano-Kugler CJ, Luikart BW, O’Malley AJ. Analyzing clustered data: why and how to account for multiple observations nested within a study participant? PLoS One. 2016;11(1):e0146721.
Zyzanski SJ, Flocke SA, Dickinson LM. On the nature and analysis of clustered data. Ann Fam Med. 2004;2(3):199–200.
Mathes T, Klassen P, Pieper D. Frequency of data extraction errors and methods to increase data extraction quality: a methodological review. BMC Med Res Methodol. 2017;17(1):152.
Bui DDA, Del Fiol G, Hurdle JF, Jonnalagadda S. Extractive text summarization system to aid data extraction from full text in systematic review development. J Biomed Inform. 2016;64:265–72.
Bui DD, Del Fiol G, Jonnalagadda S. PDF text classification to leverage information extraction from publication reports. J Biomed Inform. 2016;61:141–8.
Maticic K, Krnic Martinic M, Puljak L. Assessment of reporting quality of abstracts of systematic reviews with meta-analysis using PRISMA-A and discordance in assessments between raters without prior experience. BMC Med Res Methodol. 2019;19(1):32.
Speich B. Blinding in surgical randomized clinical trials in 2015. Ann Surg. 2017;266(1):21–2.
Abraha I, Cozzolino F, Orso M, Marchesi M, Germani A, Lombardo G, Eusebi P, De Florio R, Luchetta ML, Iorio A, et al. A systematic review found that deviations from intention-to-treat are common in randomized trials and systematic reviews. J Clin Epidemiol. 2017;84:37–46.
Zhong Y, Zhou W, Jiang H, Fan T, Diao X, Yang H, Min J, Wang G, Fu J, Mao B. Quality of reporting of two-group parallel randomized controlled clinical trials of multi-herb formulae: A survey of reports indexed in the Science Citation Index Expanded. Eur J Integrative Med. 2011;3(4):e309–16.
Farrokhyar F, Chu R, Whitlock R, Thabane L. A systematic review of the quality of publications reporting coronary artery bypass grafting trials. Can J Surg. 2007;50(4):266–77.
Oltean H, Gagnier JJ. Use of clustering analysis in randomized controlled trials in orthopaedic surgery. BMC Med Res Methodol. 2015;15:17.
Fleming PS, Koletsi D, Pandis N. Blinded by PRISMA: are systematic reviewers focusing on PRISMA and ignoring other guidelines? PLoS One. 2014;9(5):e96407.
Balasubramanian SP, Wiener M, Alshameeri Z, Tiruvoipati R, Elbourne D, Reed MW. Standards of reporting of randomized controlled trials in general surgery: can we do better? Ann Surg. 2006;244(5):663–7.
de Vries TW, van Roon EN. Low quality of reporting adverse drug reactions in paediatric randomised controlled trials. Arch Dis Child. 2010;95(12):1023–6.
Borg Debono V, Zhang S, Ye C, Paul J, Arya A, Hurlburt L, Murthy Y, Thabane L. The quality of reporting of RCTs used within a postoperative pain management meta-analysis, using the CONSORT statement. BMC Anesthesiol. 2012;12:13.
Kaiser KA, Cofield SS, Fontaine KR, Glasser SP, Thabane L, Chu R, Ambrale S, Dwary AD, Kumar A, Nayyar G, et al. Is funding source related to study reporting quality in obesity or nutrition randomized control trials in top-tier medical journals? Int J Obes. 2012;36(7):977–81.
Thomas O, Thabane L, Douketis J, Chu R, Westfall AO, Allison DB. Industry funding and the reporting quality of large long-term weight loss trials. Int J Obes. 2008;32(10):1531–6.
Khan NR, Saad H, Oravec CS, Rossi N, Nguyen V, Venable GT, Lillard JC, Patel P, Taylor DR, Vaughn BN, et al. A review of industry funding in randomized controlled trials published in the neurosurgical literature-the elephant in the room. Neurosurgery. 2018;83(5):890–7.
Hansen C, Lundh A, Rasmussen K, Hrobjartsson A. Financial conflicts of interest in systematic reviews: associations with results, conclusions, and methodological quality. Cochrane Database Syst Rev. 2019;8:Mr000047.
Kiehna EN, Starke RM, Pouratian N, Dumont AS. Standards for reporting randomized controlled trials in neurosurgery. J Neurosurg. 2011;114(2):280–5.
Liu LQ, Morris PJ, Pengel LH. Compliance to the CONSORT statement of randomized controlled trials in solid organ transplantation: a 3-year overview. Transpl Int. 2013;26(3):300–6.
Bala MM, Akl EA, Sun X, Bassler D, Mertz D, Mejza F, Vandvik PO, Malaga G, Johnston BC, Dahm P, et al. Randomized trials published in higher vs. lower impact journals differ in design, conduct, and analysis. J Clin Epidemiol. 2013;66(3):286–95.
Lee SY, Teoh PJ, Camm CF, Agha RA. Compliance of randomized controlled trials in trauma surgery with the CONSORT statement. J Trauma Acute Care Surg. 2013;75(4):562–72.
Ziogas DC, Zintzaras E. Analysis of the quality of reporting of randomized controlled trials in acute and chronic myeloid leukemia, and myelodysplastic syndromes as governed by the CONSORT statement. Ann Epidemiol. 2009;19(7):494–500.
Alvarez F, Meyer N, Gourraud PA, Paul C. CONSORT adoption and quality of reporting of randomized controlled trials: a systematic analysis in two dermatology journals. Br J Dermatol. 2009;161(5):1159–65.
Mbuagbaw L, Thabane M, Vanniyasingam T, Borg Debono V, Kosa S, Zhang S, Ye C, Parpia S, Dennis BB, Thabane L. Improvement in the quality of abstracts in major clinical journals since CONSORT extension for abstracts: a systematic review. Contemporary Clin trials. 2014;38(2):245–50.
Thabane L, Chu R, Cuddy K, Douketis J. What is the quality of reporting in weight loss intervention studies? A systematic review of randomized controlled trials. Int J Obes. 2007;31(10):1554–9.
Murad MH, Wang Z. Guidelines for reporting meta-epidemiological methodology research. Evidence Based Med. 2017;22(4):139.
METRIC - MEthodological sTudy ReportIng Checklist: guidelines for reporting methodological studies in health research [ http://www.equator-network.org/library/reporting-guidelines-under-development/reporting-guidelines-under-development-for-other-study-designs/#METRIC ]. Accessed 31 Aug 2020.
Jager KJ, Zoccali C, MacLeod A, Dekker FW. Confounding: what it is and how to deal with it. Kidney Int. 2008;73(3):256–60.
Parker SG, Halligan S, Erotocritou M, Wood CPJ, Boulton RW, Plumb AAO, Windsor ACJ, Mallett S. A systematic methodological review of non-randomised interventional studies of elective ventral hernia repair: clear definitions and a standardised minimum dataset are needed. Hernia. 2019.
Bouwmeester W, Zuithoff NPA, Mallett S, Geerlings MI, Vergouwe Y, Steyerberg EW, Altman DG, Moons KGM. Reporting and methods in clinical prediction research: a systematic review. PLoS Med. 2012;9(5):1–12.
Schiller P, Burchardi N, Niestroj M, Kieser M. Quality of reporting of clinical non-inferiority and equivalence randomised trials--update and extension. Trials. 2012;13:214.
Riado Minguez D, Kowalski M, Vallve Odena M, Longin Pontzen D, Jelicic Kadic A, Jeric M, Dosenovic S, Jakus D, Vrdoljak M, Poklepovic Pericic T, et al. Methodological and reporting quality of systematic reviews published in the highest ranking journals in the field of pain. Anesth Analg. 2017;125(4):1348–54.
Thabut G, Estellat C, Boutron I, Samama CM, Ravaud P. Methodological issues in trials assessing primary prophylaxis of venous thrombo-embolism. Eur Heart J. 2005;27(2):227–36.
Puljak L, Riva N, Parmelli E, González-Lorenzo M, Moja L, Pieper D. Data extraction methods: an analysis of internal reporting discrepancies in single manuscripts and practical advice. J Clin Epidemiol. 2020;117:158–64.
Ritchie A, Seubert L, Clifford R, Perry D, Bond C. Do randomised controlled trials relevant to pharmacy meet best practice standards for quality conduct and reporting? A systematic review. Int J Pharm Pract. 2019.
Babic A, Vuka I, Saric F, Proloscic I, Slapnicar E, Cavar J, Pericic TP, Pieper D, Puljak L. Overall bias methods and their use in sensitivity analysis of Cochrane reviews were not consistent. J Clin Epidemiol. 2019.
Tan A, Porcher R, Crequit P, Ravaud P, Dechartres A. Differences in treatment effect size between overall survival and progression-free survival in immunotherapy trials: a Meta-epidemiologic study of trials with results posted at ClinicalTrials.gov. J Clin Oncol. 2017;35(15):1686–94.
Croitoru D, Huang Y, Kurdina A, Chan AW, Drucker AM. Quality of reporting in systematic reviews published in dermatology journals. Br J Dermatol. 2020;182(6):1469–76.
Khan MS, Ochani RK, Shaikh A, Vaduganathan M, Khan SU, Fatima K, Yamani N, Mandrola J, Doukky R, Krasuski RA: Assessing the Quality of Reporting of Harms in Randomized Controlled Trials Published in High Impact Cardiovascular Journals. Eur Heart J Qual Care Clin Outcomes 2019.
Rosmarakis ES, Soteriades ES, Vergidis PI, Kasiakou SK, Falagas ME. From conference abstract to full paper: differences between data presented in conferences and journals. FASEB J. 2005;19(7):673–80.
Mueller M, D’Addario M, Egger M, Cevallos M, Dekkers O, Mugglin C, Scott P. Methods to systematically review and meta-analyse observational studies: a systematic scoping review of recommendations. BMC Med Res Methodol. 2018;18(1):44.
Li G, Abbade LPF, Nwosu I, Jin Y, Leenus A, Maaz M, Wang M, Bhatt M, Zielinski L, Sanger N, et al. A scoping review of comparisons between abstracts and full reports in primary biomedical research. BMC Med Res Methodol. 2017;17(1):181.
Krnic Martinic M, Pieper D, Glatt A, Puljak L. Definition of a systematic review used in overviews of systematic reviews, meta-epidemiological studies and textbooks. BMC Med Res Methodol. 2019;19(1):203.
Analytical study [ https://medical-dictionary.thefreedictionary.com/analytical+study ]. Accessed 31 Aug 2020.
Tricco AC, Tetzlaff J, Pham B, Brehaut J, Moher D. Non-Cochrane vs. Cochrane reviews were twice as likely to have positive conclusion statements: cross-sectional study. J Clin Epidemiol. 2009;62(4):380–6 e381.
Schalken N, Rietbergen C. The reporting quality of systematic reviews and Meta-analyses in industrial and organizational psychology: a systematic review. Front Psychol. 2017;8:1395.
Ranker LR, Petersen JM, Fox MP. Awareness of and potential for dependent error in the observational epidemiologic literature: A review. Ann Epidemiol. 2019;36:15–9 e12.
Paquette M, Alotaibi AM, Nieuwlaat R, Santesso N, Mbuagbaw L. A meta-epidemiological study of subgroup analyses in cochrane systematic reviews of atrial fibrillation. Syst Rev. 2019;8(1):241.
Download references
Acknowledgements
This work did not receive any dedicated funding.
Author information
Authors and affiliations.
Department of Health Research Methods, Evidence and Impact, McMaster University, Hamilton, ON, Canada
Lawrence Mbuagbaw, Daeria O. Lawson & Lehana Thabane
Biostatistics Unit/FSORC, 50 Charlton Avenue East, St Joseph’s Healthcare—Hamilton, 3rd Floor Martha Wing, Room H321, Hamilton, Ontario, L8N 4A6, Canada
Lawrence Mbuagbaw & Lehana Thabane
Centre for the Development of Best Practices in Health, Yaoundé, Cameroon
Lawrence Mbuagbaw
Center for Evidence-Based Medicine and Health Care, Catholic University of Croatia, Ilica 242, 10000, Zagreb, Croatia
Livia Puljak
Department of Epidemiology and Biostatistics, School of Public Health – Bloomington, Indiana University, Bloomington, IN, 47405, USA
David B. Allison
Departments of Paediatrics and Anaesthesia, McMaster University, Hamilton, ON, Canada
Lehana Thabane
Centre for Evaluation of Medicine, St. Joseph’s Healthcare-Hamilton, Hamilton, ON, Canada
Population Health Research Institute, Hamilton Health Sciences, Hamilton, ON, Canada
You can also search for this author in PubMed Google Scholar
Contributions
LM conceived the idea and drafted the outline and paper. DOL and LT commented on the idea and draft outline. LM, LP and DOL performed literature searches and data extraction. All authors (LM, DOL, LT, LP, DBA) reviewed several draft versions of the manuscript and approved the final manuscript.
Corresponding author
Correspondence to Lawrence Mbuagbaw .
Ethics declarations
Ethics approval and consent to participate.
Not applicable.
Consent for publication
Competing interests.
DOL, DBA, LM, LP and LT are involved in the development of a reporting guideline for methodological studies.
Additional information
Publisher’s note.
Springer Nature remains neutral with regard to jurisdictional claims in published maps and institutional affiliations.
Rights and permissions
Open Access This article is licensed under a Creative Commons Attribution 4.0 International License, which permits use, sharing, adaptation, distribution and reproduction in any medium or format, as long as you give appropriate credit to the original author(s) and the source, provide a link to the Creative Commons licence, and indicate if changes were made. The images or other third party material in this article are included in the article's Creative Commons licence, unless indicated otherwise in a credit line to the material. If material is not included in the article's Creative Commons licence and your intended use is not permitted by statutory regulation or exceeds the permitted use, you will need to obtain permission directly from the copyright holder. To view a copy of this licence, visit http://creativecommons.org/licenses/by/4.0/ . The Creative Commons Public Domain Dedication waiver ( http://creativecommons.org/publicdomain/zero/1.0/ ) applies to the data made available in this article, unless otherwise stated in a credit line to the data.
Reprints and permissions
About this article
Cite this article.
Mbuagbaw, L., Lawson, D.O., Puljak, L. et al. A tutorial on methodological studies: the what, when, how and why. BMC Med Res Methodol 20 , 226 (2020). https://doi.org/10.1186/s12874-020-01107-7
Download citation
Received : 27 May 2020
Accepted : 27 August 2020
Published : 07 September 2020
DOI : https://doi.org/10.1186/s12874-020-01107-7
Share this article
Anyone you share the following link with will be able to read this content:
Sorry, a shareable link is not currently available for this article.
Provided by the Springer Nature SharedIt content-sharing initiative
- Methodological study
- Meta-epidemiology
- Research methods
- Research-on-research
BMC Medical Research Methodology
ISSN: 1471-2288
- General enquiries: [email protected]
Organizing Academic Research Papers: 6. The Methodology
- Purpose of Guide
- Design Flaws to Avoid
- Glossary of Research Terms
- Narrowing a Topic Idea
- Broadening a Topic Idea
- Extending the Timeliness of a Topic Idea
- Academic Writing Style
- Choosing a Title
- Making an Outline
- Paragraph Development
- Executive Summary
- Background Information
- The Research Problem/Question
- Theoretical Framework
- Citation Tracking
- Content Alert Services
- Evaluating Sources
- Primary Sources
- Secondary Sources
- Tertiary Sources
- What Is Scholarly vs. Popular?
- Qualitative Methods
- Quantitative Methods
- Using Non-Textual Elements
- Limitations of the Study
- Common Grammar Mistakes
- Avoiding Plagiarism
- Footnotes or Endnotes?
- Further Readings
- Annotated Bibliography
- Dealing with Nervousness
- Using Visual Aids
- Grading Someone Else's Paper
- How to Manage Group Projects
- Multiple Book Review Essay
- Reviewing Collected Essays
- About Informed Consent
- Writing Field Notes
- Writing a Policy Memo
- Writing a Research Proposal
- Acknowledgements
The methods section of a research paper provides the information by which a study’s validity is judged. The method section answers two main questions: 1) How was the data collected or generated? 2) How was it analyzed? The writing should be direct and precise and written in the past tense.
Importance of a Good Methodology Section
You must explain how you obtained and analyzed your results for the following reasons:
- Readers need to know how the data was obtained because the method you choose affects the results and, by extension, how you likely interpreted those results.
- Methodology is crucial for any branch of scholarship because an unreliable method produces unreliable results and it misappropriates interpretations of findings .
- In most cases, there are a variety of different methods you can choose to investigate a research problem. Your methodology section of your paper should make clear the reasons why you chose a particular method or procedure .
- The reader wants to know that the data was collected or generated in a way that is consistent with accepted practice in the field of study. For example, if you are using a questionnaire, readers need to know that it offered your respondents a reasonable range of answers to choose from.
- The research method must be appropriate to the objectives of the study . For example, be sure you have a large enough sample size to be able to generalize and make recommendations based upon the findings.
- The methodology should discuss the problems that were anticipated and the steps you took to prevent them from occurring . For any problems that did arise, you must describe the ways in which their impact was minimized or why these problems do not affect the findings in any way that impacts your interpretation of the data.
- Often in social science research, it is useful for other researchers to adapt or replicate your methodology. Therefore, it is important to always provide sufficient information to allow others to use or replicate the study . This information is particularly important when a new method had been developed or an innovative use of an existing method has been utilized.
Bem, Daryl J. Writing the Empirical Journal Article . Psychology Writing Center. University of Washington; Lunenburg, Frederick C. Writing a Successful Thesis or Dissertation: Tips and Strategies for Students in the Social and Behavioral Sciences . Thousand Oaks, CA: Corwin Press, 2008.
Structure and Writing Style
I. Groups of Research Methods
There are two main groups of research methods in the social sciences:
- The empirical-analytical group approaches the study of social sciences in a similar manner that researchers study the natural sciences. This type of research focuses on objective knowledge, research questions that can be answered yes or no, and operational definitions of variables to be measured. The empirical-analytical group employs deductive reasoning that uses existing theory as a foundation for hypotheses that need to be tested. This approach is focused on explanation .
- The interpretative group is focused on understanding phenomenon in a comprehensive, holistic way . This research method allows you to recognize your connection to the subject under study. Because the interpretative group focuses more on subjective knowledge, it requires careful interpretation of variables.
II. Content
An effectively written methodology section should:
- Introduce the overall methodological approach for investigating your research problem . Is your study qualitative or quantitative or a combination of both (mixed method)? Are you going to take a special approach, such as action research, or a more neutral stance?
- Indicate how the approach fits the overall research design . Your methods should have a clear connection with your research problem. In other words, make sure that your methods will actually address the problem. One of the most common deficiencies found in research papers is that the proposed methodology is unsuited to achieving the stated objective of your paper.
- Describe the specific methods of data collection you are going to use , such as, surveys, interviews, questionnaires, observation, archival research. If you are analyzing existing data, such as a data set or archival documents, describe how it was originally created or gathered and by whom.
- Explain how you intend to analyze your results . Will you use statistical analysis? Will you use specific theoretical perspectives to help you analyze a text or explain observed behaviors?
- Provide background and rationale for methodologies that are unfamiliar for your readers . Very often in the social sciences, research problems and the methods for investigating them require more explanation/rationale than widely accepted rules governing the natural and physical sciences. Be clear and concise in your explanation.
- Provide a rationale for subject selection and sampling procedure . For instance, if you propose to conduct interviews, how do you intend to select the sample population? If you are analyzing texts, which texts have you chosen, and why? If you are using statistics, why is this set of statisics being used? If other data sources exist, explain why the data you chose is most appropriate.
- Address potential limitations . Are there any practical limitations that could affect your data collection? How will you attempt to control for potential confounding variables and errors? If your methodology may lead to problems you can anticipate, state this openly and show why pursuing this methodology outweighs the risk of these problems cropping up.
NOTE : Once you have written all of the elements of the methods section, subsequent revisions should focus on how to present those elements as clearly and as logically as possibly. The description of how you prepared to study the research problem, how you gathered the data, and the protocol for analyzing the data should be organized chronologically. For clarity, when a large amount of detail must be presented, information should be presented in sub-sections according to topic.
III. Problems to Avoid
Irrelevant Detail The methodology section of your paper should be thorough but to the point. Don’t provide any background information that doesn’t directly help the reader to understand why a particular method was chosen, how the data was gathered or obtained, and how it was analyzed. Unnecessary Explanation of Basic Procedures Remember that you are not writing a how-to guide about a particular method. You should make the assumption that readers possess a basic understanding of how to investigate the research problem on their own and, therefore, you do not have to go into great detail about specific methodological procedures. The focus should be on how you applied a method , not on the mechanics of doing a method. NOTE: An exception to this rule is if you select an unconventional approach to doing the method; if this is the case, be sure to explain why this approach was chosen and how it enhances the overall research process. Problem Blindness It is almost a given that you will encounter problems when collecting or generating your data. Do not ignore these problems or pretend they did not occur. Often, documenting how you overcame obstacles can form an interesting part of the methodology. It demonstrates to the reader that you can provide a cogent rationale for the decisions you made to minimize the impact of any problems that arose. Literature Review Just as the literature review section of your paper provides an overview of sources you have examined while researching a particular topic, the methodology section should cite any sources that informed your choice and application of a particular method [i.e., the choice of a survey should include any citations to the works you used to help construct the survey].
It’s More than Sources of Information! A description of a research study's method should not be confused with a description of the sources of information. Such a list of sources is useful in itself, especially if it is accompanied by an explanation about the selection and use of the sources. The description of the project's methodology complements a list of sources in that it sets forth the organization and interpretation of information emanating from those sources.
Azevedo, L.F. et al. How to Write a Scientific Paper: Writing the Methods Section. Revista Portuguesa de Pneumologia 17 (2011): 232-238; Butin, Dan W. The Education Dissertation A Guide for Practitioner Scholars . Thousand Oaks, CA: Corwin, 2010; Carter, Susan. Structuring Your Research Thesis . New York: Palgrave Macmillan, 2012; Lunenburg, Frederick C. Writing a Successful Thesis or Dissertation: Tips and Strategies for Students in the Social and Behavioral Sciences . Thousand Oaks, CA: Corwin Press, 2008. Methods Section . The Writer’s Handbook. Writing Center. University of Wisconsin, Madison; Writing the Experimental Report: Methods, Results, and Discussion . The Writing Lab and The OWL. Purdue University; Methods and Materials . The Structure, Format, Content, and Style of a Journal-Style Scientific Paper. Department of Biology. Bates College.
Writing Tip
Statistical Designs and Tests? Do Not Fear Them!
Don't avoid using a quantitative approach to analyzing your research problem just because you fear the idea of applying statistical designs and tests. A qualitative approach, such as conducting interviews or content analysis of archival texts, can yield exciting new insights about a research problem, but it should not be undertaken simply because you have a disdain for running a simple regression. A well designed quantitative research study can often be accomplished in very clear and direct ways, whereas, a similar study of a qualitative nature usually requires considerable time to analyze large volumes of data and a tremendous burden to create new paths for analysis where previously no path associated with your research problem had existed.
Another Writing Tip
Knowing the Relationship Between Theories and Methods
There can be multiple meaning associated with the term "theories" and the term "methods" in social sciences research. A helpful way to delineate between them is to understand "theories" as representing different ways of characterizing the social world when you research it and "methods" as representing different ways of generating and analyzing data about that social world. Framed in this way, all empirical social sciences research involves theories and methods, whether they are stated explicitly or not. However, while theories and methods are often related, it is important that, as a researcher, you deliberately separate them in order to avoid your theories playing a disproportionate role in shaping what outcomes your chosen methods produce.
Introspectively engage in an ongoing dialectic between theories and methods to help enable you to use the outcomes from your methods to interrogate and develop new theories, or ways of framing conceptually the research problem. This is how scholarship grows and branches out into new intellectual territory.
Reynolds, R. Larry. Ways of Knowing. Alternative Microeconomics. Part 1, Chapter 3. Boise State University; The Theory-Method Relationship . S-Cool Revision. United Kingdom.
- << Previous: What Is Scholarly vs. Popular?
- Next: Qualitative Methods >>
- Last Updated: Jul 18, 2023 11:58 AM
- URL: https://library.sacredheart.edu/c.php?g=29803
- QuickSearch
- Library Catalog
- Databases A-Z
- Publication Finder
- Course Reserves
- Citation Linker
- Digital Commons
- Our Website
Research Support
- Ask a Librarian
- Appointments
- Interlibrary Loan (ILL)
- Research Guides
- Databases by Subject
- Citation Help
Using the Library
- Reserve a Group Study Room
- Renew Books
- Honors Study Rooms
- Off-Campus Access
- Library Policies
- Library Technology
User Information
- Grad Students
- Online Students
- COVID-19 Updates
- Staff Directory
- News & Announcements
- Library Newsletter
My Accounts
- Interlibrary Loan
- Staff Site Login
FIND US ON
Thank you for visiting nature.com. You are using a browser version with limited support for CSS. To obtain the best experience, we recommend you use a more up to date browser (or turn off compatibility mode in Internet Explorer). In the meantime, to ensure continued support, we are displaying the site without styles and JavaScript.
- View all journals
- My Account Login
- Explore content
- About the journal
- Publish with us
- Sign up for alerts
- Open access
- Published: 26 March 2024
Predicting and improving complex beer flavor through machine learning
- Michiel Schreurs ORCID: orcid.org/0000-0002-9449-5619 1 , 2 , 3 na1 ,
- Supinya Piampongsant 1 , 2 , 3 na1 ,
- Miguel Roncoroni ORCID: orcid.org/0000-0001-7461-1427 1 , 2 , 3 na1 ,
- Lloyd Cool ORCID: orcid.org/0000-0001-9936-3124 1 , 2 , 3 , 4 ,
- Beatriz Herrera-Malaver ORCID: orcid.org/0000-0002-5096-9974 1 , 2 , 3 ,
- Christophe Vanderaa ORCID: orcid.org/0000-0001-7443-5427 4 ,
- Florian A. Theßeling 1 , 2 , 3 ,
- Łukasz Kreft ORCID: orcid.org/0000-0001-7620-4657 5 ,
- Alexander Botzki ORCID: orcid.org/0000-0001-6691-4233 5 ,
- Philippe Malcorps 6 ,
- Luk Daenen 6 ,
- Tom Wenseleers ORCID: orcid.org/0000-0002-1434-861X 4 &
- Kevin J. Verstrepen ORCID: orcid.org/0000-0002-3077-6219 1 , 2 , 3
Nature Communications volume 15 , Article number: 2368 ( 2024 ) Cite this article
42k Accesses
786 Altmetric
Metrics details
- Chemical engineering
- Gas chromatography
- Machine learning
- Metabolomics
- Taste receptors
The perception and appreciation of food flavor depends on many interacting chemical compounds and external factors, and therefore proves challenging to understand and predict. Here, we combine extensive chemical and sensory analyses of 250 different beers to train machine learning models that allow predicting flavor and consumer appreciation. For each beer, we measure over 200 chemical properties, perform quantitative descriptive sensory analysis with a trained tasting panel and map data from over 180,000 consumer reviews to train 10 different machine learning models. The best-performing algorithm, Gradient Boosting, yields models that significantly outperform predictions based on conventional statistics and accurately predict complex food features and consumer appreciation from chemical profiles. Model dissection allows identifying specific and unexpected compounds as drivers of beer flavor and appreciation. Adding these compounds results in variants of commercial alcoholic and non-alcoholic beers with improved consumer appreciation. Together, our study reveals how big data and machine learning uncover complex links between food chemistry, flavor and consumer perception, and lays the foundation to develop novel, tailored foods with superior flavors.
BitterSweet: Building machine learning models for predicting the bitter and sweet taste of small molecules
Rudraksh Tuwani, Somin Wadhwa & Ganesh Bagler

Sensory lexicon and aroma volatiles analysis of brewing malt
Xiaoxia Su, Miao Yu, … Tianyi Du

Predicting odor from molecular structure: a multi-label classification approach
Kushagra Saini & Venkatnarayan Ramanathan
Introduction
Predicting and understanding food perception and appreciation is one of the major challenges in food science. Accurate modeling of food flavor and appreciation could yield important opportunities for both producers and consumers, including quality control, product fingerprinting, counterfeit detection, spoilage detection, and the development of new products and product combinations (food pairing) 1 , 2 , 3 , 4 , 5 , 6 . Accurate models for flavor and consumer appreciation would contribute greatly to our scientific understanding of how humans perceive and appreciate flavor. Moreover, accurate predictive models would also facilitate and standardize existing food assessment methods and could supplement or replace assessments by trained and consumer tasting panels, which are variable, expensive and time-consuming 7 , 8 , 9 . Lastly, apart from providing objective, quantitative, accurate and contextual information that can help producers, models can also guide consumers in understanding their personal preferences 10 .
Despite the myriad of applications, predicting food flavor and appreciation from its chemical properties remains a largely elusive goal in sensory science, especially for complex food and beverages 11 , 12 . A key obstacle is the immense number of flavor-active chemicals underlying food flavor. Flavor compounds can vary widely in chemical structure and concentration, making them technically challenging and labor-intensive to quantify, even in the face of innovations in metabolomics, such as non-targeted metabolic fingerprinting 13 , 14 . Moreover, sensory analysis is perhaps even more complicated. Flavor perception is highly complex, resulting from hundreds of different molecules interacting at the physiochemical and sensorial level. Sensory perception is often non-linear, characterized by complex and concentration-dependent synergistic and antagonistic effects 15 , 16 , 17 , 18 , 19 , 20 , 21 that are further convoluted by the genetics, environment, culture and psychology of consumers 22 , 23 , 24 . Perceived flavor is therefore difficult to measure, with problems of sensitivity, accuracy, and reproducibility that can only be resolved by gathering sufficiently large datasets 25 . Trained tasting panels are considered the prime source of quality sensory data, but require meticulous training, are low throughput and high cost. Public databases containing consumer reviews of food products could provide a valuable alternative, especially for studying appreciation scores, which do not require formal training 25 . Public databases offer the advantage of amassing large amounts of data, increasing the statistical power to identify potential drivers of appreciation. However, public datasets suffer from biases, including a bias in the volunteers that contribute to the database, as well as confounding factors such as price, cult status and psychological conformity towards previous ratings of the product.
Classical multivariate statistics and machine learning methods have been used to predict flavor of specific compounds by, for example, linking structural properties of a compound to its potential biological activities or linking concentrations of specific compounds to sensory profiles 1 , 26 . Importantly, most previous studies focused on predicting organoleptic properties of single compounds (often based on their chemical structure) 27 , 28 , 29 , 30 , 31 , 32 , 33 , thus ignoring the fact that these compounds are present in a complex matrix in food or beverages and excluding complex interactions between compounds. Moreover, the classical statistics commonly used in sensory science 34 , 35 , 36 , 37 , 38 , 39 require a large sample size and sufficient variance amongst predictors to create accurate models. They are not fit for studying an extensive set of hundreds of interacting flavor compounds, since they are sensitive to outliers, have a high tendency to overfit and are less suited for non-linear and discontinuous relationships 40 .
In this study, we combine extensive chemical analyses and sensory data of a set of different commercial beers with machine learning approaches to develop models that predict taste, smell, mouthfeel and appreciation from compound concentrations. Beer is particularly suited to model the relationship between chemistry, flavor and appreciation. First, beer is a complex product, consisting of thousands of flavor compounds that partake in complex sensory interactions 41 , 42 , 43 . This chemical diversity arises from the raw materials (malt, yeast, hops, water and spices) and biochemical conversions during the brewing process (kilning, mashing, boiling, fermentation, maturation and aging) 44 , 45 . Second, the advent of the internet saw beer consumers embrace online review platforms, such as RateBeer (ZX Ventures, Anheuser-Busch InBev SA/NV) and BeerAdvocate (Next Glass, inc.). In this way, the beer community provides massive data sets of beer flavor and appreciation scores, creating extraordinarily large sensory databases to complement the analyses of our professional sensory panel. Specifically, we characterize over 200 chemical properties of 250 commercial beers, spread across 22 beer styles, and link these to the descriptive sensory profiling data of a 16-person in-house trained tasting panel and data acquired from over 180,000 public consumer reviews. These unique and extensive datasets enable us to train a suite of machine learning models to predict flavor and appreciation from a beer’s chemical profile. Dissection of the best-performing models allows us to pinpoint specific compounds as potential drivers of beer flavor and appreciation. Follow-up experiments confirm the importance of these compounds and ultimately allow us to significantly improve the flavor and appreciation of selected commercial beers. Together, our study represents a significant step towards understanding complex flavors and reinforces the value of machine learning to develop and refine complex foods. In this way, it represents a stepping stone for further computer-aided food engineering applications 46 .
To generate a comprehensive dataset on beer flavor, we selected 250 commercial Belgian beers across 22 different beer styles (Supplementary Fig. S1 ). Beers with ≤ 4.2% alcohol by volume (ABV) were classified as non-alcoholic and low-alcoholic. Blonds and Tripels constitute a significant portion of the dataset (12.4% and 11.2%, respectively) reflecting their presence on the Belgian beer market and the heterogeneity of beers within these styles. By contrast, lager beers are less diverse and dominated by a handful of brands. Rare styles such as Brut or Faro make up only a small fraction of the dataset (2% and 1%, respectively) because fewer of these beers are produced and because they are dominated by distinct characteristics in terms of flavor and chemical composition.
Extensive analysis identifies relationships between chemical compounds in beer
For each beer, we measured 226 different chemical properties, including common brewing parameters such as alcohol content, iso-alpha acids, pH, sugar concentration 47 , and over 200 flavor compounds (Methods, Supplementary Table S1 ). A large portion (37.2%) are terpenoids arising from hopping, responsible for herbal and fruity flavors 16 , 48 . A second major category are yeast metabolites, such as esters and alcohols, that result in fruity and solvent notes 48 , 49 , 50 . Other measured compounds are primarily derived from malt, or other microbes such as non- Saccharomyces yeasts and bacteria (‘wild flora’). Compounds that arise from spices or staling are labeled under ‘Others’. Five attributes (caloric value, total acids and total ester, hop aroma and sulfur compounds) are calculated from multiple individually measured compounds.
As a first step in identifying relationships between chemical properties, we determined correlations between the concentrations of the compounds (Fig. 1 , upper panel, Supplementary Data 1 and 2 , and Supplementary Fig. S2 . For the sake of clarity, only a subset of the measured compounds is shown in Fig. 1 ). Compounds of the same origin typically show a positive correlation, while absence of correlation hints at parameters varying independently. For example, the hop aroma compounds citronellol, and alpha-terpineol show moderate correlations with each other (Spearman’s rho=0.39 and 0.57), but not with the bittering hop component iso-alpha acids (Spearman’s rho=0.16 and −0.07). This illustrates how brewers can independently modify hop aroma and bitterness by selecting hop varieties and dosage time. If hops are added early in the boiling phase, chemical conversions increase bitterness while aromas evaporate, conversely, late addition of hops preserves aroma but limits bitterness 51 . Similarly, hop-derived iso-alpha acids show a strong anti-correlation with lactic acid and acetic acid, likely reflecting growth inhibition of lactic acid and acetic acid bacteria, or the consequent use of fewer hops in sour beer styles, such as West Flanders ales and Fruit beers, that rely on these bacteria for their distinct flavors 52 . Finally, yeast-derived esters (ethyl acetate, ethyl decanoate, ethyl hexanoate, ethyl octanoate) and alcohols (ethanol, isoamyl alcohol, isobutanol, and glycerol), correlate with Spearman coefficients above 0.5, suggesting that these secondary metabolites are correlated with the yeast genetic background and/or fermentation parameters and may be difficult to influence individually, although the choice of yeast strain may offer some control 53 .

Spearman rank correlations are shown. Descriptors are grouped according to their origin (malt (blue), hops (green), yeast (red), wild flora (yellow), Others (black)), and sensory aspect (aroma, taste, palate, and overall appreciation). Please note that for the chemical compounds, for the sake of clarity, only a subset of the total number of measured compounds is shown, with an emphasis on the key compounds for each source. For more details, see the main text and Methods section. Chemical data can be found in Supplementary Data 1 , correlations between all chemical compounds are depicted in Supplementary Fig. S2 and correlation values can be found in Supplementary Data 2 . See Supplementary Data 4 for sensory panel assessments and Supplementary Data 5 for correlation values between all sensory descriptors.
Interestingly, different beer styles show distinct patterns for some flavor compounds (Supplementary Fig. S3 ). These observations agree with expectations for key beer styles, and serve as a control for our measurements. For instance, Stouts generally show high values for color (darker), while hoppy beers contain elevated levels of iso-alpha acids, compounds associated with bitter hop taste. Acetic and lactic acid are not prevalent in most beers, with notable exceptions such as Kriek, Lambic, Faro, West Flanders ales and Flanders Old Brown, which use acid-producing bacteria ( Lactobacillus and Pediococcus ) or unconventional yeast ( Brettanomyces ) 54 , 55 . Glycerol, ethanol and esters show similar distributions across all beer styles, reflecting their common origin as products of yeast metabolism during fermentation 45 , 53 . Finally, low/no-alcohol beers contain low concentrations of glycerol and esters. This is in line with the production process for most of the low/no-alcohol beers in our dataset, which are produced through limiting fermentation or by stripping away alcohol via evaporation or dialysis, with both methods having the unintended side-effect of reducing the amount of flavor compounds in the final beer 56 , 57 .
Besides expected associations, our data also reveals less trivial associations between beer styles and specific parameters. For example, geraniol and citronellol, two monoterpenoids responsible for citrus, floral and rose flavors and characteristic of Citra hops, are found in relatively high amounts in Christmas, Saison, and Brett/co-fermented beers, where they may originate from terpenoid-rich spices such as coriander seeds instead of hops 58 .
Tasting panel assessments reveal sensorial relationships in beer
To assess the sensory profile of each beer, a trained tasting panel evaluated each of the 250 beers for 50 sensory attributes, including different hop, malt and yeast flavors, off-flavors and spices. Panelists used a tasting sheet (Supplementary Data 3 ) to score the different attributes. Panel consistency was evaluated by repeating 12 samples across different sessions and performing ANOVA. In 95% of cases no significant difference was found across sessions ( p > 0.05), indicating good panel consistency (Supplementary Table S2 ).
Aroma and taste perception reported by the trained panel are often linked (Fig. 1 , bottom left panel and Supplementary Data 4 and 5 ), with high correlations between hops aroma and taste (Spearman’s rho=0.83). Bitter taste was found to correlate with hop aroma and taste in general (Spearman’s rho=0.80 and 0.69), and particularly with “grassy” noble hops (Spearman’s rho=0.75). Barnyard flavor, most often associated with sour beers, is identified together with stale hops (Spearman’s rho=0.97) that are used in these beers. Lactic and acetic acid, which often co-occur, are correlated (Spearman’s rho=0.66). Interestingly, sweetness and bitterness are anti-correlated (Spearman’s rho = −0.48), confirming the hypothesis that they mask each other 59 , 60 . Beer body is highly correlated with alcohol (Spearman’s rho = 0.79), and overall appreciation is found to correlate with multiple aspects that describe beer mouthfeel (alcohol, carbonation; Spearman’s rho= 0.32, 0.39), as well as with hop and ester aroma intensity (Spearman’s rho=0.39 and 0.35).
Similar to the chemical analyses, sensorial analyses confirmed typical features of specific beer styles (Supplementary Fig. S4 ). For example, sour beers (Faro, Flanders Old Brown, Fruit beer, Kriek, Lambic, West Flanders ale) were rated acidic, with flavors of both acetic and lactic acid. Hoppy beers were found to be bitter and showed hop-associated aromas like citrus and tropical fruit. Malt taste is most detected among scotch, stout/porters, and strong ales, while low/no-alcohol beers, which often have a reputation for being ‘worty’ (reminiscent of unfermented, sweet malt extract) appear in the middle. Unsurprisingly, hop aromas are most strongly detected among hoppy beers. Like its chemical counterpart (Supplementary Fig. S3 ), acidity shows a right-skewed distribution, with the most acidic beers being Krieks, Lambics, and West Flanders ales.
Tasting panel assessments of specific flavors correlate with chemical composition
We find that the concentrations of several chemical compounds strongly correlate with specific aroma or taste, as evaluated by the tasting panel (Fig. 2 , Supplementary Fig. S5 , Supplementary Data 6 ). In some cases, these correlations confirm expectations and serve as a useful control for data quality. For example, iso-alpha acids, the bittering compounds in hops, strongly correlate with bitterness (Spearman’s rho=0.68), while ethanol and glycerol correlate with tasters’ perceptions of alcohol and body, the mouthfeel sensation of fullness (Spearman’s rho=0.82/0.62 and 0.72/0.57 respectively) and darker color from roasted malts is a good indication of malt perception (Spearman’s rho=0.54).

Heatmap colors indicate Spearman’s Rho. Axes are organized according to sensory categories (aroma, taste, mouthfeel, overall), chemical categories and chemical sources in beer (malt (blue), hops (green), yeast (red), wild flora (yellow), Others (black)). See Supplementary Data 6 for all correlation values.
Interestingly, for some relationships between chemical compounds and perceived flavor, correlations are weaker than expected. For example, the rose-smelling phenethyl acetate only weakly correlates with floral aroma. This hints at more complex relationships and interactions between compounds and suggests a need for a more complex model than simple correlations. Lastly, we uncovered unexpected correlations. For instance, the esters ethyl decanoate and ethyl octanoate appear to correlate slightly with hop perception and bitterness, possibly due to their fruity flavor. Iron is anti-correlated with hop aromas and bitterness, most likely because it is also anti-correlated with iso-alpha acids. This could be a sign of metal chelation of hop acids 61 , given that our analyses measure unbound hop acids and total iron content, or could result from the higher iron content in dark and Fruit beers, which typically have less hoppy and bitter flavors 62 .
Public consumer reviews complement expert panel data
To complement and expand the sensory data of our trained tasting panel, we collected 180,000 reviews of our 250 beers from the online consumer review platform RateBeer. This provided numerical scores for beer appearance, aroma, taste, palate, overall quality as well as the average overall score.
Public datasets are known to suffer from biases, such as price, cult status and psychological conformity towards previous ratings of a product. For example, prices correlate with appreciation scores for these online consumer reviews (rho=0.49, Supplementary Fig. S6 ), but not for our trained tasting panel (rho=0.19). This suggests that prices affect consumer appreciation, which has been reported in wine 63 , while blind tastings are unaffected. Moreover, we observe that some beer styles, like lagers and non-alcoholic beers, generally receive lower scores, reflecting that online reviewers are mostly beer aficionados with a preference for specialty beers over lager beers. In general, we find a modest correlation between our trained panel’s overall appreciation score and the online consumer appreciation scores (Fig. 3 , rho=0.29). Apart from the aforementioned biases in the online datasets, serving temperature, sample freshness and surroundings, which are all tightly controlled during the tasting panel sessions, can vary tremendously across online consumers and can further contribute to (among others, appreciation) differences between the two categories of tasters. Importantly, in contrast to the overall appreciation scores, for many sensory aspects the results from the professional panel correlated well with results obtained from RateBeer reviews. Correlations were highest for features that are relatively easy to recognize even for untrained tasters, like bitterness, sweetness, alcohol and malt aroma (Fig. 3 and below).

RateBeer text mining results can be found in Supplementary Data 7 . Rho values shown are Spearman correlation values, with asterisks indicating significant correlations ( p < 0.05, two-sided). All p values were smaller than 0.001, except for Esters aroma (0.0553), Esters taste (0.3275), Esters aroma—banana (0.0019), Coriander (0.0508) and Diacetyl (0.0134).
Besides collecting consumer appreciation from these online reviews, we developed automated text analysis tools to gather additional data from review texts (Supplementary Data 7 ). Processing review texts on the RateBeer database yielded comparable results to the scores given by the trained panel for many common sensory aspects, including acidity, bitterness, sweetness, alcohol, malt, and hop tastes (Fig. 3 ). This is in line with what would be expected, since these attributes require less training for accurate assessment and are less influenced by environmental factors such as temperature, serving glass and odors in the environment. Consumer reviews also correlate well with our trained panel for 4-vinyl guaiacol, a compound associated with a very characteristic aroma. By contrast, correlations for more specific aromas like ester, coriander or diacetyl are underrepresented in the online reviews, underscoring the importance of using a trained tasting panel and standardized tasting sheets with explicit factors to be scored for evaluating specific aspects of a beer. Taken together, our results suggest that public reviews are trustworthy for some, but not all, flavor features and can complement or substitute taste panel data for these sensory aspects.
Models can predict beer sensory profiles from chemical data
The rich datasets of chemical analyses, tasting panel assessments and public reviews gathered in the first part of this study provided us with a unique opportunity to develop predictive models that link chemical data to sensorial features. Given the complexity of beer flavor, basic statistical tools such as correlations or linear regression may not always be the most suitable for making accurate predictions. Instead, we applied different machine learning models that can model both simple linear and complex interactive relationships. Specifically, we constructed a set of regression models to predict (a) trained panel scores for beer flavor and quality and (b) public reviews’ appreciation scores from beer chemical profiles. We trained and tested 10 different models (Methods), 3 linear regression-based models (simple linear regression with first-order interactions (LR), lasso regression with first-order interactions (Lasso), partial least squares regressor (PLSR)), 5 decision tree models (AdaBoost regressor (ABR), extra trees (ET), gradient boosting regressor (GBR), random forest (RF) and XGBoost regressor (XGBR)), 1 support vector regression (SVR), and 1 artificial neural network (ANN) model.
To compare the performance of our machine learning models, the dataset was randomly split into a training and test set, stratified by beer style. After a model was trained on data in the training set, its performance was evaluated on its ability to predict the test dataset obtained from multi-output models (based on the coefficient of determination, see Methods). Additionally, individual-attribute models were ranked per descriptor and the average rank was calculated, as proposed by Korneva et al. 64 . Importantly, both ways of evaluating the models’ performance agreed in general. Performance of the different models varied (Table 1 ). It should be noted that all models perform better at predicting RateBeer results than results from our trained tasting panel. One reason could be that sensory data is inherently variable, and this variability is averaged out with the large number of public reviews from RateBeer. Additionally, all tree-based models perform better at predicting taste than aroma. Linear models (LR) performed particularly poorly, with negative R 2 values, due to severe overfitting (training set R 2 = 1). Overfitting is a common issue in linear models with many parameters and limited samples, especially with interaction terms further amplifying the number of parameters. L1 regularization (Lasso) successfully overcomes this overfitting, out-competing multiple tree-based models on the RateBeer dataset. Similarly, the dimensionality reduction of PLSR avoids overfitting and improves performance, to some extent. Still, tree-based models (ABR, ET, GBR, RF and XGBR) show the best performance, out-competing the linear models (LR, Lasso, PLSR) commonly used in sensory science 65 .
GBR models showed the best overall performance in predicting sensory responses from chemical information, with R 2 values up to 0.75 depending on the predicted sensory feature (Supplementary Table S4 ). The GBR models predict consumer appreciation (RateBeer) better than our trained panel’s appreciation (R 2 value of 0.67 compared to R 2 value of 0.09) (Supplementary Table S3 and Supplementary Table S4 ). ANN models showed intermediate performance, likely because neural networks typically perform best with larger datasets 66 . The SVR shows intermediate performance, mostly due to the weak predictions of specific attributes that lower the overall performance (Supplementary Table S4 ).
Model dissection identifies specific, unexpected compounds as drivers of consumer appreciation
Next, we leveraged our models to infer important contributors to sensory perception and consumer appreciation. Consumer preference is a crucial sensory aspects, because a product that shows low consumer appreciation scores often does not succeed commercially 25 . Additionally, the requirement for a large number of representative evaluators makes consumer trials one of the more costly and time-consuming aspects of product development. Hence, a model for predicting chemical drivers of overall appreciation would be a welcome addition to the available toolbox for food development and optimization.
Since GBR models on our RateBeer dataset showed the best overall performance, we focused on these models. Specifically, we used two approaches to identify important contributors. First, rankings of the most important predictors for each sensorial trait in the GBR models were obtained based on impurity-based feature importance (mean decrease in impurity). High-ranked parameters were hypothesized to be either the true causal chemical properties underlying the trait, to correlate with the actual causal properties, or to take part in sensory interactions affecting the trait 67 (Fig. 4A ). In a second approach, we used SHAP 68 to determine which parameters contributed most to the model for making predictions of consumer appreciation (Fig. 4B ). SHAP calculates parameter contributions to model predictions on a per-sample basis, which can be aggregated into an importance score.

A The impurity-based feature importance (mean deviance in impurity, MDI) calculated from the Gradient Boosting Regression (GBR) model predicting RateBeer appreciation scores. The top 15 highest ranked chemical properties are shown. B SHAP summary plot for the top 15 parameters contributing to our GBR model. Each point on the graph represents a sample from our dataset. The color represents the concentration of that parameter, with bluer colors representing low values and redder colors representing higher values. Greater absolute values on the horizontal axis indicate a higher impact of the parameter on the prediction of the model. C Spearman correlations between the 15 most important chemical properties and consumer overall appreciation. Numbers indicate the Spearman Rho correlation coefficient, and the rank of this correlation compared to all other correlations. The top 15 important compounds were determined using SHAP (panel B).
Both approaches identified ethyl acetate as the most predictive parameter for beer appreciation (Fig. 4 ). Ethyl acetate is the most abundant ester in beer with a typical ‘fruity’, ‘solvent’ and ‘alcoholic’ flavor, but is often considered less important than other esters like isoamyl acetate. The second most important parameter identified by SHAP is ethanol, the most abundant beer compound after water. Apart from directly contributing to beer flavor and mouthfeel, ethanol drastically influences the physical properties of beer, dictating how easily volatile compounds escape the beer matrix to contribute to beer aroma 69 . Importantly, it should also be noted that the importance of ethanol for appreciation is likely inflated by the very low appreciation scores of non-alcoholic beers (Supplementary Fig. S4 ). Despite not often being considered a driver of beer appreciation, protein level also ranks highly in both approaches, possibly due to its effect on mouthfeel and body 70 . Lactic acid, which contributes to the tart taste of sour beers, is the fourth most important parameter identified by SHAP, possibly due to the generally high appreciation of sour beers in our dataset.
Interestingly, some of the most important predictive parameters for our model are not well-established as beer flavors or are even commonly regarded as being negative for beer quality. For example, our models identify methanethiol and ethyl phenyl acetate, an ester commonly linked to beer staling 71 , as a key factor contributing to beer appreciation. Although there is no doubt that high concentrations of these compounds are considered unpleasant, the positive effects of modest concentrations are not yet known 72 , 73 .
To compare our approach to conventional statistics, we evaluated how well the 15 most important SHAP-derived parameters correlate with consumer appreciation (Fig. 4C ). Interestingly, only 6 of the properties derived by SHAP rank amongst the top 15 most correlated parameters. For some chemical compounds, the correlations are so low that they would have likely been considered unimportant. For example, lactic acid, the fourth most important parameter, shows a bimodal distribution for appreciation, with sour beers forming a separate cluster, that is missed entirely by the Spearman correlation. Additionally, the correlation plots reveal outliers, emphasizing the need for robust analysis tools. Together, this highlights the need for alternative models, like the Gradient Boosting model, that better grasp the complexity of (beer) flavor.
Finally, to observe the relationships between these chemical properties and their predicted targets, partial dependence plots were constructed for the six most important predictors of consumer appreciation 74 , 75 , 76 (Supplementary Fig. S7 ). One-way partial dependence plots show how a change in concentration affects the predicted appreciation. These plots reveal an important limitation of our models: appreciation predictions remain constant at ever-increasing concentrations. This implies that once a threshold concentration is reached, further increasing the concentration does not affect appreciation. This is false, as it is well-documented that certain compounds become unpleasant at high concentrations, including ethyl acetate (‘nail polish’) 77 and methanethiol (‘sulfury’ and ‘rotten cabbage’) 78 . The inability of our models to grasp that flavor compounds have optimal levels, above which they become negative, is a consequence of working with commercial beer brands where (off-)flavors are rarely too high to negatively impact the product. The two-way partial dependence plots show how changing the concentration of two compounds influences predicted appreciation, visualizing their interactions (Supplementary Fig. S7 ). In our case, the top 5 parameters are dominated by additive or synergistic interactions, with high concentrations for both compounds resulting in the highest predicted appreciation.
To assess the robustness of our best-performing models and model predictions, we performed 100 iterations of the GBR, RF and ET models. In general, all iterations of the models yielded similar performance (Supplementary Fig. S8 ). Moreover, the main predictors (including the top predictors ethanol and ethyl acetate) remained virtually the same, especially for GBR and RF. For the iterations of the ET model, we did observe more variation in the top predictors, which is likely a consequence of the model’s inherent random architecture in combination with co-correlations between certain predictors. However, even in this case, several of the top predictors (ethanol and ethyl acetate) remain unchanged, although their rank in importance changes (Supplementary Fig. S8 ).
Next, we investigated if a combination of RateBeer and trained panel data into one consolidated dataset would lead to stronger models, under the hypothesis that such a model would suffer less from bias in the datasets. A GBR model was trained to predict appreciation on the combined dataset. This model underperformed compared to the RateBeer model, both in the native case and when including a dataset identifier (R 2 = 0.67, 0.26 and 0.42 respectively). For the latter, the dataset identifier is the most important feature (Supplementary Fig. S9 ), while most of the feature importance remains unchanged, with ethyl acetate and ethanol ranking highest, like in the original model trained only on RateBeer data. It seems that the large variation in the panel dataset introduces noise, weakening the models’ performances and reliability. In addition, it seems reasonable to assume that both datasets are fundamentally different, with the panel dataset obtained by blind tastings by a trained professional panel.
Lastly, we evaluated whether beer style identifiers would further enhance the model’s performance. A GBR model was trained with parameters that explicitly encoded the styles of the samples. This did not improve model performance (R2 = 0.66 with style information vs R2 = 0.67). The most important chemical features are consistent with the model trained without style information (eg. ethanol and ethyl acetate), and with the exception of the most preferred (strong ale) and least preferred (low/no-alcohol) styles, none of the styles were among the most important features (Supplementary Fig. S9 , Supplementary Table S5 and S6 ). This is likely due to a combination of style-specific chemical signatures, such as iso-alpha acids and lactic acid, that implicitly convey style information to the original models, as well as the low number of samples belonging to some styles, making it difficult for the model to learn style-specific patterns. Moreover, beer styles are not rigorously defined, with some styles overlapping in features and some beers being misattributed to a specific style, all of which leads to more noise in models that use style parameters.
Model validation
To test if our predictive models give insight into beer appreciation, we set up experiments aimed at improving existing commercial beers. We specifically selected overall appreciation as the trait to be examined because of its complexity and commercial relevance. Beer flavor comprises a complex bouquet rather than single aromas and tastes 53 . Hence, adding a single compound to the extent that a difference is noticeable may lead to an unbalanced, artificial flavor. Therefore, we evaluated the effect of combinations of compounds. Because Blond beers represent the most extensive style in our dataset, we selected a beer from this style as the starting material for these experiments (Beer 64 in Supplementary Data 1 ).
In the first set of experiments, we adjusted the concentrations of compounds that made up the most important predictors of overall appreciation (ethyl acetate, ethanol, lactic acid, ethyl phenyl acetate) together with correlated compounds (ethyl hexanoate, isoamyl acetate, glycerol), bringing them up to 95 th percentile ethanol-normalized concentrations (Methods) within the Blond group (‘Spiked’ concentration in Fig. 5A ). Compared to controls, the spiked beers were found to have significantly improved overall appreciation among trained panelists, with panelist noting increased intensity of ester flavors, sweetness, alcohol, and body fullness (Fig. 5B ). To disentangle the contribution of ethanol to these results, a second experiment was performed without the addition of ethanol. This resulted in a similar outcome, including increased perception of alcohol and overall appreciation.

Adding the top chemical compounds, identified as best predictors of appreciation by our model, into poorly appreciated beers results in increased appreciation from our trained panel. Results of sensory tests between base beers and those spiked with compounds identified as the best predictors by the model. A Blond and Non/Low-alcohol (0.0% ABV) base beers were brought up to 95th-percentile ethanol-normalized concentrations within each style. B For each sensory attribute, tasters indicated the more intense sample and selected the sample they preferred. The numbers above the bars correspond to the p values that indicate significant changes in perceived flavor (two-sided binomial test: alpha 0.05, n = 20 or 13).
In a last experiment, we tested whether using the model’s predictions can boost the appreciation of a non-alcoholic beer (beer 223 in Supplementary Data 1 ). Again, the addition of a mixture of predicted compounds (omitting ethanol, in this case) resulted in a significant increase in appreciation, body, ester flavor and sweetness.
Predicting flavor and consumer appreciation from chemical composition is one of the ultimate goals of sensory science. A reliable, systematic and unbiased way to link chemical profiles to flavor and food appreciation would be a significant asset to the food and beverage industry. Such tools would substantially aid in quality control and recipe development, offer an efficient and cost-effective alternative to pilot studies and consumer trials and would ultimately allow food manufacturers to produce superior, tailor-made products that better meet the demands of specific consumer groups more efficiently.
A limited set of studies have previously tried, to varying degrees of success, to predict beer flavor and beer popularity based on (a limited set of) chemical compounds and flavors 79 , 80 . Current sensitive, high-throughput technologies allow measuring an unprecedented number of chemical compounds and properties in a large set of samples, yielding a dataset that can train models that help close the gaps between chemistry and flavor, even for a complex natural product like beer. To our knowledge, no previous research gathered data at this scale (250 samples, 226 chemical parameters, 50 sensory attributes and 5 consumer scores) to disentangle and validate the chemical aspects driving beer preference using various machine-learning techniques. We find that modern machine learning models outperform conventional statistical tools, such as correlations and linear models, and can successfully predict flavor appreciation from chemical composition. This could be attributed to the natural incorporation of interactions and non-linear or discontinuous effects in machine learning models, which are not easily grasped by the linear model architecture. While linear models and partial least squares regression represent the most widespread statistical approaches in sensory science, in part because they allow interpretation 65 , 81 , 82 , modern machine learning methods allow for building better predictive models while preserving the possibility to dissect and exploit the underlying patterns. Of the 10 different models we trained, tree-based models, such as our best performing GBR, showed the best overall performance in predicting sensory responses from chemical information, outcompeting artificial neural networks. This agrees with previous reports for models trained on tabular data 83 . Our results are in line with the findings of Colantonio et al. who also identified the gradient boosting architecture as performing best at predicting appreciation and flavor (of tomatoes and blueberries, in their specific study) 26 . Importantly, besides our larger experimental scale, we were able to directly confirm our models’ predictions in vivo.
Our study confirms that flavor compound concentration does not always correlate with perception, suggesting complex interactions that are often missed by more conventional statistics and simple models. Specifically, we find that tree-based algorithms may perform best in developing models that link complex food chemistry with aroma. Furthermore, we show that massive datasets of untrained consumer reviews provide a valuable source of data, that can complement or even replace trained tasting panels, especially for appreciation and basic flavors, such as sweetness and bitterness. This holds despite biases that are known to occur in such datasets, such as price or conformity bias. Moreover, GBR models predict taste better than aroma. This is likely because taste (e.g. bitterness) often directly relates to the corresponding chemical measurements (e.g., iso-alpha acids), whereas such a link is less clear for aromas, which often result from the interplay between multiple volatile compounds. We also find that our models are best at predicting acidity and alcohol, likely because there is a direct relation between the measured chemical compounds (acids and ethanol) and the corresponding perceived sensorial attribute (acidity and alcohol), and because even untrained consumers are generally able to recognize these flavors and aromas.
The predictions of our final models, trained on review data, hold even for blind tastings with small groups of trained tasters, as demonstrated by our ability to validate specific compounds as drivers of beer flavor and appreciation. Since adding a single compound to the extent of a noticeable difference may result in an unbalanced flavor profile, we specifically tested our identified key drivers as a combination of compounds. While this approach does not allow us to validate if a particular single compound would affect flavor and/or appreciation, our experiments do show that this combination of compounds increases consumer appreciation.
It is important to stress that, while it represents an important step forward, our approach still has several major limitations. A key weakness of the GBR model architecture is that amongst co-correlating variables, the largest main effect is consistently preferred for model building. As a result, co-correlating variables often have artificially low importance scores, both for impurity and SHAP-based methods, like we observed in the comparison to the more randomized Extra Trees models. This implies that chemicals identified as key drivers of a specific sensory feature by GBR might not be the true causative compounds, but rather co-correlate with the actual causative chemical. For example, the high importance of ethyl acetate could be (partially) attributed to the total ester content, ethanol or ethyl hexanoate (rho=0.77, rho=0.72 and rho=0.68), while ethyl phenylacetate could hide the importance of prenyl isobutyrate and ethyl benzoate (rho=0.77 and rho=0.76). Expanding our GBR model to include beer style as a parameter did not yield additional power or insight. This is likely due to style-specific chemical signatures, such as iso-alpha acids and lactic acid, that implicitly convey style information to the original model, as well as the smaller sample size per style, limiting the power to uncover style-specific patterns. This can be partly attributed to the curse of dimensionality, where the high number of parameters results in the models mainly incorporating single parameter effects, rather than complex interactions such as style-dependent effects 67 . A larger number of samples may overcome some of these limitations and offer more insight into style-specific effects. On the other hand, beer style is not a rigid scientific classification, and beers within one style often differ a lot, which further complicates the analysis of style as a model factor.
Our study is limited to beers from Belgian breweries. Although these beers cover a large portion of the beer styles available globally, some beer styles and consumer patterns may be missing, while other features might be overrepresented. For example, many Belgian ales exhibit yeast-driven flavor profiles, which is reflected in the chemical drivers of appreciation discovered by this study. In future work, expanding the scope to include diverse markets and beer styles could lead to the identification of even more drivers of appreciation and better models for special niche products that were not present in our beer set.
In addition to inherent limitations of GBR models, there are also some limitations associated with studying food aroma. Even if our chemical analyses measured most of the known aroma compounds, the total number of flavor compounds in complex foods like beer is still larger than the subset we were able to measure in this study. For example, hop-derived thiols, that influence flavor at very low concentrations, are notoriously difficult to measure in a high-throughput experiment. Moreover, consumer perception remains subjective and prone to biases that are difficult to avoid. It is also important to stress that the models are still immature and that more extensive datasets will be crucial for developing more complete models in the future. Besides more samples and parameters, our dataset does not include any demographic information about the tasters. Including such data could lead to better models that grasp external factors like age and culture. Another limitation is that our set of beers consists of high-quality end-products and lacks beers that are unfit for sale, which limits the current model in accurately predicting products that are appreciated very badly. Finally, while models could be readily applied in quality control, their use in sensory science and product development is restrained by their inability to discern causal relationships. Given that the models cannot distinguish compounds that genuinely drive consumer perception from those that merely correlate, validation experiments are essential to identify true causative compounds.
Despite the inherent limitations, dissection of our models enabled us to pinpoint specific molecules as potential drivers of beer aroma and consumer appreciation, including compounds that were unexpected and would not have been identified using standard approaches. Important drivers of beer appreciation uncovered by our models include protein levels, ethyl acetate, ethyl phenyl acetate and lactic acid. Currently, many brewers already use lactic acid to acidify their brewing water and ensure optimal pH for enzymatic activity during the mashing process. Our results suggest that adding lactic acid can also improve beer appreciation, although its individual effect remains to be tested. Interestingly, ethanol appears to be unnecessary to improve beer appreciation, both for blond beer and alcohol-free beer. Given the growing consumer interest in alcohol-free beer, with a predicted annual market growth of >7% 84 , it is relevant for brewers to know what compounds can further increase consumer appreciation of these beers. Hence, our model may readily provide avenues to further improve the flavor and consumer appreciation of both alcoholic and non-alcoholic beers, which is generally considered one of the key challenges for future beer production.
Whereas we see a direct implementation of our results for the development of superior alcohol-free beverages and other food products, our study can also serve as a stepping stone for the development of novel alcohol-containing beverages. We want to echo the growing body of scientific evidence for the negative effects of alcohol consumption, both on the individual level by the mutagenic, teratogenic and carcinogenic effects of ethanol 85 , 86 , as well as the burden on society caused by alcohol abuse and addiction. We encourage the use of our results for the production of healthier, tastier products, including novel and improved beverages with lower alcohol contents. Furthermore, we strongly discourage the use of these technologies to improve the appreciation or addictive properties of harmful substances.
The present work demonstrates that despite some important remaining hurdles, combining the latest developments in chemical analyses, sensory analysis and modern machine learning methods offers exciting avenues for food chemistry and engineering. Soon, these tools may provide solutions in quality control and recipe development, as well as new approaches to sensory science and flavor research.
Beer selection
250 commercial Belgian beers were selected to cover the broad diversity of beer styles and corresponding diversity in chemical composition and aroma. See Supplementary Fig. S1 .
Chemical dataset
Sample preparation.
Beers within their expiration date were purchased from commercial retailers. Samples were prepared in biological duplicates at room temperature, unless explicitly stated otherwise. Bottle pressure was measured with a manual pressure device (Steinfurth Mess-Systeme GmbH) and used to calculate CO 2 concentration. The beer was poured through two filter papers (Macherey-Nagel, 500713032 MN 713 ¼) to remove carbon dioxide and prevent spontaneous foaming. Samples were then prepared for measurements by targeted Headspace-Gas Chromatography-Flame Ionization Detector/Flame Photometric Detector (HS-GC-FID/FPD), Headspace-Solid Phase Microextraction-Gas Chromatography-Mass Spectrometry (HS-SPME-GC-MS), colorimetric analysis, enzymatic analysis, Near-Infrared (NIR) analysis, as described in the sections below. The mean values of biological duplicates are reported for each compound.
HS-GC-FID/FPD
HS-GC-FID/FPD (Shimadzu GC 2010 Plus) was used to measure higher alcohols, acetaldehyde, esters, 4-vinyl guaicol, and sulfur compounds. Each measurement comprised 5 ml of sample pipetted into a 20 ml glass vial containing 1.75 g NaCl (VWR, 27810.295). 100 µl of 2-heptanol (Sigma-Aldrich, H3003) (internal standard) solution in ethanol (Fisher Chemical, E/0650DF/C17) was added for a final concentration of 2.44 mg/L. Samples were flushed with nitrogen for 10 s, sealed with a silicone septum, stored at −80 °C and analyzed in batches of 20.
The GC was equipped with a DB-WAXetr column (length, 30 m; internal diameter, 0.32 mm; layer thickness, 0.50 µm; Agilent Technologies, Santa Clara, CA, USA) to the FID and an HP-5 column (length, 30 m; internal diameter, 0.25 mm; layer thickness, 0.25 µm; Agilent Technologies, Santa Clara, CA, USA) to the FPD. N 2 was used as the carrier gas. Samples were incubated for 20 min at 70 °C in the headspace autosampler (Flow rate, 35 cm/s; Injection volume, 1000 µL; Injection mode, split; Combi PAL autosampler, CTC analytics, Switzerland). The injector, FID and FPD temperatures were kept at 250 °C. The GC oven temperature was first held at 50 °C for 5 min and then allowed to rise to 80 °C at a rate of 5 °C/min, followed by a second ramp of 4 °C/min until 200 °C kept for 3 min and a final ramp of (4 °C/min) until 230 °C for 1 min. Results were analyzed with the GCSolution software version 2.4 (Shimadzu, Kyoto, Japan). The GC was calibrated with a 5% EtOH solution (VWR International) containing the volatiles under study (Supplementary Table S7 ).
HS-SPME-GC-MS
HS-SPME-GC-MS (Shimadzu GCMS-QP-2010 Ultra) was used to measure additional volatile compounds, mainly comprising terpenoids and esters. Samples were analyzed by HS-SPME using a triphase DVB/Carboxen/PDMS 50/30 μm SPME fiber (Supelco Co., Bellefonte, PA, USA) followed by gas chromatography (Thermo Fisher Scientific Trace 1300 series, USA) coupled to a mass spectrometer (Thermo Fisher Scientific ISQ series MS) equipped with a TriPlus RSH autosampler. 5 ml of degassed beer sample was placed in 20 ml vials containing 1.75 g NaCl (VWR, 27810.295). 5 µl internal standard mix was added, containing 2-heptanol (1 g/L) (Sigma-Aldrich, H3003), 4-fluorobenzaldehyde (1 g/L) (Sigma-Aldrich, 128376), 2,3-hexanedione (1 g/L) (Sigma-Aldrich, 144169) and guaiacol (1 g/L) (Sigma-Aldrich, W253200) in ethanol (Fisher Chemical, E/0650DF/C17). Each sample was incubated at 60 °C in the autosampler oven with constant agitation. After 5 min equilibration, the SPME fiber was exposed to the sample headspace for 30 min. The compounds trapped on the fiber were thermally desorbed in the injection port of the chromatograph by heating the fiber for 15 min at 270 °C.
The GC-MS was equipped with a low polarity RXi-5Sil MS column (length, 20 m; internal diameter, 0.18 mm; layer thickness, 0.18 µm; Restek, Bellefonte, PA, USA). Injection was performed in splitless mode at 320 °C, a split flow of 9 ml/min, a purge flow of 5 ml/min and an open valve time of 3 min. To obtain a pulsed injection, a programmed gas flow was used whereby the helium gas flow was set at 2.7 mL/min for 0.1 min, followed by a decrease in flow of 20 ml/min to the normal 0.9 mL/min. The temperature was first held at 30 °C for 3 min and then allowed to rise to 80 °C at a rate of 7 °C/min, followed by a second ramp of 2 °C/min till 125 °C and a final ramp of 8 °C/min with a final temperature of 270 °C.
Mass acquisition range was 33 to 550 amu at a scan rate of 5 scans/s. Electron impact ionization energy was 70 eV. The interface and ion source were kept at 275 °C and 250 °C, respectively. A mix of linear n-alkanes (from C7 to C40, Supelco Co.) was injected into the GC-MS under identical conditions to serve as external retention index markers. Identification and quantification of the compounds were performed using an in-house developed R script as described in Goelen et al. and Reher et al. 87 , 88 (for package information, see Supplementary Table S8 ). Briefly, chromatograms were analyzed using AMDIS (v2.71) 89 to separate overlapping peaks and obtain pure compound spectra. The NIST MS Search software (v2.0 g) in combination with the NIST2017, FFNSC3 and Adams4 libraries were used to manually identify the empirical spectra, taking into account the expected retention time. After background subtraction and correcting for retention time shifts between samples run on different days based on alkane ladders, compound elution profiles were extracted and integrated using a file with 284 target compounds of interest, which were either recovered in our identified AMDIS list of spectra or were known to occur in beer. Compound elution profiles were estimated for every peak in every chromatogram over a time-restricted window using weighted non-negative least square analysis after which peak areas were integrated 87 , 88 . Batch effect correction was performed by normalizing against the most stable internal standard compound, 4-fluorobenzaldehyde. Out of all 284 target compounds that were analyzed, 167 were visually judged to have reliable elution profiles and were used for final analysis.
Discrete photometric and enzymatic analysis
Discrete photometric and enzymatic analysis (Thermo Scientific TM Gallery TM Plus Beermaster Discrete Analyzer) was used to measure acetic acid, ammonia, beta-glucan, iso-alpha acids, color, sugars, glycerol, iron, pH, protein, and sulfite. 2 ml of sample volume was used for the analyses. Information regarding the reagents and standard solutions used for analyses and calibrations is included in Supplementary Table S7 and Supplementary Table S9 .
NIR analyses
NIR analysis (Anton Paar Alcolyzer Beer ME System) was used to measure ethanol. Measurements comprised 50 ml of sample, and a 10% EtOH solution was used for calibration.
Correlation calculations
Pairwise Spearman Rank correlations were calculated between all chemical properties.
Sensory dataset
Trained panel.
Our trained tasting panel consisted of volunteers who gave prior verbal informed consent. All compounds used for the validation experiment were of food-grade quality. The tasting sessions were approved by the Social and Societal Ethics Committee of the KU Leuven (G-2022-5677-R2(MAR)). All online reviewers agreed to the Terms and Conditions of the RateBeer website.
Sensory analysis was performed according to the American Society of Brewing Chemists (ASBC) Sensory Analysis Methods 90 . 30 volunteers were screened through a series of triangle tests. The sixteen most sensitive and consistent tasters were retained as taste panel members. The resulting panel was diverse in age [22–42, mean: 29], sex [56% male] and nationality [7 different countries]. The panel developed a consensus vocabulary to describe beer aroma, taste and mouthfeel. Panelists were trained to identify and score 50 different attributes, using a 7-point scale to rate attributes’ intensity. The scoring sheet is included as Supplementary Data 3 . Sensory assessments took place between 10–12 a.m. The beers were served in black-colored glasses. Per session, between 5 and 12 beers of the same style were tasted at 12 °C to 16 °C. Two reference beers were added to each set and indicated as ‘Reference 1 & 2’, allowing panel members to calibrate their ratings. Not all panelists were present at every tasting. Scores were scaled by standard deviation and mean-centered per taster. Values are represented as z-scores and clustered by Euclidean distance. Pairwise Spearman correlations were calculated between taste and aroma sensory attributes. Panel consistency was evaluated by repeating samples on different sessions and performing ANOVA to identify differences, using the ‘stats’ package (v4.2.2) in R (for package information, see Supplementary Table S8 ).
Online reviews from a public database
The ‘scrapy’ package in Python (v3.6) (for package information, see Supplementary Table S8 ). was used to collect 232,288 online reviews (mean=922, min=6, max=5343) from RateBeer, an online beer review database. Each review entry comprised 5 numerical scores (appearance, aroma, taste, palate and overall quality) and an optional review text. The total number of reviews per reviewer was collected separately. Numerical scores were scaled and centered per rater, and mean scores were calculated per beer.
For the review texts, the language was estimated using the packages ‘langdetect’ and ‘langid’ in Python. Reviews that were classified as English by both packages were kept. Reviewers with fewer than 100 entries overall were discarded. 181,025 reviews from >6000 reviewers from >40 countries remained. Text processing was done using the ‘nltk’ package in Python. Texts were corrected for slang and misspellings; proper nouns and rare words that are relevant to the beer context were specified and kept as-is (‘Chimay’,’Lambic’, etc.). A dictionary of semantically similar sensorial terms, for example ‘floral’ and ‘flower’, was created and collapsed together into one term. Words were stemmed and lemmatized to avoid identifying words such as ‘acid’ and ‘acidity’ as separate terms. Numbers and punctuation were removed.
Sentences from up to 50 randomly chosen reviews per beer were manually categorized according to the aspect of beer they describe (appearance, aroma, taste, palate, overall quality—not to be confused with the 5 numerical scores described above) or flagged as irrelevant if they contained no useful information. If a beer contained fewer than 50 reviews, all reviews were manually classified. This labeled data set was used to train a model that classified the rest of the sentences for all beers 91 . Sentences describing taste and aroma were extracted, and term frequency–inverse document frequency (TFIDF) was implemented to calculate enrichment scores for sensorial words per beer.
The sex of the tasting subject was not considered when building our sensory database. Instead, results from different panelists were averaged, both for our trained panel (56% male, 44% female) and the RateBeer reviews (70% male, 30% female for RateBeer as a whole).
Beer price collection and processing
Beer prices were collected from the following stores: Colruyt, Delhaize, Total Wine, BeerHawk, The Belgian Beer Shop, The Belgian Shop, and Beer of Belgium. Where applicable, prices were converted to Euros and normalized per liter. Spearman correlations were calculated between these prices and mean overall appreciation scores from RateBeer and the taste panel, respectively.
Pairwise Spearman Rank correlations were calculated between all sensory properties.
Machine learning models
Predictive modeling of sensory profiles from chemical data.
Regression models were constructed to predict (a) trained panel scores for beer flavors and quality from beer chemical profiles and (b) public reviews’ appreciation scores from beer chemical profiles. Z-scores were used to represent sensory attributes in both data sets. Chemical properties with log-normal distributions (Shapiro-Wilk test, p < 0.05 ) were log-transformed. Missing chemical measurements (0.1% of all data) were replaced with mean values per attribute. Observations from 250 beers were randomly separated into a training set (70%, 175 beers) and a test set (30%, 75 beers), stratified per beer style. Chemical measurements (p = 231) were normalized based on the training set average and standard deviation. In total, three linear regression-based models: linear regression with first-order interaction terms (LR), lasso regression with first-order interaction terms (Lasso) and partial least squares regression (PLSR); five decision tree models, Adaboost regressor (ABR), Extra Trees (ET), Gradient Boosting regressor (GBR), Random Forest (RF) and XGBoost regressor (XGBR); one support vector machine model (SVR) and one artificial neural network model (ANN) were trained. The models were implemented using the ‘scikit-learn’ package (v1.2.2) and ‘xgboost’ package (v1.7.3) in Python (v3.9.16). Models were trained, and hyperparameters optimized, using five-fold cross-validated grid search with the coefficient of determination (R 2 ) as the evaluation metric. The ANN (scikit-learn’s MLPRegressor) was optimized using Bayesian Tree-Structured Parzen Estimator optimization with the ‘Optuna’ Python package (v3.2.0). Individual models were trained per attribute, and a multi-output model was trained on all attributes simultaneously.
Model dissection
GBR was found to outperform other methods, resulting in models with the highest average R 2 values in both trained panel and public review data sets. Impurity-based rankings of the most important predictors for each predicted sensorial trait were obtained using the ‘scikit-learn’ package. To observe the relationships between these chemical properties and their predicted targets, partial dependence plots (PDP) were constructed for the six most important predictors of consumer appreciation 74 , 75 .
The ‘SHAP’ package in Python (v0.41.0) was implemented to provide an alternative ranking of predictor importance and to visualize the predictors’ effects as a function of their concentration 68 .
Validation of causal chemical properties
To validate the effects of the most important model features on predicted sensory attributes, beers were spiked with the chemical compounds identified by the models and descriptive sensory analyses were carried out according to the American Society of Brewing Chemists (ASBC) protocol 90 .
Compound spiking was done 30 min before tasting. Compounds were spiked into fresh beer bottles, that were immediately resealed and inverted three times. Fresh bottles of beer were opened for the same duration, resealed, and inverted thrice, to serve as controls. Pairs of spiked samples and controls were served simultaneously, chilled and in dark glasses as outlined in the Trained panel section above. Tasters were instructed to select the glass with the higher flavor intensity for each attribute (directional difference test 92 ) and to select the glass they prefer.
The final concentration after spiking was equal to the within-style average, after normalizing by ethanol concentration. This was done to ensure balanced flavor profiles in the final spiked beer. The same methods were applied to improve a non-alcoholic beer. Compounds were the following: ethyl acetate (Merck KGaA, W241415), ethyl hexanoate (Merck KGaA, W243906), isoamyl acetate (Merck KGaA, W205508), phenethyl acetate (Merck KGaA, W285706), ethanol (96%, Colruyt), glycerol (Merck KGaA, W252506), lactic acid (Merck KGaA, 261106).
Significant differences in preference or perceived intensity were determined by performing the two-sided binomial test on each attribute.
Reporting summary
Further information on research design is available in the Nature Portfolio Reporting Summary linked to this article.
Data availability
The data that support the findings of this work are available in the Supplementary Data files and have been deposited to Zenodo under accession code 10653704 93 . The RateBeer scores data are under restricted access, they are not publicly available as they are property of RateBeer (ZX Ventures, USA). Access can be obtained from the authors upon reasonable request and with permission of RateBeer (ZX Ventures, USA). Source data are provided with this paper.
Code availability
The code for training the machine learning models, analyzing the models, and generating the figures has been deposited to Zenodo under accession code 10653704 93 .
Tieman, D. et al. A chemical genetic roadmap to improved tomato flavor. Science 355 , 391–394 (2017).
Article ADS CAS PubMed Google Scholar
Plutowska, B. & Wardencki, W. Application of gas chromatography–olfactometry (GC–O) in analysis and quality assessment of alcoholic beverages – A review. Food Chem. 107 , 449–463 (2008).
Article CAS Google Scholar
Legin, A., Rudnitskaya, A., Seleznev, B. & Vlasov, Y. Electronic tongue for quality assessment of ethanol, vodka and eau-de-vie. Anal. Chim. Acta 534 , 129–135 (2005).
Loutfi, A., Coradeschi, S., Mani, G. K., Shankar, P. & Rayappan, J. B. B. Electronic noses for food quality: A review. J. Food Eng. 144 , 103–111 (2015).
Ahn, Y.-Y., Ahnert, S. E., Bagrow, J. P. & Barabási, A.-L. Flavor network and the principles of food pairing. Sci. Rep. 1 , 196 (2011).
Article CAS PubMed PubMed Central Google Scholar
Bartoshuk, L. M. & Klee, H. J. Better fruits and vegetables through sensory analysis. Curr. Biol. 23 , R374–R378 (2013).
Article CAS PubMed Google Scholar
Piggott, J. R. Design questions in sensory and consumer science. Food Qual. Prefer. 3293 , 217–220 (1995).
Article Google Scholar
Kermit, M. & Lengard, V. Assessing the performance of a sensory panel-panellist monitoring and tracking. J. Chemom. 19 , 154–161 (2005).
Cook, D. J., Hollowood, T. A., Linforth, R. S. T. & Taylor, A. J. Correlating instrumental measurements of texture and flavour release with human perception. Int. J. Food Sci. Technol. 40 , 631–641 (2005).
Chinchanachokchai, S., Thontirawong, P. & Chinchanachokchai, P. A tale of two recommender systems: The moderating role of consumer expertise on artificial intelligence based product recommendations. J. Retail. Consum. Serv. 61 , 1–12 (2021).
Ross, C. F. Sensory science at the human-machine interface. Trends Food Sci. Technol. 20 , 63–72 (2009).
Chambers, E. IV & Koppel, K. Associations of volatile compounds with sensory aroma and flavor: The complex nature of flavor. Molecules 18 , 4887–4905 (2013).
Pinu, F. R. Metabolomics—The new frontier in food safety and quality research. Food Res. Int. 72 , 80–81 (2015).
Danezis, G. P., Tsagkaris, A. S., Brusic, V. & Georgiou, C. A. Food authentication: state of the art and prospects. Curr. Opin. Food Sci. 10 , 22–31 (2016).
Shepherd, G. M. Smell images and the flavour system in the human brain. Nature 444 , 316–321 (2006).
Meilgaard, M. C. Prediction of flavor differences between beers from their chemical composition. J. Agric. Food Chem. 30 , 1009–1017 (1982).
Xu, L. et al. Widespread receptor-driven modulation in peripheral olfactory coding. Science 368 , eaaz5390 (2020).
Kupferschmidt, K. Following the flavor. Science 340 , 808–809 (2013).
Billesbølle, C. B. et al. Structural basis of odorant recognition by a human odorant receptor. Nature 615 , 742–749 (2023).
Article ADS PubMed PubMed Central Google Scholar
Smith, B. Perspective: Complexities of flavour. Nature 486 , S6–S6 (2012).
Pfister, P. et al. Odorant receptor inhibition is fundamental to odor encoding. Curr. Biol. 30 , 2574–2587 (2020).
Moskowitz, H. W., Kumaraiah, V., Sharma, K. N., Jacobs, H. L. & Sharma, S. D. Cross-cultural differences in simple taste preferences. Science 190 , 1217–1218 (1975).
Eriksson, N. et al. A genetic variant near olfactory receptor genes influences cilantro preference. Flavour 1 , 22 (2012).
Ferdenzi, C. et al. Variability of affective responses to odors: Culture, gender, and olfactory knowledge. Chem. Senses 38 , 175–186 (2013).
Article PubMed Google Scholar
Lawless, H. T. & Heymann, H. Sensory evaluation of food: Principles and practices. (Springer, New York, NY). https://doi.org/10.1007/978-1-4419-6488-5 (2010).
Colantonio, V. et al. Metabolomic selection for enhanced fruit flavor. Proc. Natl. Acad. Sci. 119 , e2115865119 (2022).
Fritz, F., Preissner, R. & Banerjee, P. VirtualTaste: a web server for the prediction of organoleptic properties of chemical compounds. Nucleic Acids Res 49 , W679–W684 (2021).
Tuwani, R., Wadhwa, S. & Bagler, G. BitterSweet: Building machine learning models for predicting the bitter and sweet taste of small molecules. Sci. Rep. 9 , 1–13 (2019).
Dagan-Wiener, A. et al. Bitter or not? BitterPredict, a tool for predicting taste from chemical structure. Sci. Rep. 7 , 1–13 (2017).
Pallante, L. et al. Toward a general and interpretable umami taste predictor using a multi-objective machine learning approach. Sci. Rep. 12 , 1–11 (2022).
Malavolta, M. et al. A survey on computational taste predictors. Eur. Food Res. Technol. 248 , 2215–2235 (2022).
Lee, B. K. et al. A principal odor map unifies diverse tasks in olfactory perception. Science 381 , 999–1006 (2023).
Mayhew, E. J. et al. Transport features predict if a molecule is odorous. Proc. Natl. Acad. Sci. 119 , e2116576119 (2022).
Niu, Y. et al. Sensory evaluation of the synergism among ester odorants in light aroma-type liquor by odor threshold, aroma intensity and flash GC electronic nose. Food Res. Int. 113 , 102–114 (2018).
Yu, P., Low, M. Y. & Zhou, W. Design of experiments and regression modelling in food flavour and sensory analysis: A review. Trends Food Sci. Technol. 71 , 202–215 (2018).
Oladokun, O. et al. The impact of hop bitter acid and polyphenol profiles on the perceived bitterness of beer. Food Chem. 205 , 212–220 (2016).
Linforth, R., Cabannes, M., Hewson, L., Yang, N. & Taylor, A. Effect of fat content on flavor delivery during consumption: An in vivo model. J. Agric. Food Chem. 58 , 6905–6911 (2010).
Guo, S., Na Jom, K. & Ge, Y. Influence of roasting condition on flavor profile of sunflower seeds: A flavoromics approach. Sci. Rep. 9 , 11295 (2019).
Ren, Q. et al. The changes of microbial community and flavor compound in the fermentation process of Chinese rice wine using Fagopyrum tataricum grain as feedstock. Sci. Rep. 9 , 3365 (2019).
Hastie, T., Friedman, J. & Tibshirani, R. The Elements of Statistical Learning. (Springer, New York, NY). https://doi.org/10.1007/978-0-387-21606-5 (2001).
Dietz, C., Cook, D., Huismann, M., Wilson, C. & Ford, R. The multisensory perception of hop essential oil: a review. J. Inst. Brew. 126 , 320–342 (2020).
CAS Google Scholar
Roncoroni, Miguel & Verstrepen, Kevin Joan. Belgian Beer: Tested and Tasted. (Lannoo, 2018).
Meilgaard, M. Flavor chemistry of beer: Part II: Flavor and threshold of 239 aroma volatiles. in (1975).
Bokulich, N. A. & Bamforth, C. W. The microbiology of malting and brewing. Microbiol. Mol. Biol. Rev. MMBR 77 , 157–172 (2013).
Dzialo, M. C., Park, R., Steensels, J., Lievens, B. & Verstrepen, K. J. Physiology, ecology and industrial applications of aroma formation in yeast. FEMS Microbiol. Rev. 41 , S95–S128 (2017).
Article PubMed PubMed Central Google Scholar
Datta, A. et al. Computer-aided food engineering. Nat. Food 3 , 894–904 (2022).
American Society of Brewing Chemists. Beer Methods. (American Society of Brewing Chemists, St. Paul, MN, U.S.A.).
Olaniran, A. O., Hiralal, L., Mokoena, M. P. & Pillay, B. Flavour-active volatile compounds in beer: production, regulation and control. J. Inst. Brew. 123 , 13–23 (2017).
Verstrepen, K. J. et al. Flavor-active esters: Adding fruitiness to beer. J. Biosci. Bioeng. 96 , 110–118 (2003).
Meilgaard, M. C. Flavour chemistry of beer. part I: flavour interaction between principal volatiles. Master Brew. Assoc. Am. Tech. Q 12 , 107–117 (1975).
Briggs, D. E., Boulton, C. A., Brookes, P. A. & Stevens, R. Brewing 227–254. (Woodhead Publishing). https://doi.org/10.1533/9781855739062.227 (2004).
Bossaert, S., Crauwels, S., De Rouck, G. & Lievens, B. The power of sour - A review: Old traditions, new opportunities. BrewingScience 72 , 78–88 (2019).
Google Scholar
Verstrepen, K. J. et al. Flavor active esters: Adding fruitiness to beer. J. Biosci. Bioeng. 96 , 110–118 (2003).
Snauwaert, I. et al. Microbial diversity and metabolite composition of Belgian red-brown acidic ales. Int. J. Food Microbiol. 221 , 1–11 (2016).
Spitaels, F. et al. The microbial diversity of traditional spontaneously fermented lambic beer. PLoS ONE 9 , e95384 (2014).
Blanco, C. A., Andrés-Iglesias, C. & Montero, O. Low-alcohol Beers: Flavor Compounds, Defects, and Improvement Strategies. Crit. Rev. Food Sci. Nutr. 56 , 1379–1388 (2016).
Jackowski, M. & Trusek, A. Non-Alcohol. beer Prod. – Overv. 20 , 32–38 (2018).
Takoi, K. et al. The contribution of geraniol metabolism to the citrus flavour of beer: Synergy of geraniol and β-citronellol under coexistence with excess linalool. J. Inst. Brew. 116 , 251–260 (2010).
Kroeze, J. H. & Bartoshuk, L. M. Bitterness suppression as revealed by split-tongue taste stimulation in humans. Physiol. Behav. 35 , 779–783 (1985).
Mennella, J. A. et al. A spoonful of sugar helps the medicine go down”: Bitter masking bysucrose among children and adults. Chem. Senses 40 , 17–25 (2015).
Wietstock, P., Kunz, T., Perreira, F. & Methner, F.-J. Metal chelation behavior of hop acids in buffered model systems. BrewingScience 69 , 56–63 (2016).
Sancho, D., Blanco, C. A., Caballero, I. & Pascual, A. Free iron in pale, dark and alcohol-free commercial lager beers. J. Sci. Food Agric. 91 , 1142–1147 (2011).
Rodrigues, H. & Parr, W. V. Contribution of cross-cultural studies to understanding wine appreciation: A review. Food Res. Int. 115 , 251–258 (2019).
Korneva, E. & Blockeel, H. Towards better evaluation of multi-target regression models. in ECML PKDD 2020 Workshops (eds. Koprinska, I. et al.) 353–362 (Springer International Publishing, Cham, 2020). https://doi.org/10.1007/978-3-030-65965-3_23 .
Gastón Ares. Mathematical and Statistical Methods in Food Science and Technology. (Wiley, 2013).
Grinsztajn, L., Oyallon, E. & Varoquaux, G. Why do tree-based models still outperform deep learning on tabular data? Preprint at http://arxiv.org/abs/2207.08815 (2022).
Gries, S. T. Statistics for Linguistics with R: A Practical Introduction. in Statistics for Linguistics with R (De Gruyter Mouton, 2021). https://doi.org/10.1515/9783110718256 .
Lundberg, S. M. et al. From local explanations to global understanding with explainable AI for trees. Nat. Mach. Intell. 2 , 56–67 (2020).
Ickes, C. M. & Cadwallader, K. R. Effects of ethanol on flavor perception in alcoholic beverages. Chemosens. Percept. 10 , 119–134 (2017).
Kato, M. et al. Influence of high molecular weight polypeptides on the mouthfeel of commercial beer. J. Inst. Brew. 127 , 27–40 (2021).
Wauters, R. et al. Novel Saccharomyces cerevisiae variants slow down the accumulation of staling aldehydes and improve beer shelf-life. Food Chem. 398 , 1–11 (2023).
Li, H., Jia, S. & Zhang, W. Rapid determination of low-level sulfur compounds in beer by headspace gas chromatography with a pulsed flame photometric detector. J. Am. Soc. Brew. Chem. 66 , 188–191 (2008).
Dercksen, A., Laurens, J., Torline, P., Axcell, B. C. & Rohwer, E. Quantitative analysis of volatile sulfur compounds in beer using a membrane extraction interface. J. Am. Soc. Brew. Chem. 54 , 228–233 (1996).
Molnar, C. Interpretable Machine Learning: A Guide for Making Black-Box Models Interpretable. (2020).
Zhao, Q. & Hastie, T. Causal interpretations of black-box models. J. Bus. Econ. Stat. Publ. Am. Stat. Assoc. 39 , 272–281 (2019).
Article MathSciNet Google Scholar
Hastie, T., Tibshirani, R. & Friedman, J. The Elements of Statistical Learning. (Springer, 2019).
Labrado, D. et al. Identification by NMR of key compounds present in beer distillates and residual phases after dealcoholization by vacuum distillation. J. Sci. Food Agric. 100 , 3971–3978 (2020).
Lusk, L. T., Kay, S. B., Porubcan, A. & Ryder, D. S. Key olfactory cues for beer oxidation. J. Am. Soc. Brew. Chem. 70 , 257–261 (2012).
Gonzalez Viejo, C., Torrico, D. D., Dunshea, F. R. & Fuentes, S. Development of artificial neural network models to assess beer acceptability based on sensory properties using a robotic pourer: A comparative model approach to achieve an artificial intelligence system. Beverages 5 , 33 (2019).
Gonzalez Viejo, C., Fuentes, S., Torrico, D. D., Godbole, A. & Dunshea, F. R. Chemical characterization of aromas in beer and their effect on consumers liking. Food Chem. 293 , 479–485 (2019).
Gilbert, J. L. et al. Identifying breeding priorities for blueberry flavor using biochemical, sensory, and genotype by environment analyses. PLOS ONE 10 , 1–21 (2015).
Goulet, C. et al. Role of an esterase in flavor volatile variation within the tomato clade. Proc. Natl. Acad. Sci. 109 , 19009–19014 (2012).
Article ADS CAS PubMed PubMed Central Google Scholar
Borisov, V. et al. Deep Neural Networks and Tabular Data: A Survey. IEEE Trans. Neural Netw. Learn. Syst. 1–21 https://doi.org/10.1109/TNNLS.2022.3229161 (2022).
Statista. Statista Consumer Market Outlook: Beer - Worldwide.
Seitz, H. K. & Stickel, F. Molecular mechanisms of alcoholmediated carcinogenesis. Nat. Rev. Cancer 7 , 599–612 (2007).
Voordeckers, K. et al. Ethanol exposure increases mutation rate through error-prone polymerases. Nat. Commun. 11 , 3664 (2020).
Goelen, T. et al. Bacterial phylogeny predicts volatile organic compound composition and olfactory response of an aphid parasitoid. Oikos 129 , 1415–1428 (2020).
Article ADS Google Scholar
Reher, T. et al. Evaluation of hop (Humulus lupulus) as a repellent for the management of Drosophila suzukii. Crop Prot. 124 , 104839 (2019).
Stein, S. E. An integrated method for spectrum extraction and compound identification from gas chromatography/mass spectrometry data. J. Am. Soc. Mass Spectrom. 10 , 770–781 (1999).
American Society of Brewing Chemists. Sensory Analysis Methods. (American Society of Brewing Chemists, St. Paul, MN, U.S.A., 1992).
McAuley, J., Leskovec, J. & Jurafsky, D. Learning Attitudes and Attributes from Multi-Aspect Reviews. Preprint at https://doi.org/10.48550/arXiv.1210.3926 (2012).
Meilgaard, M. C., Carr, B. T. & Carr, B. T. Sensory Evaluation Techniques. (CRC Press, Boca Raton). https://doi.org/10.1201/b16452 (2014).
Schreurs, M. et al. Data from: Predicting and improving complex beer flavor through machine learning. Zenodo https://doi.org/10.5281/zenodo.10653704 (2024).
Download references
Acknowledgements
We thank all lab members for their discussions and thank all tasting panel members for their contributions. Special thanks go out to Dr. Karin Voordeckers for her tremendous help in proofreading and improving the manuscript. M.S. was supported by a Baillet-Latour fellowship, L.C. acknowledges financial support from KU Leuven (C16/17/006), F.A.T. was supported by a PhD fellowship from FWO (1S08821N). Research in the lab of K.J.V. is supported by KU Leuven, FWO, VIB, VLAIO and the Brewing Science Serves Health Fund. Research in the lab of T.W. is supported by FWO (G.0A51.15) and KU Leuven (C16/17/006).
Author information
These authors contributed equally: Michiel Schreurs, Supinya Piampongsant, Miguel Roncoroni.
Authors and Affiliations
VIB—KU Leuven Center for Microbiology, Gaston Geenslaan 1, B-3001, Leuven, Belgium
Michiel Schreurs, Supinya Piampongsant, Miguel Roncoroni, Lloyd Cool, Beatriz Herrera-Malaver, Florian A. Theßeling & Kevin J. Verstrepen
CMPG Laboratory of Genetics and Genomics, KU Leuven, Gaston Geenslaan 1, B-3001, Leuven, Belgium
Leuven Institute for Beer Research (LIBR), Gaston Geenslaan 1, B-3001, Leuven, Belgium
Laboratory of Socioecology and Social Evolution, KU Leuven, Naamsestraat 59, B-3000, Leuven, Belgium
Lloyd Cool, Christophe Vanderaa & Tom Wenseleers
VIB Bioinformatics Core, VIB, Rijvisschestraat 120, B-9052, Ghent, Belgium
Łukasz Kreft & Alexander Botzki
AB InBev SA/NV, Brouwerijplein 1, B-3000, Leuven, Belgium
Philippe Malcorps & Luk Daenen
You can also search for this author in PubMed Google Scholar
Contributions
S.P., M.S. and K.J.V. conceived the experiments. S.P., M.S. and K.J.V. designed the experiments. S.P., M.S., M.R., B.H. and F.A.T. performed the experiments. S.P., M.S., L.C., C.V., L.K., A.B., P.M., L.D., T.W. and K.J.V. contributed analysis ideas. S.P., M.S., L.C., C.V., T.W. and K.J.V. analyzed the data. All authors contributed to writing the manuscript.
Corresponding author
Correspondence to Kevin J. Verstrepen .
Ethics declarations
Competing interests.
K.J.V. is affiliated with bar.on. The other authors declare no competing interests.
Peer review
Peer review information.
Nature Communications thanks Florian Bauer, Andrew John Macintosh and the other, anonymous, reviewer(s) for their contribution to the peer review of this work. A peer review file is available.
Additional information
Publisher’s note Springer Nature remains neutral with regard to jurisdictional claims in published maps and institutional affiliations.
Supplementary information
Supplementary information, peer review file, description of additional supplementary files, supplementary data 1, supplementary data 2, supplementary data 3, supplementary data 4, supplementary data 5, supplementary data 6, supplementary data 7, reporting summary, source data, source data, rights and permissions.
Open Access This article is licensed under a Creative Commons Attribution 4.0 International License, which permits use, sharing, adaptation, distribution and reproduction in any medium or format, as long as you give appropriate credit to the original author(s) and the source, provide a link to the Creative Commons licence, and indicate if changes were made. The images or other third party material in this article are included in the article’s Creative Commons licence, unless indicated otherwise in a credit line to the material. If material is not included in the article’s Creative Commons licence and your intended use is not permitted by statutory regulation or exceeds the permitted use, you will need to obtain permission directly from the copyright holder. To view a copy of this licence, visit http://creativecommons.org/licenses/by/4.0/ .
Reprints and permissions
About this article
Cite this article.
Schreurs, M., Piampongsant, S., Roncoroni, M. et al. Predicting and improving complex beer flavor through machine learning. Nat Commun 15 , 2368 (2024). https://doi.org/10.1038/s41467-024-46346-0
Download citation
Received : 30 October 2023
Accepted : 21 February 2024
Published : 26 March 2024
DOI : https://doi.org/10.1038/s41467-024-46346-0
Share this article
Anyone you share the following link with will be able to read this content:
Sorry, a shareable link is not currently available for this article.
Provided by the Springer Nature SharedIt content-sharing initiative
By submitting a comment you agree to abide by our Terms and Community Guidelines . If you find something abusive or that does not comply with our terms or guidelines please flag it as inappropriate.
Quick links
- Explore articles by subject
- Guide to authors
- Editorial policies
Sign up for the Nature Briefing: Translational Research newsletter — top stories in biotechnology, drug discovery and pharma.

Multi-index control strategy from cement calcination denitration system: a model predictive control method for combined control of nitrogen oxide and ammonia escape
- Research Article
- Published: 02 April 2024
Cite this article
- Xiaochen Hao ORCID: orcid.org/0000-0001-6948-0995 1 ,
- Xinqiang Wang 1 ,
- Xing Wang 1 &
- Yukun Ji 1
The cement industry is one of the main sources of NOx emissions, and automated denitration systems enable precise control of NOx emission concentration. With non-linearity, time delay and strong coupling data in cement production process, making it difficult to maintain stable control of the denitration system. However, excessive pursuit of denitration efficiency is often prone to large ammonia escape, causing environmental pollution. A multi-objective prediction model combining time series and a bi-directional long short-term memory network (MT-BiLSTM) is proposed to solve the data problem of the denitration system and achieve simultaneous prediction of NOx emission concentration and ammonia escape value. Based on this model, a model predictive control framework is proposed and a control strategy of denitration system with multi-index model predictive control (MI-MPC) is built based on neural networks. In addition, the differential evolution (DE) algorithm is used for rolling optimization to find the optimal solution and to obtain the best control variable parameters. The control method proposed has significant advantages over the traditional PID (proportional integral derivative) controller, with a 3.84% reduction in overshoot and a 3.04% reduction in regulation time. Experiments prove that the predictive control framework proposed in this paper has better stability and higher accuracy, with practical research significance.
This is a preview of subscription content, log in via an institution to check access.
Access this article
Price includes VAT (Russian Federation)
Instant access to the full article PDF.
Rent this article via DeepDyve
Institutional subscriptions
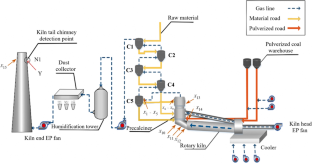
Data availability
The datasets generated during and/or analyzed during the current study are available from the corresponding author on reasonable request.
Aliramezani M, Koch CR, Hayes RE (2016) Estimating tailpipe NOx concentration using a dynamic NOx/ammonia cross sensitivity model coupled to a three state control oriented SCR model. IFAC-PapersOnLine 49:8–13. https://doi.org/10.1016/j.ifacol.2016.08.002
Article Google Scholar
Almassalkhi MR, Hiskens IA (2015) Model-predictive cascade mitigation in electric power systems with storage and renewables—part II: case-study. IEEE Trans Power Syst 30:78–87. https://doi.org/10.1109/TPWRS.2014.2320988
Gao H, Tao J, Sun Q, Chen Z (2016) Design and optimization in multiphase homing trajectory of parafoil system. J Cent South Univ 23:1416–1426. https://doi.org/10.1007/s11771-016-3194-x
Guan W, Huang S, Luo D, Rong F (2019) A reverse model predictive control strategy for a modular multilevel converter. Energies 12:297. https://doi.org/10.3390/en12020297
Hao X, Xu Q, Shi X, Song Z, Ji Y, Zhang Z (2021) Prediction of nitrogen oxide emission concentration in cement production process: a method of deep belief network with clustering and time series. Environ Sci Pollut Res 28:31689–31703. https://doi.org/10.1007/s11356-021-12834-9
Article CAS Google Scholar
Hasnen SH, Shahid M, Zabiri H, Taqvi SAA (2023) Semi-supervised adaptive PLS soft-sensor with PCA-based drift correction method for online valuation of NOx emission in industrial water-tube boiler. Process Saf Environ Protect 172:787–801. https://doi.org/10.1016/j.psep.2023.02.080
Jo H, Kang K, Park J, Ryu C, Ahn H, Go Y (2019) Optimization of air distribution to reduce NOx emission and unburned carbon for the retrofit of a 500 MWe tangential-firing coal boiler. Energies 12:3281. https://doi.org/10.3390/en12173281
Kang J, Niu Y, Hu B, Li H, Zhou Z (2021) Dynamic modeling of SCR denitration systems in coal-fired power plants based on a bi-directional long short-term memory method. Process Saf Environ Protect 148:867–878. https://doi.org/10.1016/j.psep.2021.02.009
Kim J, Kim J, Kim H, Kim H, Kang S, Ryu J, Shim S (2022) Reduction of NOx emission from the cement industry in South Korea: a review. Atmosphere 13:121. https://doi.org/10.3390/atmos13010121
Li X, Yin M (2012) Application of differential evolution algorithm on self-potential data. PLoS ONE 7:e51199. https://doi.org/10.1371/journal.pone.0051199
Lin B, Zhang Z (2016) Carbon emissions in China׳s cement industry: a sector and policy analysis. Renew Sustain Energy Rev 58:1387–1394. https://doi.org/10.1016/j.rser.2015.12.348
Liu H, Hong Q, Liu H, Huang Z, Zhang X, Chen W, Zeng X, Pan S (2021) Effects of temperature and additives on NOx emission from combustion of fast-growing grass. Front Energy Res. 9, https://doi.org/10.3389/fenrg.2021.772755
Lucia S, Navarro D, Lucia O, Zometa P, Findeisen R (2018) Optimized FPGA implementation of model predictive control for embedded systems using high-level synthesis tool. IEEE Trans Ind Inform 14:137–145. https://doi.org/10.1109/TII.2017.2719940
Meng Z, Wang C, Wang X, Chen Y, Wu W, Li H (2019) Simultaneous removal of SO 2 and NOx from flue gas using (NH4)2S2O3/steel slag slurry combined with ozone oxidation. Fuel 255:115760. https://doi.org/10.1016/j.fuel.2019.115760
Mujtaba G, Shahzad SJH (2021) Air pollutants, economic growth and public health: implications for sustainable development in OECD countries. Environ Sci Pollut Res 28:12686–12698. https://doi.org/10.1007/s11356-020-11212-1
Nüesch T, Cerofolini A, Mancini G, Cavina N, Onder C, Guzzella L (2014) Equivalent consumption minimization strategy for the control of real driving NOx emissions of a diesel hybrid electric vehicle. Energies 7:3148–3178. https://doi.org/10.3390/en7053148
Pei J, Wang H, You C (2020) Optimization of staged combustion in a 600 MWe tangentially fired boiler with wall air injection. Fuel 275:117951. https://doi.org/10.1016/j.fuel.2020.117951
Sultan T, Zabiri H, Shahbaz M, Maulud AS (2022) Performance evaluation of the fast model predictive control scheme on a CO 2 capture plant through absorption/stripping system. Process Saf Environ Protect 157:218–236. https://doi.org/10.1016/j.psep.2021.11.018
Sun C, Zhang Y, Huang G, Liu L, Hao X (2022) A soft sensor model based on long & short-term memory dual pathways convolutional gated recurrent unit network for predicting cement specific surface area. ISA Trans 130:293–305. https://doi.org/10.1016/j.isatra.2022.03.013
Wang M, Huang T, Wong DC, Ho KF, Dong G, Yim SHL (2021) A new approach for health-oriented ozone control strategy: adjoint-based optimization of NOx emission reductions using metaheuristic algorithms. J Clean Prod 312:127533. https://doi.org/10.1016/j.jclepro.2021.127533
Wang X, Liu W, Wang Y, Yang G (2022) A hybrid NOx emission prediction model based on CEEMDAN and AM-LSTM. Fuel 310:122486. https://doi.org/10.1016/j.fuel.2021.122486
Wu X, Liu J, Wei Z, Chen Z, Evrendilek F, Huang W (2022) Oxy-fuel co-combustion dynamics of phytoremediation biomass and textile dyeing sludge: gas-to-ash pollution abatement. Sci Total Environ 825:153656. https://doi.org/10.1016/j.scitotenv.2022.153656
Xu Q, Hao X, Shi X, Zhang Z, Sun Q, Di Y (2022) Control of denitration system in cement calcination process: a novel method of deep neural network model predictive control. J Clean Prod 332:129970. https://doi.org/10.1016/j.jclepro.2021.129970
Yan J, Lu X, Zhang C, Li Q, Wang J, Liu S, Zheng X, Fan X (2021) An experimental study on the characteristics of NOx distributions at the SNCR inlets of a large-scale CFB boiler. Energies 14:1267. https://doi.org/10.3390/en14051267
Yue G, Wu H, Zhang T, Liu R, Sun J (2022) Research on mobile machinery NOx emission control based on a physical model and closed-loop control. Processes 10:1374. https://doi.org/10.3390/pr10071374
Zhan S, Li G, Bailey C (2020) Economic feedback model predictive control of wave energy converters. IEEE Trans Ind Electron 67:3932–3943. https://doi.org/10.1109/TIE.2019.2922947
Zhang R, Xu G, Li B, Wang Z, Gao J, Li J, Sun Y, Xu G (2023) Analysis of the pollution emission system of large-scale combustion of biomass briquette fuel in China. Process Saf Environ Protect 169:928–936. https://doi.org/10.1016/j.psep.2022.11.088
Zhao S, Fang Q, Yin C, Wei T, Wang H, Zhang C, Chen G (2017) New fuel air control strategy for reducing NOx emissions from corner-fired utility boilers at medium–low loads. Energy Fuels 31:6689–6699. https://doi.org/10.1021/acs.energyfuels.7b00337
Download references
This work was supported by the National Natural Science Foundation of China (Grant No. 62073281), the Natural Science Foundation of Hebei Province (Grant No. F2022203088), the Natural Science Foundation of Hebei Province (Grant No. F2023203029), and Hebei innovation capability improvement plan project (Grant No. 22567619H).
Author information
Authors and affiliations.
School of Electrical Engineering, Yanshan University, 438 Hebei Avenue, Qinhuangdao, 066004, China
Xiaochen Hao, Xinqiang Wang, Xing Wang & Yukun Ji
You can also search for this author in PubMed Google Scholar
Contributions
Xiaochen Hao: conceptualization, formal analysis, funding acquisition, supervision. Xinqiang Wang: writing — original draft, visualization, data curation, software. Xing Wang: project administration, software, methodology. Yukun Ji: writing — review and editing, data curation.
Corresponding author
Correspondence to Xiaochen Hao .
Ethics declarations
Ethics approval and consent to participate.
This article does not contain any studies with human participants or animals performed by any of the authors.
Consent for publication
The authors have given their consent for publication.
Competing interests
The authors declare no competing interests.
Additional information
Responsible Editor: Guilherme Luiz Dotto
Publisher's Note
Springer Nature remains neutral with regard to jurisdictional claims in published maps and institutional affiliations.
Rights and permissions
Springer Nature or its licensor (e.g. a society or other partner) holds exclusive rights to this article under a publishing agreement with the author(s) or other rightsholder(s); author self-archiving of the accepted manuscript version of this article is solely governed by the terms of such publishing agreement and applicable law.
Reprints and permissions
About this article
Hao, X., Wang, X., Wang, X. et al. Multi-index control strategy from cement calcination denitration system: a model predictive control method for combined control of nitrogen oxide and ammonia escape. Environ Sci Pollut Res (2024). https://doi.org/10.1007/s11356-024-32996-6
Download citation
Received : 06 September 2023
Accepted : 15 March 2024
Published : 02 April 2024
DOI : https://doi.org/10.1007/s11356-024-32996-6
Share this article
Anyone you share the following link with will be able to read this content:
Sorry, a shareable link is not currently available for this article.
Provided by the Springer Nature SharedIt content-sharing initiative
- Nitrogen oxide emission
- Multi-objective prediction
- Model predictive control
- Multi-index control
- Denitration process control
- Find a journal
- Publish with us
- Track your research
Jump to navigation
Call for Chapters: Qualitative Research Methods for Dissertation Research
Call for Chapters: Qualitative Research Methods for Dissertation Research This guide provides doctoral scholars and researchers with the conventions of qualitative research for dissertation research. As an essential source, the collection is comprised of diverse resources from various perspectives for the methods and strategies to utilize the conventions of qualitative inquiry to prepare and advise doctoral scholars for rigorous qualitative dissertation research. The guide offers transdisciplinary perspectives across business, education, computer science, social and behavioral science, and the health sciences with a pathway to support a rationale for the choice of the qualitative method for the dissertation study and the subsequent design and implementation decisions needed thereafter for a qualitative dissertation study.
See submission details https://www.igi-global.com/publish/call-for-papers/call-details/7482
Have a language expert improve your writing
Run a free plagiarism check in 10 minutes, generate accurate citations for free.
- Knowledge Base
Methodology
- What Is a Research Design | Types, Guide & Examples
What Is a Research Design | Types, Guide & Examples
Published on June 7, 2021 by Shona McCombes . Revised on November 20, 2023 by Pritha Bhandari.
A research design is a strategy for answering your research question using empirical data. Creating a research design means making decisions about:
- Your overall research objectives and approach
- Whether you’ll rely on primary research or secondary research
- Your sampling methods or criteria for selecting subjects
- Your data collection methods
- The procedures you’ll follow to collect data
- Your data analysis methods
A well-planned research design helps ensure that your methods match your research objectives and that you use the right kind of analysis for your data.
Table of contents
Step 1: consider your aims and approach, step 2: choose a type of research design, step 3: identify your population and sampling method, step 4: choose your data collection methods, step 5: plan your data collection procedures, step 6: decide on your data analysis strategies, other interesting articles, frequently asked questions about research design.
- Introduction
Before you can start designing your research, you should already have a clear idea of the research question you want to investigate.
There are many different ways you could go about answering this question. Your research design choices should be driven by your aims and priorities—start by thinking carefully about what you want to achieve.
The first choice you need to make is whether you’ll take a qualitative or quantitative approach.
Qualitative research designs tend to be more flexible and inductive , allowing you to adjust your approach based on what you find throughout the research process.
Quantitative research designs tend to be more fixed and deductive , with variables and hypotheses clearly defined in advance of data collection.
It’s also possible to use a mixed-methods design that integrates aspects of both approaches. By combining qualitative and quantitative insights, you can gain a more complete picture of the problem you’re studying and strengthen the credibility of your conclusions.
Practical and ethical considerations when designing research
As well as scientific considerations, you need to think practically when designing your research. If your research involves people or animals, you also need to consider research ethics .
- How much time do you have to collect data and write up the research?
- Will you be able to gain access to the data you need (e.g., by travelling to a specific location or contacting specific people)?
- Do you have the necessary research skills (e.g., statistical analysis or interview techniques)?
- Will you need ethical approval ?
At each stage of the research design process, make sure that your choices are practically feasible.
Receive feedback on language, structure, and formatting
Professional editors proofread and edit your paper by focusing on:
- Academic style
- Vague sentences
- Style consistency
See an example

Within both qualitative and quantitative approaches, there are several types of research design to choose from. Each type provides a framework for the overall shape of your research.
Types of quantitative research designs
Quantitative designs can be split into four main types.
- Experimental and quasi-experimental designs allow you to test cause-and-effect relationships
- Descriptive and correlational designs allow you to measure variables and describe relationships between them.
With descriptive and correlational designs, you can get a clear picture of characteristics, trends and relationships as they exist in the real world. However, you can’t draw conclusions about cause and effect (because correlation doesn’t imply causation ).
Experiments are the strongest way to test cause-and-effect relationships without the risk of other variables influencing the results. However, their controlled conditions may not always reflect how things work in the real world. They’re often also more difficult and expensive to implement.
Types of qualitative research designs
Qualitative designs are less strictly defined. This approach is about gaining a rich, detailed understanding of a specific context or phenomenon, and you can often be more creative and flexible in designing your research.
The table below shows some common types of qualitative design. They often have similar approaches in terms of data collection, but focus on different aspects when analyzing the data.
Your research design should clearly define who or what your research will focus on, and how you’ll go about choosing your participants or subjects.
In research, a population is the entire group that you want to draw conclusions about, while a sample is the smaller group of individuals you’ll actually collect data from.
Defining the population
A population can be made up of anything you want to study—plants, animals, organizations, texts, countries, etc. In the social sciences, it most often refers to a group of people.
For example, will you focus on people from a specific demographic, region or background? Are you interested in people with a certain job or medical condition, or users of a particular product?
The more precisely you define your population, the easier it will be to gather a representative sample.
- Sampling methods
Even with a narrowly defined population, it’s rarely possible to collect data from every individual. Instead, you’ll collect data from a sample.
To select a sample, there are two main approaches: probability sampling and non-probability sampling . The sampling method you use affects how confidently you can generalize your results to the population as a whole.
Probability sampling is the most statistically valid option, but it’s often difficult to achieve unless you’re dealing with a very small and accessible population.
For practical reasons, many studies use non-probability sampling, but it’s important to be aware of the limitations and carefully consider potential biases. You should always make an effort to gather a sample that’s as representative as possible of the population.
Case selection in qualitative research
In some types of qualitative designs, sampling may not be relevant.
For example, in an ethnography or a case study , your aim is to deeply understand a specific context, not to generalize to a population. Instead of sampling, you may simply aim to collect as much data as possible about the context you are studying.
In these types of design, you still have to carefully consider your choice of case or community. You should have a clear rationale for why this particular case is suitable for answering your research question .
For example, you might choose a case study that reveals an unusual or neglected aspect of your research problem, or you might choose several very similar or very different cases in order to compare them.
Data collection methods are ways of directly measuring variables and gathering information. They allow you to gain first-hand knowledge and original insights into your research problem.
You can choose just one data collection method, or use several methods in the same study.
Survey methods
Surveys allow you to collect data about opinions, behaviors, experiences, and characteristics by asking people directly. There are two main survey methods to choose from: questionnaires and interviews .
Observation methods
Observational studies allow you to collect data unobtrusively, observing characteristics, behaviors or social interactions without relying on self-reporting.
Observations may be conducted in real time, taking notes as you observe, or you might make audiovisual recordings for later analysis. They can be qualitative or quantitative.
Other methods of data collection
There are many other ways you might collect data depending on your field and topic.
If you’re not sure which methods will work best for your research design, try reading some papers in your field to see what kinds of data collection methods they used.
Secondary data
If you don’t have the time or resources to collect data from the population you’re interested in, you can also choose to use secondary data that other researchers already collected—for example, datasets from government surveys or previous studies on your topic.
With this raw data, you can do your own analysis to answer new research questions that weren’t addressed by the original study.
Using secondary data can expand the scope of your research, as you may be able to access much larger and more varied samples than you could collect yourself.
However, it also means you don’t have any control over which variables to measure or how to measure them, so the conclusions you can draw may be limited.
Here's why students love Scribbr's proofreading services
Discover proofreading & editing
As well as deciding on your methods, you need to plan exactly how you’ll use these methods to collect data that’s consistent, accurate, and unbiased.
Planning systematic procedures is especially important in quantitative research, where you need to precisely define your variables and ensure your measurements are high in reliability and validity.
Operationalization
Some variables, like height or age, are easily measured. But often you’ll be dealing with more abstract concepts, like satisfaction, anxiety, or competence. Operationalization means turning these fuzzy ideas into measurable indicators.
If you’re using observations , which events or actions will you count?
If you’re using surveys , which questions will you ask and what range of responses will be offered?
You may also choose to use or adapt existing materials designed to measure the concept you’re interested in—for example, questionnaires or inventories whose reliability and validity has already been established.
Reliability and validity
Reliability means your results can be consistently reproduced, while validity means that you’re actually measuring the concept you’re interested in.
For valid and reliable results, your measurement materials should be thoroughly researched and carefully designed. Plan your procedures to make sure you carry out the same steps in the same way for each participant.
If you’re developing a new questionnaire or other instrument to measure a specific concept, running a pilot study allows you to check its validity and reliability in advance.
Sampling procedures
As well as choosing an appropriate sampling method , you need a concrete plan for how you’ll actually contact and recruit your selected sample.
That means making decisions about things like:
- How many participants do you need for an adequate sample size?
- What inclusion and exclusion criteria will you use to identify eligible participants?
- How will you contact your sample—by mail, online, by phone, or in person?
If you’re using a probability sampling method , it’s important that everyone who is randomly selected actually participates in the study. How will you ensure a high response rate?
If you’re using a non-probability method , how will you avoid research bias and ensure a representative sample?
Data management
It’s also important to create a data management plan for organizing and storing your data.
Will you need to transcribe interviews or perform data entry for observations? You should anonymize and safeguard any sensitive data, and make sure it’s backed up regularly.
Keeping your data well-organized will save time when it comes to analyzing it. It can also help other researchers validate and add to your findings (high replicability ).
On its own, raw data can’t answer your research question. The last step of designing your research is planning how you’ll analyze the data.
Quantitative data analysis
In quantitative research, you’ll most likely use some form of statistical analysis . With statistics, you can summarize your sample data, make estimates, and test hypotheses.
Using descriptive statistics , you can summarize your sample data in terms of:
- The distribution of the data (e.g., the frequency of each score on a test)
- The central tendency of the data (e.g., the mean to describe the average score)
- The variability of the data (e.g., the standard deviation to describe how spread out the scores are)
The specific calculations you can do depend on the level of measurement of your variables.
Using inferential statistics , you can:
- Make estimates about the population based on your sample data.
- Test hypotheses about a relationship between variables.
Regression and correlation tests look for associations between two or more variables, while comparison tests (such as t tests and ANOVAs ) look for differences in the outcomes of different groups.
Your choice of statistical test depends on various aspects of your research design, including the types of variables you’re dealing with and the distribution of your data.
Qualitative data analysis
In qualitative research, your data will usually be very dense with information and ideas. Instead of summing it up in numbers, you’ll need to comb through the data in detail, interpret its meanings, identify patterns, and extract the parts that are most relevant to your research question.
Two of the most common approaches to doing this are thematic analysis and discourse analysis .
There are many other ways of analyzing qualitative data depending on the aims of your research. To get a sense of potential approaches, try reading some qualitative research papers in your field.
If you want to know more about the research process , methodology , research bias , or statistics , make sure to check out some of our other articles with explanations and examples.
- Simple random sampling
- Stratified sampling
- Cluster sampling
- Likert scales
- Reproducibility
Statistics
- Null hypothesis
- Statistical power
- Probability distribution
- Effect size
- Poisson distribution
Research bias
- Optimism bias
- Cognitive bias
- Implicit bias
- Hawthorne effect
- Anchoring bias
- Explicit bias
A research design is a strategy for answering your research question . It defines your overall approach and determines how you will collect and analyze data.
A well-planned research design helps ensure that your methods match your research aims, that you collect high-quality data, and that you use the right kind of analysis to answer your questions, utilizing credible sources . This allows you to draw valid , trustworthy conclusions.
Quantitative research designs can be divided into two main categories:
- Correlational and descriptive designs are used to investigate characteristics, averages, trends, and associations between variables.
- Experimental and quasi-experimental designs are used to test causal relationships .
Qualitative research designs tend to be more flexible. Common types of qualitative design include case study , ethnography , and grounded theory designs.
The priorities of a research design can vary depending on the field, but you usually have to specify:
- Your research questions and/or hypotheses
- Your overall approach (e.g., qualitative or quantitative )
- The type of design you’re using (e.g., a survey , experiment , or case study )
- Your data collection methods (e.g., questionnaires , observations)
- Your data collection procedures (e.g., operationalization , timing and data management)
- Your data analysis methods (e.g., statistical tests or thematic analysis )
A sample is a subset of individuals from a larger population . Sampling means selecting the group that you will actually collect data from in your research. For example, if you are researching the opinions of students in your university, you could survey a sample of 100 students.
In statistics, sampling allows you to test a hypothesis about the characteristics of a population.
Operationalization means turning abstract conceptual ideas into measurable observations.
For example, the concept of social anxiety isn’t directly observable, but it can be operationally defined in terms of self-rating scores, behavioral avoidance of crowded places, or physical anxiety symptoms in social situations.
Before collecting data , it’s important to consider how you will operationalize the variables that you want to measure.
A research project is an academic, scientific, or professional undertaking to answer a research question . Research projects can take many forms, such as qualitative or quantitative , descriptive , longitudinal , experimental , or correlational . What kind of research approach you choose will depend on your topic.
Cite this Scribbr article
If you want to cite this source, you can copy and paste the citation or click the “Cite this Scribbr article” button to automatically add the citation to our free Citation Generator.
McCombes, S. (2023, November 20). What Is a Research Design | Types, Guide & Examples. Scribbr. Retrieved April 2, 2024, from https://www.scribbr.com/methodology/research-design/
Is this article helpful?
Shona McCombes
Other students also liked, guide to experimental design | overview, steps, & examples, how to write a research proposal | examples & templates, ethical considerations in research | types & examples, what is your plagiarism score.
- Quantum Research
Landmark IBM error correction paper published on the cover of Nature
Ibm has created a quantum error-correcting code about 10 times more efficient than prior methods — a milestone in quantum computing research..

27 Mar 2024
Rafi Letzter
Share this blog
Today, the paper detailing those results was published as the cover story of the scientific journal Nature. 1
Last year, we demonstrated that quantum computers had entered the era of utility , where they are now capable of running quantum circuits better than classical computers can. Over the next few years, we expect to find speedups over classical computing and extract business value from these systems. But there are also algorithms with mathematically proven speedups over leading classical methods that require tuning quantum circuits with hundreds of millions, to billions, of gates. Expanding our quantum computing toolkit to include those algorithms requires us to find a way to compute that corrects the errors inherent to quantum systems — what we call quantum error correction.
Read how a paper from IBM and UC Berkeley shows a path toward useful quantum computing
Quantum error correction requires that we encode quantum information into more qubits than we would otherwise need. However, achieving quantum error correction in a scalable and fault-tolerant way has, to this point, been out of reach without considering scales of one million or more physical qubits. Our new result published today greatly reduces that overhead, and shows that error correction is within reach.
While quantum error correction theory dates back three decades, theoretical error correction techniques capable of running valuable quantum circuits on real hardware have been too impractical to deploy on quantum system. In our new paper, we introduce a new code, which we call the gross code , that overcomes that limitation.
This code is part of our broader strategy to bring useful quantum computing to the world.
While error correction is not a solved problem, this new code makes clear the path toward running quantum circuits with a billion gates or more on our superconducting transmon qubit hardware.
What is error correction?
Quantum information is fragile and susceptible to noise — environmental noise, noise from the control electronics, hardware imperfections, state preparation and measurement errors, and more. In order to run quantum circuits with millions to billions of gates, quantum error correction will be required.
Error correction works by building redundancy into quantum circuits. Many qubits work together to protect a piece of quantum information that a single qubit might lose to errors and noise.
On classical computers, the concept of redundancy is pretty straightforward. Classical error correction involves storing the same piece of information across multiple bits. Instead of storing a 1 as a 1 or a 0 as a 0, the computer might record 11111 or 00000. That way, if an error flips a minority of bits, the computer can treat 11001 as 1, or 10001 as 0. It’s fairly easy to build in more redundancy as needed to introduce finer error correction.
Things are more complicated on quantum computers. Quantum information cannot be copied and pasted like classical information, and the information stored in quantum bits is more complicated than classical data. And of course, qubits can decohere quickly, forgetting their stored information.
Research has shown that quantum fault tolerance is possible, and there are many error correcting schemes on the books. The most popular one is called the “surface code,” where qubits are arranged on a two-dimensional lattice and units of information are encoded into sub-units of the lattice.
But these schemes have problems.
First, they only work if the hardware’s error rates are better than some threshold determined by the specific scheme and the properties of the noise itself — and beating those thresholds can be a challenge.
Second, many of those schemes scale inefficiently — as you build larger quantum computers, the number of extra qubits needed for error correction far outpaces the number of qubits the code can store.
At practical code sizes where many errors can be corrected, the surface code uses hundreds of physical qubits per encoded qubit worth of quantum information, or more. So, while the surface code is useful for benchmarking and learning about error correction, it’s probably not the end of the story for fault-tolerant quantum computers.
Exploring “good” codes
The field of error correction buzzed with excitement in 2022 when Pavel Panteleev and Gleb Kalachev at Moscow State University published a landmark paper proving that there exist asymptotically good codes — codes where the number of extra qubits needed levels off as the quality of the code increases.
This has spurred a lot of new work in error correction, especially in the same family of codes that the surface code hails from, called quantum low-density parity check, or qLDPC codes. These qLDPC codes are quantum error correcting codes where the operations responsible for checking whether or not an error has occurred only have to act on a few qubits, and each qubit only has to participate in a few checks.
But this work was highly theoretical, focused on proving the possibility of this kind of error correction. It didn’t take into account the real constraints of building quantum computers. Most importantly, some qLDPC codes would require many qubits in a system to be physically linked to high numbers of other qubits. In practice, that would require quantum processors folded in on themselves in psychedelic hyper-dimensional origami, or entombed in wildly complex rats’ nests of wires.
In our paper, we looked for fault-tolerant quantum memory with a low qubit overhead, high error threshold, and a large code distance.
. https://doi.org/10.1038/s41586-024-07107-7")
Bravyi, S., Cross, A., Gambetta, J., et al. High-threshold and low-overhead fault-tolerant quantum memory. Nature (2024). https://doi.org/10.1038/s41586-024-07107-7
In our Nature paper, we specifically looked for fault-tolerant quantum memory with a low qubit overhead, high error threshold, and a large code distance.
Let’s break that down:
Fault-tolerant: The circuits used to detect errors won't spread those errors around too badly in the process, and they can be corrected faster than they occur
Quantum memory: In this paper, we are only encoding and storing quantum information. We are not yet doing calculations on the encoded quantum information.
High error threshold: The higher the threshold, the higher amount of hardware errors the code will allow while still being fault tolerant. We were looking for a code that allowed us to operate the memory reliably at physical error rates as high as 0.001, so we wanted a threshold close to 1 percent.
Large code distance: Distance is the measure of how robust the code is — how many errors it takes to completely flip the value from 0 to 1 and vice versa. In the case of 00000 and 11111, the distance is 5. We wanted one with a large code distance that corrects more than just a couple errors. Large-distance codes can suppress noise by orders of magnitude even if the hardware quality is only marginally better than the code threshold. In contrast, codes with a small distance become useful only if the hardware quality is significantly better than the code threshold.
Low qubit overhead: Overhead is the number of extra qubits required for correcting errors. We want the number of qubits required to do error correction to be far less than we need for a surface code of the same quality, or distance.
We’re excited to report that our team’s mathematical analysis found concrete examples of qLDPC codes that met all of these required conditions. These fall into a family of codes called “Bivariate Bicycle (BB)” codes. And they are going to shape not only our research going forward, but how we architect physical quantum systems.
The gross code
While many qLDPC code families show great promise for advancing error correction theory, most aren’t necessarily pragmatic for real-world application. Our new codes lend themselves better to practical implementation because each qubit needs only to connect to six others, and the connections can be routed on just two layers.
To get an idea of how the qubits are connected, imagine they are put onto a square grid, like a piece of graph paper. Curl up this piece of graph paper so that it forms a tube, and connect the ends of the tube to make a donut. On this donut, each qubit is connected to its four neighbors and two qubits that are farther away on the surface of the donut. No more connections needed.
The good news is we don’t actually have to embed our qubits onto a donut to make these codes work — we can accomplish this by folding the surface differently and adding a few other long-range connectors to satisfy mathematical requirements of the code. It’s an engineering challenge, but much more feasible than a hyper-dimensional shape.
We explored some codes that have this architecture and focused on a particular [[144,12,12]] code. We call this code the gross code because 144 is a gross (or a dozen dozen). It requires 144 qubits to store data — but in our specific implementation, it also uses another 144 qubits to check for errors, so this instance of the code uses 288 qubits. It stores 12 logical qubits well enough that fewer than 12 errors can be detected. Thus: [[144,12,12]].
Using the gross code, you can protect 12 logical qubits for roughly a million cycles of error checks using 288 qubits. Doing roughly the same task with the surface code would require nearly 3,000 qubits.
This is a milestone. We are still looking for qLDPC codes with even more efficient architectures, and our research on performing error-corrected calculations using these codes is ongoing. But with this publication, the future of error correction looks bright.

Fig. 1 | Tanner graphs of surface and BB codes.
Fig. 1 | Tanner graphs of surface and BB codes. a, Tanner graph of a surface code, for comparison. b, Tanner graph of a BB code with parameters [[144, 12, 12]] embedded into a torus. Any edge of the Tanner graph connects a data and a check vertex. Data qubits associated with the registers q(L) and q(R) are shown by blue and orange circles. Each vertex has six incident edges including four short-range edges (pointing north, south, east and west) and two long-range edges. We only show a few long-range edges to avoid clutter. Dashed and solid edges indicate two planar subgraphs spanning the Tanner graph, see the Methods. c, Sketch of a Tanner graph extension for measuring Z ˉ \={Z} and X ˉ \={X} following ref. 50, attaching to a surface code. The ancilla corresponding to the X ˉ \={X} measurement can be connected to a surface code, enabling load-store operations for all logical qubits by means of quantum teleportation and some logical unitaries. This extended Tanner graph also has an implementation in a thickness-2 architecture through the A and B edges (Methods).

Fig. 2 | Syndrome measurement circuit.
Fig. 2 | Syndrome measurement circuit. Full cycle of syndrome measurements relying on seven layers of CNOTs. We provide a local view of the circuit that only includes one data qubit from each register q(L) and q(R) . The circuit is symmetric under horizontal and vertical shifts of the Tanner graph. Each data qubit is coupled by CNOTs with three X-check and three Z-check qubits: see the Methods for more details.
Why error correction matters
Today, our users benefit from novel error mitigation techniques — methods for reducing or eliminating the effect of noise when calculating observables, alongside our work suppressing errors at the hardware level. This work brought us into the era of quantum utility. IBM researchers and partners all over the world are exploring practical applications of quantum computing today with existing quantum systems. Error mitigation lets users begin looking for quantum advantage on real quantum hardware.
But error mitigation comes with its own overhead, requiring running the same executions repeatedly so that classical computers can use statistical methods to extract an accurate result. This limits the scale of the programs you can run, and increasing that scale requires tools beyond error mitigation — like error correction.
Last year, we debuted a new roadmap laying out our plan to continuously improve quantum computers over the next decade. This new paper is an important example of how we plan to continuously increasing the complexity (number of gates) of the quantum circuits that can be run on our hardware. It will allow us to transition from running circuits with 15,000 gates to 100 million, or even 1 billion gates.
Bravyi, S., Cross, A.W., Gambetta, J.M. et al. High-threshold and low-overhead fault-tolerant quantum memory. Nature 627, 778–782 (2024). https://doi.org/10.1038/s41586-024-07107-7
Start using our 100+ qubit systems
Keep exploring, computing with error-corrected quantum computers.

Logical gates with magic state distillation

Error correcting codes for near-term quantum computers

A new paper from IBM and UC Berkeley shows a path toward useful quantum computing
IMAGES
VIDEO
COMMENTS
Your research methodology discusses and explains the data collection and analysis methods you used in your research. A key part of your thesis, dissertation, or research paper, the methodology chapter explains what you did and how you did it, allowing readers to evaluate the reliability and validity of your research and your dissertation topic.
The research methodology is an important section of any research paper or thesis, as it describes the methods and procedures that will be used to conduct the research. It should include details about the research design, data collection methods, data analysis techniques, and any ethical considerations.
The research methodology section in a scientific paper describes the different methodological choices made, such as the data collection and analysis methods, and why these choices were selected. The reasons should explain why the methods chosen are the most appropriate to answer the research question.
One of the most common deficiencies found in research papers is that the proposed methodology is not suitable to achieving the stated objective of your paper. Describe the specific methods of data collection you are going to use, such as, surveys, interviews, questionnaires, observation, archival research. If you are analyzing existing data ...
Methodology Section for Research Papers. The methodology section of your paper describeshow your research was conducted. This information allows readers to check whether your approach is accurate and dependable. A good methodology can help increase the reader's trust in your findings. First, we will define and differentiate quantitative and ...
Research methodology is the process or the way you intend to execute your study. The methodology section of a research paper outlines how you plan to conduct your study. It covers various steps such as collecting data, statistical analysis, observing participants, and other procedures involved in the research process
As we mentioned, research methodology refers to the collection of practical decisions regarding what data you'll collect, from who, how you'll collect it and how you'll analyse it. Research design, on the other hand, is more about the overall strategy you'll adopt in your study. For example, whether you'll use an experimental design ...
Revised on 10 October 2022. Your research methodology discusses and explains the data collection and analysis methods you used in your research. A key part of your thesis, dissertation, or research paper, the methodology chapter explains what you did and how you did it, allowing readers to evaluate the reliability and validity of your research.
For novice researchers, writing the methodology of a research paper can be an overwhelming process, especially considering the intricate elements covered by this section (J. Ellis & Levy, 2009, p. 323). The goal of this article is to define what is research methodology, guide novice researchers in their research methodology writing, and to help ...
A research methodology encompasses the way in which you intend to carry out your research. This includes how you plan to tackle things like collection methods, statistical analysis, participant observations, and more. You can think of your research methodology as being a formula. One part will be how you plan on putting your research into ...
Your Methods Section contextualizes the results of your study, giving editors, reviewers and readers alike the information they need to understand and interpret your work. Your methods are key to establishing the credibility of your study, along with your data and the results themselves. A complete methods section should provide enough detail ...
The methodology in a research paper, thesis paper or dissertation is the section in which you describe the actions you took to investigate and research a problem and your rationale for the specific processes and techniques you use within your research to identify, collect and analyze information that helps you understand the problem. ...
1. Qualitative research methodology. Qualitative research methodology is aimed at understanding concepts, thoughts, or experiences. This approach is descriptive and is often utilized to gather in-depth insights into people's attitudes, behaviors, or cultures. Qualitative research methodology involves methods like interviews, focus groups, and ...
Research Methodology Example. Detailed Walkthrough + Free Methodology Chapter Template. If you're working on a dissertation or thesis and are looking for an example of a research methodology chapter, you've come to the right place. In this video, we walk you through a research methodology from a dissertation that earned full distinction ...
Even though methodological studies can be conducted on qualitative or mixed methods research, this paper focuses on and draws examples exclusively from quantitative research. ... Authors' expertise: The inclusion of authors with expertise in research methodology, biostatistics, and scientific writing is likely to influence the end-product. ...
Background Methodological studies - studies that evaluate the design, analysis or reporting of other research-related reports - play an important role in health research. They help to highlight issues in the conduct of research with the aim of improving health research methodology, and ultimately reducing research waste. Main body We provide an overview of some of the key aspects of ...
I. Groups of Research Methods. There are two main groups of research methods in the social sciences: The empirical-analytical group approaches the study of social sciences in a similar manner that researchers study the natural sciences. This type of research focuses on objective knowledge, research questions that can be answered yes or no, and operational definitions of variables to be measured.
Learn how to write a strong methodology chapter that allows readers to evaluate the reliability and validity of the research. A good methodology chapter incl...
A research paper is a piece of academic writing that provides analysis, interpretation, ... Identify the assignment goal, deadline, length specifications, formatting, and submission method. Make a bulleted list of the key points, then go back and cross completed items off as you're writing. Carefully consider your timeframe and word limit: be ...
Research methodology indicates the logic of development of the process used to generate theory that is procedural framework within which the research is conducted (Remenyi et al. 1998). It ...
Research in the lab of K.J.V. is supported by KU Leuven, FWO, VIB, VLAIO and the Brewing Science Serves Health Fund. Research in the lab of T.W. is supported by FWO (G.0A51.15) and KU Leuven (C16 ...
The research in this paper includes performance tests on the accuracy, robustness, and rapidity of the model and a comparison with the conventional PID control method. The following are the highlights of this paper: (1) ... The methods mentioned above are already widely adopted to settle nonlinear problems, but the matter of time delay has not ...
This guide provides doctoral scholars and researchers with the conventions of qualitative research for dissertation research. As an essential source, the collection is comprised of diverse resources from various perspectives for the methods and strategies to utilize the conventions of qualitative inquiry to prepare and advise doctoral scholars ...
A research design is a strategy for answering your research question using empirical data. Creating a research design means making decisions about: Your overall research objectives and approach. Whether you'll rely on primary research or secondary research. Your sampling methods or criteria for selecting subjects. Your data collection methods.
Dashed and solid edges indicate two planar subgraphs spanning the Tanner graph, see the Methods. c, Sketch of a Tanner graph extension for measuring Z ˉ \={Z} and X ˉ \={X} following ref. 50, attaching to a surface code.