Venn Diagram Examples, Problems and Solutions
On this page:
- What is Venn diagram? Definition and meaning.
- Venn diagram formula with an explanation.
- Examples of 2 and 3 sets Venn diagrams: practice problems with solutions, questions, and answers.
- Simple 4 circles Venn diagram with word problems.
- Compare and contrast Venn diagram example.
Let’s define it:
A Venn Diagram is an illustration that shows logical relationships between two or more sets (grouping items). Venn diagram uses circles (both overlapping and nonoverlapping) or other shapes.
Commonly, Venn diagrams show how given items are similar and different.
Despite Venn diagram with 2 or 3 circles are the most common type, there are also many diagrams with a larger number of circles (5,6,7,8,10…). Theoretically, they can have unlimited circles.
Venn Diagram General Formula
n(A ∪ B) = n(A) + n(B) – n(A ∩ B)
Don’t worry, there is no need to remember this formula, once you grasp the meaning. Let’s see the explanation with an example.
This is a very simple Venn diagram example that shows the relationship between two overlapping sets X, Y.
X – the number of items that belong to set A Y – the number of items that belong to set B Z – the number of items that belong to set A and B both
From the above Venn diagram, it is quite clear that
n(A) = x + z n(B) = y + z n(A ∩ B) = z n(A ∪ B) = x +y+ z.
Now, let’s move forward and think about Venn Diagrams with 3 circles.
Following the same logic, we can write the formula for 3 circles Venn diagram :
n(A ∪ B ∪ C) = n(A) + n(B) + n(C) – n(A ∩ B) – n(B ∩ C) – n(C ∩ A) + n(A ∩ B ∩ C)
Venn Diagram Examples (Problems with Solutions)
As we already know how the Venn diagram works, we are going to give some practical examples (problems with solutions) from the real life.
2 Circle Venn Diagram Examples (word problems):
Suppose that in a town, 800 people are selected by random types of sampling methods . 280 go to work by car only, 220 go to work by bicycle only and 140 use both ways – sometimes go with a car and sometimes with a bicycle.
Here are some important questions we will find the answers:
- How many people go to work by car only?
- How many people go to work by bicycle only?
- How many people go by neither car nor bicycle?
- How many people use at least one of both transportation types?
- How many people use only one of car or bicycle?
The following Venn diagram represents the data above:
Now, we are going to answer our questions:
- Number of people who go to work by car only = 280
- Number of people who go to work by bicycle only = 220
- Number of people who go by neither car nor bicycle = 160
- Number of people who use at least one of both transportation types = n(only car) + n(only bicycle) + n(both car and bicycle) = 280 + 220 + 140 = 640
- Number of people who use only one of car or bicycle = 280 + 220 = 500
Note: The number of people who go by neither car nor bicycle (160) is illustrated outside of the circles. It is a common practice the number of items that belong to none of the studied sets, to be illustrated outside of the diagram circles.
We will deep further with a more complicated triple Venn diagram example.
3 Circle Venn Diagram Examples:
For the purposes of a marketing research , a survey of 1000 women is conducted in a town. The results show that 52 % liked watching comedies, 45% liked watching fantasy movies and 60% liked watching romantic movies. In addition, 25% liked watching comedy and fantasy both, 28% liked watching romantic and fantasy both and 30% liked watching comedy and romantic movies both. 6% liked watching none of these movie genres.
Here are our questions we should find the answer:
- How many women like watching all the three movie genres?
- Find the number of women who like watching only one of the three genres.
- Find the number of women who like watching at least two of the given genres.
Let’s represent the data above in a more digestible way using the Venn diagram formula elements:
- n(C) = percentage of women who like watching comedy = 52%
- n(F ) = percentage of women who like watching fantasy = 45%
- n(R) = percentage of women who like watching romantic movies= 60%
- n(C∩F) = 25%; n(F∩R) = 28%; n(C∩R) = 30%
- Since 6% like watching none of the given genres so, n (C ∪ F ∪ R) = 94%.
Now, we are going to apply the Venn diagram formula for 3 circles.
94% = 52% + 45% + 60% – 25% – 28% – 30% + n (C ∩ F ∩ R)
Solving this simple math equation, lead us to:
n (C ∩ F ∩ R) = 20%
It is a great time to make our Venn diagram related to the above situation (problem):
See, the Venn diagram makes our situation much more clear!
From the Venn diagram example, we can answer our questions with ease.
- The number of women who like watching all the three genres = 20% of 1000 = 200.
- Number of women who like watching only one of the three genres = (17% + 12% + 22%) of 1000 = 510
- The number of women who like watching at least two of the given genres = (number of women who like watching only two of the genres) +(number of women who like watching all the three genres) = (10 + 5 + 8 + 20)% i.e. 43% of 1000 = 430.
As we mentioned above 2 and 3 circle diagrams are much more common for problem-solving in many areas such as business, statistics, data science and etc. However, 4 circle Venn diagram also has its place.
4 Circles Venn Diagram Example:
A set of students were asked to tell which sports they played in school.
The options are: Football, Hockey, Basketball, and Netball.
Here is the list of the results:
The next step is to draw a Venn diagram to show the data sets we have.
It is very clear who plays which sports. As you see the diagram also include the student who does not play any sports (Dorothy) by putting her name outside of the 4 circles.
From the above Venn diagram examples, it is obvious that this graphical tool can help you a lot in representing a variety of data sets. Venn diagram also is among the most popular types of graphs for identifying similarities and differences .
Compare and Contrast Venn Diagram Example:
The following compare and contrast example of Venn diagram compares the features of birds and bats:
Tools for creating Venn diagrams
It is quite easy to create Venn diagrams, especially when you have the right tool. Nowadays, one of the most popular way to create them is with the help of paid or free graphing software tools such as:
You can use Microsoft products such as:
Some free mind mapping tools are also a good solution. Finally, you can simply use a sheet of paper or a whiteboard.
Conclusion:
A Venn diagram is a simple but powerful way to represent the relationships between datasets. It makes understanding math, different types of data analysis , set theory and business information easier and more fun for you.
Besides of using Venn diagram examples for problem-solving and comparing, you can use them to present passion, talent, feelings, funny moments and etc.
Be it data science or real-world situations, Venn diagrams are a great weapon in your hand to deal with almost any kind of information.
If you need more chart examples, our posts fishbone diagram examples and what does scatter plot show might be of help.

About The Author
Silvia Valcheva
Silvia Valcheva is a digital marketer with over a decade of experience creating content for the tech industry. She has a strong passion for writing about emerging software and technologies such as big data, AI (Artificial Intelligence), IoT (Internet of Things), process automation, etc.

Well explained I hope more on this one

WELL STRUCTURED CONTENT AND ENLIGHTNING AS WELL
Leave a Reply Cancel Reply
This site uses Akismet to reduce spam. Learn how your comment data is processed .
High Impact Tutoring Built By Math Experts
Personalized standards-aligned one-on-one math tutoring for schools and districts
Free ready-to-use math resources
Hundreds of free math resources created by experienced math teachers to save time, build engagement and accelerate growth

15 Venn Diagram Questions And Practice Problems (Middle & High School): Exam Style Questions Included
Beki Christian
Venn diagram questions involve visual representations of the relationship between two or more different groups of things. Venn diagrams are first covered in elementary school and their complexity and uses progress through middle and high school.
This article will look at the types of Venn diagram questions that might be encountered at middle school and high school, with a focus on exam style example questions and preparing for standardized tests. We will also cover problem-solving questions. Each question is followed by a worked solution.
How to solve Venn diagram questions
In middle school, sets and set notation are introduced when working with Venn diagrams. A set is a collection of objects. We identify a set using braces. For example, if set A contains the odd numbers between 1 and 10, then we can write this as:
A = {1, 3, 5, 7, 9}
Venn diagrams sort objects, called elements, into two or more sets.

This diagram shows the set of elements
{1,2,3,4,5,6,7,8,9,10} sorted into the following sets.
Set A= factors of 10
Set B= even numbers
The numbers in the overlap (intersection) belong to both sets. Those that are not in set A or set B are shown outside of the circles.
Different sections of a Venn diagram are denoted in different ways.
ξ represents the whole set, called the universal set.
∅ represents the empty set, a set containing no elements.

Venn Diagrams Worksheet
Download this quiz to check your students' understanding of Venn diagrams. Includes 10 questions with answers!
Let’s check out some other set notation examples!
In middle school and high school, we often use Venn diagrams to establish probabilities.
We do this by reading information from the Venn diagram and applying the following formula.
For Venn diagrams we can say
Middle School Venn diagram questions
In middle school, students learn to use set notation with Venn diagrams and start to find probabilities using Venn diagrams. The questions below are examples of questions that students may encounter in 6th, 7th and 8th grade.

Venn diagram questions 6th grade
1. This Venn diagram shows information about the number of people who have brown hair and the number of people who wear glasses.

How many people have brown hair and glasses?

The intersection, where the Venn diagrams overlap, is the part of the Venn diagram which represents brown hair AND glasses. There are 4 people in the intersection.
2. Which set of objects is represented by the Venn diagram below?

We can see from the Venn diagram that there are two green triangles, one triangle that is not green, three green shapes that are not triangles and two shapes that are not green or triangles. These shapes belong to set D.
Venn diagram questions 7th grade
3. Max asks 40 people whether they own a cat or a dog. 17 people own a dog, 14 people own a cat and 7 people own a cat and a dog. Choose the correct representation of this information on a Venn diagram.

There are 7 people who own a cat and a dog. Therefore, there must be 7 more people who own a cat, to make a total of 14 who own a cat, and 10 more people who own a dog, to make a total of 17 who own a dog.
Once we put this information on the Venn diagram, we can see that there are 7+7+10=24 people who own a cat, a dog or both.
40-24=16 , so there are 16 people who own neither.
4. The following Venn diagrams each show two sets, set A and set B . On which Venn diagram has A ′ been shaded?

\mathrm{A}^{\prime} means not in \mathrm{A} . This is shown in diagram \mathrm{B.}
Venn diagram questions 8th grade
5. Place these values onto the following Venn diagram and use your diagram to find the number of elements in the set \text{S} \cup \text{O}.
\xi = \{1, 2, 3, 4, 5, 6, 7, 8, 9, 10\} \text{S} = square numbers \text{O} = odd numbers

\text{S} \cup \text{O} is the union of \text{S} or \text{O} , so it includes any element in \text{S} , \text{O} or both. The total number of elements in \text{S} , \text{O} or both is 6.
6. The Venn diagram below shows a set of numbers that have been sorted into prime numbers and even numbers.

A number is chosen at random. Find the probability that the number is prime and not even.
The section of the Venn diagram representing prime and not even is shown below.

There are 3 numbers in the relevant section out of a possible 10 numbers altogether. The probability, as a fraction, is \frac{3}{10}.
7. Some people visit the theater. The Venn diagram shows the number of people who bought ice cream and drinks in the interval.

Ice cream is sold for $3 and drinks are sold for $ 2. A total of £262 is spent. How many people bought both a drink and an ice cream?
Money spent on drinks: 32 \times \$2 = \$64
Money spent on ice cream: 16 \times \$3 = \$48
\$64+\$48=\$112 , so the information already on the Venn diagram represents \$112 worth of sales.
\$262-\$112 = \$150 , so another \$150 has been spent.
If someone bought a drink and an ice cream, they would have spent \$2+\$3 = \$5.
\$150 \div \$5=30 , so 30 people bought a drink and an ice cream.
High school Venn diagram questions
In high school, students are expected to be able to take information from word problems and put it onto a Venn diagram involving two or three sets. The use of set notation is extended and the probabilities become more complex.
In advanced math classes, Venn diagrams are used to calculate conditional probability.
Lower ability Venn diagram questions
8. 50 people are asked whether they have been to France or Spain.
18 people have been to France. 23 people have been to Spain. 6 people have been to both.
By representing this information on a Venn diagram, find the probability that a person chosen at random has not been to Spain or France.

6 people have been to both France and Spain. This means 17 more have been to Spain to make 23 altogether, and 12 more have been to France to make 18 altogether. This makes 35 who have been to France, Spain or both and therefore 15 who have been to neither.
The probability that a person chosen at random has not been to France or Spain is \frac{15}{50}.
9. Some people were asked whether they like running, cycling or swimming. The results are shown in the Venn diagram below.

One person is chosen at random. What is the probability that the person likes running and cycling?

9 people like running and cycling (we include those who also like swimming) out of 80 people altogether. The probability that a person chosen at random likes running and cycling is \frac{9}{80}.
10. ξ = \{1, 2, 3, 4, 5, 6, 7, 8, 9, 10, 11, 12, 13, 14, 15, 16\}
\text{A} = \{ even numbers \}
\text{B} = \{ multiples of 3 \}
By completing the following Venn diagram, find \text{P}(\text{A} \cup \text{B}^{\prime}).

\text{A} \cup \text{B}^{\prime} means \text{A} or not \text{B} . We need to include everything that is in \text{A} or is not in \text{B} . There are 13 elements in \text{A} or not in \text{B} out of a total of 16 elements.
Therefore \text{P}(\text{A} \cup \text{B}^{\prime}) = \frac{13}{16}.
11. ξ = \{1, 2, 3, 4, 5, 6, 7, 8, 9, 10, 11, 12\}
A = \{ multiples of 2 \}
By putting this information onto the following Venn diagram, list all the elements of B.

We can start by placing the elements in \text{A} \cap \text{B} , which is the intersection.

We can then add any other multiples of 2 to set \text{A}.

Next, we can add any unused elements from \text{A} \cup \text{B} to \text{B}.

Finally, any other elements can be added to the outside of the Venn diagram.

The elements of \text{B} are \{1, 2, 3, 4, 6, 12\}.
Middle ability high school Venn diagram questions
12. Some people were asked whether they like strawberry ice cream or chocolate ice cream. 82% said they like strawberry ice cream and 70% said they like chocolate ice cream. 4% said they like neither.
By putting this information onto a Venn diagram, find the percentage of people who like both strawberry and chocolate ice cream.

Here, the percentages add up to 156\%. This is 56\% too much. In this total, those who like chocolate and strawberry have been counted twice and so 56\% is equal to the number who like both chocolate and strawberry. We can place 56\% in the intersection, \text{C} \cap \text{S}
We know that the total percentage who like chocolate is 70\%, so 70-56 = 14\%-14\% like just chocolate. Similarly, 82\% like strawberry, so 82-56 = 26\%-26\% like just strawberry.

13. The Venn diagram below shows some information about the height and gender of 40 students.

A student is chosen at random. Find the probability that the student is female given that they are over 1.2 m .
We are told the student is over 1.2m. There are 20 students who are over 1.2m and 9 of them are female. Therefore the probability that the student is female given they are over 1.2m is \frac{9}{20}.

14. The Venn diagram below shows information about the number of students who study history and geography.
H = history
G = geography
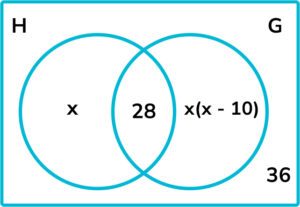
Work out the probability that a student chosen at random studies only history.
We are told that there are 100 students in total. Therefore:
x = 12 or x = -3 (not valid) If x = 12, then the number of students who study only history is 12, and the number who study only geography is 24. The probability that a student chosen at random studies only history is \frac{12}{100}.
15. 50 people were asked whether they like camping, holiday home or hotel holidays.
18\% of people said they like all three. 7 like camping and holiday homes but not hotels. 11 like camping and hotels. \frac{13}{25} like camping.
Of the 27 who like holiday homes, all but 1 like at least one other type of holiday. 7 people do not like any of these types of holiday.
By representing this information on a Venn diagram, find the probability that a person chosen at random likes hotels given that they like holiday homes.

Put this information onto a Venn diagram.

We are told that the person likes holiday homes. There are 27 people who like holiday homes. 19 of these also like hotels. Therefore, the probability that the person likes hotels given that they like holiday homes is \frac{19}{27}.
Looking for more Venn diagram math questions for middle and high school students ?
- Probability questions
- Ratio questions
- Algebra questions
- Trigonometry questions
- Long division questions
- Pythagorean theorem questions
Do you have students who need extra support in math? Give your students more opportunities to consolidate learning and practice skills through personalized math tutoring with their own dedicated online math tutor. Each student receives differentiated instruction designed to close their individual learning gaps, and scaffolded learning ensures every student learns at the right pace. Lessons are aligned with your state’s standards and assessments, plus you’ll receive regular reports every step of the way. Personalized one-on-one math tutoring programs are available for: – 2nd grade tutoring – 3rd grade tutoring – 4th grade tutoring – 5th grade tutoring – 6th grade tutoring – 7th grade tutoring – 8th grade tutoring Why not learn more about how it works ?
The content in this article was originally written by secondary teacher Beki Christian and has since been revised and adapted for US schools by elementary math teacher Katie Keeton.
Related articles

15 Probability Questions And Practice Problems for Middle and High School: Harder Exam Style Questions Included

9 Algebra Questions And Practice Problems To Do With Your Middle Schoolers

15 Trigonometry Questions And Practice Problems To Do With High Schoolers

Ratio Questions And Practice Problems: Differentiated Practice Questions Included
Solving Inequalities Questions [FREE]
Downloadable skills and applied questions about solving inequalities.
Includes 10 skills questions, 5 applied questions and an answer key. Print and share with your classes to support their learning.
Privacy Overview
Venn Diagram Examples for Problem Solving
Updated on: 13 September 2022
What is a Venn Diagram?
Venn diagrams define all the possible relationships between collections of sets. The most basic Venn diagrams simply consist of multiple circular boundaries describing the range of sets.

The overlapping areas between the two boundaries describe the elements which are common between the two, while the areas that aren’t overlapping house the elements that are different. Venn diagrams are used often in math that people tend to assume they are used only to solve math problems. But as the 3 circle Venn diagram below shows it can be used to solve many other problems.

Though the above diagram may look complicated, it is actually very easy to understand. Although Venn diagrams can look complex when solving business processes understanding of the meaning of the boundaries and what they stand for can simplify the process to a great extent. Let us have a look at a few examples which demonstrate how Venn diagrams can make problem solving much easier.
Example 1: Company’s Hiring Process
The first Venn diagram example demonstrates a company’s employee shortlisting process. The Human Resources department looks for several factors when short-listing candidates for a position, such as experience, professional skills and leadership competence. Now, all of these qualities are different from each other, and may or may not be present in some candidates. However, the best candidates would be those that would have all of these qualities combined.

The candidate who has all three qualities is the perfect match for your organization. So by using simple Venn Diagrams like the one above, a company can easily demonstrate its hiring processes and make the selection process much easier.
A colorful and precise Venn diagram like the above can be easily created using our Venn diagram software and we have professionally designed Venn diagram templates for you to get started fast too.
Example 2: Investing in a Location
The second Venn diagram example takes things a step further and takes a look at how a company can use a Venn diagram to decide a suitable office location. The decision will be based on economic, social and environmental factors.

In a perfect scenario you’ll find a location that has all the above factors in equal measure. But if you fail to find such a location then you can decide which factor is most important to you. Whatever the priority because you already have listed down the locations making the decision becomes easier.
Example 3: Choosing a Dream Job
The last example will reflect on how one of the life’s most complicated questions can be easily answered using a Venn diagram. Choosing a dream job is something that has stumped most college graduates, but with a single Venn diagram, this thought process can be simplified to a great extent.
First, single out the factors which matter in choosing a dream job, such as things that you love to do, things you’re good at, and finally, earning potential. Though most of us dream of being a celebrity and coming on TV, not everyone is gifted with acting skills, and that career path may not be the most viable. Instead, choosing something that you are good at, that you love to do along with something that has a good earning potential would be the most practical choice.

A job which includes all of these three criteria would, therefore, be the dream job for someone. The three criteria need not necessarily be the same, and can be changed according to the individual’s requirements.
So you see, even the most complicated processes can be simplified by using these simple Venn diagrams.
Join over thousands of organizations that use Creately to brainstorm, plan, analyze, and execute their projects successfully.

More Related Articles
Great article, and all true, but.. I hate venn diagrams! I don’t know why, they’ve just never seemed to work for me. Frustrating!
Hey thanks for writing. It helped me in many ways Thanks again 🙂
Hi Nishadha,
Nice article! I love Venn Diagrams because nothing comes to close to expressing the logical relationships between different sets of elements that well. With Microsoft Word 2003 you can create fantastic looking and colorful Venn Diagrams on the fly, with as many elements and colors as you need.
Hi Worli, Yes, Venn diagrams are a good way to solve problems, it’s a shame that it’s sort of restricted to the mathematics subject. MS Word do provides some nice options to create Venn diagrams, although it’s not the cheapest thing around.
Leave a comment Cancel reply
Please enter an answer in digits: 14 − 8 =
Download our all-new eBook for tips on 50 powerful Business Diagrams for Strategic Planning.
- + ACCUPLACER Mathematics
- + ACT Mathematics
- + AFOQT Mathematics
- + ALEKS Tests
- + ASVAB Mathematics
- + ATI TEAS Math Tests
- + Common Core Math
- + DAT Math Tests
- + FSA Tests
- + FTCE Math
- + GED Mathematics
- + Georgia Milestones Assessment
- + GRE Quantitative Reasoning
- + HiSET Math Exam
- + HSPT Math
- + ISEE Mathematics
- + PARCC Tests
- + Praxis Math
- + PSAT Math Tests
- + PSSA Tests
- + SAT Math Tests
- + SBAC Tests
- + SIFT Math
- + SSAT Math Tests
- + STAAR Tests
- + TABE Tests
- + TASC Math
- + TSI Mathematics
- + ACT Math Worksheets
- + Accuplacer Math Worksheets
- + AFOQT Math Worksheets
- + ALEKS Math Worksheets
- + ASVAB Math Worksheets
- + ATI TEAS 6 Math Worksheets
- + FTCE General Math Worksheets
- + GED Math Worksheets
- + 3rd Grade Mathematics Worksheets
- + 4th Grade Mathematics Worksheets
- + 5th Grade Mathematics Worksheets
- + 6th Grade Math Worksheets
- + 7th Grade Mathematics Worksheets
- + 8th Grade Mathematics Worksheets
- + 9th Grade Math Worksheets
- + HiSET Math Worksheets
- + HSPT Math Worksheets
- + ISEE Middle-Level Math Worksheets
- + PERT Math Worksheets
- + Praxis Math Worksheets
- + PSAT Math Worksheets
- + SAT Math Worksheets
- + SIFT Math Worksheets
- + SSAT Middle Level Math Worksheets
- + 7th Grade STAAR Math Worksheets
- + 8th Grade STAAR Math Worksheets
- + THEA Math Worksheets
- + TABE Math Worksheets
- + TASC Math Worksheets
- + TSI Math Worksheets
- + AFOQT Math Course
- + ALEKS Math Course
- + ASVAB Math Course
- + ATI TEAS 6 Math Course
- + CHSPE Math Course
- + FTCE General Knowledge Course
- + GED Math Course
- + HiSET Math Course
- + HSPT Math Course
- + ISEE Upper Level Math Course
- + SHSAT Math Course
- + SSAT Upper-Level Math Course
- + PERT Math Course
- + Praxis Core Math Course
- + SIFT Math Course
- + 8th Grade STAAR Math Course
- + TABE Math Course
- + TASC Math Course
- + TSI Math Course
- + Number Properties Puzzles
- + Algebra Puzzles
- + Geometry Puzzles
- + Intelligent Math Puzzles
- + Ratio, Proportion & Percentages Puzzles
- + Other Math Puzzles
How to Solve Problems Using Venn Diagrams
Venn diagrams are visual tools often used to organize and understand sets and the relationships between them. They're named after John Venn, a British philosopher, and logician who introduced them in the 1880s. Venn diagrams are frequently used in various fields, including mathematics, statistics, logic, computer science, etc. They're handy for solving problems involving sets and subsets, intersections, unions, and complements.

A Step-by-step Guide to Solving Problems Using Venn Diagrams
Here’s a step-by-step guide on how to solve problems using Venn diagrams:
Step 1: Understand the Problem
As with any problem-solving method, the first step is to understand the problem. What sets are involved? How are they related? What are you being asked to find?
Step 2: Draw the Diagram
Draw a rectangle to represent the universal set, which includes all possible elements. Each set within the universal set is represented by a circle. If there are two sets, draw two overlapping circles. If there are three sets, draw three overlapping circles, and so forth. Each section in the overlapping circles represents different intersections of the sets.
Step 3: Label the Diagram
Each circle (set) should be labeled appropriately. If you’re dealing with sets of different types of fruits, for example, one might be labeled “Apples” and another “Oranges”.
Step 4: Fill in the Values
Start filling in the values from the innermost part of the diagram (where all sets overlap) to the outer parts. This helps to avoid double-counting elements that belong to more than one set. Information provided in the problem usually tells you how many elements are in each set or section.
Step 5: Solve the Problem
Now, you can use the diagram to answer the question. This might involve counting the number of elements in a particular set or section of the diagram, or it might involve noticing patterns or relationships between the sets.
Step 6: Check Your Answer
Make sure your answer makes sense in the context of the problem and that you’ve accounted for all elements in the diagram.
by: Effortless Math Team about 11 months ago (category: Articles )
Effortless Math Team
Related to this article, more math articles.
- Intelligent Math Puzzle – Challenge 79
- Full-Length CLEP College Mathematics Practice Test-Answers and Explanations
- Top 10 Tips to ACE the CBEST Math Test
- How Does ALEKS Grading Work?
- How to Add and Subtract Integers? (+FREE Worksheet!)
- How to Use Multiplication Models Rising Up to 1000s Place Values
- 10 Most Common 3rd Grade SBAC Math Questions
- Best SAT Math Prep Books
- 6th Grade PSSA Math FREE Sample Practice Questions
- Unraveling More about Limits at Infinity
What people say about "How to Solve Problems Using Venn Diagrams - Effortless Math: We Help Students Learn to LOVE Mathematics"?
No one replied yet.
Leave a Reply Cancel reply
You must be logged in to post a comment.
Mastering Grade 6 Math Word Problems The Ultimate Guide to Tackling 6th Grade Math Word Problems
Mastering grade 5 math word problems the ultimate guide to tackling 5th grade math word problems, mastering grade 7 math word problems the ultimate guide to tackling 7th grade math word problems, mastering grade 2 math word problems the ultimate guide to tackling 2nd grade math word problems, mastering grade 8 math word problems the ultimate guide to tackling 8th grade math word problems, mastering grade 4 math word problems the ultimate guide to tackling 4th grade math word problems, mastering grade 3 math word problems the ultimate guide to tackling 3rd grade math word problems.
- ATI TEAS 6 Math
- ISEE Upper Level Math
- SSAT Upper-Level Math
- Praxis Core Math
- 8th Grade STAAR Math
Limited time only!
Save Over 45 %
It was $89.99 now it is $49.99
Login and use all of our services.
Effortless Math services are waiting for you. login faster!
Register Fast!
Password will be generated automatically and sent to your email.
After registration you can change your password if you want.
- Math Worksheets
- Math Courses
- Math Topics
- Math Puzzles
- Math eBooks
- GED Math Books
- HiSET Math Books
- ACT Math Books
- ISEE Math Books
- ACCUPLACER Books
- Premium Membership
- Youtube Videos
Effortless Math provides unofficial test prep products for a variety of tests and exams. All trademarks are property of their respective trademark owners.
- Bulk Orders
- Refund Policy

- HW Guidelines
- Study Skills Quiz
- Find Local Tutors
- Demo MathHelp.com
- Join MathHelp.com
Select a Course Below
- ACCUPLACER Math
- Math Placement Test
- PRAXIS Math
- + more tests
- 5th Grade Math
- 6th Grade Math
- Pre-Algebra
- College Pre-Algebra
- Introductory Algebra
- Intermediate Algebra
- College Algebra
Venn Diagrams: Exercises
Intro Set Not'n Sets Exercises Diag. Exercises
Venn diagram word problems generally give you two or three classifications and a bunch of numbers. You then have to use the given information to populate the diagram and figure out the remaining information. For instance:
Out of forty students, 14 are taking English Composition and 29 are taking Chemistry.
- If five students are in both classes, how many students are in neither class?
- How many are in either class?
- What is the probability that a randomly-chosen student from this group is taking only the Chemistry class?
Content Continues Below
MathHelp.com

There are two classifications in this universe: English students and Chemistry students.
First I'll draw my universe for the forty students, with two overlapping circles labelled with the total in each:
(Well, okay; they're ovals, but they're always called "circles".)
Five students are taking both classes, so I'll put " 5 " in the overlap:
I've now accounted for five of the 14 English students, leaving nine students taking English but not Chemistry, so I'll put " 9 " in the "English only" part of the "English" circle:
I've also accounted for five of the 29 Chemistry students, leaving 24 students taking Chemistry but not English, so I'll put " 24 " in the "Chemistry only" part of the "Chemistry" circle:
This tells me that a total of 9 + 5 + 24 = 38 students are in either English or Chemistry (or both). This gives me the answer to part (b) of this exercise. This also leaves two students unaccounted for, so they must be the ones taking neither class, which is the answer to part (a) of this exercise. I'll put " 2 " inside the box, but outside the two circles:
The last part of this exercise asks me for the probability that a agiven student is taking Chemistry but not English. Out of the forty students, 24 are taking Chemistry but not English, which gives me a probability of:
24/40 = 0.6 = 60%
- Two students are taking neither class.
- There are 38 students in at least one of the classes.
- There is a 60% probability that a randomly-chosen student in this group is taking Chemistry but not English.
Years ago, I discovered that my (now departed) cat had a taste for the adorable little geckoes that lived in the bushes and vines in my yard, back when I lived in Arizona. In one month, suppose he deposited the following on my carpet:
- six gray geckoes,
- twelve geckoes that had dropped their tails in an effort to escape capture, and
- fifteen geckoes that he'd chewed on a little
In addition:
- only one of the geckoes was gray, chewed-on, and tailless;
- two were gray and tailless but not chewed-on;
- two were gray and chewed-on but not tailless.
If there were a total of 24 geckoes left on my carpet that month, and all of the geckoes were at least one of "gray", "tailless", and "chewed-on", how many were tailless and chewed-on, but not gray?
If I work through this step-by-step, using what I've been given, I can figure out what I need in order to answer the question. This is a problem that takes some time and a few steps to solve.
They've given me that each of the geckoes had at least one of the characteristics, so each is a member of at least one of the circles. This means that there will be nothing outside of the circles; the circles will account for everything in this particular universe.
There was one gecko that was gray, tailless, and chewed on, so I'll draw my Venn diagram with three overlapping circles, and I'll put " 1 " in the center overlap:
Two of the geckoes were gray and tailless but not chewed-on, so " 2 " goes in the rest of the overlap between "gray" and "tailless".
Two of them were gray and chewed-on but not tailless, so " 2 " goes in the rest of the overlap between "gray" and "chewed-on".
Since a total of six were gray, and since 2 + 1 + 2 = 5 of these geckoes have already been accounted for, this tells me that there was only one left that was only gray.
This leaves me needing to know how many were tailless and chewed-on but not gray, which is what the problem asks for. But, because I don't know how many were only chewed on or only tailless, I cannot yet figure out the answer value for the remaining overlap section.
I need to work with a value that I don't yet know, so I need a variable. I'll let " x " stand for this unknown number of tailless, chewed-on geckoes.
I do know the total number of chewed geckoes ( 15 ) and the total number of tailless geckoes ( 12 ). After subtracting, this gives me expressions for the remaining portions of the diagram:
only chewed on:
15 − 2 − 1 − x = 12 − x
only tailless:
12 − 2 − 1 − x = 9 − x
There were a total of 24 geckoes for the month, so adding up all the sections of the diagram's circles gives me: (everything from the "gray" circle) plus (the unknown from the remaining overlap) plus (the only-chewed-on) plus (the only-tailless), or:
(1 + 2 + 1 + 2) + ( x )
+ (12 − x ) + (9 − x )
= 27 − x = 24
Solving , I get x = 3 . So:
Three geckoes were tailless and chewed on but not gray.
(No geckoes or cats were injured during the production of the above word problem.)
For more word-problem examples to work on, complete with worked solutions, try this page provided by Joe Kahlig of Texas A&M University. There is also a software package (DOS-based) available through the Math Archives which can give you lots of practice with the set-theory aspect of Venn diagrams. The program is not hard to use, but you should definitely read the instructions before using.
URL: https://www.purplemath.com/modules/venndiag4.htm
Page 1 Page 2 Page 3 Page 4
Standardized Test Prep
College math, homeschool math, share this page.
- Terms of Use
- About Purplemath
- About the Author
- Tutoring from PM
- Advertising
- Linking to PM
- Site licencing
Visit Our Profiles
Venn Diagram
A Venn diagram is used to visually represent the differences and the similarities between two concepts. Venn diagrams are also called logic or set diagrams and are widely used in set theory, logic, mathematics, businesses, teaching, computer science, and statistics.
Let's learn about Venn diagrams, their definition, symbols, and types with solved examples.
What is a Venn Diagram?
A Venn diagram is a diagram that helps us visualize the logical relationship between sets and their elements and helps us solve examples based on these sets. A Venn diagram typically uses intersecting and non-intersecting circles (although other closed figures like squares may be used) to denote the relationship between sets.

Venn Diagram Example
Let us observe a Venn diagram example. Here is the Venn diagram that shows the correlation between the following set of numbers.
- One set contains even numbers from 1 to 25 and the other set contains the numbers in the 5x table from 1 to 25.
- The intersecting part shows that 10 and 20 are both even numbers and also multiples of 5 between 1 to 25.

Terms Related to Venn Diagram
Let us understand the following terms and concepts related to Venn Diagram, to understand it better.
Universal Set
Whenever we use a set, it is easier to first consider a larger set called a universal set that contains all of the elements in all of the sets that are being considered. Whenever we draw a Venn diagram:
- A large rectangle is used to represent the universal set and it is usually denoted by the symbol E or sometimes U.
- All the other sets are represented by circles or closed figures within this larger rectangle .
- Every set is the subset of the universal set U.

Consider the above-given image:
- U is the universal set with all the numbers 1-10, enclosed within the rectangle.
- A is the set of even numbers 1-10, which is the subset of the universal set U and it is placed inside the rectangle.
- All the numbers between 1-10, that are not even, will be placed outside the circle and within the rectangle as shown above.
Venn diagrams are used to show subsets. A subset is actually a set that is contained within another set. Let us consider the examples of two sets A and B in the below-given figure. Here, A is a subset of B. Circle A is contained entirely within circle B. Also, all the elements of A are elements of set B.

This relationship is symbolically represented as A ⊆ B. It is read as A is a subset of B or A subset B. Every set is a subset of itself. i.e. A ⊆ A. Here is another example of subsets :
- N = set of natural numbers
- I = set of integers
- Here N ⊂ I, because all-natural numbers are integers .
Venn Diagram Symbols
There are more than 30 Venn diagram symbols. We will learn about the three most commonly used symbols in this section. They are listed below as:
Let us understand the concept and the usage of the three basic Venn diagram symbols using the image given below.

Venn Diagram for Sets Operations
In set theory, we can perform certain operations on given sets. These operations are as follows,
- Union of Set
- Intersection of set
- Complement of set
- Difference of set
Union of Sets Venn Diagram
The union of two sets A and B can be given by: A ∪ B = {x | x ∈ A or x ∈ B}. This operation on the elements of set A and B can be represented using a Venn diagram with two circles. The total region of both the circles combined denotes the union of sets A and B.
Intersection of Set Venn Diagram
The intersection of sets, A and B is given by: A ∩ B = {x : x ∈ A and x ∈ B}. This operation on set A and B can be represented using a Venn diagram with two intersecting circles. The region common to both the circles denotes the intersection of set A and Set B.
Complement of Set Venn Diagram
The complement of any set A can be given as A'. This represents elements that are not present in set A and can be represented using a Venn diagram with a circle. The region covered in the universal set, excluding the region covered by set A, gives the complement of A.
Difference of Set Venn Diagram
The difference of sets can be given as, A - B. It is also referred to as a ‘relative complement’. This operation on sets can be represented using a Venn diagram with two circles. The region covered by set A, excluding the region that is common to set B, gives the difference of sets A and B.
We can observe the above-explained operations on sets using the figures given below,

Venn Diagram for Three Sets
Three sets Venn diagram is made up of three overlapping circles and these three circles show how the elements of the three sets are related. When a Venn diagram is made of three sets, it is also called a 3-circle Venn diagram. In a Venn diagram, when all these three circles overlap, the overlapping parts contain elements that are either common to any two circles or they are common to all the three circles. Let us consider the below given example:

Here are some important observations from the above image:
- Elements in P and Q = elements in P and Q only plus elements in P, Q, and R.
- Elements in Q and R = elements in Q and R only plus elements in P, Q, and R.
- Elements in P and R = elements in P and R only plus elements in P, Q, and R.
How to Draw a Venn Diagram?
Venn diagrams can be drawn with unlimited circles. Since more than three becomes very complicated, we will usually consider only two or three circles in a Venn diagram. Here are the 4 easy steps to draw a Venn diagram:
- Step 1: Categorize all the items into sets.
- Step 2: Draw a rectangle and label it as per the correlation between the sets.
- Step 3: Draw the circles according to the number of categories you have.
- Step 4: Place all the items in the relevant circles.
Example: Let us draw a Venn diagram to show categories of outdoor and indoor for the following pets: Parrots, Hamsters, Cats, Rabbits, Fish, Goats, Tortoises, Horses.
- Step 1: Categorize all the items into sets (Here, its pets): Indoor pets: Cats, Hamsters, and, Parrots. Outdoor pets: Horses, Tortoises, and Goats. Both categories (outdoor and indoor): Rabbits and Fish.
- Step 2: Draw a rectangle and label it as per the correlation between the two sets. Here, let's label the rectangle as Pets.
- Step 3: Draw the circles according to the number of categories you have. There are two categories in the sample question: outdoor pets and indoor pets. So, let us draw two circles and make sure the circles overlap.

- Step 4: Place all the pets in the relevant circles. If there are certain pets that fit both the categories, then place them at the intersection of sets , where the circles overlap. Rabbits and fish can be kept as indoor and outdoor pets, and hence they are placed at the intersection of both circles.

- Step 5: If there is a pet that doesn't fit either the indoor or outdoor sets, then place it within the rectangle but outside the circles.
Venn Diagram Formula
For any two given sets A and B, the Venn diagram formula is used to find one of the following: the number of elements of A, B, A U B, or A ⋂ B when the other 3 are given. The formula says:
n(A U B) = n(A) + n(B) – n (A ⋂ B)
Here, n(A) and n(B) represent the number of elements in A and B respectively. n(A U B) and n(A ⋂ B) represent the number of elements in A U B and A ⋂ B respectively. This formula is further extended to 3 sets as well and it says:
- n (A U B U C) = n(A) + n(B) + n(C) - n(A ⋂ B) - n(B ⋂ C) - n(C ⋂ A) + n(A ⋂ B ⋂ C)
Here is an example of Venn diagram formula.
Example: In a cricket school, 12 players like bowling, 15 like batting, and 5 like both. Then how many players like either bowling or batting.
Let A and B be the sets of players who like bowling and batting respectively. Then
n(A ⋂ B) = 5
We have to find n(A U B). Using the Venn diagram formula,
n(A U B) = 12 + 15 - 5 = 22.
Applications of Venn Diagram
There are several advantages to using Venn diagrams. Venn diagram is used to illustrate concepts and groups in many fields, including statistics, linguistics, logic, education, computer science, and business.
- We can visually organize information to see the relationship between sets of items, such as commonalities and differences, and to depict the relations for visual communication.
- We can compare two or more subjects and clearly see what they have in common versus what makes them different. This might be done for selecting an important product or service to buy.
- Mathematicians also use Venn diagrams in math to solve complex equations.
- We can use Venn diagrams to compare data sets and to find correlations .
- Venn diagrams can be used to reason through the logic behind statements or equations .
☛ Related Articles:
Check out the following pages related to Venn diagrams:
- Operations on Sets
- Roster Notation
- Set Builder Notation
- Probability
Important Notes on Venn Diagrams:
Here is a list of a few points that should be remembered while studying Venn diagrams:
- Every set is a subset of itself i.e., A ⊆ A.
- A universal set accommodates all the sets under consideration.
- If A ⊆ B and B ⊆ A, then A = B
- The complement of a complement is the given set itself.
Examples of Venn Diagram
Example 1: Let us take an example of a set with various types of fruits, A = {guava, orange, mango, custard apple, papaya, watermelon, cherry}. Represent these subsets using sets notation: a) Fruit with one seed b) Fruit with more than one seed
Solution: Among the various types of fruit, only mango and cherry have one seed.
Answer: a) Fruit with one seed = {mango, cherry} b) Fruit with more than one seed = {guava, orange, custard apple, papaya, watermelon}
Note: If we represent these two sets on a Venn diagram, the intersection portion is empty.
Example 2: Let us take an example of two sets A and B, where A = {3, 7, 9} and B = {4, 8}. These two sets are subsets of the universal set U = {1, 2, 3, 4, 5, 6, 7, 8, 9}. Find A ∪ B.
Solution: The Venn diagram for the above relations can be drawn as:

Answer: A ∪ B means, all the elements that belong to either set A or set B or both the sets = {3, 4, 7, 8, 9}
Example 3: Using Venn diagram, find X ∩ Y, given that X = {1, 3, 5}, Y = {2, 4, 6}.
Given: X = {1, 3, 5}, Y = {2, 4, 6}
The Venn diagram for the above example can be given as,

Answer: From the blue shaded portion of Venn diagram, we observe that, X ∩ Y = ∅ ( null set ).
go to slide go to slide go to slide

Book a Free Trial Class
Venn Diagram Practice Questions
go to slide go to slide
FAQs on Venn Diagrams
What is a venn diagram in math.
In math, a Venn diagram is used to visualize the logical relationship between sets and their elements and helps us solve examples based on these sets.
How do You Read a Venn Diagram?
These are steps to be followed while reading a Venn diagram:
- First, observe all the circles that are present in the entire diagram.
- Every element present in a circle is its own item or data set.
- The intersecting or the overlapping portions of the circles contain the items that are common to the different circles.
- The parts that do not overlap or intersect show the elements that are unique to the different circle.
What is the Importance of Venn Diagram?
Venn diagrams are used in different fields including business, statistics, linguistics, etc. Venn diagrams can be used to visually organize information to see the relationship between sets of items, such as commonalities and differences, and to depict the relations for visual communication.
What is the Middle of a Venn Diagram Called?
When two or more sets intersect, overlap in the middle of a Venn diagram, it is called the intersection of a Venn diagram. This intersection contains all the elements that are common to all the different sets that overlap.
How to Represent a Universal Set Using Venn Diagram?
A large rectangle is used to represent the universal set and it is usually denoted by the symbol E or sometimes U. All the other sets are represented by circles or closed figures within this larger rectangle that represents the universal set.
What are the Different Types of Venn Diagrams?
The different types of Venn diagrams are:
- Two-set Venn diagram: The simplest of the Venn diagrams, that is made up of two circles or ovals of different sets to show their overlapping properties.
- Three-set Venn diagram: These are also called the three-circle Venn diagram, as they are made using three circles.
- Four-set Venn diagram: These are made out of four overlapping circles or ovals.
- Five-set Venn diagram: These comprise of five circles, ovals, or curves. In order to make a five-set Venn diagram, you can also pair a three-set diagram with repeating curves or circles.
What are the Different Fields of Applications of Venn Diagrams?
There are different cases of applications of Venn diagrams: Set theory, logic, mathematics, businesses, teaching, computer science, and statistics.
Can a Venn Diagram Have 2 Non Intersecting Circles?
Yes, a Venn digram can have two non intersecting circles where there is no data that is common to the categories belonging to both circles.
What is the Formula of Venn Diagram?
The formula that is very helpful to find the unknown information about a Venn diagram is n(A U B) = n(A) + n(B) – n (A ⋂ B), where
- A and B are two sets.
- n(A U B) is the number of elements in A U B.
- n (A ⋂ B) is the number of elements in A ⋂ B.
Can a Venn Diagram Have 3 Circles?
Yes, a Venn diagram can have 3 circles , and it's called a three-set Venn diagram to show the overlapping properties of the three circles.
What is Union in the Venn Diagram?
A union is one of the basic symbols used in the Venn diagram to show the relationship between the sets. A union of two sets C and D can be shown as C ∪ D, and read as C union D. It means, the elements belong to either set C or set D or both the sets.
What is A ∩ B Venn Diagram?
A ∩ B (which means A intersection B) in the Venn diagram represents the portion that is common to both the circles related to A and B. A ∩ B can be a null set as well and in this case, the two circles will either be non-intersecting or can be represented with intersecting circles having no data in the intersection portion.
Set Theory: Venn Diagrams And Subsets
Related Pages Union Of Sets Intersection Of Two Sets Intersection Of Three Sets More Lessons On Sets More Lessons for GCSE Maths Math Worksheets
What Is A Venn Diagram?
A Venn Diagram is a pictorial representation of the relationships between sets.
We can represent sets using Venn diagrams . In a Venn diagram, the sets are represented by shapes; usually circles or ovals. The elements of a set are labeled within the circle.
The following diagrams show the set operations and Venn Diagrams for Complement of a Set, Disjoint Sets, Subsets, Intersection and Union of Sets. Scroll down the page for more examples and solutions.

The set of all elements being considered is called the Universal Set (U) and is represented by a rectangle.
- The complement of A, A’ , is the set of elements in U but not in A. A’ ={ x | x ∈ U and x ∉ A}
- Sets A and B are disjoint sets if they do not share any common elements.
- B is a proper subset of A. This means B is a subset of A, but B ≠ A.
- The intersection of A and B is the set of elements in both set A and set B. A ∩ B = { x | x ∈ A and x ∈ B}
- The union of A and B is the set of elements in set A or set B. A ∪ B = { x | x ∈ A or x ∈ B}
Set Operations And Venn Diagrams
Example: 1. Create a Venn Diagram to show the relationship among the sets. U is the set of whole numbers from 1 to 15. A is the set of multiples of 3. B is the set of primes. C is the set of odd numbers.
2. Given the following Venn Diagram determine each of the following set. a) A ∩ B b) A ∪ B c) (A ∪ B)’ d) A’ ∩ B e) A ∪ B'
Venn Diagram Examples
Example: Given the set P is the set of even numbers between 15 and 25. Draw and label a Venn diagram to represent the set P and indicate all the elements of set P in the Venn diagram.
Solution: List out the elements of P . P = {16, 18, 20, 22, 24} ← ‘between’ does not include 15 and 25 Draw a circle or oval. Label it P . Put the elements in P .
Example: Draw and label a Venn diagram to represent the set R = {Monday, Tuesday, Wednesday}.
Solution: Draw a circle or oval. Label it R . Put the elements in R .
Example: Given the set Q = { x : 2 x – 3 < 11, x is a positive integer }. Draw and label a Venn diagram to represent the set Q .
Solution: Since an equation is given, we need to first solve for x . 2 x – 3 < 11 ⇒ 2 x < 14 ⇒ x < 7
So, Q = {1, 2, 3, 4, 5, 6} Draw a circle or oval. Label it Q . Put the elements in Q .
Venn Diagram Videos
What’s a Venn Diagram, and What Does Intersection and Union Mean?
Venn Diagram and Subsets
Learn about Venn diagrams and subsets.

We welcome your feedback, comments and questions about this site or page. Please submit your feedback or enquiries via our Feedback page.
1.3 Understanding Venn Diagrams
Learning objectives.
After completing this section, you should be able to:
- Utilize a universal set with two sets to interpret a Venn diagram.
- Utilize a universal set with two sets to create a Venn diagram.
- Determine the complement of a set.
Have you ever ordered a new dresser or bookcase that required assembly? When your package arrives you excitedly open it and spread out the pieces. Then you check the assembly guide and verify that you have all the parts required to assemble your new dresser. Now, the work begins. Luckily for you, the assembly guide includes step-by-step instructions with images that show you how to put together your product. If you are really lucky, the manufacturer may even provide a URL or QR code connecting you to an online video that demonstrates the complete assembly process. We can likely all agree that assembly instructions are much easier to follow when they include images or videos, rather than just written directions. The same goes for the relationships between sets.
Interpreting Venn Diagrams
Venn diagrams are the graphical tools or pictures that we use to visualize and understand relationships between sets. Venn diagrams are named after the mathematician John Venn, who first popularized their use in the 1880s. When we use a Venn diagram to visualize the relationships between sets, the entire set of data under consideration is drawn as a rectangle, and subsets of this set are drawn as circles completely contained within the rectangle. The entire set of data under consideration is known as the universal set .
Consider the statement: All trees are plants. This statement expresses the relationship between the set of all plants and the set of all trees. Because every tree is a plant, the set of trees is a subset of the set of plants. To represent this relationship using a Venn diagram, the set of plants will be our universal set and the set of trees will be the subset. Recall that this relationship is expressed symbolically as: Trees ⊂ Plants . Trees ⊂ Plants . To create a Venn diagram, first we draw a rectangle and label the universal set “ U = Plants . U = Plants . ” Then we draw a circle within the universal set and label it with the word “Trees.”
This section will introduce how to interpret and construct Venn diagrams. In future sections, as we expand our knowledge of relationships between sets, we will also develop our knowledge and use of Venn diagrams to explore how multiple sets can be combined to form new sets.
Example 1.18
Interpreting the relationship between sets in a venn diagram.
Write the relationship between the sets in the following Venn diagram, in words and symbolically.
The set of terriers is a subset of the universal set of dogs. In other words, the Venn diagram depicts the relationship that all terriers are dogs. This is expressed symbolically as T ⊂ U . T ⊂ U .
Your Turn 1.18
So far, the only relationship we have been considering between two sets is the subset relationship, but sets can be related in other ways. Lions and tigers are both different types of cats, but no lions are tigers, and no tigers are lions. Because the set of all lions and the set of all tigers do not have any members in common, we call these two sets disjoint sets , or non-overlapping sets.
Two sets A A and B B are disjoint sets if they do not share any elements in common. That is, if a a is a member of set A A , then a a is not a member of set B B . If b b is a member of set B B , then b b is not a member of set A A . To represent the relationship between the set of all cats and the sets of lions and tigers using a Venn diagram, we draw the universal set of cats as a rectangle and then draw a circle for the set of lions and a separate circle for the set of tigers within the rectangle, ensuring that the two circles representing the set of lions and the set of tigers do not touch or overlap in any way.
Example 1.19
Describing the relationship between sets.
Describe the relationship between the sets in the following Venn diagram.
The set of triangles and the set of squares are two disjoint subsets of the universal set of two-dimensional figures. The set of triangles does not share any elements in common with the set of squares. No triangles are squares and no squares are triangles, but both squares and triangles are 2D figures.
Your Turn 1.19
Creating venn diagrams.
The main purpose of a Venn diagram is to help you visualize the relationship between sets. As such, it is necessary to be able to draw Venn diagrams from a written or symbolic description of the relationship between sets.
To create a Venn diagram:
- Draw a rectangle to represent the universal set, and label it U = set name U = set name .
- Draw a circle within the rectangle to represent a subset of the universal set and label it with the set name.
If there are multiple disjoint subsets of the universal set, their separate circles should not touch or overlap.
Example 1.20
Drawing a venn diagram to represent the relationship between two sets.
Draw a Venn diagram to represent the relationship between each of the sets.
- All rectangles are parallelograms.
- All women are people.
- The set of rectangles is a subset of the set of parallelograms. First, draw a rectangle to represent the universal set and label it with U = Parallelograms U = Parallelograms , then draw a circle completely within the rectangle, and label it with the name of the set it represents, R = Rectangles R = Rectangles .
In this example, both letters and names are used to represent the sets involved, but this is not necessary. You may use either letters or names alone, as long as the relationship is clearly depicted in the diagram, as shown below.
- The universal set is the set of people, and the set of all women is a subset of the set of people.
Your Turn 1.20
Example 1.21, drawing a venn diagram to represent the relationship between three sets.
All bicycles and all cars have wheels, but no bicycle is a car. Draw a Venn diagram to represent this relationship.
Step 1: The set of bicycles and the set of cars are both subsets of the set of things with wheels. The universal set is the set of things with wheels, so we first draw a rectangle and label it with U = Things with Wheels U = Things with Wheels .
Step 2: Because the set of bicycles and the set of cars do not share any elements in common, these two sets are disjoint and must be drawn as two circles that do not touch or overlap with the universal set.
Your Turn 1.21
The complement of a set.
Recall that if set A A is a proper subset of set U U , the universal set (written symbolically as A ⊂ U A ⊂ U ), then there is at least one element in set U U that is not in set A A . The set of all the elements in the universal set U U that are not in the subset A A is called the complement of set A A , A ' A ' . In set builder notation this is written symbolically as: A ' = { x ∈ U | x ∉ A } . A ' = { x ∈ U | x ∉ A } . The symbol ∈ ∈ is used to represent the phrase, “is a member of,” and the symbol ∉ ∉ is used to represent the phrase, “is not a member of.” In the Venn diagram below, the complement of set A A is the region that lies outside the circle and inside the rectangle. The universal set U U includes all of the elements in set A A and all of the elements in the complement of set A A , and nothing else.
Consider the set of digit numbers. Let this be our universal set, U = { 0 , 1 , 2 , 3 , 4 , 5 , 6 , 7 , 8 , 9 } . U = { 0 , 1 , 2 , 3 , 4 , 5 , 6 , 7 , 8 , 9 } . Now, let set A A be the subset of U U consisting of all the prime numbers in set U U , A = { 2 , 3 , 5 , 7 } . A = { 2 , 3 , 5 , 7 } . The complement of set A A is A ' = { 0 , 1 , 4 , 6 , 8 , 9 } . A ' = { 0 , 1 , 4 , 6 , 8 , 9 } . The following Venn diagram represents this relationship graphically.
Example 1.22
Finding the complement of a set.
For both of the questions below, A A is a proper subset of U U .
- Given the universal set U = { Billie Eilish, Donald Glover, Bruno Mars, Adele, Ed Sheeran} U = { Billie Eilish, Donald Glover, Bruno Mars, Adele, Ed Sheeran} and set A = { Donald Glover, Bruno Mars, Ed Sheeran} A = { Donald Glover, Bruno Mars, Ed Sheeran} , find A ' . A ' .
- Given the universal set U = { d|d is a dog } U = { d|d is a dog } and B = { b ∈ U|b is a beagle } B = { b ∈ U|b is a beagle } , find B ' . B ' .
- The complement of set A A is the set of all elements in the universal set U U that are not in set A . A . A ' = { Billie Eilish, Adele } A ' = { Billie Eilish, Adele } .
- The complement of set B B is the set of all dogs that are not beagles. All members of set B ′ B ′ are in the universal set because they are dogs, but they are not in set B , B , because they are not beagles. This relationship can be expressed in set build notation as follows: B ′ = { All dogs that are not beagles .} B ′ = { All dogs that are not beagles .} , B ′ = { d ∈ U | d is not a beagle .} B ′ = { d ∈ U | d is not a beagle .} , or B ′ = { d ∈ U | d ∉ B } . B ′ = { d ∈ U | d ∉ B } .
Your Turn 1.22
Check your understanding, section 1.3 exercises.
As an Amazon Associate we earn from qualifying purchases.
This book may not be used in the training of large language models or otherwise be ingested into large language models or generative AI offerings without OpenStax's permission.
Want to cite, share, or modify this book? This book uses the Creative Commons Attribution License and you must attribute OpenStax.
Access for free at https://openstax.org/books/contemporary-mathematics/pages/1-introduction
- Authors: Donna Kirk
- Publisher/website: OpenStax
- Book title: Contemporary Mathematics
- Publication date: Mar 22, 2023
- Location: Houston, Texas
- Book URL: https://openstax.org/books/contemporary-mathematics/pages/1-introduction
- Section URL: https://openstax.org/books/contemporary-mathematics/pages/1-3-understanding-venn-diagrams
© Dec 21, 2023 OpenStax. Textbook content produced by OpenStax is licensed under a Creative Commons Attribution License . The OpenStax name, OpenStax logo, OpenStax book covers, OpenStax CNX name, and OpenStax CNX logo are not subject to the Creative Commons license and may not be reproduced without the prior and express written consent of Rice University.
Reset password New user? Sign up
Existing user? Log in
Venn Diagram
Already have an account? Log in here.
- Andrew Hayes
- Suyeon Khim
A Venn diagram is a diagram that shows the relationship between and among a finite collection of sets . If we have two or more sets, we can use a Venn diagram to show the logical relationship among these sets as well as the cardinality of those sets. In particular, Venn Diagrams are used to demonstrate De Morgan's Laws . Venn diagrams are also useful in illustrating relationships in statistics , probability , logic , and more.
Venn diagrams are particularly useful in helping us think carefully about set operations as they give us a visual depiction of the relationships involved.
Basic diagrams
Set notations in venn diagram, more on venn diagrams, example problems.
So what does a Venn diagram look like? To draw a Venn diagram we first draw a rectangle which will contain every item we want to consider. Since it contains every item, we can refer to it as "the universe."
Suppose now we wanted a set \(A\) which is a list of numbers containing 1 up to 5, and a set \(B\) which is a list of numbers containing 6 to 10. To represent each set we use circles:
How about if sets \(A\) and \(B\) have something in common? We can't simply draw two separate circles, as that won't form any logical relationship between the two. As you can see below, the way to show that relationship does indeed exist, where we merge the two circles partially.
In a universal set of all positive integers less than \(10,\) let \(A\) be the set of all positive even integers less than \(10,\) and \(B\) the set of all positive prime integers less than \(10\). Then what will the Venn diagram look like? we \(2\) is the only number that belongs to both sets, so it is found in the intersection point. Also we can see that \(1\) and \(9\) are found outside the circles but inside the rectangle or universal set. \(_\square\)
Venn diagrams are very useful in getting an intuition of set notations. Some common set notations and their respective diagrams are
1) \(A\cap B,\) read as \(A\) intersection \(B,\) is the set of all elements that are common to both \(A\) and \(B.\)
2) \( A\cup B,\) read as the union of \(A\) and \(B,\) is set of all elements found in both sets \(A\) and \(B.\) Observe that \(A \cup B= A + B - A\cap B,\) where we subtracted the intersection to account for the repetition of elements.
3) \(A\Delta B,\) read as symmetric difference of \(A\) and \(B,\) is the set of all elements in both sets excluding the intersection of the sets (\(A\cap B\)).
4) \(A' ,\) read as \(A\) compliment, is the set of all elements in the universal set excluding \(A\) itself. In some books the compliment notation is represented as \(A^{c}\).
The region marked in blue shows where the elements are found.
So far we have seen Venn diagrams showing the relationship between two sets, but that doesn't have to be the case, though the practicality of the diagram is lost after 3 sets.
Consider the above diagram where the number in each region indicates how many elements are there in that region. Then what is \[\] 1) the number of elements in set \(A?\) 2) the number of elements in set \(B?\) 3) the number of elements in sets \(A\) and \(B?\) 4) the number of elements in sets \(B\) and \(C?\) 5) the number of elements in sets \(A\) and \(C?\) 6) the number of elements in sets \(A\), \(B\) and \(C?\) 1) Adding up the numbers in set \(A\) gives \(n(A)=6+5+1+2=14.\) 2) Similarly, adding up the numbers in set \(B\) gives \(n(B)=2+8+1+7=18.\) 3) Ignore \(C\) and add up the elements found inside the intersection of \(A\) and \(B,\) then \(n(A\cap B)= 2 + 1=3.\) 4) Similarly, \(n(B\cap C)= 7+1=8.\) 5) Similarly, \(n(A\cap C)= 5+1=6.\) 6) The region marked in blue is the intersection of all 3 regions, so \(n(A\cap B \cap C)=1.\) \(_\square\)
When given sets and asked to find the relationship among them we see that Venn diagrams make things simpler. So it is advisable to use them when the sets are limited to 3.
Given the Venn diagram above consisting of a total of \(30\) students who study physics, biology, both and neither, if the total number of people studying physics and biology are \(19\) and \(11,\) respectively, what will be the number of people in the region marked "\(?\)" ? The region marked \(?\) is the region common to both physics and biology: \(P \cap B\). We know the total number of students is equal to the number of people in physics and biology \((P\cup B)\), plus the number of people in neither of the sets. Thus, \[\begin{align} \text{Total }&= P \cup B + 4\\ &= (P + B - P\cap B)+4\\ \\ \Rightarrow 30& = (19+11) - ? + 4\\ ?&=34-30 = 4. \ _\square \end{align}\]
Considering the diagram above: What percent of the the student study either biology only or physics only? The question can also be read as the symmetric difference between biology and physics students. So the total number of students studying physics only is \(19-4=15\) and the total number of students studying biology only is \(11-4=7\). This implies \[x=\frac { 22 }{ 30 } \times 100 \text{ (%)}=73.33 \text{ (%)}. \ _\square\]
Problem Loading...
Note Loading...
Set Loading...

- school Campus Bookshelves
- menu_book Bookshelves
- perm_media Learning Objects
- login Login
- how_to_reg Request Instructor Account
- hub Instructor Commons
- Download Page (PDF)
- Download Full Book (PDF)
- Periodic Table
- Physics Constants
- Scientific Calculator
- Reference & Cite
- Tools expand_more
- Readability
selected template will load here
This action is not available.
9.3: Venn Diagrams
- Last updated
- Save as PDF
- Page ID 62022

- David Lippman
- Pierce College via The OpenTextBookStore
To visualize the interaction of sets, John Venn in 1880 thought to use overlapping circles, building on a similar idea used by Leonhard Euler in the 18 th century. These illustrations now called Venn Diagrams .
Venn Diagram
A Venn diagram represents each set by a circle, usually drawn inside of a containing box representing the universal set. Overlapping areas indicate elements common to both sets.
Basic Venn diagrams can illustrate the interaction of two or three sets.
Create Venn diagrams to illustrate \(A \cup B, A \cap B,\) and \(A^{c} \cap B\)

\(A \cup B\) contains all elements in either set.

Use a Venn diagram to illustrate \((H \cap P)^{c} \cap W\)
We'll start by identifying everything in the set \(\mathrm{H} \cap P\)

Now, \((H \cap P)^{c} \cap W\) will contain everything not in the set identified above that is also in set \(W\)

Create an expression to represent the outlined part of the Venn diagram shown.

Try it Now 1
Create an expression to represent the outlined portion of the Venn diagram shown

\(A \cup B \cap C^{c}\)
VENN DIAGRAMS AND CARDINALITY
In the last section, we got formulas for cacluating the cardinality of unions and intersections of two sets. Venn diagrams are very useful for visually orgainzing information relating to cardinality (especially with more than two sets).
Fifty students were surveyed, and asked if they were taking a social science (SS), humanities (HM) or a natural science (NS) course the next quarter.
\(\begin{array}{ll} \text{21 were taking a SS course} & \text{26 were taking a HM course} \\ \text{19 were taking a NS course} & \text{9 were taking SS and HM} \\ \text{7 were taking SS and NS} & \text{10 were taking HM and NS} \\ \text{3 were taking all three} & \text{7 were taking none} \end{array}\)
How many students are only taking a SS course?

From the given data, we know that there are 3 students in region \(e\) and 7 students in region \(h\)
since 7 students were taking a \(S S\) and \(N S\) course, we know that \(n(d)+n(e)=7\). since we know there are 3 students in region 3 , there must be \(7-3=4\) students in region \(d\)
Similarly, since there are 10 students taking \(\mathrm{HM}\) and \(\mathrm{NS}\), which includes regions \(e\) and \(f\), there must be
\(10-3=7\) students in region \(f\)
Since 9 students were taking \(\mathrm{SS}\) and \(\mathrm{HM}\), there must be \(9-3=6\) students in region \(b\)
Now, we know that 21 students were taking a SS course. This includes students from regions \(a, b, d,\) and \(e .\) since we know the number of students in all but region \(a,\) we can determine that \(21-6-4-3=8\) students are in region \(a\)
8 students are taking only a SS course.
Try it Now 2
One hundred fifty people were surveyed and asked if they believed in UFOs, ghosts, and Bigfoot.
\(\begin{array}{ll} \text{43 believed in UFOs} & \text{44 believed in ghosts} \\ \text{25 believed in Bigfoot} & \text{10 believed in UFOs and ghosts} \\ \text{8 believed in ghosts and Bigfoot} & \text{5 believed in UFOs and Bigfoot} \\ \text{2 believed in all three} & \text{} \end{array}\)
(a) How many people surveyed believed in at least one of these things?
(b) How many people believed in none of them?

(b) Since we already know from part (a) that 91 people believe in at least one of UFOs, ghosts, and bigfoot, we can substract this number from 150 (the cardinality of the universal set) to get the number of people who believe in none of them.This gives us \(150-91=59\) who believe in none.
Venn Diagram Questions
Venn diagram questions with solutions are given here for students to practice various questions based on Venn diagrams. These questions are beneficial for both school examinations and competitive exams. Practising these questions will develop a skill to solve any problem on Venn diagrams quickly.
Venn diagrams were first introduced by John Venn to represent various propositions in a diagrammatic way. Venn diagrams are used for representing relationships between given sets. For example, natural numbers and whole numbers are subsets of integers represented by the Venn diagram:
Using Venn diagrams, we can easily understand whether given sets are subsets of each other or disjoint sets or have something in common.
- Intersection of Sets
- Union of Sets
- Complement of Set
- Set Operations
Following are some set operations and their meaning useful while solving problems on the Venn diagram:
Some important formulae:
Venn Diagram Questions with Solution
Let us practice some questions based on Venn diagrams.
Question 1: If A and B are two sets such that number of elements in A is 24, number of elements in B is 22 and number of elements in both A and B is 8, find:
(i) n(A ∪ B)
(ii) n(A – B)
(ii) n(B – A)
Given, n(A) = 24, n(B) = 22 and n(A ∩ B) = 8
The Venn diagram for the given information is:
(i) n(A ∪ B) = n(A) + n(B) – n(A ∩ B) = 24 + 22 – 8 = 38.
(ii) n(A – B) = n(A) – n(A ∩ B) = 24 – 8 = 16.
(iii) n(B – A) = n(B) – n(A ∩ B) = 22 – 8 = 14.
Question 2: According to the survey made among 200 students, 140 students like cold drinks, 120 students like milkshakes and 80 like both. How many students like atleast one of the drinks?
Number of students like cold drinks = n(A) = 140
Number of students like milkshake = n(B) = 120
Number of students like both = n(A ∩ B) = 80
Number of students like atleast one of the drinks = n(A ∪ B) = n(A) + n(B) – n(A ∩ B)
= 140 + 120 – 80
Question 3: In a group of 500 people, 350 people can speak English, and 400 people can speak Hindi. Find how many people can speak both languages?
Let H be the set of people who can speak Hindi and E be the set of people who can speak English. Then,
n(H ∪ E) = 500
We have to find n(H ∩ E).
Now, n(H ∪ E) = n(H) + n(E) – n(H ∩ E)
⇒ 500 = 400 + 350 – n(H ∩ E)
⇒ n(H ∩ E) = 750 – 500 = 250.
∴ 250 people can speak both languages.
Questions 4: The following Venn diagram shows games played by the number of students in a class:
How many students like only cricket and only football?
As per the given Venn diagram,
Number of students only like cricket = 7
Number of students only like football = 14
∴ Number of students like only cricket and only football = 7 + 14 = 21.
Question 5: In a class of 40 students, 20 have chosen Mathematics, 15 have chosen mathematics but not biology. If every student has chosen either mathematics or biology or both, find the number of students who chose both mathematics and biology and the number of students chose biology but not mathematics.
Let, M ≡ Set of students who chose mathematics
B ≡ Set of students who chose biology
n(M ∪ B) = 40
n(B) = n(M ∪ B) – n(M)
⇒ n(B) = 40 – 20 = 20
n(M – B) = 15
n(M) = n(M – B) + n(M ∩ B)
⇒ 20 = 15 + n(M ∩ B)
⇒ n(M ∩ B) = 20 – 15 = 5
n(B – M) = n(B) – n(M ∩ B)
⇒ n(B – M) = 20 – 5 = 15
Question 6: Represent The following as Venn diagram:
(i) A’ ∩ (B ∪ C)
(ii) A’ ∩ (C – B)
Question 7: In a survey among 140 students, 60 likes to play videogames, 70 likes to play indoor games, 75 likes to play outdoor games, 30 play indoor and outdoor games, 18 like to play video games and outdoor games, 42 play video games and indoor games and 8 likes to play all types of games. Use the Venn diagram to find
(i) students who play only outdoor games
(ii) students who play video games and indoor games, but not outdoor games.
Let V ≡ Play video games
I ≡ Play indoor games
O ≡ Play outdoor games
n(V) = 60, n(I) = 70, n(O) = 75
n(I ∩ O) = 30, n(V ∩ O) = 18, n(V ∩ I) = 42
n(V ∩ I ∩ O) = 8
Hence, by Venn diagram
Number of students only like to play only outdoor games = 35
Number of students like to play video games and indoor games but not outdoor games = 34
Note : Always begin to fill the Venn diagram from the innermost part.
Question 8: Using the Venn diagrams, verify (P ∩ Q) ∪ R = (P ∪ R) ∩ (Q ∪ R).
The shaded portion represents (P ∩ Q) ∪ R in the Venn diagram.
Comparing both the shaded portion in both the Venn diagram, we get (P ∩ Q) ∪ R = (P ∪ R) ∩ (Q ∪ R).
Question 9: Prove using the Venn diagram: (B – A) ∪ (A ∩ B) = B.
From the Venn diagram, it is clear that (B – A) ∪ (A ∩ B) = B
Question 10: In a survey, it is found that 21 people read English newspaper, 26 people read Hindi newspaper, and 29 people read regional language newspaper. If 14 people read both English and Hindi newspapers; 15 people read both Hindi and regional language newspapers; 12 people read both English and regional language newspaper and 8 read all types of newspapers, find:
(i) How many people were surveyed?
(ii) How many people read only regional language newspapers?
Let A ≡ People who read English newspapers.
B ≡ People who read Hindi newspapers.
C ≡ People who read Hindi newspapers.
n(A) = 21, n(B) = 26, n(C) = 29
n(A ∩ B) = 14, n(B ∩ C) = 15, n(A ∩ C) = 12
n(A ∩ B ∩ C) = 8
(i) Number of people surveyed = n(A ∪ B ∪ C) = n(A) + n(B) + n(C) – n(A ∩ B) – n(B ∩ C) – n(A ∩ C) + n(A ∩ B ∩ C) = 21 + 26 + 29 – 14 – 15 – 12 + 8 = 43
(ii) By the Venn diagram, number of people who only read regional language newspapers = 10.
Video Lesson on Introduction to Sets

Practice Questions on Venn Diagrams
1. Verify using the Venn diagram:
(i) A – B = A ∩ B C
(ii) (A ∩ B) C = A C ∪ B C
2. For given two sets P and Q, n(P – Q) = 24, n(Q – P) = 19 and n(P ∩ Q) = 11, find:
(iii) n (P ∪ Q)
3. In a group of 65 people, 40 like tea and 10 like both tea and coffee. Find
(i) how many like coffee only and not tea?
(ii) how many like coffee?
4. In a sports tournament, 38 medals were awarded for 500 m sprint, 15 medals were awarded for Javelin throw, and 20 medals were awarded for a long jump. If these medals were awarded to 58 participants and among them only three medals in all three sports, how many received exactly two medals?
Keep visiting BYJU’S to get more such Maths lessons in a simple, concise and easy to understand way. Also, register at BYJU’S – The Learning App to get complete assistance for Maths preparation with video lessons, notes, tips and other study materials.
- Share Share
Register with BYJU'S & Download Free PDFs
Register with byju's & watch live videos.

What is a Venn Diagram
What are your venn diagram needs.
Creating Venn diagrams is super simple and easy with our Venn diagram maker. Learn the essentials of Venn diagrams, along with their long history, versatile purposes and uses, examples and symbols, and steps to draw them.
7 minute read
Want to make a Venn diagram of your own? Try Lucidchart. It's quick, easy, and completely free.
What is a Venn diagram?
A Venn diagram uses overlapping circles or other shapes to illustrate the logical relationships between two or more sets of items. Often, they serve to graphically organize things, highlighting how the items are similar and different.
Venn diagrams, also called Set diagrams or Logic diagrams, are widely used in mathematics, statistics, logic, teaching, linguistics, computer science and business. Many people first encounter them in school as they study math or logic, since Venn diagrams became part of “new math” curricula in the 1960s. These may be simple diagrams involving two or three sets of a few elements, or they may become quite sophisticated, including 3D presentations, as they progress to six or seven sets and beyond. They are used to think through and depict how items relate to each within a particular “universe” or segment. Venn diagrams allow users to visualize data in clear, powerful ways, and therefore are commonly used in presentations and reports. They are closely related to Euler diagrams, which differ by omitting sets if no items exist in them. Venn diagrams show relationships even if a set is empty.
Venn diagram history
Venn diagrams are named after British logician John Venn. He wrote about them in an 1880 paper entitled “On the Diagrammatic and Mechanical Representation of Propositions and Reasonings” in the Philosophical Magazine and Journal of Science.
But the roots of this type of diagram go back much further, at least 600 years. In the 1200s, philosopher and logician Ramon Llull (sometimes spelled Lull) of Majorca used a similar type of diagram, wrote author M.E. Baron in a 1969 article tracing their history. She also credited German mathematician and philosopher Gottfried Wilhelm von Leibnitz with drawing similar diagrams in the late 1600s.
In the 1700s, Swiss mathematician Leonard Euler (pronounced Oy-ler) invented what came to be known as the Euler Diagram, the most direct forerunner of the Venn Diagram. In fact, John Venn referred to his own diagrams as Eulerian Circles, not Venn Diagrams. The term Venn Diagrams was first published by American philosopher Clarence Irving (C.I.) Lewis in his 1918 book, A Survey of Symbolic Logic.
Venn Diagrams continued to evolve over the past 60 years with advances by experts David W. Henderson, Peter Hamburger, Jerrold Griggs, Charles E. “Chip” Killian and Carla D. Savage. Their work concerned symmetric Venn Diagrams and their relationship to prime numbers, or numbers indivisible by other numbers except 1 and the number itself. One such symmetric diagram, based on prime number 7, is widely known in math circles as Victoria.
Other notable names in the development of Venn Diagrams are A.W.F. Edwards, Branko Grunbaum and Henry John Stephen Smith. Among other things, they changed the shapes in the diagrams to allow simpler depiction of Venn Diagrams at increasing numbers of sets.
Example Venn diagram
Say our universe is pets, and we want to compare which type of pet our family might agree on.
Set A contains my preferences: dog, bird, hamster.
Set B contains Family Member B’s preferences: dog, cat, fish.
Set C contains Family Member C’s preferences: dog, cat, turtle, snake.
The overlap, or intersection, of the three sets contains only dog. Looks like we’re getting a dog.
Of course, Venn diagrams can get a lot more involved than that, as they are used extensively in various fields.
Venn diagram purpose and benefits
To visually organize information, to compare two or more choices, to solve complex mathematical problems., to compare data sets,, to reason through the logic, venn diagram use cases, statistics and probability:, linguistics:, teaching reading comprehension:, computer science:, venn diagram glossary, on a lighter note: venn diagrams hit the small screen.
Not many diagrams have crossed over into popular culture, but the esteemed Venn diagram has.
Steps to draw and use a basic Venn diagram
- Determine your goal. What are you comparing, and why? This will help you to define your sets.
- Brainstorm and list the items in your sets, either on paper or with a platform like Lucidchart.
- Now, use your diagram to compare and contrast the sets. You may see things in new ways and be able to make observations, choices, arguments or decisions.
Additional Resources
- Venn Diagram Templates
- How to Create a Venn Diagram in PowerPoint
Lucidchart lets you create professional-looking Venn diagrams with easy-to-use software. With all editing taking place in the cloud, it’s easy to collaborate with colleagues on a Venn diagram. You can even import images and share your diagram digitally or via print.

- school Campus Bookshelves
- menu_book Bookshelves
- perm_media Learning Objects
- login Login
- how_to_reg Request Instructor Account
- hub Instructor Commons
- Download Page (PDF)
- Download Full Book (PDF)
- Periodic Table
- Physics Constants
- Scientific Calculator
- Reference & Cite
- Tools expand_more
- Readability
selected template will load here
This action is not available.
4.5: Intersection and Union of Events and Venn Diagrams
- Last updated
- Save as PDF
- Page ID 26049

Sometimes, when the probability problems are complex, it can be helpful to graph the situation. Tree diagrams and Venn diagrams are two tools that can be used to visualize and solve conditional probabilities.
Tree Diagrams
A tree diagram is a special type of graph used to determine the outcomes of an experiment. It consists of "branches" that are labeled with either frequencies or probabilities. Tree diagrams can make some probability problems easier to visualize and solve. The following example illustrates how to use a tree diagram.
Example \(\PageIndex{1}\): Probabilities from Sampling with replacement
In an urn, there are 11 balls. Three balls are red (\(\text{R}\)) and eight balls are blue (\(\text{B}\)). Draw two balls, one at a time, with replacement (remember that "with replacement" means that you put the first ball back in the urn before you select the second ball). The tree diagram using frequencies that show all the possible outcomes follows.

The first set of branches represents the first draw. The second set of branches represents the second draw. Each of the outcomes is distinct. In fact, we can list each red ball as R 1, R 2, and R 3 and each blue ball as B 1, B 2, B 3, B 4, B 5, B 6, B 7, and B 8. Then the nine RR outcomes can be written as:
R 1 R 1 R 1 R 2 R 1 R 3 R 2 R 1 R 2 R 2 R 2 R 3 R 3 R 1 R 3 R 2 R 3 R 3
The other outcomes are similar.
There are a total of 11 balls in the urn. Draw two balls, one at a time, with replacement. There are 11(11) = 121 outcomes, the size of the sample space.
Example \(\PageIndex{2}\): Probabilities from Sampling without replacement
An urn has three red marbles and eight blue marbles in it. Draw two marbles, one at a time, this time without replacement, from the urn. (remember that "without replacement" means that you do not put the first ball back before you select the second marble). Following is a tree diagram for this situation. The branches are labeled with probabilities instead of frequencies. The numbers at the ends of the branches are calculated by multiplying the numbers on the two corresponding branches, for example, \(\left(\frac{3}{11}\right)\left(\frac{2}{10}\right) = \frac{6}{110}\).

If you draw a red on the first draw from the three red possibilities, there are two red marbles left to draw on the second draw. You do not put back or replace the first marble after you have drawn it. You draw without replacement , so that on the second draw there are ten marbles left in the urn.
Calculate the following probabilities using the tree diagram.
- \(P(\text{RR}) =\) ________
- Fill in the blanks: \(P(\text{RB OR BR}) = \left(\frac{3}{11}\right) \left(\frac{8}{10}\right) +\) (___)(___) \(= \frac{48}{110}\)
- \(P(\text{R on 2nd|B on 1st}) =\)
- Fill in the blanks: \(P(\text{R on 1st AND B on 2nd}) = P(\text{RB}) =\) (___)(___) \(= \frac{24}{110}\)
- Find \(P(\text{BB})\).
- Find \(P(\text{B on 2nd|R on 1st})\).
- \(P(\text{RR}) = \left(\frac{3}{11}\right)\left(\frac{2}{10}\right) = \frac{6}{110}\)
- \(P(\text{RB OR BR}) = \left(\frac{3}{11}\right)\left(\frac{8}{10}\right) + \left(\frac{8}{11}\right)\left(\frac{3}{10}\right) = \frac{48}{110}\)
- \(P(\text{R on 2nd|B on 1st}) = \frac{3}{10}\)
- \(P(\text{R on 1st AND B on 2nd}) = P(\text{RB}) = \left(\frac{3}{11}\right) \left(\frac{8}{10}\right) = \frac{24}{110}\)
- \(P(\text{BB}) = \left(\frac{8}{11}\right)\left(\frac{7}{10}\right)\)
- Using the tree diagram, \(P(\text{B on 2nd|R on 1st}) = P(\text{R|B}) = \frac{8}{10}\).
If we are using probabilities, we can label the tree in the following general way.

- \(P(\text{R|R})\) here means \(P(\text{R on 2nd|R on 1st})\)
- \(P(\text{B|R})\) here means \(P(\text{B on 2nd|R on 1st})\)
- \(P(\text{R|B})\) here means \(P(\text{R on 2nd|B on 1st})\)
- \(P(\text{B|B})\) here means \(P(\text{B on 2nd|B on 1st})\)
Example \(\PageIndex{3}\)
A litter of kittens available for adoption at the Humane Society has four tabby kittens and five black kittens. A family comes in and randomly selects two kittens (without replacement) for adoption.

- What is the probability that both kittens are tabby? a. \(\left(\frac{1}{2}\right) \left(\frac{1}{2}\right)\) b. \(\left(\frac{4}{9}\right) \left(\frac{4}{9}\right)\) c. \(\left(\frac{4}{9}\right) \left(\frac{3}{8}\right)\) d. \(\left(\frac{4}{9}\right) \left(\frac{5}{9}\right)\)
- What is the probability that one kitten of each coloring is selected? a. \(\left(\frac{4}{9}\right) \left(\frac{5}{9}\right)\) b. \(\left(\frac{4}{9}\right) \left(\frac{5}{8}\right)\) c. \(\left(\frac{4}{9}\right) \left(\frac{5}{9}\right)\) + \(\left(\frac{5}{9}\right) \left(\frac{4}{9}\right)\) d. \(\left(\frac{4}{9}\right) \left(\frac{5}{8}\right)\) + \(\left(\frac{5}{9}\right) \left(\frac{4}{8}\right)\)
- What is the probability that a tabby is chosen as the second kitten when a black kitten was chosen as the first?
- What is the probability of choosing two kittens of the same color?
a. c, b. d, c. \(\frac{4}{8}\), d. \(\frac{32}{72}\)
Venn Diagram
A Venn diagram is a picture that represents the outcomes of an experiment. It generally consists of a box that represents the sample space S together with circles or ovals. The circles or ovals represent events.
Example \(\PageIndex{4}\)
Suppose an experiment has the outcomes 1, 2, 3, ... , 12 where each outcome has an equal chance of occurring. Let event \(\text{A} =\) {1, 2, 3, 4, 5, 6} and event \(\text{B} =\) {6, 7, 8, 9}. Then \(\text{A AND B} =\) {6} and \(\text{A OR B} =\) {1, 2, 3, 4, 5, 6, 7, 8, 9}. The Venn diagram is as follows:

Example \(\PageIndex{5}\)
Flip two fair coins. Let \(\text{A} =\) tails on the first coin. Let \(\text{B} =\) tails on the second coin. Then \(\text{A} =\) { TT , TH } and \(\text{B} =\) { TT , HT }. Therefore, \(\text{A AND B} =\) { TT }. \(\text{A OR B} =\) { TH , TT , HT }.
The sample space when you flip two fair coins is \(X =\) { HH , HT , TH , TT }. The outcome HH is in \(\text{NEITHER A NOR B}\). The Venn diagram is as follows:

Example \(\PageIndex{6}\): Probability and Venn Diagrams
Forty percent of the students at a local college belong to a club and 50% work part time. Five percent of the students work part time and belong to a club. Draw a Venn diagram showing the relationships. Let \(\text{C} =\) student belongs to a club and \(\text{PT} =\) student works part time.

If a student is selected at random, find
- the probability that the student belongs to a club. \(P(\text{C}) = 0.40\)
- the probability that the student works part time. \(P(\text{PT}) = 0.50\)
- the probability that the student belongs to a club AND works part time. \(P(\text{C AND PT}) = 0.05\)
- the probability that the student belongs to a club given that the student works part time. \(P(\text{C|PT}) = \frac{P(\text{C AND PT})}{P(\text{PT})} = \frac{0.05}{0.50} = 0.1\)
- the probability that the student belongs to a club OR works part time. \(P(\text{C OR PT}) = P(\text{C}) + P(\text{PT}) - P(\text{C AND PT}) = 0.40 + 0.50 - 0.05 = 0.85\)
Example \(\PageIndex{7}\)
A person with type O blood and a negative Rh factor (Rh-) can donate blood to any person with any blood type. Four percent of African Americans have type O blood and a negative RH factor, 5−10% of African Americans have the Rh- factor, and 51% have type O blood.

The “O” circle represents the African Americans with type O blood. The “Rh-“ oval represents the African Americans with the Rh- factor.
We will take the average of 5% and 10% and use 7.5% as the percent of African Americans who have the Rh- factor. Let \(\text{O} =\) African American with Type O blood and \(\text{R} =\) African American with Rh- factor.
- \(P(\text{O}) =\) ___________
- \(P(\text{R}) =\) ___________
- \(P(\text{O AND R}) =\) ___________
- \(P(\text{O OR R}) =\) ____________
- In the Venn Diagram, describe the overlapping area using a complete sentence.
- In the Venn Diagram, describe the area in the rectangle but outside both the circle and the oval using a complete sentence.
a. 0.51; b. 0.075; c. 0.04; d. 0.545; e. The area represents the African Americans that have type O blood and the Rh- factor. f. The area represents the African Americans that have neither type O blood nor the Rh- factor.
WeBWorK Problems
Query \(\PageIndex{1}\)
Query \(\PageIndex{2}\)
Query \(\PageIndex{3}\)
Query \(\PageIndex{4}\)
Query \(\PageIndex{5}\)
Query \(\PageIndex{6}\)
- Data from Clara County Public H.D.
- Data from the American Cancer Society.
- Data from The Data and Story Library, 1996. Available online at http://lib.stat.cmu.edu/DASL/ (accessed May 2, 2013).
- Data from the Federal Highway Administration, part of the United States Department of Transportation.
- Data from the United States Census Bureau, part of the United States Department of Commerce.
- Data from USA Today.
- “Environment.” The World Bank, 2013. Available online at http://data.worldbank.org/topic/environment (accessed May 2, 2013).
- “Search for Datasets.” Roper Center: Public Opinion Archives, University of Connecticut., 2013. Available online at www.ropercenter.uconn.edu/data_access/data/search_for_datasets.html (accessed May 2, 2013).
A tree diagram use branches to show the different outcomes of experiments and makes complex probability questions easy to visualize. A Venn diagram is a picture that represents the outcomes of an experiment. It generally consists of a box that represents the sample space S together with circles or ovals. The circles or ovals represent events. A Venn diagram is especially helpful for visualizing the OR event, the AND event, and the complement of an event and for understanding conditional probabilities.

Lisa Lightner
- 60 Free Graphic Organizer Template PDFs
Posted: January 10, 2024 | Last updated: May 1, 2024

- Graphic organizers are visual tools that help students organize and process information.
- There are many different types of graphic organizers that can be used to organize information in different ways.
- Using graphic organizers in education can help students better understand and remember information, as well as improve their critical thinking and problem-solving skills.
I belong to a small group of female bloggers. We meet on Zoom and discuss all the various aspects of blogging and owning a website. I recently began using graphic organizers to plan out my blog content.
On our last Zoom call, I used “share screen” to talk about what I was working on. (I’m trying some new things.) One of the other women said, “A-ha! I get it now. I never could really grasp how to cluster my content, but I love that worksheet you used. I understand it now.”
Sometimes it’s the simplest things that can make a huge difference. Like a graphic organizer PDF.

What are Graphic Organizers?
Graphic organizers are visual tools that help students organize and process information. They are used in education to enhance learning and improve comprehension. Graphic organizers come in different types and can be customized to fit the needs of each individual student.
Graphic organizers are visual tools that help individuals organize and understand information. They are commonly used in educational settings to help students learn and retain information. Graphic organizers come in a variety of forms, including tables, diagrams, charts, and story maps .
One of the main benefits of using graphic organizers is that they help individuals see the connections between different pieces of information. This can make it easier to understand complex concepts and remember important details.
For example, a mind map can be used to organize ideas for a research paper, while a Venn diagram can be used to compare and contrast different concepts.
Another benefit of graphic organizers is that they can be customized to fit an individual’s learning style. Some people prefer visual aids, while others may prefer more text-based information.
By using graphic organizers, individuals can create a personalized learning experience that fits their needs.
It is important to note that graphic organizers are not a one-size-fits-all accommodation. While they can be helpful for many students, some individuals may find them confusing or overwhelming. It is important to experiment with different types of graphic organizers to find the ones that work best for each student.

Venn Diagrams
Venn diagrams are a type of graphic organizer that allows students to compare and contrast two or more items. They consist of two or more overlapping circles, with each circle representing a different item.
The overlapping area represents the similarities between the items, while the non-overlapping areas represent the differences. This is what a Venn diagram looks like.
And here is the printable Venn diagram PDF.

Mind maps are a type of graphic organizer that help students brainstorm and organize ideas. They consist of a central idea or topic, with branches extending outwards to subtopics and supporting details.
Mind maps are a great way to visualize complex information and see how different ideas are connected. Here is one example of a mind map graphic organizer.
And here is the PDF mind map. I removed the words “mind map” from the middle so you can customize it.

Concept Maps
Concept maps are similar to mind maps, but they focus more on the relationships between ideas. They consist of nodes, which represent concepts or ideas, and links, which represent the relationships between those concepts.
Concept maps are a great way to organize and understand complex information. Here is one type of concept map.
And here is that concept map printable. I removed the words and the beige/vanilla background so you can print and customize it.

Timelines are a type of graphic organizer that show the sequence of events over time. They consist of a horizontal line with dates or time periods marked along it, and events or milestones marked at the appropriate points.
Timelines are a great way to understand the chronological order of events and how they relate to each other. Here is a timeline example.
And here is that PDF timeline template.

KWL stands for Know, Want to Know, Learn. Here is a sample KWL chart.
And here is the PDF KWL chart.

How do graphic organizer examples help in understanding their application in real classroom scenarios?
Graphic organizer examples can help in understanding their application in real classroom scenarios by providing concrete examples of how they can be used to support learning objectives. By seeing how graphic organizers are used in real classroom scenarios, teachers can better understand how to integrate them into their own teaching practices. Additionally, graphic organizer examples can help students understand how to use them effectively, which can lead to improved learning outcomes.
How to Improve Executive Function Skills
- Simon Says Ideas : Free Printable List and Simon Says Card PDF
- 20 Popular Critical Thinking Games
- How to Teach Executive Functioning Skills (Classroom and Home)
- Printable List of Executive Functioning Accommodations for an IEP or 504 Plan
- Task Avoidance Behavior : Replacement Behaviors, IEP Accommodations and More.
- What is ADHD Overwhelm and How do you Overcome It?
- How to Teach Task Initiation
- Difficulty Following Instructions ? 15 Ways to Increase a Child’s Ability to Follow Directions
- 5 Word and Picture Matching Worksheets + How to Improve Matching Skills
- How to Teach Inference for Kids (Picture Cards + IEP Accommodations)
- Stay Organized and Productive with these 5 Free ADHD To-Do List Templates (PDFs)
- 40 Working Memory IEP Accommodations (PDF)
- 17 Work Completion IEP Accommodations (Preferred and Non-Preferred Tasks)
- How to Improve Slow Processing Speed in Kids at School and at Home
- What is an Executive Functioning Coach and What do they Do?
- How to Overcome Task Paralysis , an Important Executive Function
- Study Skills and Note-Taking : IEP and 504 Plan Accommodations and Strategies
- 10 Common Executive Function Assessments Parents Should Know About
- Time Blindness and ADHD or Autism: How to Manage It
- 20 Free Apps for Executive Function Skill Deficits for Students and Adults
- Improve Focus and Attention : 10 IEP Accommodations and Strategies
- 20 IEP and 504 Plan Accommodations for Impulse Control
- Beyond Checkers and Chess: 8 Unusual and Educational Board Games for Older Kids
More for You
Average US annual salary by age revealed – see how you compare
Doocy Confronts Jean-Pierre On Being Columbia Alumna Amid Protests
Ranking the 21 'American Idol' winners
We Ordered 7 Fast-Food Breakfast Sandwiches to Find the Best One
What Is the Average Height for Women?
18 ‘Normal’ Things From the ’80s and ’90s That Are Considered Luxuries Now
Man loses 450 pounds after reaching 'rock bottom.' 1 key diet change helped
A woman said her tattoos got her rejected for a job, but experts say personality is far more important
I Cut My Food Expenses In Half Using The Viral "6-To-1" Grocery Method — Here's How
18 Things That Will Happen if 70 Becomes the New Retirement Age in the US
McDonald's Is Going To Release Its Biggest Burger Ever
Rock Queens: Recognizing 25 Women Who Shaped the Music Industry
17 Polite Habits Most People Secretly Dislike
Employers Are Avoiding Hiring Gen Z Workers- Here's Why
Here are all the top contenders to be Trump's vice-presidential nominee in 2024
45 Desserts from Around the World
I Asked 4 Chefs What Their Favorite Fast Food Cheeseburger Was and Their Pick Was Unanimous
What Do All the Heart Emojis Mean? A Guide To Using the Symbols of Love
Pokemon and Krispy Kreme Collaborate on Exclusive Donut Release
These 10 colleges may be as good as the Ivy League, according to Forbes
IMAGES
VIDEO
COMMENTS
The best way to explain how the Venn diagram works and what its formulas show is to give 2 or 3 circles Venn diagram examples and problems with solutions. Problem-solving using Venn diagram is a widely used approach in many areas such as statistics, data science, business, set theory, math, logic and etc.
High school Venn diagram questions. In high school, students are expected to be able to take information from word problems and put it onto a Venn diagram involving two or three sets. The use of set notation is extended and the probabilities become more complex. In advanced math classes, Venn diagrams are used to calculate conditional probability.
A simple Venn diagram example. The overlapping areas between the two boundaries describe the elements which are common between the two, while the areas that aren't overlapping house the elements that are different. Venn diagrams are used often in math that people tend to assume they are used only to solve math problems.
Here's a step-by-step guide on how to solve problems using Venn diagrams: Step 1: Understand the Problem. As with any problem-solving method, the first step is to understand the problem. ... (set) should be labeled appropriately. If you're dealing with sets of different types of fruits, for example, one might be labeled "Apples" and ...
Purplemath. Venn diagram word problems generally give you two or three classifications and a bunch of numbers. You then have to use the given information to populate the diagram and figure out the remaining information. For instance: Out of forty students, 14 are taking English Composition and 29 are taking Chemistry.
Here is an example on how to solve a Venn diagram word problem that involves three intersecting sets. 90 students went to a school carnival. 3 had a hamburger, soft drink and ice-cream. 24 had hamburgers. 5 had a hamburger and a soft drink. 33 had soft drinks. 10 had a soft drink and ice-cream. 38 had ice-cream. 8 had a hamburger and ice-cream.
A Venn diagram is a diagram that helps us visualize the logical relationship between sets and their elements and helps us solve examples based on these sets. A Venn diagram typically uses intersecting and non-intersecting circles (although other closed figures like squares may be used) to denote the relationship between sets.
Venn Diagram Examples. Example: Given the set P is the set of even numbers between 15 and 25. Draw and label a Venn diagram to represent the set P and indicate all the elements of set P in the Venn diagram.. Solution: List out the elements of P. P = {16, 18, 20, 22, 24} ← 'between' does not include 15 and 25 Draw a circle or oval.
Art of Problem Solving's Richard Rusczyk introduces 2-circle Venn diagrams, and using subtraction as a counting technique.Learn more: http://bit.ly/ArtofProb...
Worksheet Solving problems using Venn diagrams Qu 1-3 9-1 class textbook: p246 M8.7 Qu 1-6 (Look at Qu 2 and 5 in class) A*-G class textbook: No exercise 9-1 homework book: p84 M8.7 Qu 1-5 A*-G homework book: No exercise Summary When completing the Venn diagram, fill in the number in the overlap or outside the circles first.
To represent this relationship using a Venn diagram, the set of plants will be our universal set and the set of trees will be the subset. Recall that this relationship is expressed symbolically as: Trees ⊂ Plants. Trees ⊂ Plants. To create a Venn diagram, first we draw a rectangle and label the universal set " U = Plants. U = Plants.
A Venn diagram is a diagram that shows the relationship between and among a finite collection of sets. If we have two or more sets, we can use a Venn diagram to show the logical relationship among these sets as well as the cardinality of those sets. In particular, Venn Diagrams are used to demonstrate De Morgan's Laws. Venn diagrams are also useful in illustrating relationships in ...
Two Set Example. The following diagram is a Venn diagram for sets and : . The red region contains all the elements that are in only. The blue region contains all the elements that are in only. The black region contains all the elements in both and which is called the intersection of and , denoted .The red, black, and blue regions together represent the elements that are in , , or both.
This page titled 9.3: Venn Diagrams is shared under a CC BY-SA license and was authored, remixed, and/or curated by David Lippman ( The OpenTextBookStore) . Named after John Venn, Venn diagrams are a way to visually organize information. This section introduces the idea of using Venn diagrams to visualize set operations and answer questions ...
Applications with three-circle Venn diagrams are a bit longer and, consequently, a bit more involved. However, the strategy remains the same - work from the inside out. Example 3: A survey of 85 students asked them about the subjects they liked to study. Thirty-five students liked math, 37 liked history, and 26 liked physics. Twenty liked math
Venn diagram questions with solutions are given here for students to practice various questions based on Venn diagrams.These questions are beneficial for both school examinations and competitive exams. Practising these questions will develop a skill to solve any problem on Venn diagrams quickly.. Venn diagrams were first introduced by John Venn to represent various propositions in a ...
GCSE; WJEC; Venn diagrams - WJEC Solving problems using Venn diagrams. Venn diagrams are a useful tool in the world of statistics. Once you have got to grips with these, you will be able to ...
A Venn diagram uses overlapping circles or other shapes to illustrate the logical relationships between two or more sets of items. Often, they serve to graphically organize things, highlighting how the items are similar and different. Venn diagrams, also called Set diagrams or Logic diagrams, are widely used in mathematics, statistics, logic ...
Venn diagrams visually represent relationships between concepts. They use circles to display similarities and differences between sets of ideas, traits, or items. Intersections indicate that the groups have common elements. Non-overlapping areas represent traits that are unique to one set. Venn diagrams are also known as logic diagrams and set ...
This video solves two problems using Venn Diagrams. One with two sets and one with three sets.Complete Video List at http://www.mathispower4u.com
‼️FIRST QUARTER‼️🟢 GRADE 7: SOLVING PROBLEMS USING VENN DIAGRAMGRADE 7 PLAYLISTFirst Quarter: https://tinyurl.com/yyzdequa Second Quarter: https://tinyurl.c...
1. Solve word problems involving sets with the use of Venn diagrams 2. Apply set operations to solve a variety of word problems. NOTE TO THE TEACHER This is an important lesson. Do not skip it. This lesson reinforces what students learned about sets, set operations and the Venn diagram in solving problems. Lesson Proper: I. Activity Try solving ...
Figure 4.5.1 4.5. 1: Total = 64 + 24 + 24 + 9 = 121. The first set of branches represents the first draw. The second set of branches represents the second draw. Each of the outcomes is distinct. In fact, we can list each red ball as R 1, R 2, and R 3 and each blue ball as B 1, B 2, B 3, B 4, B 5, B 6, B 7, and B 8.
Venn diagrams are a type of graphic organizer that allows students to compare and contrast two or more items. They consist of two or more overlapping circles, with each circle representing a ...