- Find A Tutor
- Geneva Tutors
- Lausanne Tutors
- Zurich Tutors
- Basel Tutors
- Online Tutors
- Maths Tutors
- Chemistry Tutors
- Physics Tutors
- Biology Tutors
- English Tutors
- History Tutors
- Geography Tutors
- Language Tutors
- Special Educational Needs
- Residential Tutors
- Primary School
- School Entrance Exams
- Middle School
- Combined Science
- Maths AA and AI
- IB Internal Assessment
- Environmental Systems & Societies (ESS)
- Sports, Exercise & Health Science
- Computer Science
- Global Politics
- Digital Society
- Business Management
- Visual Arts
- English A/B
- English Oral (IO)
- German Oral (IO)
- French Oral (IO)
- Spanish A/B
- French Ab Initio
- German Ab Initio
- Spanish Ab Initio
- IB Extended Essay
- IB Theory of Knowledge
- University Applications
- Our Approach
- Happy Parents
- School Choice
- Become a Tutor

How to Write Your IB Biology Internal Assessment
By TutorsPlus

Performing well on the IB Internal Assessment requires a lot of work. This includes careful planning, research, experimentation, analysis, and writing. You should not take this assignment lightly since it accounts for 20% of your final grade. In this guide, we will explain in great detail how to write Biology IA to get a top score, so you can get the help you need every step along the way.
Our IB Biology Internal Assessment guide will cover both the necessary steps to take to conduct a successful investigation and the Biology IA structure.
What is the Biology Internal Assessment?
The IB Biology IA is a self-directed investigation into a Biology topic of your choice.
Your task is to design and conduct an experiment, analyse its results, and write a report about it. Typically, it takes around 10 hours of class time to work on the IA, but you will likely need to put in additional time outside of class. The final paper should be no longer than 3000 words.
A solid, well-designed IA can bring you a maximum of 24 points. To award these points, examiners take into account 4 marking criteria – learn more about them from this post .
The following guide on how to write Biology IA will show you how to meet these criteria and maximise your score. And remember, if you get stuck, our IB Biology tutors, teachers, and examiners are here to help.
The Five Steps to Writing IB Biology Internal Assessment
As we have already said, the Internal Assessment is one of the pillars of your end-of-the-course examination. Without completing your investigation, you cannot count on a good mark.
This means that you must treat your IB Biology IA as if you were a scientist for real, i.e. carefully plan what you’d like to do and which results you expect to obtain, carry out your experiment, and draw a conclusion. Here are these steps in more detail.
Choosing a Research Question
The first step is to choose a focused research question on a biological topic that interests you. The question should be specific enough to investigate through an experiment in the time available.
The best IB Biology Internal Assessments specify a clear reason why you chose such a topic. For example, you may investigate a biological phenomenon or issue that is relevant to the region where you live. Or it might be a topic that has fascinated you since childhood. Whatever your reasoning is, it must be clear from your work.
Still, it is not enough to choose a research question based solely on your interests. It should also be:
- Doable, i.e. you must be able to answer it taking into account time and resource limitations, as well as the level of complexity of an experiment;
- Measurable. In other words, your investigation should involve variables, which you can measure and analyse. It is also possible to work with statistical data.
- Unique. Your Biology IA doesn’t require you to do groundbreaking research. Nevertheless, you need to come up with an original question and contribute new insights to the chosen area of study.
Now sure which questions to use? Allow us to help you. We offer fresh 30+ IB Biology IA ideas . However, it is always best to use your own creative ideas, as examiners expect to see originality and thinking in your work.
Planning the Experiment
Once you have a research question, plan out how you are going to investigate it thoroughly. It is vital to consider every part of your work, from the variables you will measure, to the materials and methods you will use, and, of course, the data you aim to collect.
However, before you begin to investigate, your teacher must approve your plan. Do not skip this step, as it could result in wasted time and effort if your teacher doesn’t agree with your IA proposal.
Conducting the Experiment
You need to carry out your experiment safely and systematically. Every observation and piece of data you obtain should be carefully recorded. It is important to repeat your experiment a few times to verify results as well as possibly find any errors and omissions in your methodology.
Analysing and Concluding
Examine your data to identify patterns and relationships. This data will help you draw conclusions to answer your original research question. For the best marks, you ought to discuss sources of error and suggest improvements for further investigation.
How to Write Biology IA: Structure and Points to Cover
When writing the IB Biology Internal Assessment, you need to follow a certain structure. A well-organised report will help ensure that you meet every marking criterion as well as demonstrate your thinking skills.
Here are our extensive guidelines for each section of your paper.
The Title and Contents Page
The Title Page sets the tone for the entire IB Biology Internal Assessment report. Your goal is to craft a descriptive title that reflects the purpose of the study. For example, “An Investigation into the Effect of X on Y.”
The title must be accompanied by a focused research question involving the key variables, units, time, and location, if applicable.
Below is an example of a title and a research question:
Title: The Influence of Light Intensity on the Rate of Photosynthesis in Elodea Plants.
Research Question: Does the intensity of light affect the rate of photosynthesis in Elodea (Elodea nuttallii), and if so, is there an optimal light intensity for maximizing photosynthetic activity?
Please note that if your experiment involves a living organism, you must identify it by both a common name and scientific name (genus and species).
When it comes to the Contents Page, it outlines the Biology IA structure and lists all sections and page numbers. This page is important to let examiners easily navigate the document.
Taking time with these initial pages will show your ability to be organised and thoughtful. The title and contents provide the first impression to evaluators.
Introduction
We suggest that you start your report with a brief overview of the topic and focus on its importance. For example, if your research involves a living organism or a compound, say where one might encounter it in everyday life, how we use it in food production or industrial processes, and explain the role it plays in an ecosystem.
Then, proceed from general to personal. What made you choose this topic and this research subject? Do they have a significance specifically for you or a global importance? Tell briefly about it at the beginning of your report.
Along with this, you should specify the method of investigation and why you used it. For instance, if you’re studying the effect of temperature on enzyme activity, you might want to use a sugar solution or specific chemical substrate to measure the enzyme’s effectiveness at different temperatures.
Overall, the introduction should be 0.5-1.0 pages long.

The next element of the appropriate IB Biology IA structure is background information. It helps understand the context of your research question and experiment.
For example, if you’re investigating a molecule, you need to describe its fundamental structure, i.e. identify its building blocks and how they are arranged. In case your subject is a consumable compound (such as capsaicin in chilli peppers or vitamin C), it is vital to discuss its effects on the body. You can explain their benefits and the potential harm associated with deficiencies or excessive consumption.
If your focus is a living organism, you need to pinpoint its key features and specify their impact on your experiment.
Often, IB Biology Internal Assessments involve reagents that react with a selected molecule or a compound. If you, too, have such reagents, explain their chemical structure and reactivity that make them suitable for your experiment. You shouldn’t forget to include relevant chemical equations.
It is not uncommon for Biology IAs to rely on secondary data instead of experiments. If you go this route, you must justify your choice of the specific database. Along with this, you should provide the data collection method and explain why this database is relevant to your research question.
If applicable, you can include diagrams, graphs, and other visual information. Don’t forget to cite the source you’re using and provide figure captions.
After you provide the scientific justification of your experiment, proceed to state your actual hypothesis. This should be an if-then statement outlining your testable prediction about the anticipated results.
Next, provide 2-3 sentences explaining your rationale. Link it logically to scientific principles and cite any research that informed your hypothesis. Your conclusion will either support your hypothesis or reject it.
Below is an example of a hypothesis:
“Exposure to different light intensities will affect the rate of photosynthesis in Elodea plants. I predict that as light intensity increases, the rate of photosynthesis will also increase due to the enhanced availability of light energy for the photosynthetic process. However, beyond this optimal level, I expect the rate of photosynthesis to plateau or even decrease due to factors like photoinhibition. This hypothesis is supported by the established principle that photosynthesis relies on light energy, and exceeding optimal light levels can damage photosynthetic machinery.”
Typically, biological investigations will involve three sets of variables: Independent, Dependent, and Controlled Variables:
- The independent variable is what you intentionally manipulate. You need to be highly specific about the increments tested.
- The dependent variable is what changes in response to manipulations. They are what you will be measuring.
- Controlled variables are held constant to isolate effects.
In your Internal Assessment, you need to list at least 5 control variables and do 15 repeats.
We suggest that you make a table with three columns introducing your variables. It must also feature units and, if applicable, ranges (for example, gas concentrations). Don’t forget to explain the instruments or methods you used to measure variables.
Your IA report must clearly show all the apparatus and equipment you used in your experiment.
To do so, you can draw and fully label a visual diagram of your experimental setup, especially detailing how the independent variable was implemented. For example, if testing temperature, show the water bath or incubator set at different temperatures.
Alternatively, you may take a photo of your actual lab setup and annotate it.
Either way, you must specify all the apparatus and instruments, as well as solutions and chemicals (with their concentrations) that your experiment requires. Whenever possible, discuss the uncertainties for your instruments (weighing balances, pipettes, etc.).
You can start this section with a Preliminary Experiment with the purpose of providing critical insights to guide the main investigation. You should explain how it shaped your methodology, analysis approach, and decision-making.
If you didn’t conduct a preliminary experiment, you need to research the independent variables and the method for measuring the dependent variable. This analysis will mimic the function of a preliminary experiment in informing the main investigation’s design.
The next important step is to write the experimental procedure in clear numbered steps. It is better to use the imperative mood to make it look like an instruction (“Heat the solution to 20 degrees Celsius …” instead of “I heated the solution…”). Make sure to include enough detail so that someone else would be able to repeat the process.
You need to include at least 5 increments of your independent variable (e.g. 5 temperatures) and a minimum of 5 trials/replicates per increment. Please keep in mind that your procedure should collect both quantitative data (numbers) and qualitative data (observational descriptions).
At the end of this section, it is important to discuss the risks involved in your experiment (such as safety, ethical, and environmental).
This section of your IB Biology Internal Assessment should include at least 3 data tables:
- Raw Data Table, which features only unprocessed numbers;
- Control Variables Table, which presents values of controlled variables, for instance, initial temperatures;
- Qualitative Data Table including observational descriptive details (for example, colour or temperature changes).
You need to give all these tables clear, descriptive titles. It is also essential to label all your columns with headings and units of measurement. You should make sure that your numbers are uniform, i.e. have the same decimal places. You are at risk of losing marks if you miss even a single unit.
We don’t recommend that you start your table on one page and continue on another. However, if you have a large table that doesn’t fit into a single page, you should repeat the title and column names after the split.
If your data is likely to come with uncertainties (for example, human reaction time), you can specify them in footnotes. You should also indicate equipment precision in column headings.
The analysis section of your Biology IA shows how you have used both qualitative and quantitative methods to support your arguments as well as identified and justified any discrepancies or errors in your data.
For starters, pick a sample of processed data to explain your calculations. You need to provide the equation you used and track each step to demonstrate how you converted raw numbers into analysed data. You should do it for every type of calculation (i.e. for averages, the volumes of gas obtained, etc.).
The rest of your results should be organised into fully labelled tables of calculated/processed data.
Next, you need to use this data to create 1-2 graphs with appropriate formats (for instance, bar, line, or scatter plots). All graphs must have titled axes with units and a figure legend. Below the graph, you should provide a description of trends.
It is more than likely that your data will feature uncertainties and errors – don’t try to hide them. In fact, you need to show that you understand, have reflected on, and can explain them. Best-fit lines and error bars can help you indicate these uncertainties and deviations. To maximise your final IA score, you should explain whether they are significant (how you know this), and how they impacted your results.
This section summarises the results of your experiment and answers your research question.
To begin with, provide your research question one more time to remind the reader about the aim of your experiment.
Then explain the trends obtained from your data, particularly within the graph. Make sure to be specific in your explanation. For example, instead of simply saying “temperature affected enzyme activity,” state something like “enzyme activity increased from a rate of 0.2 micromoles of substrate hydrolysed per minute at 20°C to a peak rate of 1.5 micromoles per minute at 40°C. This indicates a positive correlation between temperature and enzyme activity.”
Based on these conclusions, provide a clear answer to your research question and evaluate the extent to which it was answered. Did you achieve a complete answer, was it partial, or maybe you failed to confirm your hypothesis altogether? If you encountered any unexpected data points in your experiment, discuss these anomalies and suggest reasons for their occurrence.
If possible, you should compare your experimental values with established literature values. Cite your sources and explain how your findings align with or deviate from existing knowledge.
Finally, you need to discuss the impact of uncertainties associated with your measurements. Were these uncertainties significant to your experimental values? For example, a measurement of 10 grams with an uncertainty of ±0.01 gram is much more precise than an uncertainty of ±1 gram.
The final element of your Biology IA structure is supposed to demonstrate your critical thinking skills. In particular, it focuses on the strong and weak sides of your experiment.
We recommend that you identify at least 3 weaknesses or challenges in your experimental design, such as a lack of controls or a limited number of trials. Point out which errors were systematic, random, or human. Explain how each limitation impacts the quality and interpretation of your results.
If you provided error bars, ensure to explain what they demonstrate.
The next step is to propose at least 3 changes to improve the quality of your experimental design and data analyses. Those can include additional controlled variables, more replicates, different measurement techniques, increased precision on equipment, etc. Explain how each suggestion would specifically refine the experiment.
The last page of your IB Biology IA is a list of all the sources you utilised (textbooks, research, academic papers, etc.). You need to stick to the citation style recommended by your school.
Need Help to Write Biology IA? TutorsPlus are at Your Disposal
These were our suggestions on how to write Biology IA based on the new syllabus (the first assessment in 2025).
With 20% of your total grade, IB Biology Internal Assessment is a crucial aspect of your academic journey. It’s an opportunity to demonstrate your skills and improve your understanding of Biology. To ensure your IA report brings you the grade you hope for, you need to approach it with dedication, thoroughness, and a commitment to scientific excellence.
This journey can be quite stressful, but you don’t have to face it alone. At TutorsPlus, we understand the significance of your Internal Assessment and are here to support you every step of the way. Whether you need assistance in selecting a perfect topic, refining your methodology, or reviewing your biology IA structure or its content, our knowledgeable IB Biology tutors (who are simultaneously experienced teachers and examiners) are ready to guide you towards success.
Don’t hesitate to reach out to us for expert help and assistance. We are available at +41 022 731 8148 or [email protected]. With TutorsPlus by your side, you can turn your Internal Assessment into a remarkable achievement.

Sara has been an education consultant for TutorsPlus for 15 years, and is an expert on international IB education. She is also a parent of two lively children.
Find a Tutor
Popular Posts

English IO – How to Ace Your IB English Literature & Language Oral

Tips to get a Top Grade in Your IGCSE English

How to get a top score in your IB TOK Exhibition

IGCSE Maths Revision Tips To Help You Today

What is the IA, EE or TOK? Everything you need to know about the IB written assignments

Maths Anxiety – How Parents Can Help
More articles from our expert tutors.

Tips to Ace Your IGCSE Biology

Your guide to the International School of Geneva – Part 1

Guide to IB Psychology: What You Need to Know About The Course
Find a Tutor Today
" * " indicates required fields
Step 1 of 5
Find the best support for your family
A collection of tips and notes for the International Baccalaureate.
IB Biology Internal Assessment (23/24)
Below I will attach a PDF of my Biology IA (submitted for Biology HL). It scored 23/24 (which, according to the boundaries of the M20 session, was a 7). Unfortunately, I don’t know where I lost the one mark.
Quick disclaimer; my Biology IA was a database IA, so the majority of the tips I’ll share in this post will specifically relate to writing a successful database IA. If you’re looking for tips for an experiment-based IA, I’d recommend you go check my post about my Chemistry IA , where I share some of my experiences with an experiment-based IA as well as a general structure I’d replicate when writing an experiment-based IA.
Across my three sciences (Biology HL, Chemistry HL, Physics SL), I wrote two experiment-based IAs and one database IA. As such, I feel as though I have a pretty solid understanding of the pros and cons of each IA “type” (excluding, of course, a simulation-based IA). In short, I can express the essence of these two IA types in quite a rudimentary table:
As per the above table, one of the downsides of an experiment-based IA is the amount of effort required to complete it. In experiment-based IAs, a lot of time and effort goes into planning your methodology, conducting preliminary trials, conducting the experiment itself etc. However, this hard work has a payoff, given that an advantage of an experiment-based IA is that the analysis and evaluation of your data is pretty straightforward, since there’s so much you could talk about when it comes to the accuracy and precision of your experiment.
On the other hand, a database IA requires a considerably smaller amount of time and effort to plan. Once you find a good data source and set up your primary equations on a spreadsheet, Excel practically does the rest of the work for you. It personally took me about 2 days to find all my data and process it. However, the drawback to a database IA is that it requires a lot of critical thinking and understanding of statistics and data sampling when it comes to the analysis and evaluation (which contribute half of the points you could achieve for your IA). Ultimately, because most people don’t have a good enough understanding of statistics and data sampling, they tend to score poorly in database IAs or shy away from them completely to begin with. In this post, I hope to provide you with a solid understanding of how to successfully complete a database IA, and hopefully my own IA acts as a decent exemplar for all of you to use.
The IA which I wrote was a “correlation-based IA”, which essentially means it explored the correlation between two (biology) related variables. I have not yet seen someone write a database IA that wasn’t correlation-based, so in this post I’ll be focusing on the structure and content of a correlation-based database IA. To do this, I’ll propose a general structure to use when writing a correlation-based database IA, and expand on some of the technical information that you should include in each section.
1. Research Question: In this section, state your research question. If you’re writing a correlation-based database IA, you want to make sure that your research question isn’t too simple, and that you add some unique ‘twist’ to your investigation. For example, instead of just determining the correlation between HDI and mortality rates due to CHD, I decided to specifically look at the distinction between this correlation in developing and developed countries. Some other ‘twists’ you could add to your investigation is to look at your correlation in different age groups, or between men and women.
2. Introduction: In this section, introduce why you ended up choosing to explore your particular research question. This is where I’d sneak in a bit about the connect between the research question and your interests/personal life (I was personally inspired to write my IA after I shadowed a cardiologist at a local hospital). You might also want to mention how answering your research question has important applications in the real world. In my own IA, I made the ‘Introduction’ section part of the ‘Background Information’ section to make sure my IA didn’t exceed the 12 page limit, but if you’re not running out of space I’d recommend making two separate sections.
3. Background Information: In this section, you want to illustrate all the biology knowledge that’s pertinent to your research question. This section is very important in a correlation-based database IA given that it’s one of the only sections where you’re provided an opportunity to discuss the biological background of your investigation. This section also acts as a reminder that your IA is biology-focused, not maths-focused. Additionally, in this section you should discuss other important background information that’s relevant to your investigation. For example, if you’re exploring the correlation between HDI and CHD mortality (as I have done), you’ll want to use the ‘Background Information” section to not only explain the pathogenesis of CHD but also the significance of CHD as a socioeconomic indicator.
4. Hypothesis: This section is pretty self-explanatory; just state your hypothesis. This should ideally be accompanied by a scientific explanation to support your hypothesis. In my case, I referenced a study about the correlation between the HDI and healthcare quality in a country to justify why HDI and CHD mortality should be negatively correlated.
5. Approach to the Research Question: In this section you should illustrate some of your personal engagement with the IA by explaining how you developed your methodology. For a correlation-based database IA, I suggest that three main points should be considered in this section: 1) how you will control confounding variables in your investigation, 2) how you minimised the effects of errors and variability in your data and, 3) how you standardised your variables. Below I further elaborate on these 3 points, using what I hope is a useful analogy.
In its most basic form, a correlation-based database IA is the development of an algorithm to process raw data into a form which allows you to determine whether a correlation exists between two variables. You can think of this algorithm like a machine, where your raw data is the input and the processed data is the output. In the “Approach to the Research Question” section, you essentially outline the three main ‘steps’ of the machine. The diagram below is a helpful guide:

As you see, the first “step” in the database machine is to control the raw data you collect for confounding variables. A confounding variable is a variable that influences both you dependent and independent variable (e.g. a variable that influences both HDI and mortality rates due to CHD). As such, if confounding variables are not controlled for it could lead to spurious correlations in your investigation. Confounding variables can also be variables other than your independent variable that influences your dependent variable, which you should also control (these types of variables are analogous to controlled variables in experiment-based IAs). For instance, lifestyle habits are an example of a variable which may affect both the HDI of a country and the mortality rate due to CHD. Ultimately, to control confounding variables in your experiment you must develop an inclusion criteria. The “Inclusion Criteria” section comes up later in the IA but you can foreshadow its existence in this section already.
The second “step” in the database machine is to take the data you’ve adjusted for confounding and further adjust it, this time for random variability. Random variability in data may be caused for a variety of reasons, and typically these reasons are difficult to identify. However, the existence of random errors in your data may contribute to a spurious correlation, and therefore random variability in data must be accounted for. For example, in my IA I looked at data relating to CHD mortality across different years in different countries. At any one year, there might have been some unknown factor which influenced the CHD mortality in a given country. This factor could be, for example, a sampling error or the introduction of a new procedure to treat CHD. As such, I decided to account for random variability by calculating the mean mortality rate due to CHD.
The last “step” in the database machine is to take the data you’ve adjusted (for confounding and random variability) and standardise it. Standardising data allows you to fairly compare it. For example, in my IA I looked at mortality rates due to CHD, and decided to standardise the mortality rate which I collected by expressing it per 100,000 people in a country’s population. This is important, given that the number of people who die from CHD in any given country is relative to that country’s population. There are, of course, many other ways to standardize data, but for most correlation-based database IAs which I’ve seen (where mortality/survival rates are used), expressing your data per the population is a good way to go.
6. Data sources : In this section of your IA, you should list all of the data sources which you’ve used to carry out your investigation. You should also provide an explanation as to how your chosen data sources are reliable and credible. Generally, if your data sources are well-recognised data-collecting institutions (e.g. the WHO, the World Bank), you can argue that they are also trustworthy and ergo reliable. For population statistics I’d use the World Bank database , mortality rates due to a variety of different diseases are provided by the WHO , and HDI data can be found online on United Nations Development Programme’s website.
7. Variables : In this section, state the final variables which you will explore in the investigation. This includes your independent variable (e.g. HDI) and your dependent variable (e.g. mortality rates due to CHD per 100,00 people). Additionally, state that other variables exist which you need to control (e.g. confounding variables), and that you will design an inclusion criteria in your investigation to control these variables.
8. Inclusion Criteria: In this section you will outline the inclusion criteria which you’ve designed for your investigation. In short, inclusion criteria are characteristics which the raw data you use must have in order to be used in the investigation. These criteria don’t only aim to adjust your data for confounding, but also to control other factors to ensure your results are more accurate and representative. As an example, the inclusion criteria for my own IA were as follows:

As you can see, my inclusion criteria consisted of four variables; location, population, HDI, and socioeconomic organisation, which were presented in a table. Given that my investigation looked at the distinction between developing and developed countries, I created separate inclusion criteria for each. For each inclusion criteria which you design, you need to provide an explanation for how it will enhance the accuracy or representativeness of your results. Below I outline the reason for choosing each of my variables. In your own IA, you should also provide a justification for the inclusion criteria you design.
Location : I chose to limit my chosen countries to European countries in order to limit the effects of confounding variables such as lifestyle and dietary habits. These European countries were those defined by the World Health Organidation, as per their website.This inclusion criteria was the same for both developing and developed countries.
Population : If you are sampling data from individual countries, it is necessary to ensure that the population size of these countries is sufficiently large. The larger the population, the more price and representative your results will be (and vice versa). Naturally, I’m not knowledgeable enough to decide which population size is sufficiently large to have confidence in the precision of my data. As such, I referenced a scientific study by Zhu et al. which stated that a sample size of 2 million is enough to ensure the precision of my data. This inclusion criteria excluded certain European countries, such as Liechtenstein and Monaco, from being included in my investigation.
HDI: According to the United Nations Development Programme, “countries with an HDI score higher than 0.788 are considered to be developed, while countries with an HDI value lower than 0.788 are considered to be developing”. I used this parameter to determine which sampled countries are developing and which are developed.
Socioeconomic organisation: I chose to further limit the eligible countries in my investigation to two socioeconomic organisations in order to limit the effects of confounding variables such as economic and cultural status. The two socioeconomic organisations which I chose were the CEIT (Countries with Economies in Transition) for developing countries and the OECD (Organisation for Economics Co-operation and Development) for developed countries.
As you can see, my inclusion criteria specified that variables such as population and HDI needed to be relevant as of 2000; meaning that an eligible developing country had to have, for example; a HDI smaller than 0.788 since the year 2000. This is because I sampled data from my investigation from the year 2000 onwards (given that this was the scope of raw data which I was able to find). Depending on the time period from which you sample your raw data from, this year would likely be different.
9. Safety, Environmental and Ethical Considerations: In this section, briefly outline which safety, environmental, and ethical precautions are necessary when conducting the experiment. Given the nature of a database IAs, there are no substantial safety and environmental considerations to be made. However, you may want to note that it is necessary to use data ethically and in accordance to guidelines set by your database sources (e.g. abide by copyright laws).
10. Methodology and Trial Investigation: In this section you should conduct a trial investigation to gain insight into the feasibility of the correlation you’re investigating, thus providing a justification for you to proceed and carry out the final investigation. Additionally, I would recommend using the trial investigation to explain the methodology you’ve designed for your IA. This will not only allow you to gain points in the ‘Analysis’ and ‘Communication’ criteria of the IA, but it will also save you space given that you will only need to provide the final results of your investigation later on, seeing as you’ve already explained your methodology beforehand.
In order to carry out a trial investigation, it is necessary to randomly sample your data to ensure that your trial investigation is truly representative of the rest of your data. For my IA, I randomly sampled 5 developing and 5 developed countries and carried out the investigation with their data. The way in which you randomly sample your data will vary per IA. Hereafter, explain your investigation’s methodology and all the different tables and calculation which you’ve used. For every calculation you make in the processing of your data, make sure to include a sample calculation. After processing all of your data and presenting it in a graph, determine which correlation exists in your data and justify why you should go ahead and conduct your final investigation. In my case, I used the R 2 values from my graphs to superficially assess how strong my correlations were, and thus whether I should continue with my final investigation.
(For those of you who don’t know, the R 2 value on a graph represents the proportion of the variance in the dependent variable that is predictable from the independent variable or, in layman terms, the degree of scattering of your data around the fitter trendline. The greater the R 2 value for a graph, the less scattering there is around the trendline, which may suggest a stronger correlation.)
11. Investigation and Results: Given that you’ve already explained your methodology in the previous section of your IA, all you need to do in this section is present the final processed data as well as any final graphs or tables you’ve created. Make sure to state in this section that you utilised the same methodology shown in the trial investigation to conduct the final one. Additionally, you may want to state that the raw data for the final investigation is “available upon request”, just to indicate to the person reading your IA that you actually processed the data yourself.
12. Statistical Testing: This section is, in my opinion, the one where most students miss out on marks for the ‘Evaluation’ criterion of the IA. In a correlation-based database IA, this section is where most students will conduct a statistical test to determine the strength of their correlation. Below I will provide a short description of how to conduct statistical testing for a correlation-based database IA:
Firstly, you need to determine which statistical test you will conduct. The two most frequently used statistical test for correlation are the Pearson’s correlation and Spearman’s correlation. The Pearson’s correlation tests for linear relationships, whereas the Spearman’s correlation tests for monotonic relationships. The difference between these two types of correlations is illustrated in the graphs below:

As you see, a linear relationship is a “straight-line” relationship between two variables, whereas a monotonic relationship is one where the function either always increases or always decreases, not both. Evidently, all linear relationships are monotonic, but not all monotonic relationships are linear. However, it will most probably not be clear whether the processed data in your investigation represents a linear relationship or one that is only monotonic. However, in order to conduct a Pearson’s correlation your data needs to meet certain assumptions, one of which is that your data is normally distributed, given that the test is sensitive to outliers and skewness in the data. As such, if you determine that your data is normally distributed, you should conduct a Pearson’s correlation. If your data is not normally distributed you won’t be able to conduct a Pearson’s correlation and should instead conduct a Spearman’s correlation.
An easy way to test whether your processed data is normally distributed, and thus whether you should conduct a Pearson’s correlation or not, is to conduct a skewness analysis. A skewness analysis is a quick calculation which tells you whether or not you data warrants concern of skewness. In a skewness analysis, you need to determine the value of two variables; the “skewness coefficient” and the “standard error”. Both of these variables can be calculated on Microsoft Excel.
The skewness coefficient is a variable which expresses how skewed your data is, and is a separate value for your independent and dependent variable data. Let’s say you want to calculate the skewness coefficient of your independent variable data. First, paste your data into a column on an Excel sheet. If your data spans from, say, cell E8 to cell E28, type the following equation into Excel in order to calculate the skewness coefficient of your data:
Use the same equation to calculate the skewness coefficient of your dependent variable data.
The standard error is different to the skewness coefficient and is usually the same value for both your independent and dependent variable data. The value of the standard error of your data depends on how many data points each of your variables has. In my investigation I had 31 pairs of data points, and therefore each of my variables (independent and dependent) had 31 data points. The value of the standard error was, therefore, the same for both the independent and dependent variable data. To calculate the standard error of your own data, use the following equation on Excel, where ‘N’ is the number of data points you have:
Finally, in order to assess the skewness of your data, you need to compare the absolute value of the skewness coefficient for each of your variables with twice the value of the standard error. If the value for the skewness coefficient is less than twice its standard error, then there is no concern of skewness in the data and the Pearson’s correlation can be conducted. If the value of the skewness coefficient is greater than twice its standard error, then there is concern of skewness and you need to conduct the Spearman’s correlation.
In short, the results of a skewness analysis can be presented in a table, as follows:

After the skewness analysis you need to conduct your chosen statistical test. I personally conducted the Pearson’s correlation, but I will demonstrate how to conduct both the Pearson’s and Spearman’s correlation below:
Pearson’s correlation: The Pearson’s correlation tests the strength of a linear correlation. The result of the Pearson’s correlation; the Pearson correlation coefficient ( r ), expresses the strength of and direction of a linear correlation (ranging from -1 to 1). The Pearson’s correlation is conducted using the following formula, where r is the Pearson correlation coefficient, x is your independent variable data, y is your dependent variable data, and n is the number of data pairs in your investigation.

As illustrated by the above equation, it is necessary to determine the sum of x, y, xy, x 2 and y 2 . After doing so, plug in your results into the above equation (alongside the value for n ), and the result will be your Pearson correlation coefficient.
Spearman’s correlation: Conducting the Spearman’s correlation is slightly more complex than the Pearson’s correlation. Similarly to the Pearson’s correlation coefficient, the Spearman’s correlation coefficient expresses the strength of and direction of a linear correlation (ranging from -1 to 1). Given that I haven’t personally conducted the Spearman’s correlation for my IA, I’m not very experienced in the process of doing so, but I found a great link which is very clear at describing how to calculate the Spearman’s correlation, which I will link here .
Lastly, after conducting the statistical test of choice, you need to ensure that the results of your statistical test are “statistically significant”; that is to say that the correlation which you’ve determined using the statistical test is caused by something other than chance. To determine statistical significance, you need to compare the result of your statistical test to a certain “critical value” which is based on the degrees of freedom and level of confidence assumed. I defined the two latter terms below:
- degrees of freedom : the number of values in the final calculation of a statistic that are free to vary. The degrees of freedom for an investigation is calculated as the number of data pairs minus 2 (e.g. for my investigation, which had 31 data pairs, there would be 29 degrees of freedom)
- level of confidence : the level of confidence when determining statistical significance refers to the risk that the correlation investigated is due to chance. Typically, a level of confidence of 0.05 is chosen, which denotes a 5% risk that the correlation investigated is due to chance.
You can determine the critical value for your investigation using either this document for the Pearson’s correlation or this document for the Spearman’s correlation. For instance, if you conducted a Pearson’s correlation and had 10 degrees of freedom at a level of confidence of 0.05, your critical value would be 0.576 (with reference to the appropriate document). Ultimately, if the absolute value of the correlation coefficient you have determined is greater than your assigned critical value, the results of your statistical testing are statistically significant, and vice versa.
I know this section was long, but it’s really important to get this part of the IA right in order to score highly. Remember, the statistical testing has three main parts: 1) conduct a skewness analysis to determine which statistical test to conduct, 2) conduct your chosen statistical test and, 3) determine if the results of your statistical test are statistically significant.
13. Analysis and Conclusion : In this section, analyze your final, processed data and provide an answer to your research question (if possible). This section should summarize the data which you’ve collected and how it (hopefully) supports your initial hypothesis. When analyzing the data, take into account the results of your statistical testing as well as the R 2 values from your final graphs.
14. Evaluation of Errors and Improvements: This section is of paramount important to the overall quality of your IA. The more detailed and thoughtful your evaluation of your investigation is, the better. To begin your evaluation, start by pointing out some of the strengths of your investigation. This could be the use of a trial investigation, or the thoroughness of your statistical testing. However, the bulk of the ‘Evaluation’ section should focus on identifying errors in your investigation and suggesting possible improvements to them. I mainly focused on how my methodology failed to take into account certain confounding variables, given that I suggested that these confounding variables were what caused my final correlations to be less than perfect. As such, most of the major errors in my investigation were linked to the nature of my inclusion criteria. Additionally, you may wish to point out some methodological errors in your investigation, such as the way in which you standardised your data, or how you could enhance the precision of your results by reducing the effects of certain random errors.
15. Extensions: In this section, identify any possible extensions to your investigation. It’s important to differentiate between improvements in the previous section and extensions in this one. An improvement involves tweaking your current methodology to ensure a more accurate and precise investigation. An extension, on the other hand, is suggesting an entirely new part of the methodology that would explore another aspect of your investigation. The extension you identify should, however, still be aimed at exploring something in the domain of your research question.
16. Literature: This is the last section of your IA and should include all of the sources which you’ve used, referenced in whichever style you want (I chose Chicago-style citation). Make sure to also reference any images which you’ve included in your IA in this section as well.
I hope this information is useful, and good luck!
Share this:
12 thoughts on “ ib biology internal assessment (23/24) ”.
Thank you so much for this!!! You probably saved my ass, bc I had to write a second biology IA (the first was was too shitty). This is such a good guide, thanks again!!
You don’t know how thankful i am for this like you saved my ass but i still need more helppppppp! My ANOVA test isnt’t working and my R values aren’t matching my data. Please help
Hi! Thank you for the post, it was really helpful. I was just wondering what font, font size and margin size you used? Also, I’m still not sure if the bibliography counts in the page limit but, correct me if I’m wrong, it didn’t seem to count in your IA?
Hi! I’m glad you found the post useful. I used Times New Roman size 11. I’m not really sure what margin size I used – I basically stretched the margins as far as I could because I had quite a lot of words to fit into the 12-page limit. To my knowledge, the bibliography does not count as part of the page limit. All the best!
Thank you so much for replying! The info was really useful 🙂
Hi! I was wondering how exactly you were able to gather your data from these databases? The websites are quite confusing
Hi! You usually need to download an Excel sheet or look through large tables to gather data from databases. For the WHO database, for instance, you can download different Excel sheets depending on what type of data you’re looking for. Hope that helps!
Hello. I just wanted to thank you for your precious advices. They are coming in really handy since I am taking HL biology too.
Hi! I was feeling so stressed because i didnt knew what to do with my ia and this helped a lot. Thank you so much!
Hi. Just wanted to thank you for the useful tips. They really helped me out when writing my database IA
Damn, I find myself on this website a few days before Christmas as the only one from my school doing a DB IA and I gotta admit I was super lost until I found your step-by-step guide Thank you very much.
you might just be the greatest of all time
Leave a comment Cancel reply

- Already have a WordPress.com account? Log in now.
- Subscribe Subscribed
- Copy shortlink
- Report this content
- View post in Reader
- Manage subscriptions
- Collapse this bar
Step by Step Guide to Writing Level 7 IB Biology IA
I. introduction, a. brief overview of ib biology ia.
The IB Biology Internal Assessment (IA) is a crucial component of the International Baccalaureate (IB) Biology curriculum . It serves as a substantial piece of written coursework in the form of a scientific report, focusing on a specific experiment. This undertaking provides students with an opportunity to delve into a topic of personal interest within the realm of biology, conduct experiments, analyze data, and communicate their findings effectively.
B. Importance of Achieving a Level 7
Securing a Level 7 in the IB Biology IA is highly coveted for several reasons. Given that the IB curriculum heavily emphasizes coursework, excelling in IAs can significantly impact your overall grade. Attaining a Level 7 demonstrates a deep understanding of scientific concepts, meticulous experimental design, thorough data analysis, and clear communication skills.
II. Understanding the Assessment Criteria
A. criteria breakdown, 1. personal engagement (2 marks).
Personal engagement involves selecting a topic and experiment that holds personal significance or relevance to the student. While topics often align with IB biology content, students have the flexibility to explore areas beyond the curriculum. Examples may include investigating factors affecting plant growth or studying solubility and diffusion patterns of substances. The key is to explain the relevance of the chosen topic to earn these two marks effortlessly.
2. Exploration (6 marks)
The exploration criterion encompasses providing relevant background information and context for the chosen topic. Thorough research is paramount here, incorporating scientific theory, external references, and IB biology concepts. A well-rounded exploration sets the stage for a robust experiment and hypothesis.
3. Analysis (6 marks)
Analysis begins with formulating a clear research question that includes both the independent and dependent variables. Crafting a hypothesis based on research and scientific theory is crucial. Methodology should be detailed yet accessible, with specific equipment measurements and uncertainty. Data collection, processing, and presentation should be meticulous, with multiple trials for reliability. The evaluation phase involves critical thinking, comparing results to the hypothesis, identifying strengths and weaknesses of the experiment, and reflecting on the process.
4. Communication (6 marks)
Effective communication is essential for conveying scientific theories and experiment findings. Proper formatting, labeling of tables and graphs, and adherence to citation and referencing styles (e.g., MLA or APA) are imperative. A well-structured IA with clear communication enhances readability and comprehension.
III. Final thoughts
In the pursuit of crafting a Level 7 IB Biology IA, don’t hesitate to seek reviews and feedback from your teacher—they’re not only there to guide you but also responsible for evaluating your IA. Their insights can provide invaluable direction, helping you refine your ideas, address any shortcomings, and ultimately enhance the quality of your IA. Additionally, it’s crucial to be mindful of common mistakes such as simple grammatical errors and inadequate labeling of equipment in the methodology section. Maintaining a well-structured layout with clear headers facilitates readability and comprehension, ensuring that your IA is easy to navigate for both you and the examiner.
Remember, the IA is not a task to be completed in a single sitting. Starting early and establishing a brief overview allows ample time for successive rounds of review and editing. By adopting an iterative approach, you can refine your experiment design, enhance your data analysis, and polish your communication. Embracing feedback, avoiding common mistakes, and adopting a diligent, iterative approach are key to achieving success in your IB Biology IA.
Select a topic that interests you personally and has relevance to biology. Consider areas covered in your IB biology coursework but don’t hesitate to explore beyond the curriculum if a particular aspect of biology intrigues you.
Follow a structured format with clear headings and subheadings. Ensure proper labeling of tables and graphs, and adhere to citation and referencing guidelines.
Conduct multiple trials for each experiment to enhance reliability. Use appropriate statistical tools to analyze data and draw meaningful conclusions.
Reflect on possible reasons for the discrepancy, considering experimental limitations and external factors. Compare your findings to existing research and scientific theory to provide context.
Effective communication is essential for conveying your experiment’s findings and scientific concepts. Clear formatting, labeling, and referencing contribute to a well-structured and comprehensible IA.
Related Posts

IB Math AASL May 2024 Past Statistics Exam Predictions
In the world of International Baccalaureate (IB) Math, the AASL Math exams hold immense significance, constituting a substantial 80% of…

IB Economics IA: A Step-By-Step Guide
In the realm of IB Economics, the Internal Assessment (IA) stands as a pivotal challenge for students. Beyond the constraints…

7 Essential Tips to Make Your Second Year of IB Easier
Are you a student embarking on your second year of the International Baccalaureate (IB) program? Congratulations on completing the first…
50 IB Biology IA Ideas

Colours of light on the effectiveness of phototropism
Auxin hormone is largely responsible for controlling the direction of plant growth. Does it matter what type of light the plant is exposed to affect the growth of auxin?
Experimental setup: Place a corn seed in a dark cupboard with a single light source. Observe how changing the colour of the light source impacts the success of phototropism!
Independent Variable: Colours of light
Dependent Variable: Degree of growth of plant towards a light source
Abiotic factors on the Biodiversity in a habitat
Different abiotic factors affect the growth of different plants, test the different conditions and then note how plant species change in their presence.
Experimental setup: In this ecological experiment, you will use quadrat sampling to test how successfully different plant species grow in environments. Read more about quadrat sampling here
Independent Variable: Soil pH, Nitrates in Soil, Oxygen concentration
Dependent Variable: Presence or absence of certain species
Challenges: Providing biological context for why you’re measuring certain factors.
Stomatal Density in Different Conditions
Stomata are the areas of gas exchange in leaves. Different plants that live in different conditions will have different requirements for gas exchange.
Experimental Setup: F ocus on how leaves in different conditions vary in their stomatal density. Test the stomatal density of different leaves exposed to variable conditions using a microscope.
Independent Variable: Light exposure, Different Species, Atmospheric CO2 concentration
Dependent Variable: Stomatal density (seen under the microscope)
Challenges : mathematical analysis
Comparing different plant species transpiration rate changes in response to stimuli
Different plants will change their transpiration rates in response to the environment. Investigate how different species of plants respond differently to environmental stimuli.
Experimental setup: Use a potometer to measure the rate of transpiration. Change the different conditions in which the plants are found as well as the species.
Independent Variable: Plant species + humidity/temperature/ light intensity
Dependent Variable: Rate of transpiration
Whats next?
We hope our list of Internal Assessment Ideas was useful.
If you’re looking for guidance on how to actually write an IA once you’ve chosen your topic, check out our IA Checklist post!
If you’re struggling with the Paper 2 Data Based Questions, we also have a post about that here .
FREE DOWNLOAD
Top 80 Most Common IB Biology Exam Questions
Need a tutor?
We have a team of awesome tutors ready to help you ace the IB.
Want to Improve your IB Score?
Learn everything you need to get a 7 in your IB subjects with our online courses. Designed by Harvard tutors to allow you exceed beyond expectations
The 80 Most Common IB Biology Exam Questions!

How To Write a Perfect Biology IA
Enter your email to get the guide!
Success! The Guide is on it's way to your inbox now!
80 most common ib biology exam questions.
Enter your email and tell us where to send them!

Great! The Questions are on their way to your inbox!
Pin it on pinterest.
IB Study Resources
July 26, 2023
Ace Your Biology IA (HL): A How-to Guide
The Higher Level (HL) Biology Internal Assessment (IA) is a crucial component of the International Baccalaureate (IB) program. It allows students to delve deep into a scientific topic of their choice and showcase their research and analytical skills. In this guide, we will focus on the preliminary pages of the Biology IA, specifically the Title Page and the Content Page, which lay the foundation for a well-structured and successful IA.
Preliminary Pages
Generally, in a HL Biology IA , these pages refer to the Title Page and the Content Page. They come before the actual IA sections and write-up and usually do not require a page number.
Many IB students tend to place these pages on the last of their Biology IA to-do-list. However, we would advice that you do it first.
The Title Page is more than just a formality; it sets the tone for your entire IA. It should contain the following elements:
- Title (e.g. “A study investigating…”)
A clear and concise title that reflects the essence of your study, such as “A Study Investigating the Impact of X on Y as Shown by…”
- Research Question
It has to include both the dependent and independent variables.
- Relevant details such as the scientific name of the organism (if applicable), units, time, and location.
Content Page
The Content Page serves as an organized outline of your IA. It should include the following sections:
- Title and Research Question
- Introduction
- Background Information
- Variables (Independent, Dependent, Controlled, and Uncontrolled)
- Preliminary Experiment (with a focus on its relevance to the main experiment)
- Risk Assessment
Processed Data
- Analysis (including statistical calculations and graph details)
Bibliography
The IA Title and Research Question
Identify a broad topic statement, ensuring that your research question is stated and includes both the dependent and independent variables. For example, What is the effect of X on Y as shown by… ? Your research question should include the following, where appropriate:
- The organism (if appropriate) has a scientific name
Including the following will allow you to effectively convey clarity in your research question , and thoroughly explain what you will be investigating .
Introduction and Background Information
Introduction:
Your introduction is rooted in background information about the organism and or the topic that you will be investigating in your IA. You should demonstrate strong personal engagement by a statement of purpose. For instance, you would avoid using cliche phrases such as “I have always loved..”, but rather opt for phrases that clearly illustrate your passion with the real, outside world, or your genuine reason for choosing the topic that you will be investigating.
Background info:
Go on to enhance your understanding of your research question while ensuring that your background information is:
- Within context of the range of independent variables
- Within context of the dependent variables being used
- In-text cited, based on the referencing systems used in your school (e.g. Harvard/ MLA referencing)
- Supported by a preliminary experiment through the inclusion of a short paragraph about how it was carried out, to show your clarity on how you would conduct your main experiment.
While conducting a preliminary experiment shows great engagement, many students do not do it/are not able to carry one out for various different reasons. If you have not carried out a preliminary experiment, research and describe the following instead :
- Range and intervals of your independent variables
- How you will be measuring your dependent variable
Null hypothesis :
“The null hypothesis is a typical statistical theory which suggests that no statistical relationship and significance exists in a set of given single observed variables, between two sets of observed data and measured phenomena” (“Null Hypothesis – an Overview | ScienceDirect Topics”).
For example,
“There is no statistically significant association between X and Y .”
Alternative hypothesis :
Your alternative hypothesis is an alternative theory that is suggested with direct polarity to the null hypothesis.
“There is a statistically significant association between X and Y .”
- Independent, dependent and controlled variables are clearly stated
- Ensure to have at least 5 intervals and at least 15 repeats for each interval
- Explain how and why you are using those variables, how certain variables may not be controlled, and how you minimise the effects of these to suit it to your experiment effectively
Ensure that all apparatus, chemicals and solutions are listed and / or shown in a diagram if relevant and all apparatus used are relevant. (Not an obligatory list, can be given in the method)
Preliminary Experiment
The Preliminary Experiment is often overlooked, but it holds immense value in shaping your main investigation. Students can improve this section by linking it seamlessly to their IA. Describe how the preliminary experiment influenced your methodology, analysis, and decision-making process. If you haven’t conducted a preliminary experiment, research and discuss the range and intervals of your independent variables and the method of measuring the dependent variable.
Your method section demonstrates that you have sufficient data that has been collected, and that you have thoroughly reflected on each method of control.
Ensure to :
- Outline method in a step by step, list-like format
- Reflect on every controlled variable in the method while explaining
- State that you have : “Repeated method ____ for verification” at the end of every section.
Risk assessment to ensure safety
Include a risk assessment of apparatus and chemicals and show awareness of:
- ethical issues – eg handling of animals
- environmental issues – eg impact on field sites
Once you have collected your raw data, the next step is to process and organize it for analysis. The Processed Data section is where you present your data in a structured manner, making it easier for readers to interpret and draw conclusions. Follow these steps to effectively present your Processed Data:
- Data Organization Begin by organizing your data in a clear and systematic way. You can use tables, charts, or graphs, depending on the type of data you collected. Ensure that each piece of data is properly labeled and includes units, where applicable.
- Data Manipulation In some cases, you might need to manipulate the data to calculate specific values or derive meaningful insights. Show your calculations and formulas used for any data manipulations, and explain the rationale behind these transformations.
- Averaging and Standard Deviation When presenting numerical data, consider calculating the averages and standard deviations if relevant. These statistical values provide insights into the central tendency and variability of your data points.
The Analysis section is where you interpret your processed data and draw meaningful conclusions from your findings. To conduct a comprehensive analysis, consider the following steps:
- Statistical Calculations Based on the nature of your data, choose appropriate statistical calculations to support your analysis. Depending on your research question and data type, you might use measures like mean, median, mode, range, standard deviation, t-test, chi-square test, etc. Mention the statistical methods you used and why they are appropriate for your investigation.
- Graphs and Visualizations Graphs and visualizations are powerful tools to represent your data visually. Create clear and accurate graphs that effectively illustrate the trends, patterns, and relationships present in your data. Choose appropriate graph types, such as bar graphs, line graphs, scatter plots, or pie charts, based on the variables you are analyzing.
- Data Interpretation Thoroughly interpret the patterns and trends depicted in your graphs and statistical results. Explain the significance of any relationships observed and how they relate to your research question. Use evidence from your processed data and refer to relevant scientific principles to support your interpretations.
Ensure that your analysis section includes sufficient correlated qualitative and quantitative observations, anomalies that have been clearly pointed out and explained, statistical tests and graphs that explain the data collected.
The figure below is an example graph taken from a model IA, where the student has clearly presented information in a graph.
In the Evaluation section, critically assess your investigation and methodology. Address strengths and weaknesses, reflect on potential sources of error, and suggest improvements for future studies. Consider the following points for a well-rounded evaluation
- Methodological Considerations Discuss any limitations or challenges you encountered during your investigation. Analyze how these factors might have influenced your results and propose ways to mitigate potential errors.
- Reliability and Validity Reflect on the reliability and validity of your data and methods. Identify factors that could have impacted the accuracy and generalizability of your findings.
- Sources of Error Be honest about any sources of error that might have affected your results. Consider experimental errors, sample size, or unexpected external factors that could have influenced your outcomes.
Evaluation :
- Conclude by making explicit reference to the research question. In other words, your conclusion should directly answer the question : “Does the data answer the Research Question?”
- State if your null hypothesis is accepted or rejected
- Refer to the graph and data points to clearly demonstrate your understanding and strong conclusion
- Compare the conclusion with published data and predictions
( A good tip here is to put your graph in and next to it put a graph from a textbook or website. Can you either explain any differences or relate it to scientific theory?)
- Strengths and weaknesses of your investigation
- Further extensions that could have been carried out.
Figure 1 : Model student IA graph

The Conclusion section is where you summarize your key findings and directly address your research question. Follow these steps for an effective conclusion:
- Restate the Research Question Begin by restating your research question to remind readers of the central focus of your investigation.
- Answer the Research Question Clearly state whether your research question was supported or rejected by the evidence presented in your analysis. Use your processed data, statistical calculations, and graphs to support your conclusion.
- Relate to Scientific Theory Connect your findings to established scientific principles or theories. Discuss how your results align with existing knowledge in the field of biology.
Finally, provide a comprehensive list of all the sources you used in your research. Include academic papers, textbooks, websites, and any other references you consulted. Use the appropriate citation style, such as Harvard or MLA, as required by your school or institution.
Sample IA marked and annotated :
http://xmltwo.ibo.org/publications/DP/Group4/d_4_biolo_tsm_1408_1/pdf/investigation_1b_e.pdf
If in doubt, reach out to experienced tutors at Quintessential Education for extra help and guidance. Start your journey towards academic success today!
Related Posts

Ultimate Guide to the IB Final Exam Prep: Resources, Strategies, and Crash Course

The English IA: Tips for a successful presentation

How to prepare for the Singapore Medical School applications

How to Ace your Business Management Internal Assessment (HL)
Contact Info
545 Orchard Road #14-06/09 S(238882)
(+65) 61009338
QE_Singapore
Mondays to Fridays: 10am to 7pm
Quick Links
Join Our Mailing List
© 2024 Quintessential Education™

IB Biology IA: 60 Examples and Guidance
Charles Whitehouse
The International Baccalaureate (IB) program offers a variety of assessments for students, including Internal Assessments (IAs), which are pieces of coursework marked by students’ teachers. The Biology IA is an assessment designed to test students' understanding of the material they have learned in their biology course, their ability to conduct independent research, and their competence in applying their knowledge to real-world biological issues.
What is the IA?
The IA consists of a laboratory report that students must complete during their IB biology course. For assessments before May 2025, the report should be 6 to 12 pages in length, but after May 2025, the length requirement is updated to a maximum of 3,000 words.
📈Boost your grades with our revision platform, used by 100,000+ students! 📝Access thousands of practice questions, study notes, and past papers for every subject. 📚 View IB Resources 📚 View A-Level Resources 📚 View GCSE Resources 📚 View IGCSE Resources
What should the IA contain?
The research question for the internal assessment should be a testable question that is related to the biology curriculum. It's essential that the question is relevant to the biology curriculum, specific and clearly defined. The methodology section should explain how the research was conducted, including the materials and methods used. The methodology should be detailed and well-explained, and should include information on the materials and methods used, as well as any ethical considerations.
Data analysis is an important aspect of the IA. Professional IB Biology tutors recommend that students should present their data in a clear and organized manner, and should use appropriate statistical analysis to interpret their results. They should also make sure to include a discussion of the limitations of their study and the implications of their findings.
The conclusion should summarise the main findings of the study, relate the results back to the research question, and address the relevance of these findings to the broader context of the biological field.
In addition to the laboratory report, students must complete a reflective statement, which is mandatory. This statement should be around 500 words long and must include references to how the student has achieved specific learning objectives outlined in the IB Biology syllabus, and should reflect on the student’s learning during the internal assessment process. The reflective statement should include a description of the student’s personal learning process, including successes and challenges, as well as an evaluation of their performance on the internal assessment and the skills they have gained through the process.
Have a look at our comprehensive set resources for IB Biology developed by expert IB teachers and examiners!
- IB Biology 2024 Study Notes
- IB Biology 2025 Study Notes
- IB Biology 2024 Questions
- IB Biology 2025 Questions
What are some example research questions?
Here are examples with details of potential research questions, written by expert IB Biology tutors and teachers, that could inspire your Biology IA:
1 - Investigating the effect of different types of sugars on the rate of fermentation by yeast. To investigate the effect of different concentrations of a specific herbicide on the growth rate of a particular plant species, one could set up an experiment in which the plants are grown in soil with varying concentrations of the herbicide. An appropriate range of concentrations and a suitable plant species would need to be chosen, along with control variables such as light, temperature, and watering. The growth rate of the plants could be measured by tracking their height or mass over a set period of time. Comparing the growth rates of the different groups would determine the impact of the herbicide on the plant's growth.
2 - How does the pH of a solution affect the activity of an enzyme? To investigate the effect of pH on enzyme activity, one could set up an experiment in which the enzyme is exposed to solutions with varying pH levels. The enzyme's activity could be measured by monitoring the rate of a specific reaction catalyzed by the enzyme. Control variables such as temperature, substrate concentration, and enzyme concentration would need to be kept constant. By comparing the activity of the enzyme at different pH levels, the optimal pH range for the enzyme could be determined.
3 - Can the concentration of vitamin C in different types of fruit juice be determined using titration?
To determine the concentration of vitamin C in different types of fruit juice using titration, a standardized solution of a known concentration of potassium permanganate would be prepared. A sample of the fruit juice would be titrated with the potassium permanganate solution until the endpoint is reached, indicating that all the vitamin C has reacted with the potassium permanganate. The concentration of vitamin C in the fruit juice can then be calculated based on the volume and concentration of the potassium permanganate solution used in the titration. This process would need to be repeated for each type of fruit juice being tested.
4 - Investigating the effect of light intensity on the rate of photosynthesis in aquatic plants.
Set up an experiment in which aquatic plants are placed in containers with varying levels of light intensity. The light intensity could be controlled by adjusting the distance between the light source and the plants. The rate of photosynthesis could be measured by tracking the amount of oxygen produced by the plants over a set period of time. Comparing the rates of photosynthesis of the different groups would determine the impact of light intensity on the plant's photosynthetic activity. Control variables such as temperature, water quality, and plant species would need to be kept constant.
5 - How does the concentration of carbon dioxide affect the rate of photosynthesis in terrestrial plants?
Conduct an experiment in which plants are grown under different concentrations of carbon dioxide. The plants would need to be grown in a controlled environment with consistent light, temperature, and watering. The rate of photosynthesis could be measured by monitoring the oxygen production of the plants using a dissolved oxygen probe. The results could then be analyzed to determine how the concentration of carbon dioxide affects the rate of photosynthesis in terrestrial plants.
6 - Can the presence of glucose in urine be determined using Benedict's test?
Collect a urine sample from the individual being tested. Add Benedict's reagent to the sample and heat it in a water bath. If glucose is present in the urine, it will react with the Benedict's reagent and cause a color change. The intensity of the color change can be compared to a color chart to determine the concentration of glucose in the urine. This process would need to be repeated for each urine sample being tested.
7 - Investigating the effect of temperature on the respiration rate of germinating seeds.
Set up an experiment in which germinating seeds are exposed to different temperatures. The respiration rate of the seeds could be measured by monitoring the amount of oxygen consumed or carbon dioxide produced over a set period of time. The experiment would need to control for other variables such as the type of seed, the amount of water and nutrients provided, and the length of time the seeds have been germinating. Comparing the respiration rates of the different groups would determine the effect of temperature on the seeds' respiration rate.
8 - How does the concentration of salt in a solution affect the growth of bacteria?
Prepare a series of solutions with varying concentrations of salt, and inoculate each with a known amount of bacteria. The solutions would need to be incubated at a constant temperature for a set period of time, and the growth of the bacteria could be measured by counting the number of colonies or by using a spectrophotometer to measure the optical density of the solution. Comparing the growth rates of the bacteria in the different salt concentrations would determine the effect of salt on bacterial growth. Control variables such as pH, temperature, and nutrient availability would need to be kept constant.
9 - Can the concentration of nitrogen compounds in soil be determined using colorimetry?
Collect soil samples from different locations and extract the nitrogen compounds using a suitable method such as Kjeldahl digestion. The extracted compounds can then be analyzed using colorimetry, which involves adding a reagent that reacts with the nitrogen compounds and produces a color. The intensity of the color can be measured using a spectrophotometer, and the concentration of nitrogen compounds in the soil can be calculated based on the absorbance of the color. This process would need to be repeated for each soil sample being tested.
10 - Investigating the effect of different types of plant hormones on the growth of seedlings.
Set up an experiment in which seedlings are grown in different concentrations of plant hormones, with control variables such as light, temperature, and watering. The growth rate of the seedlings could be measured by tracking their height or mass over a set period of time. Comparing the growth rates of the different groups would determine the impact of the plant hormones on the seedlings' growth. The experiment could also include observations of other plant characteristics such as leaf size and color, root development, and overall health.
Get expert help with your IB Biology
The world's leading online IB Biology tutoring provider trusted by students, parents, and schools globally.
4.93 /5 based on 486 reviews
11 - How does the concentration of salt in water affect the hatching rate of brine shrimp?
Set up multiple containers with different concentrations of salt water and add brine shrimp eggs to each container. The containers should be kept at a consistent temperature and light level. After a set period of time, count the number of hatched brine shrimp in each container and calculate the hatching rate. Comparing the hatching rates of the different containers would determine the effect of salt concentration on the hatching rate of brine shrimp.
12 - Can the rate of mitosis be determined using microscopy techniques?
Collect a sample of cells undergoing mitosis and prepare them for microscopy. Using a microscope, observe the cells and record the time it takes for each cell to complete each stage of mitosis. The rate of mitosis can then be calculated by dividing the time taken for each stage by the total time taken for the entire process. This process would need to be repeated for multiple cells to ensure accuracy and reliability of the results.
13 - Investigating the effect of different types of antibiotics on the growth of bacteria.
Culture bacteria in petri dishes with different concentrations of antibiotics. The growth of the bacteria can be observed and measured over a set period of time. The concentration of antibiotic that inhibits the growth of the bacteria can be determined, and the effectiveness of different types of antibiotics can be compared. Control variables such as temperature, humidity, and nutrient availability would need to be kept constant to ensure accurate results.
14 - How does the concentration of oxygen affect the respiration rate of crickets?
Set up a series of chambers with different concentrations of oxygen, ranging from low to high. Place crickets in each chamber and monitor their respiration rate by measuring the amount of oxygen consumed and carbon dioxide produced over a set period of time. The results can be analyzed to determine the effect of oxygen concentration on the respiration rate of crickets. Control variables such as temperature and humidity would need to be kept constant throughout the experiment.
15 - Can the concentration of glucose in blood be determined using glucose oxidase and spectrophotometry?
A sample of blood would be mixed with glucose oxidase, which converts glucose to hydrogen peroxide. The amount of hydrogen peroxide produced is proportional to the amount of glucose in the sample. A spectrophotometer would then be used to measure the absorbance of the sample at a specific wavelength, which is also proportional to the amount of hydrogen peroxide present. The concentration of glucose in the blood sample can then be calculated based on the absorbance reading and a standard curve generated using known concentrations of glucose. This process would need to be repeated for each blood sample being tested.
16 - Investigating the effect of different types of pesticides on the growth of bean plants.
Set up an experiment in which bean plants are grown in soil treated with varying concentrations of different pesticides. An appropriate range of concentrations and a suitable plant species would need to be chosen, along with control variables such as light, temperature, and watering. The growth rate of the plants could be measured by tracking their height or mass over a set period of time. Comparing the growth rates of the different groups would determine the impact of the pesticides on the plant's growth. Additionally, the health of the plants could be assessed by examining their leaves for signs of damage or discoloration.
17 - How does the concentration of light affect the growth of algae?
Set up multiple containers with different concentrations of light, ranging from low to high. In each container, add a sample of algae and monitor their growth over a set period of time. The growth rate of the algae can be measured by tracking their biomass or chlorophyll content. Comparing the growth rates of the different groups would determine the impact of light concentration on the growth of algae. Control variables such as temperature, nutrient availability, and water quality would need to be maintained to ensure accurate results.
18 - Can the presence of starch in leaves be determined using iodine solution?
Obtain a sample of the leaf and grind it into a fine powder. Add a few drops of iodine solution to the powder and observe the color change. If the solution turns blue-black, it indicates the presence of starch in the leaf. This process would need to be repeated for multiple leaves from different plants to ensure accuracy and reliability of the results. Control variables such as the age of the leaf and the time of day the sample is taken should also be considered.
19 - Investigating the effect of different types of plant nutrients on the growth of tomatoes.
Set up an experiment in which tomato plants are grown in soil with varying concentrations of different plant nutrients, such as nitrogen, phosphorus, and potassium. Control variables such as light, temperature, and watering would need to be maintained. The growth rate of the plants could be measured by tracking their height or mass over a set period of time. Comparing the growth rates of the different groups would determine the impact of the plant nutrients on the plant's growth. Additionally, the nutrient content of the tomato plants could be analyzed to determine if there is a correlation between the nutrient concentration in the soil and the nutrient content in the plant.
20 - How does the concentration of carbon dioxide affect the growth of marine plants?
Conduct an experiment in which marine plants are grown in water with varying concentrations of carbon dioxide. The carbon dioxide concentration could be controlled by bubbling different amounts of carbon dioxide gas into the water. The growth rate of the plants could be measured by tracking their height, mass, or chlorophyll content over a set period of time. Comparing the growth rates of the different groups would determine the impact of carbon dioxide concentration on the plant's growth. Other variables such as light, temperature, and nutrient availability would need to be controlled to ensure that any differences in growth rate are due to the carbon dioxide concentration.
21 - Can the concentration of protein in an egg be determined using the Biuret method?
To determine the concentration of protein in an egg using the Biuret method, the egg would need to be homogenized and the protein extracted. A Biuret reagent would then be added to the protein extract, which would cause a color change if protein is present. The intensity of the color change would be proportional to the concentration of protein in the egg. A standard curve could be created using known concentrations of protein to determine the concentration of protein in the egg sample. This process would need to be repeated for each egg being tested.
22 - Investigating the effect of different types of plant hormones on the root growth of seedlings.
Set up an experiment in which seedlings are grown in soil with different concentrations of plant hormones. An appropriate range of concentrations and a suitable plant species would need to be chosen, along with control variables such as light, temperature, and watering. The root growth of the seedlings could be measured by tracking their length or mass over a set period of time. Comparing the root growth of the different groups would determine the impact of the plant hormones on the seedling's root growth.
23 - How does the concentration of oxygen affect the respiration rate of goldfish?
Set up multiple tanks with goldfish and varying levels of oxygen concentration. The respiration rate of the goldfish can be measured by tracking their oxygen consumption or carbon dioxide production. The experiment would need to be conducted over a set period of time with control variables such as temperature and feeding schedules. Comparing the respiration rates of the different groups would determine the effect of oxygen concentration on the goldfish's respiration rate.
24 - Can the concentration of a specific hormone in blood be determined using ELISA?
ELISA (enzyme-linked immunosorbent assay) involves coating a microplate with a specific antibody that binds to the hormone of interest. The sample of blood is then added to the plate, and any hormone present in the sample will bind to the antibody. A secondary antibody that is linked to an enzyme is then added, which will bind to the hormone-antibody complex. The enzyme will then catalyze a reaction that produces a detectable signal, such as a color change. The intensity of the signal is proportional to the amount of hormone present in the sample, allowing for the concentration of the hormone to be determined. A standard curve can be created using known concentrations of the hormone to accurately quantify the concentration in the sample.
25 - Investigating the effect of different types of pollutants on the growth of watercress.
Set up an experiment in which watercress plants are grown in water contaminated with different types and concentrations of pollutants. The growth rate of the plants could be measured by tracking their height or mass over a set period of time. Comparing the growth rates of the different groups would determine the impact of the pollutants on the plant's growth. Control variables such as light, temperature, and watering would need to be kept constant to ensure accurate results. The types and concentrations of pollutants used in the experiment would need to be carefully chosen based on their potential impact on watercress growth and their relevance to real-world pollution scenarios.
26 - How does the concentration of light affect the rate of respiration in germinating seeds?
Set up a series of experiments in which germinating seeds are exposed to different intensities of light. The rate of respiration could be measured by tracking the amount of oxygen consumed or carbon dioxide produced by the seeds over a set period of time. The experiment would need to control for other variables such as temperature and humidity. Comparing the rates of respiration for the different light intensities would determine the impact of light concentration on the rate of respiration in germinating seeds.
27 - Can the concentration of nitrates in water be determined using colorimetry?
Prepare a series of standard solutions of known concentrations of nitrates. A sample of the water would be mixed with a reagent that reacts with nitrates to produce a colored product. The intensity of the color would be measured using a colorimeter, and the concentration of nitrates in the water can be calculated based on the intensity of the color and the concentration of the standard solutions. This process would need to be repeated for each water sample being tested.
28 - Investigating the effect of different types of disinfectants on the growth of bacteria.
Prepare a culture of bacteria and divide it into multiple groups. Each group would be exposed to a different type of disinfectant, while control groups would not be exposed to any disinfectant. The growth rate of the bacteria in each group would be measured over a set period of time, either by counting the number of colonies or by measuring the turbidity of the culture. Comparing the growth rates of the different groups would determine the effectiveness of each disinfectant on inhibiting bacterial growth.
29 - How does the concentration of salt in water affect the growth of duckweed?
Set up multiple containers of water with varying concentrations of salt. Add duckweed to each container and monitor their growth over a set period of time. The growth rate of the duckweed can be measured by tracking their surface area or biomass. Comparing the growth rates of the different groups would determine the impact of salt concentration on the growth of duckweed. Control variables such as light, temperature, and nutrients should be kept constant across all containers.
30 - Can the concentration of ethanol in different types of alcoholic beverages be determined using gas chromatography?
Use gas chromatography to separate the components of the alcoholic beverage sample. The ethanol would be detected and quantified using a detector such as a flame ionization detector. The concentration of ethanol in each sample can then be calculated based on the peak area or height of the ethanol peak in the chromatogram. This process would need to be repeated for each type of alcoholic beverage being tested.
31 - Investigating the effects of different types of exercise on heart rate and blood pressure.
Recruit a group of participants and randomly assign them to different exercise groups (e.g. running, cycling, weightlifting). Measure their heart rate and blood pressure before and after the exercise session. Repeat this process for each exercise group. Analyze the data to determine if there are any significant differences in the effects of the different types of exercise on heart rate and blood pressure. Control variables such as age, gender, and fitness level should be taken into account.
32 - How does the level of noise pollution affect the behavior and communication of animals?
Conduct a field study in which the behavior and communication of animals in areas with varying levels of noise pollution are observed and recorded. Control variables such as time of day, weather conditions, and animal species would need to be taken into account. The observations could include changes in vocalizations, movement patterns, and social interactions. Comparing the behavior and communication of animals in areas with different levels of noise pollution would determine the impact of noise on their behavior. Statistical analysis could be used to establish correlations between noise levels and changes in animal behavior.
33 - Investigating the effects of different types of fertilizers on plant growth and nutrient uptake.
Set up an experiment in which identical plants are grown in soil with different types of fertilizers. The growth rate of the plants could be measured by tracking their height or mass over a set period of time. Nutrient uptake could be measured by analyzing the nutrient content of the plants at the end of the experiment. Comparing the growth rates and nutrient uptake of the different groups would determine the impact of the fertilizers on plant growth and nutrient uptake. Control variables such as light, temperature, and watering would need to be kept constant.
34 - How does exposure to light pollution affect the migration and behavior of nocturnal animals?
Conduct a field study in which nocturnal animals are observed in areas with varying levels of light pollution. The behavior and migration patterns of the animals could be tracked using GPS or radio telemetry. Data on the animals' activity levels, movement patterns, and habitat use could be collected and compared between areas with different levels of light pollution. This would allow for an assessment of the impact of light pollution on nocturnal animals and their ecosystems.
35 - Investigating the effects of different types of water pollution on aquatic ecosystems and organisms.
Set up multiple tanks or containers with different types and levels of water pollution, such as oil spills, chemical runoff, or excess nutrients. Populate each tank with a variety of aquatic organisms, such as fish, algae, and invertebrates. Monitor the health and behavior of the organisms over a set period of time, noting any changes in growth, reproduction, or mortality rates. Comparing the results from each tank would allow for an assessment of the impact of different types of water pollution on aquatic ecosystems and organisms.
36 - How does exposure to electromagnetic radiation affect the growth and development of plants?
Set up an experiment in which plants are exposed to different levels of electromagnetic radiation, such as UV light or radio waves. The plants would need to be grown in a controlled environment with consistent light, temperature, and watering. The growth rate and development of the plants could be measured by tracking their height, leaf size, and overall health over a set period of time. Comparing the growth and development of the plants exposed to different levels of electromagnetic radiation would determine the impact of the radiation on the plants. Control groups of plants not exposed to radiation would also need to be included for comparison.
37 - Investigating the effects of different types of air pollution on respiratory function and lung health.
Recruit a sample of participants who are exposed to different types of air pollution, such as those who live near busy roads or industrial areas. Conduct lung function tests, such as spirometry, on each participant to establish a baseline measurement of their respiratory health. Repeat the tests after a set period of time to determine any changes in lung function. Comparing the results of participants exposed to different types of air pollution would determine the impact of each type on respiratory function and lung health. Other factors, such as age and smoking status, would need to be controlled for in the analysis.
38 - How does the level of acidity affect the growth and survival of aquatic organisms?
Conduct experiments in which aquatic organisms are exposed to different levels of acidity. The organisms could be placed in tanks with varying pH levels, and their survival and growth rates could be monitored over time. Control variables such as temperature, light, and food availability would need to be kept constant. Comparing the survival and growth rates of the different groups would determine the impact of acidity on the organisms. Additionally, other factors such as changes in behavior or reproduction could also be observed and analyzed.
39 - Investigating the effects of different types of food additives on human health and metabolism.
Conduct a literature review to identify the potential health effects of different food additives. Design a study in which participants consume a controlled diet with varying levels of the food additives being tested. Blood and urine samples could be collected at regular intervals to measure changes in metabolism and biomarkers of health. Statistical analysis would be used to determine if there are significant differences in health outcomes between the different groups.
40 - How does the level of UV radiation affect the growth and survival of plants?
Set up an experiment in which plants are grown under different levels of UV radiation. This could be achieved by using UV lamps of varying intensities or by placing the plants at different distances from a natural source of UV radiation, such as the sun. The growth rate, survival rate, and other relevant factors such as leaf size and chlorophyll content could be measured and compared across the different groups. This would help determine the impact of UV radiation on plant growth and survival. Control variables such as temperature, humidity, and watering would need to be carefully monitored and controlled to ensure accurate results.
41 - Investigating the effects of different types of drugs on human physiology and behavior.
Conduct a double-blind, randomized controlled trial with a group of participants who are given different types of drugs. The physiological and behavioral effects of the drugs would be measured through various tests and assessments, such as blood pressure, heart rate, cognitive function, and mood. The results would be analyzed to determine the impact of each drug on the participants' physiology and behavior, and any potential side effects or risks associated with each drug would be identified.
42 - How does the level of carbon dioxide affect the growth and development of plants?
Conduct an experiment in which plants are grown in controlled environments with varying levels of carbon dioxide. The growth rate, height, and biomass of the plants can be measured over a set period of time. The results can be compared to determine the impact of different levels of carbon dioxide on plant growth and development. Other variables such as light, temperature, and watering would need to be controlled to ensure that the results are accurate and reliable.
43 - Investigating the effects of different types of pesticides on non-target organisms and ecosystems.
Conduct a series of experiments in which different non-target organisms are exposed to varying concentrations of the pesticide. The organisms could be chosen based on their ecological importance, such as pollinators or soil microorganisms. The effects of the pesticide on the organisms could be measured by tracking their survival rates, reproductive success, or behavior. Additionally, the impact of the pesticide on the broader ecosystem could be assessed by monitoring changes in the abundance and diversity of other species in the area. Comparing the results of these experiments would provide insight into the potential ecological risks associated with the use of the pesticide.
44 - How does the level of atmospheric pollutants affect the growth and development of plants?
Set up an experiment in which plants are grown in controlled environments with varying levels of atmospheric pollutants, such as nitrogen dioxide or ozone. The growth rate, leaf area, and chlorophyll content of the plants could be measured over a set period of time. Comparing the growth rates and health of the plants exposed to different levels of pollutants would determine the impact of atmospheric pollutants on plant growth and development. Control variables such as light, temperature, and watering would need to be kept constant to ensure accurate results.
45 - Investigating the effects of different types of microorganisms on the digestive system and gut microbiome.
Conduct a study in which different groups of animals are exposed to different types of microorganisms, either through their diet or through direct exposure. The effects on their digestive system and gut microbiome could be measured through various methods such as analyzing fecal samples, measuring changes in gut pH, or monitoring the presence of certain bacteria. Comparing the results from the different groups would determine the impact of the microorganisms on the animals' digestive system and gut microbiome.
46 - How does the level of humidity affect the growth and survival of insects?
Conduct an experiment in which insects are exposed to different levels of humidity in a controlled environment. The survival rate and growth rate of the insects could be measured over a set period of time. The experiment would need to control for other variables such as temperature, food availability, and lighting. Comparing the survival and growth rates of the insects in different humidity levels would determine the impact of humidity on their growth and survival.
47 - Investigating the effects of different types of radiation on the genetic material and DNA replication.
Cultivate a sample of cells in a controlled environment and expose them to different types of radiation, such as gamma rays or UV light. The cells would then be monitored for changes in their genetic material, such as mutations or damage to DNA replication. The results could be compared to a control group that was not exposed to radiation to determine the effects of each type of radiation on the cells. Additional experiments could be conducted to investigate the long-term effects of radiation exposure on the cells.
48 - How does the level of soil salinity affect the growth and survival of plants?
Set up an experiment in which plants are grown in soil with varying levels of salinity. An appropriate range of salinity levels and a suitable plant species would need to be chosen, along with control variables such as light, temperature, and watering. The growth rate and survival rate of the plants could be measured by tracking their height, mass, and number of leaves over a set period of time. Comparing the growth and survival rates of the different groups would determine the impact of soil salinity on the plant's growth and survival. Additionally, the concentration of ions in the soil could be measured to determine the relationship between soil salinity and plant growth.
49 - Investigating the effects of different types of antibiotics on bacterial growth and antibiotic resistance.
Set up a series of petri dishes with agar and bacterial cultures. Each dish would contain a different antibiotic, with varying concentrations. The dishes would be incubated for a set period of time, and the growth of the bacteria would be measured. The results would show which antibiotics were most effective at inhibiting bacterial growth, and whether any resistance had developed. Control variables such as temperature, humidity, and the type of bacteria used would need to be carefully controlled to ensure accurate results.
50 - How does the level of soil pH affect the growth and survival of plants?
Conduct an experiment in which plants are grown in soil with varying pH levels. An appropriate range of pH levels and a suitable plant species would need to be chosen, along with control variables such as light, temperature, and watering. The growth rate of the plants could be measured by tracking their height or mass over a set period of time. Comparing the growth rates of the different groups would determine the impact of soil pH on the plant's growth and survival. Other factors such as nutrient availability and toxicity would also need to be considered and controlled for in the experiment.
51 - Investigating the effects of different types of hormones on animal behavior and physiology.
Conduct experiments with different groups of animals, each exposed to a different hormone. The behavior and physiology of the animals would be monitored and recorded over a set period of time. Control variables such as diet, environment, and age would need to be maintained across all groups. Comparing the results of the different groups would determine the effects of each hormone on the animals' behavior and physiology. Statistical analysis could be used to determine the significance of the results.
52 - How does the level of water availability affect the growth and survival of plants?
Conduct an experiment in which plants are grown in different levels of water availability, ranging from drought conditions to optimal watering. The growth rate, survival rate, and overall health of the plants would be monitored over a set period of time. The data collected would be used to determine the impact of water availability on plant growth and survival. Control variables such as light, temperature, and soil type would need to be kept constant to ensure accurate results.
53 - Investigating the effects of different types of plant extracts on bacterial growth and antibiotic resistance.
Prepare bacterial cultures in petri dishes with different concentrations of the plant extracts. The growth of the bacteria can be observed over a set period of time, and the effectiveness of the plant extracts in inhibiting bacterial growth and antibiotic resistance can be determined by comparing the growth rates of the different groups. Control variables such as temperature and nutrient availability would need to be kept constant to ensure accurate results.
54 - How does the level of nutrients affect the growth and development of microorganisms?
Conduct experiments in which microorganisms are grown in nutrient-rich and nutrient-poor environments. The growth rate and development of the microorganisms could be measured by tracking their population size and observing their morphology under a microscope. Comparing the growth rates and morphology of the microorganisms in the different environments would determine the impact of nutrient levels on their growth and development. Control variables such as temperature, pH, and oxygen levels would need to be kept constant.
55 - Investigating the effects of different types of pollution on the reproductive systems and fertility of animals.
Select a suitable animal species and expose them to different types of pollution, such as air pollution or water pollution. The reproductive systems and fertility of the animals could be monitored over a set period of time, and compared to a control group that was not exposed to pollution. The impact of the pollution on the animals' reproductive systems and fertility could be determined by analyzing factors such as the number of offspring produced, the health of the offspring, and any abnormalities or complications observed during pregnancy or birth.
56 - How does the level of light intensity affect the growth and development of microorganisms?
Set up multiple petri dishes with agar and different levels of light intensity, ranging from complete darkness to bright light. Inoculate each dish with the same strain of microorganisms and incubate them for a set period of time. The growth of the microorganisms can be measured by counting the number of colonies or by measuring the turbidity of the culture. Comparing the growth rates of the different groups would determine the impact of light intensity on the growth and development of the microorganisms. Control variables such as temperature, nutrient availability, and humidity would need to be maintained throughout the experiment.
57 - Investigating the effects of different types of food on the metabolism and energy balance of humans.
Conduct a randomized controlled trial in which participants are assigned to different groups and given different types of food to eat for a set period of time. The participants' energy intake, metabolism, and weight would be measured before and after the intervention to determine the impact of the different types of food on their energy balance. Other factors such as physical activity levels and sleep patterns would also need to be controlled for to ensure accurate results.
58 - How does the level of nutrients affect the growth and development of plants?
Conduct an experiment in which plants are grown in different nutrient solutions with varying levels of nitrogen, phosphorus, and potassium. The growth rate, height, and mass of the plants could be measured over a set period of time to determine the impact of the nutrient levels on their growth and development. Control variables such as light, temperature, and watering would need to be kept constant. The results could be analyzed to determine the optimal nutrient levels for plant growth and development.
59 - Investigating the effects of different types of hormones on plant growth and development.
Set up an experiment in which different groups of plants are treated with different types and concentrations of hormones. The growth rate, height, and mass of the plants could be measured over a set period of time. Control variables such as light, temperature, and watering would need to be kept constant. Comparing the growth rates of the different groups would determine the impact of the hormones on the plant's growth and development. Additional measurements such as leaf size, root length, and flower production could also be taken to further analyze the effects of the hormones.
60 - How does the level of water quality affect the growth and survival of aquatic organisms?
Set up multiple aquariums with varying levels of water quality, such as different levels of pollutants or pH. Introduce the same species of aquatic organism into each aquarium and monitor their growth and survival over a set period of time. The growth rate and survival rate of the organisms can be compared between the different aquariums to determine the impact of water quality on their growth and survival. Control variables such as temperature and feeding schedules should be kept consistent across all aquariums.
Remember to come up with your own original IA topic and check it with your teacher. It should be practical to conduct and relevant to the syllabus. Even A-Level Biology tutors say that this is a great opportunity to develop your personal interests, while advancing your knowledge of the Biology curriculum.
How can I prepare for the IA?
To prepare for the IA, students should ensure that they understand the material covered in their biology course and should practice writing lab reports. They should also seek feedback from their teachers on their writing skills and their understanding of the research process. IB tutors provide personalized guidance and can help students understand complex topics and achieve higher grades as well.
TutorChase's IB resources , including IB Biology Q&A Revision Notes , are perfect for students who want to get a 7 in their IB Biology exams and also prepare for the internal assessment. They are completely free, cover all topics in depth, also have IB Biology past papers and are structured by topic so you can easily keep track of your progress.
How is the IA graded?
The IA is worth 20% of the final grade for the IB biology course, whether you are studying at Higher or at Standard Level. It is graded by the student’s teacher, who is trained and certified by the International Baccalaureate organization. The report is then sent to a moderator, who will check that the report adheres to the IB guidelines and that the grade awarded is appropriate.
Online Biology tutors emphasise that it is important for students to be familiar with the assessment criteria for the biology internal assessment. These criteria are used to grade the laboratory report and reflective statement, and include aspects such as the quality of the research question, the methodology used, the data analysis, and the conclusion. Students should also make sure that their report is well-written and properly formatted, and that it includes all the required sections.
Recent Changes to the IB Biology IA Guidelines
The IB has recently updated the guidelines for the Biology IA to better reflect the evolving nature of biological research and education. These changes include a greater focus on the application of biological principles to real-world situations, a more structured approach to reflective statements, and updated word count and grading criteria. It is important for students to familiarize themselves with these changes to ensure they meet the new expectations.

Source: IB Biology Subject Guide, pre-May 2025
In summary, the IA in the IB is an opportunity for students to demonstrate their understanding of the biology curriculum, as well as their ability to conduct independent research. It consists of a laboratory report and a reflective statement, and is worth 20% of the final grade for the course. To prepare for the assessment, students should ensure that they understand the material covered in their IB Biology.
Need help from an expert?
The world’s top online tutoring provider trusted by students, parents, and schools globally.
Study and Practice for Free
Trusted by 100,000+ Students Worldwide
Achieve Top Grades in your Exams with our Free Resources.
Practice Questions, Study Notes, and Past Exam Papers for all Subjects!
Need Expert Help?
If you’re looking for assistance with IB Biology, get in touch with the TutorChase team and we’ll be able to provide you with an expert IB Biology tutor . We’ll be there every step of the way!

Professional tutor and Cambridge University researcher

Written by: Charles Whitehouse
Charles scored 45/45 on the International Baccalaureate and has six years' experience tutoring IB and IGCSE students and advising them with their university applications. He studied a double integrated Masters at Magdalen College Oxford and has worked as a research scientist and strategy consultant.
Related Posts

What are the Hardest IB Subjects?

IB Theory of Knowledge: Knowledge Questions Explained

How to Choose Your IB Subjects

Hire a tutor
Please fill out the form and we'll find a tutor for you
- Select your country
- Afghanistan
- Åland Islands
- American Samoa
- Antigua and Barbuda
- Bosnia and Herzegovina
- Bouvet Island
- British Indian Ocean Territory
- Brunei Darussalam
- Burkina Faso
- Cayman Islands
- Central African Republic
- Christmas Island
- Cocos (Keeling) Islands
- Congo, The Democratic Republic of the
- Cook Islands
- Cote D'Ivoire
- Czech Republic
- Dominican Republic
- El Salvador
- Equatorial Guinea
- Falkland Islands (Malvinas)
- Faroe Islands
- French Guiana
- French Polynesia
- French Southern Territories
- Guinea-Bissau
- Heard Island and Mcdonald Islands
- Holy See (Vatican City State)
- Iran, Islamic Republic Of
- Isle of Man
- Korea, Democratic People'S Republic of
- Korea, Republic of
- Lao People'S Democratic Republic
- Libyan Arab Jamahiriya
- Liechtenstein
- Macedonia, The Former Yugoslav Republic of
- Marshall Islands
- Micronesia, Federated States of
- Moldova, Republic of
- Netherlands
- Netherlands Antilles
- New Caledonia
- New Zealand
- Norfolk Island
- Northern Mariana Islands
- Palestinian Territory, Occupied
- Papua New Guinea
- Philippines
- Puerto Rico
- Russian Federation
- Saint Helena
- Saint Kitts and Nevis
- Saint Lucia
- Saint Pierre and Miquelon
- Saint Vincent and the Grenadines
- Sao Tome and Principe
- Saudi Arabia
- Serbia and Montenegro
- Sierra Leone
- Solomon Islands
- South Africa
- South Georgia and the South Sandwich Islands
- Svalbard and Jan Mayen
- Switzerland
- Syrian Arab Republic
- Taiwan, Province of China
- Tanzania, United Republic of
- Timor-Leste
- Trinidad and Tobago
- Turkmenistan
- Turks and Caicos Islands
- United Arab Emirates
- United Kingdom
- United States
- United States Minor Outlying Islands
- Virgin Islands, British
- Virgin Islands, U.S.
- Wallis and Futuna
- Western Sahara

Alternatively contact us via WhatsApp, Phone Call, or Email
How to Nail Your Science IA Analysis

Carrying out a science IA analysis and the accompanying uncertainty calculations—in subjects like Chemistry, Physics, and Biology (SL and HL)—is one of the most challenging things to get right. Too often, I have witnessed students spending hours upon hours calculating percentage errors, only to find out that they got it all wrong.
In this article, I’ll expand on the previous post on Science IA Communication and Personal Engagement and provide tips for doing well in the Analysis part of your IA. This criterium makes up 6 of the total 24 marks, making it essential to apply these tips if you’re going for that juicy 7 !
If you struggle with your IA, you should contact one of our Lanterna expert tutors. They all have extensive experience with the IB’s infamous internal assessments and are ready to help. Read this post for more about how tuition could help you.
Loyal readers will remember that our Science IA Guide likens learning science without experimentation to baking a cake without flour. If we built upon the metaphor and were to compare Communication to frosting and Personal Engagement to the cherry on top, having a solid Analysis section in your IA would be the spongecake base. Well, let’s get baking!
Nailing Your Science IA Analysis
The first half will focus on the Analysis section. Here, I will discuss data sampling, data processing, and, most importantly, uncertainty calculations . The Analysis you present is the heart and soul of your Internal Assessment, so don’t neglect it!
How much data is enough data?
It might not seem very pleasant when your teacher tells you to run the same titration five times for five different concentrations for your Chemistry IA (SL or HL), but there is a good reason for it! The “ 5 by 5″-rule is the golden standard for science IAs, and you should do your best to live up to it!
Let us say that you’re writing your Biology IA on the effect of K + -ion concentration on the growth rate of mentha piperita. In this example, you would want to test at least five different K + -ion concentrations with at least five plants per condition.
The reason for this is simple. The IA Criteria require “sufficient relevant quantitative and qualitative raw data that could support a detailed and valid conclusion to the research question” for a high mark.
You should also note down everything that happens in the lab and take plenty of pictures! You want to store as much information as possible during your lab work and decide what is useful later. Nothing is worse than noticing you forgot to measure something once you start data processing.
Qualitative vs Quantitative Data in your IA Analysis
Note that the above quote requires quantitative as well as qualitative data. Quantitative data comprises measurable aspects such as weight, height, and speed, while qualitative data refers to observations that cannot be quantified (hence, it isn’t quantitative). For instance, if you notice a colour change during one of your experiments, you can include it in a “quantitative data” subsection and explain what that alteration might signify.

Data Processing in Your IA Analysis
It’s time to slip out of the lab coat and into something more comfortable because you’re about to spend a lot of time in front of a screen. Sound data processing and uncertainty calculations take time, especially if it’s your first time working with them. It is time well spent, though! Data processing skills are useful even if you’re not planning to pursue a science degree. IA Analyses provide an opportunity to improve written communication, a crucial skill in every industry.
What follows are top tips from our tutors on what you mustn’t forget when processing your raw data.
Data Processing Tip 1: Show Your Workings
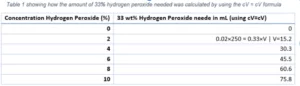
Whenever you write a number or value, ensure the reader knows where it came from. This doesn’t mean you need to show absolutely every calculation you perform, as there simply isn’t space for that. If you repeat calculations, you can show just one , but you mustn’t avoid them altogether. The table here is an example of this from my Chemistry Extended Essay. Click here for some killer EE advice!
Data Processing Tip 2: Significance Testing
Significance testing is typically only necessary for Biology and Psychology IAs (SL and HL). Therefore, I’ll keep this section relatively short and, instead of giving you an in-depth explanation, simply remind you that it is vital to get it right. Let this quote from our IB Psychology IA blog post inspire you:
“Most of the time, the statistical test will do most of the heavy lifting for you. All you have to do is state which one you’ve chosen and why, and using the number it spits out, choose to accept or reject your hypothesis. The words’ statistically significant/insignificant’ are your best friend here!”
Data Processing Tip 3: Double Check Your Calculations
You’ve probably heard the advice to have someone proofread your IA countless times and for good reason. I’ll mention it again: it’s crucial to have someone double-check your calculations to catch any silly mistakes that may have slipped by unnoticed. Don’t take any chances, and ensure the accuracy of your report by asking for help.
Uncertainty Calculations in Your IA Analysis
Here comes the big one: uncertainty calculations and their propagation. A good scientific IA “shows evidence of full and appropriate consideration of the impact of measurement uncertainty on the analysis,” according to the guidelines . Part of the “impact of measurement uncertainty” is how they propagate (i.e., evolve) to become the final uncertainties of your results.
However, before we talk about their propagation, let’s talk about our base measurement uncertainties.
How do I know my uncertainties in the lab?
Fortunately for us, the fundamentals of uncertainties are relatively straightforward to comprehend. If you measure with something analogue (say a graduated cylinder or a ruler), the uncertainty is half the smallest increment on the equipment. If you measure 52 mL with a cylinder with 1 mL spacings, your error is ±0.5. We call this absolute uncertainty.
If you measure something with a digital piece of equipment, like a digital scale, your uncertainty is the smallest increment. If your scale measures 0.2002g of a substance, your absolute uncertainty must be ±0.0001g.
Now, let’s propagate them!
Understanding uncertainty calculations
Imagine you wanted to mix that 52 mL ± 0.5 solution with another 48 mL ± 0.5 solution. The resulting mixture would, of course, have a volume of 100 mL ( unless it doesn’t ). Since you found this new volume by adding two numbers, you can find the error by just adding up their absolute uncertainties, such that:
0.5 + 0.5 = ±1
Thus, your final volume would be 100mL ± 1.
Suppose you want to dissolve the 0.2002g of a substance in your new solution to calculate its concentration in g/mL. What would the uncertainty be? This is where it gets more tricky. I will leave this as an exercise to you, as an in-depth explanation would take up too much space. Try and see if you can solve it with this video !
You should include your final uncertainties as error bars if you use graphs, and consider them when writing your conclusion!
Interpreting Your Processed Data in Your IA Analysis
After analyzing your raw data, it’s important to interpret it honestly without altering it to fit your hypothesis. Explain any trends or lack thereof and provide reasons for them. Don’t worry if there are high uncertainties; just make sure to explain how they could be improved in future research. Honesty is critical and will be what gets you high marks.
It might seem daunting, but doing an excellent job of processing and presenting your data can be done, and hopefully, these tips have inspired you to try your best!
Share article links
Related Articles

- IB - Understanding It
- Most Popular
- Study Skills
Coping with the Impacts of COVID-19
The past year and a half has been challenging for everyone, but here at Lanterna we see the impact on students daily. Our tutors see first-hand how students around the world are struggling with coping with the impacts of COVID-19. To get a better understanding of exactly what you’re finding tough and how we can […]

- Plan for Success
- Revision Skills
Top 4 Tips for Getting Started Studying Again
If you’re struggling with getting started studying again at the beginning of a new school year, you’re not alone! Getting back into the routine of studying can be challenging after weeks of free time. Here we’ll take you through our top three tips for getting started studying again. If you’re struggling with motivation, check out […]

Top 4 Essentials for Studying Chemistry
Each subject in the IB has its own unique set of requirements and challenges. As a result, how you study will be different for each subject. Here we will take you through the essentials for studying Chemistry in the IB. The Syllabus The syllabus is an absolutely essential part of studying for any […]
IMAGES
VIDEO
COMMENTS
This post covers the new Science IA syllabus starting from the May 2025 exam session. A top-scoring IA should be easy to read, have a good flow between topics, and be well-focused. The guide below is just an example of how a good IA should be structured, however, keep in mind that many high-scoring IAs may also use other structures.
Hypothesis. â-¡ A correct answer to the research question is described. â-¡ The hypothesis is supported by scientific reasoning and research. â-¡ A predicted relationship between the independent and dependent variables is described. â-¡ The independent and dependent variables are described as in the question. Background
Hypothesis. After you provide the scientific justification of your experiment, proceed to state your actual hypothesis. ... These were our suggestions on how to write Biology IA based on the new syllabus (the first assessment in 2025). With 20% of your total grade, IB Biology Internal Assessment is a crucial aspect of your academic journey. It ...
Hypothesis: This section is pretty self-explanatory; just state your hypothesis. This should ideally be accompanied by a scientific explanation to support your hypothesis. ... You probably saved my ass, bc I had to write a second biology IA (the first was was too shitty). This is such a good guide, thanks again!! Like Like. Reply. Brianna ...
This undertaking provides students with an opportunity to delve into a topic of personal interest within the realm of biology, conduct experiments, analyze data, and communicate their findings effectively. B. Importance of Achieving a Level 7. Securing a Level 7 in the IB Biology IA is highly coveted for several reasons.
Starting from the May 2025 session, the Biology IA requirements have changed. We created a couple of exemplars to show you how the new IA should look like. It's OK to refer to the old Biology IA exemplars (since the new IA is quite similar) for inspiration/ideas, but make sure to follow the new requirements. Read more
This post covers the new Science IA syllabus starting from the May 2025 exam session. The Biology internal assessment, accounting for 20% of the HL and 25% of the SL score, is graded on a total of 24 points, evaluating the following aspects: Criterion A: Research Design - 6 points. This criterion is about showing how well you have thought out ...
How have you explored various parts of your IA including the research question, background information, variables, your hypothesis, the apparatus, the risk assessment, and the method you used. Research question key questions: Is it a question? ... for specific guidance on how to successfully write this section of your IB Biology IA write-up.
1. Overview of Biology IA. Both HL and SL students are expected to write an IA (Internal Assessment) in Biology which accounts for 20% of the final grade. The IA in biology is expected to be a 6-12 pages long report about an investigation a student carries out based on their own hypothesis. 1.1 IA Criteria. HL and SL share the same IA criteria ...
Also provide an explanation for the hypothesis. This should be a brief discussion (paragraph form) about the theory or 'why' behind the hypothesis and prediction. Be sure the hypothesis is related directly to the research question and that the manipulated and responding variables for the experiment are clear. Check list:
The guide is written with each section of the IA in the order it would appear in the written draft. Both students and teachers have informed me of the guide's usefulness. So far, all of my Biology students have been awarded a 7 on their IA (post moderation) and the average of the IA of other courses I graded have been ~6.
Statistical test(s) include null and alternative hypothesis and probability levels (p values). Clear explanation with justification for the type of data visualization/graph, including use of trendlines; All data, graphs and images are relevant to the research question ; Precise Communication of Data Check list:
Download our 2022 Biology IA Guide (Checklist) to help write the perfect Internal Assessment. The ripeness of Fruit and Vit C content Similarly to the experiment on the rate of decay, you can also measure how quickly fruits ripen, and which factors affect this ripening.
But don't worry - we've got you covered with a list of the first steps of designing your IA. Here are the 5 of them to quickly start writing your Biology IA. 5 steps to jumpstart writing your Biology IA . Think about the topic of your investigation: The topic of your investigation will impact every part of your writing process. However ...
Everything you need to write a good IB IA for biology
Preliminary Pages. Generally, in a HL Biology IA, these pages refer to the Title Page and the Content Page.They come before the actual IA sections and write-up and usually do not require a page number. Many IB students tend to place these pages on the last of their Biology IA to-do-list. However, we would advice that you do it first.
5. Hypothesis & Explanation a. Predict the outcome of your investigation and explain the rationale as to why you believe this. 6. Variables (Measurements if doing a basic investigation) a. Identify the Independent Variable (I.V.) and the increments/ units used. Example: i. "Amount of Corn Starch Used (0.5g, 1.0g, 1.5g, 2.0g, 2.5g)" b.
In summary, the IA in the IB is an opportunity for students to demonstrate their understanding of the biology curriculum, as well as their ability to conduct independent research. It consists of a laboratory report and a reflective statement, and is worth 20% of the final grade for the course.
Carrying out a science IA analysis and the accompanying uncertainty calculations—in subjects like Chemistry, Physics, and Biology (SL and HL)—is one of the most challenging things to get right. Too often, I have witnessed students spending hours upon hours calculating percentage errors, only to find out that they got it all wrong.
6. Write a null hypothesis. If your research involves statistical hypothesis testing, you will also have to write a null hypothesis. The null hypothesis is the default position that there is no association between the variables. The null hypothesis is written as H 0, while the alternative hypothesis is H 1 or H a.