- Privacy Policy
Home » Secondary Data – Types, Methods and Examples

Secondary Data – Types, Methods and Examples
Table of Contents

Secondary Data
Definition:
Secondary data refers to information that has been collected, processed, and published by someone else, rather than the researcher gathering the data firsthand. This can include data from sources such as government publications, academic journals, market research reports, and other existing datasets.
Secondary Data Types
Types of secondary data are as follows:
- Published data: Published data refers to data that has been published in books, magazines, newspapers, and other print media. Examples include statistical reports, market research reports, and scholarly articles.
- Government data: Government data refers to data collected by government agencies and departments. This can include data on demographics, economic trends, crime rates, and health statistics.
- Commercial data: Commercial data is data collected by businesses for their own purposes. This can include sales data, customer feedback, and market research data.
- Academic data: Academic data refers to data collected by researchers for academic purposes. This can include data from experiments, surveys, and observational studies.
- Online data: Online data refers to data that is available on the internet. This can include social media posts, website analytics, and online customer reviews.
- Organizational data: Organizational data is data collected by businesses or organizations for their own purposes. This can include data on employee performance, financial records, and customer satisfaction.
- Historical data : Historical data refers to data that was collected in the past and is still available for research purposes. This can include census data, historical documents, and archival records.
- International data: International data refers to data collected from other countries for research purposes. This can include data on international trade, health statistics, and demographic trends.
- Public data : Public data refers to data that is available to the general public. This can include data from government agencies, non-profit organizations, and other sources.
- Private data: Private data refers to data that is not available to the general public. This can include confidential business data, personal medical records, and financial data.
- Big data: Big data refers to large, complex datasets that are difficult to manage and analyze using traditional data processing methods. This can include social media data, sensor data, and other types of data generated by digital devices.
Secondary Data Collection Methods
Secondary Data Collection Methods are as follows:
- Published sources: Researchers can gather secondary data from published sources such as books, journals, reports, and newspapers. These sources often provide comprehensive information on a variety of topics.
- Online sources: With the growth of the internet, researchers can now access a vast amount of secondary data online. This includes websites, databases, and online archives.
- Government sources : Government agencies often collect and publish a wide range of secondary data on topics such as demographics, crime rates, and health statistics. Researchers can obtain this data through government websites, publications, or data portals.
- Commercial sources: Businesses often collect and analyze data for marketing research or customer profiling. Researchers can obtain this data through commercial data providers or by purchasing market research reports.
- Academic sources: Researchers can also obtain secondary data from academic sources such as published research studies, academic journals, and dissertations.
- Personal contacts: Researchers can also obtain secondary data from personal contacts, such as experts in a particular field or individuals with specialized knowledge.
Secondary Data Formats
Secondary data can come in various formats depending on the source from which it is obtained. Here are some common formats of secondary data:
- Numeric Data: Numeric data is often in the form of statistics and numerical figures that have been compiled and reported by organizations such as government agencies, research institutions, and commercial enterprises. This can include data such as population figures, GDP, sales figures, and market share.
- Textual Data: Textual data is often in the form of written documents, such as reports, articles, and books. This can include qualitative data such as descriptions, opinions, and narratives.
- Audiovisual Data : Audiovisual data is often in the form of recordings, videos, and photographs. This can include data such as interviews, focus group discussions, and other types of qualitative data.
- Geospatial Data: Geospatial data is often in the form of maps, satellite images, and geographic information systems (GIS) data. This can include data such as demographic information, land use patterns, and transportation networks.
- Transactional Data : Transactional data is often in the form of digital records of financial and business transactions. This can include data such as purchase histories, customer behavior, and financial transactions.
- Social Media Data: Social media data is often in the form of user-generated content from social media platforms such as Facebook, Twitter, and Instagram. This can include data such as user demographics, content trends, and sentiment analysis.
Secondary Data Analysis Methods
Secondary data analysis involves the use of pre-existing data for research purposes. Here are some common methods of secondary data analysis:
- Descriptive Analysis: This method involves describing the characteristics of a dataset, such as the mean, standard deviation, and range of the data. Descriptive analysis can be used to summarize data and provide an overview of trends.
- Inferential Analysis: This method involves making inferences and drawing conclusions about a population based on a sample of data. Inferential analysis can be used to test hypotheses and determine the statistical significance of relationships between variables.
- Content Analysis: This method involves analyzing textual or visual data to identify patterns and themes. Content analysis can be used to study the content of documents, media coverage, and social media posts.
- Time-Series Analysis : This method involves analyzing data over time to identify trends and patterns. Time-series analysis can be used to study economic trends, climate change, and other phenomena that change over time.
- Spatial Analysis : This method involves analyzing data in relation to geographic location. Spatial analysis can be used to study patterns of disease spread, land use patterns, and the effects of environmental factors on health outcomes.
- Meta-Analysis: This method involves combining data from multiple studies to draw conclusions about a particular phenomenon. Meta-analysis can be used to synthesize the results of previous research and provide a more comprehensive understanding of a particular topic.
Secondary Data Gathering Guide
Here are some steps to follow when gathering secondary data:
- Define your research question: Start by defining your research question and identifying the specific information you need to answer it. This will help you identify the type of secondary data you need and where to find it.
- Identify relevant sources: Identify potential sources of secondary data, including published sources, online databases, government sources, and commercial data providers. Consider the reliability and validity of each source.
- Evaluate the quality of the data: Evaluate the quality and reliability of the data you plan to use. Consider the data collection methods, sample size, and potential biases. Make sure the data is relevant to your research question and is suitable for the type of analysis you plan to conduct.
- Collect the data: Collect the relevant data from the identified sources. Use a consistent method to record and organize the data to make analysis easier.
- Validate the data: Validate the data to ensure that it is accurate and reliable. Check for inconsistencies, missing data, and errors. Address any issues before analyzing the data.
- Analyze the data: Analyze the data using appropriate statistical and analytical methods. Use descriptive and inferential statistics to summarize and draw conclusions from the data.
- Interpret the results: Interpret the results of your analysis and draw conclusions based on the data. Make sure your conclusions are supported by the data and are relevant to your research question.
- Communicate the findings : Communicate your findings clearly and concisely. Use appropriate visual aids such as graphs and charts to help explain your results.
Examples of Secondary Data
Here are some examples of secondary data from different fields:
- Healthcare : Hospital records, medical journals, clinical trial data, and disease registries are examples of secondary data sources in healthcare. These sources can provide researchers with information on patient demographics, disease prevalence, and treatment outcomes.
- Marketing : Market research reports, customer surveys, and sales data are examples of secondary data sources in marketing. These sources can provide marketers with information on consumer preferences, market trends, and competitor activity.
- Education : Student test scores, graduation rates, and enrollment statistics are examples of secondary data sources in education. These sources can provide researchers with information on student achievement, teacher effectiveness, and educational disparities.
- Finance : Stock market data, financial statements, and credit reports are examples of secondary data sources in finance. These sources can provide investors with information on market trends, company performance, and creditworthiness.
- Social Science : Government statistics, census data, and survey data are examples of secondary data sources in social science. These sources can provide researchers with information on population demographics, social trends, and political attitudes.
- Environmental Science : Climate data, remote sensing data, and ecological monitoring data are examples of secondary data sources in environmental science. These sources can provide researchers with information on weather patterns, land use, and biodiversity.
Purpose of Secondary Data
The purpose of secondary data is to provide researchers with information that has already been collected by others for other purposes. Secondary data can be used to support research questions, test hypotheses, and answer research objectives. Some of the key purposes of secondary data are:
- To gain a better understanding of the research topic : Secondary data can be used to provide context and background information on a research topic. This can help researchers understand the historical and social context of their research and gain insights into relevant variables and relationships.
- To save time and resources: Collecting new primary data can be time-consuming and expensive. Using existing secondary data sources can save researchers time and resources by providing access to pre-existing data that has already been collected and organized.
- To provide comparative data : Secondary data can be used to compare and contrast findings across different studies or datasets. This can help researchers identify trends, patterns, and relationships that may not have been apparent from individual studies.
- To support triangulation: Triangulation is the process of using multiple sources of data to confirm or refute research findings. Secondary data can be used to support triangulation by providing additional sources of data to support or refute primary research findings.
- To supplement primary data : Secondary data can be used to supplement primary data by providing additional information or insights that were not captured by the primary research. This can help researchers gain a more complete understanding of the research topic and draw more robust conclusions.
When to use Secondary Data
Secondary data can be useful in a variety of research contexts, and there are several situations in which it may be appropriate to use secondary data. Some common situations in which secondary data may be used include:
- When primary data collection is not feasible : Collecting primary data can be time-consuming and expensive, and in some cases, it may not be feasible to collect primary data. In these situations, secondary data can provide valuable insights and information.
- When exploring a new research area : Secondary data can be a useful starting point for researchers who are exploring a new research area. Secondary data can provide context and background information on a research topic, and can help researchers identify key variables and relationships to explore further.
- When comparing and contrasting research findings: Secondary data can be used to compare and contrast findings across different studies or datasets. This can help researchers identify trends, patterns, and relationships that may not have been apparent from individual studies.
- When triangulating research findings: Triangulation is the process of using multiple sources of data to confirm or refute research findings. Secondary data can be used to support triangulation by providing additional sources of data to support or refute primary research findings.
- When validating research findings : Secondary data can be used to validate primary research findings by providing additional sources of data that support or refute the primary findings.
Characteristics of Secondary Data
Secondary data have several characteristics that distinguish them from primary data. Here are some of the key characteristics of secondary data:
- Non-reactive: Secondary data are non-reactive, meaning that they are not collected for the specific purpose of the research study. This means that the researcher has no control over the data collection process, and cannot influence how the data were collected.
- Time-saving: Secondary data are pre-existing, meaning that they have already been collected and organized by someone else. This can save the researcher time and resources, as they do not need to collect the data themselves.
- Wide-ranging : Secondary data sources can provide a wide range of information on a variety of topics. This can be useful for researchers who are exploring a new research area or seeking to compare and contrast research findings.
- Less expensive: Secondary data are generally less expensive than primary data, as they do not require the researcher to incur the costs associated with data collection.
- Potential for bias : Secondary data may be subject to biases that were present in the original data collection process. For example, data may have been collected using a biased sampling method or the data may be incomplete or inaccurate.
- Lack of control: The researcher has no control over the data collection process and cannot ensure that the data were collected using appropriate methods or measures.
- Requires careful evaluation : Secondary data sources must be evaluated carefully to ensure that they are appropriate for the research question and analysis. This includes assessing the quality, reliability, and validity of the data sources.
Advantages of Secondary Data
There are several advantages to using secondary data in research, including:
- Time-saving : Collecting primary data can be time-consuming and expensive. Secondary data can be accessed quickly and easily, which can save researchers time and resources.
- Cost-effective: Secondary data are generally less expensive than primary data, as they do not require the researcher to incur the costs associated with data collection.
- Large sample size : Secondary data sources often have larger sample sizes than primary data sources, which can increase the statistical power of the research.
- Access to historical data : Secondary data sources can provide access to historical data, which can be useful for researchers who are studying trends over time.
- No ethical concerns: Secondary data are already in existence, so there are no ethical concerns related to collecting data from human subjects.
- May be more objective : Secondary data may be more objective than primary data, as the data were not collected for the specific purpose of the research study.
Limitations of Secondary Data
While there are many advantages to using secondary data in research, there are also some limitations that should be considered. Some of the main limitations of secondary data include:
- Lack of control over data quality : Researchers do not have control over the data collection process, which means they cannot ensure the accuracy or completeness of the data.
- Limited availability: Secondary data may not be available for the specific research question or study design.
- Lack of information on sampling and data collection methods: Researchers may not have access to information on the sampling and data collection methods used to gather the secondary data. This can make it difficult to evaluate the quality of the data.
- Data may not be up-to-date: Secondary data may not be up-to-date or relevant to the current research question.
- Data may be incomplete or inaccurate : Secondary data may be incomplete or inaccurate due to missing or incorrect data points, data entry errors, or other factors.
- Biases in data collection: The data may have been collected using biased sampling or data collection methods, which can limit the validity of the data.
- Lack of control over variables: Researchers have limited control over the variables that were measured in the original data collection process, which can limit the ability to draw conclusions about causality.
About the author

Muhammad Hassan
Researcher, Academic Writer, Web developer
You may also like

Primary Data – Types, Methods and Examples

Information in Research – Types and Examples

Research Data – Types Methods and Examples

Qualitative Data – Types, Methods and Examples

Quantitative Data – Types, Methods and Examples
Root out friction in every digital experience, super-charge conversion rates, and optimize digital self-service
Uncover insights from any interaction, deliver AI-powered agent coaching, and reduce cost to serve
Increase revenue and loyalty with real-time insights and recommendations delivered to teams on the ground
Know how your people feel and empower managers to improve employee engagement, productivity, and retention
Take action in the moments that matter most along the employee journey and drive bottom line growth
Whatever they’re are saying, wherever they’re saying it, know exactly what’s going on with your people
Get faster, richer insights with qual and quant tools that make powerful market research available to everyone
Run concept tests, pricing studies, prototyping + more with fast, powerful studies designed by UX research experts
Track your brand performance 24/7 and act quickly to respond to opportunities and challenges in your market
Explore the platform powering Experience Management
- Free Account
- For Digital
- For Customer Care
- For Human Resources
- For Researchers
- Financial Services
- All Industries
Popular Use Cases
- Customer Experience
- Employee Experience
- Net Promoter Score
- Voice of Customer
- Customer Success Hub
- Product Documentation
- Training & Certification
- XM Institute
- Popular Resources
- Customer Stories
- Artificial Intelligence
Market Research
- Partnerships
- Marketplace
The annual gathering of the experience leaders at the world’s iconic brands building breakthrough business results, live in Salt Lake City.
- English/AU & NZ
- Español/Europa
- Español/América Latina
- Português Brasileiro
- REQUEST DEMO
- Experience Management
- Secondary Research
Try Qualtrics for free
Secondary research: definition, methods, & examples.
19 min read This ultimate guide to secondary research helps you understand changes in market trends, customers buying patterns and your competition using existing data sources.
In situations where you’re not involved in the data gathering process ( primary research ), you have to rely on existing information and data to arrive at specific research conclusions or outcomes. This approach is known as secondary research.
In this article, we’re going to explain what secondary research is, how it works, and share some examples of it in practice.
Free eBook: The ultimate guide to conducting market research
What is secondary research?
Secondary research, also known as desk research, is a research method that involves compiling existing data sourced from a variety of channels . This includes internal sources (e.g.in-house research) or, more commonly, external sources (such as government statistics, organizational bodies, and the internet).
Secondary research comes in several formats, such as published datasets, reports, and survey responses , and can also be sourced from websites, libraries, and museums.
The information is usually free — or available at a limited access cost — and gathered using surveys , telephone interviews, observation, face-to-face interviews, and more.
When using secondary research, researchers collect, verify, analyze and incorporate it to help them confirm research goals for the research period.
As well as the above, it can be used to review previous research into an area of interest. Researchers can look for patterns across data spanning several years and identify trends — or use it to verify early hypothesis statements and establish whether it’s worth continuing research into a prospective area.
How to conduct secondary research
There are five key steps to conducting secondary research effectively and efficiently:
1. Identify and define the research topic
First, understand what you will be researching and define the topic by thinking about the research questions you want to be answered.
Ask yourself: What is the point of conducting this research? Then, ask: What do we want to achieve?
This may indicate an exploratory reason (why something happened) or confirm a hypothesis. The answers may indicate ideas that need primary or secondary research (or a combination) to investigate them.
2. Find research and existing data sources
If secondary research is needed, think about where you might find the information. This helps you narrow down your secondary sources to those that help you answer your questions. What keywords do you need to use?
Which organizations are closely working on this topic already? Are there any competitors that you need to be aware of?
Create a list of the data sources, information, and people that could help you with your work.
3. Begin searching and collecting the existing data
Now that you have the list of data sources, start accessing the data and collect the information into an organized system. This may mean you start setting up research journal accounts or making telephone calls to book meetings with third-party research teams to verify the details around data results.
As you search and access information, remember to check the data’s date, the credibility of the source, the relevance of the material to your research topic, and the methodology used by the third-party researchers. Start small and as you gain results, investigate further in the areas that help your research’s aims.
4. Combine the data and compare the results
When you have your data in one place, you need to understand, filter, order, and combine it intelligently. Data may come in different formats where some data could be unusable, while other information may need to be deleted.
After this, you can start to look at different data sets to see what they tell you. You may find that you need to compare the same datasets over different periods for changes over time or compare different datasets to notice overlaps or trends. Ask yourself: What does this data mean to my research? Does it help or hinder my research?
5. Analyze your data and explore further
In this last stage of the process, look at the information you have and ask yourself if this answers your original questions for your research. Are there any gaps? Do you understand the information you’ve found? If you feel there is more to cover, repeat the steps and delve deeper into the topic so that you can get all the information you need.
If secondary research can’t provide these answers, consider supplementing your results with data gained from primary research. As you explore further, add to your knowledge and update your findings. This will help you present clear, credible information.
Primary vs secondary research
Unlike secondary research, primary research involves creating data first-hand by directly working with interviewees, target users, or a target market. Primary research focuses on the method for carrying out research, asking questions, and collecting data using approaches such as:
- Interviews (panel, face-to-face or over the phone)
- Questionnaires or surveys
- Focus groups
Using these methods, researchers can get in-depth, targeted responses to questions, making results more accurate and specific to their research goals. However, it does take time to do and administer.
Unlike primary research, secondary research uses existing data, which also includes published results from primary research. Researchers summarize the existing research and use the results to support their research goals.
Both primary and secondary research have their places. Primary research can support the findings found through secondary research (and fill knowledge gaps), while secondary research can be a starting point for further primary research. Because of this, these research methods are often combined for optimal research results that are accurate at both the micro and macro level.
Sources of Secondary Research
There are two types of secondary research sources: internal and external. Internal data refers to in-house data that can be gathered from the researcher’s organization. External data refers to data published outside of and not owned by the researcher’s organization.
Internal data
Internal data is a good first port of call for insights and knowledge, as you may already have relevant information stored in your systems. Because you own this information — and it won’t be available to other researchers — it can give you a competitive edge . Examples of internal data include:
- Database information on sales history and business goal conversions
- Information from website applications and mobile site data
- Customer-generated data on product and service efficiency and use
- Previous research results or supplemental research areas
- Previous campaign results
External data
External data is useful when you: 1) need information on a new topic, 2) want to fill in gaps in your knowledge, or 3) want data that breaks down a population or market for trend and pattern analysis. Examples of external data include:
- Government, non-government agencies, and trade body statistics
- Company reports and research
- Competitor research
- Public library collections
- Textbooks and research journals
- Media stories in newspapers
- Online journals and research sites
Three examples of secondary research methods in action
How and why might you conduct secondary research? Let’s look at a few examples:
1. Collecting factual information from the internet on a specific topic or market
There are plenty of sites that hold data for people to view and use in their research. For example, Google Scholar, ResearchGate, or Wiley Online Library all provide previous research on a particular topic. Researchers can create free accounts and use the search facilities to look into a topic by keyword, before following the instructions to download or export results for further analysis.
This can be useful for exploring a new market that your organization wants to consider entering. For instance, by viewing the U.S Census Bureau demographic data for that area, you can see what the demographics of your target audience are , and create compelling marketing campaigns accordingly.
2. Finding out the views of your target audience on a particular topic
If you’re interested in seeing the historical views on a particular topic, for example, attitudes to women’s rights in the US, you can turn to secondary sources.
Textbooks, news articles, reviews, and journal entries can all provide qualitative reports and interviews covering how people discussed women’s rights. There may be multimedia elements like video or documented posters of propaganda showing biased language usage.
By gathering this information, synthesizing it, and evaluating the language, who created it and when it was shared, you can create a timeline of how a topic was discussed over time.
3. When you want to know the latest thinking on a topic
Educational institutions, such as schools and colleges, create a lot of research-based reports on younger audiences or their academic specialisms. Dissertations from students also can be submitted to research journals, making these places useful places to see the latest insights from a new generation of academics.
Information can be requested — and sometimes academic institutions may want to collaborate and conduct research on your behalf. This can provide key primary data in areas that you want to research, as well as secondary data sources for your research.
Advantages of secondary research
There are several benefits of using secondary research, which we’ve outlined below:
- Easily and readily available data – There is an abundance of readily accessible data sources that have been pre-collected for use, in person at local libraries and online using the internet. This data is usually sorted by filters or can be exported into spreadsheet format, meaning that little technical expertise is needed to access and use the data.
- Faster research speeds – Since the data is already published and in the public arena, you don’t need to collect this information through primary research. This can make the research easier to do and faster, as you can get started with the data quickly.
- Low financial and time costs – Most secondary data sources can be accessed for free or at a small cost to the researcher, so the overall research costs are kept low. In addition, by saving on preliminary research, the time costs for the researcher are kept down as well.
- Secondary data can drive additional research actions – The insights gained can support future research activities (like conducting a follow-up survey or specifying future detailed research topics) or help add value to these activities.
- Secondary data can be useful pre-research insights – Secondary source data can provide pre-research insights and information on effects that can help resolve whether research should be conducted. It can also help highlight knowledge gaps, so subsequent research can consider this.
- Ability to scale up results – Secondary sources can include large datasets (like Census data results across several states) so research results can be scaled up quickly using large secondary data sources.
Disadvantages of secondary research
The disadvantages of secondary research are worth considering in advance of conducting research :
- Secondary research data can be out of date – Secondary sources can be updated regularly, but if you’re exploring the data between two updates, the data can be out of date. Researchers will need to consider whether the data available provides the right research coverage dates, so that insights are accurate and timely, or if the data needs to be updated. Also, fast-moving markets may find secondary data expires very quickly.
- Secondary research needs to be verified and interpreted – Where there’s a lot of data from one source, a researcher needs to review and analyze it. The data may need to be verified against other data sets or your hypotheses for accuracy and to ensure you’re using the right data for your research.
- The researcher has had no control over the secondary research – As the researcher has not been involved in the secondary research, invalid data can affect the results. It’s therefore vital that the methodology and controls are closely reviewed so that the data is collected in a systematic and error-free way.
- Secondary research data is not exclusive – As data sets are commonly available, there is no exclusivity and many researchers can use the same data. This can be problematic where researchers want to have exclusive rights over the research results and risk duplication of research in the future.
When do we conduct secondary research?
Now that you know the basics of secondary research, when do researchers normally conduct secondary research?
It’s often used at the beginning of research, when the researcher is trying to understand the current landscape . In addition, if the research area is new to the researcher, it can form crucial background context to help them understand what information exists already. This can plug knowledge gaps, supplement the researcher’s own learning or add to the research.
Secondary research can also be used in conjunction with primary research. Secondary research can become the formative research that helps pinpoint where further primary research is needed to find out specific information. It can also support or verify the findings from primary research.
You can use secondary research where high levels of control aren’t needed by the researcher, but a lot of knowledge on a topic is required from different angles.
Secondary research should not be used in place of primary research as both are very different and are used for various circumstances.
Questions to ask before conducting secondary research
Before you start your secondary research, ask yourself these questions:
- Is there similar internal data that we have created for a similar area in the past?
If your organization has past research, it’s best to review this work before starting a new project. The older work may provide you with the answers, and give you a starting dataset and context of how your organization approached the research before. However, be mindful that the work is probably out of date and view it with that note in mind. Read through and look for where this helps your research goals or where more work is needed.
- What am I trying to achieve with this research?
When you have clear goals, and understand what you need to achieve, you can look for the perfect type of secondary or primary research to support the aims. Different secondary research data will provide you with different information – for example, looking at news stories to tell you a breakdown of your market’s buying patterns won’t be as useful as internal or external data e-commerce and sales data sources.
- How credible will my research be?
If you are looking for credibility, you want to consider how accurate the research results will need to be, and if you can sacrifice credibility for speed by using secondary sources to get you started. Bear in mind which sources you choose — low-credibility data sites, like political party websites that are highly biased to favor their own party, would skew your results.
- What is the date of the secondary research?
When you’re looking to conduct research, you want the results to be as useful as possible , so using data that is 10 years old won’t be as accurate as using data that was created a year ago. Since a lot can change in a few years, note the date of your research and look for earlier data sets that can tell you a more recent picture of results. One caveat to this is using data collected over a long-term period for comparisons with earlier periods, which can tell you about the rate and direction of change.
- Can the data sources be verified? Does the information you have check out?
If you can’t verify the data by looking at the research methodology, speaking to the original team or cross-checking the facts with other research, it could be hard to be sure that the data is accurate. Think about whether you can use another source, or if it’s worth doing some supplementary primary research to replicate and verify results to help with this issue.
We created a front-to-back guide on conducting market research, The ultimate guide to conducting market research , so you can understand the research journey with confidence.
In it, you’ll learn more about:
- What effective market research looks like
- The use cases for market research
- The most important steps to conducting market research
- And how to take action on your research findings
Download the free guide for a clearer view on secondary research and other key research types for your business.
Related resources
Market intelligence 10 min read, marketing insights 11 min read, ethnographic research 11 min read, qualitative vs quantitative research 13 min read, qualitative research questions 11 min read, qualitative research design 12 min read, primary vs secondary research 14 min read, request demo.
Ready to learn more about Qualtrics?
- Skip to main content
- Skip to primary sidebar
- Skip to footer
- QuestionPro

- Solutions Industries Gaming Automotive Sports and events Education Government Travel & Hospitality Financial Services Healthcare Cannabis Technology Use Case NPS+ Communities Audience Contactless surveys Mobile LivePolls Member Experience GDPR Positive People Science 360 Feedback Surveys
- Resources Blog eBooks Survey Templates Case Studies Training Help center
Home Market Research
Secondary Research: Definition, Methods and Examples.

In the world of research, there are two main types of data sources: primary and secondary. While primary research involves collecting new data directly from individuals or sources, secondary research involves analyzing existing data already collected by someone else. Today we’ll discuss secondary research.
One common source of this research is published research reports and other documents. These materials can often be found in public libraries, on websites, or even as data extracted from previously conducted surveys. In addition, many government and non-government agencies maintain extensive data repositories that can be accessed for research purposes.
LEARN ABOUT: Research Process Steps
While secondary research may not offer the same level of control as primary research, it can be a highly valuable tool for gaining insights and identifying trends. Researchers can save time and resources by leveraging existing data sources while still uncovering important information.
What is Secondary Research: Definition
Secondary research is a research method that involves using already existing data. Existing data is summarized and collated to increase the overall effectiveness of the research.
One of the key advantages of secondary research is that it allows us to gain insights and draw conclusions without having to collect new data ourselves. This can save time and resources and also allow us to build upon existing knowledge and expertise.
When conducting secondary research, it’s important to be thorough and thoughtful in our approach. This means carefully selecting the sources and ensuring that the data we’re analyzing is reliable and relevant to the research question . It also means being critical and analytical in the analysis and recognizing any potential biases or limitations in the data.
LEARN ABOUT: Level of Analysis
Secondary research is much more cost-effective than primary research , as it uses already existing data, unlike primary research, where data is collected firsthand by organizations or businesses or they can employ a third party to collect data on their behalf.
LEARN ABOUT: Data Analytics Projects
Secondary Research Methods with Examples
Secondary research is cost-effective, one of the reasons it is a popular choice among many businesses and organizations. Not every organization is able to pay a huge sum of money to conduct research and gather data. So, rightly secondary research is also termed “ desk research ”, as data can be retrieved from sitting behind a desk.
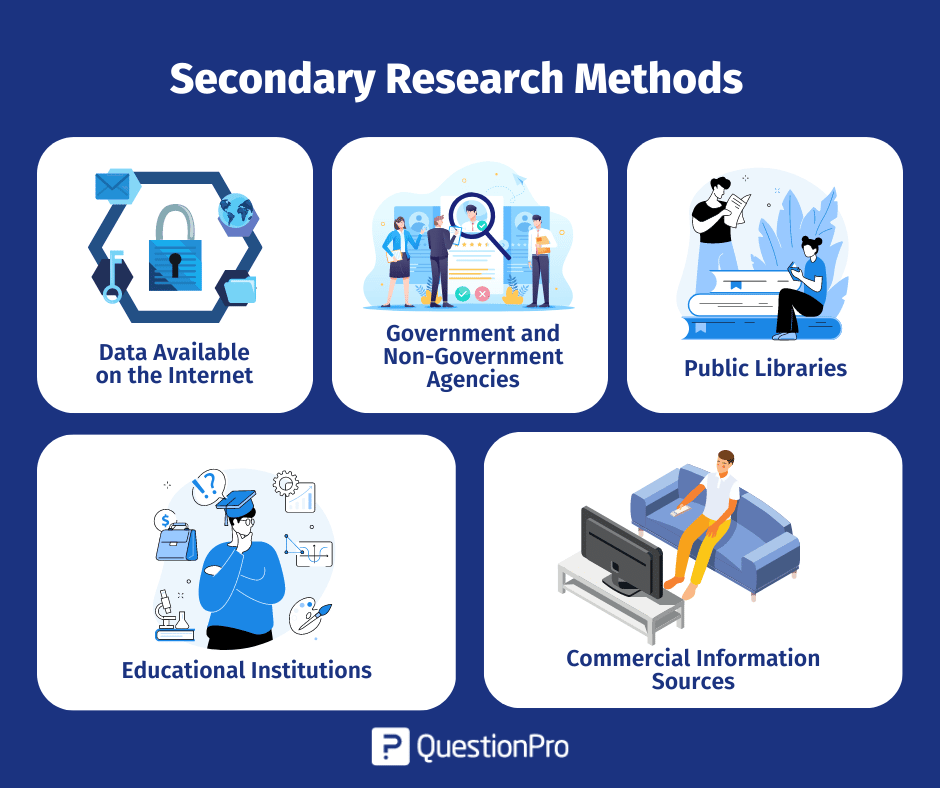
The following are popularly used secondary research methods and examples:
1. Data Available on The Internet
One of the most popular ways to collect secondary data is the internet. Data is readily available on the internet and can be downloaded at the click of a button.
This data is practically free of cost, or one may have to pay a negligible amount to download the already existing data. Websites have a lot of information that businesses or organizations can use to suit their research needs. However, organizations need to consider only authentic and trusted website to collect information.
2. Government and Non-Government Agencies
Data for secondary research can also be collected from some government and non-government agencies. For example, US Government Printing Office, US Census Bureau, and Small Business Development Centers have valuable and relevant data that businesses or organizations can use.
There is a certain cost applicable to download or use data available with these agencies. Data obtained from these agencies are authentic and trustworthy.
3. Public Libraries
Public libraries are another good source to search for data for this research. Public libraries have copies of important research that were conducted earlier. They are a storehouse of important information and documents from which information can be extracted.
The services provided in these public libraries vary from one library to another. More often, libraries have a huge collection of government publications with market statistics, large collection of business directories and newsletters.
4. Educational Institutions
Importance of collecting data from educational institutions for secondary research is often overlooked. However, more research is conducted in colleges and universities than any other business sector.
The data that is collected by universities is mainly for primary research. However, businesses or organizations can approach educational institutions and request for data from them.
5. Commercial Information Sources
Local newspapers, journals, magazines, radio and TV stations are a great source to obtain data for secondary research. These commercial information sources have first-hand information on economic developments, political agenda, market research, demographic segmentation and similar subjects.
Businesses or organizations can request to obtain data that is most relevant to their study. Businesses not only have the opportunity to identify their prospective clients but can also know about the avenues to promote their products or services through these sources as they have a wider reach.
Key Differences between Primary Research and Secondary Research
Understanding the distinction between primary research and secondary research is essential in determining which research method is best for your project. These are the two main types of research methods, each with advantages and disadvantages. In this section, we will explore the critical differences between the two and when it is appropriate to use them.
How to Conduct Secondary Research?
We have already learned about the differences between primary and secondary research. Now, let’s take a closer look at how to conduct it.
Secondary research is an important tool for gathering information already collected and analyzed by others. It can help us save time and money and allow us to gain insights into the subject we are researching. So, in this section, we will discuss some common methods and tips for conducting it effectively.
Here are the steps involved in conducting secondary research:
1. Identify the topic of research: Before beginning secondary research, identify the topic that needs research. Once that’s done, list down the research attributes and its purpose.
2. Identify research sources: Next, narrow down on the information sources that will provide most relevant data and information applicable to your research.
3. Collect existing data: Once the data collection sources are narrowed down, check for any previous data that is available which is closely related to the topic. Data related to research can be obtained from various sources like newspapers, public libraries, government and non-government agencies etc.
4. Combine and compare: Once data is collected, combine and compare the data for any duplication and assemble data into a usable format. Make sure to collect data from authentic sources. Incorrect data can hamper research severely.
4. Analyze data: Analyze collected data and identify if all questions are answered. If not, repeat the process if there is a need to dwell further into actionable insights.
Advantages of Secondary Research
Secondary research offers a number of advantages to researchers, including efficiency, the ability to build upon existing knowledge, and the ability to conduct research in situations where primary research may not be possible or ethical. By carefully selecting their sources and being thoughtful in their approach, researchers can leverage secondary research to drive impact and advance the field. Some key advantages are the following:
1. Most information in this research is readily available. There are many sources from which relevant data can be collected and used, unlike primary research, where data needs to collect from scratch.
2. This is a less expensive and less time-consuming process as data required is easily available and doesn’t cost much if extracted from authentic sources. A minimum expenditure is associated to obtain data.
3. The data that is collected through secondary research gives organizations or businesses an idea about the effectiveness of primary research. Hence, organizations or businesses can form a hypothesis and evaluate cost of conducting primary research.
4. Secondary research is quicker to conduct because of the availability of data. It can be completed within a few weeks depending on the objective of businesses or scale of data needed.
As we can see, this research is the process of analyzing data already collected by someone else, and it can offer a number of benefits to researchers.
Disadvantages of Secondary Research
On the other hand, we have some disadvantages that come with doing secondary research. Some of the most notorious are the following:
1. Although data is readily available, credibility evaluation must be performed to understand the authenticity of the information available.
2. Not all secondary data resources offer the latest reports and statistics. Even when the data is accurate, it may not be updated enough to accommodate recent timelines.
3. Secondary research derives its conclusion from collective primary research data. The success of your research will depend, to a greater extent, on the quality of research already conducted by primary research.
LEARN ABOUT: 12 Best Tools for Researchers
In conclusion, secondary research is an important tool for researchers exploring various topics. By leveraging existing data sources, researchers can save time and resources, build upon existing knowledge, and conduct research in situations where primary research may not be feasible.
There are a variety of methods and examples of secondary research, from analyzing public data sets to reviewing previously published research papers. As students and aspiring researchers, it’s important to understand the benefits and limitations of this research and to approach it thoughtfully and critically. By doing so, we can continue to advance our understanding of the world around us and contribute to meaningful research that positively impacts society.
QuestionPro can be a useful tool for conducting secondary research in a variety of ways. You can create online surveys that target a specific population, collecting data that can be analyzed to gain insights into consumer behavior, attitudes, and preferences; analyze existing data sets that you have obtained through other means or benchmark your organization against others in your industry or against industry standards. The software provides a range of benchmarking tools that can help you compare your performance on key metrics, such as customer satisfaction, with that of your peers.
Using QuestionPro thoughtfully and strategically allows you to gain valuable insights to inform decision-making and drive business success. Start today for free! No credit card is required.
LEARN MORE FREE TRIAL
MORE LIKE THIS

How Can I Help You? — Tuesday CX Thoughts
Jun 5, 2024

Why Multilingual 360 Feedback Surveys Provide Better Insights
Jun 3, 2024

Raked Weighting: A Key Tool for Accurate Survey Results
May 31, 2024

Top 8 Data Trends to Understand the Future of Data
May 30, 2024
Other categories
- Academic Research
- Artificial Intelligence
- Assessments
- Brand Awareness
- Case Studies
- Communities
- Consumer Insights
- Customer effort score
- Customer Engagement
- Customer Experience
- Customer Loyalty
- Customer Research
- Customer Satisfaction
- Employee Benefits
- Employee Engagement
- Employee Retention
- Friday Five
- General Data Protection Regulation
- Insights Hub
- Life@QuestionPro
- Market Research
- Mobile diaries
- Mobile Surveys
- New Features
- Online Communities
- Question Types
- Questionnaire
- QuestionPro Products
- Release Notes
- Research Tools and Apps
- Revenue at Risk
- Survey Templates
- Training Tips
- Uncategorized
- Video Learning Series
- What’s Coming Up
- Workforce Intelligence
- Search Menu
- Sign in through your institution
- Browse content in Arts and Humanities
- Browse content in Archaeology
- Anglo-Saxon and Medieval Archaeology
- Archaeological Methodology and Techniques
- Archaeology by Region
- Archaeology of Religion
- Archaeology of Trade and Exchange
- Biblical Archaeology
- Contemporary and Public Archaeology
- Environmental Archaeology
- Historical Archaeology
- History and Theory of Archaeology
- Industrial Archaeology
- Landscape Archaeology
- Mortuary Archaeology
- Prehistoric Archaeology
- Underwater Archaeology
- Zooarchaeology
- Browse content in Architecture
- Architectural Structure and Design
- History of Architecture
- Residential and Domestic Buildings
- Theory of Architecture
- Browse content in Art
- Art Subjects and Themes
- History of Art
- Industrial and Commercial Art
- Theory of Art
- Biographical Studies
- Byzantine Studies
- Browse content in Classical Studies
- Classical History
- Classical Philosophy
- Classical Mythology
- Classical Literature
- Classical Reception
- Classical Art and Architecture
- Classical Oratory and Rhetoric
- Greek and Roman Epigraphy
- Greek and Roman Law
- Greek and Roman Archaeology
- Greek and Roman Papyrology
- Late Antiquity
- Religion in the Ancient World
- Digital Humanities
- Browse content in History
- Colonialism and Imperialism
- Diplomatic History
- Environmental History
- Genealogy, Heraldry, Names, and Honours
- Genocide and Ethnic Cleansing
- Historical Geography
- History by Period
- History of Agriculture
- History of Education
- History of Emotions
- History of Gender and Sexuality
- Industrial History
- Intellectual History
- International History
- Labour History
- Legal and Constitutional History
- Local and Family History
- Maritime History
- Military History
- National Liberation and Post-Colonialism
- Oral History
- Political History
- Public History
- Regional and National History
- Revolutions and Rebellions
- Slavery and Abolition of Slavery
- Social and Cultural History
- Theory, Methods, and Historiography
- Urban History
- World History
- Browse content in Language Teaching and Learning
- Language Learning (Specific Skills)
- Language Teaching Theory and Methods
- Browse content in Linguistics
- Applied Linguistics
- Cognitive Linguistics
- Computational Linguistics
- Forensic Linguistics
- Grammar, Syntax and Morphology
- Historical and Diachronic Linguistics
- History of English
- Language Acquisition
- Language Variation
- Language Families
- Language Evolution
- Language Reference
- Lexicography
- Linguistic Theories
- Linguistic Typology
- Linguistic Anthropology
- Phonetics and Phonology
- Psycholinguistics
- Sociolinguistics
- Translation and Interpretation
- Writing Systems
- Browse content in Literature
- Bibliography
- Children's Literature Studies
- Literary Studies (Asian)
- Literary Studies (European)
- Literary Studies (Eco-criticism)
- Literary Studies (Modernism)
- Literary Studies (Romanticism)
- Literary Studies (American)
- Literary Studies - World
- Literary Studies (1500 to 1800)
- Literary Studies (19th Century)
- Literary Studies (20th Century onwards)
- Literary Studies (African American Literature)
- Literary Studies (British and Irish)
- Literary Studies (Early and Medieval)
- Literary Studies (Fiction, Novelists, and Prose Writers)
- Literary Studies (Gender Studies)
- Literary Studies (Graphic Novels)
- Literary Studies (History of the Book)
- Literary Studies (Plays and Playwrights)
- Literary Studies (Poetry and Poets)
- Literary Studies (Postcolonial Literature)
- Literary Studies (Queer Studies)
- Literary Studies (Science Fiction)
- Literary Studies (Travel Literature)
- Literary Studies (War Literature)
- Literary Studies (Women's Writing)
- Literary Theory and Cultural Studies
- Mythology and Folklore
- Shakespeare Studies and Criticism
- Browse content in Media Studies
- Browse content in Music
- Applied Music
- Dance and Music
- Ethics in Music
- Ethnomusicology
- Gender and Sexuality in Music
- Medicine and Music
- Music Cultures
- Music and Religion
- Music and Culture
- Music and Media
- Music Education and Pedagogy
- Music Theory and Analysis
- Musical Scores, Lyrics, and Libretti
- Musical Structures, Styles, and Techniques
- Musicology and Music History
- Performance Practice and Studies
- Race and Ethnicity in Music
- Sound Studies
- Browse content in Performing Arts
- Browse content in Philosophy
- Aesthetics and Philosophy of Art
- Epistemology
- Feminist Philosophy
- History of Western Philosophy
- Metaphysics
- Moral Philosophy
- Non-Western Philosophy
- Philosophy of Science
- Philosophy of Action
- Philosophy of Law
- Philosophy of Religion
- Philosophy of Language
- Philosophy of Mind
- Philosophy of Perception
- Philosophy of Mathematics and Logic
- Practical Ethics
- Social and Political Philosophy
- Browse content in Religion
- Biblical Studies
- Christianity
- East Asian Religions
- History of Religion
- Judaism and Jewish Studies
- Qumran Studies
- Religion and Education
- Religion and Health
- Religion and Politics
- Religion and Science
- Religion and Law
- Religion and Art, Literature, and Music
- Religious Studies
- Browse content in Society and Culture
- Cookery, Food, and Drink
- Cultural Studies
- Customs and Traditions
- Ethical Issues and Debates
- Hobbies, Games, Arts and Crafts
- Natural world, Country Life, and Pets
- Popular Beliefs and Controversial Knowledge
- Sports and Outdoor Recreation
- Technology and Society
- Travel and Holiday
- Visual Culture
- Browse content in Law
- Arbitration
- Browse content in Company and Commercial Law
- Commercial Law
- Company Law
- Browse content in Comparative Law
- Systems of Law
- Competition Law
- Browse content in Constitutional and Administrative Law
- Government Powers
- Judicial Review
- Local Government Law
- Military and Defence Law
- Parliamentary and Legislative Practice
- Construction Law
- Contract Law
- Browse content in Criminal Law
- Criminal Procedure
- Criminal Evidence Law
- Sentencing and Punishment
- Employment and Labour Law
- Environment and Energy Law
- Browse content in Financial Law
- Banking Law
- Insolvency Law
- History of Law
- Human Rights and Immigration
- Intellectual Property Law
- Browse content in International Law
- Private International Law and Conflict of Laws
- Public International Law
- IT and Communications Law
- Jurisprudence and Philosophy of Law
- Law and Politics
- Law and Society
- Browse content in Legal System and Practice
- Courts and Procedure
- Legal Skills and Practice
- Primary Sources of Law
- Regulation of Legal Profession
- Medical and Healthcare Law
- Browse content in Policing
- Criminal Investigation and Detection
- Police and Security Services
- Police Procedure and Law
- Police Regional Planning
- Browse content in Property Law
- Personal Property Law
- Study and Revision
- Terrorism and National Security Law
- Browse content in Trusts Law
- Wills and Probate or Succession
- Browse content in Medicine and Health
- Browse content in Allied Health Professions
- Arts Therapies
- Clinical Science
- Dietetics and Nutrition
- Occupational Therapy
- Operating Department Practice
- Physiotherapy
- Radiography
- Speech and Language Therapy
- Browse content in Anaesthetics
- General Anaesthesia
- Neuroanaesthesia
- Browse content in Clinical Medicine
- Acute Medicine
- Cardiovascular Medicine
- Clinical Genetics
- Clinical Pharmacology and Therapeutics
- Dermatology
- Endocrinology and Diabetes
- Gastroenterology
- Genito-urinary Medicine
- Geriatric Medicine
- Infectious Diseases
- Medical Oncology
- Medical Toxicology
- Pain Medicine
- Palliative Medicine
- Rehabilitation Medicine
- Respiratory Medicine and Pulmonology
- Rheumatology
- Sleep Medicine
- Sports and Exercise Medicine
- Clinical Neuroscience
- Community Medical Services
- Critical Care
- Emergency Medicine
- Forensic Medicine
- Haematology
- History of Medicine
- Browse content in Medical Dentistry
- Oral and Maxillofacial Surgery
- Paediatric Dentistry
- Restorative Dentistry and Orthodontics
- Surgical Dentistry
- Medical Ethics
- Browse content in Medical Skills
- Clinical Skills
- Communication Skills
- Nursing Skills
- Surgical Skills
- Medical Statistics and Methodology
- Browse content in Neurology
- Clinical Neurophysiology
- Neuropathology
- Nursing Studies
- Browse content in Obstetrics and Gynaecology
- Gynaecology
- Occupational Medicine
- Ophthalmology
- Otolaryngology (ENT)
- Browse content in Paediatrics
- Neonatology
- Browse content in Pathology
- Chemical Pathology
- Clinical Cytogenetics and Molecular Genetics
- Histopathology
- Medical Microbiology and Virology
- Patient Education and Information
- Browse content in Pharmacology
- Psychopharmacology
- Browse content in Popular Health
- Caring for Others
- Complementary and Alternative Medicine
- Self-help and Personal Development
- Browse content in Preclinical Medicine
- Cell Biology
- Molecular Biology and Genetics
- Reproduction, Growth and Development
- Primary Care
- Professional Development in Medicine
- Browse content in Psychiatry
- Addiction Medicine
- Child and Adolescent Psychiatry
- Forensic Psychiatry
- Learning Disabilities
- Old Age Psychiatry
- Psychotherapy
- Browse content in Public Health and Epidemiology
- Epidemiology
- Public Health
- Browse content in Radiology
- Clinical Radiology
- Interventional Radiology
- Nuclear Medicine
- Radiation Oncology
- Reproductive Medicine
- Browse content in Surgery
- Cardiothoracic Surgery
- Gastro-intestinal and Colorectal Surgery
- General Surgery
- Neurosurgery
- Paediatric Surgery
- Peri-operative Care
- Plastic and Reconstructive Surgery
- Surgical Oncology
- Transplant Surgery
- Trauma and Orthopaedic Surgery
- Vascular Surgery
- Browse content in Science and Mathematics
- Browse content in Biological Sciences
- Aquatic Biology
- Biochemistry
- Bioinformatics and Computational Biology
- Developmental Biology
- Ecology and Conservation
- Evolutionary Biology
- Genetics and Genomics
- Microbiology
- Molecular and Cell Biology
- Natural History
- Plant Sciences and Forestry
- Research Methods in Life Sciences
- Structural Biology
- Systems Biology
- Zoology and Animal Sciences
- Browse content in Chemistry
- Analytical Chemistry
- Computational Chemistry
- Crystallography
- Environmental Chemistry
- Industrial Chemistry
- Inorganic Chemistry
- Materials Chemistry
- Medicinal Chemistry
- Mineralogy and Gems
- Organic Chemistry
- Physical Chemistry
- Polymer Chemistry
- Study and Communication Skills in Chemistry
- Theoretical Chemistry
- Browse content in Computer Science
- Artificial Intelligence
- Computer Architecture and Logic Design
- Game Studies
- Human-Computer Interaction
- Mathematical Theory of Computation
- Programming Languages
- Software Engineering
- Systems Analysis and Design
- Virtual Reality
- Browse content in Computing
- Business Applications
- Computer Security
- Computer Games
- Computer Networking and Communications
- Digital Lifestyle
- Graphical and Digital Media Applications
- Operating Systems
- Browse content in Earth Sciences and Geography
- Atmospheric Sciences
- Environmental Geography
- Geology and the Lithosphere
- Maps and Map-making
- Meteorology and Climatology
- Oceanography and Hydrology
- Palaeontology
- Physical Geography and Topography
- Regional Geography
- Soil Science
- Urban Geography
- Browse content in Engineering and Technology
- Agriculture and Farming
- Biological Engineering
- Civil Engineering, Surveying, and Building
- Electronics and Communications Engineering
- Energy Technology
- Engineering (General)
- Environmental Science, Engineering, and Technology
- History of Engineering and Technology
- Mechanical Engineering and Materials
- Technology of Industrial Chemistry
- Transport Technology and Trades
- Browse content in Environmental Science
- Applied Ecology (Environmental Science)
- Conservation of the Environment (Environmental Science)
- Environmental Sustainability
- Environmentalist Thought and Ideology (Environmental Science)
- Management of Land and Natural Resources (Environmental Science)
- Natural Disasters (Environmental Science)
- Nuclear Issues (Environmental Science)
- Pollution and Threats to the Environment (Environmental Science)
- Social Impact of Environmental Issues (Environmental Science)
- History of Science and Technology
- Browse content in Materials Science
- Ceramics and Glasses
- Composite Materials
- Metals, Alloying, and Corrosion
- Nanotechnology
- Browse content in Mathematics
- Applied Mathematics
- Biomathematics and Statistics
- History of Mathematics
- Mathematical Education
- Mathematical Finance
- Mathematical Analysis
- Numerical and Computational Mathematics
- Probability and Statistics
- Pure Mathematics
- Browse content in Neuroscience
- Cognition and Behavioural Neuroscience
- Development of the Nervous System
- Disorders of the Nervous System
- History of Neuroscience
- Invertebrate Neurobiology
- Molecular and Cellular Systems
- Neuroendocrinology and Autonomic Nervous System
- Neuroscientific Techniques
- Sensory and Motor Systems
- Browse content in Physics
- Astronomy and Astrophysics
- Atomic, Molecular, and Optical Physics
- Biological and Medical Physics
- Classical Mechanics
- Computational Physics
- Condensed Matter Physics
- Electromagnetism, Optics, and Acoustics
- History of Physics
- Mathematical and Statistical Physics
- Measurement Science
- Nuclear Physics
- Particles and Fields
- Plasma Physics
- Quantum Physics
- Relativity and Gravitation
- Semiconductor and Mesoscopic Physics
- Browse content in Psychology
- Affective Sciences
- Clinical Psychology
- Cognitive Neuroscience
- Cognitive Psychology
- Criminal and Forensic Psychology
- Developmental Psychology
- Educational Psychology
- Evolutionary Psychology
- Health Psychology
- History and Systems in Psychology
- Music Psychology
- Neuropsychology
- Organizational Psychology
- Psychological Assessment and Testing
- Psychology of Human-Technology Interaction
- Psychology Professional Development and Training
- Research Methods in Psychology
- Social Psychology
- Browse content in Social Sciences
- Browse content in Anthropology
- Anthropology of Religion
- Human Evolution
- Medical Anthropology
- Physical Anthropology
- Regional Anthropology
- Social and Cultural Anthropology
- Theory and Practice of Anthropology
- Browse content in Business and Management
- Business Strategy
- Business History
- Business Ethics
- Business and Government
- Business and Technology
- Business and the Environment
- Comparative Management
- Corporate Governance
- Corporate Social Responsibility
- Entrepreneurship
- Health Management
- Human Resource Management
- Industrial and Employment Relations
- Industry Studies
- Information and Communication Technologies
- International Business
- Knowledge Management
- Management and Management Techniques
- Operations Management
- Organizational Theory and Behaviour
- Pensions and Pension Management
- Public and Nonprofit Management
- Strategic Management
- Supply Chain Management
- Browse content in Criminology and Criminal Justice
- Criminal Justice
- Criminology
- Forms of Crime
- International and Comparative Criminology
- Youth Violence and Juvenile Justice
- Development Studies
- Browse content in Economics
- Agricultural, Environmental, and Natural Resource Economics
- Asian Economics
- Behavioural Finance
- Behavioural Economics and Neuroeconomics
- Econometrics and Mathematical Economics
- Economic Systems
- Economic Methodology
- Economic History
- Economic Development and Growth
- Financial Markets
- Financial Institutions and Services
- General Economics and Teaching
- Health, Education, and Welfare
- History of Economic Thought
- International Economics
- Labour and Demographic Economics
- Law and Economics
- Macroeconomics and Monetary Economics
- Microeconomics
- Public Economics
- Urban, Rural, and Regional Economics
- Welfare Economics
- Browse content in Education
- Adult Education and Continuous Learning
- Care and Counselling of Students
- Early Childhood and Elementary Education
- Educational Equipment and Technology
- Educational Strategies and Policy
- Higher and Further Education
- Organization and Management of Education
- Philosophy and Theory of Education
- Schools Studies
- Secondary Education
- Teaching of a Specific Subject
- Teaching of Specific Groups and Special Educational Needs
- Teaching Skills and Techniques
- Browse content in Environment
- Applied Ecology (Social Science)
- Climate Change
- Conservation of the Environment (Social Science)
- Environmentalist Thought and Ideology (Social Science)
- Natural Disasters (Environment)
- Social Impact of Environmental Issues (Social Science)
- Browse content in Human Geography
- Cultural Geography
- Economic Geography
- Political Geography
- Browse content in Interdisciplinary Studies
- Communication Studies
- Museums, Libraries, and Information Sciences
- Browse content in Politics
- African Politics
- Asian Politics
- Chinese Politics
- Comparative Politics
- Conflict Politics
- Elections and Electoral Studies
- Environmental Politics
- Ethnic Politics
- European Union
- Foreign Policy
- Gender and Politics
- Human Rights and Politics
- Indian Politics
- International Relations
- International Organization (Politics)
- International Political Economy
- Irish Politics
- Latin American Politics
- Middle Eastern Politics
- Political Methodology
- Political Communication
- Political Philosophy
- Political Sociology
- Political Theory
- Political Behaviour
- Political Economy
- Political Institutions
- Politics and Law
- Politics of Development
- Public Administration
- Public Policy
- Quantitative Political Methodology
- Regional Political Studies
- Russian Politics
- Security Studies
- State and Local Government
- UK Politics
- US Politics
- Browse content in Regional and Area Studies
- African Studies
- Asian Studies
- East Asian Studies
- Japanese Studies
- Latin American Studies
- Middle Eastern Studies
- Native American Studies
- Scottish Studies
- Browse content in Research and Information
- Research Methods
- Browse content in Social Work
- Addictions and Substance Misuse
- Adoption and Fostering
- Care of the Elderly
- Child and Adolescent Social Work
- Couple and Family Social Work
- Direct Practice and Clinical Social Work
- Emergency Services
- Human Behaviour and the Social Environment
- International and Global Issues in Social Work
- Mental and Behavioural Health
- Social Justice and Human Rights
- Social Policy and Advocacy
- Social Work and Crime and Justice
- Social Work Macro Practice
- Social Work Practice Settings
- Social Work Research and Evidence-based Practice
- Welfare and Benefit Systems
- Browse content in Sociology
- Childhood Studies
- Community Development
- Comparative and Historical Sociology
- Economic Sociology
- Gender and Sexuality
- Gerontology and Ageing
- Health, Illness, and Medicine
- Marriage and the Family
- Migration Studies
- Occupations, Professions, and Work
- Organizations
- Population and Demography
- Race and Ethnicity
- Social Theory
- Social Movements and Social Change
- Social Research and Statistics
- Social Stratification, Inequality, and Mobility
- Sociology of Religion
- Sociology of Education
- Sport and Leisure
- Urban and Rural Studies
- Browse content in Warfare and Defence
- Defence Strategy, Planning, and Research
- Land Forces and Warfare
- Military Administration
- Military Life and Institutions
- Naval Forces and Warfare
- Other Warfare and Defence Issues
- Peace Studies and Conflict Resolution
- Weapons and Equipment

- < Previous chapter
- Next chapter >
28 Secondary Data Analysis
Department of Psychology, Michigan State University
Richard E. Lucas, Department of Psychology, Michigan State University, East Lansing, MI
- Published: 01 October 2013
- Cite Icon Cite
- Permissions Icon Permissions
Secondary data analysis refers to the analysis of existing data collected by others. Secondary analysis affords researchers the opportunity to investigate research questions using large-scale data sets that are often inclusive of under-represented groups, while saving time and resources. Despite the immense potential for secondary analysis as a tool for researchers in the social sciences, it is not widely used by psychologists and is sometimes met with sharp criticism among those who favor primary research. The goal of this chapter is to summarize the promises and pitfalls associated with secondary data analysis and to highlight the importance of archival resources for advancing psychological science. In addition to describing areas of convergence and divergence between primary and secondary data analysis, we outline basic steps for getting started and finding data sets. We also provide general guidance on issues related to measurement, handling missing data, and the use of survey weights.
The goal of research in the social science is to gain a better understanding of the world and how well theoretical predictions match empirical realities. Secondary data analysis contributes to these objectives through the application of “creative analytical techniques to data that have been amassed by others” ( Kiecolt & Nathan, 1985 , p. 10). Primary researchers design new studies to answer research questions, whereas the secondary data analyst uses existing resources. There is a deliberate coupling of research design and data analysis in primary research; however, the secondary data analyst rarely has had input into the design of the original studies in terms of the sampling strategy and measures selected for the investigation. For better or worse, the secondary data analyst simply has access to the final products of the data collection process in the form of a codebook or set of codebooks and a cleaned data set.
The analysis of existing data sets is routine in disciplines such as economics, political science, and sociology, but it is less well established in psychology ( but see Brooks-Gunn & Chase-Lansdale, 1991 ; Brooks-Gunn, Berlin, Leventhal, & Fuligini, 2000 ). Moreover, biases against secondary data analysis in favor of primary research may be present in psychology ( see McCall & Appelbaum, 1991 ). One possible explanation for this bias is that psychology has a rich and vibrant experimental tradition, and the training of many psychologists has likely emphasized this approach as the “gold standard” for addressing research questions and establishing causality ( see , e.g., Cronbach, 1957 ). As a result, the nonexperimental methods that are typically used in secondary analyses may be viewed by some as inferior. Psychological scientists trained in the experimental tradition may not fully appreciate the unique strengths that nonexperimental techniques have to offer and may underestimate the time, effort, and skills required for conducting secondary data analyses in a competent and professional manner. Finally, biases against secondary data analysis might stem from lingering concerns over the validity of the self-report methods that are typically used in secondary data analysis. These can include concerns about the possibility that placement of items in a survey can influence responses (e.g., differences in the average levels of reported marital and life satisfaction when questions occur back to back as opposed to having the questions separated in the survey; see Schwarz, 1999 ; Schwarz & Strack, 1999 ) and concerns with biased reporting of sensitive behaviors ( but see Akers, Massey, & Clarke, 1983 ).
Despite the initial reluctance to widely embrace secondary data analysis as a tool for psychological research, there are promising signs that the skepticism toward secondary analyses will diminish as psychology seeks to position itself as a hub science that plays a key role in interdisciplinary inquiry ( see Mroczek, Pitzer, Miller, Turiano, & Fingerman, 2011 ). Accordingly, there is a compelling argument for including secondary data analysis into the suite of methodological approaches used by psychologists ( see Trzesniewski, Donnellan, & Lucas, 2011 ).
The goal of this chapter is to summarize the promises and pitfalls associated with secondary data analysis and to highlight the importance of archival resources for advancing psychological science. We limit our discussion to analyses based on large-scale and often longitudinal national data sets such as the National Longitudinal Study of Adolescent Health (Add Health), the British Household Panel Study (BHPS), the German Socioeconomic Panel Study (GSOEP), and the National Institute of Child Health and Human Development (NICHD) Study of Early Child Care and Youth Development (SEC-CYD). However, much of our discussion applies to all secondary analyses. The perspective and specific recommendations found in this chapter draw on the edited volume by Trzesniewski et al. (2011 ). Following a general introduction to secondary data analysis, we will outline the necessary steps for getting started and finding data sets. Finally, we provide some general guidance on issues related to measurement, approaches to handling missing data, and survey weighting. Our treatment of these important topics is intended to draw attention to the relevant issues rather than to provide extensive coverage. Throughout, we take a practical approach to the issues and offer tips and guidance rooted in our experiences as data analysts and researchers with substantive interests in personality and life span developmental psychology.
Comparing Primary Research and Secondary Research
As noted in the opening section, it is possible that biases against secondary data analysis exist in the minds of some psychological scientists. To address these concerns, we have found it can be helpful to explicitly compare the processes of secondary analyses with primary research ( see also McCall & Appelbaum, 1991 ). An idealized and simplified list of steps is provided in Table 28.1 . As is evident from this table, both techniques start with a research question that is ideally rooted in existing theory and previous empirical results. The areas of biggest divergence between primary and secondary approaches occur after researchers have identified their questions (i.e., Steps 2 through 5 in Table 28.1 ). At this point, the primary researcher develops a set of procedures and then engages in pilot testing to refine procedures and methods, whereas the secondary analyst searches for data sets and evaluates codebooks. The primary researcher attempts to refine her or his procedures, whereas the secondary analyst determines whether a particular resource is appropriate for addressing the question at hand. In the next stages, the primary researcher collects new data, whereas the secondary data analyst constructs a working data set from a much larger data archive. At these stages, both types of researchers must grapple with the practical considerations imposed by real world constraints. There is no such thing as a perfect single study ( see Hunter & Schmidt, 2004 ), as all data sets are subject to limitations stemming from design and implementation. For example, the primary researcher may not have enough subjects to generate adequate levels of statistical power (because of a failure to take power calculations into account during the design phase, time or other resource constraints during the data collection phase, or because of problems with sample retention), whereas the secondary data analyst may have to cope with impoverished measurement of core constructs. Both sets of considerations will affect the ability of a given study to detect effects and provide unbiased estimates of effect sizes.
Table 28.1 also illustrates the fact that there are considerable areas of overlap between the two techniques. Researchers stemming from both traditions analyze data, interpret results, and write reports for dissemination to the wider scientific community. Both kinds of research require a significant investment of time and intellectual resources. Many skills required in conducting high-quality primary research are also required in conducting high-quality secondary data analysis including sound scientific judgment, attention to detail, and a firm grasp of statistical methodology.
Note: Steps modified and expanded from McCall and Appelbaum (1991 ).
We argue that both primary research and secondary data analysis have the potential to provide meaningful and scientifically valid research findings for psychology. Both approaches can generate new knowledge and are therefore reasonable ways of evaluating research questions. Blanket pronouncements that one approach is inherently superior to the other are usually difficult to justify. Many of the concerns about secondary data analysis are raised in the context of an unfair comparison—a contrast between the idealized conceptualization of primary research with the actual process of a secondary data analysis. Our point is that both approaches can be conducted in a thoughtful and rigorous manner, yet both approaches involve concessions to real-world constraints. Accordingly, we encourage all researchers and reviewers of papers to keep an open mind about the importance of both types of research.
Advantages and Disadvantages of Secondary Data Analysis
The foremost reason why psychologists should learn about secondary data analysis is that there are many existing data sets that can be used to answer interesting and important questions. Individuals who are unaware of these resources are likely to miss crucial opportunities to contribute new knowledge to the discipline and even risk reinventing the proverbial wheel by collecting new data. Regrettably, new data collection efforts may occur on a smaller scale than what is available in large national datasets. Researchers who are unaware of the potential treasure trove of variables in existing data sets risk unnecessarily duplicating considerable amounts of time and effort. At the very least, researchers may wish to familiarize themselves with publicly available data to truly address gaps in the literature when they undertake projects that involve new data collection.
The biggest advantage of secondary analyses is that the data have already been collected and are ready to be analyzed ( see Hofferth, 2005 ), thus conserving time and resources. Existing data sources are often of much larger and higher quality than could be feasibly collected by a single investigator. This advantage is especially pronounced when considering the investments of time and money necessary to collect longitudinal data. Some data sets were collected with scientific sampling plans (such as the GSOEP), which make it possible to generalize the findings to a specific population. Further, many publicly available data sets are quite large, and therefore provide adequate statistical power for conducting many analyses, including hypotheses about statistical interactions. Investigations of interactions often require a surprisingly high number of participants to achieve respectable levels of statistical power in the face of measurement error ( see Aiken & West, 1991 ). 1 Large-scale data sets are also well suited for subgroup analyses of populations that are often under-represented in smaller research studies.
Another advantage of secondary data analysis is that it forces researchers to adopt an open and transparent approach to their craft. Because data are publicly available, other investigators may attempt to replicate findings and specify alternative models for a given research question. This reality encourages transparency and detailed record keeping on the part of the researcher, including careful reporting of analysis and a reasoned justification for all analytic decisions. Freese (2007 ) has provided a useful discussion about policies for archiving material necessary for replicating results, and his treatment of the issues provides guidance to researchers interested in maintaining good records.
Despite the many advantages of secondary data analysis, it is not without its disadvantages. The most significant challenge is simply the flipside of the primary advantage—the data have already been collected by somebody else! Analysts must take advantage of what has been collected without input into design and measurement issues. In some cases, an existing data set may not be available to address the particular research questions of a given investigator without some limitations in terms of sampling, measurement, or other design feature. For example, data sets commonly used for secondary analysis often have a great deal of breadth in terms of the range of constructs assessed (e.g., finances, attitudes, personality, life satisfaction, physical health), but these constructs are often measured with a limited number of survey items. Issues of measurement reliability and validity are usually a major concern. Therefore, a strong grounding in basic and advanced psychometrics is extremely helpful for responding to criticisms and concerns about measurement issues that arise during the peer-review process.
A second consequence of the fact that the data have been collected by somebody else is that analysts may not have access to all of the information about data collection procedures and issues. The analyst simply receives a cleaned data set to use for subsequent analyses. Perhaps not obvious to the user is the amount of actual cleaning that occurred behind the scenes. Similarly, the complicated sampling procedures used in a given study may not be readily apparent to users, and this issue can prevent the appropriate use of survey weights ( Shrout & Napier, 2011 ).
Another significant disadvantage for secondary data analysis is the large amount of time and energy initially required to review data documentation. It can take hours and even weeks to become familiar with the codebooks and to discover which research questions have already been addressed by investigators using the existing data sets. It is very easy to underestimate how long it will take to move from an initial research idea to a competent final analysis. There is a risk that, unbeknownst to one another, researchers in different locations will pursue answers to the same research questions. On the other hand, once a researcher has become familiar with a data set and developed skills to work with the resource, they are able to pursue additional research questions resulting in multiple publications from the same data set. It is our experience that the process of learning about a data set can help generate new research ideas as it becomes clearer how the resource can be used to contribute to psychological science. Thus, the initial time and energy expended to learn about a resource can be viewed as initial investment that holds the potential to pay larger dividends over time.
Finally, a possible disadvantage concerns how secondary data analyses are viewed within particular subdisciplines of psychology and by referees during the peer-review process. Some journals and some academic departments may not value secondary data analyses as highly as primary research. Such preferences might break along Cronbach’s two disciplines or two streams of psychology—correlational versus experimental ( Cronbach, 1957 ; Tracy, Robins, & Sherman, 2009 ). The reality is that if original data collection is more highly valued in a given setting, then new investigators looking to build a strong case for getting hired or getting promoted might face obstacles if they base a career exclusively on secondary data analysis. Similarly, if experimental methods are highly valued and correlational methods are denigrated in a particular subfield, then results of secondary data analyses will face difficulties getting attention (and even getting published). The best advice is to be aware of local norms and to act accordingly.
Steps for Beginning a Secondary Data Analysis
Step 1: Find Existing Data Sets . After generating a substantive question, the first task is to find relevant data sets ( see Pienta, O’Rouke, & Franks, 2011 ). In some cases researchers will be aware of existing data sets through familiarity with the literature given that many well-cited papers have used such resources. For example, the GSOEP has now been widely used to address questions about correlates and developmental course of subjective well-being (e.g., Baird, Lucas, & Donnellan, 2010 ; Gerstorf, Ram, Estabrook, Schupp, Wagner, & Lindenberger, 2008 ; Gerstorf, Ram, Goebel, Schupp, Lindenberger, & Wagner, 2010 ; Lucas, 2005 ; 2007 ), and thus, researchers in this area know to turn to this resource if a new question arises. In other cases, however, researchers will attempt to find data sets using established archives such as the University of Michigan’s Interuniversity Consortium for Political and Social Research (ICPSR; http://www.icpsr.umich.edu/icpsrweb/ICPSR/ ). In addition to ICPSR, there are a number of other major archives ( see Pienta et al., 2011 ) that house potentially relevant data sets. Here are just a few starting points:
The Henry A. Murray Research Archive ( http://www.murray.harvard.edu/ )
The Howard W Odum Institute for Research in Social Science ( http://www.irss.unc.edu/odum/jsp/home2.jsp )
The National Opinion Research Center ( http://norc.org/homepage.htm )
The Roper Center of Public Opinion Research ( http://ropercenter.uconn.edu/ )
The United Kingdom Data Archive ( http://www.data-archive.ac.uk/ )
Individuals in charge of these archives and data depositories often catalog metadata, which is the technical term for information about the constituent data sets. Typical kinds of metadata include information about the original investigators, a description of the design and process of data collection, a list of the variables assessed, and notes about sampling weights and missing data. Searching through this information is an efficient way of gaining familiarity with data sets. In particular, the ICPSR has an impressive infrastructure for allowing researchers to search for data sets through a cataloguing of study metadata. The ICPSR is thus a useful starting point for finding the raw material for a secondary data analysis. The ICPSR also provides a new user tutorial for searching their holdings ( http://www.icpsr.umich.edu/icpsrweb/ICPSR/help/newuser.jsp ). We recommend that researchers search through their holdings to make a list of potential data sets. At that point, the next task is to obtain relevant codebooks to learn more about each resource.
Step 2: Read Codebooks . Researchers interesting in using an existing data set are strongly advised to thoroughly read the accompanying codebook ( Pienta et al., 2011 ). There are several reasons why a comprehensive understanding of the codebook is a critical first step when conducting a secondary data analysis. First, the codebook will detail the procedures and methods used to acquire the data and provide a list of all of the questions and assessments collected. A thorough reading of the codebook can provide insights into important covariates that can be included in subsequent models, and a careful reading will draw the analyst’s attention to key variables that will be missing because no such information was collected. Reading through a codebook can also help to generate new research questions.
Second, high-quality codebooks often report basic descriptive information for each variable such as raw frequency distributions and information about the extent of missing values. The descriptive information in the codebook can give investigators a baseline expectation for variables under consideration, including the expected distributions of the variables and the frequencies of under-represented groups (such as ethnic minority participants). Because it is important to verify that the descriptive statistics in the published codebook match those in the file analyzed by the secondary analyst, a familiarity with the codebook is essential. In addition to codebooks, many existing resources provide copies of the actual surveys completed by participants ( Pienta et al., 2011 ). However, the use of actual pencil-and-paper surveys is becoming less common with the advent of computer assisted interview techniques and Internet surveys. It is often the case that survey methods involve skip patterns (e.g., a participant is not asked about the consequences of her drinking if she responds that she doesn’t drink alcohol) that make it more difficult to assume the perspective of the “typical” respondent in a given study ( Pienta et al., 2011 ). Nonetheless, we recommend that analysts try to develop an understanding for the experiences of the participant in a given study. This perspective can help secondary analysts develop an intuitive understanding of certain patterns of missing data and anticipate concerns about question ordering effects ( see , e.g., Schwarz, 1999 ).
Step 3: Acquire Datasets and Construct a Working Datafile . Although there is a growing availability of Web-based resources for conducting basic analyses using selected data sets (e.g., the Survey Documentation Analysis software used by ICPSR), we are convinced that there is no substitute for the analysis of the raw data using the software packages of preference for a given investigator. This means that the analysts will need to acquire the data sets that they consider most relevant. This is typically a very straightforward process that involves acknowledging researcher responsibilities before downloading the entire data set from a website. In some cases, data are classified as restricted-use, and there are more extensive procedures for obtaining access that may involve submitting a detailed security plan and accompanying legal paperwork before becoming an authorized data user. When data involve children and other sensitive groups, Institutional Review Board approval is often required.
Each data set has different usage requirements, so it is difficult to provide blanket guidance. Researchers should be aware of the policies for using each data set and recognize their ethical responsibility for adhering to those regulations. A central issue is that the researcher must avoid deductive disclosure whereby otherwise anonymous participants are identified because of prior knowledge in conjunction with the personal characteristics coded in the dataset (e.g., gender, racial/ethnic group, geographic location, birth date). Such a practice violates the major ethical principles followed by responsible social scientists and has the potential to harm research participants.
Once the entire set of raw data is acquired, it is usually straightforward to import the files into the kinds of statistical packages used by researchers (e.g., R, SAS, SPSS, and STATA). At this point, it is likely that researchers will want to create smaller “working” file by pulling only relevant variables from the larger master files. It is often too cumbersome to work with a computer file that may have more than a thousand columns of information. The solution is to construct a working data file that has all of the needed variables tied to a particular research project. Researchers may also need to link multiple files by matching longitudinal data sets and linking to contextual variables such as information about schools or neighborhoods for data sets with a multilevel structure (e.g., individuals nested in schools or neighborhoods).
Explicit guidance about managing a working data file can be found in Willms (2011 ). Here, we simply highlight some particularly useful advice: (1) keep exquisite notes about what variables were selected and why; (2) keep detailed notes regarding changes to each variable and reasons why; and (3) keep track of sample sizes throughout this entire process. The guiding philosophy is to create documentation that is clear enough for an outside user to follow the logic and procedures used by the researcher. It is far too easy to overestimate the power of memory only to be disappointed when it comes time to revisit a particular analysis. Careful documentation can save time and prevent frustration. Willms (2011 ) noted that “keeping good notes is the sine qua non of the trade” (p. 33).
Step 4: Conduct Analyses . After assembling the working data file, the researcher will likely construct major study variables by creating scale composites (e.g., the mean of the responses to the items assessing the same construct) and conduct initial analyses. As previously noted, a comparison of the distributions and sample sizes with those in the study codebook is essential at this stage. Any deviations for the variables in the working data file and the codebook should be understood and documented. It is particularly useful to keep track of missing values to make sure that they have been properly coded. It should go without saying that an observed value of-9999 will typically require recoding to a missing value in the working file. Similarly, errors in reverse scoring items can be particularly common (and troubling) so researchers are well advised to conduct through item-level and scale analyses and check to make sure that reverse scoring was done correctly (e.g., examine the inter-item correlation matrix when calculating internal consistency estimates to screen for negative correlations). Willms (2011 ) provides some very savvy advice for the initial stages of actual data analysis: “Be wary of surprise findings” (p. 35). He noted that “too many times I have been excited by results only to find that I have made some mistake” (p. 35). Caution, skepticism, and a good sense of the underlying data set are essential for detecting mistakes.
An important comment about the nature of secondary data analysis is again worth emphasizing: These data sets are available to others in the scholarly community. This means that others should be able to replicate your results! It is also very useful to adopt a self-critical perspective because others will be able to subject findings to their own empirical scrutiny. Contemplate alternative explanations and attempt to conduct analyses to evaluate the plausibility of these explanations. Accordingly, we recommend that researchers strive to think of theoretically relevant control variables and include them in the analytic models when appropriate. Such an approach is useful both from the perspective of scientific progress (i.e., attempting to curb confirmation biases) and in terms of surviving the peer-review process.
Special Issue: Measurement Concerns in Existing Datasets
One issue with secondary data analyses that is likely to perplex psychologists are concerns regarding the measurement of core constructs. The reality is that many of the measures available in large-scale data sets consist of a subset of items derived from instruments commonly used by psychologists ( see Russell & Matthews, 2011 ). For example, the 10-item Rosenberg Self-Esteem scale ( Rosenberg, 1965 ) is the most commonly used measure of global self-esteem in the literature ( Donnellan, Trzesniewski, & Robins, 2011 ). Measures of self-esteem are available in many data sets like Monitoring the Future ( see Trzesniewski & Donnellan, 2010 ) but these measures are typically shorter than the original Rosenberg scale. Similarly, the GSOEP has a single-item rating of subjective well-being in the form of happiness, whereas psychologists might be more accustomed to measuring this construct with at least five items (e.g., Diener, Emmons, Larsen, & Griffin, 1985 ). Researchers using existing data sets will have to grapple with the consequences of having relatively short assessments in terms of the impact on reliability and validity.
For purposes of this chapter, we will make use of a conventional distinction between reliability and validity. Reliability will refer to the degree of measurement error present in a given set of scores (or alternatively the degree of consistency or precision in scores), whereas validity will refer to the degree to which measures capture the construct of interest and predict other variables in ways that are consistent with theory. More detailed but accessible discussions of reliability and validity can be found in Briggs and Cheek (1986 ), Clark and Watson (1995 ), John and Soto (2007 ), Messick (1995 ), Simms (2008 ), and Simms and Watson (2007 ). Widaman, Little, Preacher, and Sawalani (2011 ) have provided a discussion of these issues in the context of the shortened assessments available in existing data sets.
Short Measures and Reliability . Classical Test Theory (e.g., Lord & Novick, 1968 ) is the measurement perspective most commonly used among psychologists. According to this measurement philosophy, any observed score is a function of the underlying attribute (the so-called “true score”) and measurement error. Reliability is conceptualized as any deviation or inconsistency in observed scores for the same attribute across multiple assessments of that attribute. A thought experiment may help crystallize insights about reliability (e.g., Lord & Novick, 1968 ): Imagine a thousand identical clones each completing the same self-esteem instrument simultaneously. The underlying self-esteem attribute (i.e., the true scores) should be the same for each clone (by definition), whereas the observed scores may fluctuate across clones because of random measurement errors (e.g., a single clone misreading an item vs. another clone being frustrated by an extremely hot testing room). The extent of the observed fluctuations in reported scores across clones offers insight into how much measurement error is present in this instrument. If scores are tightly clustered around a single value, then measurement error is minimal; however, if scores are dramatically different across clones, then there is a clear indication of problems with reliability. The measure is imprecise because it yields inconsistent values across the same true scores.
These ideas about reliability can be applied to observed samples of scores such that the total observed variance is attributable to true score variance (i.e., true individual differences in underlying attributes) and variance stemming from random measurement errors. The assumption that measurement error is random means that it has an expected value of zero across observations. Using this framework, reliability can then be defined as the ratio of true score variance to the total observed variance. An assessment that is perfectly reliable (i.e., has no measurement error) will have a ratio of 1.0, whereas an assessment that is completely unreliable will yield a ratio of 0.0 ( see John & Soto, 2007 , for an expanded discussion). This perspective provides a formal definition of a reliability coefficient.
Psychologists have developed several tools to estimate the reliability of their measures, but the approach that is most commonly used is coefficient a ( Cronbach, 1951 ; see Schmitt, 1996 , for an accessible review). This approach considers reliability from the perspective of internal consistency. The basic idea is that fluctuations across items assessing the same construct reflect the presence of measurement error. The formula for the standardized α is a fairly simple function of the average inter-item correlation (a measure of inter-item homogeneity) and the total number of items in a scale. The α coefficient is typically judged acceptable if it is above 0.70, but the justification for this particular cutoff is somewhat arbitrary ( see Lance, Butts, & Michels, 2006 ). Researchers are therefore advised to take a more critical perspective on this statistic. A relevant concern is that α is negatively impacted when the measure is short.
Given concerns with scale length and α, many methodologically oriented researchers recommend evaluating and reporting the average inter-item correlation because it can be interpreted independently of length and thus represents a “more straightforward indicator of internal consistency” ( Clark & Watson, 1995 , p. 316). Consider that it is common to observe an average inter-item correlation for the 10-item Rosenberg Self-Esteem ( Rosenberg, 1965 ) scale around 0.40 (this is based on typically reported a coefficients; see Donnellan et al., 2011 ). This same level of internal homogeneity (i.e., an inter-item correlation of 0.40) yields an α of around 0.67 with a 3-item scale but an α of around 0.87 with 10 items. A measure of a broader construct like Extraversion may generate an average inter-item correlation of 0.20 ( Clark & Watson, 1995 , p. 316), which would translate to an α of 0.43 for a 3-item scale and 0.71 for a 10-item scale. The point is that α coefficients will fluctuate with scale length and the breadth of the construct. Because most scales in existing resources are short, the α coefficients might fall below the 0.70 convention despite having a respectable level of inter-item correlation.
Given these considerations, we recommend that researchers consider the average inter-item correlation more explicitly when working with secondary data sets. It is also important to consider the breadth of the underlying construct to generate expectations for reasonable levels of item homogeneity as indexed by the average inter-item correlation. Clark and Watson (1995 ; see also Briggs & Cheek, 1986 ) recommend values of around 0.40 to 0.50 for measures of fairly narrow constructs (e.g., self-esteem) and values of around 0.15 to 0.20 for measures of broader constructs (e.g., neuroticism). It is our experience that considerations about internal consistency often need to be made explicit in manuscripts so that reviewers will not take an unnecessarily harsh perspective on α’s that fall below their expectations. Finally, we want to emphasize that internal consistency is but one kind of reliability. In some cases, it might be that test—retest reliability is more informative and diagnostic of the quality of a measure ( McCrae, Kurtz, Yamagata, & Terracciano, 2011 ). Fortunately, many secondary data sets are longitudinal so it possible to get an estimate of longer term test-retest reliability from the existing data.
Beyond simply reporting estimates of reliability, it is worth considering why measurement reliability is such an important issue in the first place. One consequence of reliability for substantive research is that measurement imprecision tends to depress observed correlations with other variables. This notion of attenuation resulting from measurement error and a solution were discussed by Spearman as far back as 1904 ( see , e.g., pp. 88–94). Unreliable measures can affect the conclusions drawn from substantive research by imposing a downward bias on effect size estimation. This is perhaps why Widaman et al. (2011 ) advocate using latent variable structural modeling methods to combat this important consequence of measurement error. Their recommendation is well worth considering for those with experience with this technique ( see Kline, 2011 , for an introduction). Regardless of whether researchers use observed variables or latent variables for their analyses, it is important to recognize and appreciate the consequences of reliability.
Short Measures and Validity . Validity, for our purposes, reflects how well a measure captures the underlying conceptual attribute of interest. All discussions of validity are based, in part, on agreement in a field as to how to understand the construct in question. Validity, like reliability, is assessed as a matter of degree rather than a categorical distinction between valid or invalid measures. Cronbach and Meehl (1955 ) have provided a classic discussion of construct validity, perhaps the most overarching and fundamental form of validity considered in psychological research ( see also Smith, 2005 ). However, we restrict our discussion to content validity and criterion-related validity because these two types of validity are particularly relevant for secondary data analysis and they are more immediately addressable.
Content validity describes how well a measure captures the entire domain of the construct in question. Judgments regarding content validity are ideally made by panels of experts familiar with the focal construct. A measure is considered construct deficient if it fails to assess important elements of the construct. For example, if thoughts of suicide are an integral aspect of the concept depression and a given self-report measure is missing items that tap this content, then the measure would be deemed construct-deficient. A measure can also suffer from construct contamination if it includes extraneous items that are irrelevant to the focal construct. For example, if somatic symptoms like a rapid heartbeat are considered to reflect the construct of anxiety and not part of depression, then a depression inventory that has such an item would suffer from construct contamination. Given the reduced length of many assessments, concerns over construct deficiency are likely to be especially pressing. A short assessment may not include enough items to capture the full breadth of a broad construct. This limitation is not readily addressed and should be acknowledged ( see Widaman et al., 2011 ). In particular, researchers may need to clearly specify that their findings are based on a narrower content domain than is normally associated with the focal construct of interest.
A subtle but important point can arise when considering the content of measures with particularly narrow content. Internal consistency will increase when there is redundancy among items in the scale; however, the presence of similar items may decrease predictive power. This is known as the attenuation paradox in psycho metrics ( see Clark & Watson, 1995 ). When items are nearly identical, they contribute redundant information about a very specific aspect of the construct. However, the very specific attribute may not have predictive power. In essence, reliability can be maximized at the expense of creating a measure that is not very useful from the point of view of prediction (and likely explanation). Indeed, Clark and Watson (1995 ) have argued that the “goal of scale construction is to maximize validity rather than reliability” (p. 316). In short, an evaluation of content validity is also important when considering the predictive power of a given measure.
Whereas content validity is focused on the internal attributes of a measure, criterion-related validity is based on the empirical relations between measures and other variables. Using previous research and theory surrounding the focal construct, the researcher should develop an expectation regarding the magnitude and direction of observed associations (i.e., correlations) with other variables. A good supporting theory of a construct should stipulate a pattern of association, or nomological network, concerning those other variables that should be related and unrelated to the focal construct. This latter requirement is often more difficult to specify from existing theories, which tend to provide a more elaborate discussion of convergent associations rather than discriminant validity ( Widaman et al., 2011 ). For example, consider a very truncated nomological network for Agreeableness (dispositional kindness and empathy). Measures of this construct should be positively associated with romantic relationship quality, negatively related to crime (especially violent crime), and distinct from measures of cognitive ability such as tests of general intelligence.
Evaluations of criterion-related validity can be conducted within a data set as researchers document that a measure has an expected pattern of associations with existing criterion-related variables. Investigators using secondary data sets may want to conduct additional research to document the criterion-related validity of short measures with additional convenience samples (e.g., the ubiquitous college student samples used by many psychologists; Sears, 1986 ). For example, there are six items in the Add Health data set that appear to measure self-esteem (e.g., “I have a lot of good qualities” and “I like myself just the way I am”) ( see Russell, Crockett, Shen, &Lee, 2008 ). Although many of the items bear a strong resemblance to the items on the Rosenberg Self-Esteem scale ( Rosenberg, 1965 ), they are not exactly the same items. To obtain some additional data on the usefulness of this measure, we administered the Add Health items to a sample of 387 college students at our university along with the Rosenberg Self-Esteem scale and an omnibus measure of personality based on the Five-Factor model ( Goldberg, 1999 ). The six Add Health items were strongly correlated with the Rosenberg ( r = 0.79), and both self-esteem measures had a similar pattern of convergent and divergent associations with the facets of the Five-Factor model (the two profiles were very strongly associated: r > 0.95). This additional information can help bolster the case for the validity of the short Add Health self-esteem measure.
Special Issue: Missing Data in Existing Data Sets
Missing data is a fact of life in research— individuals may drop out of longitudinal studies or refuse to answer particular questions. These behaviors can affect the generalizability of findings because results may only apply to those individuals who choose to complete a study or a measure. Missing data can also diminish statistical power when common techniques like listwise deletion are used (e.g., only using cases with complete information, thereby reducing the sample size) and even lead to biased effect size estimates (e.g., McKnight & McKnight, 2011 ; McKnight, McKnight, Sidani, & Figuredo, 2007 ; Widaman, 2006 ). Thus, concerns about missing data are important for all aspects of research, including secondary data analysis. The development of specific techniques for appropriately handling missing data is an active area of research in quantitative methods ( Schafer & Graham, 2002 ).
Unfortunately, the literature surrounding missing data techniques is often technical and steeped in jargon, as noted by McKnight et al. (2007 ). The reality is that researchers attempting to understand issues of missing data need to pay careful attention to terminology. For example, a novice researcher may not immediately grasp the classification of missing data used in the literature ( see Schafer & Graham, 2002 , for a clear description). Consider the confusion that may stem from learning that data are missing at random (MAR) versus data are missing completely at random (MCAR). The term MAR does not mean that missing values only occurred because of chance factors. This is the case when data are missing completely at random (MCAR). Data that are MCAR are absent because of truly random factors. Data that are MAR refers to the situation in which the probability that the observations are missing depends only on other available information in the data set. Data that are MAR can be essentially “ignored” when the other factors are included in a statistical model. The last type of missing data, data missing not at random (MNAR), is likely to characterize the variables in many real-life data sets. As it stands, methods for handing data that are MAR and MCAR are better developed and more easily implemented than methods for handling data MNAR. Thus, many applied researchers will assume data are MAR for purposes of statistical modeling (and the ability to sleep comfortably at night). Fortunately, such an assumption might not create major problems for many analyses and may in fact represent the “practical state of the art” ( Schafer & Graham, 2002 , p. 173).
The literature on missing data techniques is growing, so we simply recommend that researchers keep current on developments in this area. McKnight et al. (2007 ) and Widaman (2006 ) both provide an accessible primer on missing data techniques. In keeping with the largely practical bent to the chapter, we suggest that researchers keep careful track of the amount of missing data present in their analyses and report such information clearly in research papers ( see McKnight & McKnight, 2011 ). Similarly, we recommend that researchers thoroughly screen their data sets for evidence that missing values depend on other measured variables (e.g., scores at Time 1 might be associated with Time 2 dropout). In general, we suggest that researchers avoid listwise and pairwise deletion methods because there is very little evidence that these are good practices ( see Jeličić, Phelps, & Lerner, 2009 ; Widaman, 2006 ). Rather, it might be easiest to use direct fitting methods such as the estimation procedures used in conventional structural equation modeling packages (e.g., Full Information Maximum Likelihood; see Allison, 2003 ). At the very least, it is usually instructive to compare results using listwise deletion with results obtained with direct model fitting in terms of the effect size estimates and basic conclusions regarding the statistical significance of focal coefficients.
Special Issue: Sample Weighting in Existing Data Sets
One of the advantages of many existing data sets is that they were collected using probabilistic sampling methods so that researchers can obtain unbiased population estimates. Such estimates, however, are only obtained when complex survey weights are formally incorporated into the statistical modeling procedures. Such weighting schemes can affect the correlations between variables, and therefore all users of secondary data sets should become familiar with sampling design when they begin working with a new data set. A considerable amount of time and effort is dedicated toward generating complex weighting schemes that account for the precise sampling strategies used in the given study, and users of secondary data sets should give careful consideration to using these weights appropriately.
In some cases, the addition of sampling weights will have little substantive implication on findings, so extensive concern over weighting might be overstated. On the other hand, any potential difference is ultimately an empirical question, so researchers are well advised to consider the importance of sampling weights ( Shrout & Napier, 2011 ). The problem is that many psychologists are not well versed in the use of sampling weights ( Shrout & Napier, 2011 ). Thus, psychologists may not be in a strong position to evaluate whether sample weighting concerns are relevant. In addition, it is sometimes necessary to use specialized software packages or add-ons to adjust analytic models appropriately for sampling weights. Programs such as STATA and SAS have such capabilities in the base package, whereas packages like SPSS sometimes require a complex survey model add-on that integrates with its existing capabilities. Whereas the graduate training of the modal sociologist or demographer is likely to emphasize survey research and thus presumably cover sampling, this is not the case with the methodological training of many psychologists ( Aiken, West, & Millsap, 2008 ). Psychologists who are unfamiliar with sample weighting procedures are well advised to seek the counsel of a survey methodologist before undertaking data analysis.
In terms of practical recommendations, it is important for the user of the secondary data set to develop a clear understanding of how the data were collected by reading documentation about the design and sampling procedure ( Shrout & Napier, 2011 ). This insight will provide a conceptual framework for understanding weighting schemes and for deciding how to appropriately weight the data. Once researchers have a clear idea of the sampling scheme and potential weights, actually incorporating available weights into analyses is not terribly difficult, provided researchers have the appropriate software ( Shrout & Napier, 2011 ). Weighting tutorials are often available for specific data sets. For example, the Add Health project has a document describing weighting ( http://www.cpc.unc.edu/projects/addhealth/faqs/aboutdata/weight1.pdf ) as does the Centers for Disease Control and Prevention for use with their Youth Risk Behavior Surveys ( http://www.cdc.gov/HealthyYouth/yrbs/pdf/YRBS_analysis_software.pdf ). These free documents may also provide useful and accessible background even for those who may not use the data from these projects.
Secondary data analysis refers to the analysis of existing data that may not have been explicitly collected to address a particular research question. Many of the quantitative techniques described in this volume can be applied using existing resources. To be sure, strong data analytic skills are important for fully realizing the potential benefits of secondary data sets, and such skills can help researchers recognize the limits of a data set for any given analysis.
In particular, measurement issues are likely to create the biggest hurdles for psychologists conducting secondary analyses in terms of the challenges associated with offering a reasonable interpretation of the results and in surviving the peer-review process. Accordingly, a familiarity with basic issues in psychometrics is very helpful. Beyond such skills, the effective use of these existing resources requires patience and strong attention to detail. Effective secondary data analysis also requires a fair bit of curiosity to seek out those resources that might be used to make important contribution to psychological science.
Ultimately, we hope that the field of psychology becomes more and more accepting of secondary data analysis. As psychologists use this approach with increasing frequency, it is likely that the organizers of major ongoing data collection efforts will be increasingly open to including measures of prime interest to psychologists. The individuals in charge of projects like the BHPS, the GSOEP, and the National Center for Education Statistics ( http://nces.ed.gov/ ) want their data to be used by the widest possible audiences and will respond to researcher demands. We believe that it is time that psychologists join their colleagues in economics, sociology, and political science in taking advantage of these existing resources. It is also time to move beyond divisive discussions surrounding the presumed superiority of primary data collection over secondary analysis. There is no reason to choose one over the other when the field of psychology can profit from both. We believe that the relevant topics of debate are not about the method of initial data collection but, rather, about the importance and intrinsic interest of the underlying research questions. If the question is important and the research design and measures are suitable, then there is little doubt in our minds that secondary data analysis can make a contribution to psychological science.
Author Note
M. Brent Donnellan, Department of Psychology, Michigan State University, East Lansing, MI 48824.
Richard E. Lucas, Department of Psychology, Michigan State University, East Lansing, MI 48824.
One consequence of large sample sizes, however, is that issues of effect size interpretation become paramount given that very small correlations or very small mean differences between groups are likely to be statistically significant using conventional null hypothesis significance tests (e.g., Trzesniewski & Donnellan, 2009 ). Researchers will therefore need to grapple with issues related to null hypothesis significance testing ( see Kline, 2004 ).
Aiken, L. S. , & West, S. G. ( 1991 ). Multiple regression: Testing and interpreting interactions . Newbury Park, CA: Sage.
Google Scholar
Google Preview
Aiken, L. S. , West, S. G. , & Millsap, R. E. ( 2008 ). Doctoral training in statistics, measurement, and methodology in psychology: Replication and extension of Aiken, West, Sechrest, and Reno’s (1990) survey of Ph.D. programs in North America. American Psychologist, 63, 32–50.
Akers, R. L. , Massey, J. , & Clarke, W ( 1983 ). Are self-reports of adolescent deviance valid? Biochemical measures, randomized response, and the bogus pipeline in smoking behavior. Social Forces, 62, 234–251.
Allison, P. D. ( 2003 ). Missing data techniques for structural equation modeling. Journal of Abnormal Psychology, 112, 545–557.
Baird, B. M. , Lucas, R. E. , & Donnellan, M. B. ( 2010 ). Life Satisfaction across the lifespan: Findings from two nationally representative panel studies. Social Indicators Research, 99, 183–203.
Briggs, S. R. , & Cheek, J. M. ( 1986 ). The role of factor analysis in the development and evaluation of personality scales. Journal of Personality 54, 106–148.
Brooks-Gunn, J. , Berlin, L. J. , Leventhal, T. , & Fuligini, A. S. ( 2000 ). Depending on the kindness of strangers: Current national data initiatives and developmental research. Child Development, 71, 257–268.
Brooks-Gunn, J. , & Chase-Lansdale, P. L. ( 1991 ) (Eds.). Secondary data analyses in developmental psychology [Special section]. Developmental Psychology, 27, 899–951.
Clark, L. A. , & Watson, D. ( 1995 ). Constructing validity: Basic issues in objective scale development. Psychological Assessment, 7, 309–319.
Cronbach, L. J. ( 1951 ). Coefficient alpha and the internal structure of tests. Psychometrika, 16, 297–234.
Cronbach, L. J. ( 1957 ). The two disciplines of scientific psychology. American Psychologist, 12, 671–684.
Cronbach, L. J. , & Meehl, P. ( 1955 ). Construct validity in psychological tests. Psychological Bulletin, 52, 281–302.
Diener, E. , Emmons, R. A. , Larsen, R. J. , & Griffin, S. ( 1985 ). The Satisfaction with Life Scale. Journal of Personality Assessment, 49, 71–75.
Donnellan, M. B. , Trzesniewski, K. H. , & Robins, R. W. ( 2011 ). Self-esteem: Enduring issues and controversies. In T Chamorro-Premuzic , S. von Stumm , and A. Furnham (Eds). The Wiley-Blackwell Handbook of Individual Differences (pp. 710–746). New York: Wiley-Blackwell.
Freese, J. ( 2007 ). Replication standards for quantitative social science: Why not sociology? Sociological Methods & Research, 36, 153–172.
Gerstorf, D. , Ram, N. , Estabrook, R. , Schupp, J. , Wagner, G. G. , & Lindenberger, U. ( 2008 ). Life satisfaction shows terminal decline in old age: Longitudinal evidence from the German Socio-Economic Panel Study (SOEP). Developmental Psychology, 44, 1148–1159.
Gerstorf, D. , Ram, N. , Goebel, J. , Schupp, J. , Lindenberger, U. , & Wagner, G. G. ( 2010 ). Where people live and die makes a difference: Individual and geographic disparities in well-being progression at the end of life. Psychology and Aging, 25, 661–676.
Goldberg, L. R. ( 1999 ). A broad-bandwidth, public domain, personality inventory measuring the lower-level facets of several five-factor models. In I Mervielde , I. Deary , F. De Fruyt , & F. Ostendorf (Eds.), Personality psychology in Europe (Vol. 7, pp. 7–28). Tilburg, The Netherlands: Tilburg University Press.
Hofferth, S. L. , ( 2005 ). Secondary data analysis in family research. Journal of Marriage and the Family, 67, 891–907.
Hunter, J. E. , & Schmidt, F. L. ( 2004 ). Methods of meta-analysis: Correcting error and bias in research findings (2nd ed.). Newbury Park, CA: Sage.
Jeličić, H. , Phelps, E. , & Lerner, R. M. ( 2009 ). Use of missing data methods in longitudinal studies: The persistence of bad practices in developmental psychology. Developmental Psychology, 45, 1195–1199.
John, O. P. , & Soto, C. J. ( 2007 ). The importance of being valid. In R. W Robins , R. C. Fraley , and R. F. Krueger (Eds). Handbook of Research Methods in Personality Psychology (pp. 461–494). New York: Guilford Press.
Kiecolt, K. J. & Nathan, L. E. ( 1985 ). Secondary analysis of survey data . Sage University Paper series on Quantitative Applications in the Social Sciences, No. 53). Newbury Park, CA: Sage.
Kline, R. B. ( 2004 ). Beyond significance testing: Reforming data analysis methods in behavioral research . Washington, DC: American Psychological Association.
Kline, R. B. ( 2011 ). Principles and practice of structural equation modeling (3rd ed.). New York: Guildford Press.
Lance, C. E. , Butts, M. M. , & Michels, L. C. ( 2006 ). The sources of four commonly reported cutoff criteria: What did they really say? Organizational Research Methods, 9, 202–220.
Lord, F. , & Novick, M. R. ( 1968 ). Statistical theories of mental test scores . Reading, MA: Addison-Wesley.
Lucas, R. E. ( 2005 ). Time does not heal all wounds. Psychological Science, 16, 945–950.
Lucas, R. E. ( 2007 ). Adaptation and the set-point model of subjective well-being: Does happiness change after major life events? Current Directions in Psychological Science, 16, 75–79.
McCall, R. B. , & Appelbaum, M. I. ( 1991 ). Some issues of conducting secondary analyses. Developmental Psychology, 27, 911–917.
McCrae, R. R. , Kurtz, J. E. , Yamagata, S. , & Terracciano, A. ( 2011 ). Internal consistency, retest reliability, and their implications for personality scale validity. Personality and Social Psychology Review, 15, 28–50.
Messick, S. ( 1995 ). Validity of psychological assessment: Validation of inferences from persons’ responses and performances as scientific inquiry into score meaning. American Psychologist, 50, 741–749.
McKnight, P. E. , & McKnight, K. M. ( 2011 ). Missing data in secondary data analysis. In K. H. Trzesniewski , M. B. Donnellan , & R. E. Lucas (Eds). Secondary data analysis: An introduction for psychologists (pp. 83–101). Washington, DC: American Psychological Association.
McKnight, P. E. , McKnight, K. M. , Sidani, S. , & Figuredo, A. ( 2007 ). Missing data: A gentle introduction . New York: Guilford Press.
Mroczek, D. K. , Pitzer, L. , Miller, L. , Turiano, N. , & Fingerman, K. ( 2011 ). The use of secondary data in adult development and aging research. In K. H. Trzesniewski , M. B. Donnellan , and R. E. Lucas (Eds). Secondary data analysis: An introduction for psychologists (pp. 121–132). Washington, DC: American Psychological Association.
Pienta, A. M. , O’Rourke, J. M. , & Franks, M. M. ( 2011 ). Getting started: Working with secondary data. In K. H. Trzesniewski , M. B. Donnellan , and R. E. Lucas (Eds). Secondary data analysis: An introduction for psychologists (pp. 13–25). Washington, DC: American Psychological Association.
Rosenberg, M. ( 1965 ). Society and adolescent self image , Princeton, NJ: Princeton University.
Russell, S. T. , Crockett, L. J. , Shen, Y-L , & Lee, S-A. ( 2008 ). Cross-ethnic invariance of self-esteem and depression measures for Chinese, Filipino, and European American adolescents. Journal of Youth and Adolescence, 37, 50–61.
Russell, S. T. , & Matthews, E. ( 2011 ). Using secondary data to study adolescence and adolescent development. In K. H. Trzesniewski , M. B. Donnellan , & R. E. Lucas (Eds). Secondary data analysis: An introduction for psychologists (pp. 163–176). Washington, DC: American Psychological Association.
Schafer, J. L. & Graham, J. W ( 2002 ). Missing data: Our view of the state of the art. Psychological Methods, 7, 147–177.
Schmitt, N. ( 1996 ). Uses and abuses of coefficient alpha. Psychological Assessment, 8, 350–353.
Schwarz, N. ( 1999 ). Self-reports: How the questions shape the answers. American Psychologist, 54, 93–105.
Schwarz, N. & Strack, F. ( 1999 ). Reports of subjective well-being: Judgmental processes and their methodological implications. In D. Kahneman , E. Diener , & N. Schwarz (Eds.). Well-being: The foundations of hedonic psychology (pp.61–84). New York: Russell Sage Foundation.
Sears, D. O. ( 1986 ). College sophomores in the lab: Influences of a narrow data base on social psychology’s view of human nature. Journal of Personality and Social Psychology, 51, 515–530.
Shrout, P. E. , & Napier, J. L. ( 2011 ). Analyzing survey data with complex sampling designs. In K. H. Trzesniewski , M. B. Donnellan , & R. E. Lucas (Eds). Secondary data analysis: An introduction for psychologists (pp. 63–81). Washington, DC: American Psychological Association.
Simms, L. J. ( 2008 ). Classical and modern methods of psychological scale construction. Social and Personality Psychology Compass, 2/1, 414–433.
Simms, L. J. , & Watson, D. ( 2007 ). The construct validation approach to personality scale creation. In R. W Robins , R. C. Fraley , & R. F. Krueger (Eds). Handbook of Research Methods in Personality Psychology (pp. 240–258). New York: Guilford Press.
Smith, G. X ( 2005 ). On construct validity: Issues of method and measurement. Psychological Assessment, 17, 396–408.
Tracy, J. L. , Robins, R. W. , & Sherman, J. W. ( 2009 ). The practice of psychological science: Searching for Cronbach’s two streams in social-personality psychology. Journal of Personality and Social Psychology, 96, 1206–1225.
Trzesniewski, K.H. & Donnellan, M. B. ( 2009 ). Re-evaluating the evidence for increasing self-views among high school students: More evidence for consistency across generations (1976–2006). Psychological Science, 20, 920–922.
Trzesniewski, K. H. & Donnellan, M. B. ( 2010 ). Rethinking “Generation Me”: A study of cohort effects from 1976–2006. Perspectives in Psychological Science , 5, 58–75.
Trzesniewski, K. H. , Donnellan, M. B. , & Lucas, R. E. ( 2011 ) (Eds). Secondary data analysis: An introduction for psychologists . Washington, DC: American Psychological Association.
Widaman, K. F. ( 2006 ). Missing data: What to do with or without them. Monographs of the Society for Research in Child Development, 71, 42–64.
Widaman, K. F. , Little, T. D. , Preacher, K. K. , & Sawalani, G. M. ( 2011 ). On creating and using short forms of scales in secondary research. In K. H. Trzesniewski , M. B. Donnellan , & R. E. Lucas (Eds). Secondary data analysis: An introduction for psychologists (pp. 39–61). Washington, DC: American Psychological Association.
Willms, J. D. ( 2011 ). Managing and using secondary data sets with multidisciplinary research teams. In K. H. Trzesniewski , M. B. Donnellan , & R. E. Lucas (Eds). Secondary data analysis: An introduction for psychologists (pp. 27–38). Washington, DC: American Psychological Association.
- About Oxford Academic
- Publish journals with us
- University press partners
- What we publish
- New features
- Open access
- Institutional account management
- Rights and permissions
- Get help with access
- Accessibility
- Advertising
- Media enquiries
- Oxford University Press
- Oxford Languages
- University of Oxford
Oxford University Press is a department of the University of Oxford. It furthers the University's objective of excellence in research, scholarship, and education by publishing worldwide
- Copyright © 2024 Oxford University Press
- Cookie settings
- Cookie policy
- Privacy policy
- Legal notice
This Feature Is Available To Subscribers Only
Sign In or Create an Account
This PDF is available to Subscribers Only
For full access to this pdf, sign in to an existing account, or purchase an annual subscription.

- Teesside University Student & Library Services
- Learning Hub Group
Research Methods
Secondary research.
- Primary Research
What is Secondary Research?
Advantages and disadvantages of secondary research, secondary research in literature reviews, secondary research - going beyond literature reviews, main stages of secondary research, useful resources, using material on this page.
- Quantitative Research This link opens in a new window
- Qualitative Research This link opens in a new window
- Being Critical This link opens in a new window
- Subject LibGuides This link opens in a new window

Secondary research
Secondary research uses research and data that has already been carried out. It is sometimes referred to as desk research. It is a good starting point for any type of research as it enables you to analyse what research has already been undertaken and identify any gaps.
You may only need to carry out secondary research for your assessment or you may need to use secondary research as a starting point, before undertaking your own primary research .
Searching for both primary and secondary sources can help to ensure that you are up to date with what research has already been carried out in your area of interest and to identify the key researchers in the field.
"Secondary sources are the books, articles, papers and similar materials written or produced by others that help you to form your background understanding of the subject. You would use these to find out about experts’ findings, analyses or perspectives on the issue and decide whether to draw upon these explicitly in your research." (Cottrell, 2014, p. 123).
Examples of secondary research sources include:.
- journal articles
- official statistics, such as government reports or organisations which have collected and published data
Primary research involves gathering data which has not been collected before. Methods to collect it can include interviews, focus groups, controlled trials and case studies. Secondary research often comments on and analyses this primary research.
Gopalakrishnan and Ganeshkumar (2013, p. 10) explain the difference between primary and secondary research:
"Primary research is collecting data directly from patients or population, while secondary research is the analysis of data already collected through primary research. A review is an article that summarizes a number of primary studies and may draw conclusions on the topic of interest which can be traditional (unsystematic) or systematic".
Secondary Data
As secondary data has already been collected by someone else for their research purposes, it may not cover all of the areas of interest for your research topic. This research will need to be analysed alongside other research sources and data in the same subject area in order to confirm, dispute or discuss the findings in a wider context.
"Secondary source data, as the name infers, provides second-hand information. The data come ‘pre-packaged’, their form and content reflecting the fact that they have been produced by someone other than the researcher and will not have been produced specifically for the purpose of the research project. The data, none the less, will have some relevance for the research in terms of the information they contain, and the task for the researcher is to extract that information and re-use it in the context of his/her own research project." (Denscombe, 2021, p. 268)
In the video below Dr. Benedict Wheeler (Senior Research Fellow at the European Center for Environment and Human Health at the University of Exeter Medical School) discusses secondary data analysis. Secondary data was used for his research on how the environment affects health and well-being and utilising this secondary data gave access to a larger data set.
As with all research, an important part of the process is to critically evaluate any sources you use. There are tools to help with this in the Being Critical section of the guide.
Louise Corti, from the UK Data Archive, discusses using secondary data in the video below. T he importance of evaluating secondary research is discussed - this is to ensure the data is appropriate for your research and to investigate how the data was collected.
There are advantages and disadvantages to secondary research:
Advantages:
- Usually low cost
- Easily accessible
- Provides background information to clarify / refine research areas
- Increases breadth of knowledge
- Shows different examples of research methods
- Can highlight gaps in the research and potentially outline areas of difficulty
- Can incorporate a wide range of data
- Allows you to identify opposing views and supporting arguments for your research topic
- Highlights the key researchers and work which is being undertaken within the subject area
- Helps to put your research topic into perspective
Disadvantages
- Can be out of date
- Might be unreliable if it is not clear where or how the research has been collected - remember to think critically
- May not be applicable to your specific research question as the aims will have had a different focus
Literature reviews
Secondary research for your major project may take the form of a literature review . this is where you will outline the main research which has already been written on your topic. this might include theories and concepts connected with your topic and it should also look to see if there are any gaps in the research., as the criteria and guidance will differ for each school, it is important that you check the guidance which you have been given for your assessment. this may be in blackboard and you can also check with your supervisor..
The videos below include some insights from academics regarding the importance of literature reviews.
Secondary research which goes beyond literature reviews
For some dissertations/major projects there might only be a literature review (discussed above ). For others there could be a literature review followed by primary research and for others the literature review might be followed by further secondary research.
You may be asked to write a literature review which will form a background chapter to give context to your project and provide the necessary history for the research topic. However, you may then also be expected to produce the rest of your project using additional secondary research methods, which will need to produce results and findings which are distinct from the background chapter t o avoid repetition .
Remember, as the criteria and guidance will differ for each School, it is important that you check the guidance which you have been given for your assessment. This may be in Blackboard and you can also check with your supervisor.
Although this type of secondary research will go beyond a literature review, it will still rely on research which has already been undertaken. And, "just as in primary research, secondary research designs can be either quantitative, qualitative, or a mixture of both strategies of inquiry" (Manu and Akotia, 2021, p. 4).
Your secondary research may use the literature review to focus on a specific theme, which is then discussed further in the main project. Or it may use an alternative approach. Some examples are included below. Remember to speak with your supervisor if you are struggling to define these areas.
Some approaches of how to conduct secondary research include:
- A systematic review is a structured literature review that involves identifying all of the relevant primary research using a rigorous search strategy to answer a focused research question.
- This involves comprehensive searching which is used to identify themes or concepts across a number of relevant studies.
- The review will assess the q uality of the research and provide a summary and synthesis of all relevant available research on the topic.
- The systematic review LibGuide goes into more detail about this process (The guide is aimed a PhD/Researcher students. However, students on other levels of study may find parts of the guide helpful too).
- Scoping reviews aim to identify and assess available research on a specific topic (which can include ongoing research).
- They are "particularly useful when a body of literature has not yet been comprehensively reviewed, or exhibits a complex or heterogeneous nature not amenable to a more precise systematic review of the evidence. While scoping reviews may be conducted to determine the value and probable scope of a full systematic review, they may also be undertaken as exercises in and of themselves to summarize and disseminate research findings, to identify research gaps, and to make recommendations for the future research." (Peters et al., 2015) .
- This is designed to summarise the current knowledge and provide priorities for future research.
- "A state-of-the-art review will often highlight new ideas or gaps in research with no official quality assessment." ( MacAdden, 2020).
- "Bibliometric analysis is a popular and rigorous method for exploring and analyzing large volumes of scientific data." (Donthu et al., 2021)
- Quantitative methods and statistics are used to analyse the bibliographic data of published literature. This can be used to measure the impact of authors, publications, or topics within a subject area.
The bibliometric analysis often uses the data from a citation source such as Scopus or Web of Science .
- This is a technique used to combine the statistic results of prior quantitative studies in order to increase precision and validity.
- "It goes beyond the parameters of a literature review, which assesses existing literature, to actually perform calculations based on the results collated, thereby coming up with new results" (Curtis and Curtis, 2011, p. 220)
(Adapted from: Grant and Booth, 2009, cited in Sarhan and Manu, 2021, p. 72)
- Grounded Theory is used to create explanatory theory from data which has been collected.
- "Grounded theory data analysis strategies can be used with different types of data, including secondary data." (Whiteside, Mills and McCalman, 2012)
- This allows you to use a specific theory or theories which can then be applied to your chosen topic/research area.
- You could focus on one case study which is analysed in depth, or you could examine more than one in order to compare and contrast the important aspects of your research question.
- "Good case studies often begin with a predicament that is poorly comprehended and is inadequately explained or traditionally rationalised by numerous conflicting accounts. Therefore, the aim is to comprehend an existent problem and to use the acquired understandings to develop new theoretical outlooks or explanations." (Papachroni and Lochrie, 2015, p. 81)
Main stages of secondary research for a dissertation/major project
In general, the main stages for conducting secondary research for your dissertation or major project will include:
Click on the image below to access the reading list which includes resources used in this guide as well as some additional useful resources.

This work is licensed under a Creative Commons Attribution-NonCommercial-ShareAlike 3.0 Unported License .
- << Previous: Primary Research
- Next: Quantitative Research >>
- Last Updated: Apr 29, 2024 4:47 PM
- URL: https://libguides.tees.ac.uk/researchmethods
- What is Secondary Research? + [Methods & Examples]

In some situations, the researcher may not be directly involved in the data gathering process and instead, would rely on already existing data in order to arrive at research outcomes. This approach to systematic investigation is known as secondary research.
There are many reasons a researcher may want to make use of already existing data instead of collecting data samples, first-hand. In this article, we will share some of these reasons with you and show you how to conduct secondary research with Formplus.
What is Secondary Research?
Secondary research is a common approach to a systematic investigation in which the researcher depends solely on existing data in the course of the research process. This research design involves organizing, collating and analyzing these data samples for valid research conclusions.
Secondary research is also known as desk research since it involves synthesizing existing data that can be sourced from the internet, peer-reviewed journals , textbooks, government archives, and libraries. What the secondary researcher does is to study already established patterns in previous researches and apply this information to the specific research context.
Interestingly, secondary research often relies on data provided by primary research and this is why some researches combine both methods of investigation. In this sense, the researcher begins by evaluating and identifying gaps in existing knowledge before adopting primary research to gather new information that will serve his or her research.
What are Secondary Research Methods?
As already highlighted, secondary research involves data assimilation from different sources, that is, using available research materials instead of creating a new pool of data using primary research methods. Common secondary research methods include data collection through the internet, libraries, archives, schools and organizational reports.
- Online Data
Online data is data that is gathered via the internet. In recent times, this method has become popular because the internet provides a large pool of both free and paid research resources that can be easily accessed with the click of a button.
While this method simplifies the data gathering process , the researcher must take care to depend solely on authentic sites when collecting information. In some way, the internet is a virtual aggregation for all other sources of secondary research data.
- Data from Government and Non-government Archives
You can also gather useful research materials from government and non-government archives and these archives usually contain verifiable information that provides useful insights on varying research contexts. In many cases, you would need to pay a sum to gain access to these data.
The challenge, however, is that such data is not always readily available due to a number of factors. For instance, some of these materials are described as classified information as such, it would be difficult for researchers to have access to them.
- Data from Libraries
Research materials can also be accessed through public and private libraries. Think of a library as an information storehouse that contains an aggregation of important information that can serve as valid data in different research contexts.
Typically, researchers donate several copies of dissertations to public and private libraries; especially in cases of academic research. Also, business directories, newsletters, annual reports and other similar documents that can serve as research data, are gathered and stored in libraries, in both soft and hard copies.
- Data from Institutions of Learning
Educational facilities like schools, faculties, and colleges are also a great source of secondary data; especially in academic research. This is because a lot of research is carried out in educational institutions more than in other sectors.
It is relatively easier to obtain research data from educational institutions because these institutions are committed to solving problems and expanding the body of knowledge. You can easily request research materials from educational facilities for the purpose of a literature review.
Secondary research methods can also be categorized into qualitative and quantitative data collection methods . Quantitative data gathering methods include online questionnaires and surveys, reports about trends plus statistics about different areas of a business or industry.
Qualitative research methods include relying on previous interviews and data gathered through focus groups which helps an organization to understand the needs of its customers and plan to fulfill these needs. It also helps businesses to measure the level of employee satisfaction with organizational policies.
When Do We Conduct Secondary Research?
Typically, secondary research is the first step in any systematic investigation. This is because it helps the researcher to understand what research efforts have been made so far and to utilize this knowledge in mapping out a novel direction for his or her investigation.
For instance, you may want to carry out research into the nature of a respiratory condition with the aim of developing a vaccine. The best place to start is to gather existing research material about the condition which would help to point your research in the right direction.
When sifting through these pieces of information, you would gain insights into methods and findings from previous researches which would help you define your own research process. Secondary research also helps you to identify knowledge gaps that can serve as the name of your own research.
Questions to ask before conducting Secondary Research
Since secondary research relies on already existing data, the researcher must take extra care to ensure that he or she utilizes authentic data samples for the research. Falsified data can have a negative impact on the research outcomes; hence, it is important to always carry out resource evaluation by asking a number of questions as highlighted below:
- What is the purpose of the research? Again, it is important for every researcher to clearly define the purpose of the research before proceeding with it. Usually, the research purpose determines the approach that would be adopted.
- What is my research methodology? After identifying the purpose of the research, the next thing to do is outline the research methodology. This is the point where the researcher chooses to gather data using secondary research methods.
- What are my expected research outcomes?
- Who collected the data to be analyzed? Before going on to use secondary data for your research, it is necessary to ascertain the authenticity of the information. This usually affects the data reliability and determines if the researcher can trust the materials. For instance, data gathered from personal blogs and websites may not be as credible as information obtained from an organization’s website.
- When was the data collected? Data recency is another factor that must be considered since the recency of data can affect research outcomes. For instance, if you are carrying out research into the number of women who smoke in London, it would not be appropriate for you to make use of information that was gathered 5 years ago unless you plan to do some sort of data comparison.
- Is the data consistent with other data available from other sources? Always compare and contrast your data with other available research materials as this would help you to identify inconsistencies if any.
- What type of data was collected? Take care to determine if the secondary data aligns with your research goals and objectives.
- How was the data collected?
Advantages of Secondary Research
- Easily Accessible With secondary research, data can easily be accessed in no time; especially with the use of the internet. Apart from the internet, there are different data sources available in secondary research like public libraries and archives which are relatively easy to access too.
- Secondary research is cost-effective and it is not time-consuming. The researcher can cut down on costs because he or she is not directly involved in the data collection process which is also time-consuming.
- Secondary research helps researchers to identify knowledge gaps which can serve as the basis of further systematic investigation.
- It is useful for mapping out the scope of research thereby setting the stage for field investigations. When carrying out secondary research, the researchers may find that the exact information they were looking for is already available, thus eliminating the need and expense incurred in carrying out primary research in these areas.
Disadvantages of Secondary Research
- Questionable Data: With secondary research, it is hard to determine the authenticity of the data because the researcher is not directly involved in the research process. Invalid data can affect research outcomes negatively hence, it is important for the researcher to take extra care by evaluating the data before making use of it.
- Generalization: Secondary data is unspecific in nature and may not directly cater to the needs of the researcher. There may not be correlations between the existing data and the research process.
- Common Data: Research materials in secondary research are not exclusive to an individual or group. This means that everyone has access to the data and there is little or no “information advantage” gained by those who obtain the research.
- It has the risk of outdated research materials. Outdated information may offer little value especially for organizations competing in fast-changing markets.
How to Conduct Online Surveys with Formplus
Follow these 5 steps to create and administer online surveys for secondary research:
- Sign into Formplus
In the Formplus builder, you can easily create an online survey for secondary research by dragging and dropping preferred fields into your form. To access the Formplus builder, you will need to create an account on Formplus.
Once you do this, sign in to your account and click on “Create Form ” to begin.

- Edit Form Title

Click on the field provided to input your form title, for example, “Secondary Research Survey”.
- Click on the edit button to edit the form.

- Add Fields: Drag and drop preferred form fields into your form in the Formplus builder inputs column. There are several field input options for questionnaires in the Formplus builder.
- Edit fields
- Click on “Save”
- Preview form.
- Customize your Form

With the form customization options in the form builder, you can easily change the outlook of your form and make it more unique and personalized. Formplus allows you to change your form theme, add background images and even change the font according to your needs.
- Multiple Sharing Options

Formplus offers multiple form sharing options which enables you to easily share your questionnaire with respondents. You can use the direct social media sharing buttons to share your form link to your organization’s social media pages.
You can send out your survey form as email invitations to your research subjects too. If you wish, you can share your form’s QR code or embed it on your organization’s website for easy access.
Why Use Formplus as a Secondary Research Tool?
- Simple Form Builder Solution
The Formplus form builder is easy to use and does not require you to have any knowledge in computer programming, unlike other form builders. For instance, you can easily add form fields to your form by dragging and dropping them from the inputs section in the builder.
In the form builder, you can also modify your fields to be hidden or read-only and you can create smart forms with save and resume options, form lookup, and conditional logic. Formplus also allows you to customize your form by adding preferred background images and your organization’s logo.
- Over 25 Form Fields
With over 25 versatile form fields available in the form builder, you can easily collect data the way you like. You can receive payments directly in your form by adding payment fields and you can also add file upload fields to allow you receive files in your form too.
- Offline Form feature
With Formplus, you can collect data from respondents even without internet connectivity . Formplus automatically detects when there is no or poor internet access and allows forms to be filled out and submitted in offline mode.
Offline form responses are automatically synced with the servers when the internet connection is restored. This feature is extremely useful for field research that may involve sourcing for data in remote and rural areas plus it allows you to scale up on your audience reach.
- Team and Collaboration
You can add important collaborators and team members to your shared account so that you all can work on forms and responses together. With the multiple users options, you can assign different roles to team members and you can also grant and limit access to forms and folders.
This feature works with an audit trail that enables you to track changes and suggestions made to your form as the administrator of the shared account. You can set up permissions to limit access to the account while organizing and monitoring your form(s) effectively.
- Embeddable Form
Formplus allows you to easily add your form with respondents with the click of a button. For instance, you can directly embed your form in your organization’s web pages by adding Its unique shortcode to your site’s HTML.
You can also share your form to your social media pages using the social media direct sharing buttons available in the form builder. You can choose to embed the form as an iframe or web pop-up that is easy to fill.
With Formplus, you can share your form with numerous form respondents in no time. You can invite respondents to fill out your form via email invitation which allows you to also track responses and prevent multiple submissions in your form.
In addition, you can also share your form link as a QR code so that respondents only need to scan the code to access your form. Our forms have a unique QR code that you can add to your website or print in banners, business cards and the like.
While secondary research can be cost-effective and time-efficient, it requires the researcher to take extra care in ensuring that the data is authentic and valid. As highlighted earlier, data in secondary research can be sourced through the internet, archives, and libraries, amongst other methods.
Secondary research is usually the starting point of systematic investigation because it provides the researcher with a background of existing research efforts while identifying knowledge gaps to be filled. This type of research is typically used in science and education.
It is, however, important to note that secondary research relies on the outcomes of collective primary research data in carrying out its systematic investigation. Hence, the success of your research will depend, to a greater extent, on the quality of data provided by primary research in relation to the research context.
Connect to Formplus, Get Started Now - It's Free!
- primary secondary research differences
- primary secondary research method
- secondary data collection
- secondary research examples
- busayo.longe
You may also like:
Recall Bias: Definition, Types, Examples & Mitigation
This article will discuss the impact of recall bias in studies and the best ways to avoid them during research.
Exploratory Research: What are its Method & Examples?
Overview on exploratory research, examples and methodology. Shows guides on how to conduct exploratory research with online surveys
Primary vs Secondary Research Methods: 15 Key Differences
Difference between primary and secondary research in definition, examples, data analysis, types, collection methods, advantages etc.
What is Pure or Basic Research? + [Examples & Method]
Simple guide on pure or basic research, its methods, characteristics, advantages, and examples in science, medicine, education and psychology
Formplus - For Seamless Data Collection
Collect data the right way with a versatile data collection tool. try formplus and transform your work productivity today..
A Guide To Secondary Data Analysis
What is secondary data analysis? How do you carry it out? Find out in this post.
Historically, the only way data analysts could obtain data was to collect it themselves. This type of data is often referred to as primary data and is still a vital resource for data analysts.
However, technological advances over the last few decades mean that much past data is now readily available online for data analysts and researchers to access and utilize. This type of data—known as secondary data—is driving a revolution in data analytics and data science.
Primary and secondary data share many characteristics. However, there are some fundamental differences in how you prepare and analyze secondary data. This post explores the unique aspects of secondary data analysis. We’ll briefly review what secondary data is before outlining how to source, collect and validate them. We’ll cover:
- What is secondary data analysis?
- How to carry out secondary data analysis (5 steps)
- Summary and further reading
Ready for a crash course in secondary data analysis? Let’s go!
1. What is secondary data analysis?
Secondary data analysis uses data collected by somebody else. This contrasts with primary data analysis, which involves a researcher collecting predefined data to answer a specific question. Secondary data analysis has numerous benefits, not least that it is a time and cost-effective way of obtaining data without doing the research yourself.
It’s worth noting here that secondary data may be primary data for the original researcher. It only becomes secondary data when it’s repurposed for a new task. As a result, a dataset can simultaneously be a primary data source for one researcher and a secondary data source for another. So don’t panic if you get confused! We explain exactly what secondary data is in this guide .
In reality, the statistical techniques used to carry out secondary data analysis are no different from those used to analyze other kinds of data. The main differences lie in collection and preparation. Once the data have been reviewed and prepared, the analytics process continues more or less as it usually does. For a recap on what the data analysis process involves, read this post .
In the following sections, we’ll focus specifically on the preparation of secondary data for analysis. Where appropriate, we’ll refer to primary data analysis for comparison.
2. How to carry out secondary data analysis
Step 1: define a research topic.
The first step in any data analytics project is defining your goal. This is true regardless of the data you’re working with, or the type of analysis you want to carry out. In data analytics lingo, this typically involves defining:
- A statement of purpose
- Research design
Defining a statement of purpose and a research approach are both fundamental building blocks for any project. However, for secondary data analysis, the process of defining these differs slightly. Let’s find out how.
Step 2: Establish your statement of purpose
Before beginning any data analytics project, you should always have a clearly defined intent. This is called a ‘statement of purpose.’ A healthcare analyst’s statement of purpose, for example, might be: ‘Reduce admissions for mental health issues relating to Covid-19′. The more specific the statement of purpose, the easier it is to determine which data to collect, analyze, and draw insights from.
A statement of purpose is helpful for both primary and secondary data analysis. It’s especially relevant for secondary data analysis, though. This is because there are vast amounts of secondary data available. Having a clear direction will keep you focused on the task at hand, saving you from becoming overwhelmed. Being selective with your data sources is key.
Step 3: Design your research process
After defining your statement of purpose, the next step is to design the research process. For primary data, this involves determining the types of data you want to collect (e.g. quantitative, qualitative, or both ) and a methodology for gathering them.
For secondary data analysis, however, your research process will more likely be a step-by-step guide outlining the types of data you require and a list of potential sources for gathering them. It may also include (realistic) expectations of the output of the final analysis. This should be based on a preliminary review of the data sources and their quality.
Once you have both your statement of purpose and research design, you’re in a far better position to narrow down potential sources of secondary data. You can then start with the next step of the process: data collection.
Step 4: Locate and collect your secondary data
Collecting primary data involves devising and executing a complex strategy that can be very time-consuming to manage. The data you collect, though, will be highly relevant to your research problem.
Secondary data collection, meanwhile, avoids the complexity of defining a research methodology. However, it comes with additional challenges. One of these is identifying where to find the data. This is no small task because there are a great many repositories of secondary data available. Your job, then, is to narrow down potential sources. As already mentioned, it’s necessary to be selective, or else you risk becoming overloaded.
Some popular sources of secondary data include:
- Government statistics , e.g. demographic data, censuses, or surveys, collected by government agencies/departments (like the US Bureau of Labor Statistics).
- Technical reports summarizing completed or ongoing research from educational or public institutions (colleges or government).
- Scientific journals that outline research methodologies and data analysis by experts in fields like the sciences, medicine, etc.
- Literature reviews of research articles, books, and reports, for a given area of study (once again, carried out by experts in the field).
- Trade/industry publications , e.g. articles and data shared in trade publications, covering topics relating to specific industry sectors, such as tech or manufacturing.
- Online resources: Repositories, databases, and other reference libraries with public or paid access to secondary data sources.
Once you’ve identified appropriate sources, you can go about collecting the necessary data. This may involve contacting other researchers, paying a fee to an organization in exchange for a dataset, or simply downloading a dataset for free online .
Step 5: Evaluate your secondary data
Secondary data is usually well-structured, so you might assume that once you have your hands on a dataset, you’re ready to dive in with a detailed analysis. Unfortunately, that’s not the case!
First, you must carry out a careful review of the data. Why? To ensure that they’re appropriate for your needs. This involves two main tasks:
Evaluating the secondary dataset’s relevance
- Assessing its broader credibility
Both these tasks require critical thinking skills. However, they aren’t heavily technical. This means anybody can learn to carry them out.
Let’s now take a look at each in a bit more detail.
The main point of evaluating a secondary dataset is to see if it is suitable for your needs. This involves asking some probing questions about the data, including:
What was the data’s original purpose?
Understanding why the data were originally collected will tell you a lot about their suitability for your current project. For instance, was the project carried out by a government agency or a private company for marketing purposes? The answer may provide useful information about the population sample, the data demographics, and even the wording of specific survey questions. All this can help you determine if the data are right for you, or if they are biased in any way.
When and where were the data collected?
Over time, populations and demographics change. Identifying when the data were first collected can provide invaluable insights. For instance, a dataset that initially seems suited to your needs may be out of date.
On the flip side, you might want past data so you can draw a comparison with a present dataset. In this case, you’ll need to ensure the data were collected during the appropriate time frame. It’s worth mentioning that secondary data are the sole source of past data. You cannot collect historical data using primary data collection techniques.
Similarly, you should ask where the data were collected. Do they represent the geographical region you require? Does geography even have an impact on the problem you are trying to solve?
What data were collected and how?
A final report for past data analytics is great for summarizing key characteristics or findings. However, if you’re planning to use those data for a new project, you’ll need the original documentation. At the very least, this should include access to the raw data and an outline of the methodology used to gather them. This can be helpful for many reasons. For instance, you may find raw data that wasn’t relevant to the original analysis, but which might benefit your current task.
What questions were participants asked?
We’ve already touched on this, but the wording of survey questions—especially for qualitative datasets—is significant. Questions may deliberately be phrased to preclude certain answers. A question’s context may also impact the findings in a way that’s not immediately obvious. Understanding these issues will shape how you perceive the data.
What is the form/shape/structure of the data?
Finally, to practical issues. Is the structure of the data suitable for your needs? Is it compatible with other sources or with your preferred analytics approach? This is purely a structural issue. For instance, if a dataset of people’s ages is saved as numerical rather than continuous variables, this could potentially impact your analysis. In general, reviewing a dataset’s structure helps better understand how they are categorized, allowing you to account for any discrepancies. You may also need to tidy the data to ensure they are consistent with any other sources you’re using.
This is just a sample of the types of questions you need to consider when reviewing a secondary data source. The answers will have a clear impact on whether the dataset—no matter how well presented or structured it seems—is suitable for your needs.
Assessing secondary data’s credibility
After identifying a potentially suitable dataset, you must double-check the credibility of the data. Namely, are the data accurate and unbiased? To figure this out, here are some key questions you might want to include:
What are the credentials of those who carried out the original research?
Do you have access to the details of the original researchers? What are their credentials? Where did they study? Are they an expert in the field or a newcomer? Data collection by an undergraduate student, for example, may not be as rigorous as that of a seasoned professor.
And did the original researcher work for a reputable organization? What other affiliations do they have? For instance, if a researcher who works for a tobacco company gathers data on the effects of vaping, this represents an obvious conflict of interest! Questions like this help determine how thorough or qualified the researchers are and if they have any potential biases.
Do you have access to the full methodology?
Does the dataset include a clear methodology, explaining in detail how the data were collected? This should be more than a simple overview; it must be a clear breakdown of the process, including justifications for the approach taken. This allows you to determine if the methodology was sound. If you find flaws (or no methodology at all) it throws the quality of the data into question.
How consistent are the data with other sources?
Do the secondary data match with any similar findings? If not, that doesn’t necessarily mean the data are wrong, but it does warrant closer inspection. Perhaps the collection methodology differed between sources, or maybe the data were analyzed using different statistical techniques. Or perhaps unaccounted-for outliers are skewing the analysis. Identifying all these potential problems is essential. A flawed or biased dataset can still be useful but only if you know where its shortcomings lie.
Have the data been published in any credible research journals?
Finally, have the data been used in well-known studies or published in any journals? If so, how reputable are the journals? In general, you can judge a dataset’s quality based on where it has been published. If in doubt, check out the publication in question on the Directory of Open Access Journals . The directory has a rigorous vetting process, only permitting journals of the highest quality. Meanwhile, if you found the data via a blurry image on social media without cited sources, then you can justifiably question its quality!
Again, these are just a few of the questions you might ask when determining the quality of a secondary dataset. Consider them as scaffolding for cultivating a critical thinking mindset; a necessary trait for any data analyst!
Presuming your secondary data holds up to scrutiny, you should be ready to carry out your detailed statistical analysis. As we explained at the beginning of this post, the analytical techniques used for secondary data analysis are no different than those for any other kind of data. Rather than go into detail here, check out the different types of data analysis in this post.
3. Secondary data analysis: Key takeaways
In this post, we’ve looked at the nuances of secondary data analysis, including how to source, collect and review secondary data. As discussed, much of the process is the same as it is for primary data analysis. The main difference lies in how secondary data are prepared.
Carrying out a meaningful secondary data analysis involves spending time and effort exploring, collecting, and reviewing the original data. This will help you determine whether the data are suitable for your needs and if they are of good quality.
Why not get to know more about what data analytics involves with this free, five-day introductory data analytics short course ? And, for more data insights, check out these posts:
- Discrete vs continuous data variables: What’s the difference?
- What are the four levels of measurement? Nominal, ordinal, interval, and ratio data explained
- What are the best tools for data mining?

Want to create or adapt books like this? Learn more about how Pressbooks supports open publishing practices.
Integrated Primary & Secondary Research
5 Types of Secondary Research Data

Secondary sources allow you to broaden your research by providing background information, analyses, and unique perspectives on various elements for a specific campaign. Bibliographies of these sources can lead to the discovery of further resources to enhance research for organizations.
There are two common types of secondary data: Internal data and External data. Internal data is the information that has been stored or organized by the organization itself. External data is the data organized or collected by someone else.
Internal Secondary Sources
Internal secondary sources include databases containing reports from individuals or prior research. This is often an overlooked resource—it’s amazing how much useful information collects dust on an organization’s shelves! Other individuals may have conducted research of their own or bought secondary research that could be useful to the task at hand. This prior research would still be considered secondary even if it were performed internally because it was conducted for a different purpose.
External Secondary Sources
A wide range of information can be obtained from secondary research. Reliable databases for secondary sources include Government Sources, Business Source Complete, ABI, IBISWorld, Statista, and CBCA Complete. This data is generated by others but can be considered useful when conducting research into a new scope of the study. It also means less work for a non-for-profit organization as they would not have to create their own data and instead can piggyback off the data of others.
Examples of Secondary Sources
Government sources.
A lot of secondary data is available from the government, often for free, because it has already been paid for by tax dollars. Government sources of data include the Census Bureau, the Bureau of Labor Statistics, and the National Centre for Health Statistics.
For example, through the Census Bureau, the Bureau of Labor Statistics regularly surveys individuals to gain information about them (Bls.gov, n.d). These surveys are conducted quarterly, through an interview survey and a diary survey, and they provide data on expenditures, income, and household information (families or single). Detailed tables of the Expenditures Reports include the age of the reference person, how long they have lived in their place of residence and which geographic region they live in.
Syndicated Sources
A syndicated survey is a large-scale instrument that collects information about a wide variety of people’s attitudes and capital expenditures. The Simmons Market Research Bureau conducts a National Consumer Survey by randomly selecting families throughout the country that agree to report in great detail what they eat, read, watch, drive, and so on. They also provide data about their media preferences.
Other Types of Sources
Gallup, which has a rich tradition as the world’s leading public opinion pollster, also provides in-depth reports based on its proprietary probability-based techniques (called the Gallup Panel), in which respondents are recruited through a random digit dial method so that results are more reliably generalizable. The Gallup organization operates one of the largest telephone research data-collection systems in the world, conducting more than twenty million interviews over the last five years and averaging ten thousand completed interviews per day across two hundred individual survey research questionnaires (GallupPanel, n.d).
Attribution
This page contains materials taken from:
Bls.gov. (n.d). U.S Bureau of Labor Statistics. Retrieved from https://www.bls.gov/
Define Quantitative and Qualitative Evidence. (2020). Retrieved July 23, 2020, from http://sgba-resource.ca/en/process/module-8-evidence/define-quantitative-and-qualitative-evidence/
GallupPanel. (n.d). Gallup Panel Research. Retrieved from http://www.galluppanel.com
Secondary Data. (2020). Retrieved July 23, 2020, from https://2012books.lardbucket.org/books/advertising-campaigns-start-to-finish/s08-03-secondary-data.html
An Open Guide to Integrated Marketing Communications (IMC) Copyright © by Andrea Niosi and KPU Marketing 4201 Class of Summer 2020 is licensed under a Creative Commons Attribution-NonCommercial-ShareAlike 4.0 International License , except where otherwise noted.
Share This Book

An official website of the United States government
The .gov means it’s official. Federal government websites often end in .gov or .mil. Before sharing sensitive information, make sure you’re on a federal government site.
The site is secure. The https:// ensures that you are connecting to the official website and that any information you provide is encrypted and transmitted securely.
- Publications
- Account settings
Preview improvements coming to the PMC website in October 2024. Learn More or Try it out now .
- Advanced Search
- Journal List
- Iran J Public Health
- v.42(12); 2013 Dec
Secondary Data Analysis: Ethical Issues and Challenges
Research does not always involve collection of data from the participants. There is huge amount of data that is being collected through the routine management information system and other surveys or research activities. The existing data can be analyzed to generate new hypothesis or answer critical research questions. This saves lots of time, money and other resources. Also data from large sample surveys may be of higher quality and representative of the population. It avoids repetition of research & wastage of resources by detailed exploration of existing research data and also ensures that sensitive topics or hard to reach populations are not over researched ( 1 ). However, there are certain ethical issues pertaining to secondary data analysis which should be taken care of before handling such data.
Secondary data analysis
Secondary analysis refers to the use of existing research data to find answer to a question that was different from the original work ( 2 ). Secondary data can be large scale surveys or data collected as part of personal research. Although there is general agreement about sharing the results of large scale surveys, but little agreement exists about the second. While the fundamental ethical issues related to secondary use of research data remain the same, they have become more pressing with the advent of new technologies. Data sharing, compiling and storage have become much faster and easier. At the same time, there are fresh concerns about data confidentiality and security.
Issues in Secondary data analysis
Concerns about secondary use of data mostly revolve around potential harm to individual subjects and issue of return for consent. Secondary data vary in terms of the amount of identifying information in it. If the data has no identifying information or is completely devoid of such information or is appropriately coded so that the researcher does not have access to the codes, then it does not require a full review by the ethical board. The board just needs to confirm that the data is actually anonymous. However, if the data contains identifying information on participants or information that could be linked to identify participants, a complete review of the proposal will then be made by the board. The researcher will then have to explain why is it unavoidable to have identifying information to answer the research question and must also indicate how participants’ privacy and the confidentiality of the data will be protected. If the above said concerns are satisfactorily addressed, the researcher can then request for a waiver of consent.
If the data is freely available on the Internet, books or other public forum, permission for further use and analysis is implied. However, the ownership of the original data must be acknowledged. If the research is part of another research project and the data is not freely available, except to the original research team, explicit, written permission for the use of the data must be obtained from the research team and included in the application for ethical clearance.
However, there are certain other issues pertaining to the data that is procured for secondary analysis. The data obtained should be adequate, relevant but not excessive. In secondary data analysis, the original data was not collected to answer the present research question. Thus the data should be evaluated for certain criteria such as the methodology of data collection, accuracy, period of data collection, purpose for which it was collected and the content of the data. It shall be kept for no longer than is necessary for that purpose. It must be kept safe from unauthorized access, accidental loss or destruction. Data in the form of hardcopies should be kept in safe locked cabinets whereas softcopies should be kept as encrypted files in computers. It is the responsibility of the researcher conducting the secondary analysis to ensure that further analysis of the data conducted is appropriate. In some cases there is provision for analysis of secondary data in the original consent form with the condition that the secondary study is approved by the ethics review committee. According to the British Sociological Association’s Statement of Ethical Practice (2004) the researchers must inform participants regarding the use of data and obtain consent for the future use of the material as well. However it also says that consent is not a once-and-for-all event, but is subject to renegotiation over time ( 3 ). It appears that there are no guidelines about the specific conditions that require further consent.
Issues in Secondary analysis of Qualitative data
In qualitative research, the culture of data archiving is absent ( 4 ). Also, there is a concern that data archiving exposes subject’s personal views. However, the best practice is to plan anonymisation at the time of initial transcription. Use of pseudonyms or replacements can protect subject’s identity. A log of all replacements, aggregations or removals should be made and stored separately from the anonymised data files. But because of the circumstances, under which qualitative data is produced, their reinterpretation at some later date can be challenging and raises further ethical concerns.
There is a need for formulating specific guidelines regarding re-use of data, data protection and anonymisation and issues of consent in secondary data analysis.
Acknowledgements
The authors declare that there is no conflict of interest.
- Fielding NG, Fielding JL (2003). Resistance and adaptation to criminal identity: Using secondary analysis to evaluate classic studies of crime and deviance . Sociology , 34 ( 4 ): 671–689. [ Google Scholar ]
- Szabo V, Strang VR (1997). Secondary analysis of qualitative data . Advances in Nursing Science , 20 ( 2 ): 66–74. [ PubMed ] [ Google Scholar ]
- Statement of Ethical Practice for the British Sociological Association (2004). The British Sociological Association, Durham . Available at: http://www.york.ac.uk/media/abouttheuniversity/governanceandmanagement/governance/ethicscommittee/hssec/documents/BSA%20statement%20of%20ethical%20practice.pdf (Last accessed 24November2013)
- Archiving Qualitative Data: Prospects and Challenges of Data Preservation and Sharing among Australian Qualitative Researchers. Institute for Social Science Research, The University of Queensland, 2009 . Available at: http://www.assda.edu.au/forms/AQuAQualitativeArchiving_DiscussionPaper_FinalNov09.pdf (Last accessed 05September2013)
- Open access
- Published: 01 June 2024
Biomarkers for personalised prevention of chronic diseases: a common protocol for three rapid scoping reviews
- E Plans-Beriso ORCID: orcid.org/0000-0002-9388-8744 1 , 2 na1 ,
- C Babb-de-Villiers 3 na1 ,
- D Petrova 2 , 4 , 5 ,
- C Barahona-López 1 , 2 ,
- P Diez-Echave 1 , 2 ,
- O R Hernández 1 , 2 ,
- N F Fernández-Martínez 2 , 4 , 5 ,
- H Turner 3 ,
- E García-Ovejero 1 ,
- O Craciun 1 ,
- P Fernández-Navarro 1 , 2 ,
- N Fernández-Larrea 1 , 2 ,
- E García-Esquinas 1 , 2 ,
- V Jiménez-Planet 7 ,
- V Moreno 2 , 8 , 9 ,
- F Rodríguez-Artalejo 2 , 10 , 11 ,
- M J Sánchez 2 , 4 , 5 ,
- M Pollan-Santamaria 1 , 2 ,
- L Blackburn 3 ,
- M Kroese 3 na2 &
- B Pérez-Gómez 1 , 2 na2
Systematic Reviews volume 13 , Article number: 147 ( 2024 ) Cite this article
241 Accesses
2 Altmetric
Metrics details
Introduction
Personalised prevention aims to delay or avoid disease occurrence, progression, and recurrence of disease through the adoption of targeted interventions that consider the individual biological, including genetic data, environmental and behavioural characteristics, as well as the socio-cultural context. This protocol summarises the main features of a rapid scoping review to show the research landscape on biomarkers or a combination of biomarkers that may help to better identify subgroups of individuals with different risks of developing specific diseases in which specific preventive strategies could have an impact on clinical outcomes.
This review is part of the “Personalised Prevention Roadmap for the future HEalThcare” (PROPHET) project, which seeks to highlight the gaps in current personalised preventive approaches, in order to develop a Strategic Research and Innovation Agenda for the European Union.
To systematically map and review the evidence of biomarkers that are available or under development in cancer, cardiovascular and neurodegenerative diseases that are or can be used for personalised prevention in the general population, in clinical or public health settings.
Three rapid scoping reviews are being conducted in parallel (February–June 2023), based on a common framework with some adjustments to suit each specific condition (cancer, cardiovascular or neurodegenerative diseases). Medline and Embase will be searched to identify publications between 2020 and 2023. To shorten the time frames, 10% of the papers will undergo screening by two reviewers and only English-language papers will be considered. The following information will be extracted by two reviewers from all the publications selected for inclusion: source type, citation details, country, inclusion/exclusion criteria (population, concept, context, type of evidence source), study methods, and key findings relevant to the review question/s. The selection criteria and the extraction sheet will be pre-tested. Relevant biomarkers for risk prediction and stratification will be recorded. Results will be presented graphically using an evidence map.
Inclusion criteria
Population: general adult populations or adults from specific pre-defined high-risk subgroups; concept: all studies focusing on molecular, cellular, physiological, or imaging biomarkers used for individualised primary or secondary prevention of the diseases of interest; context: clinical or public health settings.
Systematic review registration
https://doi.org/10.17605/OSF.IO/7JRWD (OSF registration DOI).
Peer Review reports
In recent years, innovative health research has moved quickly towards a new paradigm. The ability to analyse and process previously unseen sources and amounts of data, e.g. environmental, clinical, socio-demographic, epidemiological, and ‘omics-derived, has created opportunities in the understanding and prevention of chronic diseases, and in the development of targeted therapies that can cure them. This paradigm has come to be known as “personalised medicine”. According to the European Council Conclusion on personalised medicine for patients (2015/C 421/03), this term defines a medical model which involves characterisation of individuals’ genotypes, phenotypes and lifestyle and environmental exposures (e.g. molecular profiling, medical imaging, lifestyle and environmental data) for tailoring the right therapeutic strategy for the right person at the right time, and/or to determine the predisposition to disease and/or to deliver timely and targeted prevention [ 1 , 2 ]. In many cases, these personalised health strategies have been based on advances in fields such as molecular biology, genetic engineering, bioinformatics, diagnostic imaging and new’omics technologies, which have made it possible to identify biomarkers that have been used to design and adapt therapies to specific patients or groups of patients [ 2 ]. A biomarker is defined as a substance, structure, characteristic, or process that can be objectively quantified as an indicator of typical biological functions, disease processes, or biological reactions to exposure [ 3 , 4 ].
Adopting a public health perspective within this framework, one of the most relevant areas that would benefit from these new opportunities is the personalisation of disease prevention. Personalised prevention aims to delay or avoid the occurrence, progression and recurrence of disease by adopting targeted interventions that take into account biological information, environmental and behavioural characteristics, and the socio-economic and cultural context of individuals. These interventions should be timely, effective and equitable in order to maintain the best possible balance in lifetime health trajectory [ 5 ].
Among the main diseases that merit specific attention are chronic noncommunicable diseases, due to their incidence, their mortality or disability-adjusted life years [ 6 , 7 , 8 , 9 ]. Within the European Union (EU), in 2021, one-third of adults reported suffering from a chronic condition [ 10 ]. In addition, in 2019, the leading causes of mortality were cardiovascular disease (CVD) (35%), cancer (26%), respiratory disease (8%), and Alzheimer's disease (5%) [ 11 ]. For all of the above, in 2019, the PRECeDI consortium recommended the identification of biomarkers that could be used for the prevention of chronic diseases to integrate personalised medicine in the field of chronicity. This will support the goal of stratifying populations by indicating an individuals’ risk or resistance to disease and their potential response to drugs, guiding primary, secondary and tertiary preventive interventions [ 12 ]; understanding primary prevention as measures taken to prevent the occurrence of a disease before it occurs, secondary prevention as actions aimed at early detection, and tertiary prevention as interventions to prevent complications and improve quality of life in individuals already affected by a disease [ 4 ].
The “Personalised Prevention roadmap for the future HEalThcare” (PROPHET) project, funded by the European Union’s Horizon Europe research and innovation program and linked to ICPerMed, seeks to assess the effectiveness, clinical utility, and existing gaps in current personalised preventive approaches, as well as their potential to be implemented in healthcare settings. It also aims to develop a Strategy Research and Innovation Agenda (SRIA) for the European Union. This protocol corresponds to one of the first steps in the PROPHET, namely a review that aims to map the evidence and highlight the evidence gaps in research or the use of biomarkers in personalised prevention in the general adult population, as well as their integration with digital technologies, including wearable devices, accelerometers, and other appliances utilised for measuring physical and physiological functions. These biomarkers may be already available or currently under development in the fields of cancer, CVD, and neurodegenerative diseases.
There is already a significant body of knowledge about primary and secondary prevention strategies for these diseases. For example, hypercholesterolemia or dyslipidaemia, hypertension, smoking, diabetes mellitus and obesity or levels of physical activity are known risk factors for CVD [ 6 , 13 ] and neurodegenerative diseases [ 14 , 15 , 16 ]; for cancer, a summary of lifestyle preventive actions with good evidence is included in the European code against cancer [ 17 ]. The question is whether there is any biomarker or combination of biomarkers that can help to better identify subgroups of individuals with different risks of developing a particular disease, in which specific preventive strategies could have an impact on clinical outcomes. Our aim in this context is to show the available research in this field.
Given the context and time constraints, the rapid scoping review design is the most appropriate method for providing landscape knowledge [ 18 ] and provide summary maps, such as Campbell evidence and gap map [ 19 ]. Here, we present the protocol that will be used to elaborate three rapid scoping reviews and evidence maps of research on biomarkers investigated in relation to primary or secondary prevention of cancer, cardiovascular and neurodegenerative diseases, respectively. The results of these three rapid scoping reviews will contribute to inform the development of the PROPHET SRIA, which will guide the future policy for research in this field in the EU.
Review question
What biomarkers are being investigated in the context of personalised primary and secondary prevention of cancer, CVD and neurodegenerative diseases in the general adult population in clinical or public health settings?
Three rapid scoping reviews are being conducted between February and June 2023, in parallel, one for each disease group included (cancer, CVD and neurodegenerative diseases), using a common framework and specifying the adaptations to each disease group in search terms, data extraction and representation of results.
This research protocol, designed according to Joanna Briggs Institute (JBI) and Preferred Reporting Items for Systematic Reviews and Meta-Analyses extension for Scoping Reviews (PRISMA-ScR) Checklist [ 20 , 21 , 22 ] was uploaded to the Open Science Framework for public consultation [ 23 ], with registration DOI https://doi.org/ https://doi.org/10.17605/OSF.IO/7JRWD . The protocol was also reviewed by experts in the field, after which modifications were incorporated.
Eligibility criteria
Following the PCC (population, concept and context) model [ 21 , 22 ], the included studies will meet the following eligibility criteria (Table 1 ):
Rationale for performing a rapid scoping review
As explained above, these scoping reviews are intended to be one of the first materials produced in the PROPHET project, so that they can inform the first draft of the SRIA. Therefore, according to the planned timetable, the reviews should be completed in only 4 months. Thus, following recommendations from the Cochrane Rapid Review Methods Group [ 24 ] and taking into account the large number of records expected to be assessed, according to the preliminary searches, and in order to meet these deadlines, specific restrictions were defined for the search—limited to a 3-year period (2020–2023), in English only, and using only MEDLINE and EMBASE as possible sources—and it was decided that the title-abstract and full-text screening phase would be carried out by a single reviewer, after an initial training phase with 10% of the records assessed by two reviewers to ensure concordance between team members. This percentage could be increased if necessary.
Rationale for population selection
These rapid scoping reviews are focused on the general adult population. In addition, they give attention to studies conducted among populations that present specific risk factors relevant to the selected diseases or that include these factors among those considered in the study.
For cancer, these risk (or preventive) factors include smoking [ 25 ], obesity [ 26 ], diabetes [ 27 , 28 , 29 ], Helicobacter pylori infection/colonisation [ 30 ], human papillomavirus (HPV) infection [ 30 ], human immunodeficiency virus (HIV) infection [ 30 ], alcohol consumption [ 31 ], liver cirrhosis and viral (HVB, HVC, HVD) hepatitis [ 32 ].
For CVD, we include hypercholesterolemia or dyslipidaemia, arterial hypertension, smoking, diabetes mellitus, chronic kidney disease, hyperglycaemia and obesity [ 6 , 13 ].
Risk groups for neurodegenerative diseases were defined based on the following risk factors: obesity [ 15 , 33 ], arterial hypertension [ 15 , 33 , 34 , 35 ], diabetes mellitus [ 15 , 33 , 34 , 35 ], dyslipidaemia [ 33 ], alcohol consumption [ 36 , 37 ] and smoking [ 15 , 16 , 33 , 34 ].
After the general search, only relevant and/or disease-specific subpopulations will be used for each specific disease. On the other hand, pregnancy is an exclusion criterion, as the very specific characteristics of this population group would require a specific review.
Rationale for disease selection
The search is limited to diseases with high morbidity and mortality within each of the three disease groups:
Cancer type
Due to time constraints, we only evaluate those malignant neoplasms with the greatest mortality and incidence rates in Europe, which according to the European Cancer Information System [ 38 ] are breast, prostate, colorectum, lung, bladder, pancreas, liver, stomach, kidney, and corpus uteri. Additionally, cervix uteri and liver cancers will also be included due to their preventable nature and/or the existence of public health screening programs [ 30 , 31 ].
We evaluate the following main causes of deaths: ischemic heart disease (49.2% of all CVD deaths), stroke (35.2%) (this includes ischemic stroke, intracerebral haemorrhage and subarachnoid haemorrhage), hypertensive heart disease (6.2%), cardiomyopathy and myocarditis (1.8%), atrial fibrillation and flutter (1.7%), rheumatic heart disease (1.6%), non-rheumatic valvular heart disease (0.9%), aortic aneurism (0.9%), peripheral artery disease (0.4%) and endocarditis (0.4%) [ 6 ].
In this scoping review, specifically in the context of CVD, rheumatic heart disease and endocarditis are not considered because of their infectious aetiology. Arterial hypertension is a risk factor for many cardiovascular diseases and for the purposes of this review is considered as an intermediary disease that leads to CVD.
- Neurodegenerative diseases
The leading noncommunicable neurodegenerative causes of death are Alzheimer’s disease or dementia (20%), Parkinson’s disease (2.5%), motor neuron diseases (0.4%) and multiple sclerosis (0.2%) [ 8 ]. Alzheimer’s disease, vascular dementia, frontotemporal dementia and Lewy body disease will be specifically searched, following the pattern of European dementia prevalence studies [ 39 ]. Additionally, because amyotrophic lateral sclerosis is the most common motor neuron disease, it is also included in the search [ 8 , 40 , 41 ].
Rationale for context
Public health and clinical settings from any geographical location are being considered. The searches will only consider the period between January 2020 and mid-February 2023 due to time constraints.
Rationale for type of evidence
Qualitative studies are not considered since they cannot answer the research question. Editorials and opinion pieces, protocols, and conference abstracts will also be excluded. Clinical practice guidelines are not included since the information they contain should be in the original studies and in reviews on which they are based.
Pilot study
We did a pilot study to test and refine the search strategies, selection criteria and data extraction sheet as well as to get used to the software—Covidence [ 42 ]. The pilot study consisted of selecting from the results of the preliminary search matrix 100 papers in order of best fit to the topic, and 100 papers at random. The team comprised 15 individual reviewers (both in the pilot and final reviews) who met daily to revise, enhance, and reach consensus on the search matrices, criteria, and data extraction sheets.
Regarding the selected databases and the platforms used, we conducted various tests, including PubMed/MEDLINE and Ovid/MEDLINE, as well as Ovid/Embase and Elsevier/Embase. Ultimately, we chose Ovid as the platform for accessing both MEDLINE and Embase, utilizing thesaurus Mesh and EmTrees. We manually translated these thesauri to ensure consistency between them. Given that the review team was spread across the UK and Spain, we centralised the search results within the UK team's access to the Ovid license to ensure consistency. Additionally, using Ovid exclusively for accessing both MEDLINE and Embase streamlined the process and allowed for easier access to preprints, which represent the latest research in this rapidly evolving field.
Identification of research
The searches are being conducted in MEDLINE via Ovid, Embase via Ovid and Embase preprints via Ovid. We also explored the feasibility of searching in CDC-Authored Genomics and Precision Health Publications Databases [ 43 ] . However, the lack of advanced tools to refine the search, as well as the unavailability of bulk downloading prevented the inclusion of this data source. Nevertheless, a search with 15 records for each disease group showed a full overlap with MEDLINE and/or Embase.
Search strategy definition
An initial limited search of MEDLINE via PubMed and Ovid was undertaken to identify relevant papers on the topic. In this step, we identified keytext words in their titles and abstracts, as well as thesaurus terms. The SR-Accelerator, Citationchaser, and Yale Mesh Analyzer tools were used to assist in the construction of the search matrix. With all this information, we developed a full search strategy adapted for each included database and information source, optimised by research librarians.
Study evidence selection
The complete search strategies are shown in Additional file 3. The three searches are being conducted in parallel. When performing the search, no limits to the type of study or setting are being applied.
Following each search, all identified citations will be collated and uploaded into Covidence (Veritas Health Innovation, Melbourne, Australia, available at www.covidence.org ) with the citation details, and duplicates will be removed.
In the title-abstract and full-text screening phase, the first 10% of the papers will be evaluated by two independent reviewers (accounting for 200 or more papers in absolute numbers in the title-abstract phase). Then, a meeting to discuss discrepancies will lead to adjusting inclusion and exclusion criteria and to acquire consistency between reviewers’ decisions. After that, the full screening of the search results will be performed by a single reviewer. Disagreements that arise between reviewers at each stage of the selection process will be resolved through discussion, or with additional reviewers. We maintain an active forum to facilitate permanent contact among reviewers.
The results of the searches and the study inclusion processes will be reported and presented in a flow diagram following the PRISMA-ScR recommendations [ 22 ].
Expert consultation
The protocol has been refined after consultation with experts in each field (cancer, CVD, and neurodegenerative diseases) who gave input on the scope of the reviews regarding the diverse biomarkers, risk factors, outcomes, and types of prevention relevant to their fields of expertise. In addition, the search strategies have been peer-reviewed by a network of librarians (PRESS-forum in pressforum.pbworks.com) who kindly provided useful feedback.
Data extraction
We have developed a draft data extraction sheet, which is included as Additional file 4, based on the JBI recommendations [ 21 ]. Data extraction will include citation details, study design, population type, biomarker information (name, type, subtype, clinical utility, use of AI technology), disease (group, specific disease), prevention (primary or secondary, lifestyle if primary prevention), and subjective reviewer observations. The data extraction for all papers will be performed by two reviewers to ensure consistency in the classification of data.
Data analysis and presentation
The descriptive information about the studies collected in the previous phase will be coded according to predefined categories to allow the elaboration of visual summary maps that can allow readers and researchers to have a quick overview of their main results. As in the previous phases, this process will be carried out with the aid of Covidence.
Therefore, a summary of the extracted data will be presented in tables as well as in static and, especially, through interactive evidence gap maps (EGM) created using EPPI-Mapper [ 44 ], an open-access web application developed in 2018 by the Evidence for Policy and Practice Information and Coordinating Centre (EPPI-Centre) and Digital Solution Foundry, in partnership with the Campbell Collaboration, which has become the standard software for producing visual evidence gap maps.
Tables and static maps will be made by using R Studio, which will also be used to clean and prepare the database for its use in EPPI-Mapper by generating two Excel files: one containing the EGM structure (i.e. what will be the columns and rows of the visual table) and coding sets, and another containing the bibliographic references and their codes that reviewers had added. Finally, we will use a Python script to produce a file in JSON format, making it ready for importation into EPPI-Reviewer.
The maps are matrixes with biomarker categories/subcategories defining the rows and diseases serving as columns. They define cells, which contain small squares, each one representing each paper included in it. We will use a code of colours to reflect the study design. There will be also a second sublevel in the columns, depending on the map. Thus, for each group of diseases, we will produce three interactive EGMs: two for primary prevention and one for secondary prevention. For primary prevention, the first map will stratify the data to show whether any or which lifestyle has been considered in each paper in combination with the studied biomarker. The second map for primary prevention and the map for secondary prevention will include, as a second sublevel, the subpopulations in which the biomarker has been used or evaluated, which are disease-specific (i.e. cirrhosis for hepatic cancer) researched. The maps will also include filters that allow users to select records based on additional features, such as the use of artificial intelligence in the content of the papers. Furthermore, the EGM, which will be freely available online, will enable users to view and export selected bibliographic references and their abstracts. An example of these interactive maps with dummy data is provided in Additional file 5.
Finally, we will elaborate on two scientific reports for PROPHET. The main report, which will follow the Preferred Reporting Items for Systematic Reviews and Meta-Analyses extension for Scoping Reviews (PRISMA-ScR) recommendations, will summarise the results of the three scoping reviews, will provide a general and global interpretation of the results and will comment on their implication for the SRIA, and will discuss the limitations of the process. The second report will present the specific methodology for the dynamic maps.
This protocol summarises the procedure to carry out three parallel rapid scoping reviews to provide an overview of the available research and gaps in the literature on biomarkers for personalised primary and secondary prevention for the three most common chronic disease groups: cancer, CVD and neurodegenerative diseases. The result will be a common report for the three scoping reviews and the online publication of interactive evidence gap maps to facilitate data visualisation.
This work will be complemented, in a further step of the PROPHET project, by a subsequent mapping report on the scientific evidence for the clinical utility of biomarkers. Both reports are part of an overall mapping effort to characterise the current knowledge and environment around personalised preventive medicine. In this context, PROPHET will also map personalised prevention research programs, as well as bottlenecks and challenges in the adoption of personalised preventive approaches or in the involvement of citizens, patients, health professionals and policy-makers in personalised prevention. The overall results will contribute to the development of the SRIA concept paper, which will help define future priorities for personalised prevention research in the European Union.
In regard to this protocol, one of the strengths of this approach is that it can be applied in the three scoping reviews. This will improve the consistency and comparability of the results between them, allowing for better leveraging of efforts; it also will facilitate the coordination among the staff conducting the different reviews and will allow them to discuss them together, providing a more global perspective as needed for the SRIA. In addition, the collaboration of researchers with different backgrounds, the inclusion of librarians in the research team, and the specific software tools used have helped us to guarantee the quality of the work and have shortened the time invested in defining the final version of this protocol. Another strength is that we have conducted a pilot study to test and refine the search strategy, selection criteria and data extraction sheet. In addition, the selection of the platform of access to the bibliographic databases has been decided after a previous evaluation process (Ovid-MEDLINE versus PubMed MEDLINE, Ovid-Embase versus Elsevier-Embase, etc.).
Only 10% of the papers will undergo screening by two reviewers, and if time permits, we will conduct kappa statistics to assess reviewer agreement during the screening phases. Additionally, ongoing communication and the exchange and discussion of uncertainties will ensure a high level of consensus in the review process.
The main limitation of this work is the very broad field it covers: personalised prevention in all chronic diseases; however, we have tried to maintain decisions to limit it to the chronic diseases with the greatest impact on the population and in the last 3 years, making a rapid scoping review due to time constraints following recommendations from the Cochrane Rapid Review Methods Group [ 24 ]; however, as our aim is to identify gaps in the literature in an area of growing interest (personalisation and prevention), we believe that the records retrieved will provide a solid foundation for evaluating available literature. Additionally, systematic reviews, which may encompass studies predating 2020, have the potential to provide valuable insights beyond the temporal constraints of our search.
Thus, this protocol reflects the decisions set by the PROPHET's timetable, without losing the quality and rigour of the work. In addition, the data extraction phase will be done by two reviewers in 100% of the papers to ensure the consistency of the extracted data. Lastly, extending beyond these three scoping reviews, the primary challenge resides in amalgamating their findings with those from numerous other reviews within the project, ultimately producing a cohesive concept paper in the Strategy Research and Innovation Agenda (SRIA) for the European Union, firmly rooted in evidence-based conclusions.
Council of European Union. Council conclusions on personalised medicine for patients (2015/C 421/03). Brussels: European Union; 2015 dic. Report No.: (2015/C 421/03). Disponible en: https://eur-lex.europa.eu/legal-content/EN/TXT/PDF/?uri=CELEX:52015XG1217(01)&from=FR .
Goetz LH, Schork NJ. Personalized medicine: motivation, challenges, and progress. Fertil Steril. 2018;109(6):952–63.
Article PubMed PubMed Central Google Scholar
FDA-NIH Biomarker Working Group. BEST (Biomarkers, EndpointS, and other Tools) Resource. Silver Spring (MD): Food and Drug Administration (US); 2016 [citado 3 de febrero de 2023]. Disponible en: http://www.ncbi.nlm.nih.gov/books/NBK326791/ .
Porta M, Greenland S, Hernán M, dos Silva I S, Last JM. International Epidemiological Association, editores. A dictionary of epidemiology. 6th ed. Oxford: Oxford Univ. Press; 2014. p. 343.
Google Scholar
PROPHET. Project kick-off meeting. Rome. 2022.
Roth GA, Mensah GA, Johnson CO, Addolorato G, Ammirati E, Baddour LM, et al. Global burden of cardiovascular diseases and risk factors, 1990–2019. J Am College Cardiol. 2020;76(25):2982–3021.
Article Google Scholar
GBD 2019 Cancer Collaboration, Kocarnik JM, Compton K, Dean FE, Fu W, Gaw BL, et al. Cancer incidence, mortality, years of life lost, years lived with disability, and disability-adjusted life years for 29 cancer groups from 2010 to 2019: a systematic analysis for the global burden of disease study 2019. JAMA Oncol. 2022;8(3):420.
Feigin VL, Vos T, Nichols E, Owolabi MO, Carroll WM, Dichgans M, et al. The global burden of neurological disorders: translating evidence into policy. The Lancet Neurology. 2020;19(3):255–65.
Article PubMed Google Scholar
GBD 2019 Collaborators, Nichols E, Abd‐Allah F, Abdoli A, Abosetugn AE, Abrha WA, et al. Global mortality from dementia: Application of a new method and results from the Global Burden of Disease Study 2019. A&D Transl Res & Clin Interv. 2021;7(1). Disponible en: https://onlinelibrary.wiley.com/doi/10.1002/trc2.12200 . [citado 7 de febrero de 2023].
Eurostat. ec.europa.eu. Self-perceived health statistics. European health interview survey (EHIS). 2022. Disponible en: https://ec.europa.eu/eurostat/statistics-explained/index.php?title=Self-perceived_health_statistics . [citado 7 de febrero de 2023].
OECD/European Union. Health at a Glance: Europe 2022: State of Health in the EU Cycle. Paris: OECD Publishing; 2022. Disponible en: https://www.oecd-ilibrary.org/social-issues-migration-health/health-at-a-glance-europe-2022_507433b0-en .
Boccia S, Pastorino R, Ricciardi W, Ádány R, Barnhoorn F, Boffetta P, et al. How to integrate personalized medicine into prevention? Recommendations from the Personalized Prevention of Chronic Diseases (PRECeDI) Consortium. Public Health Genomics. 2019;22(5–6):208–14.
Visseren FLJ, Mach F, Smulders YM, Carballo D, Koskinas KC, Bäck M, et al. 2021 ESC Guidelines on cardiovascular disease prevention in clinical practice. Eur Heart J. 2021;42(34):3227–337.
World Health Organization. Global action plan on the public health response to dementia 2017–2025. Geneva: WHO Document Production Services; 2017. p. 27.
Norton S, Matthews FE, Barnes DE, Yaffe K, Brayne C. Potential for primary prevention of Alzheimer’s disease: an analysis of population-based data. Lancet Neurol. 2014;13(8):788–94.
Mentis AFA, Dardiotis E, Efthymiou V, Chrousos GP. Non-genetic risk and protective factors and biomarkers for neurological disorders: a meta-umbrella systematic review of umbrella reviews. BMC Med. 2021;19(1):6.
Schüz J, Espina C, Villain P, Herrero R, Leon ME, Minozzi S, et al. European Code against Cancer 4th Edition: 12 ways to reduce your cancer risk. Cancer Epidemiol. 2015;39:S1-10.
Tricco AC, Langlois EtienneV, Straus SE, Alliance for Health Policy and Systems Research, World Health Organization. Rapid reviews to strengthen health policy and systems: a practical guide. Geneva: World Health Organization; 2017. Disponible en: https://apps.who.int/iris/handle/10665/258698 . [citado 3 de febrero de 2023].
White H, Albers B, Gaarder M, Kornør H, Littell J, Marshall Z, et al. Guidance for producing a Campbell evidence and gap map. Campbell Systematic Reviews. 2020;16(4). Disponible en: https://onlinelibrary.wiley.com/doi/10.1002/cl2.1125 . [citado 3 de febrero de 2023].
Aromataris E, Munn Z. editores. JBI: JBI Manual for Evidence Synthesis; 2020.
Peters MDJ, Marnie C, Tricco AC, Pollock D, Munn Z, Alexander L, et al. Updated methodological guidance for the conduct of scoping reviews. JBI Evid Synth. 2020;18(10):2119–26.
Tricco AC, Lillie E, Zarin W, O’Brien KK, Colquhoun H, Levac D, et al. PRISMA Extension for Scoping Reviews (PRISMA-ScR): Checklist and Explanation. Ann Intern Med. 2018;169(7):467–73.
OSF. Open Science Framework webpage. Disponible en: https://osf.io/ . [citado 8 de febrero de 2023].
Garritty C, Gartlehner G, Nussbaumer-Streit B, King VJ, Hamel C, Kamel C, et al. Cochrane Rapid Reviews Methods Group offers evidence-informed guidance to conduct rapid reviews. Journal Clin Epidemiol. 2021;130:13–22.
Leon ME, Peruga A, McNeill A, Kralikova E, Guha N, Minozzi S, et al. European code against cancer, 4th edition: tobacco and cancer. Cancer Epidemiology. 2015;39:S20-33.
Anderson AS, Key TJ, Norat T, Scoccianti C, Cecchini M, Berrino F, et al. European code against cancer 4th edition: obesity, body fatness and cancer. Cancer Epidemiology. 2015;39:S34-45.
Barone BB, Yeh HC, Snyder CF, Peairs KS, Stein KB, Derr RL, et al. Long-term all-cause mortality in cancer patients with preexisting diabetes mellitus: a systematic review and meta-analysis. JAMA. 2008;300(23):2754–64.
Article CAS PubMed PubMed Central Google Scholar
Barone BB, Yeh HC, Snyder CF, Peairs KS, Stein KB, Derr RL, et al. Postoperative mortality in cancer patients with preexisting diabetes: systematic review and meta-analysis. Diabetes Care. 2010;33(4):931–9.
Noto H, Tsujimoto T, Sasazuki T, Noda M. Significantly increased risk of cancer in patients with diabetes mellitus: a systematic review and meta-analysis. Endocr Pract. 2011;17(4):616–28.
Villain P, Gonzalez P, Almonte M, Franceschi S, Dillner J, Anttila A, et al. European code against cancer 4th edition: infections and cancer. Cancer Epidemiology. 2015;39:S120-38.
Scoccianti C, Cecchini M, Anderson AS, Berrino F, Boutron-Ruault MC, Espina C, et al. European Code against Cancer 4th Edition: Alcohol drinking and cancer. Cancer Epidemiology. 2016;45:181–8.
El-Serag HB. Epidemiology of viral hepatitis and hepatocellular carcinoma. Gastroenterology. 2012;142(6):1264-1273.e1.
Li XY, Zhang M, Xu W, Li JQ, Cao XP, Yu JT, et al. Midlife modifiable risk factors for dementia: a systematic review and meta-analysis of 34 prospective cohort studies. CAR. 2020;16(14):1254–68.
Ford E, Greenslade N, Paudyal P, Bremner S, Smith HE, Banerjee S, et al. Predicting dementia from primary care records: a systematic review and meta-analysis Forloni G, editor. PLoS ONE. 2018;13(3):e0194735.
Xu W, Tan L, Wang HF, Jiang T, Tan MS, Tan L, et al. Meta-analysis of modifiable risk factors for Alzheimer’s disease. J Neurol Neurosurg Psychiatry. 2015;86(12):1299–306.
PubMed Google Scholar
Guo Y, Xu W, Liu FT, Li JQ, Cao XP, Tan L, et al. Modifiable risk factors for cognitive impairment in Parkinson’s disease: A systematic review and meta-analysis of prospective cohort studies. Mov Disord. 2019;34(6):876–83.
Jiménez-Jiménez FJ, Alonso-Navarro H, García-Martín E, Agúndez JAG. Alcohol consumption and risk for Parkinson’s disease: a systematic review and meta-analysis. J Neurol agosto de. 2019;266(8):1821–34.
ECIS European Cancer Information System. Data explorer | ECIS. 2023. Estimates of cancer incidence and mortality in 2020 for all cancer sites. Disponible en: https://ecis.jrc.ec.europa.eu/explorer.php?$0-0$1-AE27$2-All$4-2$3-All$6-0,85$5-2020,2020$7-7,8$CEstByCancer$X0_8-3$CEstRelativeCanc$X1_8-3$X1_9-AE27$CEstBySexByCancer$X2_8-3$X2_-1-1 . [citado 22 de febrero de 2023].
Bacigalupo I, Mayer F, Lacorte E, Di Pucchio A, Marzolini F, Canevelli M, et al. A systematic review and meta-analysis on the prevalence of dementia in Europe: estimates from the highest-quality studies adopting the DSM IV diagnostic criteria Bruni AC, editor. JAD. 2018;66(4):1471–81.
Barceló MA, Povedano M, Vázquez-Costa JF, Franquet Á, Solans M, Saez M. Estimation of the prevalence and incidence of motor neuron diseases in two Spanish regions: Catalonia and Valencia. Sci Rep. 2021;11(1):6207.
Ng L, Khan F, Young CA, Galea M. Symptomatic treatments for amyotrophic lateral sclerosis/motor neuron disease. Cochrane Neuromuscular Group, editor. Cochrane Database of Systematic Reviews. 2017;2017(1). Disponible en: http://doi.wiley.com/10.1002/14651858.CD011776.pub2 . [citado 13 de febrero de 2023].
Covidence systematic review software. Melbourne, Australia: Veritas Health Innovation; 2023. Disponible en: https://www.covidence.org .
Centre for Disease Control and Prevention. Public Health Genomics and Precision Health Knowledge Base (v8.4). 2023. Disponible en: https://phgkb.cdc.gov/PHGKB/specificPHGKB.action?action=about .
Digital Solution Foundry and EPPI Centre. EPPI Centre. UCL Social Research Institute: University College London; 2022.
Download references
Acknowledgements
We are grateful for the library support received from Teresa Carretero (Instituto de Salud Carlos III, ISCIII) and, from Concepción Campos-Asensio (Hospital Universitario de Getafe, Comité ejecutivo BiblioMadSalud) for the seminar on the Scoping Reviews methodology and for their continuous teachings through their social networks.
Also, we would like to thank Dr. Héctor Bueno (Centro Nacional de Investigaciones Cardiovasculares (CNIC), Hospital Universitario 12 de Octubre) and Dr. Pascual Sánchez (Fundación Centro de Investigación de Enfermedades Neurológicas (CIEN)) for their advice in their fields of expertise.
The PROPHET project has received funding from the European Union’s Horizon Europe research and innovation program under grant agreement no. 101057721. UK participation in Horizon Europe Project PROPHET is supported by UKRI grant number 10040946 (Foundation for Genomics & Population Health).
Author information
Plans-Beriso E and Babb-de-Villiers C contributed equally to this work.
Kroese M and Pérez-Gómez B contributed equally to this work.
Authors and Affiliations
Department of Epidemiology of Chronic Diseases, National Centre for Epidemiology, Instituto de Salud Carlos III, Madrid, Spain
E Plans-Beriso, C Barahona-López, P Diez-Echave, O R Hernández, E García-Ovejero, O Craciun, P Fernández-Navarro, N Fernández-Larrea, E García-Esquinas, M Pollan-Santamaria & B Pérez-Gómez
CIBER of Epidemiology and Public Health (CIBERESP), Madrid, Spain
E Plans-Beriso, D Petrova, C Barahona-López, P Diez-Echave, O R Hernández, N F Fernández-Martínez, P Fernández-Navarro, N Fernández-Larrea, E García-Esquinas, V Moreno, F Rodríguez-Artalejo, M J Sánchez, M Pollan-Santamaria & B Pérez-Gómez
PHG Foundation, University of Cambridge, Cambridge, UK
C Babb-de-Villiers, H Turner, L Blackburn & M Kroese
Instituto de Investigación Biosanitaria Ibs. GRANADA, Granada, Spain
D Petrova, N F Fernández-Martínez & M J Sánchez
Escuela Andaluza de Salud Pública (EASP), Granada, Spain
Cambridge University Medical Library, Cambridge, UK
National Library of Health Sciences, Instituto de Salud Carlos III, Madrid, Spain
V Jiménez-Planet
Oncology Data Analytics Program, Catalan Institute of Oncology (ICO), L’Hospitalet de Llobregat, Barcelona, 08908, Spain
Colorectal Cancer Group, ONCOBELL Program, Institut de Recerca Biomedica de Bellvitge (IDIBELL), L’Hospitalet de Llobregat, Barcelona, 08908, Spain
Department of Preventive Medicine and Public Health, Universidad Autónoma de Madrid, Madrid, Spain
F Rodríguez-Artalejo
IMDEA-Food Institute, CEI UAM+CSIC, Madrid, Spain
You can also search for this author in PubMed Google Scholar
Contributions
BPG and MK supervised and directed the project. EPB and CBV coordinated and managed the development of the project. CBL, PDE, ORH, CBV and EPB developed the search strategy. All authors reviewed the content, commented on the methods, provided feedback, contributed to drafts and approved the final manuscript.
Corresponding author
Correspondence to E Plans-Beriso .
Ethics declarations
Competing interests.
There are no conflicts of interest in this project.
Additional information
Publisher’s note.
Springer Nature remains neutral with regard to jurisdictional claims in published maps and institutional affiliations.
Supplementary Information
Additional file 1: glossary., additional file 2: glossary of biomarkers that may define high risk groups., additional file 3: search strategy., additional file 4: data extraction sheet., additional file 5: example of interactive maps in cancer and primary prevention., rights and permissions.
Open Access This article is licensed under a Creative Commons Attribution 4.0 International License, which permits use, sharing, adaptation, distribution and reproduction in any medium or format, as long as you give appropriate credit to the original author(s) and the source, provide a link to the Creative Commons licence, and indicate if changes were made. The images or other third party material in this article are included in the article's Creative Commons licence, unless indicated otherwise in a credit line to the material. If material is not included in the article's Creative Commons licence and your intended use is not permitted by statutory regulation or exceeds the permitted use, you will need to obtain permission directly from the copyright holder. To view a copy of this licence, visit http://creativecommons.org/licenses/by/4.0/ . The Creative Commons Public Domain Dedication waiver ( http://creativecommons.org/publicdomain/zero/1.0/ ) applies to the data made available in this article, unless otherwise stated in a credit line to the data.
Reprints and permissions
About this article
Cite this article.
Plans-Beriso, E., Babb-de-Villiers, C., Petrova, D. et al. Biomarkers for personalised prevention of chronic diseases: a common protocol for three rapid scoping reviews. Syst Rev 13 , 147 (2024). https://doi.org/10.1186/s13643-024-02554-9
Download citation
Received : 19 October 2023
Accepted : 03 May 2024
Published : 01 June 2024
DOI : https://doi.org/10.1186/s13643-024-02554-9
Share this article
Anyone you share the following link with will be able to read this content:
Sorry, a shareable link is not currently available for this article.
Provided by the Springer Nature SharedIt content-sharing initiative
- Personalised prevention
- Precision Medicine
- Precision prevention
- Cardiovascular diseases
- Chronic diseases
Systematic Reviews
ISSN: 2046-4053
- Submission enquiries: Access here and click Contact Us
- General enquiries: [email protected]
Thank you for visiting nature.com. You are using a browser version with limited support for CSS. To obtain the best experience, we recommend you use a more up to date browser (or turn off compatibility mode in Internet Explorer). In the meantime, to ensure continued support, we are displaying the site without styles and JavaScript.
- View all journals
- My Account Login
- Explore content
- About the journal
- Publish with us
- Sign up for alerts
- Open access
- Published: 05 June 2024
Machine learning predicts upper secondary education dropout as early as the end of primary school
- Maria Psyridou 1 ,
- Fabi Prezja 2 ,
- Minna Torppa 3 ,
- Marja-Kristiina Lerkkanen 3 ,
- Anna-Maija Poikkeus 3 &
- Kati Vasalampi 4
Scientific Reports volume 14 , Article number: 12956 ( 2024 ) Cite this article
Metrics details
- Computer science
- Human behaviour
Education plays a pivotal role in alleviating poverty, driving economic growth, and empowering individuals, thereby significantly influencing societal and personal development. However, the persistent issue of school dropout poses a significant challenge, with its effects extending beyond the individual. While previous research has employed machine learning for dropout classification, these studies often suffer from a short-term focus, relying on data collected only a few years into the study period. This study expanded the modeling horizon by utilizing a 13-year longitudinal dataset, encompassing data from kindergarten to Grade 9. Our methodology incorporated a comprehensive range of parameters, including students’ academic and cognitive skills, motivation, behavior, well-being, and officially recorded dropout data. The machine learning models developed in this study demonstrated notable classification ability, achieving a mean area under the curve (AUC) of 0.61 with data up to Grade 6 and an improved AUC of 0.65 with data up to Grade 9. Further data collection and independent correlational and causal analyses are crucial. In future iterations, such models may have the potential to proactively support educators’ processes and existing protocols for identifying at-risk students, thereby potentially aiding in the reinvention of student retention and success strategies and ultimately contributing to improved educational outcomes.
Introduction
Education is often heralded as the key to poverty reduction, economic prosperity, and individual empowerment, and it plays a pivotal role in shaping societies and fostering individual growth 1 , 2 , 3 . However, the specter of school dropout casts a long shadow, with repercussions extending far beyond the individual. Dropping out of school is not only a personal tragedy but also a societal concern; it leads to a lifetime of missed opportunities and reduced potential alongside broader social consequences, including increased poverty rates and reliance on public assistance. Existing literature has underscored the link between school dropout and diminished wages, unskilled labor market entry, criminal convictions, and early adulthood challenges, such as substance use and mental health problems 4 , 5 , 6 , 7 . The socioeconomic impacts, which range from reduced tax collections and heightened welfare costs to elevated healthcare and crime expenditures, signal the urgency of addressing this critical issue 8 . Therefore, understanding and preventing school dropout is crucial for both individual and societal advancement.
Beyond its economic impact, education differentiates individuals within the labor market and serves as a vehicle for social inclusion. Students’ abandonment of the pursuit of knowledge translates into social costs for society and profound personal losses. Dropping out during upper secondary education disrupts the transition to adulthood, impedes career integration, and compromises societal well-being 9 . The strong link between educational attainment and adult social status observed in Finland and globally 10 underscores the importance of upper secondary education as a gateway to higher education and the labor market.
An increase in school drop-out rates in many European countries 11 is leading to growing pockets of marginalized young people. In the European Union (EU), 9.6% of individuals between 18 and 24 years of age did not engage in education or training beyond the completion of lower secondary education 12 . This disconcerting statistic raises alarms about the challenge of preventing early exits from the educational journey. Finnish statistics 13 highlight that 0.5% of Finnish students drop out during lower secondary school, but this figure is considerably higher at the upper secondary level, with dropout rates of 13.3% in vocational school and 3.6% in general upper secondary school. Amid this landscape, there is a clear and pressing need to not only support out-of-school youths and dropouts but also identify potential dropouts early on and prevent their potential disengagement. In view of the far-reaching consequences of school dropout for individuals and societies, social policy initiatives have rightly prioritized preventive interventions.
Machine learning has emerged as a transformative technology across numerous domains, particularly promising for its capabilities in utilizing large datasets and leveraging non-linear relationships. Within machine learning, deep learning 14 has gained significant traction due to its ability to outperform traditional methods given larger data samples. Deep learning has played a significant role in advancements in fields such as medical computer vision 15 , 16 , 17 , 18 , 19 , 20 and, more recently, in large foundation models 21 , 22 , 23 , 24 . Although machine learning methods have significantly transformed various disciplines, their application in education remains relatively unexplored 25 , 26 .
In education, only a handful of studies have harnessed machine learning to automatically classify between cases of students dropping out from upper secondary education or continuing in education. Previous research in this field has been constrained by short-term approaches. For instance, some studies have focused on collecting and analyzing data within the same academic year 27 , 28 . Others have restricted their data collection exclusively to the upper secondary education phase 29 , 30 , 31 , while one study has expanded its dataset to include data collection of student traits across both lower and upper secondary school years 32 . Only one previous study has focused on predicting dropout within the next three years following the collection of trait data 33 , and another study aimed at predictions within the next 5 years 34 . However, the process of dropping out of school often begins in early school years and is marked by a gradual disengagement and disassociation from education 35 , 36 . These findings suggest that current machine learning models might need to incorporate data that spans further back into the past. In this study we extended this time horizon by leveraging a 13-year longitudinal dataset, utilizing features from kindergarten up to Grade 9 (age 15-16). In this study, we provide the first results for the automatic classification of upper secondary school dropout and non-dropout, using data available as early as the end of primary school.
Given that the process of dropping out of school often begins in early school years and may be influenced by a multitude of factors, our study utilized data from a comprehensive longitudinal study. We aimed to include a broad spectrum of traits that existing literature has shown to have a direct or indirect association with school dropout 37 , 38 , 39 . From the available variables in the dataset, we incorporated features covering family background (e.g. parental education, socio-economic status), individual factors (e.g. gender, school absences, burn-out), behavioral patterns (e.g. prosocial behaviors, hyperactivity), motivation and engagement metrics (e.g. self-concept, task value, teacher-student relationships), experiences of bullying, health behaviors (e.g. smoking, alcohol use), media usage, and academic and cognitive performance (e.g. reading fluency, arithmetic skills). By incorporating this diverse set of features, we aimed to capture a holistic view of the students’ educational journey from kindergarten through the end of lower secondary school.
This study is guided by two main research questions:
Can predictive models, developed using a comprehensive longitudinal dataset from kindergarten through Grade 9, accurately classify students’ upper secondary dropout and non-dropout status at age 19?
How does the performance of machine learning classifiers in predicting school dropout compare when utilizing data up to the end of primary school (Grade 6; age 12-13) versus data up to the end of lower secondary school (Grade 9)? Can model predictions be made as early as Grade 6 without significantly compromising accuracy?
In response to these questions, we hypothesized that a comprehensive longitudinal dataset would facilitate the development of predictive models that could accurately classify dropout and non-dropout status as early as Grade 6. However, we acknowledge that the inherent variability in individual dropout factors may constrain the overall performance of these models. Additionally, we posit that while models trained with data up to Grade 9 are likely to demonstrate higher predictive accuracy than those trained with data only up to Grade 6, accurate model predictions could still be achieved with data up to Grade 6.
We trained and validated machine learning models, with a 13-year longitudinal dataset, to create classification models for upper secondary school dropout. Four supervised classification algorithms were utilized: Balanced Random Forest (B-RandomForest), Easy Ensemble (Adaboost Ensemble), RSBoost (Adaboost), and the Bagging Decision Tree. Six-fold cross-validation was used for the evaluation of performance. Confusion matrices were calculated for each classifier to evaluate performance. The methodological research workflow is presented in Fig. 1 .

Proposed research workflow. Our process begins with data collection over 13 years, from kindergarten to the end of upper secondary education (Step 1), followed by data processing which includes cleaning and imputing missing feature values (Step 2). We then apply four machine learning models for dropout and non-dropout classification (Step 3), and evaluate these models using 6-fold cross-validation, focusing on performance metrics and ROC curves (Step 4).
This study used existing longitudinal data from the “First Steps” follow-up study 40 and its extension, the “School Path: From First Steps to Secondary and Higher Education” study 41 . The entire follow-up spanned a 13-year period, from kindergarten to the third (final) year of upper secondary education. In the “First Steps” study, approximately 2,000 children born in 2000 were followed 10 times from kindergarten (age 6–7) to the end of lower secondary school (Grade 9; age 15-16) in four municipalities around Finland (two medium-sized, one large, and one rural). The goal was to examine students’ learning, motivation, and problem behavior, including their academic performance, motivation and engagement, social skills, peer relations, and well-being, in different interpersonal contexts. The rate at which the contacted parents agreed to participate in the study ranged from 78% to 89% in the towns and municipalities - depending on the town or municipality. Ethnically and culturally, the sample was very homogeneous and representative of the Finnish population, and parental education levels were very close to the national distribution in Finland 42 . In the “School Path” study, the participants of the “First Steps” follow-up study and their new classmates ( \(N = 4160\) ) were followed twice after the transition to upper secondary education: in the first year (Grade 10; age 16-17) and in the third year (Grade 12; age 18-19).
The present study focused on those participants who took part in both the “First Steps” study and the “School Path” study. Data from three time points across three phases of the follow-up were used. Data collection for Time 1 (T1) took place in Fall 2006 and Spring 2007, when the participants entered kindergarten (age 6-7). Data collection for Time 2 (T2) took place during comprehensive school (ages 7-16), which extended from the beginning of primary school (Grade 1; age 7-8) in Fall 2007 to the end of the final year of the lower secondary school (Grade 9; age 15-16) in Spring 2016. For Time 3 (T3), data were collected at the end of 2019, 3.5 years after the start of upper secondary education. We focused on students who enrolled in either general upper secondary school (the academic track) or vocational school (the vocational track) following comprehensive school, as these tracks represent the most typical choices available for young individuals in Finland. Common reasons for not completing school within 3.5 years included students deciding to discontinue their education or not fulfilling specific requirements (e.g. failing mandatory courses) during their schooling.
At T1 and T2, questionnaires were administered to the participants in their classrooms during normal school days, and their academic skills were assessed through group-administered tasks. Questionnaires were administered to parents as well. At T3, register information on the completion of upper secondary education was collected from school registers. In Finland, the typical duration of upper secondary education is three years. For the data collection in comprehensive school (T1 and T2), written informed consent was obtained from the participants’ guardians. In the secondary phase (T3), the participants themselves provided written informed consent to confirm their voluntary participation. The ethical statements for the follow-up study were obtained in 2006 and 2018 from the Ethical Committee of the University of Jyväskylä.
The target variable in the 13-year follow-up was the participant’s status 3.5 years after starting upper secondary education, as determined from the school registers. Participants who had not completed upper secondary education by this time were coded as having dropped out. Initially, we considered the assessment of 586 features. However, as is common in longitudinal studies, missing values were identified in all of them. Features with more than 30% missing data were excluded from the analysis, and a total of 311 features were used (with one-hot encoding) (see Supplementary Table S3 ). These features covered family background (e.g. parental education, socio-economic status), individual factors (e.g. gender, absences from school, school burn-out), the individual’s behavior (e.g. prosocial behavior, hyperactivity), motivation (e.g. self-concept, task value), engagement (e.g. teacher-student relationships, class engagement), bullying (e.g. bullied, bullying), health behavior (e.g. smoking, alcohol use), media usage (e.g. use of media, phone, internet), cognitive skills (e.g. rapid naming, raven), and academic outcomes (i.e. reading fluency, reading comprehension, PISA scores, arithmetic, and multiplication). Figure 2 presents an overview of the features used while Fig. 3 summarizes the features used in the models, the grades and the corresponding ages for each grade, and the time points (T1, T2, T3) at which different assessments were conducted. The Supplementary Table S3 provides details about the features included.

Features domains used for the classification of education dropout and non-dropout. The model incorporated a set of 311 features, categorized into 10 domains: family background, individual factors, behavior, motivation, engagement, bullying experiences, health behavior, media usage, cognitive skills, and academic outcomes. Each domain encompassed a variety of measures.

Gantt chart summarizing the features used in the models, the grades and the corresponding ages for each grade, and the time points (T1, T2, T3) at which different assessments were conducted. Assessments from Grades 7 and 9 were not included in the models predicting dropout with data up to Grade 6.
Data processing
In our study, we employed a systematic approach to address missing values in the dataset. Initially, the percentage of missing data was calculated for each feature, and features exhibiting more than 30% missing values were excluded. For categorical features, imputation was performed using the most frequent value within each feature, while a median-based strategy was applied to numeric features. To ensure unbiased imputation, imputation values were derived from a temporary dataset where the majority class (i.e. non-dropout cases) was randomly sampled to match the size of the positive class (i.e. dropout cases).
- Machine learning
In our study, we utilized a range of balanced classifiers from the Imbalanced Learning Python package 43 for benchmarking. These classifiers were employed with their default hyperparameter settings. Our selection included Balanced Random Forest, Easy Ensemble (Adaboost Ensemble), RSBoost (Adaboost), and Bagging Decision Tree. Notably, the Balanced Random Forest classifier played a pivotal role in our study. We delve into its performance, specific configuration, and effectiveness in the following section. Below are descriptions of each classifier:
Balanced random forest : This classifier modifies the traditional random forest 44 approach by randomly under-sampling each bootstrap sample to achieve balance. In our study, we refer to the classifier as “B-RandomForest”.
Easy ensemble (Adaboost ensemble) : This classifier, known as EasyEnsemble 45 , is a collection of AdaBoost 46 learners that are trained on differently balanced bootstrap samples. The balancing is realized through random under-sampling. In our study, we refer to the classifier as “E-Ensemble”.
RSBoost (Adaboost) : This classifier integrates random under-sampling into the learning process of AdaBoost. It under-samples the sample at each iteration of the boosting algorithm. In our study, we refer to the classifier as “B-Boosting”.
Bagging decision tree : This classifier operates similarly to the standard Bagging 47 classifier in the scikit-learn library 48 using decision trees 49 , but it incorporates an additional step to balance the training set by using a sampler. In our study, we refer to the classifier as “B-Bagging”.
Each of these classifiers was selected for their specific strengths in handling class imbalances, a critical consideration of our study’s methodology. The next section elaborates on the performance and configurations of these classifiers, particularly B-RandomForest.
Random forest
The Random Forest (RF) method, introduced by Breiman in 2001 44 , is a machine learning approach that employs a collection of decision trees for prediction tasks. This method’s strength lies in its ensemble nature, where multiple “weak learners” (individual decision trees) combine to form a “strong learner” (the RF). Typically, decision trees in an RF make binary predictions based on various feature thresholds. The mathematical representation of a single decision tree’s prediction, ( \(T_d\) ) for an input vector \({\varvec{I}}\) is given by the following formula:
Here, n signifies the total nodes in the tree, \(v_i\) is the value predicted at the i -th node, \(f_i({\varvec{I}})\) is the i -th feature of the input vector \({\varvec{I}}\) , \(t_i\) stands for the threshold at the i -th node, and \(\delta\) represents the indicator function.
In an RF, the collective predictions from D individual decision trees are aggregated to form the final output. For regression problems, these outputs are typically averaged, whereas a majority vote (mode) approach is used for classification tasks. The prediction formula for an RF ( \(F_D\) ) on an input vector \({\varvec{I}}\) , is as follows:
In this equation, \(T_d({\varvec{I}})\) is the result from the d -th tree for input vector \({\varvec{I}}\) , and D is the count of decision trees within the forest. Random Forests are particularly effective for reducing overfitting compared to individual decision trees because they average results across a plethora of trees. In our study, we utilized 100 estimators with default settings from the scikit-learn library 48 .
Figures of merit
To evaluate the efficacy of our classification models, we employed a set of essential evaluative metrics, known as figures of merit.
The accuracy metric reflects the fraction of correct predictions (encompassing both true positive and true negative outcomes) in comparison to the overall number of predictions. The formula for accuracy is as follows:
Notably, given the balanced nature of our target data, the accuracy rate in our analysis equated to the definition of balanced accuracy.
Precision, or the positive predictive value, represents the proportion of true positive predictions out of all positive predictions made. The equation to determine precision is as follows:
Recall, which is alternatively called sensitivity, quantifies the percentage of actual positives that were correctly identified. The formula for calculating recall is as follows:
Specificity, also known as the true negative rate, measures the proportion of actual negatives that were correctly identified. The formula for specificity is as follows:
The F1 Score is the harmonic mean of precision and recall, providing a balance between the two metrics. It is particularly useful when the class distribution is imbalanced. The formula for the F1 Score is as follows:
In these formulas, \(\text{TP}\) represents true positives, \(\text{TN}\) stands for true negatives, \(\text{FP}\) refers to false positives, and \(\text{FN}\) denotes false negatives.
The balanced accuracy metric, as referenced by Brodersen et al. in 2010 50 , is a crucial measure in the context of classification tasks, particularly when dealing with imbalanced datasets. This metric is calculated as follows:
Essentially, this equation is an average of the recall computed for each class. The balanced accuracy metric is particularly effective since it accounts for class imbalance by applying balanced sample weights. In situations where the class weights are equal, this metric is directly analogous to the conventional accuracy metric. However, when class weights differ, the metric adjusts accordingly and weights each sample based on the true class prevalence ratio. This adjustment makes the balanced accuracy metric a more robust and reliable measure in scenarios where the class distribution is uneven. In line with this approach, we also employed the macro average of F1 and Precision in our computations.
A confusion matrix is a vital tool for understanding the performance of a classification model. In the context of our study, the performance of each classification model was encapsulated by binary confusion matrices. One matrix was a \(2\times 2\) table categorizing the predictions into four distinct outcomes. In the columns of the matrix,the classifications predicted by the model are represented and categorized as Predicted Positive and Predicted Negative. The rows signify the actual classifications, which are labeled as Actual Positive and Actual Negative.
The upper-left cell is the True Negatives (TN), which are instances where the model correctly predicted the negative class.
The upper-right cell is the False Positives (FP), which are cases where the model incorrectly predicted the positive class for actual negatives.
The lower-left cell is the False Negatives (FN), where the model incorrectly predicted the negative class for actual positives.
Finally, the lower-right cell shows ’True Positives (TP)’, where the model correctly predicted the positive class.
In our study, we aggregated the results from all iterations of the cross-validation process to generate normalized average binary confusion matrices. Normalization of the confusion matrix involves converting the raw counts of true positives, false positives, true negatives, and false negatives into proportions, which account for the varying class distributions. This approach allows for a more comparable and intuitive understanding of the model’s performance, especially when dealing with imbalanced datasets. By analyzing the normalized matrices, we obtain a comprehensive view of the model’s predictive performance across the entire cross-validation run, instead of relying on a single instance.
The AUC score is a widely used metric in machine learning for evaluating the performance of binary classification models. Derived from the receiver operating characteristic (ROC) curve, the AUC score quantifies a model’s ability to distinguish between two classes. The ROC curve plots the true positive rate (TPR) against the false positive rate (FPR) at various threshold settings. By varying the threshold that determines the classification decision, the ROC curve illustrates the trade-off between sensitivity (TPR) and specificity (1 - FPR). The TPR and FPR are defined as follows:
The AUC score represents the area under the ROC curve and ranges from 0 to 1. An AUC score of 0.50 is equivalent to random guessing and indicates that the model has no discriminative ability. On the other hand, a model with an AUC score of 1.0 demonstrates perfect classification. A higher AUC score suggests a better model performance in terms of distinguishing between the positive and negative classes.
Cross-validation
In this study, we employed the stratified K-fold cross-validation method with \(K=6\) to ascertain the robustness and generalizability of our approach 51 . This method partitions the dataset into k distinct subsets, or folds with an even distribution of class labels in each fold to reflect the overall dataset composition. For each iteration of the process, one of these folds is designated as the test set, while the remaining folds collectively form the training set. This cycle is iterated k times, with a different fold used as the test set each time. This technique was crucial in our study to ensure that the model’s performance would be consistently evaluated against varied data samples. One formal representation of this process with \(K=6\) , is as follows:
Here, \({\mathscr {M}}\) represents the machine learning model, \({\mathscr {D}}\) is the dataset, \({\mathscr {D}}_k^\text{train}\) and \({\mathscr {D}}_k^\text{test}\) respectively denote the training and test datasets for the \(k\) -th fold, and \(\text{Eval}\) is the evaluation function (e.g. accuracy, precision, recall).Our AUC plots have been generated using the forthcoming version of utility functions from the Deep Fast Vision Python Library 52 .
Ethics declarations
Ethical approval for the original data collection was obtained from the Ethical Committee of the University of Jyväskylä in 2006 and 2018, ensuring that all experiments were performed in accordance with relevant guidelines and regulations.
This study utilized a comprehensive 13-year longitudinal dataset from kindergarten through upper secondary education. We applied machine learning techniques with data up to Grade 9 (age 15-16), and subsequently with data up to Grade 6 (age 12–13), to classify registered upper secondary education dropout and non-drop out status. The dataset included a broad range of educational data on students’ academic and cognitive skills, motivation, behavior, and well-being. Given the imbalance observed in the target, we trained four classifiers: Balanced Random Forest, or B-RandomForest; Easy Ensemble (AdaBoost Ensemble), or E-Ensemble; RSBoost (Adaboost), or B-Boosting; and Bagging Decision Tree, or B-Bagging. The performance of each classifier was evaluated using six-fold cross-validation, as shown in Fig. 4 and Table 1 .

Confusion matrices for classifiers using data up to Grade 9 (first row) and up to Grade 6 (second row) averaged across all folds in six-fold cross-validation.
Our analysis using data up to Grade 9 (Fig. 4 , Table 1 ), revealed that the B-RandomForest classifier was the most effective, as it achieved the highest balanced mean accuracy (0.61). It also showed a recall rate of 0.60 (i.e. dropout class) and a specificity of 0.62 (i.e. non-dropout class). While the other classifiers matched or exceeded the specificity (B-Bagging: 0.78, E-Ensemble: 0.64, B-Boosting: 0.62), they underperformed in classifying true positives (B-Bagging: 0.32, B-Boosting: 0.50, E-Ensemble: 0.56) and had higher false negative rates (B-Bagging: 0.68, B-Boosting: 0.48, E-Ensemble: 0.45). The B-RandomForest classifier demonstrated a mean area under the curve (AUC) of 0.65, which indicated good discriminative ability (Fig. 5 ).

The ROC Curves for the B-RandomForest classifiers from cross-validation. Left: Curve for the B-RandomForest classifier trained using data up to Grade 9. Right: Curve for another classifier instance trained using data up to Grade 6.
We further obtained the feature scores for the B-RandomForest models across the six-fold cross-validation (Fig. 6 ; for the full list, refer to Supplementary Table S1 ). The top 20 rankings of the features (averaged across folds) fell into two domains: cognitive skills and academic outcomes. The Supplementary Table S3 provides a detailed description of all features. Academic outcomes appeared as the dominant domain and included reading fluency skills in Grades 1, 2, 3, 4, 7, and 9, reading comprehension in Grade 1, 2, 3, and 4, PISA reading comprehension outcomes, arithmetic skills in Grades 1, 2, 3, and 4, and multiplication skills in Grades 4 and 7. Among the top ranked features were two cognitive skills assessed in kindergarten: rapid automatized naming (RAN) which involved naming a series of visual stimuli consisting of pictures of objects (e.g. a ball, a house) as quickly as possible and vocabulary.

The top ranked 20 features for the B-RandomForest using data up to Grade 9. Features are listed in order of average score from top to bottom. The scores are averages from across all folds of the six-fold cross-validation. The features listed pertain to: READ2=Reading fluency, Grade 2; READ4=Reading fluency, Grade 4; READ3=Reading fluency, Grade 3; READ1=Reading fluency, Grade 1; RAN=Rapid Automatized Naming, Kindergarten; multSC7=Multiplication, Grade 4; ariSC4=Arithmetic, Grade 1 spring; ly1C5C=Reading comprehension, Grade 2; ariSC6=Arithmetic, Grade 3; ly4C7C=Reading comprehension, Grade 4; ly1C4C=Reading comprehension, Grade 1; ariSC7=Arithmetic, Grade 4; ariSC5=Arithmetic, Grade 2; ppvSC2=Vocabulary, Kindergarten; pisaC10total_sum=PISA, Grade 9; ariSC3=Arithmetic, Grade 1 fall; multSC9=Multiplication, Grade 7; READ9=Reading fluency, Grade 9; READ7=Reading fluency, Grade 7; ly1C6C=Reading comprehension, Grade 3.
Classifying school dropout using data up to grade 6
Using data from kindergarten up to Grade 6, we retrained the same four classifiers on this condensed dataset and evaluated their performance using a six-fold cross-validation method (Fig. 4 , Table 2 ). The B-RandomForest classifier performed the highest, with a balanced mean accuracy of 0.59. It showed a recall rate of 0.59 (dropout class) and a specificity of 0.59 (non-dropout class). In comparison, the other classifiers had higher specificities (B-Bagging: 0.76, B-Boosting: 0.62, E-Ensemble: 0.61) but lower true positives (recall rates: B-Bagging: 0.30, B-Boosting: 0.50, E-Ensemble: 0.56) and exhibited higher false negative rates (B-Bagging: 0.70, B-Boosting: 0.50, E-Ensemble: 0.44). The B-RandomForest classifier demonstrated an AUC of 0.61 (Fig. 5 ). The performance of this classifier was slightly lower but comparable to that of the classifier that used the more extensive dataset up to Grade 9.
We obtained the feature scores for the B-RandomForest models across the six-fold cross-validation with data up to Grade 6 (Fig. 7 ; for the full list, refer to Supplementary S2 ). The top 20 feature ranks included four domains: cognitive skills, academic outcomes, motivation, and family background. The Supplementary Information contains a detailed description of all features (Table S3 ). Similarly to the previous models academic outcomes ranked highest, consisting of reading fluency skills in Grades 1, 2, 3, 4, and 6, reading comprehension in Grades 1, 2, 4, and 6, arithmetic skills in Grades 1, 2, 3, and 4, and multiplication skills in Grades 4 and 6. Motivational factors, parental education level and two cognitive skills assessed in kindergarten - RAN and vocabulary - were also included in the ranking.

The top ranked 20 features for the B-RandomForest using data up to Grade 6. Features are listed in order of average score from top to bottom. The scores are averages from across all folds of the six-fold cross-validation. READ1=Reading fluency, Grade 1; READ2=Reading fluency, Grade 2; READ4=Reading fluency, Grade 4; multSC7=Multiplication, Grade 4; READ3=Reading fluency, Grade 3; RAN=Rapid Automatized Naming, Kindergarten; ariSC4=Arithmetic, Grade 1 spring; multSC8=Multiplication, Grade 6; READ6=Reading fluency, Grade 6; ariSC6=Arithmetic, Grade 3; ly1C5C=Reading comprehension, Grade 2; ariSC7=Arithmetic, Grade 4; ariSC5=Arithmetic, Grade 2; voedo=Parental education; ly4C7C=Reading comprehension, Grade 4; ly1C4C=Reading comprehension, Grade 1; ppvSC2=Vocabulary, Kindergarten; tavma_g6=Task value for math, Grade 6; ariSC3=Arithmetic, Grade 1 fall; ly6C8C=Reading comprehension, Grade 6.
This study signifies a major advancement in educational research, as it provides the first predictive models leveraging data from as early as kindergarten to forecast upper secondary school dropout. By utilizing a comprehensive 13-year longitudinal dataset from kindergarten through upper secondary education, we developed predictive models using the Balanced Random Forest (B-RandomForest) classifier, which effectively predicted both dropout and non-dropout cases from as early as Grade 6.
The classifier’s consistency was evident from its performance, which showed only a slight decrease in the AUC from 0.65 with data up to Grade 9 to 0.61 with data limited up to Grade 6. These results are particularly significant since they demonstrate predictive ability. Upon further validation and investigation, and by collecting more data, this approach may assist in the prediction of dropout and non-dropout as early as the end of primary school. However, it is important to note that the deployment and practical application of these findings must be preceded by further data collection, study, and validation. The developed predictive models offered some substantial indicators for future proactive approaches to help educators in their established protocols for identifying and supporting at-risk students. Such an approach could set a new precedent for enhancing student retention and success, potentially leading to transformative changes in educational systems and policies. While our predictive models marked a significant advancement in early automatic identification, it is important to recognize that this study is just the first step in a broader process.
The use of register data was a strength of this study because it allowed us to conceptualize dropout not merely as a singular event but as a comprehensive measure of on-time upper secondary education graduation. This approach is particularly relevant for students who do not graduate by the expected time, as it highlights their high risk of encountering problems in later education and the job market and underscores the need for targeted supplementary support 37 , 53 . This conceptualization of dropout offers several advantages 53 as it aligns with the nuanced nature of dropout and late graduation dynamics in educational practice. Additionally, it avoids mistakenly applying the dropout category to students who switch between secondary school tracks yet still graduate within the expected timeframe or drop out multiple times but ultimately graduate on time. From the perspective of the school system, delays in graduation incur substantial costs and necessitate intensive educational strategies. This nuanced understanding of dropout and non-dropout underpins the primary objective of our approach: to help empower educators with tools that can assist them in their evaluation of intervention needs.
In our study, we adopted a comprehensive approach to feature collection, acknowledging that the process of dropping out begins in early school years 35 and evolves through protracted disengagement and disassociation from education 36 . With over 300 features covering a wide array of domains - such as family background, individual factors, behavior, motivation, engagement, bullying, health behavior, media usage, cognitive skills, and academic outcomes - our dataset presents a challenge typical of high-dimensional data: the curse of dimensionality.This phenomenon, where the volume of the feature space grows exponentially with the number of features, can lead to sparsity of data and make pattern recognition more complex.
To address these challenges, we employed machine learning classifiers like Random Forest, which are particularly adept at managing high-dimensional data. Random Forest inherently performs a form of feature selection, which is crucial in high-dimensional spaces, by building each tree from a random subset of features. This approach not only helps in addressing the risk of overfitting but also enhances the model’s ability to identify intricate patterns in the data. This comprehensive analysis, with the use of machine learning, not only advances the methodology in automatic dropout and non-dropout prediction but also provides educators and policymakers with valuable tools and insights into the multifaceted nature of dropout and non-drop out identification from the perspective of machine learning classifiers.
In our study, the limited size of the positive class, namely the dropout cases, posed a significant challenge due to its impact on classification data balance. This imbalance steered our methodological decisions, leading us to forego both neural network synthesis and conventional oversampling techniques. Instead, we focused on using classification methods designed to handle highly imbalanced datasets. Our strategy was geared towards effectively addressing the issues inherent in working with severely imbalanced classification data.
Another important limitation to acknowledge pertains to the initial dataset and the subsequent handling of missing data. The study initially recruited around 2,000 kindergarten-age children and then invited their classmates to join the study at each subsequent educational stage. While this approach expanded the participant pool, it also resulted in a significant amount of missing data in many features. To maintain reliability, we excluded features with more than 30% missing values. This aspect of our methodological approach highlights the challenges of managing large-scale longitudinal data. Future studies might explore alternative strategies for handling missing data or investigate ways to include a broader range of features for feature selection, while mitigating the impact of incomplete data and the curse of dimensionality.
Despite these limitations, this study confronts the shortcomings of current research, particularly the focus on short-term horizons. Previous studies that have used machine learning to predict upper secondary education dropout have operated within limited timeframes - by collecting data on student traits and dropout cases within the same academic year 27 , 28 , limiting the collection of data on student traits to upper secondary education 29 , 30 , 31 , and by collecting data on student traits during both lower and upper secondary school years 32 . Two previous studies have focused on predicting dropout within three years 33 and five years 34 , respectively, of collecting the data. The present study has extended this horizon by leveraging a 13-year longitudinal dataset, utilizing features from kindergarten, and predicting upper secondary school dropout and non-dropout as early as the end of primary school.
Our study identified a set of top features from Grades 1 to 4 that were highlighted by the Random Forest classifier as influential in predicting school dropout or non-dropout status. These features included aspects like reading fluency, reading comprehension, and arithmetic skills. These top feature rankings did not significantly change with data up to Grades 9 and 6. It is important to note that these features were identified based on their utility in improving the model’s predictions within the dataset and cross-validation and should not be interpreted as causal or correlational factors for dropout and non-dropout rates. Given these limitations, and considering known across-time feature correlations 54 , 55 , 56 , 57 , 58 , 59 , we find it pertinent to suggest further speculative discussions of this ranking consistency between early and later academic grades. If, upon further data collection, validation, and correlational and causal analysis this kind of ranking profile is re-established and validated, it could indicate that early proficiency in these key academic areas could potentially be an important factor influencing students’ educational trajectory and dropout risk.
In conclusion, this study represented a significant leap forward in educational research by developing predictive models that automatically distinguished between dropouts and non-dropouts as early as Grade 6. Utilizing a comprehensive 13-year longitudinal dataset, our research enriches existing knowledge of automatic school dropout and non-dropout detection and surpasses the time-frame confines of prior studies. While incorporating data up to Grade 9 enhanced predictive accuracy, the primary aim of our study was to predict potential school dropout status at an early stage. The Balanced Random Forest classifier demonstrated proficiency across educational stages. Although confronted with challenges such as handling missing data and dealing with small positive class sizes, our methodological approach was meticulously designed to address such issues.
The developed predictive models demonstrate potential for further investigation. Given that our study predominantly utilized data from the Finnish educational system, it is not clear how the classifiers would perform with different populations. Additional data, including data from populations from different demographic and educational contexts, and further validation using independent test sets are essential. Further independent correlational and causal analyses are also crucial. In future iterations, such models may have the potential to proactively support educators’ processes and existing protocols for identifying at-risk students, thereby potentially aiding in the reinvention of student retention and success strategies, and ultimately contributing to improved educational outcomes.
Data availability
The datasets generated during and/or analysed during the current study are available from the corresponding author on reasonable request.
Huisman, J. & Smits, J. Keeping children in school: Effects of household and context characteristics on school dropout in 363 districts of 30 developing countries. SAGE Open 5 , 2158244015609666. https://doi.org/10.1177/2158244015609666 (2015).
Article Google Scholar
Breton, T. R. Can institutions or education explain world poverty? An augmented Solow model provides some insights. J. Socio-Econ. 33 , 45–69. https://doi.org/10.1016/j.socec.2003.12.004 (2004).
The World Bank. The Human Capital Index 2020 Update: Human Capital in the Time of COVID-19 (The World Bank, 2021).
Google Scholar
Bäckman, O. High school dropout, resource attainment, and criminal convictions. J. Res. Crime Delinq. 54 , 715–749. https://doi.org/10.1177/0022427817697441 (2017).
Bjerk, D. Re-examining the impact of dropping out on criminal and labor outcomes in early adulthood. Econ. Educ. Rev. 31 , 110–122. https://doi.org/10.1016/j.econedurev.2011.09.003 (2012).
Campolieti, M., Fang, T. & Gunderson, M. Labour market outcomes and skill acquisition of high-school dropouts. J. Labor Res. 31 , 39–52. https://doi.org/10.1007/s12122-009-9074-5 (2010).
Dragone, D., Migali, G. & Zucchelli, E. High school dropout and the intergenerational transmission of crime. IZA Discuss. Paper https://doi.org/10.2139/ssrn.3794075 (2021).
Catterall, J. S. The societal benefits and costs of school dropout recovery. Educ. Res. Int. 2011 , 957303. https://doi.org/10.1155/2011/957303 (2011).
Freudenberg, N. & Ruglis, J. Reframing school dropout as a public health issue. Prev. Chronic Dis. 4 , A107 (2007).
PubMed PubMed Central Google Scholar
Kallio, J. M., Kauppinen, T. M. & Erola, J. Cumulative socio-economic disadvantage and secondary education in Finland. Eur. Sociol. Rev. 32 , 649–661. https://doi.org/10.1093/esr/jcw021 (2016).
Gubbels, J., van der Put, C. E. & Assink, M. Risk factors for school absenteeism and dropout: A meta-analytic review. J. Youth Adolesc. 48 , 1637–1667. https://doi.org/10.1007/s10964-019-01072-5 (2019).
Article PubMed PubMed Central Google Scholar
EUROSTAT. Early leavers from education and training (2021).
Official Statistics of Finland (OSF). Discontinuation of education (2022).
LeCun, Y., Bengio, Y. & Hinton, G. Deep learning. Nature 521 , 436–444 (2015).
Article ADS CAS PubMed Google Scholar
Esteva, A. et al. Dermatologist-level classification of skin cancer with deep neural networks. Nature 542 , 115–118. https://doi.org/10.1038/nature21056 (2017).
Article ADS CAS PubMed PubMed Central Google Scholar
Liu, X. et al. A comparison of deep learning performance against health-care professionals in detecting diseases from medical imaging: A systematic review and meta-analysis. Lancet Digit. Health 1 , e271–e297. https://doi.org/10.1016/S2589-7500(19)30123-2 (2019).
Article PubMed Google Scholar
Prezja, F., Annala, L., Kiiskinen, S., Lahtinen, S. & Ojala, T. Synthesizing bidirectional temporal states of knee osteoarthritis radiographs with cycle-consistent generative adversarial neural networks. Preprint at http://arxiv.org/abs/2311.05798 (2023).
Prezja, F., Paloneva, J., Pölönen, I., Niinimäki, E. & Äyrämö, S. DeepFake knee osteoarthritis X-rays from generative adversarial neural networks deceive medical experts and offer augmentation potential to automatic classification. Sci. Rep. 12 , 18573. https://doi.org/10.1038/s41598-022-23081-4 (2022).
Prezja, F. et al. Improving performance in colorectal cancer histology decomposition using deep and ensemble machine learning. Preprint at http://arxiv.org/abs/2310.16954 (2023).
Topol, E. J. High-performance medicine: The convergence of human and artificial intelligence. Nat. Med. 25 , 44–56. https://doi.org/10.1038/s41591-018-0300-7 (2019).
Article CAS PubMed Google Scholar
Wornow, M. et al. The shaky foundations of clinical foundation models: A survey of large language models and foundation models for emrs. Preprint at http://arxiv.org/abs/2303.12961 (2023).
Peng, Z. et al. Kosmos-2: Grounding multimodal large language models to the world. Preprint at http://arxiv.org/abs/2306.14824 (2023).
Livne, M. et al. nach0: Multimodal natural and chemical languages foundation model. Preprint at http://arxiv.org/abs/2311.12410 (2023).
Luo, Y. et al. Biomedgpt: Open multimodal generative pre-trained transformer for biomedicine. Preprint at http://arxiv.org/abs/2308.09442 (2023).
Bernardo, A. B. I. et al. Profiling low-proficiency science students in the Philippines using machine learning. Humanit. Soc. Sci. Commun. 10 , 192. https://doi.org/10.1057/s41599-023-01705-y (2023).
Bilal, M., Omar, M., Anwar, W., Bokhari, R. H. & Choi, G. S. The role of demographic and academic features in a student performance prediction. Sci. Rep. 12 , 12508. https://doi.org/10.1038/s41598-022-15880-6 (2022).
Krüger, J. G. C., Alceu de Souza, B. J. & Barddal, J. P. An explainable machine learning approach for student dropout prediction. Expert Syst. Appl. 233 , 120933. https://doi.org/10.1016/j.eswa.2023.120933 (2023).
Sara, N.-B., Halland, R., Igel, C. & Alstrup, S. High-school dropout prediction using machine learning: A danish large-scale study. In ESANN , vol. 2015, 23rd (2015).
Chung, J. Y. & Lee, S. Dropout early warning systems for high school students using machine learning. Child. Youth Serv. Rev. 96 , 346–353. https://doi.org/10.1016/j.childyouth.2018.11.030 (2019).
Lee, S. & Chung, J. Y. The machine learning-based dropout early warning system for improving the performance of dropout prediction. Appl. Sci. https://doi.org/10.3390/app9153093 (2019).
Sansone, D. Beyond early warning indicators: High school dropout and machine learning. Oxf. Bull. Econ. Stat. 81 , 456–485. https://doi.org/10.1111/obes.12277 (2019).
Aguiar, E. et al. Who, when, and why: A machine learning approach to prioritizing students at risk of not graduating high school on time. In Proc. of the Fifth International Conference on Learning Analytics And Knowledge , LAK ’15, 93–102, https://doi.org/10.1145/2723576.2723619 (Association for Computing Machinery, New York, NY, USA, 2015).
Colak, O. Z. et al. School dropout prediction and feature importance exploration in Malawi using household panel data: Machine learning approach. J. Comput. Soc. Sci. 6 , 245–287. https://doi.org/10.1007/s42001-022-00195-3 (2023).
Sorensen, L. C. “Big Data’’ in educational administration: An application for predicting school dropout risk. Educ. Adm. Q. 55 , 404–446. https://doi.org/10.1177/0013161X18799439 (2019).
Schoeneberger, J. A. Longitudinal attendance patterns: Developing high school dropouts. Clear. House J. Educ. Strat. Issues Ideas 85 , 7–14. https://doi.org/10.1080/00098655.2011.603766 (2012).
Balfanz, R., Herzog, L., Douglas, I. & Mac, J. Preventing student disengagement and keeping students on the graduation path in urban middle-grades schools: Early identification and effective interventions. Educ. Psychol. 42 , 223–235. https://doi.org/10.1080/00461520701621079 (2007).
Rumberger, R. W. Why Students Drop Out of High School and What Can Be Done About It (Harvard University Press, 2012).
De Witte, K., Cabus, S., Thyssen, G., Groot, W. & van Den Brink, H. M. A critical review of the literature on school dropout. Educ. Res. Rev. 10 , 13–28 (2013).
Esch, P. et al. The downward spiral of mental disorders and educational attainment: A systematic review on early school leaving. BMC Psychiatry 14 , 1–13 (2014).
Lerkkanen, M.-K. et al. The first steps study [alkuportaat] (2006-2016).
Vasalampi, K. & Aunola, K. The school path: From first steps to secondary and higher education study [koulupolku: Alkuportailta jatko-opintoihin] (2016).
Official Statistics of Finland (OSF). Statistical databases (2007).
Lemaître, G., Nogueira, F. & Aridas, C. K. Imbalanced-learn: A python toolbox to tackle the curse of imbalanced datasets in machine learning. J. Mach. Learn. Res. 18 , 1–5 (2017).
Breiman, L. Random forests. Mach. Learn. 45 , 5–32 (2001).
Liu, X.-Y., Wu, J. & Zhou, Z.-H. Exploratory undersampling for class-imbalance learning. IEEE Trans. Syst. Man Cybern. B (Cybernetics) 39 , 539–550 (2008).
PubMed Google Scholar
Freund, Y. & Schapire, R. E. A decision-theoretic generalization of on-line learning and an application to boosting. J. Comput. Syst. Sci. 55 , 119–139 (1997).
Article MathSciNet Google Scholar
Breiman, L. Bagging predictors. Mach. Learn. 24 , 123–140 (1996).
Pedregosa, F. et al. Scikit-learn: Machine learning in Python. J. Mach. Learn. Res. 12 , 2825–2830 (2011).
MathSciNet Google Scholar
Quinlan, J. R. Induction of decision trees. Mach. Learn. 1 , 81–106 (1986).
Brodersen, K. H., Ong, C. S., Stephan, K. E. & Buhmann, J. M. The balanced accuracy and its posterior distribution. In 2010 20th international conference on pattern recognition , 3121–3124 (IEEE, 2010).
Kohavi, R. et al. A study of cross-validation and bootstrap for accuracy estimation and model selection. Ijcai 14 , 1137–1145 (1995).
Prezja, F. Deep fast vision: A python library for accelerated deep transfer learning vision prototyping. Preprint at http://arxiv.org/abs/2311.06169 (2023).
Knowles, J. E. Of needles and haystacks: Building an accurate statewide dropout early warning system in Wisconsin. J. Educ. Data Min. 7 , 18–67. https://doi.org/10.5281/zenodo.3554725 (2015).
Aunola, K., Leskinen, E., Lerkkanen, M.-K. & Nurmi, J.-E. Developmental dynamics of math performance from preschool to Grade 2. J. Educ. Psychol. 96 , 699–713. https://doi.org/10.1037/0022-0663.96.4.699 (2004).
Ricketts, J., Lervåg, A., Dawson, N., Taylor, L. A. & Hulme, C. Reading and oral vocabulary development in early adolescence. Sci. Stud. Read. 24 , 380–396. https://doi.org/10.1080/10888438.2019.1689244 (2020).
Verhoeven, L. & van Leeuwe, J. Prediction of the development of reading comprehension: A longitudinal study. Appl. Cogn. Psychol. 22 , 407–423. https://doi.org/10.1002/acp.1414 (2008).
Khanolainen, D. et al. Longitudinal effects of the home learning environment and parental difficulties on reading and math development across Grades 1–9. Front. Psychol. https://doi.org/10.3389/fpsyg.2020.577981 (2020).
Psyridou, M. et al. Developmental profiles of arithmetic fluency skills from grades 1 to 9 and their early identification. Dev. Psychol. 59 , 2379–2396. https://doi.org/10.1037/dev0001622 (2023).
Psyridou, M. et al. Developmental profiles of reading fluency and reading comprehension from grades 1 to 9 and their early identification. Dev. Psychol. 57 , 1840–1854. https://doi.org/10.1037/dev0000976 (2021).
Download references
Acknowledgements
The First Steps Study was funded by by grants from the Academy of Finland (Grant numbers: 213486, 263891, 268586, 292466, 276239, 284439, and 313768). The School Path study was funded by grants from Academy of Finland (Grant numbers: 299506 and 323773).This research was also partly funded by the Strategic Research Council (SRC) established within the Academy of Finland (Grant numbers: 335625, 335727, 345196, 358490, and 358250 for the project CRITICAL and Grant numbers: 352648, 353392 for the project Right to Belong). In addition, Maria Psyridou was supported by the Academy of Finland (Grant number: 339418).
Author information
Authors and affiliations.
Department of Psychology, University of Jyväskylä, 40014, Jyväskylä, Finland
Maria Psyridou
Faculty of Information Technology, University of Jyväskylä, 40014, Jyväskylä, Finland
Fabi Prezja
Department of Teacher Education, University of Jyväskylä, 40014, Jyväskylä, Finland
Minna Torppa, Marja-Kristiina Lerkkanen & Anna-Maija Poikkeus
Department of Education, University of Jyväskylä, 40014, Jyväskylä, Finland
Kati Vasalampi
You can also search for this author in PubMed Google Scholar
Contributions
M.P. conceived the experiment, was involved in data curation, and analysed the results. F.P. was involved in data curation and analysed the results. M.K.L. was involved in data collection. A.M.P. was involved in data collection. M.T. conceived the experiment, was involved in data curation and data collection. K.V. conceived the experiment and was involved in data curation and data collection. All authors reviewed the manuscript.
Corresponding author
Correspondence to Maria Psyridou .
Competing interests
The authors declare no competing interests.
Additional information
Publisher's note.
Springer Nature remains neutral with regard to jurisdictional claims in published maps and institutional affiliations.
Supplementary Information
Supplementary information., rights and permissions.
Open Access This article is licensed under a Creative Commons Attribution 4.0 International License, which permits use, sharing, adaptation, distribution and reproduction in any medium or format, as long as you give appropriate credit to the original author(s) and the source, provide a link to the Creative Commons licence, and indicate if changes were made. The images or other third party material in this article are included in the article’s Creative Commons licence, unless indicated otherwise in a credit line to the material. If material is not included in the article’s Creative Commons licence and your intended use is not permitted by statutory regulation or exceeds the permitted use, you will need to obtain permission directly from the copyright holder. To view a copy of this licence, visit http://creativecommons.org/licenses/by/4.0/ .
Reprints and permissions
About this article
Cite this article.
Psyridou, M., Prezja, F., Torppa, M. et al. Machine learning predicts upper secondary education dropout as early as the end of primary school. Sci Rep 14 , 12956 (2024). https://doi.org/10.1038/s41598-024-63629-0
Download citation
Received : 27 February 2024
Accepted : 30 May 2024
Published : 05 June 2024
DOI : https://doi.org/10.1038/s41598-024-63629-0
Share this article
Anyone you share the following link with will be able to read this content:
Sorry, a shareable link is not currently available for this article.
Provided by the Springer Nature SharedIt content-sharing initiative
- Education dropout
- Longitudinal data
- Upper secondary education
- Comprehensive education
- Kindergarten
- Academic outcomes
By submitting a comment you agree to abide by our Terms and Community Guidelines . If you find something abusive or that does not comply with our terms or guidelines please flag it as inappropriate.
Quick links
- Explore articles by subject
- Guide to authors
- Editorial policies
Sign up for the Nature Briefing: AI and Robotics newsletter — what matters in AI and robotics research, free to your inbox weekly.

IMAGES
VIDEO
COMMENTS
Secondary research is a research method that uses data that was collected by someone else. In other words, whenever you conduct research using data that already exists, you are conducting secondary research. On the other hand, any type of research that you undertake yourself is called primary research. Example: Secondary research.
Secondary Data. Definition: Secondary data refers to information that has been collected, processed, and published by someone else, rather than the researcher gathering the data firsthand. This can include data from sources such as government publications, academic journals, market research reports, and other existing datasets. Secondary Data Types
Secondary research, also known as desk research, is a research method that involves compiling existing data sourced from a variety of channels. This includes internal sources (e.g.in-house research) or, more commonly, external sources (such as government statistics, organizational bodies, and the internet).
Sources of Secondary Data. Sources of secondary data include books, personal sources, journals, newspapers, websitess, government records etc. Secondary data are known to be readily available compared to that of primary data. It requires very little research and needs for manpower to use these sources.
Introduction. Secondary data analysis is a valuable research approach that can be used to advance knowledge across many disciplines through the use of quantitative, qualitative, or mixed methods data to answer new research questions ( Polit & Beck, 2021 ). This research method dates to the 1960s and involves the utilization of existing or ...
5. Advantages of secondary data. Secondary data is suitable for any number of analytics activities. The only limitation is a dataset's format, structure, and whether or not it relates to the topic or problem at hand. When analyzing secondary data, the process has some minor differences, mainly in the preparation phase.
So, rightly secondary research is also termed " desk research ", as data can be retrieved from sitting behind a desk. The following are popularly used secondary research methods and examples: 1. Data Available on The Internet. One of the most popular ways to collect secondary data is the internet.
Secondary data analysis refers to the analysis of existing data collected by others. Secondary analysis affords researchers the opportunity to investigate research questions using large-scale data sets that are often inclusive of under-represented groups, while saving time and resources.
Secondary analysis of data collected by another researcher for a different purpose, or SDA, is increasing in the medical and social sciences. This is not surprising, given the immense body of health care-related research performed worldwide and the potential beneficial clinical implications of the timely expansion of primary research (Johnston, 2014; Tripathy, 2013).
Secondary research. Secondary research uses research and data that has already been carried out. It is sometimes referred to as desk research. It is a good starting point for any type of research as it enables you to analyse what research has already been undertaken and identify any gaps. You may only need to carry out secondary research for ...
Common secondary research methods include data collection through the internet, libraries, archives, schools and organizational reports. Online Data. Online data is data that is gathered via the internet. In recent times, this method has become popular because the internet provides a large pool of both free and paid research resources that can ...
Step 3: Design your research process. After defining your statement of purpose, the next step is to design the research process. For primary data, this involves determining the types of data you want to collect (e.g. quantitative, qualitative, or both) and a methodology for gathering them. For secondary data analysis, however, your research ...
Secondary analysis of qualitative data is a topic unto itself and is not discussed in this volume. The interested reader is referred to references such as James and Sorenson (2000) and Heaton (2004). The choice of primary or secondary data need not be an either/or ques-tion. Most researchers in epidemiology and public health will work with both ...
This paper, therefore, presents a new step-by-step research methodology for using publicly available secondary data to mitigate the risks associated with using secondary qualitative data analysis. We set a clear distinction between overall research methodology and the data analysis method.
Secondary Data Research Methods The methods for conducting secondary data research typically involve finding and studying published research. There are several ways you can do this, including: Finding the data online: Many market research websites exist, as do blogs and other data analysis websites. Some are free, though some charge fees.
In simple terms, secondary data is every. dataset not obtained by the author, or "the analysis. of data gathered b y someone else" (Boslaugh, 2007:IX) to be more sp ecific. Secondary data may ...
Bibliographies of these sources can lead to the discovery of further resources to enhance research for organizations. There are two common types of secondary data: Internal data and External data. Internal data is the information that has been stored or organized by the organization itself. External data is the data organized or collected by ...
SDA involves investigations where data collected for a previous study is analyzed - either by the same researcher(s) or different researcher(s) - to explore new questions or use different analysis strategies that were not a part of the primary analysis (Szabo and Strang, 1997).For research involving quantitative data, SDA, and the process of sharing data for the purpose of SDA, has become ...
Secondary data refers to data that is collected by someone other than the primary user. Common sources of secondary data for social science include censuses, information collected by government departments, organizational records and data that was originally collected for other research purposes. Primary data, by contrast, are collected by the investigator conducting the research.
Secondary analysis is a research methodology by which researchers use pre-existing data in order to investigate new questions or for the verification of the findings of previous works (Heaton, 2019).
the online version will vary from the pagination of the print book. 1. 2. Secondary data is usually defined in opposition to primary data. The latter is directly obtained. from first-hand sources ...
Secondary data analysis. Secondary analysis refers to the use of existing research data to find answer to a question that was different from the original work ( 2 ). Secondary data can be large scale surveys or data collected as part of personal research. Although there is general agreement about sharing the results of large scale surveys, but ...
When doing secondary research, researchers use and analyze data from primary research sources. Secondary research is widely used in many fields of study and industries, such as legal research and market research. In the sciences, for instance, one of the most common methods of secondary research is a systematic review.
In recent years, innovative health research has moved quickly towards a new paradigm. The ability to analyse and process previously unseen sources and amounts of data, e.g. environmental, clinical, socio-demographic, epidemiological, and 'omics-derived, has created opportunities in the understanding and prevention of chronic diseases, and in the development of targeted therapies that can ...
Proposed research workflow. Our process begins with data collection over 13 years, from kindergarten to the end of upper secondary education (Step 1), followed by data processing which includes ...