- Privacy Policy
Home » Research Methodology – Types, Examples and writing Guide

Research Methodology – Types, Examples and writing Guide
Table of Contents

Research Methodology
Definition:
Research Methodology refers to the systematic and scientific approach used to conduct research, investigate problems, and gather data and information for a specific purpose. It involves the techniques and procedures used to identify, collect , analyze , and interpret data to answer research questions or solve research problems . Moreover, They are philosophical and theoretical frameworks that guide the research process.
Structure of Research Methodology
Research methodology formats can vary depending on the specific requirements of the research project, but the following is a basic example of a structure for a research methodology section:
I. Introduction
- Provide an overview of the research problem and the need for a research methodology section
- Outline the main research questions and objectives
II. Research Design
- Explain the research design chosen and why it is appropriate for the research question(s) and objectives
- Discuss any alternative research designs considered and why they were not chosen
- Describe the research setting and participants (if applicable)
III. Data Collection Methods
- Describe the methods used to collect data (e.g., surveys, interviews, observations)
- Explain how the data collection methods were chosen and why they are appropriate for the research question(s) and objectives
- Detail any procedures or instruments used for data collection
IV. Data Analysis Methods
- Describe the methods used to analyze the data (e.g., statistical analysis, content analysis )
- Explain how the data analysis methods were chosen and why they are appropriate for the research question(s) and objectives
- Detail any procedures or software used for data analysis
V. Ethical Considerations
- Discuss any ethical issues that may arise from the research and how they were addressed
- Explain how informed consent was obtained (if applicable)
- Detail any measures taken to ensure confidentiality and anonymity
VI. Limitations
- Identify any potential limitations of the research methodology and how they may impact the results and conclusions
VII. Conclusion
- Summarize the key aspects of the research methodology section
- Explain how the research methodology addresses the research question(s) and objectives
Research Methodology Types
Types of Research Methodology are as follows:
Quantitative Research Methodology
This is a research methodology that involves the collection and analysis of numerical data using statistical methods. This type of research is often used to study cause-and-effect relationships and to make predictions.
Qualitative Research Methodology
This is a research methodology that involves the collection and analysis of non-numerical data such as words, images, and observations. This type of research is often used to explore complex phenomena, to gain an in-depth understanding of a particular topic, and to generate hypotheses.
Mixed-Methods Research Methodology
This is a research methodology that combines elements of both quantitative and qualitative research. This approach can be particularly useful for studies that aim to explore complex phenomena and to provide a more comprehensive understanding of a particular topic.
Case Study Research Methodology
This is a research methodology that involves in-depth examination of a single case or a small number of cases. Case studies are often used in psychology, sociology, and anthropology to gain a detailed understanding of a particular individual or group.
Action Research Methodology
This is a research methodology that involves a collaborative process between researchers and practitioners to identify and solve real-world problems. Action research is often used in education, healthcare, and social work.
Experimental Research Methodology
This is a research methodology that involves the manipulation of one or more independent variables to observe their effects on a dependent variable. Experimental research is often used to study cause-and-effect relationships and to make predictions.
Survey Research Methodology
This is a research methodology that involves the collection of data from a sample of individuals using questionnaires or interviews. Survey research is often used to study attitudes, opinions, and behaviors.
Grounded Theory Research Methodology
This is a research methodology that involves the development of theories based on the data collected during the research process. Grounded theory is often used in sociology and anthropology to generate theories about social phenomena.
Research Methodology Example
An Example of Research Methodology could be the following:
Research Methodology for Investigating the Effectiveness of Cognitive Behavioral Therapy in Reducing Symptoms of Depression in Adults
Introduction:
The aim of this research is to investigate the effectiveness of cognitive-behavioral therapy (CBT) in reducing symptoms of depression in adults. To achieve this objective, a randomized controlled trial (RCT) will be conducted using a mixed-methods approach.
Research Design:
The study will follow a pre-test and post-test design with two groups: an experimental group receiving CBT and a control group receiving no intervention. The study will also include a qualitative component, in which semi-structured interviews will be conducted with a subset of participants to explore their experiences of receiving CBT.
Participants:
Participants will be recruited from community mental health clinics in the local area. The sample will consist of 100 adults aged 18-65 years old who meet the diagnostic criteria for major depressive disorder. Participants will be randomly assigned to either the experimental group or the control group.
Intervention :
The experimental group will receive 12 weekly sessions of CBT, each lasting 60 minutes. The intervention will be delivered by licensed mental health professionals who have been trained in CBT. The control group will receive no intervention during the study period.
Data Collection:
Quantitative data will be collected through the use of standardized measures such as the Beck Depression Inventory-II (BDI-II) and the Generalized Anxiety Disorder-7 (GAD-7). Data will be collected at baseline, immediately after the intervention, and at a 3-month follow-up. Qualitative data will be collected through semi-structured interviews with a subset of participants from the experimental group. The interviews will be conducted at the end of the intervention period, and will explore participants’ experiences of receiving CBT.
Data Analysis:
Quantitative data will be analyzed using descriptive statistics, t-tests, and mixed-model analyses of variance (ANOVA) to assess the effectiveness of the intervention. Qualitative data will be analyzed using thematic analysis to identify common themes and patterns in participants’ experiences of receiving CBT.
Ethical Considerations:
This study will comply with ethical guidelines for research involving human subjects. Participants will provide informed consent before participating in the study, and their privacy and confidentiality will be protected throughout the study. Any adverse events or reactions will be reported and managed appropriately.
Data Management:
All data collected will be kept confidential and stored securely using password-protected databases. Identifying information will be removed from qualitative data transcripts to ensure participants’ anonymity.
Limitations:
One potential limitation of this study is that it only focuses on one type of psychotherapy, CBT, and may not generalize to other types of therapy or interventions. Another limitation is that the study will only include participants from community mental health clinics, which may not be representative of the general population.
Conclusion:
This research aims to investigate the effectiveness of CBT in reducing symptoms of depression in adults. By using a randomized controlled trial and a mixed-methods approach, the study will provide valuable insights into the mechanisms underlying the relationship between CBT and depression. The results of this study will have important implications for the development of effective treatments for depression in clinical settings.
How to Write Research Methodology
Writing a research methodology involves explaining the methods and techniques you used to conduct research, collect data, and analyze results. It’s an essential section of any research paper or thesis, as it helps readers understand the validity and reliability of your findings. Here are the steps to write a research methodology:
- Start by explaining your research question: Begin the methodology section by restating your research question and explaining why it’s important. This helps readers understand the purpose of your research and the rationale behind your methods.
- Describe your research design: Explain the overall approach you used to conduct research. This could be a qualitative or quantitative research design, experimental or non-experimental, case study or survey, etc. Discuss the advantages and limitations of the chosen design.
- Discuss your sample: Describe the participants or subjects you included in your study. Include details such as their demographics, sampling method, sample size, and any exclusion criteria used.
- Describe your data collection methods : Explain how you collected data from your participants. This could include surveys, interviews, observations, questionnaires, or experiments. Include details on how you obtained informed consent, how you administered the tools, and how you minimized the risk of bias.
- Explain your data analysis techniques: Describe the methods you used to analyze the data you collected. This could include statistical analysis, content analysis, thematic analysis, or discourse analysis. Explain how you dealt with missing data, outliers, and any other issues that arose during the analysis.
- Discuss the validity and reliability of your research : Explain how you ensured the validity and reliability of your study. This could include measures such as triangulation, member checking, peer review, or inter-coder reliability.
- Acknowledge any limitations of your research: Discuss any limitations of your study, including any potential threats to validity or generalizability. This helps readers understand the scope of your findings and how they might apply to other contexts.
- Provide a summary: End the methodology section by summarizing the methods and techniques you used to conduct your research. This provides a clear overview of your research methodology and helps readers understand the process you followed to arrive at your findings.
When to Write Research Methodology
Research methodology is typically written after the research proposal has been approved and before the actual research is conducted. It should be written prior to data collection and analysis, as it provides a clear roadmap for the research project.
The research methodology is an important section of any research paper or thesis, as it describes the methods and procedures that will be used to conduct the research. It should include details about the research design, data collection methods, data analysis techniques, and any ethical considerations.
The methodology should be written in a clear and concise manner, and it should be based on established research practices and standards. It is important to provide enough detail so that the reader can understand how the research was conducted and evaluate the validity of the results.
Applications of Research Methodology
Here are some of the applications of research methodology:
- To identify the research problem: Research methodology is used to identify the research problem, which is the first step in conducting any research.
- To design the research: Research methodology helps in designing the research by selecting the appropriate research method, research design, and sampling technique.
- To collect data: Research methodology provides a systematic approach to collect data from primary and secondary sources.
- To analyze data: Research methodology helps in analyzing the collected data using various statistical and non-statistical techniques.
- To test hypotheses: Research methodology provides a framework for testing hypotheses and drawing conclusions based on the analysis of data.
- To generalize findings: Research methodology helps in generalizing the findings of the research to the target population.
- To develop theories : Research methodology is used to develop new theories and modify existing theories based on the findings of the research.
- To evaluate programs and policies : Research methodology is used to evaluate the effectiveness of programs and policies by collecting data and analyzing it.
- To improve decision-making: Research methodology helps in making informed decisions by providing reliable and valid data.
Purpose of Research Methodology
Research methodology serves several important purposes, including:
- To guide the research process: Research methodology provides a systematic framework for conducting research. It helps researchers to plan their research, define their research questions, and select appropriate methods and techniques for collecting and analyzing data.
- To ensure research quality: Research methodology helps researchers to ensure that their research is rigorous, reliable, and valid. It provides guidelines for minimizing bias and error in data collection and analysis, and for ensuring that research findings are accurate and trustworthy.
- To replicate research: Research methodology provides a clear and detailed account of the research process, making it possible for other researchers to replicate the study and verify its findings.
- To advance knowledge: Research methodology enables researchers to generate new knowledge and to contribute to the body of knowledge in their field. It provides a means for testing hypotheses, exploring new ideas, and discovering new insights.
- To inform decision-making: Research methodology provides evidence-based information that can inform policy and decision-making in a variety of fields, including medicine, public health, education, and business.
Advantages of Research Methodology
Research methodology has several advantages that make it a valuable tool for conducting research in various fields. Here are some of the key advantages of research methodology:
- Systematic and structured approach : Research methodology provides a systematic and structured approach to conducting research, which ensures that the research is conducted in a rigorous and comprehensive manner.
- Objectivity : Research methodology aims to ensure objectivity in the research process, which means that the research findings are based on evidence and not influenced by personal bias or subjective opinions.
- Replicability : Research methodology ensures that research can be replicated by other researchers, which is essential for validating research findings and ensuring their accuracy.
- Reliability : Research methodology aims to ensure that the research findings are reliable, which means that they are consistent and can be depended upon.
- Validity : Research methodology ensures that the research findings are valid, which means that they accurately reflect the research question or hypothesis being tested.
- Efficiency : Research methodology provides a structured and efficient way of conducting research, which helps to save time and resources.
- Flexibility : Research methodology allows researchers to choose the most appropriate research methods and techniques based on the research question, data availability, and other relevant factors.
- Scope for innovation: Research methodology provides scope for innovation and creativity in designing research studies and developing new research techniques.
Research Methodology Vs Research Methods
About the author.

Muhammad Hassan
Researcher, Academic Writer, Web developer
You may also like

How to Cite Research Paper – All Formats and...

Data Collection – Methods Types and Examples

Delimitations in Research – Types, Examples and...

Research Paper Format – Types, Examples and...

Research Process – Steps, Examples and Tips

Research Design – Types, Methods and Examples
Have a language expert improve your writing
Run a free plagiarism check in 10 minutes, automatically generate references for free.
- Knowledge Base
- Dissertation
- What Is a Research Methodology? | Steps & Tips
What Is a Research Methodology? | Steps & Tips
Published on 25 February 2019 by Shona McCombes . Revised on 10 October 2022.
Your research methodology discusses and explains the data collection and analysis methods you used in your research. A key part of your thesis, dissertation, or research paper, the methodology chapter explains what you did and how you did it, allowing readers to evaluate the reliability and validity of your research.
It should include:
- The type of research you conducted
- How you collected and analysed your data
- Any tools or materials you used in the research
- Why you chose these methods
- Your methodology section should generally be written in the past tense .
- Academic style guides in your field may provide detailed guidelines on what to include for different types of studies.
- Your citation style might provide guidelines for your methodology section (e.g., an APA Style methods section ).
Instantly correct all language mistakes in your text
Be assured that you'll submit flawless writing. Upload your document to correct all your mistakes.

Table of contents
How to write a research methodology, why is a methods section important, step 1: explain your methodological approach, step 2: describe your data collection methods, step 3: describe your analysis method, step 4: evaluate and justify the methodological choices you made, tips for writing a strong methodology chapter, frequently asked questions about methodology.
The only proofreading tool specialized in correcting academic writing
The academic proofreading tool has been trained on 1000s of academic texts and by native English editors. Making it the most accurate and reliable proofreading tool for students.

Correct my document today
Your methods section is your opportunity to share how you conducted your research and why you chose the methods you chose. It’s also the place to show that your research was rigorously conducted and can be replicated .
It gives your research legitimacy and situates it within your field, and also gives your readers a place to refer to if they have any questions or critiques in other sections.
You can start by introducing your overall approach to your research. You have two options here.
Option 1: Start with your “what”
What research problem or question did you investigate?
- Aim to describe the characteristics of something?
- Explore an under-researched topic?
- Establish a causal relationship?
And what type of data did you need to achieve this aim?
- Quantitative data , qualitative data , or a mix of both?
- Primary data collected yourself, or secondary data collected by someone else?
- Experimental data gathered by controlling and manipulating variables, or descriptive data gathered via observations?
Option 2: Start with your “why”
Depending on your discipline, you can also start with a discussion of the rationale and assumptions underpinning your methodology. In other words, why did you choose these methods for your study?
- Why is this the best way to answer your research question?
- Is this a standard methodology in your field, or does it require justification?
- Were there any ethical considerations involved in your choices?
- What are the criteria for validity and reliability in this type of research ?
Once you have introduced your reader to your methodological approach, you should share full details about your data collection methods .
Quantitative methods
In order to be considered generalisable, you should describe quantitative research methods in enough detail for another researcher to replicate your study.
Here, explain how you operationalised your concepts and measured your variables. Discuss your sampling method or inclusion/exclusion criteria, as well as any tools, procedures, and materials you used to gather your data.
Surveys Describe where, when, and how the survey was conducted.
- How did you design the questionnaire?
- What form did your questions take (e.g., multiple choice, Likert scale )?
- Were your surveys conducted in-person or virtually?
- What sampling method did you use to select participants?
- What was your sample size and response rate?
Experiments Share full details of the tools, techniques, and procedures you used to conduct your experiment.
- How did you design the experiment ?
- How did you recruit participants?
- How did you manipulate and measure the variables ?
- What tools did you use?
Existing data Explain how you gathered and selected the material (such as datasets or archival data) that you used in your analysis.
- Where did you source the material?
- How was the data originally produced?
- What criteria did you use to select material (e.g., date range)?
The survey consisted of 5 multiple-choice questions and 10 questions measured on a 7-point Likert scale.
The goal was to collect survey responses from 350 customers visiting the fitness apparel company’s brick-and-mortar location in Boston on 4–8 July 2022, between 11:00 and 15:00.
Here, a customer was defined as a person who had purchased a product from the company on the day they took the survey. Participants were given 5 minutes to fill in the survey anonymously. In total, 408 customers responded, but not all surveys were fully completed. Due to this, 371 survey results were included in the analysis.
Qualitative methods
In qualitative research , methods are often more flexible and subjective. For this reason, it’s crucial to robustly explain the methodology choices you made.
Be sure to discuss the criteria you used to select your data, the context in which your research was conducted, and the role you played in collecting your data (e.g., were you an active participant, or a passive observer?)
Interviews or focus groups Describe where, when, and how the interviews were conducted.
- How did you find and select participants?
- How many participants took part?
- What form did the interviews take ( structured , semi-structured , or unstructured )?
- How long were the interviews?
- How were they recorded?
Participant observation Describe where, when, and how you conducted the observation or ethnography .
- What group or community did you observe? How long did you spend there?
- How did you gain access to this group? What role did you play in the community?
- How long did you spend conducting the research? Where was it located?
- How did you record your data (e.g., audiovisual recordings, note-taking)?
Existing data Explain how you selected case study materials for your analysis.
- What type of materials did you analyse?
- How did you select them?
In order to gain better insight into possibilities for future improvement of the fitness shop’s product range, semi-structured interviews were conducted with 8 returning customers.
Here, a returning customer was defined as someone who usually bought products at least twice a week from the store.
Surveys were used to select participants. Interviews were conducted in a small office next to the cash register and lasted approximately 20 minutes each. Answers were recorded by note-taking, and seven interviews were also filmed with consent. One interviewee preferred not to be filmed.
Mixed methods
Mixed methods research combines quantitative and qualitative approaches. If a standalone quantitative or qualitative study is insufficient to answer your research question, mixed methods may be a good fit for you.
Mixed methods are less common than standalone analyses, largely because they require a great deal of effort to pull off successfully. If you choose to pursue mixed methods, it’s especially important to robustly justify your methods here.
Prevent plagiarism, run a free check.
Next, you should indicate how you processed and analysed your data. Avoid going into too much detail: you should not start introducing or discussing any of your results at this stage.
In quantitative research , your analysis will be based on numbers. In your methods section, you can include:
- How you prepared the data before analysing it (e.g., checking for missing data , removing outliers , transforming variables)
- Which software you used (e.g., SPSS, Stata or R)
- Which statistical tests you used (e.g., two-tailed t test , simple linear regression )
In qualitative research, your analysis will be based on language, images, and observations (often involving some form of textual analysis ).
Specific methods might include:
- Content analysis : Categorising and discussing the meaning of words, phrases and sentences
- Thematic analysis : Coding and closely examining the data to identify broad themes and patterns
- Discourse analysis : Studying communication and meaning in relation to their social context
Mixed methods combine the above two research methods, integrating both qualitative and quantitative approaches into one coherent analytical process.
Above all, your methodology section should clearly make the case for why you chose the methods you did. This is especially true if you did not take the most standard approach to your topic. In this case, discuss why other methods were not suitable for your objectives, and show how this approach contributes new knowledge or understanding.
In any case, it should be overwhelmingly clear to your reader that you set yourself up for success in terms of your methodology’s design. Show how your methods should lead to results that are valid and reliable, while leaving the analysis of the meaning, importance, and relevance of your results for your discussion section .
- Quantitative: Lab-based experiments cannot always accurately simulate real-life situations and behaviours, but they are effective for testing causal relationships between variables .
- Qualitative: Unstructured interviews usually produce results that cannot be generalised beyond the sample group , but they provide a more in-depth understanding of participants’ perceptions, motivations, and emotions.
- Mixed methods: Despite issues systematically comparing differing types of data, a solely quantitative study would not sufficiently incorporate the lived experience of each participant, while a solely qualitative study would be insufficiently generalisable.
Remember that your aim is not just to describe your methods, but to show how and why you applied them. Again, it’s critical to demonstrate that your research was rigorously conducted and can be replicated.
1. Focus on your objectives and research questions
The methodology section should clearly show why your methods suit your objectives and convince the reader that you chose the best possible approach to answering your problem statement and research questions .
2. Cite relevant sources
Your methodology can be strengthened by referencing existing research in your field. This can help you to:
- Show that you followed established practice for your type of research
- Discuss how you decided on your approach by evaluating existing research
- Present a novel methodological approach to address a gap in the literature
3. Write for your audience
Consider how much information you need to give, and avoid getting too lengthy. If you are using methods that are standard for your discipline, you probably don’t need to give a lot of background or justification.
Regardless, your methodology should be a clear, well-structured text that makes an argument for your approach, not just a list of technical details and procedures.
Methodology refers to the overarching strategy and rationale of your research. Developing your methodology involves studying the research methods used in your field and the theories or principles that underpin them, in order to choose the approach that best matches your objectives.
Methods are the specific tools and procedures you use to collect and analyse data (e.g. interviews, experiments , surveys , statistical tests ).
In a dissertation or scientific paper, the methodology chapter or methods section comes after the introduction and before the results , discussion and conclusion .
Depending on the length and type of document, you might also include a literature review or theoretical framework before the methodology.
Quantitative research deals with numbers and statistics, while qualitative research deals with words and meanings.
Quantitative methods allow you to test a hypothesis by systematically collecting and analysing data, while qualitative methods allow you to explore ideas and experiences in depth.
A sample is a subset of individuals from a larger population. Sampling means selecting the group that you will actually collect data from in your research.
For example, if you are researching the opinions of students in your university, you could survey a sample of 100 students.
Statistical sampling allows you to test a hypothesis about the characteristics of a population. There are various sampling methods you can use to ensure that your sample is representative of the population as a whole.
Cite this Scribbr article
If you want to cite this source, you can copy and paste the citation or click the ‘Cite this Scribbr article’ button to automatically add the citation to our free Reference Generator.
McCombes, S. (2022, October 10). What Is a Research Methodology? | Steps & Tips. Scribbr. Retrieved 14 May 2024, from https://www.scribbr.co.uk/thesis-dissertation/methodology/
Is this article helpful?

Shona McCombes
Other students also liked, how to write a dissertation proposal | a step-by-step guide, what is a literature review | guide, template, & examples, what is a theoretical framework | a step-by-step guide.
- USC Libraries
- Research Guides
Organizing Your Social Sciences Research Paper
- 6. The Methodology
- Purpose of Guide
- Design Flaws to Avoid
- Independent and Dependent Variables
- Glossary of Research Terms
- Reading Research Effectively
- Narrowing a Topic Idea
- Broadening a Topic Idea
- Extending the Timeliness of a Topic Idea
- Academic Writing Style
- Applying Critical Thinking
- Choosing a Title
- Making an Outline
- Paragraph Development
- Research Process Video Series
- Executive Summary
- The C.A.R.S. Model
- Background Information
- The Research Problem/Question
- Theoretical Framework
- Citation Tracking
- Content Alert Services
- Evaluating Sources
- Primary Sources
- Secondary Sources
- Tiertiary Sources
- Scholarly vs. Popular Publications
- Qualitative Methods
- Quantitative Methods
- Insiderness
- Using Non-Textual Elements
- Limitations of the Study
- Common Grammar Mistakes
- Writing Concisely
- Avoiding Plagiarism
- Footnotes or Endnotes?
- Further Readings
- Generative AI and Writing
- USC Libraries Tutorials and Other Guides
- Bibliography
The methods section describes actions taken to investigate a research problem and the rationale for the application of specific procedures or techniques used to identify, select, process, and analyze information applied to understanding the problem, thereby, allowing the reader to critically evaluate a study’s overall validity and reliability. The methodology section of a research paper answers two main questions: How was the data collected or generated? And, how was it analyzed? The writing should be direct and precise and always written in the past tense.
Kallet, Richard H. "How to Write the Methods Section of a Research Paper." Respiratory Care 49 (October 2004): 1229-1232.
Importance of a Good Methodology Section
You must explain how you obtained and analyzed your results for the following reasons:
- Readers need to know how the data was obtained because the method you chose affects the results and, by extension, how you interpreted their significance in the discussion section of your paper.
- Methodology is crucial for any branch of scholarship because an unreliable method produces unreliable results and, as a consequence, undermines the value of your analysis of the findings.
- In most cases, there are a variety of different methods you can choose to investigate a research problem. The methodology section of your paper should clearly articulate the reasons why you have chosen a particular procedure or technique.
- The reader wants to know that the data was collected or generated in a way that is consistent with accepted practice in the field of study. For example, if you are using a multiple choice questionnaire, readers need to know that it offered your respondents a reasonable range of answers to choose from.
- The method must be appropriate to fulfilling the overall aims of the study. For example, you need to ensure that you have a large enough sample size to be able to generalize and make recommendations based upon the findings.
- The methodology should discuss the problems that were anticipated and the steps you took to prevent them from occurring. For any problems that do arise, you must describe the ways in which they were minimized or why these problems do not impact in any meaningful way your interpretation of the findings.
- In the social and behavioral sciences, it is important to always provide sufficient information to allow other researchers to adopt or replicate your methodology. This information is particularly important when a new method has been developed or an innovative use of an existing method is utilized.
Bem, Daryl J. Writing the Empirical Journal Article. Psychology Writing Center. University of Washington; Denscombe, Martyn. The Good Research Guide: For Small-Scale Social Research Projects . 5th edition. Buckingham, UK: Open University Press, 2014; Lunenburg, Frederick C. Writing a Successful Thesis or Dissertation: Tips and Strategies for Students in the Social and Behavioral Sciences . Thousand Oaks, CA: Corwin Press, 2008.
Structure and Writing Style
I. Groups of Research Methods
There are two main groups of research methods in the social sciences:
- The e mpirical-analytical group approaches the study of social sciences in a similar manner that researchers study the natural sciences . This type of research focuses on objective knowledge, research questions that can be answered yes or no, and operational definitions of variables to be measured. The empirical-analytical group employs deductive reasoning that uses existing theory as a foundation for formulating hypotheses that need to be tested. This approach is focused on explanation.
- The i nterpretative group of methods is focused on understanding phenomenon in a comprehensive, holistic way . Interpretive methods focus on analytically disclosing the meaning-making practices of human subjects [the why, how, or by what means people do what they do], while showing how those practices arrange so that it can be used to generate observable outcomes. Interpretive methods allow you to recognize your connection to the phenomena under investigation. However, the interpretative group requires careful examination of variables because it focuses more on subjective knowledge.
II. Content
The introduction to your methodology section should begin by restating the research problem and underlying assumptions underpinning your study. This is followed by situating the methods you used to gather, analyze, and process information within the overall “tradition” of your field of study and within the particular research design you have chosen to study the problem. If the method you choose lies outside of the tradition of your field [i.e., your review of the literature demonstrates that the method is not commonly used], provide a justification for how your choice of methods specifically addresses the research problem in ways that have not been utilized in prior studies.
The remainder of your methodology section should describe the following:
- Decisions made in selecting the data you have analyzed or, in the case of qualitative research, the subjects and research setting you have examined,
- Tools and methods used to identify and collect information, and how you identified relevant variables,
- The ways in which you processed the data and the procedures you used to analyze that data, and
- The specific research tools or strategies that you utilized to study the underlying hypothesis and research questions.
In addition, an effectively written methodology section should:
- Introduce the overall methodological approach for investigating your research problem . Is your study qualitative or quantitative or a combination of both (mixed method)? Are you going to take a special approach, such as action research, or a more neutral stance?
- Indicate how the approach fits the overall research design . Your methods for gathering data should have a clear connection to your research problem. In other words, make sure that your methods will actually address the problem. One of the most common deficiencies found in research papers is that the proposed methodology is not suitable to achieving the stated objective of your paper.
- Describe the specific methods of data collection you are going to use , such as, surveys, interviews, questionnaires, observation, archival research. If you are analyzing existing data, such as a data set or archival documents, describe how it was originally created or gathered and by whom. Also be sure to explain how older data is still relevant to investigating the current research problem.
- Explain how you intend to analyze your results . Will you use statistical analysis? Will you use specific theoretical perspectives to help you analyze a text or explain observed behaviors? Describe how you plan to obtain an accurate assessment of relationships, patterns, trends, distributions, and possible contradictions found in the data.
- Provide background and a rationale for methodologies that are unfamiliar for your readers . Very often in the social sciences, research problems and the methods for investigating them require more explanation/rationale than widely accepted rules governing the natural and physical sciences. Be clear and concise in your explanation.
- Provide a justification for subject selection and sampling procedure . For instance, if you propose to conduct interviews, how do you intend to select the sample population? If you are analyzing texts, which texts have you chosen, and why? If you are using statistics, why is this set of data being used? If other data sources exist, explain why the data you chose is most appropriate to addressing the research problem.
- Provide a justification for case study selection . A common method of analyzing research problems in the social sciences is to analyze specific cases. These can be a person, place, event, phenomenon, or other type of subject of analysis that are either examined as a singular topic of in-depth investigation or multiple topics of investigation studied for the purpose of comparing or contrasting findings. In either method, you should explain why a case or cases were chosen and how they specifically relate to the research problem.
- Describe potential limitations . Are there any practical limitations that could affect your data collection? How will you attempt to control for potential confounding variables and errors? If your methodology may lead to problems you can anticipate, state this openly and show why pursuing this methodology outweighs the risk of these problems cropping up.
NOTE : Once you have written all of the elements of the methods section, subsequent revisions should focus on how to present those elements as clearly and as logically as possibly. The description of how you prepared to study the research problem, how you gathered the data, and the protocol for analyzing the data should be organized chronologically. For clarity, when a large amount of detail must be presented, information should be presented in sub-sections according to topic. If necessary, consider using appendices for raw data.
ANOTHER NOTE : If you are conducting a qualitative analysis of a research problem , the methodology section generally requires a more elaborate description of the methods used as well as an explanation of the processes applied to gathering and analyzing of data than is generally required for studies using quantitative methods. Because you are the primary instrument for generating the data [e.g., through interviews or observations], the process for collecting that data has a significantly greater impact on producing the findings. Therefore, qualitative research requires a more detailed description of the methods used.
YET ANOTHER NOTE : If your study involves interviews, observations, or other qualitative techniques involving human subjects , you may be required to obtain approval from the university's Office for the Protection of Research Subjects before beginning your research. This is not a common procedure for most undergraduate level student research assignments. However, i f your professor states you need approval, you must include a statement in your methods section that you received official endorsement and adequate informed consent from the office and that there was a clear assessment and minimization of risks to participants and to the university. This statement informs the reader that your study was conducted in an ethical and responsible manner. In some cases, the approval notice is included as an appendix to your paper.
III. Problems to Avoid
Irrelevant Detail The methodology section of your paper should be thorough but concise. Do not provide any background information that does not directly help the reader understand why a particular method was chosen, how the data was gathered or obtained, and how the data was analyzed in relation to the research problem [note: analyzed, not interpreted! Save how you interpreted the findings for the discussion section]. With this in mind, the page length of your methods section will generally be less than any other section of your paper except the conclusion.
Unnecessary Explanation of Basic Procedures Remember that you are not writing a how-to guide about a particular method. You should make the assumption that readers possess a basic understanding of how to investigate the research problem on their own and, therefore, you do not have to go into great detail about specific methodological procedures. The focus should be on how you applied a method , not on the mechanics of doing a method. An exception to this rule is if you select an unconventional methodological approach; if this is the case, be sure to explain why this approach was chosen and how it enhances the overall process of discovery.
Problem Blindness It is almost a given that you will encounter problems when collecting or generating your data, or, gaps will exist in existing data or archival materials. Do not ignore these problems or pretend they did not occur. Often, documenting how you overcame obstacles can form an interesting part of the methodology. It demonstrates to the reader that you can provide a cogent rationale for the decisions you made to minimize the impact of any problems that arose.
Literature Review Just as the literature review section of your paper provides an overview of sources you have examined while researching a particular topic, the methodology section should cite any sources that informed your choice and application of a particular method [i.e., the choice of a survey should include any citations to the works you used to help construct the survey].
It’s More than Sources of Information! A description of a research study's method should not be confused with a description of the sources of information. Such a list of sources is useful in and of itself, especially if it is accompanied by an explanation about the selection and use of the sources. The description of the project's methodology complements a list of sources in that it sets forth the organization and interpretation of information emanating from those sources.
Azevedo, L.F. et al. "How to Write a Scientific Paper: Writing the Methods Section." Revista Portuguesa de Pneumologia 17 (2011): 232-238; Blair Lorrie. “Choosing a Methodology.” In Writing a Graduate Thesis or Dissertation , Teaching Writing Series. (Rotterdam: Sense Publishers 2016), pp. 49-72; Butin, Dan W. The Education Dissertation A Guide for Practitioner Scholars . Thousand Oaks, CA: Corwin, 2010; Carter, Susan. Structuring Your Research Thesis . New York: Palgrave Macmillan, 2012; Kallet, Richard H. “How to Write the Methods Section of a Research Paper.” Respiratory Care 49 (October 2004):1229-1232; Lunenburg, Frederick C. Writing a Successful Thesis or Dissertation: Tips and Strategies for Students in the Social and Behavioral Sciences . Thousand Oaks, CA: Corwin Press, 2008. Methods Section. The Writer’s Handbook. Writing Center. University of Wisconsin, Madison; Rudestam, Kjell Erik and Rae R. Newton. “The Method Chapter: Describing Your Research Plan.” In Surviving Your Dissertation: A Comprehensive Guide to Content and Process . (Thousand Oaks, Sage Publications, 2015), pp. 87-115; What is Interpretive Research. Institute of Public and International Affairs, University of Utah; Writing the Experimental Report: Methods, Results, and Discussion. The Writing Lab and The OWL. Purdue University; Methods and Materials. The Structure, Format, Content, and Style of a Journal-Style Scientific Paper. Department of Biology. Bates College.
Writing Tip
Statistical Designs and Tests? Do Not Fear Them!
Don't avoid using a quantitative approach to analyzing your research problem just because you fear the idea of applying statistical designs and tests. A qualitative approach, such as conducting interviews or content analysis of archival texts, can yield exciting new insights about a research problem, but it should not be undertaken simply because you have a disdain for running a simple regression. A well designed quantitative research study can often be accomplished in very clear and direct ways, whereas, a similar study of a qualitative nature usually requires considerable time to analyze large volumes of data and a tremendous burden to create new paths for analysis where previously no path associated with your research problem had existed.
To locate data and statistics, GO HERE .
Another Writing Tip
Knowing the Relationship Between Theories and Methods
There can be multiple meaning associated with the term "theories" and the term "methods" in social sciences research. A helpful way to delineate between them is to understand "theories" as representing different ways of characterizing the social world when you research it and "methods" as representing different ways of generating and analyzing data about that social world. Framed in this way, all empirical social sciences research involves theories and methods, whether they are stated explicitly or not. However, while theories and methods are often related, it is important that, as a researcher, you deliberately separate them in order to avoid your theories playing a disproportionate role in shaping what outcomes your chosen methods produce.
Introspectively engage in an ongoing dialectic between the application of theories and methods to help enable you to use the outcomes from your methods to interrogate and develop new theories, or ways of framing conceptually the research problem. This is how scholarship grows and branches out into new intellectual territory.
Reynolds, R. Larry. Ways of Knowing. Alternative Microeconomics . Part 1, Chapter 3. Boise State University; The Theory-Method Relationship. S-Cool Revision. United Kingdom.
Yet Another Writing Tip
Methods and the Methodology
Do not confuse the terms "methods" and "methodology." As Schneider notes, a method refers to the technical steps taken to do research . Descriptions of methods usually include defining and stating why you have chosen specific techniques to investigate a research problem, followed by an outline of the procedures you used to systematically select, gather, and process the data [remember to always save the interpretation of data for the discussion section of your paper].
The methodology refers to a discussion of the underlying reasoning why particular methods were used . This discussion includes describing the theoretical concepts that inform the choice of methods to be applied, placing the choice of methods within the more general nature of academic work, and reviewing its relevance to examining the research problem. The methodology section also includes a thorough review of the methods other scholars have used to study the topic.
Bryman, Alan. "Of Methods and Methodology." Qualitative Research in Organizations and Management: An International Journal 3 (2008): 159-168; Schneider, Florian. “What's in a Methodology: The Difference between Method, Methodology, and Theory…and How to Get the Balance Right?” PoliticsEastAsia.com. Chinese Department, University of Leiden, Netherlands.
- << Previous: Scholarly vs. Popular Publications
- Next: Qualitative Methods >>
- Last Updated: May 18, 2024 11:38 AM
- URL: https://libguides.usc.edu/writingguide
How To Write Methodology For A Quantitative Study?
Methodology Chapter Provides Information On All The Steps Taken For The Study Of A Problem And The Justifications Given For Specific Steps Taken To Gather, Process, And Analyze Data Related To Understanding The Problem. The Chapter Allows The Reader To Understand And Evaluate The Research Design And Thus Validate It.

Quantitative Study: Quantitative Research Is The Quantification Of A Problem Via Generating Numerical Data That Are Most Often Converted Into Statistics. The Statistical Analysis In Research Methodology Helps In Proving Or Disproving A Thesis. The Research Is Usually Conducted Among A Broad Populace In The Form Of Questionnaire, Polls And Other Surveys Which Involves The Participants To Reply In Numbers. This Means Quantitative Research Falls Under The Headings Of Empirical Or Statistical Studies. Its Main Characteristics Are :
- Use Of Standard Instruments To Gather Data.
- Sizes Of The Samples Are Proportional To That Of The Population In Question.
- Research Is Conducted On A Well-Defined Question.
- Studies Are Well Designed Before The Process.
- Numerical Data That Quantify A Problem Or An Area Of Research Using Various Means Like Charts, Tables, Graphs, Etc. Data Collection Carried Out Through Surveys, Questionnaires, Etc.
A Methodology Chapter For A Quantitative Study Explains The Following In A Direct And Precise Manner:
How Was The Data Generated? How Was It Processed? Why Was The Design, That Was Used, Used?
Any Methodology Chapter Must Be Written In The Past Tense And Follows The Following Guidelines: Chapter Provides Information On The Methods Of Data Collection To Enable The Readers To Understand The Process.
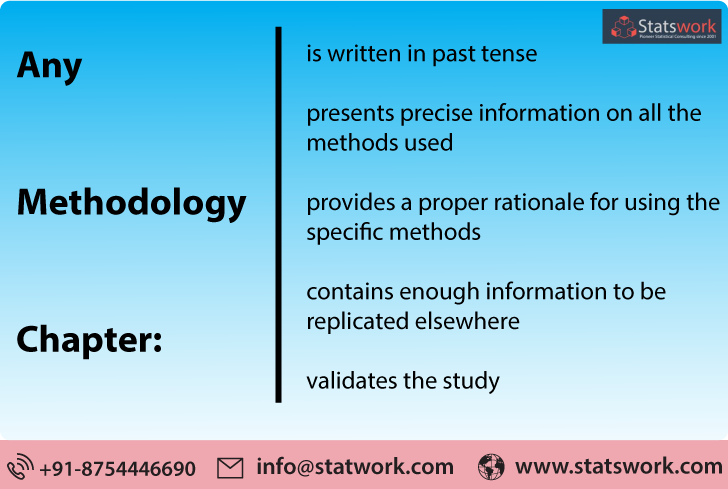
- Significance Of The Methodology Is That A Proper Methodology Validates The Study As A Whole.
- Methodology Section Should Provide A Rationale For Choosing A Particular Design.
- Methods Used Must Be Valid And Conforming To The Conventional Norms Of Research. As Such, The Methodology Chapter Must Provide Enough Evidence To Support The Credibility Of Each Method Used.
- The Appropriateness Of The Methods Chosen Must Be Stated. Only The Methods That Are Appropriate To The Scale Of The Subject In Investigation Must Be Chosen.
- The Chapter Must Contain Information On The Constraints And Challenges That Were Anticipated Before The Beginning Of The Study, The Steps Taken To Prevent The Problems From Occurring, And The Ways The Constraints That Did Occur Were Tackled With Minimal Impact And How The Said Impact Doesn’t Affect The Outcome Of The Study.
- Necessary Information To Replicate Any Particular Method Must Be Provided Concisely In The Chapter.
A methodology for a quantitative study begins with a reiteration of the research question and its context.
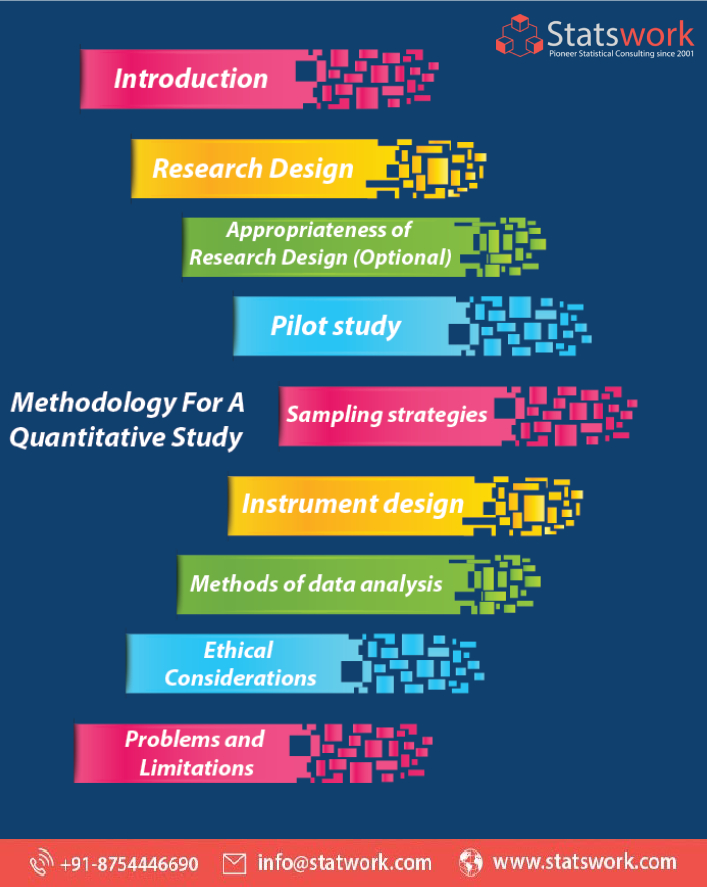
This is followed by the research design , where the methods used to gather, process and analyze the data are given. This is usually preceded or followed by a justification of the appropriateness of the research design . Then, the information on the pilot study is given. It is followed by the precise information on sampling strategies, instrument design, and methods of data analysis . ‘ Ethical considerations ’ comes next . Here the researcher informs the reader of the measures taken to ensure participants privacy and consent, etc. Penultimate to concluding the methodology chapter is problems and limitations, where the reader is informed of all the constraints the researcher anticipated and all the problems that occurred and the limitations methods may pose to the overall study.
Links, Related Posts
– indispensable qualitative research methods.
- Qualitative Research Design Methodology
- Quantitative Research Design Methodology
- Research Methodology Help
- Research Methodology Services

- A global market analysis (1)
- Academic (22)
- Algorithms (1)
- Big Data Analytics (4)
- Bio Statistics (3)
- Clinical Prediction Model (1)
- Corporate (9)
- Corporate statistics service (1)
- Data Analyses (23)
- Data collection (11)
- Genomics & Bioinformatics (1)
- Guidelines (2)
- Machine Learning – Blogs (1)
- Meta-analysis service (2)
- Network Analysis (1)
- Predictive analyses (2)
- Qualitative (1)
- Quantitaive (2)
- Quantitative Data analysis service (1)
- Research (59)
- Shipping & Logistics (1)
- Statistical analysis service (7)
- Statistical models (1)
- Statistical Report Writing (1)
- Statistical Software (10)
- Statistics (64)
- Survey & Interview from Statswork (1)
- Uncategorized (1)
Recent Posts
- Top 10 Machine Learning Algorithms Expected to Shape the Future of AI
- Data-Driven Governance: Revolutionizing State Youth Policies through Web Scraping
- The Future is Now: The Potential of Predictive Analytics Models and Algorithms
- 2024 Vision: Exploring the Impact and Evolution of Advanced Analytics Tools
- Application of machine learning in marketing
Statswork is a pioneer statistical consulting company providing full assistance to researchers and scholars. Statswork offers expert consulting assistance and enhancing researchers by our distinct statistical process and communication throughout the research process with us.
Functional Area
– Research Planning – Tool Development – Data Mining – Data Collection – Statistics Coursework – Research Methodology – Meta Analysis – Data Analysis
- – Corporate
- – Statistical Software
- – Statistics
Corporate Office
#10, Kutty Street, Nungambakkam, Chennai, Tamil Nadu – 600034, India No : +91 4433182000, UK No : +44-1223926607 , US No : +1-9725029262 Email: [email protected]
Website: www.statswork.com
© 2024 Statswork. All Rights Reserved

An official website of the United States government
The .gov means it’s official. Federal government websites often end in .gov or .mil. Before sharing sensitive information, make sure you’re on a federal government site.
The site is secure. The https:// ensures that you are connecting to the official website and that any information you provide is encrypted and transmitted securely.
- Publications
- Account settings
Preview improvements coming to the PMC website in October 2024. Learn More or Try it out now .
- Advanced Search
- Journal List
- J Korean Med Sci
- v.37(16); 2022 Apr 25
A Practical Guide to Writing Quantitative and Qualitative Research Questions and Hypotheses in Scholarly Articles
Edward barroga.
1 Department of General Education, Graduate School of Nursing Science, St. Luke’s International University, Tokyo, Japan.
Glafera Janet Matanguihan
2 Department of Biological Sciences, Messiah University, Mechanicsburg, PA, USA.
The development of research questions and the subsequent hypotheses are prerequisites to defining the main research purpose and specific objectives of a study. Consequently, these objectives determine the study design and research outcome. The development of research questions is a process based on knowledge of current trends, cutting-edge studies, and technological advances in the research field. Excellent research questions are focused and require a comprehensive literature search and in-depth understanding of the problem being investigated. Initially, research questions may be written as descriptive questions which could be developed into inferential questions. These questions must be specific and concise to provide a clear foundation for developing hypotheses. Hypotheses are more formal predictions about the research outcomes. These specify the possible results that may or may not be expected regarding the relationship between groups. Thus, research questions and hypotheses clarify the main purpose and specific objectives of the study, which in turn dictate the design of the study, its direction, and outcome. Studies developed from good research questions and hypotheses will have trustworthy outcomes with wide-ranging social and health implications.
INTRODUCTION
Scientific research is usually initiated by posing evidenced-based research questions which are then explicitly restated as hypotheses. 1 , 2 The hypotheses provide directions to guide the study, solutions, explanations, and expected results. 3 , 4 Both research questions and hypotheses are essentially formulated based on conventional theories and real-world processes, which allow the inception of novel studies and the ethical testing of ideas. 5 , 6
It is crucial to have knowledge of both quantitative and qualitative research 2 as both types of research involve writing research questions and hypotheses. 7 However, these crucial elements of research are sometimes overlooked; if not overlooked, then framed without the forethought and meticulous attention it needs. Planning and careful consideration are needed when developing quantitative or qualitative research, particularly when conceptualizing research questions and hypotheses. 4
There is a continuing need to support researchers in the creation of innovative research questions and hypotheses, as well as for journal articles that carefully review these elements. 1 When research questions and hypotheses are not carefully thought of, unethical studies and poor outcomes usually ensue. Carefully formulated research questions and hypotheses define well-founded objectives, which in turn determine the appropriate design, course, and outcome of the study. This article then aims to discuss in detail the various aspects of crafting research questions and hypotheses, with the goal of guiding researchers as they develop their own. Examples from the authors and peer-reviewed scientific articles in the healthcare field are provided to illustrate key points.
DEFINITIONS AND RELATIONSHIP OF RESEARCH QUESTIONS AND HYPOTHESES
A research question is what a study aims to answer after data analysis and interpretation. The answer is written in length in the discussion section of the paper. Thus, the research question gives a preview of the different parts and variables of the study meant to address the problem posed in the research question. 1 An excellent research question clarifies the research writing while facilitating understanding of the research topic, objective, scope, and limitations of the study. 5
On the other hand, a research hypothesis is an educated statement of an expected outcome. This statement is based on background research and current knowledge. 8 , 9 The research hypothesis makes a specific prediction about a new phenomenon 10 or a formal statement on the expected relationship between an independent variable and a dependent variable. 3 , 11 It provides a tentative answer to the research question to be tested or explored. 4
Hypotheses employ reasoning to predict a theory-based outcome. 10 These can also be developed from theories by focusing on components of theories that have not yet been observed. 10 The validity of hypotheses is often based on the testability of the prediction made in a reproducible experiment. 8
Conversely, hypotheses can also be rephrased as research questions. Several hypotheses based on existing theories and knowledge may be needed to answer a research question. Developing ethical research questions and hypotheses creates a research design that has logical relationships among variables. These relationships serve as a solid foundation for the conduct of the study. 4 , 11 Haphazardly constructed research questions can result in poorly formulated hypotheses and improper study designs, leading to unreliable results. Thus, the formulations of relevant research questions and verifiable hypotheses are crucial when beginning research. 12
CHARACTERISTICS OF GOOD RESEARCH QUESTIONS AND HYPOTHESES
Excellent research questions are specific and focused. These integrate collective data and observations to confirm or refute the subsequent hypotheses. Well-constructed hypotheses are based on previous reports and verify the research context. These are realistic, in-depth, sufficiently complex, and reproducible. More importantly, these hypotheses can be addressed and tested. 13
There are several characteristics of well-developed hypotheses. Good hypotheses are 1) empirically testable 7 , 10 , 11 , 13 ; 2) backed by preliminary evidence 9 ; 3) testable by ethical research 7 , 9 ; 4) based on original ideas 9 ; 5) have evidenced-based logical reasoning 10 ; and 6) can be predicted. 11 Good hypotheses can infer ethical and positive implications, indicating the presence of a relationship or effect relevant to the research theme. 7 , 11 These are initially developed from a general theory and branch into specific hypotheses by deductive reasoning. In the absence of a theory to base the hypotheses, inductive reasoning based on specific observations or findings form more general hypotheses. 10
TYPES OF RESEARCH QUESTIONS AND HYPOTHESES
Research questions and hypotheses are developed according to the type of research, which can be broadly classified into quantitative and qualitative research. We provide a summary of the types of research questions and hypotheses under quantitative and qualitative research categories in Table 1 .
Research questions in quantitative research
In quantitative research, research questions inquire about the relationships among variables being investigated and are usually framed at the start of the study. These are precise and typically linked to the subject population, dependent and independent variables, and research design. 1 Research questions may also attempt to describe the behavior of a population in relation to one or more variables, or describe the characteristics of variables to be measured ( descriptive research questions ). 1 , 5 , 14 These questions may also aim to discover differences between groups within the context of an outcome variable ( comparative research questions ), 1 , 5 , 14 or elucidate trends and interactions among variables ( relationship research questions ). 1 , 5 We provide examples of descriptive, comparative, and relationship research questions in quantitative research in Table 2 .
Hypotheses in quantitative research
In quantitative research, hypotheses predict the expected relationships among variables. 15 Relationships among variables that can be predicted include 1) between a single dependent variable and a single independent variable ( simple hypothesis ) or 2) between two or more independent and dependent variables ( complex hypothesis ). 4 , 11 Hypotheses may also specify the expected direction to be followed and imply an intellectual commitment to a particular outcome ( directional hypothesis ) 4 . On the other hand, hypotheses may not predict the exact direction and are used in the absence of a theory, or when findings contradict previous studies ( non-directional hypothesis ). 4 In addition, hypotheses can 1) define interdependency between variables ( associative hypothesis ), 4 2) propose an effect on the dependent variable from manipulation of the independent variable ( causal hypothesis ), 4 3) state a negative relationship between two variables ( null hypothesis ), 4 , 11 , 15 4) replace the working hypothesis if rejected ( alternative hypothesis ), 15 explain the relationship of phenomena to possibly generate a theory ( working hypothesis ), 11 5) involve quantifiable variables that can be tested statistically ( statistical hypothesis ), 11 6) or express a relationship whose interlinks can be verified logically ( logical hypothesis ). 11 We provide examples of simple, complex, directional, non-directional, associative, causal, null, alternative, working, statistical, and logical hypotheses in quantitative research, as well as the definition of quantitative hypothesis-testing research in Table 3 .
Research questions in qualitative research
Unlike research questions in quantitative research, research questions in qualitative research are usually continuously reviewed and reformulated. The central question and associated subquestions are stated more than the hypotheses. 15 The central question broadly explores a complex set of factors surrounding the central phenomenon, aiming to present the varied perspectives of participants. 15
There are varied goals for which qualitative research questions are developed. These questions can function in several ways, such as to 1) identify and describe existing conditions ( contextual research question s); 2) describe a phenomenon ( descriptive research questions ); 3) assess the effectiveness of existing methods, protocols, theories, or procedures ( evaluation research questions ); 4) examine a phenomenon or analyze the reasons or relationships between subjects or phenomena ( explanatory research questions ); or 5) focus on unknown aspects of a particular topic ( exploratory research questions ). 5 In addition, some qualitative research questions provide new ideas for the development of theories and actions ( generative research questions ) or advance specific ideologies of a position ( ideological research questions ). 1 Other qualitative research questions may build on a body of existing literature and become working guidelines ( ethnographic research questions ). Research questions may also be broadly stated without specific reference to the existing literature or a typology of questions ( phenomenological research questions ), may be directed towards generating a theory of some process ( grounded theory questions ), or may address a description of the case and the emerging themes ( qualitative case study questions ). 15 We provide examples of contextual, descriptive, evaluation, explanatory, exploratory, generative, ideological, ethnographic, phenomenological, grounded theory, and qualitative case study research questions in qualitative research in Table 4 , and the definition of qualitative hypothesis-generating research in Table 5 .
Qualitative studies usually pose at least one central research question and several subquestions starting with How or What . These research questions use exploratory verbs such as explore or describe . These also focus on one central phenomenon of interest, and may mention the participants and research site. 15
Hypotheses in qualitative research
Hypotheses in qualitative research are stated in the form of a clear statement concerning the problem to be investigated. Unlike in quantitative research where hypotheses are usually developed to be tested, qualitative research can lead to both hypothesis-testing and hypothesis-generating outcomes. 2 When studies require both quantitative and qualitative research questions, this suggests an integrative process between both research methods wherein a single mixed-methods research question can be developed. 1
FRAMEWORKS FOR DEVELOPING RESEARCH QUESTIONS AND HYPOTHESES
Research questions followed by hypotheses should be developed before the start of the study. 1 , 12 , 14 It is crucial to develop feasible research questions on a topic that is interesting to both the researcher and the scientific community. This can be achieved by a meticulous review of previous and current studies to establish a novel topic. Specific areas are subsequently focused on to generate ethical research questions. The relevance of the research questions is evaluated in terms of clarity of the resulting data, specificity of the methodology, objectivity of the outcome, depth of the research, and impact of the study. 1 , 5 These aspects constitute the FINER criteria (i.e., Feasible, Interesting, Novel, Ethical, and Relevant). 1 Clarity and effectiveness are achieved if research questions meet the FINER criteria. In addition to the FINER criteria, Ratan et al. described focus, complexity, novelty, feasibility, and measurability for evaluating the effectiveness of research questions. 14
The PICOT and PEO frameworks are also used when developing research questions. 1 The following elements are addressed in these frameworks, PICOT: P-population/patients/problem, I-intervention or indicator being studied, C-comparison group, O-outcome of interest, and T-timeframe of the study; PEO: P-population being studied, E-exposure to preexisting conditions, and O-outcome of interest. 1 Research questions are also considered good if these meet the “FINERMAPS” framework: Feasible, Interesting, Novel, Ethical, Relevant, Manageable, Appropriate, Potential value/publishable, and Systematic. 14
As we indicated earlier, research questions and hypotheses that are not carefully formulated result in unethical studies or poor outcomes. To illustrate this, we provide some examples of ambiguous research question and hypotheses that result in unclear and weak research objectives in quantitative research ( Table 6 ) 16 and qualitative research ( Table 7 ) 17 , and how to transform these ambiguous research question(s) and hypothesis(es) into clear and good statements.
a These statements were composed for comparison and illustrative purposes only.
b These statements are direct quotes from Higashihara and Horiuchi. 16
a This statement is a direct quote from Shimoda et al. 17
The other statements were composed for comparison and illustrative purposes only.
CONSTRUCTING RESEARCH QUESTIONS AND HYPOTHESES
To construct effective research questions and hypotheses, it is very important to 1) clarify the background and 2) identify the research problem at the outset of the research, within a specific timeframe. 9 Then, 3) review or conduct preliminary research to collect all available knowledge about the possible research questions by studying theories and previous studies. 18 Afterwards, 4) construct research questions to investigate the research problem. Identify variables to be accessed from the research questions 4 and make operational definitions of constructs from the research problem and questions. Thereafter, 5) construct specific deductive or inductive predictions in the form of hypotheses. 4 Finally, 6) state the study aims . This general flow for constructing effective research questions and hypotheses prior to conducting research is shown in Fig. 1 .

Research questions are used more frequently in qualitative research than objectives or hypotheses. 3 These questions seek to discover, understand, explore or describe experiences by asking “What” or “How.” The questions are open-ended to elicit a description rather than to relate variables or compare groups. The questions are continually reviewed, reformulated, and changed during the qualitative study. 3 Research questions are also used more frequently in survey projects than hypotheses in experiments in quantitative research to compare variables and their relationships.
Hypotheses are constructed based on the variables identified and as an if-then statement, following the template, ‘If a specific action is taken, then a certain outcome is expected.’ At this stage, some ideas regarding expectations from the research to be conducted must be drawn. 18 Then, the variables to be manipulated (independent) and influenced (dependent) are defined. 4 Thereafter, the hypothesis is stated and refined, and reproducible data tailored to the hypothesis are identified, collected, and analyzed. 4 The hypotheses must be testable and specific, 18 and should describe the variables and their relationships, the specific group being studied, and the predicted research outcome. 18 Hypotheses construction involves a testable proposition to be deduced from theory, and independent and dependent variables to be separated and measured separately. 3 Therefore, good hypotheses must be based on good research questions constructed at the start of a study or trial. 12
In summary, research questions are constructed after establishing the background of the study. Hypotheses are then developed based on the research questions. Thus, it is crucial to have excellent research questions to generate superior hypotheses. In turn, these would determine the research objectives and the design of the study, and ultimately, the outcome of the research. 12 Algorithms for building research questions and hypotheses are shown in Fig. 2 for quantitative research and in Fig. 3 for qualitative research.

EXAMPLES OF RESEARCH QUESTIONS FROM PUBLISHED ARTICLES
- EXAMPLE 1. Descriptive research question (quantitative research)
- - Presents research variables to be assessed (distinct phenotypes and subphenotypes)
- “BACKGROUND: Since COVID-19 was identified, its clinical and biological heterogeneity has been recognized. Identifying COVID-19 phenotypes might help guide basic, clinical, and translational research efforts.
- RESEARCH QUESTION: Does the clinical spectrum of patients with COVID-19 contain distinct phenotypes and subphenotypes? ” 19
- EXAMPLE 2. Relationship research question (quantitative research)
- - Shows interactions between dependent variable (static postural control) and independent variable (peripheral visual field loss)
- “Background: Integration of visual, vestibular, and proprioceptive sensations contributes to postural control. People with peripheral visual field loss have serious postural instability. However, the directional specificity of postural stability and sensory reweighting caused by gradual peripheral visual field loss remain unclear.
- Research question: What are the effects of peripheral visual field loss on static postural control ?” 20
- EXAMPLE 3. Comparative research question (quantitative research)
- - Clarifies the difference among groups with an outcome variable (patients enrolled in COMPERA with moderate PH or severe PH in COPD) and another group without the outcome variable (patients with idiopathic pulmonary arterial hypertension (IPAH))
- “BACKGROUND: Pulmonary hypertension (PH) in COPD is a poorly investigated clinical condition.
- RESEARCH QUESTION: Which factors determine the outcome of PH in COPD?
- STUDY DESIGN AND METHODS: We analyzed the characteristics and outcome of patients enrolled in the Comparative, Prospective Registry of Newly Initiated Therapies for Pulmonary Hypertension (COMPERA) with moderate or severe PH in COPD as defined during the 6th PH World Symposium who received medical therapy for PH and compared them with patients with idiopathic pulmonary arterial hypertension (IPAH) .” 21
- EXAMPLE 4. Exploratory research question (qualitative research)
- - Explores areas that have not been fully investigated (perspectives of families and children who receive care in clinic-based child obesity treatment) to have a deeper understanding of the research problem
- “Problem: Interventions for children with obesity lead to only modest improvements in BMI and long-term outcomes, and data are limited on the perspectives of families of children with obesity in clinic-based treatment. This scoping review seeks to answer the question: What is known about the perspectives of families and children who receive care in clinic-based child obesity treatment? This review aims to explore the scope of perspectives reported by families of children with obesity who have received individualized outpatient clinic-based obesity treatment.” 22
- EXAMPLE 5. Relationship research question (quantitative research)
- - Defines interactions between dependent variable (use of ankle strategies) and independent variable (changes in muscle tone)
- “Background: To maintain an upright standing posture against external disturbances, the human body mainly employs two types of postural control strategies: “ankle strategy” and “hip strategy.” While it has been reported that the magnitude of the disturbance alters the use of postural control strategies, it has not been elucidated how the level of muscle tone, one of the crucial parameters of bodily function, determines the use of each strategy. We have previously confirmed using forward dynamics simulations of human musculoskeletal models that an increased muscle tone promotes the use of ankle strategies. The objective of the present study was to experimentally evaluate a hypothesis: an increased muscle tone promotes the use of ankle strategies. Research question: Do changes in the muscle tone affect the use of ankle strategies ?” 23
EXAMPLES OF HYPOTHESES IN PUBLISHED ARTICLES
- EXAMPLE 1. Working hypothesis (quantitative research)
- - A hypothesis that is initially accepted for further research to produce a feasible theory
- “As fever may have benefit in shortening the duration of viral illness, it is plausible to hypothesize that the antipyretic efficacy of ibuprofen may be hindering the benefits of a fever response when taken during the early stages of COVID-19 illness .” 24
- “In conclusion, it is plausible to hypothesize that the antipyretic efficacy of ibuprofen may be hindering the benefits of a fever response . The difference in perceived safety of these agents in COVID-19 illness could be related to the more potent efficacy to reduce fever with ibuprofen compared to acetaminophen. Compelling data on the benefit of fever warrant further research and review to determine when to treat or withhold ibuprofen for early stage fever for COVID-19 and other related viral illnesses .” 24
- EXAMPLE 2. Exploratory hypothesis (qualitative research)
- - Explores particular areas deeper to clarify subjective experience and develop a formal hypothesis potentially testable in a future quantitative approach
- “We hypothesized that when thinking about a past experience of help-seeking, a self distancing prompt would cause increased help-seeking intentions and more favorable help-seeking outcome expectations .” 25
- “Conclusion
- Although a priori hypotheses were not supported, further research is warranted as results indicate the potential for using self-distancing approaches to increasing help-seeking among some people with depressive symptomatology.” 25
- EXAMPLE 3. Hypothesis-generating research to establish a framework for hypothesis testing (qualitative research)
- “We hypothesize that compassionate care is beneficial for patients (better outcomes), healthcare systems and payers (lower costs), and healthcare providers (lower burnout). ” 26
- Compassionomics is the branch of knowledge and scientific study of the effects of compassionate healthcare. Our main hypotheses are that compassionate healthcare is beneficial for (1) patients, by improving clinical outcomes, (2) healthcare systems and payers, by supporting financial sustainability, and (3) HCPs, by lowering burnout and promoting resilience and well-being. The purpose of this paper is to establish a scientific framework for testing the hypotheses above . If these hypotheses are confirmed through rigorous research, compassionomics will belong in the science of evidence-based medicine, with major implications for all healthcare domains.” 26
- EXAMPLE 4. Statistical hypothesis (quantitative research)
- - An assumption is made about the relationship among several population characteristics ( gender differences in sociodemographic and clinical characteristics of adults with ADHD ). Validity is tested by statistical experiment or analysis ( chi-square test, Students t-test, and logistic regression analysis)
- “Our research investigated gender differences in sociodemographic and clinical characteristics of adults with ADHD in a Japanese clinical sample. Due to unique Japanese cultural ideals and expectations of women's behavior that are in opposition to ADHD symptoms, we hypothesized that women with ADHD experience more difficulties and present more dysfunctions than men . We tested the following hypotheses: first, women with ADHD have more comorbidities than men with ADHD; second, women with ADHD experience more social hardships than men, such as having less full-time employment and being more likely to be divorced.” 27
- “Statistical Analysis
- ( text omitted ) Between-gender comparisons were made using the chi-squared test for categorical variables and Students t-test for continuous variables…( text omitted ). A logistic regression analysis was performed for employment status, marital status, and comorbidity to evaluate the independent effects of gender on these dependent variables.” 27
EXAMPLES OF HYPOTHESIS AS WRITTEN IN PUBLISHED ARTICLES IN RELATION TO OTHER PARTS
- EXAMPLE 1. Background, hypotheses, and aims are provided
- “Pregnant women need skilled care during pregnancy and childbirth, but that skilled care is often delayed in some countries …( text omitted ). The focused antenatal care (FANC) model of WHO recommends that nurses provide information or counseling to all pregnant women …( text omitted ). Job aids are visual support materials that provide the right kind of information using graphics and words in a simple and yet effective manner. When nurses are not highly trained or have many work details to attend to, these job aids can serve as a content reminder for the nurses and can be used for educating their patients (Jennings, Yebadokpo, Affo, & Agbogbe, 2010) ( text omitted ). Importantly, additional evidence is needed to confirm how job aids can further improve the quality of ANC counseling by health workers in maternal care …( text omitted )” 28
- “ This has led us to hypothesize that the quality of ANC counseling would be better if supported by job aids. Consequently, a better quality of ANC counseling is expected to produce higher levels of awareness concerning the danger signs of pregnancy and a more favorable impression of the caring behavior of nurses .” 28
- “This study aimed to examine the differences in the responses of pregnant women to a job aid-supported intervention during ANC visit in terms of 1) their understanding of the danger signs of pregnancy and 2) their impression of the caring behaviors of nurses to pregnant women in rural Tanzania.” 28
- EXAMPLE 2. Background, hypotheses, and aims are provided
- “We conducted a two-arm randomized controlled trial (RCT) to evaluate and compare changes in salivary cortisol and oxytocin levels of first-time pregnant women between experimental and control groups. The women in the experimental group touched and held an infant for 30 min (experimental intervention protocol), whereas those in the control group watched a DVD movie of an infant (control intervention protocol). The primary outcome was salivary cortisol level and the secondary outcome was salivary oxytocin level.” 29
- “ We hypothesize that at 30 min after touching and holding an infant, the salivary cortisol level will significantly decrease and the salivary oxytocin level will increase in the experimental group compared with the control group .” 29
- EXAMPLE 3. Background, aim, and hypothesis are provided
- “In countries where the maternal mortality ratio remains high, antenatal education to increase Birth Preparedness and Complication Readiness (BPCR) is considered one of the top priorities [1]. BPCR includes birth plans during the antenatal period, such as the birthplace, birth attendant, transportation, health facility for complications, expenses, and birth materials, as well as family coordination to achieve such birth plans. In Tanzania, although increasing, only about half of all pregnant women attend an antenatal clinic more than four times [4]. Moreover, the information provided during antenatal care (ANC) is insufficient. In the resource-poor settings, antenatal group education is a potential approach because of the limited time for individual counseling at antenatal clinics.” 30
- “This study aimed to evaluate an antenatal group education program among pregnant women and their families with respect to birth-preparedness and maternal and infant outcomes in rural villages of Tanzania.” 30
- “ The study hypothesis was if Tanzanian pregnant women and their families received a family-oriented antenatal group education, they would (1) have a higher level of BPCR, (2) attend antenatal clinic four or more times, (3) give birth in a health facility, (4) have less complications of women at birth, and (5) have less complications and deaths of infants than those who did not receive the education .” 30
Research questions and hypotheses are crucial components to any type of research, whether quantitative or qualitative. These questions should be developed at the very beginning of the study. Excellent research questions lead to superior hypotheses, which, like a compass, set the direction of research, and can often determine the successful conduct of the study. Many research studies have floundered because the development of research questions and subsequent hypotheses was not given the thought and meticulous attention needed. The development of research questions and hypotheses is an iterative process based on extensive knowledge of the literature and insightful grasp of the knowledge gap. Focused, concise, and specific research questions provide a strong foundation for constructing hypotheses which serve as formal predictions about the research outcomes. Research questions and hypotheses are crucial elements of research that should not be overlooked. They should be carefully thought of and constructed when planning research. This avoids unethical studies and poor outcomes by defining well-founded objectives that determine the design, course, and outcome of the study.
Disclosure: The authors have no potential conflicts of interest to disclose.
Author Contributions:
- Conceptualization: Barroga E, Matanguihan GJ.
- Methodology: Barroga E, Matanguihan GJ.
- Writing - original draft: Barroga E, Matanguihan GJ.
- Writing - review & editing: Barroga E, Matanguihan GJ.
Research Methodologies
Quantitative research methodologies.
- Qualitative Research Methodologies
- Systematic Reviews
- Finding Articles by Methodology
- Design Your Research Project
Library Help
What is quantitative research.
Quantitative methodologies use statistics to analyze numerical data gathered by researchers to answer their research questions. Quantitative methods can be used to answer questions such as:
- What are the relationships between two or more variables?
- What factors are at play in an environment that might affect the behavior or development of the organisms in that environment?
Quantitative methods can also be used to test hypotheses by conducting quasi-experimental studies or designing experiments.
Independent and Dependent Variables
In quantitative research, a variable is something (an intervention technique, a pharmaceutical, a temperature, etc.) that changes. There are two kinds of variables: independent variables and dependent variables . In the simplest terms, the independent variable is whatever the researchers are using to attempt to make a change in their dependent variable.
* This is a real, repeatable experiment you can try on your plants.
Correlational
Researchers will compare two sets of numbers to try and identify a relationship (if any) between two things.
- Köse S., & Murat, M. (2021). Examination of the relationship between smartphone addiction and cyberchondria in adolescents. Archives of Psychiatric Nursing, 35(6): 563-570.
- Pilger et al. (2021). Spiritual well-being, religious/spiritual coping and quality of life among the elderly undergoing hemodialysis: a correlational study. Journal of Religion, Spirituality & Aging, 33(1): 2-15.
Descriptive
Researchers will attempt to quantify a variety of factors at play as they study a particular type of phenomenon or action. For example, researchers might use a descriptive methodology to understand the effects of climate change on the life cycle of a plant or animal.
- Lakshmi, E. (2021). Food consumption pattern and body mass index of adolescents: A descriptive study. International Journal of Nutrition, Pharmacology, Neurological Diseases, 11(4), 293–297.
- Lin, J., Singh, S., Sha, L., Tan, W., Lang, D., Gašević, D., & Chen, G. (2022). Is it a good move? Mining effective tutoring strategies from human–human tutorial dialogues. Future Generation Computer Systems, 127, 194–207.
Experimental
To understand the effects of a variable, researchers will design an experiment where they can control as many factors as possible. This can involve creating control and experimental groups. The experimental group will be exposed to the variable to study its effects. The control group provides data about what happens when the variable is absent. For example, in a study about online teaching, the control group might receive traditional face-to-face instruction while the experimental group would receive their instruction virtually.
- Jinzhang Jia, Yinuo Chen, Guangbo Che, Jinchao Zhu, Fengxiao Wang, & Peng Jia. (2021). Experimental study on the explosion characteristics of hydrogen-methane premixed gas in complex pipe networks. Scientific Reports, 11(1), 1–11.
- Sasaki, R. et al. (2021). Effects of cryotherapy applied at different temperatures on inflammatory pain during the acute phase of arthritis in rats. Physical Therapy, 101(2), 1–9.
Quasi-Experimental/Quasi-Comparative
Researchers will attempt to determine what (if any) effect a variable can have. These studies may have multiple independent variables (causes) and multiple dependent variables (effects), but this can complicate researchers' efforts to find out if A can cause B or if X, Y, and Z are also playing a role.
- Jafari, A., Alami, A., Charoghchian, E., Delshad Noghabi, A., & Nejatian, M. (2021). The impact of effective communication skills training on the status of marital burnout among married women. BMC Women’s Health, 21(1), 1-10.
- Phillips, S. W., Kim, D.-Y., Sobol, J. J., & Gayadeen, S. M. (2021). Total recall?: A quasi-experimental study of officer’s recollection in shoot - don’t shoot simulators. Police Practice and Research, 22(3), 1229–1240.
Surveys can be considered a quantitative methodology if the researchers require their respondents to choose from pre-determined responses.
- Harries et al. (2021). Effects of the COVID-19 pandemic on medical students: A multicenter quantitative study. BMC Medical Education, 21(14), 1-8.
- Call : 801.863.8840
- Text : 801.290.8123
- In-Person Help
- Email a Librarian
- Make an Appointment
- << Previous: Home
- Next: Qualitative Research Methodologies >>
- Last Updated: May 2, 2024 4:22 PM
- URL: https://uvu.libguides.com/methods
- PRO Courses Guides New Tech Help Pro Expert Videos About wikiHow Pro Upgrade Sign In
- EDIT Edit this Article
- EXPLORE Tech Help Pro About Us Random Article Quizzes Request a New Article Community Dashboard This Or That Game Popular Categories Arts and Entertainment Artwork Books Movies Computers and Electronics Computers Phone Skills Technology Hacks Health Men's Health Mental Health Women's Health Relationships Dating Love Relationship Issues Hobbies and Crafts Crafts Drawing Games Education & Communication Communication Skills Personal Development Studying Personal Care and Style Fashion Hair Care Personal Hygiene Youth Personal Care School Stuff Dating All Categories Arts and Entertainment Finance and Business Home and Garden Relationship Quizzes Cars & Other Vehicles Food and Entertaining Personal Care and Style Sports and Fitness Computers and Electronics Health Pets and Animals Travel Education & Communication Hobbies and Crafts Philosophy and Religion Work World Family Life Holidays and Traditions Relationships Youth
- Browse Articles
- Learn Something New
- Quizzes Hot
- This Or That Game
- Train Your Brain
- Explore More
- Support wikiHow
- About wikiHow
- Log in / Sign up
- Education and Communications
- College University and Postgraduate
- Academic Writing
How to Write Research Methodology
Last Updated: May 21, 2023 Approved
This article was co-authored by Alexander Ruiz, M.Ed. and by wikiHow staff writer, Jennifer Mueller, JD . Alexander Ruiz is an Educational Consultant and the Educational Director of Link Educational Institute, a tutoring business based in Claremont, California that provides customizable educational plans, subject and test prep tutoring, and college application consulting. With over a decade and a half of experience in the education industry, Alexander coaches students to increase their self-awareness and emotional intelligence while achieving skills and the goal of achieving skills and higher education. He holds a BA in Psychology from Florida International University and an MA in Education from Georgia Southern University. wikiHow marks an article as reader-approved once it receives enough positive feedback. In this case, several readers have written to tell us that this article was helpful to them, earning it our reader-approved status. This article has been viewed 521,667 times.
The research methodology section of any academic research paper gives you the opportunity to convince your readers that your research is useful and will contribute to your field of study. An effective research methodology is grounded in your overall approach – whether qualitative or quantitative – and adequately describes the methods you used. Justify why you chose those methods over others, then explain how those methods will provide answers to your research questions. [1] X Research source
Describing Your Methods

- In your restatement, include any underlying assumptions that you're making or conditions that you're taking for granted. These assumptions will also inform the research methods you've chosen.
- Generally, state the variables you'll test and the other conditions you're controlling or assuming are equal.

- If you want to research and document measurable social trends, or evaluate the impact of a particular policy on various variables, use a quantitative approach focused on data collection and statistical analysis.
- If you want to evaluate people's views or understanding of a particular issue, choose a more qualitative approach.
- You can also combine the two. For example, you might look primarily at a measurable social trend, but also interview people and get their opinions on how that trend is affecting their lives.

- For example, if you conducted a survey, you would describe the questions included in the survey, where and how the survey was conducted (such as in person, online, over the phone), how many surveys were distributed, and how long your respondents had to complete the survey.
- Include enough detail that your study can be replicated by others in your field, even if they may not get the same results you did. [4] X Research source

- Qualitative research methods typically require more detailed explanation than quantitative methods.
- Basic investigative procedures don't need to be explained in detail. Generally, you can assume that your readers have a general understanding of common research methods that social scientists use, such as surveys or focus groups.

- For example, suppose you conducted a survey and used a couple of other research papers to help construct the questions on your survey. You would mention those as contributing sources.
Justifying Your Choice of Methods

- Describe study participants specifically, and list any inclusion or exclusion criteria you used when forming your group of participants.
- Justify the size of your sample, if applicable, and describe how this affects whether your study can be generalized to larger populations. For example, if you conducted a survey of 30 percent of the student population of a university, you could potentially apply those results to the student body as a whole, but maybe not to students at other universities.

- Reading other research papers is a good way to identify potential problems that commonly arise with various methods. State whether you actually encountered any of these common problems during your research.

- If you encountered any problems as you collected data, explain clearly the steps you took to minimize the effect that problem would have on your results.

- In some cases, this may be as simple as stating that while there were numerous studies using one method, there weren't any using your method, which caused a gap in understanding of the issue.
- For example, there may be multiple papers providing quantitative analysis of a particular social trend. However, none of these papers looked closely at how this trend was affecting the lives of people.
Connecting Your Methods to Your Research Goals

- Depending on your research questions, you may be mixing quantitative and qualitative analysis – just as you could potentially use both approaches. For example, you might do a statistical analysis, and then interpret those statistics through a particular theoretical lens.

- For example, suppose you're researching the effect of college education on family farms in rural America. While you could do interviews of college-educated people who grew up on a family farm, that would not give you a picture of the overall effect. A quantitative approach and statistical analysis would give you a bigger picture.

- If in answering your research questions, your findings have raised other questions that may require further research, state these briefly.
- You can also include here any limitations to your methods, or questions that weren't answered through your research.

- Generalization is more typically used in quantitative research. If you have a well-designed sample, you can statistically apply your results to the larger population your sample belongs to.
Template to Write Research Methodology

Community Q&A
- Organize your methodology section chronologically, starting with how you prepared to conduct your research methods, how you gathered data, and how you analyzed that data. [13] X Research source Thanks Helpful 0 Not Helpful 0
- Write your research methodology section in past tense, unless you're submitting the methodology section before the research described has been carried out. [14] X Research source Thanks Helpful 2 Not Helpful 0
- Discuss your plans in detail with your advisor or supervisor before committing to a particular methodology. They can help identify possible flaws in your study. [15] X Research source Thanks Helpful 0 Not Helpful 0

You Might Also Like

- ↑ http://expertjournals.com/how-to-write-a-research-methodology-for-your-academic-article/
- ↑ http://libguides.usc.edu/writingguide/methodology
- ↑ https://www.skillsyouneed.com/learn/dissertation-methodology.html
- ↑ https://uir.unisa.ac.za/bitstream/handle/10500/4245/05Chap%204_Research%20methodology%20and%20design.pdf
- ↑ https://elc.polyu.edu.hk/FYP/html/method.htm
About This Article

To write a research methodology, start with a section that outlines the problems or questions you'll be studying, including your hypotheses or whatever it is you're setting out to prove. Then, briefly explain why you chose to use either a qualitative or quantitative approach for your study. Next, go over when and where you conducted your research and what parameters you used to ensure you were objective. Finally, cite any sources you used to decide on the methodology for your research. To learn how to justify your choice of methods in your research methodology, scroll down! Did this summary help you? Yes No
- Send fan mail to authors
Reader Success Stories
Prof. Dr. Ahmed Askar
Apr 18, 2020
Did this article help you?
M. Mahmood Shah Khan
Mar 17, 2020
Shimola Makondo
Jul 20, 2019
Zain Sharif Mohammed Alnadhery
Jan 7, 2019
Lundi Dukashe
Feb 17, 2020

Featured Articles

Trending Articles

Watch Articles

- Terms of Use
- Privacy Policy
- Do Not Sell or Share My Info
- Not Selling Info
Get all the best how-tos!
Sign up for wikiHow's weekly email newsletter
Quantitative Data Analysis 101
The lingo, methods and techniques, explained simply.
By: Derek Jansen (MBA) and Kerryn Warren (PhD) | December 2020
Quantitative data analysis is one of those things that often strikes fear in students. It’s totally understandable – quantitative analysis is a complex topic, full of daunting lingo , like medians, modes, correlation and regression. Suddenly we’re all wishing we’d paid a little more attention in math class…
The good news is that while quantitative data analysis is a mammoth topic, gaining a working understanding of the basics isn’t that hard , even for those of us who avoid numbers and math . In this post, we’ll break quantitative analysis down into simple , bite-sized chunks so you can approach your research with confidence.

Overview: Quantitative Data Analysis 101
- What (exactly) is quantitative data analysis?
- When to use quantitative analysis
- How quantitative analysis works
The two “branches” of quantitative analysis
- Descriptive statistics 101
- Inferential statistics 101
- How to choose the right quantitative methods
- Recap & summary
What is quantitative data analysis?
Despite being a mouthful, quantitative data analysis simply means analysing data that is numbers-based – or data that can be easily “converted” into numbers without losing any meaning.
For example, category-based variables like gender, ethnicity, or native language could all be “converted” into numbers without losing meaning – for example, English could equal 1, French 2, etc.
This contrasts against qualitative data analysis, where the focus is on words, phrases and expressions that can’t be reduced to numbers. If you’re interested in learning about qualitative analysis, check out our post and video here .
What is quantitative analysis used for?
Quantitative analysis is generally used for three purposes.
- Firstly, it’s used to measure differences between groups . For example, the popularity of different clothing colours or brands.
- Secondly, it’s used to assess relationships between variables . For example, the relationship between weather temperature and voter turnout.
- And third, it’s used to test hypotheses in a scientifically rigorous way. For example, a hypothesis about the impact of a certain vaccine.
Again, this contrasts with qualitative analysis , which can be used to analyse people’s perceptions and feelings about an event or situation. In other words, things that can’t be reduced to numbers.
How does quantitative analysis work?
Well, since quantitative data analysis is all about analysing numbers , it’s no surprise that it involves statistics . Statistical analysis methods form the engine that powers quantitative analysis, and these methods can vary from pretty basic calculations (for example, averages and medians) to more sophisticated analyses (for example, correlations and regressions).
Sounds like gibberish? Don’t worry. We’ll explain all of that in this post. Importantly, you don’t need to be a statistician or math wiz to pull off a good quantitative analysis. We’ll break down all the technical mumbo jumbo in this post.
Need a helping hand?
As I mentioned, quantitative analysis is powered by statistical analysis methods . There are two main “branches” of statistical methods that are used – descriptive statistics and inferential statistics . In your research, you might only use descriptive statistics, or you might use a mix of both , depending on what you’re trying to figure out. In other words, depending on your research questions, aims and objectives . I’ll explain how to choose your methods later.
So, what are descriptive and inferential statistics?
Well, before I can explain that, we need to take a quick detour to explain some lingo. To understand the difference between these two branches of statistics, you need to understand two important words. These words are population and sample .
First up, population . In statistics, the population is the entire group of people (or animals or organisations or whatever) that you’re interested in researching. For example, if you were interested in researching Tesla owners in the US, then the population would be all Tesla owners in the US.
However, it’s extremely unlikely that you’re going to be able to interview or survey every single Tesla owner in the US. Realistically, you’ll likely only get access to a few hundred, or maybe a few thousand owners using an online survey. This smaller group of accessible people whose data you actually collect is called your sample .
So, to recap – the population is the entire group of people you’re interested in, and the sample is the subset of the population that you can actually get access to. In other words, the population is the full chocolate cake , whereas the sample is a slice of that cake.
So, why is this sample-population thing important?
Well, descriptive statistics focus on describing the sample , while inferential statistics aim to make predictions about the population, based on the findings within the sample. In other words, we use one group of statistical methods – descriptive statistics – to investigate the slice of cake, and another group of methods – inferential statistics – to draw conclusions about the entire cake. There I go with the cake analogy again…
With that out the way, let’s take a closer look at each of these branches in more detail.

Branch 1: Descriptive Statistics
Descriptive statistics serve a simple but critically important role in your research – to describe your data set – hence the name. In other words, they help you understand the details of your sample . Unlike inferential statistics (which we’ll get to soon), descriptive statistics don’t aim to make inferences or predictions about the entire population – they’re purely interested in the details of your specific sample .
When you’re writing up your analysis, descriptive statistics are the first set of stats you’ll cover, before moving on to inferential statistics. But, that said, depending on your research objectives and research questions , they may be the only type of statistics you use. We’ll explore that a little later.
So, what kind of statistics are usually covered in this section?
Some common statistical tests used in this branch include the following:
- Mean – this is simply the mathematical average of a range of numbers.
- Median – this is the midpoint in a range of numbers when the numbers are arranged in numerical order. If the data set makes up an odd number, then the median is the number right in the middle of the set. If the data set makes up an even number, then the median is the midpoint between the two middle numbers.
- Mode – this is simply the most commonly occurring number in the data set.
- In cases where most of the numbers are quite close to the average, the standard deviation will be relatively low.
- Conversely, in cases where the numbers are scattered all over the place, the standard deviation will be relatively high.
- Skewness . As the name suggests, skewness indicates how symmetrical a range of numbers is. In other words, do they tend to cluster into a smooth bell curve shape in the middle of the graph, or do they skew to the left or right?
Feeling a bit confused? Let’s look at a practical example using a small data set.

On the left-hand side is the data set. This details the bodyweight of a sample of 10 people. On the right-hand side, we have the descriptive statistics. Let’s take a look at each of them.
First, we can see that the mean weight is 72.4 kilograms. In other words, the average weight across the sample is 72.4 kilograms. Straightforward.
Next, we can see that the median is very similar to the mean (the average). This suggests that this data set has a reasonably symmetrical distribution (in other words, a relatively smooth, centred distribution of weights, clustered towards the centre).
In terms of the mode , there is no mode in this data set. This is because each number is present only once and so there cannot be a “most common number”. If there were two people who were both 65 kilograms, for example, then the mode would be 65.
Next up is the standard deviation . 10.6 indicates that there’s quite a wide spread of numbers. We can see this quite easily by looking at the numbers themselves, which range from 55 to 90, which is quite a stretch from the mean of 72.4.
And lastly, the skewness of -0.2 tells us that the data is very slightly negatively skewed. This makes sense since the mean and the median are slightly different.
As you can see, these descriptive statistics give us some useful insight into the data set. Of course, this is a very small data set (only 10 records), so we can’t read into these statistics too much. Also, keep in mind that this is not a list of all possible descriptive statistics – just the most common ones.
But why do all of these numbers matter?
While these descriptive statistics are all fairly basic, they’re important for a few reasons:
- Firstly, they help you get both a macro and micro-level view of your data. In other words, they help you understand both the big picture and the finer details.
- Secondly, they help you spot potential errors in the data – for example, if an average is way higher than you’d expect, or responses to a question are highly varied, this can act as a warning sign that you need to double-check the data.
- And lastly, these descriptive statistics help inform which inferential statistical techniques you can use, as those techniques depend on the skewness (in other words, the symmetry and normality) of the data.
Simply put, descriptive statistics are really important , even though the statistical techniques used are fairly basic. All too often at Grad Coach, we see students skimming over the descriptives in their eagerness to get to the more exciting inferential methods, and then landing up with some very flawed results.
Don’t be a sucker – give your descriptive statistics the love and attention they deserve!

Branch 2: Inferential Statistics
As I mentioned, while descriptive statistics are all about the details of your specific data set – your sample – inferential statistics aim to make inferences about the population . In other words, you’ll use inferential statistics to make predictions about what you’d expect to find in the full population.
What kind of predictions, you ask? Well, there are two common types of predictions that researchers try to make using inferential stats:
- Firstly, predictions about differences between groups – for example, height differences between children grouped by their favourite meal or gender.
- And secondly, relationships between variables – for example, the relationship between body weight and the number of hours a week a person does yoga.
In other words, inferential statistics (when done correctly), allow you to connect the dots and make predictions about what you expect to see in the real world population, based on what you observe in your sample data. For this reason, inferential statistics are used for hypothesis testing – in other words, to test hypotheses that predict changes or differences.

Of course, when you’re working with inferential statistics, the composition of your sample is really important. In other words, if your sample doesn’t accurately represent the population you’re researching, then your findings won’t necessarily be very useful.
For example, if your population of interest is a mix of 50% male and 50% female , but your sample is 80% male , you can’t make inferences about the population based on your sample, since it’s not representative. This area of statistics is called sampling, but we won’t go down that rabbit hole here (it’s a deep one!) – we’ll save that for another post .
What statistics are usually used in this branch?
There are many, many different statistical analysis methods within the inferential branch and it’d be impossible for us to discuss them all here. So we’ll just take a look at some of the most common inferential statistical methods so that you have a solid starting point.
First up are T-Tests . T-tests compare the means (the averages) of two groups of data to assess whether they’re statistically significantly different. In other words, do they have significantly different means, standard deviations and skewness.
This type of testing is very useful for understanding just how similar or different two groups of data are. For example, you might want to compare the mean blood pressure between two groups of people – one that has taken a new medication and one that hasn’t – to assess whether they are significantly different.
Kicking things up a level, we have ANOVA, which stands for “analysis of variance”. This test is similar to a T-test in that it compares the means of various groups, but ANOVA allows you to analyse multiple groups , not just two groups So it’s basically a t-test on steroids…
Next, we have correlation analysis . This type of analysis assesses the relationship between two variables. In other words, if one variable increases, does the other variable also increase, decrease or stay the same. For example, if the average temperature goes up, do average ice creams sales increase too? We’d expect some sort of relationship between these two variables intuitively , but correlation analysis allows us to measure that relationship scientifically .
Lastly, we have regression analysis – this is quite similar to correlation in that it assesses the relationship between variables, but it goes a step further to understand cause and effect between variables, not just whether they move together. In other words, does the one variable actually cause the other one to move, or do they just happen to move together naturally thanks to another force? Just because two variables correlate doesn’t necessarily mean that one causes the other.
Stats overload…
I hear you. To make this all a little more tangible, let’s take a look at an example of a correlation in action.
Here’s a scatter plot demonstrating the correlation (relationship) between weight and height. Intuitively, we’d expect there to be some relationship between these two variables, which is what we see in this scatter plot. In other words, the results tend to cluster together in a diagonal line from bottom left to top right.

As I mentioned, these are are just a handful of inferential techniques – there are many, many more. Importantly, each statistical method has its own assumptions and limitations .
For example, some methods only work with normally distributed (parametric) data, while other methods are designed specifically for non-parametric data. And that’s exactly why descriptive statistics are so important – they’re the first step to knowing which inferential techniques you can and can’t use.

How to choose the right analysis method
To choose the right statistical methods, you need to think about two important factors :
- The type of quantitative data you have (specifically, level of measurement and the shape of the data). And,
- Your research questions and hypotheses
Let’s take a closer look at each of these.
Factor 1 – Data type
The first thing you need to consider is the type of data you’ve collected (or the type of data you will collect). By data types, I’m referring to the four levels of measurement – namely, nominal, ordinal, interval and ratio. If you’re not familiar with this lingo, check out the video below.
Why does this matter?
Well, because different statistical methods and techniques require different types of data. This is one of the “assumptions” I mentioned earlier – every method has its assumptions regarding the type of data.
For example, some techniques work with categorical data (for example, yes/no type questions, or gender or ethnicity), while others work with continuous numerical data (for example, age, weight or income) – and, of course, some work with multiple data types.
If you try to use a statistical method that doesn’t support the data type you have, your results will be largely meaningless . So, make sure that you have a clear understanding of what types of data you’ve collected (or will collect). Once you have this, you can then check which statistical methods would support your data types here .
If you haven’t collected your data yet, you can work in reverse and look at which statistical method would give you the most useful insights, and then design your data collection strategy to collect the correct data types.
Another important factor to consider is the shape of your data . Specifically, does it have a normal distribution (in other words, is it a bell-shaped curve, centred in the middle) or is it very skewed to the left or the right? Again, different statistical techniques work for different shapes of data – some are designed for symmetrical data while others are designed for skewed data.
This is another reminder of why descriptive statistics are so important – they tell you all about the shape of your data.
Factor 2: Your research questions
The next thing you need to consider is your specific research questions, as well as your hypotheses (if you have some). The nature of your research questions and research hypotheses will heavily influence which statistical methods and techniques you should use.
If you’re just interested in understanding the attributes of your sample (as opposed to the entire population), then descriptive statistics are probably all you need. For example, if you just want to assess the means (averages) and medians (centre points) of variables in a group of people.
On the other hand, if you aim to understand differences between groups or relationships between variables and to infer or predict outcomes in the population, then you’ll likely need both descriptive statistics and inferential statistics.
So, it’s really important to get very clear about your research aims and research questions, as well your hypotheses – before you start looking at which statistical techniques to use.
Never shoehorn a specific statistical technique into your research just because you like it or have some experience with it. Your choice of methods must align with all the factors we’ve covered here.
Time to recap…
You’re still with me? That’s impressive. We’ve covered a lot of ground here, so let’s recap on the key points:
- Quantitative data analysis is all about analysing number-based data (which includes categorical and numerical data) using various statistical techniques.
- The two main branches of statistics are descriptive statistics and inferential statistics . Descriptives describe your sample, whereas inferentials make predictions about what you’ll find in the population.
- Common descriptive statistical methods include mean (average), median , standard deviation and skewness .
- Common inferential statistical methods include t-tests , ANOVA , correlation and regression analysis.
- To choose the right statistical methods and techniques, you need to consider the type of data you’re working with , as well as your research questions and hypotheses.

Psst... there’s more!
This post was based on one of our popular Research Bootcamps . If you're working on a research project, you'll definitely want to check this out ...
You Might Also Like:
")
75 Comments

Hi, I have read your article. Such a brilliant post you have created.

Thank you for the feedback. Good luck with your quantitative analysis.

Thank you so much.

Thank you so much. I learnt much well. I love your summaries of the concepts. I had love you to explain how to input data using SPSS

Amazing and simple way of breaking down quantitative methods.

This is beautiful….especially for non-statisticians. I have skimmed through but I wish to read again. and please include me in other articles of the same nature when you do post. I am interested. I am sure, I could easily learn from you and get off the fear that I have had in the past. Thank you sincerely.

Send me every new information you might have.

i need every new information

Thank you for the blog. It is quite informative. Dr Peter Nemaenzhe PhD

It is wonderful. l’ve understood some of the concepts in a more compréhensive manner

Your article is so good! However, I am still a bit lost. I am doing a secondary research on Gun control in the US and increase in crime rates and I am not sure which analysis method I should use?

Based on the given learning points, this is inferential analysis, thus, use ‘t-tests, ANOVA, correlation and regression analysis’

Well explained notes. Am an MPH student and currently working on my thesis proposal, this has really helped me understand some of the things I didn’t know.

I like your page..helpful

wonderful i got my concept crystal clear. thankyou!!

This is really helpful , thank you

Thank you so much this helped

Wonderfully explained

thank u so much, it was so informative

THANKYOU, this was very informative and very helpful

This is great GRADACOACH I am not a statistician but I require more of this in my thesis
Include me in your posts.

This is so great and fully useful. I would like to thank you again and again.

Glad to read this article. I’ve read lot of articles but this article is clear on all concepts. Thanks for sharing.

Thank you so much. This is a very good foundation and intro into quantitative data analysis. Appreciate!

You have a very impressive, simple but concise explanation of data analysis for Quantitative Research here. This is a God-send link for me to appreciate research more. Thank you so much!

Avery good presentation followed by the write up. yes you simplified statistics to make sense even to a layman like me. Thank so much keep it up. The presenter did ell too. i would like more of this for Qualitative and exhaust more of the test example like the Anova.

This is a very helpful article, couldn’t have been clearer. Thank you.

Awesome and phenomenal information.Well done

The video with the accompanying article is super helpful to demystify this topic. Very well done. Thank you so much.

thank you so much, your presentation helped me a lot

I don’t know how should I express that ur article is saviour for me 🥺😍

It is well defined information and thanks for sharing. It helps me a lot in understanding the statistical data.

I gain a lot and thanks for sharing brilliant ideas, so wish to be linked on your email update.

Very helpful and clear .Thank you Gradcoach.

Thank for sharing this article, well organized and information presented are very clear.

VERY INTERESTING AND SUPPORTIVE TO NEW RESEARCHERS LIKE ME. AT LEAST SOME BASICS ABOUT QUANTITATIVE.

An outstanding, well explained and helpful article. This will help me so much with my data analysis for my research project. Thank you!

wow this has just simplified everything i was scared of how i am gonna analyse my data but thanks to you i will be able to do so

simple and constant direction to research. thanks

This is helpful

Great writing!! Comprehensive and very helpful.

Do you provide any assistance for other steps of research methodology like making research problem testing hypothesis report and thesis writing?

Thank you so much for such useful article!

Amazing article. So nicely explained. Wow

Very insightfull. Thanks

I am doing a quality improvement project to determine if the implementation of a protocol will change prescribing habits. Would this be a t-test?

The is a very helpful blog, however, I’m still not sure how to analyze my data collected. I’m doing a research on “Free Education at the University of Guyana”

tnx. fruitful blog!

So I am writing exams and would like to know how do establish which method of data analysis to use from the below research questions: I am a bit lost as to how I determine the data analysis method from the research questions.
Do female employees report higher job satisfaction than male employees with similar job descriptions across the South African telecommunications sector? – I though that maybe Chi Square could be used here. – Is there a gender difference in talented employees’ actual turnover decisions across the South African telecommunications sector? T-tests or Correlation in this one. – Is there a gender difference in the cost of actual turnover decisions across the South African telecommunications sector? T-tests or Correlation in this one. – What practical recommendations can be made to the management of South African telecommunications companies on leveraging gender to mitigate employee turnover decisions?
Your assistance will be appreciated if I could get a response as early as possible tomorrow

This was quite helpful. Thank you so much.

wow I got a lot from this article, thank you very much, keep it up

Thanks for yhe guidance. Can you send me this guidance on my email? To enable offline reading?

Thank you very much, this service is very helpful.

Every novice researcher needs to read this article as it puts things so clear and easy to follow. Its been very helpful.

Wonderful!!!! you explained everything in a way that anyone can learn. Thank you!!

I really enjoyed reading though this. Very easy to follow. Thank you

Many thanks for your useful lecture, I would be really appreciated if you could possibly share with me the PPT of presentation related to Data type?

Thank you very much for sharing, I got much from this article

This is a very informative write-up. Kindly include me in your latest posts.

Very interesting mostly for social scientists

Thank you so much, very helpfull
You’re welcome 🙂

woow, its great, its very informative and well understood because of your way of writing like teaching in front of me in simple languages.

I have been struggling to understand a lot of these concepts. Thank you for the informative piece which is written with outstanding clarity.

very informative article. Easy to understand

Beautiful read, much needed.

Always greet intro and summary. I learn so much from GradCoach

Quite informative. Simple and clear summary.

I thoroughly enjoyed reading your informative and inspiring piece. Your profound insights into this topic truly provide a better understanding of its complexity. I agree with the points you raised, especially when you delved into the specifics of the article. In my opinion, that aspect is often overlooked and deserves further attention.

Absolutely!!! Thank you

Thank you very much for this post. It made me to understand how to do my data analysis.

its nice work and excellent job ,you have made my work easier
Submit a Comment Cancel reply
Your email address will not be published. Required fields are marked *
Save my name, email, and website in this browser for the next time I comment.
- Print Friendly
Quantitative research: Understanding the approaches and key elements
Quantitative research has many benefits and challenges but understanding how to properly conduct it can lead to a successful marketing research project.
Choosing the right quantitative approach
Editor’s note: Allison Von Borstel is the associate director of creative analytics at The Sound. This is an edited version of an article that originally appeared under the title “ Understanding Quantitative Research Approaches .”
What is quantitative research?
The systematic approaches that ground quantitative research involve hundreds or thousands of data points for one research project. The wonder of quantitative research is that each data point, or row in a spreadsheet, is a person and has a human story to tell.
Quantitative research aggregates voices and distills them into numbers that uncover trends, illuminates relationships and correlations that inform decision-making with solid evidence and clarity.
The benefits of quantitative approach es
Why choose a quantitative approach? Because you want a very clear story grounded in statistical rigor as a guide to making smart, data-backed decisions.
Quantitative approaches shine because they:
Involve a lot of people
Large sample sizes (think hundreds or thousands) enable researchers to generalize findings because the sample is representative of the total population.
They are grounded in statistical rigor
Allowing for precise measurement and analysis of data, providing statistically significant results that bolster confidence in research.
Reduce bias
Structured data collection and analysis methods enhance the reliability of findings.
Boost efficiency
Quantitative methods often follow a qualitative phase, allowing researchers to validate findings by reporting the perspective of hundreds of people in a fraction of the time.
Widen the analysis’ scope
The copious data collected in just a 20-minute (max) survey positions researchers to evaluate a broad spectrum of variables within the data. This thorough comprehension is instrumental when dealing with complex questions that require in-depth analysis.
Quantitative approaches have hurdles, which include:
Limited flexibility
Once a survey is fielded, or data is gathered, there’s no opportunity to ask a live follow-up question. While it is possible to follow-up with the same people for two surveys, the likelihood of sufficient responses is small.
Battling bots
One of the biggest concerns in data quality is making sure data represents people and not bots.
Missing body language cues
Numbers, words and even images lack the cues that a researcher could pick up on during an interview. Unlike in a qualitative focus group, where one might deduce that a person is uncertain of an answer, in quantitative research, a static response is what the researcher works with.
Understanding quantitative research methods
Quantitative approaches approach research from the same starting point as qualitative approaches – grounded in business objectives with a specific group of people to study.
Once research has kicked off, the business objective thoroughly explored and the approach selected, research follows a general outline:
Consider what data is needed
Think about what type of information needs to be gathered, with an approach in mind. While most quantitative research involves numbers, words and images also count.
- Numbers: Yes, the stereotypical rows of numbers in spreadsheets. Rows that capture people’s opinions and attitudes and are coded to numbers for comparative analytics. Numerical analysis is used for everything from descriptive statistics to regression/predictive analysis.
- Words: Text analysis employs a machine learning model to identify sentiment, emotion and meaning of text. Often used for sentiment analysis or content classification, it can be applied to single-word responses, elaborate open-ends, reviews or even social media posts.
- Images: Image analysis extracts meaningful information from images. A computer vision model that takes images as inputs and outputs numerical information (e.g., having a sample upload their favorite bag of chips and yielding the top three brands).
Design a survey
Create a survey to capture the data needed to address the objective. During this process, different pathways could be written to get a dynamic data set (capturing opinions that derive from various lived experiences). Survey logic is also written to provide a smooth UX experience for respondents.
Prepare the data
The quality of quantitative research rests heavily on the quality of data. After data is collected (typically by fielding a survey or collecting already-existing data, more on that in a bit), it’s time to clean the data.
Begin the analysis process
Now that you have a robust database (including numbers, words or images), it’s time to listen to the story that the data tells. Depending on the research approach used, advanced analytics come into play to tease out insights and nuances for the business objective.
Tell the story
Strip the quantitative jargon and convey the insights from the research. Just because it’s quantitative research does not mean the results have to be told in a monotone drone with a monochrome chart. Answer business objectives dynamically, knowing that research is grounded in statistically sound information.
The two options: Primary vs. secondary research
The two methods that encompass quantitative approaches are primary (collecting data oneself) and secondary (relying on already existing data).
Primary research is primarily used
Most research involves primary data collection – where the researcher collects data directly. The main approach in primary research is survey data collection.
The types of survey questions
Span various measurement scales (nominal, ordinal, interval and ratio) using a mix of question types (single and multi-choice, scales, matrix or open-ends).
Analysis methods
Custom surveys yield great data for a variety of methods in market analysis. Here are a couple favorites:
- Crosstabulation : Used to uncover insights that might not be obvious at first glance. This analysis organizes data into categories, revealing trends or patterns between variables.
- Sentiment analysis: Used to sift through text to gauge emotions, opinions and attitudes. This method helps understand perception, fine-tune strategies and effectively respond to feedback.
- Market sizing: Used to map out the dimensions of a market. By calculating the total potential demand for a product or service in a specific market, this method reveals the scope of opportunities needed to make informed decisions about investment and growth strategies.
- Conjoint analysis : Used to uncover what people value most in products or services. It breaks down features into bits and pieces and asks people to choose their ideal combo. By analyzing these preferences, this analysis reveals the hidden recipe for customer satisfaction.
- Job-To-Be-Done : Used to understand the underlying human motivations that drive people to act. People are multifaceted and experience a myriad of situations each day – meaning that a brand’s competition isn’t limited to in-category.
- Segmentation: Used to identify specific cohorts within a greater population. It groups people with similar characteristics, behaviors or needs together. This method helps tailor products or services to specific groups, boosting satisfaction and sales.
Statistical rigor
Regardless of method, a quantitative approach then enables researchers to draw inferences and make predictions based upon the confidence in the data (looking at confidence intervals, margin of error, etc.)
Let’s not forget secondary research
By accessing a wide range of existing information, this research can be a cost-effective way to gain insights or can supplement primary research findings.
Here are popular options:
Government sources
Government sources can be extremely in-depth, can range across multiple industries and markets and reflect millions of people. This type of data is often instrumental for longitudinal or cultural trends analysis.
Educational institutions
Research universities conduct in-depth studies on a variety of topics, often aggregating government data, nonprofit data and primary data.
Client data
This includes any research that was conducted for or by companies before the present research project. Whether it’s data gathered from customer reviews or prior quantitative work, these secondary resources can help extend findings and detect trends by connecting past data to future data.
Quantitative research enhances research projects
Quantitative research approaches are so much more than “how much” or “how many,” they reveal the why behind people’s actions, emotions and behaviors. By using standardized collection methods, like surveys, quant instills confidence and rigor in findings.
Canvs AI: Unlock critical insights from unstructured feedback Related Categories: Research Industry, Data Analysis, Quantitative Research Research Industry, Data Analysis, Quantitative Research, Artificial Intelligence / AI, Text Analytics
Segmentation in the pharma industry: How to create resilient strategies Related Categories: Research Industry, Sampling, Survey Research Research Industry, Sampling, Survey Research, Market Segmentation Studies, Segmentation Studies, Health Care (Healthcare), Health Care (Healthcare) Research, Patients , Questionnaire Analysis, Social Media Research
Leveraging AI to unlock qualitative research at scale Related Categories: Research Industry, Quantitative Research, Sampling, Hybrid Research (Qual/Quant) Research Industry, Quantitative Research, Sampling, Hybrid Research (Qual/Quant), Artificial Intelligence / AI, Qualitative Research, Attitude/Usage Studies, Consumer Research, Consumers, Data Visualization/Infographics
Situational choice experiments for marketing research Related Categories: Research Industry, Data Analysis, Survey Research Research Industry, Data Analysis, Survey Research, Conjoint Analysis/Trade-Off Analysis, Discrete Choice Modeling, Physicians, Software-Conjoint Analysis, Questionnaire Analysis
IMAGES
VIDEO
COMMENTS
Types of Research Methodology are as follows: Quantitative Research Methodology. This is a research methodology that involves the collection and analysis of numerical data using statistical methods. This type of research is often used to study cause-and-effect relationships and to make predictions. Qualitative Research Methodology
Step 1: Explain your methodological approach. Step 2: Describe your data collection methods. Step 3: Describe your analysis method. Step 4: Evaluate and justify the methodological choices you made. Tips for writing a strong methodology chapter. Other interesting articles.
Revised on June 22, 2023. Quantitative research is the process of collecting and analyzing numerical data. It can be used to find patterns and averages, make predictions, test causal relationships, and generalize results to wider populations. Quantitative research is the opposite of qualitative research, which involves collecting and analyzing ...
Quantitative methods emphasize objective measurements and the statistical, mathematical, or numerical analysis of data collected through polls, questionnaires, and surveys, or by manipulating pre-existing statistical data using computational techniques.Quantitative research focuses on gathering numerical data and generalizing it across groups of people or to explain a particular phenomenon.
Revised on 10 October 2022. Your research methodology discusses and explains the data collection and analysis methods you used in your research. A key part of your thesis, dissertation, or research paper, the methodology chapter explains what you did and how you did it, allowing readers to evaluate the reliability and validity of your research.
You can use quantitative research methodology if your research requires you to validate or justify the obtained results. In quantitative methods, surveys, tests, experiments, and evaluations of current databases can be advantageously used as instruments If your research involves testing some hypothesis, then use this methodology. 3. Amalgam ...
Do yourself a favour and start with the end in mind. Section 1 - Introduction. As with all chapters in your dissertation or thesis, the methodology chapter should have a brief introduction. In this section, you should remind your readers what the focus of your study is, especially the research aims. As we've discussed many times on the blog ...
Bem, Daryl J. Writing the Empirical Journal Article. Psychology Writing Center. University of Washington; Denscombe, Martyn. The Good Research Guide: For Small-Scale Social Research Projects. 5th edition.Buckingham, UK: Open University Press, 2014; Lunenburg, Frederick C. Writing a Successful Thesis or Dissertation: Tips and Strategies for Students in the Social and Behavioral Sciences.
To structure your methods section, you can use the subheadings of "Participants," "Materials," and "Procedures.". These headings are not mandatory—aim to organize your methods section using subheadings that make sense for your specific study. Note that not all of these topics will necessarily be relevant for your study.
A methodology for a quantitative study begins with a reiteration of the research question and its context. This is followed by the research design, where the methods used to gather, process and analyze the data are given. This is usually preceded or followed by a justification of the appropriateness of the research design.
Unlike in quantitative research where hypotheses are usually developed to be tested, qualitative research can lead to both hypothesis-testing and hypothesis-generating outcomes.2 When studies require both quantitative and qualitative research questions, this suggests an integrative process between both research methods wherein a single mixed ...
Mixed Methods: Combines quantitative and qualitative approaches to offer a comprehensive understanding of the research problem. Writing the Methodology Section: Introduce the methodological approach. Establish the connection between the methodology and the research problem. Describe the research instruments and analysis methods.
The methodology section of your paper describes how your research was conducted. This information allows readers to check whether your approach is accurate and dependable. A good methodology can help increase the reader's trust in your findings. First, we will define and differentiate quantitative and qualitative research.
The results chapter (also referred to as the findings or analysis chapter) is one of the most important chapters of your dissertation or thesis because it shows the reader what you've found in terms of the quantitative data you've collected. It presents the data using a clear text narrative, supported by tables, graphs and charts.
In quantitative research, a variable is something (an intervention technique, a pharmaceutical, a temperature, etc.) that changes. There are two kinds of variables: independent variables and dependent variables.In the simplest terms, the independent variable is whatever the researchers are using to attempt to make a change in their dependent variable.
Quantitative research methods provide an relatively conclusive answer to the research questions. When the data is collected and analyzed in accordance with standardized, reputable methodology, the results are usually trustworthy. With statistically significant sample sizes, the results can be generalized to an entire target group.
Instruments. This section should include the instruments you plan on using to measure the variables in the research questions. (a) the source or developers of the instrument. (b) validity and reliability information. •. (c) information on how it was normed. •. (d) other salient information (e.g., number of. items in each scale, subscales ...
A quantitative approach and statistical analysis would give you a bigger picture. 3. Identify how your analysis answers your research questions. Relate your methodology back to your original research questions and present a proposed outcome based on your analysis.
A research design is a strategy for answering your research question using empirical data. Creating a research design means making decisions about: Your overall research objectives and approach. Whether you'll rely on primary research or secondary research. Your sampling methods or criteria for selecting subjects. Your data collection methods.
Factor 1 - Data type. The first thing you need to consider is the type of data you've collected (or the type of data you will collect). By data types, I'm referring to the four levels of measurement - namely, nominal, ordinal, interval and ratio. If you're not familiar with this lingo, check out the video below.
Structured data collection and analysis methods enhance the reliability of findings. Boost efficiency. Quantitative methods often follow a qualitative phase, allowing researchers to validate findings by reporting the perspective of hundreds of people in a fraction of the time. Widen the analysis' scope
Extend research proposal to cover the qualitative and quantitative methods, primary data using observation, interviews and questionnaires. The essay may not choose both qualitative and quantitative methods but you must discuss the advantages and disadvantages of both even if you do not use them.
When collecting and analyzing data, quantitative research deals with numbers and statistics, while qualitative research deals with words and meanings. Both are important for gaining different kinds of knowledge. Quantitative research. Quantitative research is expressed in numbers and graphs. It is used to test or confirm theories and assumptions.
Data Collection | Definition, Methods & Examples. Published on June 5, 2020 by Pritha Bhandari.Revised on June 21, 2023. Data collection is a systematic process of gathering observations or measurements. Whether you are performing research for business, governmental or academic purposes, data collection allows you to gain first-hand knowledge and original insights into your research problem.