Flowgorithm

Flowgorithm Variables
Flowgorithm 0 Comments
Table of Contents
To use variables in a flowchart, we need to create them. Variables are named memory locations that hold or store data in the program. The flowchart identifies each variable with a name called an Identifier .
Declare Variable
We use the Declare shape to declare a variable. Give the variable a name and specify the data type. To add the Declare shape to the flowchart, click on the flow control arrow line between the Main and End symbols.
Select the Declare symbol from the symbols pop-up window. Click on the Declare shape to add it.

Double-click on the Declare shape to open the Declare properties Window. We can name the variable and set the data type from the Type drop-down. Please note that Identifiers must start with a letter and avoid naming variables with reserved words.
Assign value
To assign a value to a variable, double-click on the line and choose the Assign shape—Double-click on the Assign shape to bring up the Assignment Properties window. Enter the variable name and the appropriate value, and click the OK button.
Sample Declare and Assign shapes in a flowchart. A foo variable is declared as an Integer data type. The foo variable is assigned 25 as the value.
When we assign a value to the variable for the first time it’s called the variable initialization. In this example, we have initialized the variable foo to 25.
Constant vs Variable
In the above example, the foo variable can be re-assigned to another value in the program flow. A variable can change its value during the flowchart or program run. On the other hand, Constant doesn’t change its value during the program run. The value of the constant will be the same throughout the flowchart/program.
pi = 3.1415 (approx)
pi value is a constant in the program. The value of pi is predefined by the Flowgorithm. We can use constants in the flowchart. Once assigned the value of the constant would not change during the program run. It’s a good programming practice to denote user-defined constants in the flowcharts in uppercase.
Flowgorithm Tutorials
Flowgorithm flowchart tutorials on this website:
https://www.testingdocs.com/flowgorithm-flowchart-tutorial/
Flowgorithm Website
For more information on the Flowgorithm tool, please visit the official website at:
http://flowgorithm.org/
Related Posts

Flowgorithm /
Flowgorithm Pen Symbol

Flowgorithm 4 Features

Flowgorithm Conditional Breakpoint

Square Patterns using Turtle Graphics

Flowgorithm Layouts

Flowgorithm File Errors

Update Flowgorithm Software

Flowgorithm Turtle Graphics

Flowgorithm 3 New Features

Flowgorithm Features

- Demo Videos
- Interactive Product Tours
- Request Demo
Flowchart Tutorial (with Symbols, Guide and Examples)
A flowchart is simply a graphical representation of steps. It shows steps in sequential order and is widely used in presenting the flow of algorithms, workflow or processes. Typically, a flowchart shows the steps as boxes of various kinds, and their order by connecting them with arrows.

What is a Flowchart?
A flowchart is a graphical representations of steps. It was originated from computer science as a tool for representing algorithms and programming logic but had extended to use in all other kinds of processes. Nowadays, flowcharts play an extremely important role in displaying information and assisting reasoning. They help us visualize complex processes, or make explicit the structure of problems and tasks. A flowchart can also be used to define a process or project to be implemented.
Flowchart Symbols
Different flowchart shapes have different conventional meanings. The meanings of some of the more common shapes are as follows:
The terminator symbol represents the starting or ending point of the system.

A box indicates some particular operation.

This represents a printout, such as a document or a report.

A diamond represents a decision or branching point. Lines coming out from the diamond indicates different possible situations, leading to different sub-processes.

It represents information entering or leaving the system. An input might be an order from a customer. Output can be a product to be delivered.

On-Page Reference
This symbol would contain a letter inside. It indicates that the flow continues on a matching symbol containing the same letter somewhere else on the same page.

Off-Page Reference
This symbol would contain a letter inside. It indicates that the flow continues on a matching symbol containing the same letter somewhere else on a different page.

Delay or Bottleneck
Identifies a delay or a bottleneck.

Lines represent the flow of the sequence and direction of a process.
When to Draw Flowchart?
Using a flowchart has a variety of benefits:
- It helps to clarify complex processes.
- It identifies steps that do not add value to the internal or external customer, including delays; needless storage and transportation; unnecessary work, duplication, and added expense; breakdowns in communication.
- It helps team members gain a shared understanding of the process and use this knowledge to collect data, identify problems, focus discussions, and identify resources.
- It serves as a basis for designing new processes.
Flowchart examples
Here are several flowchart examples. See how you can apply a flowchart practically.
Flowchart Example – Medical Service
This is a hospital flowchart example that shows how clinical cases shall be processed. This flowchart uses decision shapes intensively in representing alternative flows.

Flowchart Example – Simple Algorithms
A flowchart can also be used in visualizing algorithms, regardless of its complexity. Here is an example that shows how flowchart can be used in showing a simple summation process.

Flowchart Example – Calculate Profit and Loss
The flowchart example below shows how profit and loss can be calculated.

Creating a Flowchart in Visual Paradigm
Let’s see how to draw a flowchart in Visual Paradigm. We will use a very simple flowchart example here. You may expand the example when finished this tutorial.
- Select Diagram > New from the main menu.

- Enter the name of the flowchart and click OK .

- Enter Add items to Cart as the name of the process.

Turn every software project into a successful one.
We use cookies to offer you a better experience. By visiting our website, you agree to the use of cookies as described in our Cookie Policy .
© 2024 by Visual Paradigm. All rights reserved.
- Privacy statement
Want to create or adapt books like this? Learn more about how Pressbooks supports open publishing practices.
Kenneth Leroy Busbee
A flowchart is a type of diagram that represents an algorithm, workflow or process. The flowchart shows the steps as boxes of various kinds, and their order by connecting the boxes with arrows. This diagrammatic representation illustrates a solution model to a given problem. Flowcharts are used in analyzing, designing, documenting or managing a process or program in various fields. [1]
Common flowcharting symbols and examples follow. When first reading this section, focus on the simple symbols and examples. Return to this section in later chapters to review the advanced symbols and examples.
Simple Flowcharting Symbols
The rounded rectangles, or terminal points, indicate the flowchart’s starting and ending points.

Note: The default flow is left to right and top to bottom (the same way you read English). To save time arrowheads are often only drawn when the flow lines go contrary the normal.

Input/Output
The parallelograms designate input or output operations.

The rectangle depicts a process such as a mathematical computation, or a variable assignment.

The diamond is used to represent the true/false statement being tested in a decision symbol.

Advanced Flowcharting Symbols
Module call.
A program module is represented in a flowchart by rectangle with some lines to distinguish it from process symbol. Often programmers will make a distinction between program control and specific task modules as shown below.
Local module: usually a program control function.

Library module: usually a specific task function.

Sometimes a flowchart is broken into two or more smaller flowcharts. This is usually done when a flowchart does not fit on a single page, or must be divided into sections. A connector symbol, which is a small circle with a letter or number inside it, allows you to connect two flowcharts on the same page. A connector symbol that looks like a pocket on a shirt, allows you to connect to a flowchart on a different page.
On-Page Connector

Off-Page Connector

Simple Examples
We will demonstrate various flowcharting items by showing the flowchart for some pseudocode.
pseudocode: Function with no parameter passing

pseudocode: Function main calling the clear monitor function

Sequence Control Structures
The next item is pseudocode for a simple temperature conversion program. This demonstrates the use of both the on-page and off-page connectors. It also illustrates the sequence control structure where nothing unusual happens. Just do one instruction after another in the sequence listed.
pseudocode: Sequence control structure

Advanced Examples
Selection control structures.
pseudocode: If then Else

pseudocode: Case

Iteration (Repetition) Control Structures
pseudocode: While

pseudocode: For
The for loop does not have a standard flowcharting method and you will find it done in different ways. The for loop as a counting loop can be flowcharted similar to the while loop as a counting loop.

pseudocode: Do While

pseudocode: Repeat Until

- cnx.org: Programming Fundamentals – A Modular Structured Approach using C++
- Wikipedia: Flowchart ↵
Programming Fundamentals Copyright © 2018 by Kenneth Leroy Busbee is licensed under a Creative Commons Attribution-ShareAlike 4.0 International License , except where otherwise noted.
Share This Book
Flowchart Symbols and Notation
What do you want to do with flowcharts, i want to create my own flowchart on lucidchart., i want to create a flowchart from a ready-made template..
Don’t be intimidated by the wide array of flowchart shapes. Each symbol has a specific meaning and context where its use is appropriate. If you get confused while drawing your flow chart, remember that most charts can be drawn with just a few common symbols, which are listed below.
4 minute read
Want to create a flowchart of your own? Try Lucidchart. It's fast, easy, and totally free.
Common flowchart symbols
These flowchart shapes and symbols are some of the most common types you'll find in most flowchart diagrams.
Additional flowchart symbols
Many of these additional flowchart symbols are best utilized when mapping out a process flow diagram for apps, user flow, data processing, etc.
Standard vs. non-standard flowchart symbols
Additional resources.
- How to Make a Flowchart in Excel
- What is a flowchart and how to create one
- How to Make a Flowchart
- How to Make a Flowchart in PowerPoint
- How to Make a Flowchart in Word
- What is a Flowchart
If we don’t have the shape you’re looking for, Lucidchart allows you to also upload any and all shapes you want to use in addition to our own extensive shape library. Try mapping out your process flow with Lucidchart today!
- Spider Diagram Guide
- 5 Whys Template
- Assumption Grid Template
- Brainstorming Templates
- Brainwriting Template
- Innovation Techniques
- 50 Business Diagrams
- Business Model Canvas
- Change Control Process
- Change Management Process
- Macro Environmental Analysis
- NOISE Analysis
- Profit & Loss Templates
- Scenario Planning
- What are Tree Diagrams
- Winning Brand Strategy
- Work Management Systems
- Balanced Scorecard
- Developing Action Plans
- Guide to setting OKRS
- How to Write a Memo
- Improve Productivity & Efficiency
- Mastering Task Analysis
- Mastering Task Batching
- Monthly Budget Templates
- Program Planning
- Top Down Vs. Bottom Up
- Weekly Schedule Templates
- Cash Cow Matrix
- Kaizen Principles
- Opportunity Mapping
- Strategic-Goals
- Strategy Mapping
- Strategy vs Tactics
- T Chart Guide
- Business Continuity Plan
- Developing Your MVP
- Incident Management
- Needs Assessment Process
- Product Development From Ideation to Launch
- Value-Proposition-Canvas
- Visualizing Competitive Landscape
- Communication Plan
- Graphic Organizer Creator
- Fault Tree Software
- Bowman's Strategy Clock Template
- Decision Matrix Template
- Communities of Practice
- Goal Setting for 2024
- Meeting Templates
- Meetings Participation
- Microsoft Teams Brainstorming
- Retrospective Guide
- Skip Level Meetings
- Visual Documentation Guide
- Visual Note Taking
- Weekly Meetings
- Affinity Diagrams
- Business Plan Presentation
- Post-Mortem Meetings
- Team Building Activities
- WBS Templates
- Online Whiteboard Tool
- Communications Plan Template
- Idea Board Online
- Meeting Minutes Template
- Genograms in Social Work Practice
- Conceptual Framework
- How to Conduct a Genogram Interview
- How to Make a Genogram
- Genogram Questions
- Genograms in Client Counseling
- Understanding Ecomaps
- Visual Research Data Analysis Methods
- House of Quality Template
- Customer Problem Statement Template
- Competitive Analysis Template
- Creating Operations Manual
- Knowledge Base
- Folder Structure Diagram
- Online Checklist Maker
- Lean Canvas Template
- Instructional Design Examples
- Genogram Maker
- Work From Home Guide
- Strategic Planning
- Employee Engagement Action Plan
- Huddle Board
- One-on-One Meeting Template
- Story Map Graphic Organizers
- Introduction to Your Workspace
- Managing Workspaces and Folders
- Adding Text
- Collaborative Content Management
- Creating and Editing Tables
- Adding Notes
- Introduction to Diagramming
- Using Shapes
- Using Freehand Tool
- Adding Images to the Canvas
- Accessing the Contextual Toolbar
- Using Connectors
- Working with Tables
- Working with Templates
- Working with Frames
- Using Notes
- Access Controls
- Exporting a Workspace
- Real-Time Collaboration
- Notifications
- Using Creately VIZ
- Meet Creately VIZ
- Unleashing the Power of Collaborative Brainstorming
- Uncovering the potential of Retros for all teams
- Collaborative Apps in Microsoft Teams
- Hiring a Great Fit for Your Team
- Project Management Made Easy
- Cross-Corporate Information Radiators
- Creately 4.0 - Product Walkthrough
- What's New
Ultimate Flowchart Tutorial | Learn What is a flowchart and How to create a flowchart
So you want to learn flowcharts? Well, This flowchart tutorial will teach you all you need to know. It will cover the history of flowcharts, flowchart symbols, how to create flowcharts, flowchart best practices and we’ve also included a section to answer frequent questions about flowcharts. Best of all you can use our flowchart software.
Creately already has some really awesome articles and videos covering various things related to flowcharts like meanings of flowchart symbols, how to use swimlanes in flowcharts, flowchart best practices, case studies, and much more.
History of Flowcharts
Frank Gilberth introduced flowcharts in 1921, and they were called “Process Flow Charts” at the beginning. Allan H. Mogensen is credited with training business people on how to use flowcharts. Wikipedia has a great summary of the history of flowcharts, read more in this wiki section .
What is a Flowchart
Flowcharts are visual representations of processes and systems, showing the various steps, decision points, and paths through a process. In a wide range of fields, including software development, engineering, business, and education, it is used to help understand, analyze, and optimize processes. A well-designed flowchart should be easy to read and follow a logical sequence of steps.
Flowchart Symbols

Flowchart symbols are graphical representations of various components of a process or system. Each symbol is used to denote a particular action, decision, or result in the process being represented. Each symbol also has a specific meaning.
So what are the different symbols used in a flowchart?. Most people are only aware of basic symbols like processes and decision blocks. But there are many more symbols to make your flowchart more meaningful. The above image shows all the standard flowchart symbols.
The most common symbol used in a flowchart is the rectangle. A rectangle represents a process, operation, or a task. The next most common symbol is the diamond which is used to represent a decision.
With this following list, you can figure out the most commonly used flowchart symbols as well as those that are little-known. All these shapes are available in Creately and you can try out a demo or take a look at some flowchart examples for more context.
Terminal / Terminator

The terminator shows where your process begins or ends. You can use words like ‘Start’, ‘Begin’, ‘End’ inside the terminator shape to make things more obvious.
Process / Rectangle

Flowchart process shape is used to represent a process, action step, or operation. While these are pictured with rectangles, the text in the rectangle mostly includes a verb. For example, ‘Edit Video’, ‘Try Again’, ‘Choose Your Plan’.n’.

The Data object, often referred to as the I/O Shape shows the Inputs to and Outputs from a process. This takes the shape of a parallelogram.
Decision / Conditional

The decision shape is represented as a Diamond. This object is always used in a process flow to ask a question. And, the answer to the question determines the arrows coming out of the Diamond. This shape is quite unique with two arrows coming out of it. One from the bottom point corresponding to Yes or True and one from either the right/left point corresponding to No or False. The arrows should always be labeled to avoid confusion in the process flow.

The document object is a rectangle with a wave-like base. This shape is used to represent a Document or Report in a process flow.
Stored Data

This is a general data storage object used in the process flow as opposed to data that could be also stored on a hard drive, magnetic tape, memory card, of any other storage device.
Direct Data

Direct Data object in a process flow represents information stored which can be accessed directly. This object represents a computer’s hard drive.
Internal Storage

This is a shape that is commonly found in programming flowcharts to illustrate the information stored in memory, as opposed to on a file. This shape is often referred to as the magnetic core memory of early computers, or the random access memory (RAM) as we call it today.
Sequential Access

This object takes the shape of a reel of tape. It represents information stored in a sequence, such as data on a magnetic tape.
Manual Input

This object is represented by a rectangle with the top sloping up from left to right. The Manual Input object signifies an action where the user is prompted for information that must be manually input into a system.
Subroutine / Predefined Process

This shape takes two names – ‘Subroutine’ or ‘Predefined Process’. Its called a subroutine if you use this object in flowcharting a software program. This allows you to write one subroutine and call it as often as you like from anywhere in the code.
The same object is also called a Predefined Process. This means the flowchart for the predefined process has to be already drawn, and you should reference the flowchart for more information.
Although these are the standard symbols available in most flowchart software, some people do use different shapes for different meanings. The most common example of this is using circles to denote start and end. The examples in this flowchart tutorial will stick with the standard symbols.
How to Draw a Flowchart
How do you draw a flowchart? Well, our flowcharting tool is a good place to start. But before directly using the tool, let’s take a look at some basics.
There are four main types of flowcharts. Document flowchart, System flowchart, data flowchart, and program flowchart. Not everyone agrees with this categorization, but the core principles of drawing a flowchart remain the same. You need to consider a few things when drawing a flowchart, Check out 6 useful tips on drawing flowcharts before you start.
If you are drawing a flowchart with many responsible parties you can group them together using swimlanes. Swimlanes are a powerful technique to increase the readability of your flowchart so you should use them according to the situation. Read how to use cross-functional flowchart for planning to learn more about the process.
The below video shows how to draw a flowchart using Creately. It is very simple to use and one-click create and connect helps you draw them faster as well. You can drag and drop symbols from the library or drag images to your diagram by doing an image search.
Here are the Steps to Draw a Flowchart
1. explain the procedure.
Determine the function and boundaries of the system or process you wish to depict in the flowchart. The process’s inputs, outputs, and actions should be identified.
2. Choose the shapes and symbols
To represent the many process components—such as the start and end points, inputs, outputs, actions, decisions, and loops—choose the right symbols and shapes. Rectangles, diamonds, circles, and arrows are the most often utilized shapes in flowcharts. To access all shapes, enable Creately’s flowchart shapes library.
3. Organize the flow
Determine the order of the steps in the process and the different paths that can be taken. This will help you organize the flow of the flowchart. Use Creately’s Plus Create to add the next shape and the connector in a single click.
4. Review and revise
Check that the flowchart accurately depicts the procedure and is simple to read and understand. If required, revise it to make it more precise and understandable. Share feedback using Creately’s contextual comments.
5. Share the flowchart
Distribute the flowchart to coworkers, stakeholders, or clients who will need to use it or refer to it easily with a workspace link
Flowchart Templates and Examples
Although you can start drawing flowcharts by scratch it is much easier to use templates. They help you reduce errors and remind you about the best practices to follow. If you want to use a ready-made template, go to the flowchart examples section and click on the flowchart that best suits you. Click on the use at template after the image and you are ready to draw your flowchart.
Below are two templates out of hundreds of flowchart templates available to the user. Click on any of them to start drawing flowcharts immediately.

- Ready to use
- Fully customizable template
- Get Started in seconds

Flowchart Best Practices
There are a few things you can do to make your flowchart universally accepted. And there are some things that you can do to make it visually pleasing to others as well.
If you’re planning to share your flowchart or hoping to use it on a presentation etc. then it’s wise to use standard symbols. However, it is important to remember that the idea is to give out information in an easy-to-understand manner. It is perfectly acceptable to use an alternative image instead of the document symbol as long as the audience understands it.
Keeping the arrow flow to one side, using the same size symbols, naming the decision blocks, processes, arrows, etc. are a few things you can do to make it better. The common mistakes section covers most of these practices in detail.
Map out any process, workflows, or system with ease. Dedicated shape library, drag and drop interface, and powerful diagramming for super-fast drawing.
Common Mistakes Made when Drawing Flowcharts
This section highlights the common mistakes made when drawing flowcharts. Some of the things mentioned here are to make it better looking and more understandable, not having them in your flowchart won’t make it wrong. Since there are two posts covering these mistakes in-depth I will link to them from this flowchart tutorial.
Effective Use of Flowcharts – Case Studies
A flowchart tutorial isn’t complete without some case studies. Below are three case studies and real-life examples of how flowcharts can help you make decisions.
- Ten Flowchart Ideas for Your Business – How flowcharts can be used in making business decisions and optimizing the current business processes
- Analyzing Sales Funnel with Flowcharts – How to analyze the Google analytic sales funnel using a flowchart.
- Flutterscape Case Study – How one of our customers used flowcharts to enhance their processes.
Frequently Asked Questions About Flowchart
The comments section of this article is full of questions. Please note that I will not draw flowcharts for specific scenarios. Below I have answered some of the most frequently asked questions.
Q 01 : What is a subprocess in a flowchart?
Answer: Sometimes complex processes are broken down into smaller sub-processes for clarity. So a flowchart can point to a different sub-process within its flow. The predefined process symbol is used to show such subprocesses.
Q 02 : How are flowcharts used in computer programming?
Answer: A computer program consists of many processes and flows. Flowcharts are used to visualize the processes and make them understandable for non-technical people. They are also used to visualize algorithms and comprehend pseudo-code which is used in programming.
Comments and Feedback on the Flowchart Tutorial
I hope this flowchart tutorial will help you to come up with awesome flowcharts. Flowcharts are a great way to present complex processes in a simple-to-understand manner and they are used all over the world in many industries. If you have a question about drawing flowcharts or have any suggestions to improve this post, feel free to mention in the comments section.
More Diagram Tutorials
- Sequence Diagram Tutorial: Complete Guide with Examples
- Business Process Modeling Tutorial (BPM Guide Explaining Features)
- Use Case Diagram Tutorial (Guide with Examples)
Join over thousands of organizations that use Creately to brainstorm, plan, analyze, and execute their projects successfully.
More Related Articles

Software engineer turned tech evangelist. I handle marketing stuff here at Creately including writing blog posts and handling social media accounts. In my spare time, I love to read and travel.
Variable declaration
In order to use variables in Flowgorithm you first “declare” them (i.e. get a space in memory for them) and then “assign” them a value.
Click on the arrow between Main and End to bring up the shapes menu. Choose the yellow "Declare" shape. This will let us declare a variable. Double click the Declare shape in our flowchart to set its values.
You should see a dialog box pop up where we can set the values for the variables. You must give it a variable name and a type. Name the variable and then click the OK button.

You should now see a yellow rectangle named whatever name you specified in the Declare Properties box.
Variable Assignment
The steps in using a variable in Flowgorithm are to:
- Assign it a value
To assign a value to a variable that has been previously declared, double-click on it to select it. From the shapes menu choose the Assign shape. Enter the appropriate values and click ok.
- You must give the name of a previously declared variable
- Enter the value for the variable. Note the data type must match the type originally specified for the variable (i.e. number values for integers or reals and string for alphanumeric values)
- See the Types section for information about the types of data that can be used with Flowgorithm.

results matching " "
No results matching " ".
Declare Shape
Default appearance, what it does.
A Declare Statement is used to create variables and arrays. These are used to store data while the program is running. You can declare multiple variables by separating the names with commas.
We use essential cookies to make Venngage work. By clicking “Accept All Cookies”, you agree to the storing of cookies on your device to enhance site navigation, analyze site usage, and assist in our marketing efforts.
Manage Cookies
Cookies and similar technologies collect certain information about how you’re using our website. Some of them are essential, and without them you wouldn’t be able to use Venngage. But others are optional, and you get to choose whether we use them or not.
Strictly Necessary Cookies
These cookies are always on, as they’re essential for making Venngage work, and making it safe. Without these cookies, services you’ve asked for can’t be provided.
Show cookie providers
- Google Login
Functionality Cookies
These cookies help us provide enhanced functionality and personalisation, and remember your settings. They may be set by us or by third party providers.
Performance Cookies
These cookies help us analyze how many people are using Venngage, where they come from and how they're using it. If you opt out of these cookies, we can’t get feedback to make Venngage better for you and all our users.
- Google Analytics
Targeting Cookies
These cookies are set by our advertising partners to track your activity and show you relevant Venngage ads on other sites as you browse the internet.
- Google Tag Manager
- Infographics
- Daily Infographics
- Popular Templates
- Accessibility
- Graphic Design
- Graphs and Charts
- Data Visualization
- Human Resources
- Beginner Guides
Blog Graphs and Charts Flowchart Symbols and Meaning: A Complete Guide (2024)
Flowchart Symbols and Meaning: A Complete Guide (2024)
Written by: Danesh Ramuthi Feb 29, 2024

Flowchart symbols are used to show the steps, order and choices in a process. Together, they form a universal language that makes process analysis easy.
I’m sure you’ve seen flowcharts before with various shapes, lines and arrows to depict stages within a process like where it begins or ends.
Understanding what these symbols mean enhances communication, facilitates problem-solving and ultimately guides process improvement.
In this post, I’ll review flowchart symbols and their meaning. By the way, when creating a flowchart, I suggest using a Flowchart Maker or editing flowchart templates that let you add, remove, and edit these shapes and symbols.
Click to jump ahead:
- What shapes are most frequently used in a flowchart?
List of flowchart symbols and their meanings
What shapes are most frequently used in a flowchart .
One reason why flowcharts are so popular is because they use standardized shapes that almost anyone can instantly recognize.
Here are the five most common shapes used in a flowchart.
- Oval (Terminal symbol)
- Rectangle (Process symbol)
- Arrow (Arrow Symbol)
- Diamond (Decision symbol)
- Parallelogram (Input/Output symbol)

You can see most of these shapes in the following flowchart examples:

Related: Learn how to create a flowchart .
Every shape found in a flowchart has a use case (it’s not just a design preference!)
In this section, I’ll first name the shape, show it to you, and then describe its function.
1. Oval/Pill (Terminal symbol)

The oval shape, also known as the terminal symbol, is as an elongated circle or an ellipse.
Its function is to provide a visual reference of the start or end of a flowchart.
To make sure readers understand the start and endpoint correctly, you should verbally communicate “Start” and “End”.
2. Rectangle (Process symbol)

A rectangle is used to highlight each specific task or action within a process.
Also known as the process symbol, the rectangle is fundamental to mapping out the sequence of actions or operations that take place from the start to the end of a process.
By placing tasks within a rectangle, flowcharts make it easy to understand, follow, and analyze individual tasks that contribute to the overall workflow.
3. Diamond (Decision symbol)

A diamond or a rhombus highlights a decision point in a flowchart and hence is also known as the decision symbol.
Diamonds are usually present when there is a conditional statement such as a “Yes” or “No” or “True” or “False” question.
As a result, two or more paths always branch out from this symbol.
Here’s a great example:

4. Parallelogram (Input/output symbol)

A parallelogram in flowchart represents both input and output processes within a system.
This means it marks the point in a process where a user has to enter data into a system, such as an online shopper entering their name, address, and payment details, into the system.
But the parallelogram can also also refer to a point when system generates data such as an order confirmation number from the example above.
Therefore, it’s good practice to indicate whether the process is an input or an output using labels or arrows.

An arrow usually connects two rectangles, parallelograms or diamond symbols to highlight a sequence flow between the two.
The sole purpose of arrows is to provide visual direction to your flowchart.
6. On-page connector symbol

The on-page connector symbol in a flowchart is a fancy way of referencing a circle.
This shape connects two or more separate paths within a flowchart without the need for long, intersecting lines that can make the flowchart difficult to follow.
Think of the circle as a connecting bridge.
7. Off-page connector symbol

The off-page connector is a five-pointed polygon.
They’re usually seen complex multi-page flowcharts to indicate that the process continues on a different page.
The off-page connector is typically accompanied by a reference point, such as a page number, section identifier, or a unique code to guide the reader to the exact location where the process continues.
8. Document symbol

The document symbol looks like a rectangle with a wavy line below it.
Its design is intended to resemble a piece of paper which is also a hint of its function to indicate a point in the workflow where documentation is integral to the process.
The document symbol is particularly useful for administrative procedures, quality assurance protocols, or any process where record-keeping and documentation is key.
9. Multiple documents symbol

The multiple documents symbol looks like a stack of papers which again hint to its purpose.
This symbol indicates that a step requires the handling, review, or generation of a collection of documents instead of just one.
It’s particularly useful in representing steps that require compiling of reports or processing of multiple forms.
10. Preparation symbol

The preparation symbol is a six point polygon shape (some also refer to it as a rectangle with pointy bits).
The symbol is used to indicate a step where you need to gather resources or engage in specific tasks to ensure a smooth transition into a workflow.
The preparation symbol alerts users to the fact that certain conditions must be met before they can move forward.
11. Manual operation symbol

The trapezoid, which has a longer top side, is used denote a non-automated process that requires manual intervention or handling.
The trapezoid can help identify where human resources are needed and/or and where bottlenecks can occur due to manual operation.
12. Summoning junction symbol

A circle divided into four slices, known as the summoning junction symbol, references a point in the flowchart where multiple branches converge into a single process.
You’ll see this symbol used in complex workflows where different sequences lead to a common action point.
The junction point can be used to indicate that a common path will follow regardless of the preceding steps before it.
13. Merge symbol

The merge symbol is represented by a triangle and is used to combine two or more lists into a single flow.
The merge symbol is a way to communicate the coming together of multiple inputs or sequences.
The pointed end of the triangle faces the direction of the flow, so it’s a way to visualize where a merge happens and the unified process that follows.
14. Collate symbol

The collate symbol is represented by an hourglass shape and indicates the gathering, arranging, or organizing of items in a specific order or sequence.
This symbol is useful in processes where information needs to be organized before it can be processed or analyzed.
15. Sort symbol

A sort symbol is represented by two isosceles triangles joined together on the longest side.
This symbol is useful in processes where data or items need to be classified and ordered in a way that facilitates further actions or decisions.
For example, it could be used to represent the sorting of customer feedback into categories of priority or the organization of products by type before inventory.
16. Or symbol

The Or symbol looks awfully similar to the summoning junctions symbol but don’t confuse them because they have different use cases.
For reference, the Or symbol is a circle with a “Plus sign” inside it rather than an “X.”
The Or symbol is used to denote a point in the process where a decision is made and the outcome of that decision dictates the next step in the process.
17. Loop limit symbol

The loop limit symbol is represented as a rectangle with squared-off top edges.
The purpose of the loop limit symbol is to show where and when a looping action, which could otherwise continue indefinitely, should stop.
This symbol is commonly seen in flowcharts related to programming workflows.
18. Delay symbol

The delay symbol has the appearance of an elongated semi-circle.
It’s used to mark points where delays or waiting periods are expected within a process
For example, in a manufacturing workflow, this symbol might indicate a cooling period required after a product has been heated.
Adding the length of delay in the symbol (if you know it) makes this symbol more useful.
19. Internal storage symbol

A rectangle with two lines going across its length and width is known as the internal storage symbol.
It’s used mainly in software design flowcharts and represents a specific type of data storage or memory that is internal to the system being described.
20. Data storage or stored data symbol

The stored data symbol appears as a curved piece of paper and is used in programming flowcharts.
It’s used to denote where data is stored outside of the immediate processing environment.
This symbol illustrates the interaction between the process and external data storage facilities, such as databases, file systems, or cloud storage services.
21. Database symbol

The database symbol resembles a stack of cylinders and indicates the involvement of a database in the process.
This symbol in flowcharts showing data-intensive processes, such as querying information, updating records, or performing transactions within a database.
22. Display symbol

The display symbol looks like the delay symbol merged with an isosceles triangle on one side.
This symbol shows where user interaction occurs within a system and is important in processes that require data to be presented to the user.
23. Hard disk symbol

The hard disk symbol is essentially a cylinder lying on its curved side.
This symbol indicates when data is stored on a hard drive. It’s used to show points in a process where data is written to or read from a hard disk.
24. Alternate process symbol

The alternate process symbol looks like a rectangle with rounded corners.
It’s used to denote a step that deviates from the main process and represents an alternative method or pathway for accomplishing a task.
Conclusion: Create flowcharts with all these symbols and more using Venngage
When making a flowchart, the last thing you want to worry about is if the software has all the shapes and symbols you need.
With Venngage, you’ll not only get that but access to our in-editor library of images, shapes, and diverse icons that’ll bring your flowchart to life.
Frequently asked questions (FAQ)
What is a flowchart?
A flowchart is a visual representation that outlines each step or decision point in a process. Think of flowcharts as a roadmap of your workflow.
What is input/output in a flowchart?
Input/output in flowcharts indicate when data enters or leaves a system. For example, in online booking system, a parallelogram labeled “Enter Booking Details” represents the input where customers submit their information and another another parallelogram labelled “Send Email Confirmation” indicates the output where the system sends a confirmation email to the customer.
What are the types of flowcharts?
There are 8 main types of flowcharts . They include: 1) Process flowchart, 2) Decision flowchart, 3) Workflow flowchart, 4) Swimlane flowchart, 5) Use case flowchart, 6) EPC flowchart, 7) System or program flowchart, and 8) Data or document flowchart.
What are the 8 basic symbols of a flowchart?
The eight main symbols used in a flowchart are 1) Rectangle, 2) Diamond, 3) Parallelogram, 4) Triangle, 5) Circle, 6) Trapezoid, 7) Hexagon, 8) Circle.
Are workflow diagrams and flowcharts the same?
Workflow diagram and a flowchart aren’t the same. A workflow diagram is a specific type of flowchart focused on illustrating the sequence of steps and the flow of tasks of particular process while a general flowchart can be used for a wide range of purposes, from programming to decision-making processes. They’re not limited to depicting workflows.
Discover popular designs

Infographic maker

Brochure maker

White paper online

Newsletter creator

Flyer maker

Timeline maker

Letterhead maker

Mind map maker

Ebook maker
Popular Tutorials
Popular examples, learn python interactively, related articles.
- self in Python, Demystified
- Increment ++ and Decrement -- Operator as Prefix and Postfix
- Interpreter Vs Compiler : Differences Between Interpreter and Compiler
- Algorithm in Programming
Flowchart In Programming
A flowchart is a diagrammatic representation of an algorithm. A flowchart can be helpful for both writing programs and explaining the program to others.
Symbols Used In Flowchart
Examples of flowcharts in programming.
1. Add two numbers entered by the user.

2. Find the largest among three different numbers entered by the user.

3. Find all the roots of a quadratic equation ax 2 +bx+c=0

4. Find the Fibonacci series till term≤1000.

Note: Though flowcharts can be useful for writing and analyzing a program, drawing a flowchart for complex programs can be more complicated than writing the program itself. Hence, creating flowcharts for complex programs is often ignored.
Sorry about that.
Parallelogram in Flowchart - Input / Output Flowchart Symbol
What symbol is parallelogram in flowchart.
Parallelogram represents the input and output symbols in a flowchart; it also represents data in general. In other words, the paralellogram shape represents a data's value as it enters a process or is sent out of a process.
How to use parallelogram in flowchart?
Add a parallelogram (input/output symbol) as a step in your flowchart whenever there's a step which involves inputting or outputting data. For example, in a step which a program requires a user's email address, use this input/ouput symbol.
All Flowchart Symbols

1. Flowline : Shows the process’ direction. Each flowline connects two blocks.
2. Terminal : Indicates the beginning or end of a flowchart
3. Process : Represent a step in a process. This is the most common component of a flowchart.
4. Decision : Shows a step that decides the next step in a process. This is commonly a yes/no or true/false question.
5. Input / Output : Indicates the process of inputting or outputting external data.
6. Annotation / Comment : Indicates additional information regarding a step in a process.
7. Predefined Process : Shows named process which is defined elsewhere.
8. On-page Connector : Pairs of on-page connecter are used to replace long lines on a flowchart page.
9. Off-page Connector : An off-page connector is used when the target is on another page.
10. Delay : Any delay period that is part of a process
11. Alternate Process : An alternate to the normal process step. Flow lines to an alternate process block is usually dashed.
12. Data : Data input or output
13. Document : A document
14. Multi-document : Multiple documents
15. Preparation : A preparation step
16. Display : A machine display
17. Manual Input : Data or information into a system
18. Manual Operation : A process step that isn’t automated
Related articles
Timeline Flowchart 101: Everything You Need To Know
Top 10 alternatives to lucidchart - flowchart maker reviews.

What Religion Am I Flowchart
Creately flowchart maker - product review.

Ken Flowchart - Meme Explained
Top 10 alternatives to visio - flowchart maker reviews, brought to you by, zen flowchart, flowchart guides.
Flowchart in Computer Programming
Input and output.
Generally, you can use Data symbol for input or output actions in your algorithm. Alternatively, you can use the User Input symbol if the input is entered solely by a user. If you want to show the output to the user, you can use Display symbol in your flowchart . The output can be displayed on a screen or printed.
Declaring Variables
You can use Internal Storage symbol or simple Process symbol for variable declarations.
Assignment Statement
There is not any specific shape for the assignment statement. If you want to show a variable assignment in your flowchart , you can just use the Process element.
Call Method
If you want to call another subroutine, procedure, or function, you should use the Predefined Process element.
If Statement
If and else-if conditions are represented using Flow branches that lead from Decision symbol (diamond). The condition is stated within the diamond shape. The branches are labeled as Yes or True for the met condition and No or False for the else branch.
You can check out our template for multiple else-if branches here .
Switch Case
Switch statement for multiple cases is depicted similarly as an if-condition in flowcharts . The switch variable is given in a Decision diamond. The individual cases are represented by Flow branches. The values of the cases are stated as labels for flow connectors.
The template for switch cases is available here .
The condition for the while loop is displayed inside the Decision symbol. The flow from the last Process element (that represents the last statement within the while loop) points to the starting decision element. The decision element has two flow branches - one leads to while-loop statements (it can be labeled as Yes or True), and the other flow leads out of the loop to the following statements.
The example here shows how to draw flowchart for while and for do-while loops .
Return Statement
The Return statement is depicted using the Flow connector that leads to the End symbol (rounded rectangle, stadium shape).
Break, Continue
If you want to translate the Break or Continue statement from a program code into a flowchart , you can do it using the Flow relationship that connects the respective places in the program flow.
If you need to indicate waiting in your algorithm flowchart you should use the Delay symbol . It is a rectangular shape rounded on the right side. The waiting time or the condition when the waiting ends can be expressed inside the Delay shape.
Flowchart Maker
You can create and edit your flowcharts using our flowchart tool .
New Comment
The Value Assignment Operator
Java, c++, c#, visual basic, python.
assigns a value of 5 to variable x.
As you already know, this is equivalent to the left arrow used in flowcharts.

Probably the left arrow used in a flowchart is more convenient and clearer than the value assignment operator ( = ) sign because it shows in a more graphical way that the value or the result of an expression on the right is assigned to a variable on the left.
Be careful! The ( = ) sign is not equivalent to the one used in mathematics. In mathematics, the expression x = 5 is read as “x is equal to 5 . ” However, in a computer language the expression x = 5 is read as “assign the value 5 to x” or “set x equal to 5.” They look the same but they act differently!
In mathematics, the following two lines are equivalent:
The first one can be read as “ x is equal to the sum of y and z ” and the second one as “the sum of y and z is equal to x .”
On the other hand, in a computer language, the following two statements are definitely not equivalent. In fact, the second one is considered wrong!
The first statement seems quite correct. It can be read as “ Set x equal to the sum of y and z ” or “ Assign the sum of y and z to x . ”
But what about the second one? Think! Is it possible to assign the value of x to y + z? The answer is obviously a big “NO!”
Remember ! In a computer language, the variable on the left side of the ( = ) sign represents a region in main memory (RAM) where a value can be stored. Thus, on the left side only one single variable must exist! However, on the right side there can be a number, a variable, a string, or even a complex mathematical expression.
In Table 1 you can find some examples of value assignments.
Confused about the last one? Are you thinking about your math teacher right now? What would he/she say if you had written a = a + 1 on the blackboard? Can you personally think of a number that is equal to the number itself plus one? Are you nuts? This means that 5 is equal to 6 and 10 is equal to 11!
Obviously, things are different in computer science. The statement a = a + 1 is absolutely acceptable! It instructs the CPU to retrieve the value of variable a from main memory (RAM), to increase the value by one, and to assign the result back to variable a . The old value of variable a is replaced by the new one.
Still don’t get it? Let’s take a look at how the CPU and main memory (RAM) cooperate with each other in order to execute the statement A ← A + 1 .
Let’s say that there is a region in memory, named A and it contains the number 13
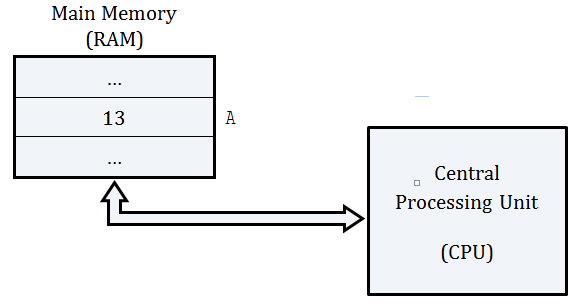
When a program instructs the CPU to execute the statement
the following procedure is executed:
- the number 13 is transferred from the RAM’s region named A to the CPU;
- the CPU calculates the sum of 13 and 1; and
- the result, 14, is transferred from the CPU to the RAM’s region named A replacing the existing number, 13.
After execution, the RAM looks like this.

Related articles:
- What is a Variable?
- Compound Assignment Operators
- What is a Boolean Expression?
- Membership Operators (only for Python)

- school Campus Bookshelves
- menu_book Bookshelves
- perm_media Learning Objects
- login Login
- how_to_reg Request Instructor Account
- hub Instructor Commons
Margin Size
- Download Page (PDF)
- Download Full Book (PDF)
- Periodic Table
- Physics Constants
- Scientific Calculator
- Reference & Cite
- Tools expand_more
- Readability
selected template will load here
This action is not available.
10.3: Flowcharting
- Last updated
- Save as PDF
- Page ID 11289

- Kenneth Leroy Busbee
- Houston Community College via OpenStax CNX
\( \newcommand{\vecs}[1]{\overset { \scriptstyle \rightharpoonup} {\mathbf{#1}} } \)
\( \newcommand{\vecd}[1]{\overset{-\!-\!\rightharpoonup}{\vphantom{a}\smash {#1}}} \)
\( \newcommand{\id}{\mathrm{id}}\) \( \newcommand{\Span}{\mathrm{span}}\)
( \newcommand{\kernel}{\mathrm{null}\,}\) \( \newcommand{\range}{\mathrm{range}\,}\)
\( \newcommand{\RealPart}{\mathrm{Re}}\) \( \newcommand{\ImaginaryPart}{\mathrm{Im}}\)
\( \newcommand{\Argument}{\mathrm{Arg}}\) \( \newcommand{\norm}[1]{\| #1 \|}\)
\( \newcommand{\inner}[2]{\langle #1, #2 \rangle}\)
\( \newcommand{\Span}{\mathrm{span}}\)
\( \newcommand{\id}{\mathrm{id}}\)
\( \newcommand{\kernel}{\mathrm{null}\,}\)
\( \newcommand{\range}{\mathrm{range}\,}\)
\( \newcommand{\RealPart}{\mathrm{Re}}\)
\( \newcommand{\ImaginaryPart}{\mathrm{Im}}\)
\( \newcommand{\Argument}{\mathrm{Arg}}\)
\( \newcommand{\norm}[1]{\| #1 \|}\)
\( \newcommand{\Span}{\mathrm{span}}\) \( \newcommand{\AA}{\unicode[.8,0]{x212B}}\)
\( \newcommand{\vectorA}[1]{\vec{#1}} % arrow\)
\( \newcommand{\vectorAt}[1]{\vec{\text{#1}}} % arrow\)
\( \newcommand{\vectorB}[1]{\overset { \scriptstyle \rightharpoonup} {\mathbf{#1}} } \)
\( \newcommand{\vectorC}[1]{\textbf{#1}} \)
\( \newcommand{\vectorD}[1]{\overrightarrow{#1}} \)
\( \newcommand{\vectorDt}[1]{\overrightarrow{\text{#1}}} \)
\( \newcommand{\vectE}[1]{\overset{-\!-\!\rightharpoonup}{\vphantom{a}\smash{\mathbf {#1}}}} \)
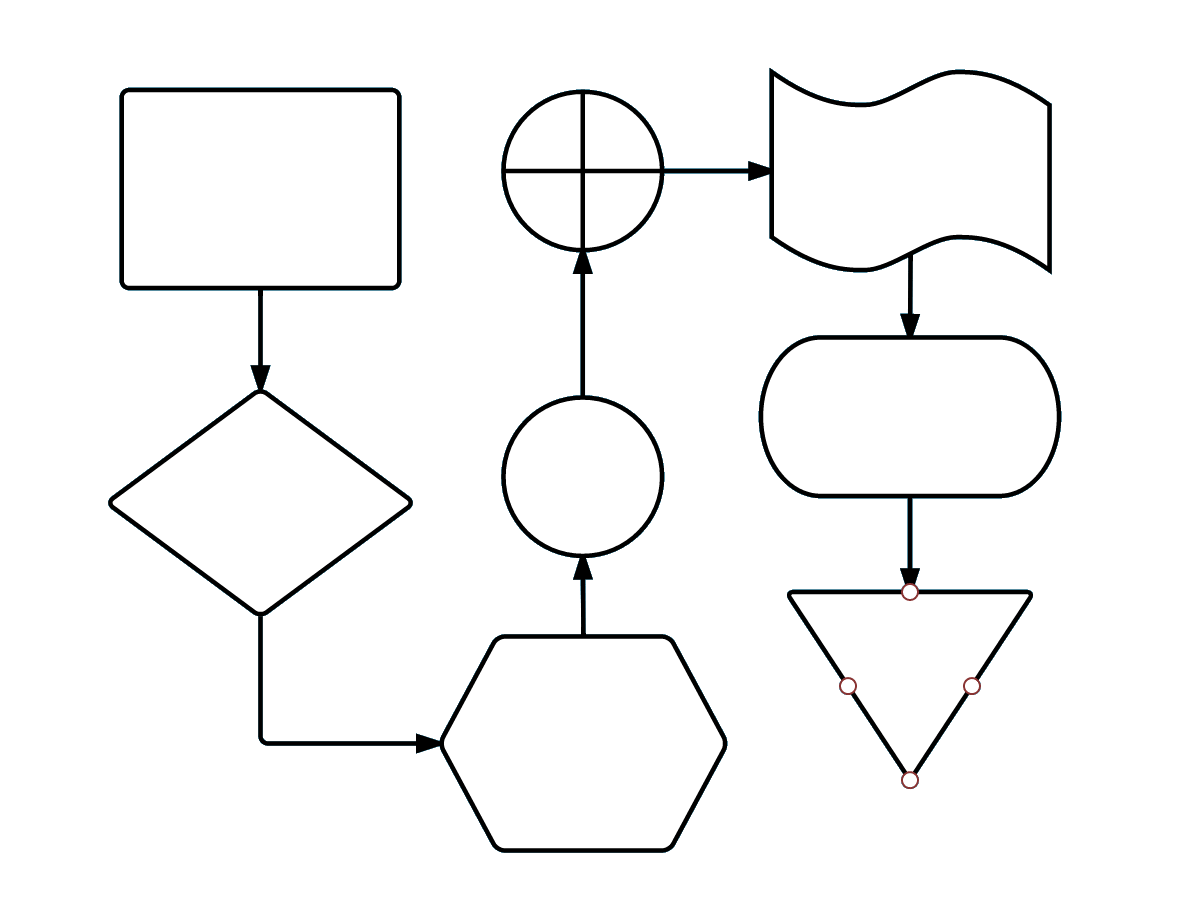
Flowcharting Symbols
The rounded rectangles, or terminal points, indicate the flowchart's starting and ending points.
Figure \(\PageIndex{1}\)
The rectangle depicts a process such as a mathematical computation, or a variable assignment.
Note: the C++ language equivalent is the statement.
Figure \(\PageIndex{2}\)
Input/Output
The parallelograms designate input or output operations.
Note: the C++ language equivalent is cin or cout.
Figure \(\PageIndex{3}\)
Sometimes a flowchart is broken into two or more smaller flowcharts. This is usually done when a flowchart does not fit on a single page, or must be divided into sections. A connector symbol, which is a small circle with a letter or number inside it, allows you to connect two flowcharts on the same page. A connector symbol that looks like a pocket on a shirt, allows you to connect to a flowchart on a different page.
On-Page Connector
Figure \(\PageIndex{4}\)
Off-Page Connector
Figure \(\PageIndex{5}\)
The diamond is used to represent the true/false statement being tested in a decision symbol.
Figure \(\PageIndex{6}\)
Module Call
A program module is represented in a flowchart by rectangle with some lines to distinguish it from process symbol. Often programmers will make a distinction between program control and specific task modules as shown below.
Note: C++ equivalent is the function.
Local module: usually a program control function.
Figure \(\PageIndex{7}\)
Library module: usually a specific task function.
Figure \(\PageIndex{8}\)
Note: The default flow is left to right and top to bottom (the same way you read English). To save time arrowheads are often only drawn when the flow lines go contrary the normal.
Figure \(\PageIndex{9}\)
We will demonstrate various flowcharting items by showing the flowchart for some pseudocode.
Figure \(\PageIndex{10}\)
Figure \(\PageIndex{11}\)
Sequence Control Structures
The next item is pseudocode for a simple temperature conversion program. This demonstrates the use of both the on-page and off-page connectors. It also illustrates the sequence control structure where nothing unusually happens. Just do one instruction after another in the sequence listed.
Figure \(\PageIndex{12}\)

Figure \(\PageIndex{13}\)
Selection Control Structures
Figure \(\PageIndex{14}\) If then Else control structure
Figure \(\PageIndex{15}\) Case Control Structure
Iteration (Repetition) Control Structures
Figure \(\PageIndex{16}\) While control structure
The for loop does not have a standard flowcharting method and you will find it done in different ways. The for loop as a counting loop can be flowcharted similar to the while loop as a counting loop.
Figure \(\PageIndex{17}\) For control structure
Figure \(\PageIndex{18}\) Do While control structure
Figure \(\PageIndex{19}\) Repeat Until control structure
Definitions
IMAGES
VIDEO
COMMENTS
Assign value. To assign a value to a variable, double-click on the line and choose the Assign shape—Double-click on the Assign shape to bring up the Assignment Properties window. Enter the variable name and the appropriate value, and click the OK button. Example. Sample Declare and Assign shapes in a flowchart. A foo variable is declared as ...
In the New Diagram window, select Flowchart and click Next. You can start from an empty diagram or start from a flowchart template or flowchart example provided. Let's start from a blank diagram. Select Blank and click Next. Enter the name of the flowchart and click OK. Let's start by creating a Start symbol.
The rectangle depicts a process such as a mathematical computation, or a variable assignment. Decision. The diamond is used to represent the true/false statement being tested in a decision symbol. Advanced Flowcharting Symbols Module Call. A program module is represented in a flowchart by rectangle with some lines to distinguish it from process ...
Flowchart Symbol. Name. Description. Process symbol. Also known as an "Action Symbol," this shape represents a process, action, or function. It's the most widely-used symbol in flowcharting. Start/End symbol. Also known as the "Terminator Symbol," this symbol represents the start points, end points, and potential outcomes of a path.
Organize the flow. Determine the order of the steps in the process and the different paths that can be taken. This will help you organize the flow of the flowchart. Use Creately's Plus Create to add the next shape and the connector in a single click. 4.
However, if you are going to use flowcharts, you could use a "defined process" boxes to represent function calls. Put the parameters and the result assignment in the box. Then use a separate flowchart to describe what happens within the function. For examples, take a look at this or this.
The for loop does not have a standard flowcharting method and you will find it done in different ways. The for loop as a counting loop can be flowcharted similar to the while loop as a counting loop. Figure 11.3.17 11.3. 17 For control structure. Pseudocode: Do While. count assigned five.
In order to use variables in Flowgorithm you first "declare" them (i.e. get a space in memory for them) and then "assign" them a value. Click on the arrow between Main and End to bring up the shapes menu. Choose the yellow "Declare" shape. This will let us declare a variable. Double click the Declare shape in our flowchart to set its ...
The Assignment shape is used to store the result of a calculation into a variable. This is one of the most common tasks found in programs. Example. The example, to the right, declares two variables: area (which stores real numbers) and radius (which stores integers). It then uses an Assignment Statement to set the 'radius' to 7.
These are used to store data while the program is running. You can declare multiple variables by separating the names with commas. Example. The example, to the right, declares two variables: area (which stores real numbers) and radius (which stores integers). It then uses an Assignment Statement to set the 'radius' to 7.
The oval, rectangle, diamond, parallelogram and arrow are the basic process flowchart symbols. The oval represents the start and end. The rectangle represents any step in the process, like tasks or actions. The diamond symbol indicates a decision. The parallelogram represents information that's received/generated like an e-mail or product.
This video will explain how to use variables in the flowcharts for GCSE computer science.
Feb 29, 2024. Flowchart symbols are used to show the steps, order and choices in a process. Together, they form a universal language that makes process analysis easy. I'm sure you've seen flowcharts before with various shapes, lines and arrows to depict stages within a process like where it begins or ends.
Examples of flowcharts in programming. 1. Add two numbers entered by the user. Flowchart to add two numbers. 2. Find the largest among three different numbers entered by the user. Flowchart to find the largest among three numbers. 3. Find all the roots of a quadratic equation ax2+bx+c=0.
A flowchart is a type of diagram that represents an algorithm, workflow or process. The flowchart shows the steps as boxes of various kinds, and their order by connecting the boxes with arrows. ... The rectangle depicts a process such as a mathematical computation, or a variable assignment. Decision. The diamond is used to represent the true ...
Flowchart Symbols. 1. Flowline: Shows the process' direction.Each flowline connects two blocks. 2. Terminal: Indicates the beginning or end of a flowchart. 3. Process: Represent a step in a process.This is the most common component of a flowchart. 4. Decision: Shows a step that decides the next step in a process.This is commonly a yes/no or true/false question.
Assignment Statement. There is not any specific shape for the assignment statement. If you want to show a variable assignment in your flowchart, you can just use the Process element. Call Method. If you want to call another subroutine, procedure, or function, you should use the Predefined Process element.
assigns a value of 5 to variable x. As you already know, this is equivalent to the left arrow used in flowcharts. Probably the left arrow used in a flowchart is more convenient and clearer than the value assignment operator ( = ) sign because it shows in a more graphical way that the value or the result of an expression on the right is assigned to a variable on the left.
Definitions. Flowcharting. Process Symbol. Input/Output Symbol. Decision Symbol. Flow Lines. This page titled 10.3: Flowcharting is shared under a CC BY license and was authored, remixed, and/or curated by Kenneth Leroy Busbee ( OpenStax CNX) . A module on helping to construct flowcharts, a useful programming tool.