- Affiliate Program

- UNITED STATES
- 台灣 (TAIWAN)
- TÜRKIYE (TURKEY)
- Academic Editing Services
- - Research Paper
- - Journal Manuscript
- - Dissertation
- - College & University Assignments
- Admissions Editing Services
- - Application Essay
- - Personal Statement
- - Recommendation Letter
- - Cover Letter
- - CV/Resume
- Business Editing Services
- - Business Documents
- - Report & Brochure
- - Website & Blog
- Writer Editing Services
- - Script & Screenplay
- Our Editors
- Client Reviews
- Editing & Proofreading Prices
- Wordvice Points
- Partner Discount
- Plagiarism Checker
- APA Citation Generator
- MLA Citation Generator
- Chicago Citation Generator
- Vancouver Citation Generator
- - APA Style
- - MLA Style
- - Chicago Style
- - Vancouver Style
- Writing & Editing Guide
- Academic Resources
- Admissions Resources

How to Write the Results/Findings Section in Research
What is the research paper Results section and what does it do?
The Results section of a scientific research paper represents the core findings of a study derived from the methods applied to gather and analyze information. It presents these findings in a logical sequence without bias or interpretation from the author, setting up the reader for later interpretation and evaluation in the Discussion section. A major purpose of the Results section is to break down the data into sentences that show its significance to the research question(s).
The Results section appears third in the section sequence in most scientific papers. It follows the presentation of the Methods and Materials and is presented before the Discussion section —although the Results and Discussion are presented together in many journals. This section answers the basic question “What did you find in your research?”
What is included in the Results section?
The Results section should include the findings of your study and ONLY the findings of your study. The findings include:
- Data presented in tables, charts, graphs, and other figures (may be placed into the text or on separate pages at the end of the manuscript)
- A contextual analysis of this data explaining its meaning in sentence form
- All data that corresponds to the central research question(s)
- All secondary findings (secondary outcomes, subgroup analyses, etc.)
If the scope of the study is broad, or if you studied a variety of variables, or if the methodology used yields a wide range of different results, the author should present only those results that are most relevant to the research question stated in the Introduction section .
As a general rule, any information that does not present the direct findings or outcome of the study should be left out of this section. Unless the journal requests that authors combine the Results and Discussion sections, explanations and interpretations should be omitted from the Results.
How are the results organized?
The best way to organize your Results section is “logically.” One logical and clear method of organizing research results is to provide them alongside the research questions—within each research question, present the type of data that addresses that research question.
Let’s look at an example. Your research question is based on a survey among patients who were treated at a hospital and received postoperative care. Let’s say your first research question is:

“What do hospital patients over age 55 think about postoperative care?”
This can actually be represented as a heading within your Results section, though it might be presented as a statement rather than a question:
Attitudes towards postoperative care in patients over the age of 55
Now present the results that address this specific research question first. In this case, perhaps a table illustrating data from a survey. Likert items can be included in this example. Tables can also present standard deviations, probabilities, correlation matrices, etc.
Following this, present a content analysis, in words, of one end of the spectrum of the survey or data table. In our example case, start with the POSITIVE survey responses regarding postoperative care, using descriptive phrases. For example:
“Sixty-five percent of patients over 55 responded positively to the question “ Are you satisfied with your hospital’s postoperative care ?” (Fig. 2)
Include other results such as subcategory analyses. The amount of textual description used will depend on how much interpretation of tables and figures is necessary and how many examples the reader needs in order to understand the significance of your research findings.
Next, present a content analysis of another part of the spectrum of the same research question, perhaps the NEGATIVE or NEUTRAL responses to the survey. For instance:
“As Figure 1 shows, 15 out of 60 patients in Group A responded negatively to Question 2.”
After you have assessed the data in one figure and explained it sufficiently, move on to your next research question. For example:
“How does patient satisfaction correspond to in-hospital improvements made to postoperative care?”

This kind of data may be presented through a figure or set of figures (for instance, a paired T-test table).
Explain the data you present, here in a table, with a concise content analysis:
“The p-value for the comparison between the before and after groups of patients was .03% (Fig. 2), indicating that the greater the dissatisfaction among patients, the more frequent the improvements that were made to postoperative care.”
Let’s examine another example of a Results section from a study on plant tolerance to heavy metal stress . In the Introduction section, the aims of the study are presented as “determining the physiological and morphological responses of Allium cepa L. towards increased cadmium toxicity” and “evaluating its potential to accumulate the metal and its associated environmental consequences.” The Results section presents data showing how these aims are achieved in tables alongside a content analysis, beginning with an overview of the findings:
“Cadmium caused inhibition of root and leave elongation, with increasing effects at higher exposure doses (Fig. 1a-c).”
The figure containing this data is cited in parentheses. Note that this author has combined three graphs into one single figure. Separating the data into separate graphs focusing on specific aspects makes it easier for the reader to assess the findings, and consolidating this information into one figure saves space and makes it easy to locate the most relevant results.

Following this overall summary, the relevant data in the tables is broken down into greater detail in text form in the Results section.
- “Results on the bio-accumulation of cadmium were found to be the highest (17.5 mg kgG1) in the bulb, when the concentration of cadmium in the solution was 1×10G2 M and lowest (0.11 mg kgG1) in the leaves when the concentration was 1×10G3 M.”
Captioning and Referencing Tables and Figures
Tables and figures are central components of your Results section and you need to carefully think about the most effective way to use graphs and tables to present your findings . Therefore, it is crucial to know how to write strong figure captions and to refer to them within the text of the Results section.
The most important advice one can give here as well as throughout the paper is to check the requirements and standards of the journal to which you are submitting your work. Every journal has its own design and layout standards, which you can find in the author instructions on the target journal’s website. Perusing a journal’s published articles will also give you an idea of the proper number, size, and complexity of your figures.
Regardless of which format you use, the figures should be placed in the order they are referenced in the Results section and be as clear and easy to understand as possible. If there are multiple variables being considered (within one or more research questions), it can be a good idea to split these up into separate figures. Subsequently, these can be referenced and analyzed under separate headings and paragraphs in the text.
To create a caption, consider the research question being asked and change it into a phrase. For instance, if one question is “Which color did participants choose?”, the caption might be “Color choice by participant group.” Or in our last research paper example, where the question was “What is the concentration of cadmium in different parts of the onion after 14 days?” the caption reads:
“Fig. 1(a-c): Mean concentration of Cd determined in (a) bulbs, (b) leaves, and (c) roots of onions after a 14-day period.”
Steps for Composing the Results Section
Because each study is unique, there is no one-size-fits-all approach when it comes to designing a strategy for structuring and writing the section of a research paper where findings are presented. The content and layout of this section will be determined by the specific area of research, the design of the study and its particular methodologies, and the guidelines of the target journal and its editors. However, the following steps can be used to compose the results of most scientific research studies and are essential for researchers who are new to preparing a manuscript for publication or who need a reminder of how to construct the Results section.
Step 1 : Consult the guidelines or instructions that the target journal or publisher provides authors and read research papers it has published, especially those with similar topics, methods, or results to your study.
- The guidelines will generally outline specific requirements for the results or findings section, and the published articles will provide sound examples of successful approaches.
- Note length limitations on restrictions on content. For instance, while many journals require the Results and Discussion sections to be separate, others do not—qualitative research papers often include results and interpretations in the same section (“Results and Discussion”).
- Reading the aims and scope in the journal’s “ guide for authors ” section and understanding the interests of its readers will be invaluable in preparing to write the Results section.
Step 2 : Consider your research results in relation to the journal’s requirements and catalogue your results.
- Focus on experimental results and other findings that are especially relevant to your research questions and objectives and include them even if they are unexpected or do not support your ideas and hypotheses.
- Catalogue your findings—use subheadings to streamline and clarify your report. This will help you avoid excessive and peripheral details as you write and also help your reader understand and remember your findings. Create appendices that might interest specialists but prove too long or distracting for other readers.
- Decide how you will structure of your results. You might match the order of the research questions and hypotheses to your results, or you could arrange them according to the order presented in the Methods section. A chronological order or even a hierarchy of importance or meaningful grouping of main themes or categories might prove effective. Consider your audience, evidence, and most importantly, the objectives of your research when choosing a structure for presenting your findings.
Step 3 : Design figures and tables to present and illustrate your data.
- Tables and figures should be numbered according to the order in which they are mentioned in the main text of the paper.
- Information in figures should be relatively self-explanatory (with the aid of captions), and their design should include all definitions and other information necessary for readers to understand the findings without reading all of the text.
- Use tables and figures as a focal point to tell a clear and informative story about your research and avoid repeating information. But remember that while figures clarify and enhance the text, they cannot replace it.
Step 4 : Draft your Results section using the findings and figures you have organized.
- The goal is to communicate this complex information as clearly and precisely as possible; precise and compact phrases and sentences are most effective.
- In the opening paragraph of this section, restate your research questions or aims to focus the reader’s attention to what the results are trying to show. It is also a good idea to summarize key findings at the end of this section to create a logical transition to the interpretation and discussion that follows.
- Try to write in the past tense and the active voice to relay the findings since the research has already been done and the agent is usually clear. This will ensure that your explanations are also clear and logical.
- Make sure that any specialized terminology or abbreviation you have used here has been defined and clarified in the Introduction section .
Step 5 : Review your draft; edit and revise until it reports results exactly as you would like to have them reported to your readers.
- Double-check the accuracy and consistency of all the data, as well as all of the visual elements included.
- Read your draft aloud to catch language errors (grammar, spelling, and mechanics), awkward phrases, and missing transitions.
- Ensure that your results are presented in the best order to focus on objectives and prepare readers for interpretations, valuations, and recommendations in the Discussion section . Look back over the paper’s Introduction and background while anticipating the Discussion and Conclusion sections to ensure that the presentation of your results is consistent and effective.
- Consider seeking additional guidance on your paper. Find additional readers to look over your Results section and see if it can be improved in any way. Peers, professors, or qualified experts can provide valuable insights.
One excellent option is to use a professional English proofreading and editing service such as Wordvice, including our paper editing service . With hundreds of qualified editors from dozens of scientific fields, Wordvice has helped thousands of authors revise their manuscripts and get accepted into their target journals. Read more about the proofreading and editing process before proceeding with getting academic editing services and manuscript editing services for your manuscript.
As the representation of your study’s data output, the Results section presents the core information in your research paper. By writing with clarity and conciseness and by highlighting and explaining the crucial findings of their study, authors increase the impact and effectiveness of their research manuscripts.
For more articles and videos on writing your research manuscript, visit Wordvice’s Resources page.
Wordvice Resources
- How to Write a Research Paper Introduction
- Which Verb Tenses to Use in a Research Paper
- How to Write an Abstract for a Research Paper
- How to Write a Research Paper Title
- Useful Phrases for Academic Writing
- Common Transition Terms in Academic Papers
- Active and Passive Voice in Research Papers
- 100+ Verbs That Will Make Your Research Writing Amazing
- Tips for Paraphrasing in Research Papers
- USC Libraries
- Research Guides
Organizing Your Social Sciences Research Paper
- 7. The Results
- Purpose of Guide
- Design Flaws to Avoid
- Independent and Dependent Variables
- Glossary of Research Terms
- Reading Research Effectively
- Narrowing a Topic Idea
- Broadening a Topic Idea
- Extending the Timeliness of a Topic Idea
- Academic Writing Style
- Applying Critical Thinking
- Choosing a Title
- Making an Outline
- Paragraph Development
- Research Process Video Series
- Executive Summary
- The C.A.R.S. Model
- Background Information
- The Research Problem/Question
- Theoretical Framework
- Citation Tracking
- Content Alert Services
- Evaluating Sources
- Primary Sources
- Secondary Sources
- Tiertiary Sources
- Scholarly vs. Popular Publications
- Qualitative Methods
- Quantitative Methods
- Insiderness
- Using Non-Textual Elements
- Limitations of the Study
- Common Grammar Mistakes
- Writing Concisely
- Avoiding Plagiarism
- Footnotes or Endnotes?
- Further Readings
- Generative AI and Writing
- USC Libraries Tutorials and Other Guides
- Bibliography
The results section is where you report the findings of your study based upon the methodology [or methodologies] you applied to gather information. The results section should state the findings of the research arranged in a logical sequence without bias or interpretation. A section describing results should be particularly detailed if your paper includes data generated from your own research.
Annesley, Thomas M. "Show Your Cards: The Results Section and the Poker Game." Clinical Chemistry 56 (July 2010): 1066-1070.
Importance of a Good Results Section
When formulating the results section, it's important to remember that the results of a study do not prove anything . Findings can only confirm or reject the hypothesis underpinning your study. However, the act of articulating the results helps you to understand the problem from within, to break it into pieces, and to view the research problem from various perspectives.
The page length of this section is set by the amount and types of data to be reported . Be concise. Use non-textual elements appropriately, such as figures and tables, to present findings more effectively. In deciding what data to describe in your results section, you must clearly distinguish information that would normally be included in a research paper from any raw data or other content that could be included as an appendix. In general, raw data that has not been summarized should not be included in the main text of your paper unless requested to do so by your professor.
Avoid providing data that is not critical to answering the research question . The background information you described in the introduction section should provide the reader with any additional context or explanation needed to understand the results. A good strategy is to always re-read the background section of your paper after you have written up your results to ensure that the reader has enough context to understand the results [and, later, how you interpreted the results in the discussion section of your paper that follows].
Bavdekar, Sandeep B. and Sneha Chandak. "Results: Unraveling the Findings." Journal of the Association of Physicians of India 63 (September 2015): 44-46; Brett, Paul. "A Genre Analysis of the Results Section of Sociology Articles." English for Specific Speakers 13 (1994): 47-59; Go to English for Specific Purposes on ScienceDirect;Burton, Neil et al. Doing Your Education Research Project . Los Angeles, CA: SAGE, 2008; Results. The Structure, Format, Content, and Style of a Journal-Style Scientific Paper. Department of Biology. Bates College; Kretchmer, Paul. Twelve Steps to Writing an Effective Results Section. San Francisco Edit; "Reporting Findings." In Making Sense of Social Research Malcolm Williams, editor. (London;: SAGE Publications, 2003) pp. 188-207.
Structure and Writing Style
I. Organization and Approach
For most research papers in the social and behavioral sciences, there are two possible ways of organizing the results . Both approaches are appropriate in how you report your findings, but use only one approach.
- Present a synopsis of the results followed by an explanation of key findings . This approach can be used to highlight important findings. For example, you may have noticed an unusual correlation between two variables during the analysis of your findings. It is appropriate to highlight this finding in the results section. However, speculating as to why this correlation exists and offering a hypothesis about what may be happening belongs in the discussion section of your paper.
- Present a result and then explain it, before presenting the next result then explaining it, and so on, then end with an overall synopsis . This is the preferred approach if you have multiple results of equal significance. It is more common in longer papers because it helps the reader to better understand each finding. In this model, it is helpful to provide a brief conclusion that ties each of the findings together and provides a narrative bridge to the discussion section of the your paper.
NOTE: Just as the literature review should be arranged under conceptual categories rather than systematically describing each source, you should also organize your findings under key themes related to addressing the research problem. This can be done under either format noted above [i.e., a thorough explanation of the key results or a sequential, thematic description and explanation of each finding].
II. Content
In general, the content of your results section should include the following:
- Introductory context for understanding the results by restating the research problem underpinning your study . This is useful in re-orientating the reader's focus back to the research problem after having read a review of the literature and your explanation of the methods used for gathering and analyzing information.
- Inclusion of non-textual elements, such as, figures, charts, photos, maps, tables, etc. to further illustrate key findings, if appropriate . Rather than relying entirely on descriptive text, consider how your findings can be presented visually. This is a helpful way of condensing a lot of data into one place that can then be referred to in the text. Consider referring to appendices if there is a lot of non-textual elements.
- A systematic description of your results, highlighting for the reader observations that are most relevant to the topic under investigation . Not all results that emerge from the methodology used to gather information may be related to answering the " So What? " question. Do not confuse observations with interpretations; observations in this context refers to highlighting important findings you discovered through a process of reviewing prior literature and gathering data.
- The page length of your results section is guided by the amount and types of data to be reported . However, focus on findings that are important and related to addressing the research problem. It is not uncommon to have unanticipated results that are not relevant to answering the research question. This is not to say that you don't acknowledge tangential findings and, in fact, can be referred to as areas for further research in the conclusion of your paper. However, spending time in the results section describing tangential findings clutters your overall results section and distracts the reader.
- A short paragraph that concludes the results section by synthesizing the key findings of the study . Highlight the most important findings you want readers to remember as they transition into the discussion section. This is particularly important if, for example, there are many results to report, the findings are complicated or unanticipated, or they are impactful or actionable in some way [i.e., able to be pursued in a feasible way applied to practice].
NOTE: Always use the past tense when referring to your study's findings. Reference to findings should always be described as having already happened because the method used to gather the information has been completed.
III. Problems to Avoid
When writing the results section, avoid doing the following :
- Discussing or interpreting your results . Save this for the discussion section of your paper, although where appropriate, you should compare or contrast specific results to those found in other studies [e.g., "Similar to the work of Smith [1990], one of the findings of this study is the strong correlation between motivation and academic achievement...."].
- Reporting background information or attempting to explain your findings. This should have been done in your introduction section, but don't panic! Often the results of a study point to the need for additional background information or to explain the topic further, so don't think you did something wrong. Writing up research is rarely a linear process. Always revise your introduction as needed.
- Ignoring negative results . A negative result generally refers to a finding that does not support the underlying assumptions of your study. Do not ignore them. Document these findings and then state in your discussion section why you believe a negative result emerged from your study. Note that negative results, and how you handle them, can give you an opportunity to write a more engaging discussion section, therefore, don't be hesitant to highlight them.
- Including raw data or intermediate calculations . Ask your professor if you need to include any raw data generated by your study, such as transcripts from interviews or data files. If raw data is to be included, place it in an appendix or set of appendices that are referred to in the text.
- Be as factual and concise as possible in reporting your findings . Do not use phrases that are vague or non-specific, such as, "appeared to be greater than other variables..." or "demonstrates promising trends that...." Subjective modifiers should be explained in the discussion section of the paper [i.e., why did one variable appear greater? Or, how does the finding demonstrate a promising trend?].
- Presenting the same data or repeating the same information more than once . If you want to highlight a particular finding, it is appropriate to do so in the results section. However, you should emphasize its significance in relation to addressing the research problem in the discussion section. Do not repeat it in your results section because you can do that in the conclusion of your paper.
- Confusing figures with tables . Be sure to properly label any non-textual elements in your paper. Don't call a chart an illustration or a figure a table. If you are not sure, go here .
Annesley, Thomas M. "Show Your Cards: The Results Section and the Poker Game." Clinical Chemistry 56 (July 2010): 1066-1070; Bavdekar, Sandeep B. and Sneha Chandak. "Results: Unraveling the Findings." Journal of the Association of Physicians of India 63 (September 2015): 44-46; Burton, Neil et al. Doing Your Education Research Project . Los Angeles, CA: SAGE, 2008; Caprette, David R. Writing Research Papers. Experimental Biosciences Resources. Rice University; Hancock, Dawson R. and Bob Algozzine. Doing Case Study Research: A Practical Guide for Beginning Researchers . 2nd ed. New York: Teachers College Press, 2011; Introduction to Nursing Research: Reporting Research Findings. Nursing Research: Open Access Nursing Research and Review Articles. (January 4, 2012); Kretchmer, Paul. Twelve Steps to Writing an Effective Results Section. San Francisco Edit ; Ng, K. H. and W. C. Peh. "Writing the Results." Singapore Medical Journal 49 (2008): 967-968; Reporting Research Findings. Wilder Research, in partnership with the Minnesota Department of Human Services. (February 2009); Results. The Structure, Format, Content, and Style of a Journal-Style Scientific Paper. Department of Biology. Bates College; Schafer, Mickey S. Writing the Results. Thesis Writing in the Sciences. Course Syllabus. University of Florida.
Writing Tip
Why Don't I Just Combine the Results Section with the Discussion Section?
It's not unusual to find articles in scholarly social science journals where the author(s) have combined a description of the findings with a discussion about their significance and implications. You could do this. However, if you are inexperienced writing research papers, consider creating two distinct sections for each section in your paper as a way to better organize your thoughts and, by extension, your paper. Think of the results section as the place where you report what your study found; think of the discussion section as the place where you interpret the information and answer the "So What?" question. As you become more skilled writing research papers, you can consider melding the results of your study with a discussion of its implications.
Driscoll, Dana Lynn and Aleksandra Kasztalska. Writing the Experimental Report: Methods, Results, and Discussion. The Writing Lab and The OWL. Purdue University.
- << Previous: Insiderness
- Next: Using Non-Textual Elements >>
- Last Updated: May 25, 2024 4:09 PM
- URL: https://libguides.usc.edu/writingguide
- How it works

How to Write the Dissertation Findings or Results – Steps & Tips
Published by Grace Graffin at August 11th, 2021 , Revised On October 9, 2023
Each part of the dissertation is unique, and some general and specific rules must be followed. The dissertation’s findings section presents the key results of your research without interpreting their meaning .
Theoretically, this is an exciting section of a dissertation because it involves writing what you have observed and found. However, it can be a little tricky if there is too much information to confuse the readers.
The goal is to include only the essential and relevant findings in this section. The results must be presented in an orderly sequence to provide clarity to the readers.
This section of the dissertation should be easy for the readers to follow, so you should avoid going into a lengthy debate over the interpretation of the results.
It is vitally important to focus only on clear and precise observations. The findings chapter of the dissertation is theoretically the easiest to write.
It includes statistical analysis and a brief write-up about whether or not the results emerging from the analysis are significant. This segment should be written in the past sentence as you describe what you have done in the past.
This article will provide detailed information about how to write the findings of a dissertation .
When to Write Dissertation Findings Chapter
As soon as you have gathered and analysed your data, you can start to write up the findings chapter of your dissertation paper. Remember that it is your chance to report the most notable findings of your research work and relate them to the research hypothesis or research questions set out in the introduction chapter of the dissertation .
You will be required to separately report your study’s findings before moving on to the discussion chapter if your dissertation is based on the collection of primary data or experimental work.
However, you may not be required to have an independent findings chapter if your dissertation is purely descriptive and focuses on the analysis of case studies or interpretation of texts.
- Always report the findings of your research in the past tense.
- The dissertation findings chapter varies from one project to another, depending on the data collected and analyzed.
- Avoid reporting results that are not relevant to your research questions or research hypothesis.
Does your Dissertation Have the Following?
- Great Research/Sources
- Perfect Language
- Accurate Sources
If not, we can help. Our panel of experts makes sure to keep the 3 pillars of the Dissertation strong.

1. Reporting Quantitative Findings
The best way to present your quantitative findings is to structure them around the research hypothesis or questions you intend to address as part of your dissertation project.
Report the relevant findings for each research question or hypothesis, focusing on how you analyzed them.
Analysis of your findings will help you determine how they relate to the different research questions and whether they support the hypothesis you formulated.
While you must highlight meaningful relationships, variances, and tendencies, it is important not to guess their interpretations and implications because this is something to save for the discussion and conclusion chapters.
Any findings not directly relevant to your research questions or explanations concerning the data collection process should be added to the dissertation paper’s appendix section.
Use of Figures and Tables in Dissertation Findings
Suppose your dissertation is based on quantitative research. In that case, it is important to include charts, graphs, tables, and other visual elements to help your readers understand the emerging trends and relationships in your findings.
Repeating information will give the impression that you are short on ideas. Refer to all charts, illustrations, and tables in your writing but avoid recurrence.
The text should be used only to elaborate and summarize certain parts of your results. On the other hand, illustrations and tables are used to present multifaceted data.
It is recommended to give descriptive labels and captions to all illustrations used so the readers can figure out what each refers to.
How to Report Quantitative Findings
Here is an example of how to report quantitative results in your dissertation findings chapter;
Two hundred seventeen participants completed both the pretest and post-test and a Pairwise T-test was used for the analysis. The quantitative data analysis reveals a statistically significant difference between the mean scores of the pretest and posttest scales from the Teachers Discovering Computers course. The pretest mean was 29.00 with a standard deviation of 7.65, while the posttest mean was 26.50 with a standard deviation of 9.74 (Table 1). These results yield a significance level of .000, indicating a strong treatment effect (see Table 3). With the correlation between the scores being .448, the little relationship is seen between the pretest and posttest scores (Table 2). This leads the researcher to conclude that the impact of the course on the educators’ perception and integration of technology into the curriculum is dramatic.
Paired Samples
Paired samples correlation, paired samples test.
Also Read: How to Write the Abstract for the Dissertation.
2. Reporting Qualitative Findings
A notable issue with reporting qualitative findings is that not all results directly relate to your research questions or hypothesis.
The best way to present the results of qualitative research is to frame your findings around the most critical areas or themes you obtained after you examined the data.
In-depth data analysis will help you observe what the data shows for each theme. Any developments, relationships, patterns, and independent responses directly relevant to your research question or hypothesis should be mentioned to the readers.
Additional information not directly relevant to your research can be included in the appendix .
How to Report Qualitative Findings
Here is an example of how to report qualitative results in your dissertation findings chapter;
How do I report quantitative findings?
The best way to present your quantitative findings is to structure them around the research hypothesis or research questions you intended to address as part of your dissertation project. Report the relevant findings for each of the research questions or hypotheses, focusing on how you analyzed them.
How do I report qualitative findings?
The best way to present the qualitative research results is to frame your findings around the most important areas or themes that you obtained after examining the data.
An in-depth analysis of the data will help you observe what the data is showing for each theme. Any developments, relationships, patterns, and independent responses that are directly relevant to your research question or hypothesis should be clearly mentioned for the readers.
Can I use interpretive phrases like ‘it confirms’ in the finding chapter?
No, It is highly advisable to avoid using interpretive and subjective phrases in the finding chapter. These terms are more suitable for the discussion chapter , where you will be expected to provide your interpretation of the results in detail.
Can I report the results from other research papers in my findings chapter?
NO, you must not be presenting results from other research studies in your findings.
You May Also Like
Dissertation discussion is where you explore the relevance and significance of results. Here are guidelines to help you write the perfect discussion chapter.
If your dissertation includes many abbreviations, it would make sense to define all these abbreviations in a list of abbreviations in alphabetical order.
Not sure how to start your dissertation and get it right the first time? Here are some tips and guidelines for you to kick start your dissertation project.
USEFUL LINKS
LEARNING RESOURCES

COMPANY DETAILS

- How It Works
How To Write The Results/Findings Chapter
For qualitative studies (dissertations & theses).
By: Jenna Crossley (PhD). Expert Reviewed By: Dr. Eunice Rautenbach | August 2021
So, you’ve collected and analysed your qualitative data, and it’s time to write up your results chapter. But where do you start? In this post, we’ll guide you through the qualitative results chapter (also called the findings chapter), step by step.
Overview: Qualitative Results Chapter
- What (exactly) the qualitative results chapter is
- What to include in your results chapter
- How to write up your results chapter
- A few tips and tricks to help you along the way
- Free results chapter template
What exactly is the results chapter?
The results chapter in a dissertation or thesis (or any formal academic research piece) is where you objectively and neutrally present the findings of your qualitative analysis (or analyses if you used multiple qualitative analysis methods ). This chapter can sometimes be combined with the discussion chapter (where you interpret the data and discuss its meaning), depending on your university’s preference. We’ll treat the two chapters as separate, as that’s the most common approach.
In contrast to a quantitative results chapter that presents numbers and statistics, a qualitative results chapter presents data primarily in the form of words . But this doesn’t mean that a qualitative study can’t have quantitative elements – you could, for example, present the number of times a theme or topic pops up in your data, depending on the analysis method(s) you adopt.
Adding a quantitative element to your study can add some rigour, which strengthens your results by providing more evidence for your claims. This is particularly common when using qualitative content analysis. Keep in mind though that qualitative research aims to achieve depth, richness and identify nuances , so don’t get tunnel vision by focusing on the numbers. They’re just cream on top in a qualitative analysis.
So, to recap, the results chapter is where you objectively present the findings of your analysis, without interpreting them (you’ll save that for the discussion chapter). With that out the way, let’s take a look at what you should include in your results chapter.

What should you include in the results chapter?
As we’ve mentioned, your qualitative results chapter should purely present and describe your results , not interpret them in relation to the existing literature or your research questions . Any speculations or discussion about the implications of your findings should be reserved for your discussion chapter.
In your results chapter, you’ll want to talk about your analysis findings and whether or not they support your hypotheses (if you have any). Naturally, the exact contents of your results chapter will depend on which qualitative analysis method (or methods) you use. For example, if you were to use thematic analysis, you’d detail the themes identified in your analysis, using extracts from the transcripts or text to support your claims.
While you do need to present your analysis findings in some detail, you should avoid dumping large amounts of raw data in this chapter. Instead, focus on presenting the key findings and using a handful of select quotes or text extracts to support each finding . The reams of data and analysis can be relegated to your appendices.
While it’s tempting to include every last detail you found in your qualitative analysis, it is important to make sure that you report only that which is relevant to your research aims, objectives and research questions . Always keep these three components, as well as your hypotheses (if you have any) front of mind when writing the chapter and use them as a filter to decide what’s relevant and what’s not.
Need a helping hand?
How do I write the results chapter?
Now that we’ve covered the basics, it’s time to look at how to structure your chapter. Broadly speaking, the results chapter needs to contain three core components – the introduction, the body and the concluding summary. Let’s take a look at each of these.
Section 1: Introduction
The first step is to craft a brief introduction to the chapter. This intro is vital as it provides some context for your findings. In your introduction, you should begin by reiterating your problem statement and research questions and highlight the purpose of your research . Make sure that you spell this out for the reader so that the rest of your chapter is well contextualised.
The next step is to briefly outline the structure of your results chapter. In other words, explain what’s included in the chapter and what the reader can expect. In the results chapter, you want to tell a story that is coherent, flows logically, and is easy to follow , so make sure that you plan your structure out well and convey that structure (at a high level), so that your reader is well oriented.
The introduction section shouldn’t be lengthy. Two or three short paragraphs should be more than adequate. It is merely an introduction and overview, not a summary of the chapter.
Pro Tip – To help you structure your chapter, it can be useful to set up an initial draft with (sub)section headings so that you’re able to easily (re)arrange parts of your chapter. This will also help your reader to follow your results and give your chapter some coherence. Be sure to use level-based heading styles (e.g. Heading 1, 2, 3 styles) to help the reader differentiate between levels visually. You can find these options in Word (example below).

Section 2: Body
Before we get started on what to include in the body of your chapter, it’s vital to remember that a results section should be completely objective and descriptive, not interpretive . So, be careful not to use words such as, “suggests” or “implies”, as these usually accompany some form of interpretation – that’s reserved for your discussion chapter.
The structure of your body section is very important , so make sure that you plan it out well. When planning out your qualitative results chapter, create sections and subsections so that you can maintain the flow of the story you’re trying to tell. Be sure to systematically and consistently describe each portion of results. Try to adopt a standardised structure for each portion so that you achieve a high level of consistency throughout the chapter.
For qualitative studies, results chapters tend to be structured according to themes , which makes it easier for readers to follow. However, keep in mind that not all results chapters have to be structured in this manner. For example, if you’re conducting a longitudinal study, you may want to structure your chapter chronologically. Similarly, you might structure this chapter based on your theoretical framework . The exact structure of your chapter will depend on the nature of your study , especially your research questions.
As you work through the body of your chapter, make sure that you use quotes to substantiate every one of your claims . You can present these quotes in italics to differentiate them from your own words. A general rule of thumb is to use at least two pieces of evidence per claim, and these should be linked directly to your data. Also, remember that you need to include all relevant results , not just the ones that support your assumptions or initial leanings.
In addition to including quotes, you can also link your claims to the data by using appendices , which you should reference throughout your text. When you reference, make sure that you include both the name/number of the appendix , as well as the line(s) from which you drew your data.
As referencing styles can vary greatly, be sure to look up the appendix referencing conventions of your university’s prescribed style (e.g. APA , Harvard, etc) and keep this consistent throughout your chapter.
Section 3: Concluding summary
The concluding summary is very important because it summarises your key findings and lays the foundation for the discussion chapter . Keep in mind that some readers may skip directly to this section (from the introduction section), so make sure that it can be read and understood well in isolation.
In this section, you need to remind the reader of the key findings. That is, the results that directly relate to your research questions and that you will build upon in your discussion chapter. Remember, your reader has digested a lot of information in this chapter, so you need to use this section to remind them of the most important takeaways.
Importantly, the concluding summary should not present any new information and should only describe what you’ve already presented in your chapter. Keep it concise – you’re not summarising the whole chapter, just the essentials.
Tips for writing an A-grade results chapter
Now that you’ve got a clear picture of what the qualitative results chapter is all about, here are some quick tips and reminders to help you craft a high-quality chapter:
- Your results chapter should be written in the past tense . You’ve done the work already, so you want to tell the reader what you found , not what you are currently finding .
- Make sure that you review your work multiple times and check that every claim is adequately backed up by evidence . Aim for at least two examples per claim, and make use of an appendix to reference these.
- When writing up your results, make sure that you stick to only what is relevant . Don’t waste time on data that are not relevant to your research objectives and research questions.
- Use headings and subheadings to create an intuitive, easy to follow piece of writing. Make use of Microsoft Word’s “heading styles” and be sure to use them consistently.
- When referring to numerical data, tables and figures can provide a useful visual aid. When using these, make sure that they can be read and understood independent of your body text (i.e. that they can stand-alone). To this end, use clear, concise labels for each of your tables or figures and make use of colours to code indicate differences or hierarchy.
- Similarly, when you’re writing up your chapter, it can be useful to highlight topics and themes in different colours . This can help you to differentiate between your data if you get a bit overwhelmed and will also help you to ensure that your results flow logically and coherently.
If you have any questions, leave a comment below and we’ll do our best to help. If you’d like 1-on-1 help with your results chapter (or any chapter of your dissertation or thesis), check out our private dissertation coaching service here or book a free initial consultation to discuss how we can help you.

Psst... there’s more!
This post was based on one of our popular Research Bootcamps . If you're working on a research project, you'll definitely want to check this out ...
You Might Also Like:
")
20 Comments

This was extremely helpful. Thanks a lot guys

Hi, thanks for the great research support platform created by the gradcoach team!
I wanted to ask- While “suggests” or “implies” are interpretive terms, what terms could we use for the results chapter? Could you share some examples of descriptive terms?

I think that instead of saying, ‘The data suggested, or The data implied,’ you can say, ‘The Data showed or revealed, or illustrated or outlined’…If interview data, you may say Jane Doe illuminated or elaborated, or Jane Doe described… or Jane Doe expressed or stated.

I found this article very useful. Thank you very much for the outstanding work you are doing.

What if i have 3 different interviewees answering the same interview questions? Should i then present the results in form of the table with the division on the 3 perspectives or rather give a results in form of the text and highlight who said what?

I think this tabular representation of results is a great idea. I am doing it too along with the text. Thanks

That was helpful was struggling to separate the discussion from the findings

this was very useful, Thank you.

Very helpful, I am confident to write my results chapter now.

It is so helpful! It is a good job. Thank you very much!

Very useful, well explained. Many thanks.

Hello, I appreciate the way you provided a supportive comments about qualitative results presenting tips

I loved this! It explains everything needed, and it has helped me better organize my thoughts. What words should I not use while writing my results section, other than subjective ones.

Thanks a lot, it is really helpful

Thank you so much dear, i really appropriate your nice explanations about this.

Thank you so much for this! I was wondering if anyone could help with how to prproperly integrate quotations (Excerpts) from interviews in the finding chapter in a qualitative research. Please GradCoach, address this issue and provide examples.

what if I’m not doing any interviews myself and all the information is coming from case studies that have already done the research.

Very helpful thank you.

This was very helpful as I was wondering how to structure this part of my dissertation, to include the quotes… Thanks for this explanation

This is very helpful, thanks! I am required to write up my results chapters with the discussion in each of them – any tips and tricks for this strategy?
Submit a Comment Cancel reply
Your email address will not be published. Required fields are marked *
Save my name, email, and website in this browser for the next time I comment.
- Print Friendly
- Discoveries
- Right Journal
- Journal Metrics
- Journal Fit
- Abbreviation
- In-Text Citations
- Bibliographies
- Writing an Article
- Peer Review Types
- Acknowledgements
- Withdrawing a Paper
- Form Letter
- ISO, ANSI, CFR
- Google Scholar
- Journal Manuscript Editing
- Research Manuscript Editing
Book Editing
- Manuscript Editing Services
Medical Editing
- Bioscience Editing
- Physical Science Editing
- PhD Thesis Editing Services
- PhD Editing
- Master’s Proofreading
- Bachelor’s Editing
- Dissertation Proofreading Services
- Best Dissertation Proofreaders
- Masters Dissertation Proofreading
- PhD Proofreaders
- Proofreading PhD Thesis Price
- Journal Article Editing
- Book Editing Service
- Editing and Proofreading Services
- Research Paper Editing
- Medical Manuscript Editing
- Academic Editing
- Social Sciences Editing
- Academic Proofreading
- PhD Theses Editing
- Dissertation Proofreading
- Proofreading Rates UK
- Medical Proofreading
- PhD Proofreading Services UK
- Academic Proofreading Services UK
Medical Editing Services
- Life Science Editing
- Biomedical Editing
- Environmental Science Editing
- Pharmaceutical Science Editing
- Economics Editing
- Psychology Editing
- Sociology Editing
- Archaeology Editing
- History Paper Editing
- Anthropology Editing
- Law Paper Editing
- Engineering Paper Editing
- Technical Paper Editing
- Philosophy Editing
- PhD Dissertation Proofreading
- Lektorat Englisch
- Akademisches Lektorat
- Lektorat Englisch Preise
- Wissenschaftliches Lektorat
- Lektorat Doktorarbeit
PhD Thesis Editing
- Thesis Proofreading Services
- PhD Thesis Proofreading
- Proofreading Thesis Cost
- Proofreading Thesis
- Thesis Editing Services
- Professional Thesis Editing
- Thesis Editing Cost
- Proofreading Dissertation
- Dissertation Proofreading Cost
- Dissertation Proofreader
- Correção de Artigos Científicos
- Correção de Trabalhos Academicos
- Serviços de Correção de Inglês
- Correção de Dissertação
- Correção de Textos Precos
- 定額 ネイティブチェック
- Copy Editing
- FREE Courses
- Revision en Ingles
- Revision de Textos en Ingles
- Revision de Tesis
- Revision Medica en Ingles
- Revision de Tesis Precio
- Revisão de Artigos Científicos
- Revisão de Trabalhos Academicos
- Serviços de Revisão de Inglês
- Revisão de Dissertação
- Revisão de Textos Precos
- Corrección de Textos en Ingles
- Corrección de Tesis
- Corrección de Tesis Precio
- Corrección Medica en Ingles
- Corrector ingles
Select Page
How To Write the Findings Section of a Research Paper
Posted by Rene Tetzner | Sep 2, 2021 | Paper Writing Advice | 0 |

How To Write the Findings Section of a Research Paper Each research project is unique, so it is natural for one researcher to make use of somewhat different strategies than another when it comes to designing and writing the section of a research paper dedicated to findings. The academic or scientific discipline of the research, the field of specialisation, the particular author or authors, the targeted journal or other publisher and the editor making the decisions about publication can all have a significant impact. The practical steps outlined below can be effectively applied to writing about the findings of most advanced research, however, and will prove especially helpful for early-career scholars who are preparing a research paper for a first publication.

Step 1 : Consult the guidelines or instructions that the targeted journal (or other publisher) provides for authors and read research papers it has already published, particularly ones similar in topic, methods or results to your own. The guidelines will generally outline specific requirements for the results or findings section, and the published articles will provide sound examples of successful approaches. Watch particularly for length limitations and restrictions on content. Interpretation, for instance, is usually reserved for a later discussion section, though not always – qualitative research papers often combine findings and interpretation. Background information and descriptions of methods, on the other hand, almost always appear in earlier sections of a research paper. In most cases it is appropriate in a findings section to offer basic comparisons between the results of your study and those of other studies, but knowing exactly what the journal wants in the report of research findings is essential. Learning as much as you can about the journal’s aims and scope as well as the interests of its readers is invaluable as well.

Step 2 : Reflect at some length on your research results in relation to the journal’s requirements while planning the findings section of your paper. Choose for particular focus experimental results and other research discoveries that are particularly relevant to your research questions and objectives, and include them even if they are unexpected or do not support your ideas and hypotheses. Streamline and clarify your report, especially if it is long and complex, by using subheadings that will help you avoid excessive and peripheral details as you write and also help your reader understand and remember your findings. Consider appendices for raw data that might interest specialists but prove too long or distracting for other readers. The opening paragraph of a findings section often restates research questions or aims to refocus the reader’s attention, and it is always wise to summarise key findings at the end of the section, providing a smooth intellectual transition to the interpretation and discussion that follows in most research papers. There are many effective ways in which to organise research findings. The structure of your findings section might be determined by your research questions and hypotheses or match the arrangement of your methods section. A chronological order or hierarchy of importance or meaningful grouping of main themes or categories might prove effective. It may be best to present all the relevant findings and then explain them and your analysis of them, or explaining the results of each trial or test immediately after reporting it may render the material clearer and more comprehensible for your readers. Keep your audience, your most important evidence and your research goals in mind.

Step 3 : Design effective visual presentations of your research results to enhance the textual report of your findings. Tables of various styles and figures of all kinds such as graphs, maps and photos are used in reporting research findings, but do check the journal guidelines for instructions on the number of visual aids allowed, any required design elements and the preferred formats for numbering, labelling and placement in the manuscript. As a general rule, tables and figures should be numbered according to first mention in the main text of the paper, and each one should be clearly introduced and explained at least briefly in that text so that readers know what is presented and what they are expected to see in a particular visual element. Tables and figures should also be self-explanatory, however, so their design should include all definitions and other information necessary for a reader to understand the findings you intend to show without returning to your text. If you construct your tables and figures before drafting your findings section, they can serve as focal points to help you tell a clear and informative story about your findings and avoid unnecessary repetition. Some authors will even work on tables and figures before organising the findings section (Step 2), which can be an extremely effective approach, but it is important to remember that the textual report of findings remains primary. Visual aids can clarify and enrich the text, but they cannot take its place.
Step 4 : Write your findings section in a factual and objective manner. The goal is to communicate information – in some cases a great deal of complex information – as clearly, accurately and precisely as possible, so well-constructed sentences that maintain a simple structure will be far more effective than convoluted phrasing and expressions. The active voice is often recommended by publishers and the authors of writing manuals, and the past tense is appropriate because the research has already been done. Make sure your grammar, spelling and punctuation are correct and effective so that you are conveying the meaning you intend. Statements that are vague, imprecise or ambiguous will often confuse and mislead readers, and a verbose style will add little more than padding while wasting valuable words that might be put to far better use in clear and logical explanations. Some specialised terminology may be required when reporting findings, but anything potentially unclear or confusing that has not already been defined earlier in the paper should be clarified for readers, and the same principle applies to unusual or nonstandard abbreviations. Your readers will want to understand what you are reporting about your results, not waste time looking up terms simply to understand what you are saying. A logical approach to organising your findings section (Step 2) will help you tell a logical story about your research results as you explain, highlight, offer analysis and summarise the information necessary for readers to understand the discussion section that follows.
Step 5 : Review the draft of your findings section and edit and revise until it reports your key findings exactly as you would have them presented to your readers. Check for accuracy and consistency in data across the section as a whole and all its visual elements. Read your prose aloud to catch language errors, awkward phrases and abrupt transitions. Ensure that the order in which you have presented results is the best order for focussing readers on your research objectives and preparing them for the interpretations, speculations, recommendations and other elements of the discussion that you are planning. This will involve looking back over the paper’s introductory and background material as well as anticipating the discussion and conclusion sections, and this is precisely the right point in the process for reviewing and reflecting. Your research results have taken considerable time to obtain and analyse, so a little more time to stand back and take in the wider view from the research door you have opened is a wise investment. The opinions of any additional readers you can recruit, whether they are professional mentors and colleagues or family and friends, will often prove invaluable as well.
You might be interested in Services offered by Proof-Reading-Service.com
Journal editing.
Journal article editing services
PhD thesis editing services
Scientific Editing
Manuscript editing.
Manuscript editing services
Expert Editing
Expert editing for all papers
Research Editing
Research paper editing services
Professional book editing services
How To Write the Findings Section of a Research Paper These five steps will help you write a clear & interesting findings section for a research paper
Related Posts

How To Write a Journal Article
September 6, 2021

Tips on How To Write a Journal Article
August 30, 2021

How To Write Highlights for an Academic or Scientific Paper
September 7, 2021

Tips on How To Write an Effective Figure Legend
August 27, 2021
Our Recent Posts

Our review ratings
- Examples of Research Paper Topics in Different Study Areas Score: 98%
- Dealing with Language Problems – Journal Editor’s Feedback Score: 95%
- Making Good Use of a Professional Proofreader Score: 92%
- How To Format Your Journal Paper Using Published Articles Score: 95%
- Journal Rejection as Inspiration for a New Perspective Score: 95%
Explore our Categories
- Abbreviation in Academic Writing (4)
- Career Advice for Academics (5)
- Dealing with Paper Rejection (11)
- Grammar in Academic Writing (5)
- Help with Peer Review (7)
- How To Get Published (146)
- Paper Writing Advice (17)
- Referencing & Bibliographies (16)
- Link to facebook
- Link to linkedin
- Link to twitter
- Link to youtube
- Writing Tips
How to Write an “Implications of Research” Section

4-minute read
- 24th October 2022
When writing research papers , theses, journal articles, or dissertations, one cannot ignore the importance of research. You’re not only the writer of your paper but also the researcher ! Moreover, it’s not just about researching your topic, filling your paper with abundant citations, and topping it off with a reference list. You need to dig deep into your research and provide related literature on your topic. You must also discuss the implications of your research.
Interested in learning more about implications of research? Read on! This post will define these implications, why they’re essential, and most importantly, how to write them. If you’re a visual learner, you might enjoy this video .
What Are Implications of Research?
Implications are potential questions from your research that justify further exploration. They state how your research findings could affect policies, theories, and/or practices.
Implications can either be practical or theoretical. The former is the direct impact of your findings on related practices, whereas the latter is the impact on the theories you have chosen in your study.
Example of a practical implication: If you’re researching a teaching method, the implication would be how teachers can use that method based on your findings.
Example of a theoretical implication: You added a new variable to Theory A so that it could cover a broader perspective.
Finally, implications aren’t the same as recommendations, and it’s important to know the difference between them .
Questions you should consider when developing the implications section:
● What is the significance of your findings?
● How do the findings of your study fit with or contradict existing research on this topic?
● Do your results support or challenge existing theories? If they support them, what new information do they contribute? If they challenge them, why do you think that is?
Why Are Implications Important?
You need implications for the following reasons:
● To reflect on what you set out to accomplish in the first place
● To see if there’s a change to the initial perspective, now that you’ve collected the data
● To inform your audience, who might be curious about the impact of your research
How to Write an Implications Section
Usually, you write your research implications in the discussion section of your paper. This is the section before the conclusion when you discuss all the hard work you did. Additionally, you’ll write the implications section before making recommendations for future research.
Implications should begin with what you discovered in your study, which differs from what previous studies found, and then you can discuss the implications of your findings.
Your implications need to be specific, meaning you should show the exact contributions of your research and why they’re essential. They should also begin with a specific sentence structure.
Examples of starting implication sentences:
● These results build on existing evidence of…
● These findings suggest that…
● These results should be considered when…
● While previous research has focused on x , these results show that y …
Find this useful?
Subscribe to our newsletter and get writing tips from our editors straight to your inbox.
You should write your implications after you’ve stated the results of your research. In other words, summarize your findings and put them into context.
The result : One study found that young learners enjoy short activities when learning a foreign language.
The implications : This result suggests that foreign language teachers use short activities when teaching young learners, as they positively affect learning.
Example 2
The result : One study found that people who listen to calming music just before going to bed sleep better than those who watch TV.
The implications : These findings suggest that listening to calming music aids sleep quality, whereas watching TV does not.
To summarize, remember these key pointers:
● Implications are the impact of your findings on the field of study.
● They serve as a reflection of the research you’ve conducted.
● They show the specific contributions of your findings and why the audience should care.
● They can be practical or theoretical.
● They aren’t the same as recommendations.
● You write them in the discussion section of the paper.
● State the results first, and then state their implications.
Are you currently working on a thesis or dissertation? Once you’ve finished your paper (implications included), our proofreading team can help ensure that your spelling, punctuation, and grammar are perfect. Consider submitting a 500-word document for free.
Share this article:
Post A New Comment
Got content that needs a quick turnaround? Let us polish your work. Explore our editorial business services.
9-minute read
How to Use Infographics to Boost Your Presentation
Is your content getting noticed? Capturing and maintaining an audience’s attention is a challenge when...
8-minute read
Why Interactive PDFs Are Better for Engagement
Are you looking to enhance engagement and captivate your audience through your professional documents? Interactive...
7-minute read
Seven Key Strategies for Voice Search Optimization
Voice search optimization is rapidly shaping the digital landscape, requiring content professionals to adapt their...
Five Creative Ways to Showcase Your Digital Portfolio
Are you a creative freelancer looking to make a lasting impression on potential clients or...
How to Ace Slack Messaging for Contractors and Freelancers
Effective professional communication is an important skill for contractors and freelancers navigating remote work environments....
3-minute read
How to Insert a Text Box in a Google Doc
Google Docs is a powerful collaborative tool, and mastering its features can significantly enhance your...
Make sure your writing is the best it can be with our expert English proofreading and editing.

An official website of the United States government
The .gov means it’s official. Federal government websites often end in .gov or .mil. Before sharing sensitive information, make sure you’re on a federal government site.
The site is secure. The https:// ensures that you are connecting to the official website and that any information you provide is encrypted and transmitted securely.
- Publications
- Account settings
Preview improvements coming to the PMC website in October 2024. Learn More or Try it out now .
- Advanced Search
- Journal List
- PLoS Comput Biol
- v.16(4); 2020 Apr
Ten simple rules for innovative dissemination of research
Tony ross-hellauer.
1 Open and Reproducible Research Group, Institute of Interactive Systems and Data Science, Graz University of Technology and Know-Center GmbH, Graz, Austria
Jonathan P. Tennant
2 Center for Research and Interdisciplinarity, University of Paris, Paris, France
Viltė Banelytė
3 Freelance Researcher, Vilnius, Lithuania
Edit Gorogh
4 University and National Library, University of Debrecen, Debrecen, Hungary
Daniela Luzi
5 Institute for Research on Population and Social Policies, National Research Council, Rome, Italy
Peter Kraker
6 Open Knowledge Maps, Vienna, Austria
Lucio Pisacane
Roberta ruggieri, electra sifacaki.
7 National and Kapodistrian University of Athens, Athens, Greece
Michela Vignoli
8 Center for Digital Safety and Security, AIT Austrian Institute of Technology, Vienna, Austria
Author summary
How we communicate research is changing because of new (especially digital) possibilities. This article sets out 10 easy steps researchers can take to disseminate their work in novel and engaging ways, and hence increase the impact of their research on science and society.
Introduction
As with virtually all areas of life, research dissemination has been disrupted by the internet and digitally networked technologies. The last two decades have seen the majority of scholarly journals move online, and scholarly books are increasingly found online as well as in print. However, these traditional communication vehicles have largely retained similar functions and formats during this transition. But digital dissemination can happen in a variety of ways beyond the traditional modes: social media have become more widely used among researchers [ 1 , 2 , 3 ], and the use of blogs and wikis as a specific form of ‘open notebook science’ has been popular for more than a decade [ 4 ].
Professional academic social networks such as ResearchGate and Academia.edu boast millions of users. New online formats for interaction with the wider public, such as TED talks broadcast via YouTube, often receive millions of views. Some researchers have even decided to make all of their research findings public in real time by keeping open notebooks [ 5 , 6 ]. In particular, digital technologies invoke new ways of reaching and involving audiences beyond their usual primary dissemination targets (i.e., other scholars) to actively involve peers or citizens who would otherwise remain out of reach for traditional methods of communication [ 7 ]. Adoption of these outlets and methods can also lead to new cross-disciplinary collaborations, helping to create new research, publication, and funding opportunities [ 8 ].
Beyond the increase in the use of web-based and computational technologies, other trends in research cultures have had a profound effect on dissemination. The push towards greater public understanding of science and research since the 1980s, and an emphasis on engagement and participation of non-research audiences have brought about new forms of dissemination [ 9 ]. These approaches include popular science magazines and science shows on television and the radio. In recent years, new types of events have emerged that aim at involving the general public within the research process itself, including science slams and open lab days. With science cafés and hackerspaces, novel, participatory spaces for research production and dissemination are emerging—both online and offline. Powerful trends towards responsible research and innovation, the increasing globalisation of research, and the emergence and inclusion of new or previously excluded stakeholders or communities are also reshaping the purposes of dissemination as well as the scope and nature of its audiences.
Many now view wider dissemination and public engagement with science to be a fundamental element of open science [ 10 ]. However, there is a paradox at play here, for while there have never been more avenues for the widespread dissemination of research, researchers tend nonetheless to value and focus upon just a few traditional outputs: journal articles, books, and conference presentations [ 11 ].
Following Wilson and colleagues [ 12 ], we here define research dissemination as a planned process that involves consideration of target audiences, consideration of the settings in which research findings are to be received, and communicating and interacting with wider audiences in ways that will facilitate research uptake and understanding. Innovative dissemination, then, means dissemination that goes beyond traditional academic publishing (e.g., academic journals, books, or monographs) and meetings (conferences and workshops) to achieve more widespread research uptake and understanding. Hence, a citizen science project, which involves citizens in data collection but does not otherwise educate them about the research, is not here considered innovative dissemination.
We here present 10 steps researchers can take to embrace innovative dissemination practices in their research, either as individuals or groups ( Fig 1 ). They represent the synthesis of multidimensional research activities undertaken within the OpenUP project ( https://www.openuphub.eu/ ). This European Coordination and Support Action grant award addressed key aspects and challenges of the currently transforming science landscape and proposed recommendations and solutions addressing the needs of researchers, innovators, the public, and funding bodies. The goal is to provide stakeholders (primarily researchers but also intermediaries) with an entry point to innovative dissemination, so that they can choose methods and tools based on their audience, their skills, and their requirements. The advice is directed towards both individual researchers and research teams or projects. It is similar to other entries in the Ten Simple Rules series (e.g., [ 13 , 14 ]). Ultimately, the benefit here for researchers is increased recognition and social impact of their work.

Rule 1: Get the basics right
Despite changes in communication technologies and models, there are some basic organisational aspects of dissemination that remain important: to define objectives, map potential target audience(s), target messages, define mode of communication/engagement, and create a dissemination plan. These might seem a bit obvious or laborious but are critical first steps towards strategically planning a project.
Define objectives
The motivation to disseminate research can come in many forms. You might want to share your findings with wider nonacademic audiences to raise awareness of particular issues or invite audience engagement, participation, and feedback. Start by asking yourself what you want to achieve with your dissemination. This first strategic step will make all other subsequent steps much simpler, as well as guide how you define the success of your activities.
Map your audience
Specify who exactly you want your research results to reach, for which purposes, and what their general characteristics might be (e.g., policy makers, patient groups, non-governmental organisations). Individuals are not just ‘empty vessels’ to be filled with new knowledge, and having a deeper contextual understanding of your audience can make a real difference to the success of your engagement practices. Who is most affected by your research? Who might find it most valuable? What is it that you want them to take away? Get to know your target audiences, their needs and expectations of the research outcomes, as well as their preferred communication channels to develop a detailed understanding of their interests and align your messages and media with their needs and priorities. Keep in mind, too, that intermediaries such as journalists or science communication organisations can support or mediate the dissemination process.
Target/frame your messages
Target and frame the key messages that you want to communicate to specific groups. Think first from the perspective of what they might want or need to hear from you, rather than what you want to tell them. Choosing media and format of your communication strongly depends on your communication objectives, i.e., what you want to achieve. There are many ways to communicate your research; for example, direct messages, blog/vlog posts, tweeting about it, or putting your research on Instagram. Form and content go hand in hand. Engage intermediaries and leverage any relevant existing networks to help amplify messages.
Create a dissemination plan
Many funded research projects require a dissemination plan. However, even if not, the formal exercise of creating a plan at the outset that organises dissemination around distinct milestones in the research life cycle will help you to assign roles, structure activities, as well as plan funds to be allocated in your dissemination. This will ultimately save you time and make future work easier. If working in groups, distribute tasks and effort to ensure regular updates of content targeted to different communities. Engage those with special specific skills in the use and/or development of appropriate communication tools, to help you in using the right language and support you in finding the suitable occasions to reach your identified audience. Research is not linear, however, and so you might find it best to treat the plan as a living document to be flexibly adapted as the direction of research changes.
Rule 2: Keep the right profile
Whether communicating as an individual researcher, a research project, or a research organisation, establishing a prominent and unique identity online and offline is essential for communicating. Use personal websites, social media accounts, researcher identifiers, and academic social networks to help make you and your research visible. When doing this, try to avoid any explicit self-promotion—your personal profile naturally will develop based on your ability to be an effective and impactful communicator.
Academia is a prestige economy, where individual researchers are often evaluated based on their perceived esteem or standing within their communities [ 15 ]. Remaining visible is an essential part of accumulating esteem. An online presence maintained via personal websites, social media accounts (e.g., Facebook, Twitter, LinkedIn), researcher identifiers (e.g., ORCID), and academic social networks (e.g., ResearchGate, institutional researcher profiles) can be a personal calling card, where you can highlight experience and demonstrate your expertise in certain topics. Being active on important mailing lists, forums, and social media is not only a good chance to disseminate your findings to those communities but also offers you the chance to engage with your community and potentially spark new ideas and collaborations.
Using researcher identifiers like ORCID when disseminating outputs will ensure that those outputs will be unambiguously linked back to the individual researcher (and even automatically updated to their ORCID profile). The OpenUP survey showed that nearly half of the respondents (41%) use academic social networks as a medium to disseminate their research, and a quarter of respondents (26%) said that these networks informed their professional work [ 16 ].
Create a brand by giving your project a unique name, ideally with some intuitive relation to the issue you are investigating. Create a striking visual identity, with a compelling logo, core colours, and a project slogan. Create a website that leverages this visual identity and is as simple and intuitive as possible, both in its layout and in the way content is formulated (limit insider jargon). Create associated appropriate social media accounts (e.g., Twitter, Facebook, LinkedIn, SlideShare, YouTube) and link to this from the project website. Aim for a sustained presence with new and engaging content to reinforce project messaging, and this can help to establish a core following group or user base within different platforms. Include links to other project online presences such as social media accounts, or a rolling feed of updates if possible. Consider including a blog to disseminate core findings or give important project updates. A periodical newsletter could be released in order to provide project updates and other news, to keep the community informed and activated regarding project issues. Depending on the size of your project and budget, you might want to produce hard copy material such as leaflets or fact sheets, as well as branded giveaways to increase awareness of your project. Finally, and perhaps most importantly, try not to come across as a ‘scientific robot’, and make sure to communicate the more human personality side of research.
Rule 3: Encourage participation
In the age of open research, don’t just broadcast. Invite and engage others to foster participation and collaboration with research audiences. Scholarship is a collective endeavour, and so we should not expect its dissemination to be unidirectional, especially not in the digital age. Dissemination is increasingly done at earlier stages of the research life cycle, and such wider and more interactive engagement is becoming an integral part of the whole research workflow.
Such participative activities can be as creative as you wish; for example, through games, such as Foldit for protein folding ( https://fold.it/portal/ ). You might even find it useful to actively engage ‘citizen scientists’ in research projects; for example, to collect data or analyse findings. Initiatives such as Zooniverse ( https://www.zooniverse.org/ ) serve as great examples of allowing anyone to freely participate in cutting-edge ‘people-powered research’.
Disseminating early and often showcases the progress of your work and demonstrates productivity and engagement as part of an agile development workflow. People like to see progress and react positively to narrative, so give regular updates to followers on social media, for example, blogging or tweeting early research findings for early feedback. Alternatively, involving businesses early on can align research to industry requirements and expectations, thus potentially increasing commercial impact. In any case, active involvement of citizens and other target audiences beyond academia can help increase the societal impact of your research [ 17 ].
Rule 4: Open science for impact
Open science is ‘transparent and accessible knowledge that is shared and developed through collaborative networks’, as defined by one systematic review [ 18 ]. It encompasses a variety of practices covering a range of research processes and outputs, including areas like open access (OA) to publications, open research data, open source software/tools, open workflows, citizen science, open educational resources, and alternative methods for research evaluation including open peer review [ 19 ]. Open science is rooted in principles of equitable participation and transparency, enabling others to collaborate in, contribute to, scrutinise and reuse research, and spread knowledge as widely as possible [ 20 ]. As such, innovative dissemination is a core element of open science.
Embracing open science principles can boost the impact of research. Firstly, OA publications seem to accrue more citations than their closed counterparts, as well as having a variety of possible wider economic and societal benefits [ 21 ]. There are a number of ways to make research papers OA, including at the journal site itself, or self-archiving an accepted manuscript in a repository or personal website.
Disseminating publications as preprints in advance of or parallel to journal submission can increase impact, as measured by relative citation counts [ 22 ]. Very often, traditional publishing takes a long time, with the waiting time between submission and acceptance of a paper being in excess of 100 days [ 23 ]. Preprinting speeds up dissemination, meaning that findings are available sooner for sharing and reuse. Potential platforms for disseminating preprints include the Open Science Framework, biorXiv, or arXiv.
Dissemination of other open science outputs that would usually remain hidden also not only helps to ensure the transparency and increased reproducibility of research [ 24 ], but also means that more research elements are released that can potentially impact upon others by creating network effects through reuse. Making FAIR (Findable, Accessible, Interoperable, Reusable) research data and code available enables reuse and remixing of core research outputs, which can also lead to further citations for projects [ 25 , 26 , 27 ]. Published research proposals, protocols, and open notebooks act as advertisements for ongoing research and enable others to reuse methods, exposing the continuous and collaborative nature of scholarship.
To enable reuse, embrace open licenses. When it comes to innovative dissemination, the goal is usually that the materials are accessible to as large an audience as possible. If appropriate open licenses are not used, while materials may be free to access, they cannot be widely used, modified, or shared. The best in this case is the widely adopted Creative Commons licenses, CC BY or CC 0. Variations of these licenses are less permissive and can constrain reuse for commercial or derivative purposes. This limitation, however, prevents the use of materials in many forms of (open) educational resources and other open projects, including Wikipedia. Careful consideration should be given to licensing of materials, depending on what your intended outcomes from the project are (see Rule 1). Research institutes and funding bodies typically have a variety of policies and guidance about the use and licensing of such materials, and should be consulted prior to releasing any materials.
Rule 5: Remix traditional outputs
Traditional research outputs like research articles and books can be complemented with innovative dissemination to boost impact; for example, by preparing accompanying nonspecialist summaries, press releases, blog posts, and visual/video abstracts to better reach your target audiences. Free media coverage can be an easy way to get results out to as many people as possible. There are countless media outlets interested in science-related stories. Most universities and large research organisations have an office for public affairs or communication: liaise with these experts to disseminate research findings widely through public media. Consider writing a press release for manuscripts that have been accepted for publication in journals or books and use sample forms and tools available online to assist you in the process. Some journals also have dedicated press teams that might be able to help you with this.
Another useful tool to disseminate traditional research outputs is to release a research summary document. This one- or two-page document clearly and concisely summarises the key conclusions from a research initiative. It can combine several studies by the same investigator or by a research group and should integrate two main components: key findings and fact sheets (preferably with graphical images to illustrate your point). This can be published on your institutional website as well as on research blogs, thematic hubs, or simply posted on your social media profiles. Other platforms such as ScienceOpen and Kudos allow authors to attach nonspecialist summaries to each of their research papers.
To maximise the impact of your conference presentations or posters, there are several steps that can be taken. For instance, you can upload your slides to a general-purpose repository such as Figshare or Zenodo and add a digital object identifier (DOI) to your presentation. This also makes it easier to integrate such outputs with other services like ORCID. You can also schedule tweets before and during any conferences, and use the conference hashtag to publicise your talk or poster. Finally, you can also add information about your contributions to email signatures or out-of-office messages [ 28 ].
Rule 6: Go live
In-person dissemination does not just have to be at stuffy conferences. With research moving beyond the walls of universities, there are several types of places for more participatory events. Next to classic scientific conferences, different types of events addressing wider audiences have emerged. It is possible to hit the road and take part in science festivals, science slams, TEDx talks, or road shows.
Science slams are short talks in which researchers explain a scientific topic to a typically nonexpert audience. Similar to other short talk formats like TED talks, they lend themselves to being spread over YouTube and other video channels. A prominent example from the German-speaking area is Giulia Enders, who won the first prize in a science slam that took place in 2012 in Berlin. The YouTube video of her fascinating talk about the gut has received over 1 million views. After this success, she got an offer to write a book about the gut and the digestive system, which has since been published and translated into many languages. You never know how these small steps might end up having a wider impact on your research and career.
Another example is Science Shops, small entities which provide independent, participatory research support to civil society. While they are usually linked to universities, hacker and maker spaces tend to be community-run locations, where people with an interest in science, engineering, and art meet and collaborate on projects. Science festivals are community-based showcases of science and technology that take place over large areas for several days or weeks and directly involve researchers and practitioners in public outreach. Less formally, Science Cafés or similar events like Pint of Science are public engagement events in casual settings like pubs and coffeehouses.
Alternatively, for a more personal approach, consider reaching out to key stakeholders who might be affected by your research and requesting a meeting, or participating in relevant calls for policy consultations. Such an approach can be especially powerful in getting the message across to decision-makers and thought-leaders, although the resources required to schedule and potentially travel to such meetings means you should target such activities very carefully. And don’t forget the value of serendipity—who knows who you’ll meet in the course of your everyday meetings and travels. Always be prepared with a 30 second ‘elevator pitch’ that sums up your project in a confident and concise manner—such encounters may be the gateways to greater engagement or opportunities.
Rule 7: Think visual
Dissemination of research is still largely ruled by the written or spoken word. However, there are many ways to introduce visual elements that can act as attractive means to help your audience understand and interpret your research. Disseminate findings through art or multimedia interpretations. Let your artistic side loose or use new visualisation techniques to produce intuitive, attractive data displays. Of course, not everyone is a trained artist, and this will be dependent on your personal skills.
Most obviously, this could take the form of data visualisation. Graphic representation of quantitative information reaches back to ‘earliest map-making and visual depiction’ [ 29 ]. As technologies have advanced, so have our means of visually representing data.
If your data visualisations could be considered too technical and not easily understandable by a nonexpert reader, consider creating an ad hoc image for this document; sometimes this can also take the form of a graphical abstract or infographic. Use online tools to upload a sample of your data and develop smart graphs and infographics (e.g., Infogr.am, Datawrapper, Easel.ly, or Venngage).
Science comics can be used, in the words of McDermott, Partridge, and Bromberg [ 30 ], to ‘communicate difficult ideas efficiently, illuminate obscure concepts, and create a metaphor that can be much more memorable than a straightforward description of the concept itself’. McDermott and colleagues continue that comics can be used to punctuate or introduce papers or presentations and to capture and share the content of conference talks, and that some journals even have a ‘cartoon’ publication category. They advise that such content has a high chance of being ‘virally’ spread via social media.
As previously discussed, you may also consider creating a video abstract for a paper or project. However, as with all possible methods, it is worth considering the relative costs versus benefits of such an approach. Creating a high-quality video might have more impact than, say, a blog post but could be more costly to produce.
Projects have even successfully disseminated scientific findings through art. For example, The Civilians—a New York–based investigative theatre company—received a three-year grant to develop The Great Immensity , a play addressing the complexity of climate change. AstroDance tells the story of the search for gravitational waves through a combination of dance, multimedia, sound, and computer simulations. The annual Dance Your PhD contest, which began in 2007 and is sponsored by Science magazine, even asks scientists to interpret their PhD research as dance. This initiative receives approximately 50 submissions a year, demonstrating the popularity of novel forms of research dissemination.
Rule 8: Respect diversity
The academic discourse on diversity has always included discussions on gender, ethnic and cultural backgrounds, digital literacy, and epistemic, ideological, or economic diversity. An approach that is often taken is to include as many diverse groups into research teams as possible; for example, more women, underrepresented minorities, or persons from developing countries. In terms of scientific communication, however, not only raising awareness about diversity issues but also increasing visibility of underrepresented minorities in research or including more women in science communication teams should be considered, and embedded in projects from the outset. Another important aspect is assessing how the communication messages are framed, and if the chosen format and content is appropriate to address and respect all audiences. Research should reach all who might be affected by it. Respect inclusion in scientific dissemination by creating messages that reflect and respect diversity regarding factors like gender, demography, and ability. Overcoming geographic barriers is also important, as well as the consideration of differences in time zones and the other commitments that participants might have. As part of this, it is a key responsibility to create a healthy and welcoming environment for participation. Having things such as a code of conduct, diversity statement, and contributing guidelines can really help provide this for projects.
The 2017 Progression Framework benchmarking report of the Scientific Council made several recommendations on how to make progress on diversity and inclusion in science: (1) A strategy and action plan for diversity should developed that requires action from all members included and (2) diversity should be included in a wide range of scientific activities, such as building diversity into prizes, awards, or creating guidance on building diversity and inclusion across a range of demographics groups into communications, and building diversity and inclusion into education and training.
Rule 9: Find the right tools
Innovative dissemination practices often require different resources and skills than traditional dissemination methods. As a result of different skills and tools needed, there may be higher costs associated with some aspects of innovative dissemination. You can find tools via a more-complete range of sources, including the OpenUP Hub. The Hub lists a catalogue of innovative dissemination services, organised according to the following categories, with some suggested tools:
- Visualising data: tools to help create innovative visual representations of data (e.g., Nodegoat, DataHero, Plot.ly)
- Sharing notebooks, protocols, and workflows: ways to share outputs that document and share research processes, including notebooks, protocols, and workflows (e.g., HiveBench, Protocols.io, Open Notebook Science Network)
- Crowdsourcing and collaboration: platforms that help researchers and those outside academia to come together to perform research and share ideas (e.g., Thinklab, Linknovate, Just One Giant Lab)
- Profiles and networking: platforms to raise academic profile and find collaboration and funding opportunities with new partners (e.g., Humanities Commons, ORCID, ImpactStory)
- Organiding events: tools to help plan, facilitate, and publicise academic events (e.g., Open Conference Systems, Sched, ConfTool)
- Outreach to wider public: channels to help broadcast your research to audiences beyond academia, including policy makers, young people, industry, and broader society (e.g., Famelab, Kudos, Pint of Science)
- Publishing: platforms, tools, and services to help you publish your research (e.g., Open Science Framework, dokieli, ScienceMatters)
- Archive and share: preprint servers and repositories to help you archive and share your texts, data, software, posters, and more (e.g., BitBucket, GitHub, RunMyCode)
The Hub here represents just one attempt to create a registry of resources related to scholarly communication. A similar project is the 101 Innovations in Scholarly Communication project, which contains different tools and services for all parts of a generalised research workflow, including dissemination and outreach. This can be broadly broken down into services for communication through social media (e.g., Twitter), as well as those designed for sharing of scholarly outputs, including posters and presentations (e.g., Zenodo or Figshare). The Open Science MOOC has also curated a list of resources for its module on Public Engagement with Science, and includes key research articles, organisations, and services to help with wider scientific engagement.
Rule 10: Evaluate, evaluate, evaluate
Assess your dissemination activities. Are they having the right impact? If not, why not? Evaluation of dissemination efforts is an essential part of the process. In order to know what worked and which strategies did not generate the desired outcomes, all the research activities should be rigorously assessed. Such evaluation should be measured via the use of a combination of quantitative and qualitative indicators (which should be already foreseen in the planning stage of dissemination; see Rule 1). Questionnaires, interviews, observations, and assessments could also be used to measure the impact. Assessing and identifying the most successful practices will give you the evidence for the most effective strategies to reach your audience. In addition, the evaluation can help you plan your further budget and minimise the spending and dedicating efforts on ineffective dissemination methods.
Some examples of quantitative indicators include the following:
- Citations of publications;
- alternative metrics related to websites and social media platforms (updates, visits, interactions, likes, and reposts);
- numbers of events held for specific audiences;
- numbers of participants in those events;
- production and circulation of printed materials;
- media coverage (articles in specialised press newsletters, press releases, interviews, etc.); and
- how much time and effort were spent on activities.
Some examples of qualitative indicators include the following:
- Visibility in the social media and attractiveness of website;
- newly established contacts with networks and partners and the outcomes of these contacts;
- feedback from the target groups; and
- share feedback within your group on what dissemination strategies seemed to be the most effective in conveying your messages and reaching your target audiences.
We recognise that researchers are usually already very busy, and we do not seek to pressurise them further by increasing their burdens. Our recommendations, however, come at a time when there are shifting norms in how researchers are expected to engage with society through new technologies. Researchers are now often partially evaluated based on such, or expected to include dissemination plans in grant applications. We also do not want to encourage the further fragmentation of scholarship across different platforms and ‘silos’, and therefore we strongly encourage researchers to be highly strategic in how they engage with different methods of innovative dissemination. We hope that these simple rules provide guidance for researchers and their future projects, especially as the tools and services available evolve through time. Some of these suggestions or platforms might not work across all project types, and it is important for researchers to find which methods work best for them.
Acknowledgments
Many thanks to everyone who engaged with the workshops we conducted as part of this grant award.
Funding Statement
This work was partly funded by the OpenUP project, which received funding from the European Union’s Horizon 2020 research and innovation programme under grant agreement No. 710722. The funders had no role in study design, data collection and analysis, decision to publish, or preparation of the manuscript.
PULSE Undergraduate Research Webinar: Effectively Communicating Your Findings | Mastering the Art of Research Communication
The session covers practical tips on structuring your presentation, crafting compelling visuals, and delivering your message with clarity and conviction.
The APS Physics Undergraduates Learning and Sharing Experiences (PULSE) series is proud to present "Effectively Communicating Your Findings: Mastering the Art of Research Communication." The session covers practical tips on structuring your presentation, crafting compelling visuals, and delivering your message with clarity and conviction. Whether you're presenting in-person or virtually, our expert guidance will help you navigate the intricacies of academic communication.
Join your Society
If you embrace scientific discovery, truth and integrity, partnership, inclusion, and lifelong curiosity, this is your professional home.

- Campus News /
2024 Research & Scholarship Forum Showcases Pharmacist’s Role in Interprofessional Healthcare Team
May 13, 2024

The MCW School of Pharmacy’s 2024 Research & Scholarship Forum exhibited the work of students, residents, fellows, preceptors, faculty, staff and affiliated partners. The poster showcase featured the findings of 42 projects, which aimed to improve patient care and medication outcomes.
“Providing a research and scholarship forum allows participants to learn about the evolving role of pharmacists, particularly in an interprofessional environment, to discover advancements in the pharmacy profession, engage in peer reflection and identify opportunities for future collaboration,” said Kristin Busse, PharmD, BCPS , assistant professor in the MCW School of Pharmacy and research oversight program director in the Office of Research.

Of the 42 poster presenters, three award winners gave platform presentations. For Best Student Project, lead author Carter White, BS, 2027 MD candidate from the MCW Medical School, presented the project “Release Characteristics of Partial Patch Clonidine Transdermal System for Pediatric Patients.” The other authors include Sophia Schulte, 2025 PharmD candidate, and MCW School of Pharmacy faculty Jesse Cramer, PharmD, and Abhay Chauhan, PhD, MPharm.
“I hope my presentation demonstrated how pharmacy research can directly enhance patient care,” said White. “I was eager to show attendees that some clinical challenges can be met with straightforward, effective solutions.”
For Best Resident Project, lead author Emily VanOtterloo, PharmD, resident pharmacist with Froedtert & the Medical College of Wisconsin, presented the project “Optimal Duration of Home Blood Pressure Monitoring Protocol in Adults with Hypertension.” The other authors include Zachary Hovis, PharmD, BCACP, assistant professor in the MCW School of Pharmacy, Michelle Mack, BBA, of Froedtert & MCW, Ryan Hanson, MS, of Froedtert & MCW and Erin DeJarlais, PT, MBA, DPT, of Inception Health.
“The Digital Care Monitoring Program at Froedtert and the Medical College of Wisconsin demonstrated sustained effectiveness in maintaining blood pressure control three to six months after patients were disenrolled from the program,” said Dr. VanOtterloo. “These findings highlight the potential value of integrating home blood pressure monitoring with digital engagement tools and pharmacist follow-up in hypertension management.”
For Best Abstract Overall, lead author Mark Hawi, BS, research technologist with the MCW School of Pharmacy, presented the project “HPLC Determination of Pharmaceutical Strength of Expired Oral Hypoglycemics Containing Alogliptin, Metformin and Pioglitazone.” The other authors include Anna Little, 2025 PharmD candidate, Carter White, 2027 MD candidate and Ehab Abourashed, PhD, MS, BPharm, professor and assistant dean for academic and curricular affairs with the MCW School of Pharmacy.
Hawi hoped his presentation ignited interest and curiosity about expired medications. “I want to show that the findings of our study have real, practical applications in terms of free clinic physicians using the data collected to aid in their judgment when using expired medications, plus how our study contributes to the advancement of knowledge about expired hypoglycemic formulations,” said Hawi.
The project receiving honorable mention was “A Prescription to Change Enhancing Pharmacy Student Cultural Intelligence” by Ariane Aidedji and Liliana Galvan, both 2025 PharmD candidates, and Lana Minshew, PhD, assistant professor with the MCW School of Pharmacy.
The event also included a Celebration of Teaching and Learning, which recognized the following 2023-2024 instructor and preceptor award winners:
Outstanding Guest Instructor s
- Caitlin Dunn, MHA (Froedtert &MCW)
- Kristin Hanson, MS (Froedtert &MCW)
- Mark Lodes, MD (Froedtert &MCW)
- Taylor Mancuso, PharmD (Froedtert &MCW)
- Chris Viesselmann, PharmD, BCCCP (Froedtert &MCW)
Patient Care Lab
- John Harter, PharmD (Children’s Wisconsin)
- Angela Paul, PharmD, BCPS (ProHealth Care)
- Rodney Ramos (MATC)
- Claire Solofra, PharmD (St. Luke’s)
- Kathryn Wierer, PharmD, BCPPS, BCCPS (Children’s Wisconsin)
Pharmaceutics
- James Cruikshank, PharmD (Froedtert &MCW)
- Brooke Fraser, PharmD (Froedtert &MCW)
Interdisciplinary Colleague of the Year
- Amy Turner, MS – Director of Operations and Innovation, RPRD Diagnostics
- Ashley Derezinski, BS – Clinical Lab Supervisor, RPRD Diagnostics
IPPE Preceptor of the Year
- Michelle Mitchell, PharmD – Pharmacy Manager, Walgreens
APPE Preceptor of the Year
- Steven Finkenbinder, PharmD, AE-C – Internal Medicine Clinical Pharmacy Specialist, Clement J. Zablocki VA Medical Center
Faculty Preceptor of the Year
- Matthew Stanton, PharmD, BCPS, DABAT – Emergency Pharmacist, Froedtert Hospital; Clinical Assistant Professor, MCW School of Pharmacy; Clinical Toxicologist, WI Poison Center
Didactic Instructors of the Year
Biopharmaceutical Sciences Faculty
- Abir El-Alfy, PhD – Assistant Dean for Student Affairs, Professor (Selected by PY1 and PY2 students)
Clinical Sciences Faculty
- Michael DeBisschop, PharmD – Professor (Selected by PY1 students)
- Matthew Stanton, PharmD, BCPS, DABAT – Clinical Assistant Professor (Selected by PY2 students)
- Program Finder
- Admissions Services
- Course Directory
- Academic Calendar
- Hybrid Campus
- Lecture Series
- Convocation
- Strategy and Development
- Implementation and Impact
- Integrity and Oversight
- In the School
- In the Field
- In Baltimore
- Resources for Practitioners
- Articles & News Releases
- In The News
- Statements & Announcements
- At a Glance
- Student Life
- Strategic Priorities
- Inclusion, Diversity, Anti-Racism, and Equity (IDARE)
- What is Public Health?
Mental health in the workplace: a conversation bridging research and practice
How can we promote mental health in the workplace .
This is a question that Zhiqing (Albert) Zhou , PhD, and Lawanda Lewis are constantly asking themselves in their work, just from different perspectives. As an associate professor in the Department of Mental Health, Dr. Zhou researches how employees’ work-related experiences impact their health, well-being, and safety. As an HR Business Partner who oversees multiple academic departments at the Bloomberg School, Ms. Lewis has firsthand experience with assessing the mental health needs of employees and the effectiveness of workplace mental health and wellness programs.
This Mental Health Awareness Month, we brought them together for a wide-ranging conversation about research, practice, program implementation, and what still needs to be learned to help workplaces manage and support the mental health of their employees.
This conversation has been edited and condensed for length and clarity.
Lawanda Lewis: Post-COVID, we’re seeing different work modalities, from fully remote work to hybrid work to a mix. Hybrid work seems to be the way of the world now. What approaches can organizations take to better promote mental wellness in a hybrid workforce?
Albert Zhou: There is consistent evidence of the benefits of hybrid work, such as more flexibility, more autonomy, reducing commuting time, and better work-life balance. Meanwhile, there are reports of remote or hybrid workers feeling lonely or isolated, dealing with the added stress of shared spaces and family responsibilities, and feeling pressure to always appear available and present. We published a study in 2022 in the International Journal of Human Resource Management that found that workers’ mental health was negatively impacted when they felt too closely monitored by their managers.
One way to deal with this is to make sure managers are trained to prepare, support, and better communicate expectations and guidelines for hybrid and remote workers, while giving workers flexibility and more control over their time. Social and emotional support from coworkers and supervisors is also instrumental to building a healthy work life. People should be able to ask questions, connect with their colleagues, and access resources regardless of when and where they’re working. My collaborators and I are trying to understand how hybrid or remote work can be better managed so that workers can enjoy the benefits and reduce the negative consequences for their mental health.
LL: What has recent research revealed about the mental health benefits of transitioning to a four-day work week with no pay reduction?
AZ: We still need to do more research on the four-day work week, and we don’t yet have consistent solutions, even though this topic has been discussed for over 50 years. But there have been pilots and case studies in several countries that have shown evidence of increased productivity. Workers in these studies reported that they are more satisfied with their work, have better work life balance, and experience less stress and burnout. However, one issue that came up is scheduling problems. For example, I’m working for four days, but my clients are not, so how can we align our work? When we studied weekly work cycles , we found that Monday is already the most stressful day. Since working on Friday is off the table, how do I make sure too much work doesn’t pile up on Monday?
It’s important to note that these pilot programs were tested with a small number of organizations who voluntarily participated, which means they were already open to the idea of a four-day work week. It's unclear, then, whether their practices can be generalized to other workplaces. The transition to a four-day work week may be easier for office workers, but it would be harder for people in industries where people’s work schedules are less flexible, like blue collar workers or healthcare workers. Again, more research is needed, especially with HR professionals like you, since a lot of these changes will be implemented through HR functions. You are at the front line of making sure that it works as planned, taking feedback, and continuously shaping the practice.
I’m learning a lot about HR practices, and I was wondering if you could give examples of programs you have implemented to promote workplace mental health.
LL: One of our most important programs is the Johns Hopkins Employee Assistance Program (JHEAP), which provides confidential counseling, resources, and referrals to employees and their families for personal and work-related issues. And we’ve implemented flexible work arrangements. Hybrid or modified hybrid schedules allow employees to meet the needs of their roles and divisions while still managing their personal and work lives.
We also provide programs that can help employees manage their physical, emotional, social, and financial well-being, like meditation and yoga classes; premium memberships to tools that reduce stress and improve focus, like the Calm app; and the Healthy at Hopkins Wellness Initiative hub for resources and benefits.
Our leadership trainings raise awareness of mental health and unconscious bias and help supervisors recognize and manage employee stress. To reduce the stigma of talking about mental health, we regularly coach managers on how to create open dialogue with their employees about issues like stress and workloads. Through these kinds of initiatives, we want to help managers create a psychologically safe work environment.
AZ: Offering a variety of programs is great for addressing individuals’ different needs and creating psychologically safe relationships, while also caring about the overall work environment. Of all these different programs, what has worked well?
LL: Our Employee Assistance Program has evolved over the years. The University has been good at adapting it as work set-ups change and employee needs change, so that flexibility has led to a lot of reinventions over the years. Being flexible with our employees’ work arrangements has also worked really well. Everyone is dealing with day-to-day issues and unpredictable situations, so we want managers to balance knowing what needs to be done with caring for their employees.
JHU’s supervisor trainings have helped managers lead fairly, create open communication, and provide timely feedback so that employees always know where they stand. We also think it’s important to show employees appreciation and recognition for their hard work.
AZ: Definitely. We’ve seen in research that lack of recognition negatively affects productivity, performance, and mental well-being. It’s always good to see appreciation and recognition coming from the top down. Are there other workplace mental health topics that HR professionals like you are interested in right now?
LL: I'm interested in learning more about efforts to reduce stigma and promote open dialogue, especially when it comes to relationships between supervisors and their subordinates. What should organizations look out for when managing that relationship?
AZ: That's a great question because supervisors play an important role in employee mental health. From the research perspective, we develop specific, reliable, and valid measures to assess supervisor behaviors. The commonly used approach is asking workers to answer questions about the frequency of certain supervisor behaviors, such as rudeness or inattention. Those kinds of behaviors are subtle and sometimes low intensity but can affect people’s well-being if experienced regularly.
It's important to note that sometimes employees’ perceptions might not correspond to the actual behavior of the supervisor. The supervisor might not intentionally be rude, but their behaviors can still be perceived as rudeness or incivility. That's why when we study supervisor behaviors, it's important to calibrate across multiple direct reports of the same supervisor. That's an indication of a pattern of behavior and that action needs to be taken in terms of interventions or training. So, I think it’s important for organizations to continuously gather employees’ perceptions and combine data from multiple sources to get a more accurate reflection of supervisor behaviors. To prevent incivility in the workplace, it's important to build an environment where people are aware of their behavior and are mindful of their impact and talk about mental health.
LL: Reducing mental health stigma is a major theme. We want to raise awareness of resources and make sure that people get the support they need. But when we start talking about illnesses, we start to trickle into the lines of protected health information and figuring out how to handle that information. We have an office that supports employees who need accommodations, but we are still learning.
AZ: It’s great that HR is thinking about and prioritizing workplace mental health because that’s not the case everywhere. The research on workplace mental health is also still evolving. I’m doing a review piece with a student about disclosure of mental health conditions and how we can foster more open communication so support can be provided. But there’s still a long way to go. As a researcher, I want to keep providing evidence to help teams like yours who are doing actual implementation and supporting employee health and well-being.
Related Content

Global Mental Health NOW

Activity, Sleep & Dementia

Rev. Pamula Yerby-Hammack Breaking the Stigma of Mental Health

Inside the Movement to Transform Mental Health in Sierra Leone

Autism and Suicidal Thinking: ‘Alarming’ New Insights
How Will AI Impact Finance? New Research Uncovers Key Findings

- Share to Facebook
- Share to Twitter
- Share to Linkedin
By Sarah Dziuk, Sr. Director, SAP Insights
Even though finance departments look different from one organization to the next, they all share a common purpose of how to best manage resources to achieve company goals. However, the critical decisions finance departments make, often create long-term effects.
This raises a few questions: How can finance teams stay one step ahead of the latest industry disruptions that impact their decisions? Is AI a double-edged sword that helps democratize access and improve efficiencies for the financial line of business, or does it sideline human intuition and create potential risks?
In many cases, AI tools are used for more mundane tasks, which frees up people to perform the next-level analysis on those transactions and reports, allowing them to make strategic decisions.
As we stand at this crossroad, it’s essential to examine and understand the true impact of AI on our financial landscapes, and by extension, on our lives. New research commissioned by SAP Insights identifies macro trends affecting finance organizations . One of the primary goals of this research was to gain a deeper understanding of AI’s impact on the transformation of businesses, including how it affects people’s roles and responsibilities, especially in the area of finance.
Common themes span many of these broader trends. For example, data privacy and cybersecurity were top concerns, as were AI model accuracy and transparency, data management, compliance, and employee experience. Even areas where AI currently is less mature – such as strategic thinking – are nevertheless implicated.
“We are at an inflection point right now, where cloud and AI converge, and the technology is mature enough to deliver what our customers need,” said Jan Gilg, President, Chief Product Officer, Cloud ERP at SAP. “As we use AI tools to handle more basic tasks and to provide us with crucial data, people are migrating toward the roles they are still better at than the AI tools. Through our main guidelines to build relevant, responsible and reliable AI features, we are set to support our customers, where it has the biggest impact.”
AI use cases in finance
Tasks that can now be automated by AI systems include financial report generation, intelligent document processing and review, compliance monitoring, anomaly detection, reconciliations, and tax form automation, among others. AI systems can streamline invoice management by extracting and integrating relevant data directly into ERP systems, minimizing manual entry errors.
AI systems improve communications, too, by personalizing content and better supporting multilingual financial communications. LLMs aid in the creation of clear and coherent reports, summaries, and other materials.
“They also make complex financial information easily understandable for a diverse range of stakeholders,” said Gilg. “Representatives across different finance functions, for example, can use AI to provide immediate, accurate responses to inquiries. By combining AI data retrieval with human problem-solving skills, service levels greatly improve.”
Analysis functions benefit from AI systems, too. For example, generative AI can analyze vast amounts of environmental, social, and governance (ESG) data—often times non-financial performance data—to uncover insights that might not be apparent through traditional analysis. AI systems can gauge market sentiment by analyzing vast amounts of data from news, social media, and other sources, and gauge public opinion about finance and adjust communications accordingly.
Risk management systems take on new autonomous functionality, with security dashboards for monitoring financial health, systems that can assess investment risk, credit risk, supplier risk, or even the compliance with ESG regulations and initiatives.
“In the face of financial crises or conflicts, AI systems can assist in managing and resolving issues by providing real-time data analysis and recommended courses of action,” said Gilg.
Other use cases include simulation and prediction, informing strategy and planning, and market and regulatory compliance research.
Technology enablers
Along with exploring the most popular ways AI is being used, SAP Insights research identified the motivators behind its adoption. They include automating processes and content generation, of course, but it’s more complicated than that.
“Personalization is a primary driver,” said Gilg. “We can use AI to synthesize vast amounts of financial data into personalized content, like financial visualizations and data interpretations, that is tailored to each user’s specific needs. And in addition to learning material being customized just for us, the content itself can learn from us and adapt accordingly.”
Privacy, security, and risk management are drivers, too. AI systems can help with compliance and privacy assurance, as well as secure collaborative data handling; AI capabilities ensure that sensitive data is shared and used in a manner that maintains privacy and security.
“Advanced AI tools can identify, evaluate, and even predict organizational risks,” said Gilg. “Real-time, dynamic data allows for immediate analysis and strategic advice, enabling better decision-making processes that adhere to regulatory standards. In the end it is technology that can enable different business outcomes, ones that help you grow and simplify your business”
The path to adoption
As businesses contemplate and invest in AI solutions, it is worth noting some potential challenges. While a lot of excitement and experimentation is happening, a lack of attention to the social and cultural implications may undermine the decision-making processes and lead to suboptimal outcomes. A failure to consider the implications for employees could result in increased risks and redundancies.
Conversely, taking a wait-and-see approach and delaying a strategic approach to adoption carries the risk that shadow AI projects will ultimately cause inefficiencies. A fragmented path risks lack of common standards. There is a need for recalibration in industries and individual’s expectations from AI. The future will likely require a combination of AI’s computational prowess and human judgement, but the present is about how we decode how AI is shaping our world, one algorithm at a time.
To learn more, you can find the full findings of the SAP Insights research here .
- Editorial Standards
- Reprints & Permissions
- Privacy Policy
Home » Research Process – Steps, Examples and Tips
Research Process – Steps, Examples and Tips
Table of Contents

Research Process
Definition:
Research Process is a systematic and structured approach that involves the collection, analysis, and interpretation of data or information to answer a specific research question or solve a particular problem.
Research Process Steps
Research Process Steps are as follows:
Identify the Research Question or Problem
This is the first step in the research process. It involves identifying a problem or question that needs to be addressed. The research question should be specific, relevant, and focused on a particular area of interest.
Conduct a Literature Review
Once the research question has been identified, the next step is to conduct a literature review. This involves reviewing existing research and literature on the topic to identify any gaps in knowledge or areas where further research is needed. A literature review helps to provide a theoretical framework for the research and also ensures that the research is not duplicating previous work.
Formulate a Hypothesis or Research Objectives
Based on the research question and literature review, the researcher can formulate a hypothesis or research objectives. A hypothesis is a statement that can be tested to determine its validity, while research objectives are specific goals that the researcher aims to achieve through the research.
Design a Research Plan and Methodology
This step involves designing a research plan and methodology that will enable the researcher to collect and analyze data to test the hypothesis or achieve the research objectives. The research plan should include details on the sample size, data collection methods, and data analysis techniques that will be used.
Collect and Analyze Data
This step involves collecting and analyzing data according to the research plan and methodology. Data can be collected through various methods, including surveys, interviews, observations, or experiments. The data analysis process involves cleaning and organizing the data, applying statistical and analytical techniques to the data, and interpreting the results.
Interpret the Findings and Draw Conclusions
After analyzing the data, the researcher must interpret the findings and draw conclusions. This involves assessing the validity and reliability of the results and determining whether the hypothesis was supported or not. The researcher must also consider any limitations of the research and discuss the implications of the findings.
Communicate the Results
Finally, the researcher must communicate the results of the research through a research report, presentation, or publication. The research report should provide a detailed account of the research process, including the research question, literature review, research methodology, data analysis, findings, and conclusions. The report should also include recommendations for further research in the area.
Review and Revise
The research process is an iterative one, and it is important to review and revise the research plan and methodology as necessary. Researchers should assess the quality of their data and methods, reflect on their findings, and consider areas for improvement.
Ethical Considerations
Throughout the research process, ethical considerations must be taken into account. This includes ensuring that the research design protects the welfare of research participants, obtaining informed consent, maintaining confidentiality and privacy, and avoiding any potential harm to participants or their communities.
Dissemination and Application
The final step in the research process is to disseminate the findings and apply the research to real-world settings. Researchers can share their findings through academic publications, presentations at conferences, or media coverage. The research can be used to inform policy decisions, develop interventions, or improve practice in the relevant field.
Research Process Example
Following is a Research Process Example:
Research Question : What are the effects of a plant-based diet on athletic performance in high school athletes?
Step 1: Background Research Conduct a literature review to gain a better understanding of the existing research on the topic. Read academic articles and research studies related to plant-based diets, athletic performance, and high school athletes.
Step 2: Develop a Hypothesis Based on the literature review, develop a hypothesis that a plant-based diet positively affects athletic performance in high school athletes.
Step 3: Design the Study Design a study to test the hypothesis. Decide on the study population, sample size, and research methods. For this study, you could use a survey to collect data on dietary habits and athletic performance from a sample of high school athletes who follow a plant-based diet and a sample of high school athletes who do not follow a plant-based diet.
Step 4: Collect Data Distribute the survey to the selected sample and collect data on dietary habits and athletic performance.
Step 5: Analyze Data Use statistical analysis to compare the data from the two samples and determine if there is a significant difference in athletic performance between those who follow a plant-based diet and those who do not.
Step 6 : Interpret Results Interpret the results of the analysis in the context of the research question and hypothesis. Discuss any limitations or potential biases in the study design.
Step 7: Draw Conclusions Based on the results, draw conclusions about whether a plant-based diet has a significant effect on athletic performance in high school athletes. If the hypothesis is supported by the data, discuss potential implications and future research directions.
Step 8: Communicate Findings Communicate the findings of the study in a clear and concise manner. Use appropriate language, visuals, and formats to ensure that the findings are understood and valued.
Applications of Research Process
The research process has numerous applications across a wide range of fields and industries. Some examples of applications of the research process include:
- Scientific research: The research process is widely used in scientific research to investigate phenomena in the natural world and develop new theories or technologies. This includes fields such as biology, chemistry, physics, and environmental science.
- Social sciences : The research process is commonly used in social sciences to study human behavior, social structures, and institutions. This includes fields such as sociology, psychology, anthropology, and economics.
- Education: The research process is used in education to study learning processes, curriculum design, and teaching methodologies. This includes research on student achievement, teacher effectiveness, and educational policy.
- Healthcare: The research process is used in healthcare to investigate medical conditions, develop new treatments, and evaluate healthcare interventions. This includes fields such as medicine, nursing, and public health.
- Business and industry : The research process is used in business and industry to study consumer behavior, market trends, and develop new products or services. This includes market research, product development, and customer satisfaction research.
- Government and policy : The research process is used in government and policy to evaluate the effectiveness of policies and programs, and to inform policy decisions. This includes research on social welfare, crime prevention, and environmental policy.
Purpose of Research Process
The purpose of the research process is to systematically and scientifically investigate a problem or question in order to generate new knowledge or solve a problem. The research process enables researchers to:
- Identify gaps in existing knowledge: By conducting a thorough literature review, researchers can identify gaps in existing knowledge and develop research questions that address these gaps.
- Collect and analyze data : The research process provides a structured approach to collecting and analyzing data. Researchers can use a variety of research methods, including surveys, experiments, and interviews, to collect data that is valid and reliable.
- Test hypotheses : The research process allows researchers to test hypotheses and make evidence-based conclusions. Through the systematic analysis of data, researchers can draw conclusions about the relationships between variables and develop new theories or models.
- Solve problems: The research process can be used to solve practical problems and improve real-world outcomes. For example, researchers can develop interventions to address health or social problems, evaluate the effectiveness of policies or programs, and improve organizational processes.
- Generate new knowledge : The research process is a key way to generate new knowledge and advance understanding in a given field. By conducting rigorous and well-designed research, researchers can make significant contributions to their field and help to shape future research.
Tips for Research Process
Here are some tips for the research process:
- Start with a clear research question : A well-defined research question is the foundation of a successful research project. It should be specific, relevant, and achievable within the given time frame and resources.
- Conduct a thorough literature review: A comprehensive literature review will help you to identify gaps in existing knowledge, build on previous research, and avoid duplication. It will also provide a theoretical framework for your research.
- Choose appropriate research methods: Select research methods that are appropriate for your research question, objectives, and sample size. Ensure that your methods are valid, reliable, and ethical.
- Be organized and systematic: Keep detailed notes throughout the research process, including your research plan, methodology, data collection, and analysis. This will help you to stay organized and ensure that you don’t miss any important details.
- Analyze data rigorously: Use appropriate statistical and analytical techniques to analyze your data. Ensure that your analysis is valid, reliable, and transparent.
- I nterpret results carefully : Interpret your results in the context of your research question and objectives. Consider any limitations or potential biases in your research design, and be cautious in drawing conclusions.
- Communicate effectively: Communicate your research findings clearly and effectively to your target audience. Use appropriate language, visuals, and formats to ensure that your findings are understood and valued.
- Collaborate and seek feedback : Collaborate with other researchers, experts, or stakeholders in your field. Seek feedback on your research design, methods, and findings to ensure that they are relevant, meaningful, and impactful.
About the author

Muhammad Hassan
Researcher, Academic Writer, Web developer
You may also like

Data Collection – Methods Types and Examples

Delimitations in Research – Types, Examples and...

Research Design – Types, Methods and Examples

Institutional Review Board – Application Sample...

Evaluating Research – Process, Examples and...

Research Questions – Types, Examples and Writing...
Impact of U.S. Labor Productivity Losses from Extreme Heat

Stephie Fried
Gregory Casey
Matthew Gibson
FRBSF Economic Letter 2024-14 | May 28, 2024
Extreme heat decreases labor productivity in sectors like construction, where much work occurs outdoors. Because construction is an important component of investment, lost productivity today will slow how much capital is built up for future use and thus can have long-lasting impacts on overall economic outcomes. Combining estimates of lost labor productivity due to extreme heat with a model of economic growth suggests that, by the year 2200, extreme heat will reduce the U.S. capital stock by 5.4% and annual consumption by 1.8%.
Extreme heat makes it more difficult to perform physical labor. In the United States, this is particularly relevant for agriculture, mining, and construction, where a substantial share of production takes place outdoors. Data from the Bureau of Economic Analysis show that, of these three sectors, construction contributes the most to economic output, which suggests that the impact from lost labor activity due to extreme heat will largely be driven by the effects on the construction sector.
The labor productivity losses in construction today could have long-lasting effects on the U.S. economy because construction is important for investment. Investment is the purchase of capital in the form of goods or services. Thus, if extreme heat lowers investment today, then it will slow the accumulation of capital for future use and have long-lasting impacts on economic outcomes.
In this Economic Letter based on Casey, Fried, and Gibson (2024), we combine economic theory with findings from the climate science literature to project the future economic impacts of U.S. labor productivity losses from extreme heat. We find that future increases in days of extreme heat can be expected to reduce the amount of accumulated capital by approximately 5.4% in 2200 and reduce annual consumption by approximately 1.8%.
Extreme heat and worker productivity
When a person works on a physically intensive task, the body must release heat to maintain a safe internal temperature. If it is not possible to release enough heat, the person can suffer from heat stress. Scientists use wet bulb globe temperature (WBGT), which incorporates the ambient air temperature, humidity, wind speed, and solar irradiance, to determine when people are at risk of heat stress. Rising temperatures increase the risk of heat stress for workers in settings without climate control, such as those who work outdoors.
Worker safety organizations, such as the Occupational Safety and Health Administration, as well as the U.S. military provide guidelines for how much effort individuals can safely exert under different climate conditions. Dunne, Stouffer, and Johns (2013) analyze these guidelines and find that they are consistent across organizations. For “heavy work” that is characteristic of construction and agriculture, the guidelines suggest that heat stress becomes a concern at a WBGT of 25 degrees Celsius (°C), equivalent to 77 degrees Fahrenheit (°F), and that it is not safe to do any work outdoors when WBGT is above 33°C (91°F).
Figure 1 projects the future vulnerability to heat stress for an outdoor worker in the United States, measured in days above certain WBGT thresholds. To construct the figure, we use projections of future weather conditions at the county-level from Rasmussen, Meinshausen, and Kopp (2016). The projections are based on a scenario that assumes no large-scale efforts to limit carbon emissions. To aggregate these projections to the national level, we take a weighted average across counties, where the weights are fixed over time and determined by the current level of outdoor employment in each county.
Figure 1 Projected number of days above WBGT thresholds
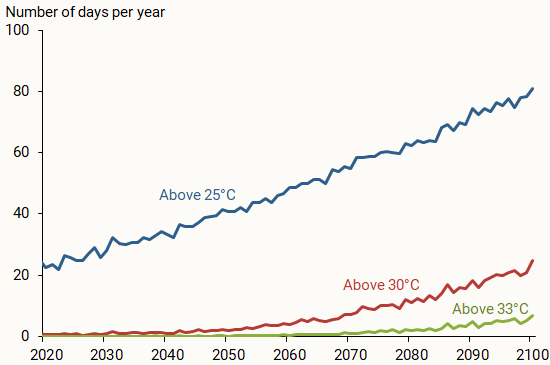
The results suggest that future changes in climate will increase exposure to extreme heat for outdoor workers in the United States. The number of days above 25°C for these workers rises substantially between 2020 and 2100, from 22 days to 80 days per year. The number of days above 33°C increases from near zero to almost seven.
Why construction?
To understand how labor productivity losses from extreme heat could affect the economy, Figure 2 divides U.S. economic output from 1950 to 2019 into five sectors: services, manufacturing, construction, mining, and agriculture.
Figure 2 Composition of U.S. economic output
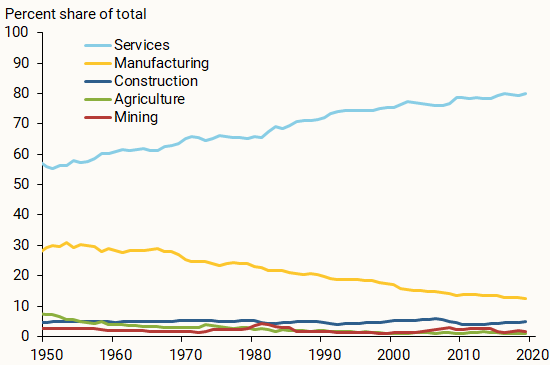
Services (light blue line) and manufacturing (yellow line) play the largest role in the U.S. economy, but they are unlikely to be highly affected by heat. This is because work in these sectors is largely performed indoors and U.S. businesses generally have access to air conditioning (Nath 2022). On the other hand, agriculture, construction, and mining are more likely to entail outdoor work. Among these outdoor sectors, construction makes up the largest share of overall U.S. output. The construction share (dark blue line) has been relatively constant over time, equal to approximately 4%. In contrast, the share of agriculture (green line) has fallen over time and equaled less than 0.2% of output in 2019. The share of the mining sector (red line) has been consistently less than 1%. Projecting these trends into the future, we expect that construction is likely to determine the overall vulnerability of U.S. production to extreme heat.
These results do not imply that the impact of extreme heat on U.S. agriculture and mining is unimportant. Extreme heat’s impact on U.S. agricultural productivity could affect food prices around the world, which could have a disproportionate effect on low-income individuals in the United States and in developing countries. Moreover, these impacts could have negative consequences for U.S. workers in agriculture and their local communities. Relative to the larger share of construction, however, agriculture and mining are not as likely to drive national outcomes.
Consumption versus investment
Economic output can be used for consumption or for investment. Consumption refers to households’ purchases of goods and services, such as food or haircuts, that increase well-being today. Investment refers to purchases of goods and services that are used to produce output in the future, and thus increase well-being in the future. This includes spending by businesses on things like factories and software, as well as the purchase of homes by households. The distinction between consumption and investment matters because a decrease in consumption reduces well-being today but has no impact on future economic outcomes. In contrast, a decrease in investment has no impact on well-being today, but it reduces the accumulation of capital, making it harder to produce both consumption and investment goods and services in the future.
Figure 3 shows the contribution of the five sectors from Figure 2 to consumption and investment. The construction sector is an important component of U.S. investment, accounting for over 20% of investment value-added. Thus, a decrease in construction productivity from extreme heat would reduce investment and thereby have a long-lasting impact on the economy.
Figure 3 Composition of U.S. consumption and investment
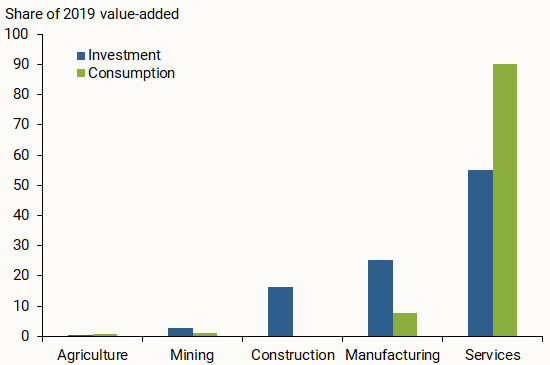
The future consequences of increases in extreme heat
To determine the impact of labor productivity losses from extreme heat, we build and simulate an economic model designed to study the impact of sectoral productivity on macroeconomic outcomes. Dunne et al. (2013) provide estimates of how WBGT affects labor productivity in outdoor work. We combine these estimates with the future paths of WBGT shown in Figure 1 to project future changes in productivity in the outdoor sectors. We then feed these reductions in outdoor productivity into our model.
Figure 4 shows the impact of extreme heat on the capital stock in our model. The capital stock is the value of accumulated investment, an important determinant of an economy’s ability to produce output. We compare the size of the capital stock under the scenario depicted in Figure 1 to the size of the capital stock when there is no change in extreme heat exposure after 2019. We find that future increases in extreme heat would lower the capital stock by about 1.4% in 2100 and by 5.4% in 2200. The lower capital stock reduces the economy’s ability to produce output, which in turn reduces consumption. Thus, we find that extreme heat reduces annual consumption by 0.5% in 2100 and 1.8% in 2200.
Figure 4 Impact of extreme heat on capital accumulation
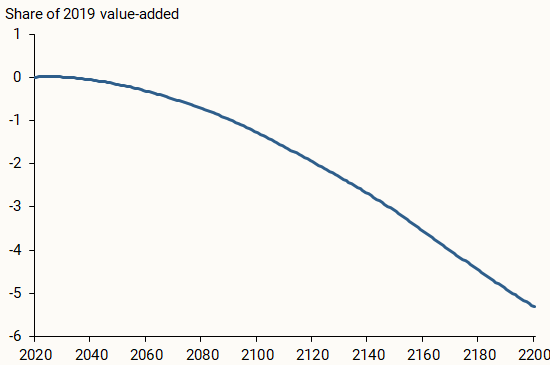
The WBGT paths in Figure 1 and our results in Figure 4 correspond to the most likely climate outcome given a particular path of carbon emissions. However, there is considerable uncertainty over these climate outcomes. As a result, some economists argue that it is important to consider the consequences of other less likely but still possible outcomes (Weitzman 2009). To do so, we simulated the economic effects of an alternative outcome with only a 5% likelihood that retains our given path of carbon emissions but has a larger increase in number of extreme heat days. For example, in that outcome, the number of days with WBGT greater than 25°C increases from 22 in 2020 to 125 in 2100, as opposed to from 22 to 80 as assumed in our main analysis. The outcome would lead to considerably larger consequences from extreme heat, reducing capital accumulation by 18% in 2200 and consumption by 7%.
Some caveats are in order when interpreting the magnitudes from our analysis. We abstract from some ways that companies could adapt to extreme heat, such as relocating production to cooler parts of the United States or shifting work hours to cooler parts of the day. Additionally, while our focus is on the overall consequences of extreme heat on U.S. labor productivity, the effects could vary across income groups and regions of the country. One could also consider the effects of extreme heat in other countries. For example, the impacts are likely to be larger in developing countries, where agriculture is a bigger fraction of output and where work in manufacturing and services is less likely to take place in climate-controlled environments. Finally, the increases in extreme heat days that we study could be paired with decreases in extreme cold days, which could in turn have different implications for labor productivity.
This Letter studies the impact of extreme heat on long-run economic outcomes in the United States. Extreme heat is most likely to affect economic outcomes through the construction sector for two reasons. First, construction makes up a larger share of economic output than other vulnerable sectors, like agriculture. Second, decreases in construction productivity slow capital accumulation and therefore have long-lasting effects on macroeconomic outcomes. Our findings suggest that, under a scenario with no large-scale efforts to reduce carbon emissions, future increases in extreme heat would reduce the capital stock by 5.4% and annual consumption by 1.8% by the year 2200.
Casey, Gregory, Stephie Fried, and Matthew Gibson. 2022. “ Understanding Climate Damages: Consumption versus Investment .” FRB San Francisco Working Paper 2022-21.
Dunne, John P., Ronald J. Stouffer, and Jasmin G. John. 2013. “Reductions in Labour Capacity from Heat Stress under Climate Warming.” Nature Climate Change 3(6), pp. 563–566.
Nath, Ishan B. 2022. “ Climate Change, the Food Problem, and the Challenge of Adaptation through Sectoral Reallocation .” National Bureau of Economic Research Working Paper 27297.
Rasmussen, D.J., Malte Meinshausen, and Robert E. Kopp. 2016. “ Probability-Weighted Ensembles of U.S. County-Level Climate Projections for Climate Risk Analysis .” Journal of Applied Meteorology and Climatolo gy 55(10), pp. 2,301–2,322.
Weitzman, Martin L. 2009. “On Modeling and Interpreting the Economics of Catastrophic Climate Change.” Review of Economics and Statistics 91(1), pp. 1–19.
Opinions expressed in FRBSF Economic Letter do not necessarily reflect the views of the management of the Federal Reserve Bank of San Francisco or of the Board of Governors of the Federal Reserve System. This publication is edited by Anita Todd and Karen Barnes. Permission to reprint portions of articles or whole articles must be obtained in writing. Please send editorial comments and requests for reprint permission to [email protected]
Along with Stanford news and stories, show me:
- Student information
- Faculty/Staff information
We want to provide announcements, events, leadership messages and resources that are relevant to you. Your selection is stored in a browser cookie which you can remove at any time using “Clear all personalization” below.
Image credit: Claire Scully
Gen Z is growing up: In 2024, the generation born between 1996 to 2010 is expected to overtake Baby Boomers in the full-time workforce, according to a recent analysis by Glassdoor .
They are bringing to the office a different set of values, behaviors, and expectations than prior generations, according to research by Roberta Katz , a former senior research scholar at Stanford’s Center for Advanced Study in the Behavioral Sciences (CASBS) . Katz collaborated with a team of researchers to conduct a large, multi-year study to find out what matters to Gen Z and why – findings that culminated in a book and website .
Stanford Report sat down with Katz to talk about this research and what to expect from Gen Z in the workplace.
1. Gen Z expects change
The world Gen Zers came of age in was fundamentally different from that of their parents and even millennials, people who were born in the early 1980s to 1996.
The world of Gen Z has been defined by technological changes happening at rapid speeds that also reshaped social experiences. Disruption and impermanence have always been part of the world Gen Z experienced – for them, it’s a norm, not an exception.
“There is an expectation of constant change,” said Katz.
Growing up amid uncertainty has given Gen Z a unique set of characteristics, including being flexible and resilient. It has opened them up to new ways of thinking about the future and doing things – and questioning the ways things are done, which leads to the next trait Gen Zers will bring with them to work.
2. Gen Z is pragmatic
Gen Z has a strong sense of self-agency.
Gen Z lives in a world that has always been one search engine result away. If they want to know more about something, they readily seek the answer out for themselves ( even if it’s not always the correct one ).
They question everything and everyone – from their peers, parents, or people at work. “They don’t necessarily see elders as experts,” Katz said. “They want to understand why something is done in a certain way. They’re very pragmatic.”
They are also not afraid to challenge why things are done the way they are.
“When an older person says to them, ‘This is how you should do it,’ they want to check that out for themselves. It doesn’t mean they’re always right; it’s a different way of understanding,” Katz explained.
3. Gen Z wants to make a difference
Gen Zers not only expect change – they demand it.
They are inheriting a set of complex problems – from climate change to inequality to racial injustice, to name but a few – and want to fix it. They want to work for a place that they believe is doing good in the world.
Some Gen Zers will hold their employers accountable on the causes and issues that matter to them.
Katz warns that for some employers, it can be challenging – if not untenable – to take a position on politically charged or sensitive topics. “It is impossible for most institutions that represent lots of people and lots of identities to satisfy everybody,” Katz said.
4. Gen Z values collaboration and teamwork
For some Gen Zers, the digital world helped shape their identity: Through social media and in online groups, they found subcultures to connect and interact with.
They grew up with wikis – websites collaboratively built and edited by its users – and fandoms – enthusiastic and energetic communities centered around a shared, common interest. For example, K-pop sensation BTS has its Army , Beyonce has her Beyhive, and Taylor Swift has her Swifties.
“They’re in a posse – even with their headphones on,” Katz said.
To get things done, they value collaboration.
“There is a hope that everybody who is contributing is in it for the good of the whole,” Katz describes. “They want to have a team spirit.”
5. Gen Z wants leaders who guide by consensus
Gen Z is also less hierarchical than previous generations.
“They don’t believe in hierarchy for hierarchy’s sake,” Katz said. “They do believe in hierarchy where it is useful.”
Instead, Gen Zers prefer leadership that is dependent on expertise that is task or time specific. That could mean they favor management where team members take turns leading the group (known as a “rotating leadership” model). Another style they may prefer is “collaborative leadership,” in which people from across the organization participate in decision-making and problem-solving.
Transparency is also important.
Gen Zers value consensus and they look for leaders who are in service of the group (also called “service leadership”).
6. Gen Z cares about mental health and work-life balance
Gen Z grew up in a period that saw the blurring of the 9-to-5 work schedule and the rise of flexible work models – a mode of working that led to older generations feeling a pressure to always be “on.”
“Work and home life are all so integrated that if you don’t pay attention, you could be working all the time,” said Katz. “I think Gen Z is sensitive to that.”
Having a work-life balance and maintaining mental and physical health is also important to Gen Z.
“They’re placing a value on the human experience and recognizing that life is more than work,” Katz said.
7. Gen Z thinks differently about loyalty
Because Gen Z grew up amid so much change, Gen Z has a different perspective on loyalty.
But as Katz pointed out, “they also grew up with workplaces not being very loyal to their employees.”
Gen Zers were raised in the shadows of the global financial crisis of 2008, an event that has had long-lasting impacts on employment and the nature of work. “It used to be that people went to work for big companies thinking they’d be there for their entire career and that the company would watch out for them: providing health insurance, and so on,” Katz said.
But after the 2008 recession, and even more recently following the COVID-19 pandemic, companies have cut back labor costs and implemented other cost-saving measures, like reducing perks and benefits. Meanwhile, mass layoffs have also been rampant.
“There’s a reason that employees don’t feel the same degree of loyalty, too,” Katz said.
Meanwhile, the gig economy has also been present throughout Gen Zers’ lives, as has the rise of contract work. They are entrepreneurial, which is part of their pragmatic tendencies.
8. Gen Z looks for trust and authenticity
Gen Z also values authenticity.
“Authenticity is about trust,” Katz said. “Words and actions need to match.”
Honesty and openness are important.
For Katz, it’s all about mutually respectful communication. “My bottom line always to employers is stay open to hearing about different ways to get things done, because Gen Z has one foot in the future.”
Katz is associate vice president for strategic planning, emerita, and is currently involved in a strategic role with the Stanford Doerr School of Sustainability and the Stanford Institute for Human-Centered Artificial Intelligence . She also serves as vice chair of the board of the Center for Advanced Study in the Behavioral Sciences (CASBS).
Katz studied Gen Z as part of a multi-year CASBS research project with Sarah Ogilvie, a linguist at the University of Oxford and formerly at Stanford; Jane Shaw, a historian who is the principal of Harris Manchester College at Oxford and was previously dean for religious life at Stanford; and Linda Woodhead, a sociologist at King’s College London. The research was funded by the Knight Foundation.
From 2004 to 2017, Katz served under Stanford University Presidents John Hennessy and Marc Tessier-Lavigne as associate vice president for strategic planning, and in 2017 as interim chief of staff.
IMAGES
VIDEO
COMMENTS
Checklist: Research results 0 / 7. I have completed my data collection and analyzed the results. I have included all results that are relevant to my research questions. I have concisely and objectively reported each result, including relevant descriptive statistics and inferential statistics. I have stated whether each hypothesis was supported ...
Research findings are the result of a systematic and rigorous investigation of a research question or hypothesis, using appropriate research methods and techniques. ... This can make it challenging for practitioners and policymakers to apply the findings to their work. Lack of generalizability: While research findings are intended to be ...
Step 1: Consult the guidelines or instructions that the target journal or publisher provides authors and read research papers it has published, especially those with similar topics, methods, or results to your study. The guidelines will generally outline specific requirements for the results or findings section, and the published articles will ...
Reporting Research Results in APA Style | Tips & Examples. Published on December 21, 2020 by Pritha Bhandari.Revised on January 17, 2024. The results section of a quantitative research paper is where you summarize your data and report the findings of any relevant statistical analyses.. The APA manual provides rigorous guidelines for what to report in quantitative research papers in the fields ...
The results section should state the findings of the research arranged in a logical sequence without bias or interpretation. A section describing results should be particularly detailed if your paper includes data generated from your own research. ... [e.g., "Similar to the work of Smith [1990], one of the findings of this study is the strong ...
1. Reporting Quantitative Findings. The best way to present your quantitative findings is to structure them around the research hypothesis or questions you intend to address as part of your dissertation project. Report the relevant findings for each research question or hypothesis, focusing on how you analyzed them.
The results (or findings) section is one of the most important parts of a research paper, in which an author reports the findings of their study in connection to their research question(s). The results section should not attempt to interpret or analyze the findings, only state the facts. In this handout, you will find a description of a results ...
The results chapter in a dissertation or thesis (or any formal academic research piece) is where you objectively and neutrally present the findings of your qualitative analysis (or analyses if you used multiple qualitative analysis methods ). This chapter can sometimes be combined with the discussion chapter (where you interpret the data and ...
However, a research summary and abstract are two very different things with individual purpose. To start with, a research summary is written at the end while the abstract comes at the beginning of a research paper. A research summary captures the essence of the paper at the end of your document. It focuses on your topic, methods, and findings.
Having summed up your key arguments or findings, the conclusion ends by considering the broader implications of your research. This means expressing the key takeaways, practical or theoretical, from your paper—often in the form of a call for action or suggestions for future research. Argumentative paper: Strong closing statement
Thesis. Thesis is a type of research report. A thesis is a long-form research document that presents the findings and conclusions of an original research study conducted by a student as part of a graduate or postgraduate program. It is typically written by a student pursuing a higher degree, such as a Master's or Doctoral degree, although it ...
Don't make the reader do the analytic work for you. Now, on to some specific ways to structure your findings section. 1). Tables. Tables can be used to give an overview of what you're about to present in your findings, including the themes, some supporting evidence, and the meaning/explanation of the theme.
Step 4: Write your findings section in a factual and objective manner. The goal is to communicate information - in some cases a great deal of complex information - as clearly, accurately and precisely as possible, so well-constructed sentences that maintain a simple structure will be far more effective than convoluted phrasing and expressions.
A research article usually has seven major sections: Title, Abstract, Introduction, Method, Results, Discussion, and References. The first thing you should do is to decide why you need to summarize the article. If the purpose of the summary is to take notes to later remind yourself about the article you may want to write a longer summary ...
INTRODUCTION. Scientific research is usually initiated by posing evidenced-based research questions which are then explicitly restated as hypotheses.1,2 The hypotheses provide directions to guide the study, solutions, explanations, and expected results.3,4 Both research questions and hypotheses are essentially formulated based on conventional theories and real-world processes, which allow the ...
Taking time to reflect on your findings and what these might possibly mean requires some serious mind work—so do not try and rush this phase. Spend a few days away from your research, giving careful thought to the findings, trying to put them in perspective, and trying to gain some deeper insights. To begin facilitating the kind of thinking ...
To summarize, remember these key pointers: Implications are the impact of your findings on the field of study. They serve as a reflection of the research you've conducted. They show the specific contributions of your findings and why the audience should care. They can be practical or theoretical. They aren't the same as recommendations.
Some researchers have even decided to make all of their research findings public in real time by keeping open notebooks [5,6]. In particular, digital technologies invoke new ways of reaching and involving audiences beyond their usual primary dissemination targets (i.e., other scholars) to actively involve peers or citizens who would otherwise ...
Supported by the National Institute of Allergy and Infectious Diseases Centers of Excellence for Influenza Research and Response (contract 75N93021C00014) and by grants from the Japan Agency for ...
The APS Physics Undergraduates Learning and Sharing Experiences (PULSE) series is proud to present "Effectively Communicating Your Findings: Mastering the Art of Research Communication." The session covers practical tips on structuring your presentation, crafting compelling visuals, and delivering your message with clarity and conviction.
The MCW School of Pharmacy's 2024 Research & Scholarship Forum exhibited the work of students, residents, fellows, preceptors, faculty, staff and affiliated partners. The poster showcase featured the findings of 42 projects, which aimed to improve patient care and medication outcomes.
Below are seven takeaways from Bloom's discussion: The employees. About 58% of people in the U.S. can't work from home at all, and they are typically frontline workers with lower pay. Those ...
AZ: We still need to do more research on the four-day work week, and we don't yet have consistent solutions, even though this topic has been discussed for over 50 years. But there have been pilots and case studies in several countries that have shown evidence of increased productivity.
Research Summary. Definition: A research summary is a brief and concise overview of a research project or study that highlights its key findings, main points, and conclusions. It typically includes a description of the research problem, the research methods used, the results obtained, and the implications or significance of the findings.
New research commissioned by SAP Insights identifies macro trends affecting finance organizations. One of the primary goals of this research was to gain a deeper understanding of AI's impact on ...
To evaluate these learning archetypes, we had students work on innovation projects in a course and allowed students to use AI tools without restriction. However, the students were required to clearly state how they utilized the AI tools to produce their results.
Step 4: Create a research design. The research design is a practical framework for answering your research questions. It involves making decisions about the type of data you need, the methods you'll use to collect and analyze it, and the location and timescale of your research. There are often many possible paths you can take to answering ...
The final step in the research process is to disseminate the findings and apply the research to real-world settings. Researchers can share their findings through academic publications, presentations at conferences, or media coverage. The research can be used to inform policy decisions, develop interventions, or improve practice in the relevant ...
Extreme heat decreases labor productivity in sectors like construction, where much work occurs outdoors. Because construction is an important component of investment, lost productivity today will slow how much capital is built up for future use and thus can have long-lasting impacts on overall economic outcomes. Combining estimates of lost labor productivity due to extreme heat with a model of ...
They are entrepreneurial, which is part of their pragmatic tendencies. 8. Gen Z looks for trust and authenticity. Gen Z also values authenticity. "Authenticity is about trust," Katz said ...