- Introduction to Algorithms and Flowcharts

Problem Solving
Today, we use computers in every field for various purposes. But, we know that they cannot solve the problems all by themselves. Furthermore, we have to give step by step instructions to the computer for solving the problem. We can define problem-solving as a process of understanding the problem, finding solutions for the problem, and finally implementing the solution to it. We can design the solution before coding in the form of algorithms and flowcharts. Moreover, the identification of arithmetic and logical operations is very important in developing the program.
Therefore, we can say that a successful problem-solving process depends on the following factors:
- understanding the problem and defining it precisely.
- designing proper algorithms and flowcharts of the solution.
- implementing the algorithm successfully.
When the problems are easy we can easily search out a solution. Whereas, complex problems require step by step process to solve. Hence, this means that we have to apply problem-solving techniques to solve the problem. Furthermore, this starts with finding a precise definition of the problem and ends with a successful solution. Moreover, the identification of arithmetic and logical operations plays a vital role while designing the algorithm. Here, we will study the algorithms and flowcharts.
Designing the solution
After understanding the relationship between input and output and the functionalities required we have to design an algorithm or flowchart. Furthermore, the algorithm should contain all the necessary functions to solve the problem. Moreover, it should produce a proper output for every input.
Hence, we can say that before writing the exact code for the problem it is necessary to define a solution. We can do this by starting with an initial plan and improvising it till it gives perfect results. Moreover, there can be more than one possible solution for a problem. Therefore, it is the responsibility of the programmer to choose the best solution.
While designing a problem we can represent it in algorithms and flowcharts. Hence, before writing the program code we can design the solution either in the form of an algorithm or a flowchart.
Browse more Topics Under Problem Solving Methodologies
- Understanding of the Problem
- Solution for the Problem
- Breaking Down Solution into Simple Steps
- Identification of Arithmetic and Logical Operations
- Control Structure
Introduction to Algorithms
An algorithm is basically a procedure of steps that we exactly follow to solve a particular task or problem. We can say that it is a set of rules that we need to follow while developing a program code during problem-solving. Furthermore, if we write an algorithm before actually writing a code, it becomes easy to perform the coding part. Moreover, the algorithm is in simple English language hence, others can also easily understand it and develop the code.
Features of an algorithm
The features of an algorithm are as follows:
The algorithm should be very clear and unambiguous in its meaning. It should be simple so that one can understand it easily.
- Well-defined inputs
A program may require to take input from the user. Therefore, the algorithm should clearly define the inputs.
- Well-defined outputs
The algorithm should clearly specify the output that the program will produce.
The algorithm should have a termination point. This means that the algorithm should not be such that it runs infinite times or end up in loops.
- Feasibility
The algorithm should be such that we can implement it easily. Hence, it should be simple and practical to implement.
- Language independent
It should be in simple English language. Since the code implementation should result in the same output no matter which programming language we use while writing the code.
Introduction to Flowcharts
It is basically a diagrammatic representation of an algorithm. Furthermore, it uses various symbols and arrows to describe the beginning, ending, and flow of the program. Moreover, the programmers use it to depicting the flow of data and instructions while problem-solving. F lowcharting is the process of drawing a flowchart for an algorithm.
Symbols in a flowchart
The flowchart uses various symbols in the representation. These basic symbols are as follows:
It represents the start, stop, or halt in a program’s flow. The flowchart always starts and ends with this symbol. Besides, we represent it using an oval shape.
Input/Output
We represent it using a parallelogram . It indicates any input from the user or output of the program.
We represent it using a rectangle . It indicates any arithmetic operation’s processing such as addition, subtraction, multiplication, division, etc.
We represent it using the diamond symbol. It represents any type of decision in a program that results in true or false. For example. if-conditions.
We represent it using a circle . Whenever a flowchart is too large we can use connectors to avoid confusion.
These are basically arrows that represent the flow of the program.
Frequently Asked Questions (FAQs)
Q1. What are the main steps in problem-solving?
A1. A successful problem-solving process depends on the following factors:
- understanding the problem.
- designing proper algorithms and flowcharts.
- implementing the algorithm.
Q2. What is problem-solving?
A2. We can define problem-solving as a process of understanding the problem, finding solution for the problem, and finally implementing the solution to it.
Q3. What is an algorithm?
A3. An algorithm is basically a procedure of steps that we exactly follow to solve a particular task or problem.
Q4. What is a flowchart?
A4. It is basically a diagrammatic representation of an algorithm. Furthermore, it uses various symbols and arrows to describe the beginning, ending, and flow of the program.
Q5. Name the features of an algorithm.
A5. The features of an algorithm are as follows:
Customize your course in 30 seconds
Which class are you in.

Problem Solving Methodologies
- Control Structures
- Identification of Arithmetic and Logical Operations Required for Solution
- Understanding the Problem
Leave a Reply Cancel reply
Your email address will not be published. Required fields are marked *
Download the App

Computersciencementor | Hardware, Software, Networking and programming
Algorithm and flowchart explained with examples, what is algorithm and flowchart.
Algorithm and flowchart are programming tools. A Programmer uses various programming languages to create programs. But before actually writing a program in a programming language, a programmer first needs to find a procedure for solving the problem which is known as planning the program. The program written without proper pre-planning have higher chances of errors. The tools that are used to plan or design the problem are known as programming tools. Algorithm and flowchart are widely used programming tools.

The word “algorithm” relates to the name of the mathematician Al- khowarizmi , which means a procedure or a technique. Programmer commonly uses an algorithm for planning and solving the problems.
An algorithm is a specific set of meaningful instructions written in a specific order for carrying out or solving a specific problem.
Types of Algorithm:
The algorithm and flowchart are classified into three types of control structures.
- Branching(Selection)
- Loop(Repetition)
According to the condition and requirement, these three control structures can be used.
In the sequence structure, statements are placed one after the other and the execution takes place starting from up to down.
Whereas in branch control, there is a condition and according to a condition, a decision of either TRUE or FALSE is achieved. In the case of TRUE, one of the two branches is explored; but in the case of FALSE condition, the other alternative is taken. Generally, the ‘IF-THEN’ is used to represent branch control.
Write an algorithm to find the smallest number between two numbers
Write an algorithm to check odd or even number.
The Loop or Repetition allows a statements or block of statements to be executed repeatedly based on certain loop condition. ‘While’ and ‘for’ construct are used to represent the loop structure in most programming languages. Loops are of two types: Bounded and Unbounded loop. In bounded loop, the number of iterations is fixed while in unbounded loops the condition has to satisfy to end the loop.
An algorithm to calculate even numbers between 20 and 40
Write an algorithm to input a natural number, n, and calculate the odd numbers equal or less than n.
Characteristics of a good algorithm.
- The Finite number of steps:
After starting an algorithm for any problem, it has to terminate at some point.
- Easy Modification.
There can be numbers of steps in an algorithm depending on the type of problem. It supports easy modification of Steps.
- Easy and simple to understand
A Simple English language is used while writing an algorithm. It is not dependent on any particular programming language. People without the knowledge of programming can read and understand the steps in the algorithm.
An algorithm is just a design of a program. Every program needs to display certain output after processing the input data. So one always expects the result as an output from an algorithm. It can give output at different stages. The result obtained at the end of an algorithm is known as an end result and if the result is obtained at an intermediate stage of process or operation then the result is known as an intermediate result. Also, the output has to be as expected having some relation to the inputs.
The first design of flowchart goes back to 1945 which was designed by John Von Neumann . Unlike an algorithm, Flowchart uses different symbols to design a solution to a problem. It is another commonly used programming tool.
In general, a flowchart is a diagram that uses different symbols to visually present the flow of data. By looking at a flow chart one can understand the operations and sequence of operations performed in a system. This is why flowchart is often considered as a blueprint of a design used for solving a specific problem.
A flowchart is defined as a symbolic or a graphical representation of an algorithm that uses different standard symbols.
Flowchart Symbols:

Guidelines for drawing a flowchart.
- The Title for every flowchart is compulsory.
- There must be START and END point for every flowchart.
- The symbols used in flowchart should have only one entry point on the top. The exit point for symbols (except for decision/diamond symbol) is on the button.
- There should be two exit points for decision symbol; exit points can be on the bottom and one side or on the sides.
- The flow of flowchart is generally from top to bottom. But in some cases, it can also flow to upward direction
- The direction of the flow of control should be indicated by arrowheads.
- The operations for every step should be written inside the symbol.
- The language used in flowchart should be simple so that it can be easily understood.
- The flowlines that show the direction of flow of flowchart must not cross each other.
- While connecting different pages of the same flowchart, Connectors must be used.
Some examples of algorithm and flowchart.
Example1: To calculate the area of a circle
Step1: Start
Step2: Input radius of the circle say r
Step3: Use the formula πr 2 and store result in a variable AREA
Step4: Print AREA
Step5: Stop Flowchart:

Related Posts

Sampurna shrestha
Save my name, email, and website in this browser for the next time I comment.

Popular Tutorials
Popular examples, learn python interactively, related articles.
- self in Python, Demystified
- Increment ++ and Decrement -- Operator as Prefix and Postfix
- Interpreter Vs Compiler : Differences Between Interpreter and Compiler
- Algorithm in Programming
Flowchart In Programming
A flowchart is a diagrammatic representation of an algorithm. A flowchart can be helpful for both writing programs and explaining the program to others.
Symbols Used In Flowchart
Examples of flowcharts in programming.
1. Add two numbers entered by the user.

2. Find the largest among three different numbers entered by the user.

3. Find all the roots of a quadratic equation ax 2 +bx+c=0

4. Find the Fibonacci series till term≤1000.

Note: Though flowcharts can be useful for writing and analyzing a program, drawing a flowchart for complex programs can be more complicated than writing the program itself. Hence, creating flowcharts for complex programs is often ignored.
Sorry about that.
Algorithms, flowcharts, and pseudocode. 
Overview, objectives, and key terms ¶.
In this lesson, we’ll dive right into the basic logic needed to plan one’s program, significantly extending the process identified in Lesson 2 . We’ll examine algorithms for several applications and illustrate solutions using flowcharts and pseudocode . Along the way, we’ll see for the first time the three principal structures in programming logic: sequence , selection , and iteration . Throughout, specialized syntax (Python or otherwise) is avoided (with the exception of the handy slicing syntax introduced in Lesson 3 ), but variables and simple operators are used.
Objectives 
By the end of this lesson, you should be able to
- define what an algorithm is
- decompose problems into a sequence of simple steps
- illustrate those steps graphically using flowcharts
- describe those steps in words using pseudocode
Key Terms 
- counter variable
- index variable
- conditional statement
Algorithms 
An algorithm is procedure by which a problem (computational or otherwise) is solved following a certain set of rules. In many computer science departments, entire courses are dedicated to the study of algorithms important for solving a wide variety of problems. Some of the most important algorithms (including a few that we’ll be studying in part throughout the semester) are
- Gaussian elimination (for solving \(\mathbf{Ax}=\mathbf{b}\) )
- Bubble sort (for sorting an array of values)
- Quicksort (a better way to sort those same values)
- Sieve of Eratosthenes (for finding prime numbers)
- Babylonian method (for finding square roots)
- Linear search (for finding a value in an array)
- Binary search (a better way for finding that value)
- Dijkstra’s algorithm (for finding, e.g., the shortest path between two cities)
- RSA algorithm (for encrypting and decrypting messages)
Many more such algorithms are listed elsewhere .
It turns out, however, that we apply algorithms all the time in every-day life, often without realizing it. Such occasions might be as boring as choosing one’s outfit for the day based on planned activities, the weather, the general status of laundry (and how many times you think you can wear that pair of jeans), etc. Other occasions of somewhat more importance might include choosing a baby’s name (which might mean making a list, whittling it down, and then convincing your wife that Linus is the one not just because that’s the name of the Finnish-born inventor of Linux). The list goes on and on: life presents problems, and we apply logic to solve those problems.
Sequence by Example: Computing Grades 
Let’s consider something with which you are all familiar: a course grading scheme. As a concrete example, suppose the course in question has graded tasks in four categories, each with its own weight:
- homework - 20%
- laboratories - 10%
- quizzes - 10%
- examinations - 60%
Such a scheme is probably familiar, and you’ve probably used your intuition, knowledge of your grades, and knowledge of this sort of weighting scheme to compute a final percentage. Here, we’ll formalize that process using flowcharts and pseudocode.
To simplify matters somewhat (for now), assume that there are a fixed number of tasks in each category, and each task within a category is worth the same amount. For example, the course might have 5 homework assignments, and each of these assignments might be assessed out of ten points. Take those scores to be 10, 7, 9, 10, and 10.
You might immediately see how the computation of a homework percentage can be broken into several independent steps. For instance, we can first compute the homework score. How? Think carefully. If you were using a calculator, what would you enter? On mine, I can enter 10 followed by a + and then 7 and then another + . After every addition + , it prints out the running total. In other words, it’s automatically storing the running total.
We can be more explicit, though. Before we add any of the scores at all, we can set the total score to zero, and thereafter, we can add each of the homework scores to that total in sequence . When that’s done, we need to compute the total possible score, which is the number of tasks multiplied by the point value per task. Finally, we need to compute the percentage earned on these homework assignments, which is equal to the total homework score divided by the total number of points possible (and then multiplied by 100).
This entire process can be described using pseudocode , which is any informal, high-level (few details) language used to describe a program, algorithm, procedure, or anything else with well-defined steps. There is no official syntax for pseudocode, but usually it is much closer to regular English than computer programming languages like Python. Here is one possible pseudocode representation of the procedure just outlined for computing the homework score:
Of course, this might seem long-winded, but it is explicit . As long as the input and output processes are specified (e.g., providing a printout of grades and asking for a final value to be written on that printout), this procedure could be given to most reasonable people and executed without difficulty. For reference, the total homework score (in percent) that one should get from the individual scores above is 92.
Exercise : For each line of the pseudocode above, write the value of total_score , total_possible , and hw_percent . If a variable does not have a value at a particular line, then say it is undefined .
A flowchart of the same procedure is provided below.

Flowchart for Computing Homework Percentage
Now, revisit the bolded word above: sequence . This particular process for computing the homework percentage is a sequence , which is the simplest of the logical structures used in programming. A sequence is nothing more than a set of instructions executed one after another. The number of these instructions and the order in which they are executed is known from the start, just like our example here (and the example seen in Lesson 2 ).
Selection 
The same sort of procedure can be used for all of the grading categories, and hence, let us assume now that we have available the final percentages for homework, laboratories, quizzes, and homeworks. The question now is how to assign a final letter grade based, for example, on the traditional 90/80/70/60 scheme for A/B/C/D. For this grading scheme, anything 90% or higher earns an A, anything less than 90% but greater than or equal to 80% earns a B, and so forth.
Of course, this requires that we first compute the final grade, for which the final percentages and the corresponding category weights are required. In pseudocode, that process can be done via
What we need next is to define the grade, and that’s where selection enters the game. Selection refers to a structure that allows certain statements to be executed preferentially based on some condition . Hence, selection is often implemented using conditional statements . In English, a basic conditional statement takes the form If some condition is satisfied, then do something . More complicated statements can be formed, but all conditional statements can be rewritten using one or more of these simple statements.
A basic conditional statement can be represented graphically as shown below.

Flowchart fragment for a simple conditional statement
Armed with conditional statements for selection, we can tackle the final grade. Given the final percentage, we check whether that value is greater than 90. If so, the grade assigned is an A. If not, we can further check whether that percentage is greater than or equal to 80 and less than 90. If so, a B. If not, we check against 70 and then 60 for a C and D, respectively. If the percentage has not earned a D by the time we’ve checked, our poor student’s grade, of course, is an F.
This procedure, much like those described previously, can be described compactly in pseudocode:
As a flowchart, this same procedure is shown below.

Flowchart for computing the final grade
Iteration 
Suppose that the homework grades analyzed above are subjected to a slight policy change: the lowest score is dropped. Such a policy is pretty common. How do we tackle this problem? It requires that we make a decision when adding a particular homework score to the total. In particularly, we skip adding the lowest score.
Exercise : Think back to the scores (i.e., 10, 7, 9, 10, and 10). Now, pick out the lowest score and, importantly , write down how you came to that conclusion. Seriously—think about what you needed to do to choose the lowest number and get it down in words.
When I first glance at the numbers, I see that there are some 10’s and other numbers, and scanning left to right, I pick out 7 as being the lowest of them. Then, keeping track of 7 (subconsciously, in this case), I scan the list and confirm that 7 is, in fact, the lowest score. I’ll bet you do something similar, but computers don’t have eyes (or a subconscience), and we therefore need to define this a bit more carefully.
The Basic Idea 
To start, let’s assume that the individual homework grades are stored in an array (e.g., a NumPy ndarray ) rather than as separate values. Call this array hw_scores so that we use, e.g., hw_scores[0] and hw_scores[1] instead of hw_1_score and hw_2_score . From this array, we need to pick out which element represents the score to be dropped. Therefore, we need language to describe the process of iterating through the array elements, i.e., iteration . In English, we might say something like “for each score in the array, do something.” More generically, iteration consists of doing that something until some condition is no longer satisfied, as illustrated in the flowchart fragment below:

Flowchart fragment for a simple loop
Notice that this flowchart bears a striking similarity to the one shown above for the conditional statement. The difference, however, is that the flow of the program is redirected to before the condition block. In other words, a repeating loop is produced that is broken only if the condition is no longer because of changes made inside the “do something” block. The pseudocode fragment for this same loop is
Let’s apply this to a simple but illustrative problem before moving on to our homework application. Suppose we want to print every value in an array a of length n . A canonical approach to this sort of problem starts by defining an index or counter variable (often named i ) that is used to access the i th element of the array during the i th time through the loop. After the i th element has been used, the counter is increased by one, and the loop begins again. Once the counter is equal to the number of elements in the array, the loop is terminated. Here’s the complete algorithm in pseudocode
and as a flowchart

Flowchart for printing the elements of an array
Back to Homework 
For our homework example, the condition is “have all the scores been considered?”, while the “something” to be done is checking whether or not a given score is lower than the others. The counter-based approach to iteration developed above can be used to go through each element of the homework score array, thereby ensuring that all the elements are considered. We could compare the i th grade to every other grade (implying an iteration within an iteration), but there is a simpler way. First, we can set the lowest score equal to the first grade (i.e., hw_grades[0] ). Then, we can go through all the other scores and compare each to the lowest score. If a score is lower than the current value of lowest score, that score becomes the lowest score. Along the way, we can also keep track of the index (location) of the lowest score within the array. Here’s the idea in pseudocode:
Here it is also as a flow chart:

Flowchart for finding the lowest grade
Putting It All Together 
By now, we have all the pieces needed to compute the total homework percentage when the lowest score is dropped. Here it is, all together, in pseudocode:
Practice Problems 
Planning out the logic needed to solve problems can be tricky, and most students require lots of practice. Each of the topics discussed above will be the focus of the next several lessons as we dive into their implementation in Python. However, now is the time to start applying the sequence, selection, and iteration constructs, and listed below are several great practice problems to help get you started.
Develop an algorithm for each of the following tasks using both pseudocode and a flowchart . Note, many of these tasks represent great practice problems for Python programs, too. Of course, if you plan out the logic first using the tools employed in this lesson, the implementation of your solution in Python later on should be much easier!
- Prepare a pot of coffee.
- Prepare a cup of coffee for your friend. (Cream or sugar?)
- String a guitar.
- Choose your outfit (making sure to account for the day of the week and the weather).
- Determine the largest number in an array.
- Determine the second largest number in an array.
- Determine whether an integer is even.
- Determine whether an integer is prime .
- Determine whether a given year is a leap year .
- Determine the next leap year after a given year.
- Divide one number by another number using long division
- Determine the sum of an array of numbers.
- Determine the sum of the elements of an array of numbers that are divisible by 3 and 5.
- Given any two integers n and d , determine whether the quotient n/d leads to a finite decimal number (e.g., \(5/4 = 1.25\) ) or an infinite decimal number (e.g., \(1/3 = 0.3333\ldots = 0.\bar{3}\) ).
- Extend the homework grade algorithm to drop the two lowest scores.
- Determine a final grade in ME 400 following the course grading policies (including drops).
Further Reading 
Here is a nice example of flow chart construction for the game of hangman.
Table Of Contents
- Sequence by Example: Computing Grades
- The Basic Idea
- Back to Homework
- Putting It All Together
- Practice Problems
- Further Reading
Related Topics
- Previous: More on NumPy Arrays: Slicing and np.linalg
- Next: Lecture 6 - Conditional Statements and the Structure of Python Code
- Show Source
Quick search
- Demo Videos
- Interactive Product Tours
- Request Demo
Flowchart Tutorial (with Symbols, Guide and Examples)
A flowchart is simply a graphical representation of steps. It shows steps in sequential order and is widely used in presenting the flow of algorithms, workflow or processes. Typically, a flowchart shows the steps as boxes of various kinds, and their order by connecting them with arrows.

What is a Flowchart?
A flowchart is a graphical representations of steps. It was originated from computer science as a tool for representing algorithms and programming logic but had extended to use in all other kinds of processes. Nowadays, flowcharts play an extremely important role in displaying information and assisting reasoning. They help us visualize complex processes, or make explicit the structure of problems and tasks. A flowchart can also be used to define a process or project to be implemented.
Flowchart Symbols
Different flowchart shapes have different conventional meanings. The meanings of some of the more common shapes are as follows:
The terminator symbol represents the starting or ending point of the system.

A box indicates some particular operation.

This represents a printout, such as a document or a report.

A diamond represents a decision or branching point. Lines coming out from the diamond indicates different possible situations, leading to different sub-processes.

It represents information entering or leaving the system. An input might be an order from a customer. Output can be a product to be delivered.

On-Page Reference
This symbol would contain a letter inside. It indicates that the flow continues on a matching symbol containing the same letter somewhere else on the same page.

Off-Page Reference
This symbol would contain a letter inside. It indicates that the flow continues on a matching symbol containing the same letter somewhere else on a different page.

Delay or Bottleneck
Identifies a delay or a bottleneck.

Lines represent the flow of the sequence and direction of a process.
When to Draw Flowchart?
Using a flowchart has a variety of benefits:
- It helps to clarify complex processes.
- It identifies steps that do not add value to the internal or external customer, including delays; needless storage and transportation; unnecessary work, duplication, and added expense; breakdowns in communication.
- It helps team members gain a shared understanding of the process and use this knowledge to collect data, identify problems, focus discussions, and identify resources.
- It serves as a basis for designing new processes.
Flowchart examples
Here are several flowchart examples. See how you can apply a flowchart practically.
Flowchart Example – Medical Service
This is a hospital flowchart example that shows how clinical cases shall be processed. This flowchart uses decision shapes intensively in representing alternative flows.

Flowchart Example – Simple Algorithms
A flowchart can also be used in visualizing algorithms, regardless of its complexity. Here is an example that shows how flowchart can be used in showing a simple summation process.

Flowchart Example – Calculate Profit and Loss
The flowchart example below shows how profit and loss can be calculated.

Creating a Flowchart in Visual Paradigm
Let’s see how to draw a flowchart in Visual Paradigm. We will use a very simple flowchart example here. You may expand the example when finished this tutorial.
- Select Diagram > New from the main menu.

- Enter the name of the flowchart and click OK .

- Enter Add items to Cart as the name of the process.

Turn every software project into a successful one.
We use cookies to offer you a better experience. By visiting our website, you agree to the use of cookies as described in our Cookie Policy .
© 2024 by Visual Paradigm. All rights reserved.
- Privacy statement
- Architecture and Design
- Asian and Pacific Studies
- Business and Economics
- Classical and Ancient Near Eastern Studies
- Computer Sciences
- Cultural Studies
- Engineering
- General Interest
- Geosciences
- Industrial Chemistry
- Islamic and Middle Eastern Studies
- Jewish Studies
- Library and Information Science, Book Studies
- Life Sciences
- Linguistics and Semiotics
- Literary Studies
- Materials Sciences
- Mathematics
- Social Sciences
- Sports and Recreation
- Theology and Religion
- Publish your article
- The role of authors
- Promoting your article
- Abstracting & indexing
- Publishing Ethics
- Why publish with De Gruyter
- How to publish with De Gruyter
- Our book series
- Our subject areas
- Your digital product at De Gruyter
- Contribute to our reference works
- Product information
- Tools & resources
- Product Information
- Promotional Materials
- Orders and Inquiries
- FAQ for Library Suppliers and Book Sellers
- Repository Policy
- Free access policy
- Open Access agreements
- Database portals
- For Authors
- Customer service
- People + Culture
- Journal Management
- How to join us
- Working at De Gruyter
- Mission & Vision
- De Gruyter Foundation
- De Gruyter Ebound
- Our Responsibility
- Partner publishers
Your purchase has been completed. Your documents are now available to view.
Flowchart and Algorithm Basics
The art of programming.
- A. B. Chaudhuri
- X / Twitter
Please login or register with De Gruyter to order this product.
- Language: English
- Publisher: Mercury Learning and Information
- Copyright year: 2020
- Main content: 188
- Keywords: selection ; looping ; arrays ; program logics ; logical manipulations ; file processing
- Published: July 8, 2020
- ISBN: 9781683925354
We use essential cookies to make Venngage work. By clicking “Accept All Cookies”, you agree to the storing of cookies on your device to enhance site navigation, analyze site usage, and assist in our marketing efforts.
Manage Cookies
Cookies and similar technologies collect certain information about how you’re using our website. Some of them are essential, and without them you wouldn’t be able to use Venngage. But others are optional, and you get to choose whether we use them or not.
Strictly Necessary Cookies
These cookies are always on, as they’re essential for making Venngage work, and making it safe. Without these cookies, services you’ve asked for can’t be provided.
Show cookie providers
- Google Login
Functionality Cookies
These cookies help us provide enhanced functionality and personalisation, and remember your settings. They may be set by us or by third party providers.
Performance Cookies
These cookies help us analyze how many people are using Venngage, where they come from and how they're using it. If you opt out of these cookies, we can’t get feedback to make Venngage better for you and all our users.
- Google Analytics
Targeting Cookies
These cookies are set by our advertising partners to track your activity and show you relevant Venngage ads on other sites as you browse the internet.
- Google Tag Manager
- Infographics
- Daily Infographics
- Template Lists
- Graphic Design
- Graphs and Charts
- Data Visualization
- Human Resources
- Beginner Guides
Blog Business
What is a Problem-Solving Flowchart & How to Make One
By Danesh Ramuthi , Aug 10, 2023

Problem-Solving Flowcharts, contrary to what many believe aren’t just aesthetic wonders — they’re almost like magical blueprints for troubleshooting those pesky problems that many of us face.
Flowcharts take business challenges and turn them into a navigable pathway. In this post, I will guide you on key aspects of problem-solving flowcharts such as what it is, the advantages of problem-solving flowcharts, how to create one and more.
Besides, you’ll also discover how to create problem-solving flowcharts with the help of Venngage’s Flowchart Maker.
And for those of you thinking, “I’m no designer, how can I create one?” worry not! I’ve got you covered. Just hop on Venggage’s Flowchart Templates and you’ll be charting your way to problem-solving glory in no time.
Click to jump ahead:
What are problem-solving flowcharts?
When to use problem-solving flowcharts, what are the advantages of flowcharts in problem-solving, what are the 7 steps of problem-solving flowcharts.
- 5 different types of problem-solving flowcharts
Best practices for designing effective problem-solving flowcharts
How to make a flowchart using venngage , problem-solving flowcharts faqs.
- Final Thoughts
Problem-Solving Flowcharts is a graphical representation used to break down problem or process into smaller, manageable parts, identify the root causes and outline a step-by-step solution.
It helps in visually organizing information and showing the relationships between various parts of the problem.
This type of flowcharts consists of different symbols and arrows, each representing different components or steps in the problem-solving process.
By following the flow of the chart, individuals or teams can methodically approach problem, analyze different aspects of it and come to a well-informed solution.

Problem-Solving Flowcharts is a versatile tool that can be used in various scenarios. Here’s when to consider utilizing one:
- Complex Problems: When faced with a multifaceted issue that involves multiple steps or variables, flowcharts can help break down the complexity into digestible parts.
- Team Collaboration: If you’re working with a team and need a common understanding of problem and its potential solutions then a flowchart provides a visual that everyone can refer to.
- Analyzing Processes: In a situation where you need to understand a particular process, whether it’s within a project or a part of regular operations then mapping it out in a flowchart can offer clarity.
- Decision Making: When various paths or decisions might be taken, a flowchart can outline the potential outcomes of each aiding in making an informed choice.
- Training and Onboarding: Flowcharts can be used in training materials to help new employees understand complex processes or procedures which makes the learning curve smoother.
- Identifying Root Causes: If you’re looking to identify the underlying causes of problem then a flowchart can facilitate a systematic approach to reaching the root of the issue.
Related: How to Use Fishbone Diagrams to Solve Complex Problems
Problem-solving flowcharts can offer several benefits to the users who are looking to solve a particular problem. Few advantages of flowcharts in problem solving are:
Visual Clarity
When you’re dealing with multifaceted problems or processes, words alone can make the situation seem even more tangled. Flowcharts distill these complexities into easily understandable visual elements.
By mapping out each phase or component of problem, flowcharts offer a bird’s eye view enabling individuals to grasp the bigger picture and the finer details simultaneously.
Sequential Representation
Flowcharts excel in laying out the sequence of events or actions. By indicating a clear starting point and illustrating each subsequent step, they guide users through a process or solution path methodically.
This linear representation ensures that no step is overlooked and each is executed in the right order.
Collaboration
Problem-solving often requires team effort and flowcharts are instrumental in fostering collaborative environments.
When a team is discussing potential solutions or trying to understand problem’s intricacies, a flowchart serves as a collective reference point.
It aids in synchronizing everyone’s understanding, minimizing miscommunications and promoting constructive discussions.
Read more about: Flowcharts Symbols and Meaning

1. Define the Problem
Before anything else, it’s essential to articulate the problem or task you want to solve clearly and accurately. By understanding exactly what needs to be addressed you can ensure that subsequent steps align with the core issue.
2. Identify the Inputs and Outputs
Determine what inputs (such as data, information or resources) will be required to solve the problem and what the desired outputs or outcomes are. Identifying these factors will guide you in structuring the steps needed to reach the end goal and ensure that all necessary resources are at hand.
3. Identify the Main Steps
Break down the problem-solving process into its main steps or subtasks. This involves pinpointing the essential actions or stages necessary to reach the solution. Create a roadmap that helps in understanding how to approach the problem methodically.
4. Use Decision Symbols
In problem-solving, decisions often lead to different paths or outcomes. Using standard symbols to represent these decision points in the flowcharts allows for a clear understanding of these critical junctures. It helps visually present various scenarios and their consequences.
5. Add Descriptions and Details
A well-designed flowcharts is concise but clear in its labeling. Using arrows and short, descriptive phrases to explain what happens at each step or decision point ensures that the flowcharts communicates the process without unnecessary complexity.
6. Revise and Refine
Creating a flowcharts is not always a one-and-done process. It may require revisions to improve its clarity, accuracy or comprehensiveness. Necessary refinement ensures that the flowcharts precisely reflects the problem-solving process and is free from errors or ambiguities.
7. Use Flowchart Tool
While it’s possible to draw a flowcharts manually, using a flowcharts tool like Venngage’s Flowchart Maker and Venngage’s Flowchart Templates can make the process more efficient and flexible. These tools come with pre-designed templates and intuitive interfaces that make it easy to create, modify and share flowcharts.

5 different types of problem-solving flowcharts
Let’s have a look at 5 most common types of flowcharts that individuals and organizations often use.
1. Process Flowchart s
A process flowcharts is a visual representation of the sequence of steps and decisions involved in executing a particular process or procedure.
It serves as a blueprint that showcases how different stages or functions are interconnected in a systematic flow and it highlights the direction of the process from its beginning to its end.

Process flowcharts are instrumental in training and onboarding, sales process , process optimization, documentation, recruitment and in any scenario where clear communication of a process is crucial.

2. Flowcharts Infographic
A flowcharts infographic is a great way to showcase the process or a series of steps using a combination of graphics, icons, symbols and concise text. It aims to communicate complex information in a clear and easy-to-understand manner, making it a popular tool for conveying information, data and instructions in a visually engaging way.

For example, you can use this flowchart to illustrate a health insurance process that visually explains the steps involved from finding a provider to paying for your healthcare provider.

3. Circular Flowcharts
A circular flowcharts is used to illustrate the flow of information, goods, services or money within a closed system or process. It gets its name from its circular shape, which emphasizes the continuous and cyclical nature of the flow.

Circular flowcharts are widely used in various fields such as economics, business, engineering and process management to help visualize and understand complex systems.
In a circular flowcharts , elements are represented using various shapes and connected with arrows to indicate the direction of flow. The circular arrangement indicates that the process is ongoing and repeats itself over time.

4. Swimlane flowcharts
Swimlane flowcharts , also known as cross-functional flowcharts are a specific type of flowchart that organizes the process flow into lanes or “swimlanes.”
Each lane represents a different participant or functional area involved in the process and the flowchart shows how activities or information move between these participants.

Swimlane flowcharts are particularly useful for illustrating complex processes that involve multiple stakeholders or departments.
In a swimlane flowcharts, the process is divided horizontally into lanes and each lane is labeled with the name of the department, person or role responsible for that part of the process. Vertically, the flowchart displays the sequence of steps or actions taken in the process.

5. Decision Flowchart s
Decision flowcharts, also known as decision trees or flow diagrams are graphical representations that illustrate the process of making decisions or solving problems.
They are widely used in various fields such as computer science, business mapping , engineering and problem-solving scenarios.

Decision flowcharts help break down complex decision-making processes into simple, sequential steps, making it easier to understand and follow.
A decision tree is a specialized flowchart used to visually represent the process of decision-making.
Businesses and other individuals can employ a decision tree analysis as a tool to aid in evaluating different options and the possible consequences associated with each choice.
Decision trees Infographics can be used to create a more nuanced type of flowchart that is more informative and visually appealing by combining a decision flowchart and the flowchart infographic.
Decision flowcharts are valuable tools for visualizing decision-making processes, analyzing complex problems and communicating them effectively to others.

Designing effective problem-solving flowcharts involves careful consideration of various factors to ensure clarity, accuracy and usability. Here are some best practices to create efficient and useful problem-solving flowcharts:
- Understand the problem first & clearly define it
- Keep it simple
- Use standard & recognizable symbols
- Ensure that the flowchart follows a logical and sequential order
- Clearly label each decision point, action and outcome
- Verify the flowchart’s accuracy by testing it
- Clearly state the decision criteria that lead to different branches
- Provide context when the flowchart is part of a larger process or system
- Review and revise the flowchart
Creating problem-solving flowchart on Venngage is incredibly simple. All you have to do is:
- Start by Signing Up and Creating an Account with Venngage
- Choose a flowchart template that best suits your needs from our library.
- Start editing your flowchart by choosing the desired shapes, labels and colors.
- You can also enhance your flowchart by incorporating icons, illustrations or backgrounds all of which are readily available in our library.
- Once done, you will have 2 options to choose from, either sharing it online for free or downloading your flowchart to your desktop by subscribing to the Premium or Business Plan.
Is flowchart the representation of problem solutions?
Flowcharts are not the representation of problem solutions per se; rather, they are a visual representation of processes, decision-making steps and actions taken to arrive at a solution to problem.
What are the 3 basic structures of flowcharts?
3 Basic Structures of Flowcharts are:
- Sequence: Simplify Complexity
- Selection (Decision): Embrace Choices
- Repetition (Loop): Emphasize Iteration
What are the elements of a good flowchart?
A good flowchart should exhibit clarity and simplicity, using consistent symbols and labels to depict a logical sequence of steps. It should be readable, with appropriate white space to avoid clutter while eliminating ambiguity through well-defined decision criteria and paths.
Can flowcharts be used for both simple and complex problem-solving?
Yes, flowcharts can be used for both simple and complex problem-solving scenarios. Flowcharts are versatile visual tools that can effectively represent various processes, decision-making steps and problem-solving approaches regardless of their complexity.
In both cases, flowcharts offer a systematic and visual means of organizing information, identifying potential problems and facilitating collaboration among team members.
Can problem-solving flowcharts be used in any industry or domain?
Problem-solving flowcharts can be used in virtually any industry or domain. The versatility and effectiveness of flowcharts make them applicable to a wide range of fields such as Business and Management, Software Development and IT, Healthcare, Education, Finance, Marketing & Sales and a lot more other industries.
Final thoughts
Problem-solving flowcharts are a valuable and versatile tool that empowers individuals and teams to tackle complex problems with clarity and efficiency.
By visually representing the step-by-step process of identifying, analyzing and resolving issues, flowcharts serve as navigational guides simplifying intricate challenges into digestible parts.
With the aid of modern tools like Venngage’s Flowchart Maker and Venngage’s Flowchart Templates , designing impactful flowcharts becomes accessible to all while revolutionizing the way problems are approached and solved.

- school Campus Bookshelves
- menu_book Bookshelves
- perm_media Learning Objects
- login Login
- how_to_reg Request Instructor Account
- hub Instructor Commons
- Download Page (PDF)
- Download Full Book (PDF)
- Periodic Table
- Physics Constants
- Scientific Calculator
- Reference & Cite
- Tools expand_more
- Readability
selected template will load here
This action is not available.
1.1: Activity 1 - Introduction to Algorithms and Problem Solving
- Last updated
- Save as PDF
- Page ID 48194
Introduction
In this learning activity section, the learner will be introduced to algorithms and how to write algorithms to solve tasks faced by learners or everyday problems. Examples of the algorithm are also provided with a specific application to everyday problems that the learner is familiar with. The learners will particularly learn what is an algorithm, the process of developing a solution for a given task, and finally examples of application of the algorithms are given.
An algorithm is a finite sequence of steps for accomplishing some computational task. It must
- Have steps that are simple and definite enough to be done by a computer, and
- Terminate after finitely many steps.
An algorithm can be considered as a computational procedure that consists of a set of instructions, that takes some value or set of values, as input, and produces some value or set of values, as output, as illustrated in Figure 1.3.1 . It can also be described as a procedure that accepts data, manipulate them following the prescribed steps, so as to eventually fill the required unknown with the desired value(s). The concept of an algorithm is best illustrated by the example of a recipe, although many algorithms are much more complex; algorithms often have steps that repeat (iterate) or require decisions (such as logic or comparison) until the task is completed. Correctly performing an algorithm will not solve a problem if the algorithm is flawed or not appropriate to the problem. A recipe is a set of instructions that show how to prepare or make something, especially a culinary dish.
Different algorithms may complete the same task with a different set of instructions in more or less time, space, or effort than others. Algorithms are essential to the way computers process information, because a computer program is essentially an algorithm that tells the computer what specific steps to perform (in what specific order) in order to carry out a specified task.
Algorithmic problem solving comes in two phases. These include:
- derivation of an algorithm that solves the problem, and
- conversion of the algorithm into code.
It is worth noting that:
- an algorithm is a sequence of steps, not a program.
- same algorithm can be used in different programs, or the same algorithm can be expressed in different languages, because an algorithm is an entity that is abstracted from implementation details.
An algorithm can be expressed in the following ways:
- human language
- pseudo code
Example \(\PageIndex{1}\)
Problem: Given a list of positive numbers, return the largest number on the list.
Inputs: A list L of positive numbers. This list must contain at least one number.
Outputs: A number n, which will be the largest number of the list.
- Set max to 0.
- For each number x in the list L, compare it to max. If x is larger, set max to x.
- max is now set to the largest number in the list.
The learner was introduced to the concept of algorithms and the various ways he/she can develop a solution to a task. In particular, the learner was introduced to the definition/s of an algorithm, the three main ways of developing or expressing an algorithm which are the human language, Pseudo code and the flow chart. An example was also given to reinforce the concept of the algorithm.
- Outline the algorithmic steps that can be used to add two given numbers.
- By using an example, describe how the concept of algorithms can be well presented to a group of students being introduced to it.
Problem-Solving Flowchart: A Visual Method to Find Perfect Solutions
Lucid Content
Reading time: about 7 min
“People ask me questions Lost in confusion Well, I tell them there's no problem Only solutions” —John Lennon, “Watching the Wheels”
Despite John Lennon’s lyrics, nobody is free from problems, and that’s especially true in business. Chances are that you encounter some kind of problem at work nearly every day, and maybe you’ve had to “put out a fire” before lunchtime once or twice in your career.
But perhaps what Lennon’s saying is that, no matter what comes our way, we can find solutions. How do you approach problems? Do you have a process in place to ensure that you and your co-workers come to the right solution?
In this article, we will give you some tips on how to find solutions visually through a problem-solving flowchart and other methods.
What is visual problem-solving?
If you are a literal thinker, you may think that visual problem-solving is something that your ophthalmologist does when your vision is blurry. For the rest of us, visual problem-solving involves executing the following steps in a visual way:
- Define the problem.
- Brainstorm solutions.
- Pick a solution.
- Implement solutions.
- Review the results.
How to make your problem-solving process more visual
Words pack a lot of power and are very important to how we communicate on a daily basis. Using words alone, you can brainstorm, organize data, identify problems, and come up with possible solutions. The way you write your ideas may make sense to you, but it may not be as easy for other team members to follow.
When you use flowcharts, diagrams, mind maps, and other visuals, the information is easier to digest. Your eyes dart around the page quickly gathering information, more fully engaging your brain to find patterns and make sense of the data.
Identify the problem with mind maps
So you know there is a problem that needs to be solved. Do you know what that problem is? Is there only one problem? Is the problem sum total of a bunch of smaller problems?
You need to ask these kinds of questions to be sure that you are working on the root of the issue. You don’t want to spend too much time and energy solving the wrong problem.
To help you identify the problem, use a mind map. Mind maps can help you visually brainstorm and collect ideas without a strict organization or structure. A mind map more closely aligns with the way a lot of our brains work—participants can bounce from one thought to the next defining the relationships as they go.

Mind mapping to solve a problem includes, but is not limited to, these relatively easy steps:
- In the center of the page, add your main idea or concept (in this case, the problem).
- Branch out from the center with possible root causes of the issue. Connect each cause to the central idea.
- Branch out from each of the subtopics with examples or additional details about the possible cause. As you add more information, make sure you are keeping the most important ideas closer to the main idea in the center.
- Use different colors, diagrams, and shapes to organize the different levels of thought.
Alternatively, you could use mind maps to brainstorm solutions once you discover the root cause. Search through Lucidchart’s mind maps template library or add the mind map shape library to quickly start your own mind map.
Create a problem-solving flowchart
A mind map is generally a good tool for non-linear thinkers. However, if you are a linear thinker—a person who thinks in terms of step-by-step progression making a flowchart may work better for your problem-solving strategy. A flowchart is a graphical representation of a workflow or process with various shapes connected by arrows representing each step.
Whether you are trying to solve a simple or complex problem, the steps you take to solve that problem with a flowchart are easy and straightforward. Using boxes and other shapes to represent steps, you connect the shapes with arrows that will take you down different paths until you find the logical solution at the end.

Flowcharts or decision trees are best used to solve problems or answer questions that are likely to come up multiple times. For example, Yoder Lumber , a family-owned hardwood manufacturer, built decision trees in Lucidchart to demonstrate what employees should do in the case of an injury.
To start your problem-solving flowchart, follow these steps:
- Draw a starting shape to state your problem.
- Draw a decision shape where you can ask questions that will give you yes-or-no answers.
- Based on the yes-or-no answers, draw arrows connecting the possible paths you can take to work through the steps and individual processes.
- Continue following paths and asking questions until you reach a logical solution to the stated problem.
- Try the solution. If it works, you’re done. If it doesn’t work, review the flowchart to analyze what may have gone wrong and rework the flowchart until you find the solution that works.
If your problem involves a process or workflow , you can also use flowcharts to visualize the current state of your process to find the bottleneck or problem that’s costing your company time and money.

Lucidchart has a large library of flowchart templates to help you analyze, design, and document problem-solving processes or any other type of procedure you can think of.
Draw a cause-and-effect diagram
A cause-and-effect diagram is used to analyze the relationship between an event or problem and the reason it happened. There is not always just one underlying cause of a problem, so this visual method can help you think through different potential causes and pinpoint the actual cause of a stated problem.
Cause-and-effect diagrams, created by Kaoru Ishikawa, are also known as Ishikawa diagrams, fishbone diagrams , or herringbone diagrams (because they resemble a fishbone when completed). By organizing causes and effects into smaller categories, these diagrams can be used to examine why things went wrong or might go wrong.

To perform a cause-and-effect analysis, follow these steps.
1. Start with a problem statement.
The problem statement is usually placed in a box or another shape at the far right of your page. Draw a horizontal line, called a “spine” or “backbone,” along the center of the page pointing to your problem statement.
2. Add the categories that represent possible causes.
For example, the category “Materials” may contain causes such as “poor quality,” “too expensive,” and “low inventory.” Draw angled lines (or “bones”) that branch out from the spine to these categories.
3. Add causes to each category.
Draw as many branches as you need to brainstorm the causes that belong in each category.
Like all visuals and diagrams, a cause-and-effect diagram can be as simple or as complex as you need it to be to help you analyze operations and other factors to identify causes related to undesired effects.
Collaborate with Lucidchart
You may have superior problem-solving skills, but that does not mean that you have to solve problems alone. The visual strategies above can help you engage the rest of your team. The more involved the team is in the creation of your visual problem-solving narrative, the more willing they will be to take ownership of the process and the more invested they will be in its outcome.
In Lucidchart, you can simply share the documents with the team members you want to be involved in the problem-solving process. It doesn’t matter where these people are located because Lucidchart documents can be accessed at any time from anywhere in the world.
Whatever method you decide to use to solve problems, work with Lucidchart to create the documents you need. Sign up for a free account today and start diagramming in minutes.
Lucidchart, a cloud-based intelligent diagramming application, is a core component of Lucid Software's Visual Collaboration Suite. This intuitive, cloud-based solution empowers teams to collaborate in real-time to build flowcharts, mockups, UML diagrams, customer journey maps, and more. Lucidchart propels teams forward to build the future faster. Lucid is proud to serve top businesses around the world, including customers such as Google, GE, and NBC Universal, and 99% of the Fortune 500. Lucid partners with industry leaders, including Google, Atlassian, and Microsoft. Since its founding, Lucid has received numerous awards for its products, business, and workplace culture. For more information, visit lucidchart.com.
Related articles

Sometimes you're faced with challenges that traditional problem solving can't fix. Creative problem solving encourages you to find new, creative ways of thinking that can help you overcome the issue at hand more quickly.

Dialogue mapping is a facilitation technique used to visualize critical thinking as a group. Learn how you and your team can start dialogue mapping today to solve problems and bridge gaps in knowledge and understanding (plus get a free template!).
Bring your bright ideas to life.
or continue with
Programming Techniques Through C: A Beginner's Companion by
Get full access to Programming Techniques Through C: A Beginner's Companion and 60K+ other titles, with a free 10-day trial of O'Reilly.
There are also live events, courses curated by job role, and more.
Algorithms and Flowcharts
1.1 algorithms.
In order to solve a problem using a computer, we must first express the procedure used to solve the problem in terms of computer instructions. A computer program is just a collection of these instructions, that are necessary to solve a specific problem. The approach or method that is used to solve the problem is known as an algorithm . For example, if we wish to develop a program that tests whether a number is +ve or -ve, then the set of statements which solves the problem becomes the program. The method that is used to test if the number is +ve or -ve is the algorithm. Normally, to develop a program to solve a particular problem, we first express the solution to the problem in terms of an algorithm ...
Get Programming Techniques Through C: A Beginner's Companion now with the O’Reilly learning platform.
O’Reilly members experience books, live events, courses curated by job role, and more from O’Reilly and nearly 200 top publishers.
Don’t leave empty-handed
Get Mark Richards’s Software Architecture Patterns ebook to better understand how to design components—and how they should interact.
It’s yours, free.

Check it out now on O’Reilly
Dive in for free with a 10-day trial of the O’Reilly learning platform—then explore all the other resources our members count on to build skills and solve problems every day.

Please log in to save materials. Log in
- Problem Solving / Decision Making
Problem Solving Diagrams - Flowcharts
A flow chart can be a useful tool in problem solving. You can see at a glance how your decisions and actions affect the outcome of your problem solving process. This lesson will help you learn the symbols and steps for writing a flowchart.
Video - Introduction to Creating Flowcharts
Video - lucidchart introduction, "what is my grade" flowchart.
Computer programmers use flowcharts and other types of diagrams to help visualize the steps and flow of the program. This can help to see any errors in the logic before they begin to program. Flowcharts can be used no matter what computer language the program will be written in.
If you wanted to write a computer program that inputs a quiz score and then outputs the letter grade that corresponds to that quiz score, you may want to think about the steps that you would use to create this program.
Task Instructions:
1. View the tutorial above for information on how to use Lucidchart to create a flowchart.
2. This is the algorithm that your flowchart should follow:
Input test score
Decision: Is score greater than 89?
Decision: Is score between 80 and 89?
Decision: Is score between 70 and 79?
Decision: Is score between 60 and 69?
Decision: Is score less than 60?
2. You will use the following symbols for this flowchart: Start/End symbols (this symbol is called Terminator in Lucidchart), Decision symbols, Input/Output (Data) symbols
3. Click here for the What is my Grade Flowchart Template . Click on File , then Make Copy
4. Create your flowchart according to the instructions on the template.
"Time For Lunch" Flowchart
Summarize the lesson by discussing with the students the reasons a computer programmer might use a flowchart.
You want to order lunch at a fast food restaurant. You know you want a hamburger, but aren't sure if you'd like fries and a drink. To practice creating a flowchart, think about the steps that you take to solve this problem. Instructions:
Click HERE to go to Lucidchart.com .
Click HERE to open the TIME FOR LUNCH Flowchart
Click on File and choose to Make a Copy
- Follow the instructions on the TIME FOR LUNCH Flowchart to fill in the correct text in the flowchart symbols. Click HERE to view a tutorial on how to properly fill out this chart .
Version History
- Machine Learning Decision Tree – Solved Problem (ID3 algorithm)
- Poisson Distribution | Probability and Stochastic Process
- Conditional Probability | Joint Probability
- Solved assignment problems in communicaion |online Request
- while Loop in C++
EngineersTutor
Solved assignment problems – algorithms and flowcharts.
An algorithm is defined as sequence of steps to solve a problem (task) . The steps must be finite, well defined and unambiguous. Writing algorithm requires some thinking. Algorithm can also be defined as a plan to solve a problem and represents its logic. Note that an algorithm is of no use if it does not help us arrive at the desired solution
Algorithm characteristics
- It should have finite number of steps . No one can be expected to execute infinite number of steps.
- The steps must be in order and simple
- Each step should be defined clearly i.e. without un-ambiguity (without doubtfulness)
- Must include all required information
- Should exhibit at least one output
A flowchart is a pictorial (graphical) representation of an algorithm . A flowchart is drawn using different kinds of symbols. A symbol is used for a specific purpose. Each symbol has name.
Different algorithms have different performance characteristics to solve the same problem. some algorithms are fast. some are slow. some occupy more memory space. some occupy less memory space. some are complex and some algorithms are simple..
Logically algorithm, flowchart and program are the same.
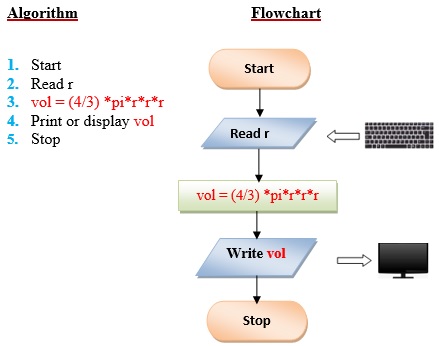
Q1 . Create a program to compute the volume of a sphere. Use the formula: V = (4/3) *pi*r 3 where pi is equal to 3.1416 approximately. The r is the radius of sphere. Display the result.
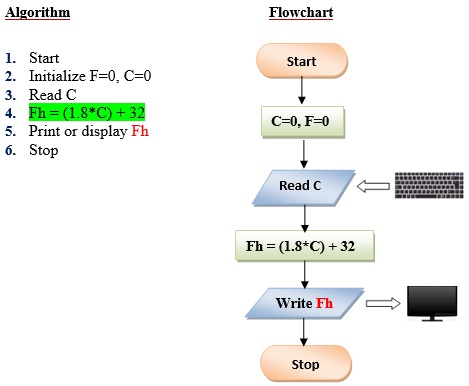
Q2 . Write a program the converts the input Celsius degree into its equivalent Fahrenheit degree. Use the formula: F = (9/5) *C+32.
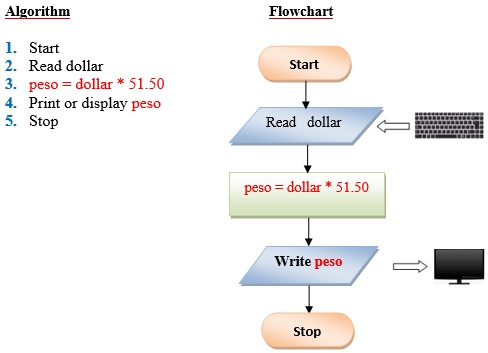
Q3 . Write a program that converts the input dollar to its peso exchange rate equivalent. Assume that the present exchange rate is 51.50 pesos against the dollar. Then display the peso equivalent exchange rate.
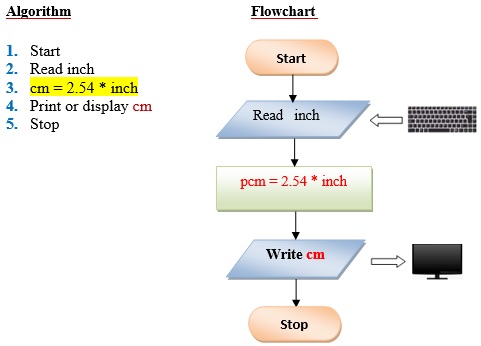
Q4 . Write a program that converts an input inch(es) into its equivalent centimeters. Take note that one inch is equivalent to 2.54cms.
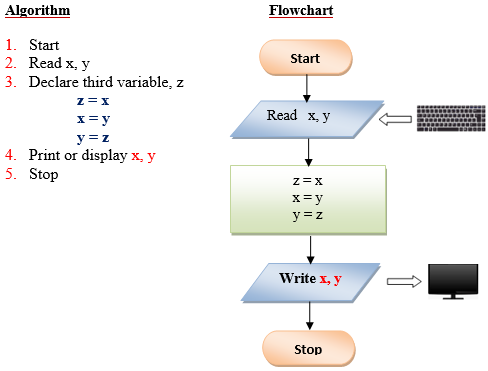
Q5 . Write a program that exchanges the value of two variables: x and y. The output must be: the value of variable y will become the value of variable x, and vice versa.
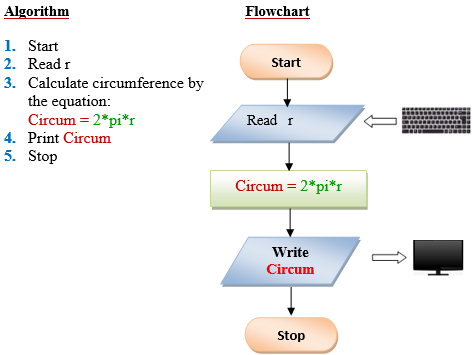
Q6 . Design a program to find the circumference of a circle. Use the formula: C=2πr, where π is approximately equivalent 3.1416.
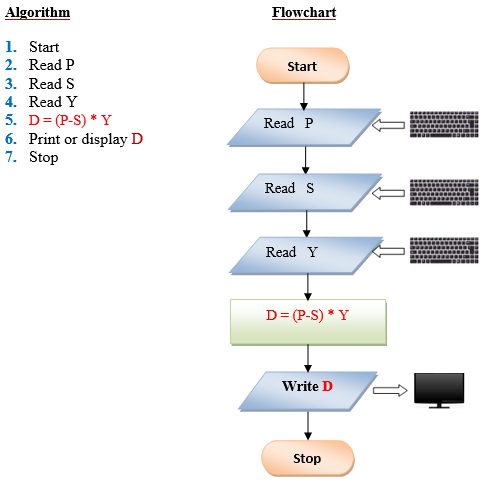
Q7 . Write a program that takes as input the purchase price of an item (P), its expected number of years of service (Y) and its expected salvage value (S). Then outputs the yearly depreciation for the item (D). Use the formula: D = (P – S) Y.
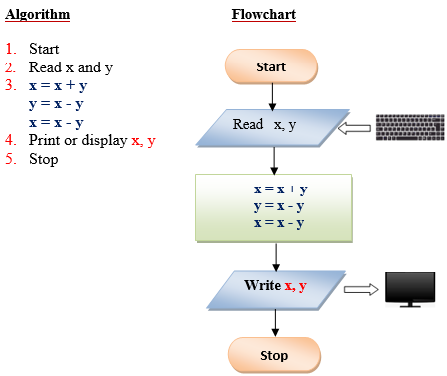
Q8 . Swapping of 2 variables without using temporary (or 3 rd variable).
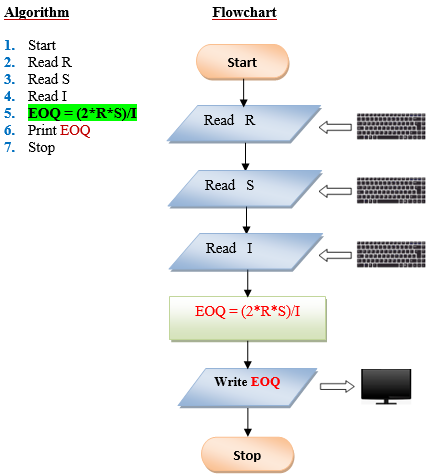
Q9 . Determine the most economical quantity to be stocked for each product that a manufacturing company has in its inventory: This quantity, called economic order quantity (EOQ) is calculated as follows: EOQ=2rs/1 where: R= total yearly production requirement S=set up cost per order I=inventory carrying cost per unit.
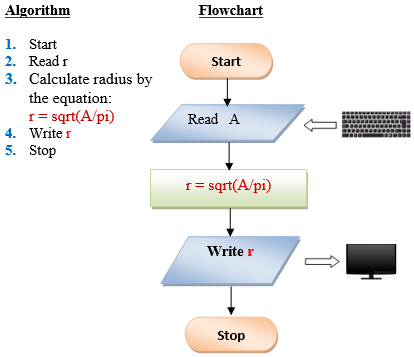
Q10 . Write a program to compute the radius of a circle. Derive your formula from the given equation: A=πr², then display the output.
- ← Solved Assignment Problems in Java (with Algorithm and Flowchart)
- Simple if statement in C →
Gopal Krishna
Hey Engineers, welcome to the award-winning blog,Engineers Tutor. I'm Gopal Krishna. a professional engineer & blogger from Andhra Pradesh, India. Notes and Video Materials for Engineering in Electronics, Communications and Computer Science subjects are added. "A blog to support Electronics, Electrical communication and computer students".

You May Also Like
Flowchart and algorithm, algorithm and flowchart concept, problem solving and algorithms, leave a reply cancel reply.
Your email address will not be published. Required fields are marked *
- Data Structures
- Linked List
- Binary Tree
- Binary Search Tree
- Segment Tree
- Disjoint Set Union
- Fenwick Tree
- Red-Black Tree
- Advanced Data Structures
Difference Between Algorithm and Flowchart
- Difference between Software and Algorithm
- Difference between Searching and Sorting Algorithms
- Difference between Program and Flowchart
- Difference between Data Structures and Algorithms
- Difference between Algorithm, Pseudocode and Program
- Difference between Flow and TypeScript
- Difference Between Flood-fill and Boundary-fill Algorithm
- Difference between SCAN and LOOK Disk scheduling algorithms
- Difference between LOOK and C-LOOK Disk scheduling algorithms
- Difference between FCFS and C-SCAN disk scheduling algorithm
- Difference between C-LOOK and C-SCAN Disk Scheduling Algorithm
- Difference between SCAN and CSCAN Disk scheduling algorithms
- Difference between Adaptive and Non-Adaptive Routing algorithms
- What are the differences between Bellman Ford's and Dijkstra's algorithms?
- Difference between Flowchart and Data Flow Diagram (DFD)
- Difference Between Graph and Tree
- Difference Between A* and AO* Alogithm
- Difference between Stock and Flow
- Difference between Best-First Search and A* Search?
- Must Do Coding Questions for Companies like Amazon, Microsoft, Adobe, ...
- Breadth First Search or BFS for a Graph
- Top 50 Array Coding Problems for Interviews
- Insertion in a Doubly Linked List
- Must Do Coding Questions for Product Based Companies
- What is Array?
- What is Priority Queue | Introduction to Priority Queue
- Top 10 Algorithms in Interview Questions
- Implementing a Linked List in Java using Class
- Data Structure Types, Classifications and Applications
What is an Algorithm ?
The word Algorithm means “a process or set of rules to be followed in calculations or other problem-solving operations”. Therefore Algorithm refers to a set of rules/instructions that step-by-step define how a work is to be executed in order to get the expected results. Let’s take a look at an example for a better understanding. As a programmer, we are all aware of the Linear Search program. ( Linear Search )

Algorithm of linear search:
Start from the leftmost element of arr[] and one by one compare x with each element of arr[]. If x matches with an element, return the index. If x doesn’t match with any of elements, return -1.
What is a Flowchart ?

Difference between algorithm and flow chart:
Please login to comment....
- Difference Between

Improve your Coding Skills with Practice
What kind of Experience do you want to share?
THE PATH TO SUCCESS IN EXAM...
Introduction to Problem Solving – Notes
Introduction to problem solving.
- Steps for problem solving ( analysing the problem, developing an algorithm, coding, testing and debugging).
- flow chart and
- pseudo code,
Decomposition
Introduction
Computers is machine that not only use to develop the software. It is also used for solving various day-to-day problems.
Computers cannot solve a problem by themselves. It solve the problem on basic of the step-by-step instructions given by us.
Thus, the success of a computer in solving a problem depends on how correctly and precisely we –
- Identifying (define) the problem
- Designing & developing an algorithm and
- Implementing the algorithm (solution) do develop a program using any programming language.
Thus problem solving is an essential skill that a computer science student should know.
Steps for Problem Solving-
1. Analysing the problem
Analysing the problems means understand a problem clearly before we begin to find the solution for it. Analysing a problem helps to figure out what are the inputs that our program should accept and the outputs that it should produce.
2. Developing an Algorithm
It is essential to device a solution before writing a program code for a given problem. The solution is represented in natural language and is called an algorithm.
Algorithm: A set of exact steps which when followed, solve the problem or accomplish the required task.
Coding is the process of converting the algorithm into the program which can be understood by the computer to generate the desired solution.
You can use any high level programming languages for writing a program.
4. Testing and Debugging
The program created should be tested on various parameters.
- The program should meet the requirements of the user.
- It must respond within the expected time.
- It should generate correct output for all possible inputs.
- In the presence of syntactical errors, no output will be obtained.
- In case the output generated is incorrect, then the program should be checked for logical errors, if any.
Software Testing methods are
- unit or component testing,
- integration testing,
- system testing, and
- acceptance testing
Debugging – The errors or defects found in the testing phases are debugged or rectified and the program is again tested. This continues till all the errors are removed from the program.
Algorithm is a set of sequence which followed to solve a problem.
Algorithm for an activity ‘riding a bicycle’: 1) remove the bicycle from the stand, 2) sit on the seat of the bicycle, 3) start peddling, 4) use breaks whenever needed and 5) stop on reaching the destination.
Algorithm for Computing GCD of two numbers:
Step 1: Find the numbers (divisors) which can divide the given numbers.
Step 2: Then find the largest common number from these two lists.
A finite sequence of steps required to get the desired output is called an algorithm. Algorithm has a definite beginning and a definite end, and consists of a finite number of steps.
Characteristics of a good algorithm
- Precision — the steps are precisely stated or defined.
- Uniqueness — results of each step are uniquely defined and only depend on the input and the result of the preceding steps.
- Finiteness — the algorithm always stops after a finite number of steps.
- Input — the algorithm receives some input.
- Output — the algorithm produces some output.
While writing an algorithm, it is required to clearly identify the following:
- The input to be taken from the user.
- Processing or computation to be performed to get the desired result.
- The output desired by the user.
Representation of Algorithms
There are two common methods of representing an algorithm —
Flowchart — Visual Representation of Algorithms
A flowchart is a visual representation of an algorithm. A flowchart is a diagram made up of boxes, diamonds and other shapes, connected by arrows. Each shape represents a step of the solution process and the arrow represents the order or link among the steps. There are standardised symbols to draw flowcharts.
Start/End – Also called “Terminator” symbol. It indicates where the flow starts and ends.
Process – Also called “Action Symbol,” it represents a process, action, or a single step. Decision – A decision or branching point, usually a yes/no or true/ false question is asked, and based on the answer, the path gets split into two branches.
Input / Output – Also called data symbol, this parallelogram shape is used to input or output data.
Arrow – Connector to show order of flow between shapes.
Question: Write an algorithm to find the square of a number. Algorithm to find square of a number. Step 1: Input a number and store it to num Step 2: Compute num * num and store it in square Step 3: Print square
The algorithm to find square of a number can be represented pictorially using flowchart
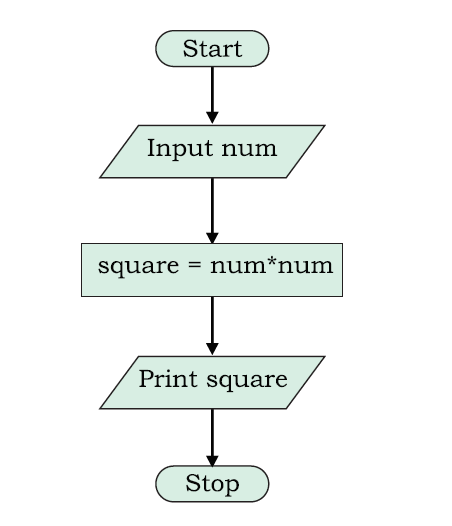
A pseudocode (pronounced Soo-doh-kohd) is another way of representing an algorithm. It is considered as a non-formal language that helps programmers to write algorithm. It is a detailed description of instructions that a computer must follow in a particular order.
- It is intended for human reading and cannot be executed directly by the computer.
- No specific standard for writing a pseudocode exists.
- The word “pseudo” means “not real,” so “pseudocode” means “not real code”.
Keywords are used in pseudocode:
Question : Write an algorithm to calculate area and perimeter of a rectangle, using both pseudocode and flowchart.
Pseudocode for calculating area and perimeter of a rectangle.
INPUT length INPUT breadth COMPUTE Area = length * breadth PRINT Area COMPUTE Perim = 2 * (length + breadth) PRINT Perim The flowchart for this algorithm

Benefits of Pseudocode
- A pseudocode of a program helps in representing the basic functionality of the intended program.
- By writing the code first in a human readable language, the programmer safeguards against leaving out any important step.
- For non-programmers, actual programs are difficult to read and understand, but pseudocode helps them to review the steps to confirm that the proposed implementation is going to achieve the desire output.
Flow of Control :
The flow of control depicts the flow of process as represented in the flow chart. The process can flow in
In a sequence steps of algorithms (i.e. statements) are executed one after the other.
In a selection, steps of algorithm is depend upon the conditions i.e. any one of the alternatives statement is selected based on the outcome of a condition.
Conditionals are used to check possibilities. The program checks one or more conditions and perform operations (sequence of actions) depending on true or false value of the condition.
Conditionals are written in the algorithm as follows: If is true then steps to be taken when the condition is true/fulfilled otherwise steps to be taken when the condition is false/not fulfilled
Question : Write an algorithm to check whether a number is odd or even. • Input: Any number • Process: Check whether the number is even or not • Output: Message “Even” or “Odd” Pseudocode of the algorithm can be written as follows: PRINT “Enter the Number” INPUT number IF number MOD 2 == 0 THEN PRINT “Number is Even” ELSE PRINT “Number is Odd”
The flowchart representation of the algorithm

Repetitions are used, when we want to do something repeatedly, for a given number of times.
Question : Write pseudocode and draw flowchart to accept numbers till the user enters 0 and then find their average. Pseudocode is as follows:
Step 1: Set count = 0, sum = 0 Step 2: Input num Step 3: While num is not equal to 0, repeat Steps 4 to 6 Step 4: sum = sum + num Step 5: count = count + 1 Step 6: Input num Step 7: Compute average = sum/count Step 8: Print average The flowchart representation is

Once an algorithm is finalised, it should be coded in a high-level programming language as selected by the programmer. The ordered set of instructions are written in that programming language by following its syntax.
The syntax is the set of rules or grammar that governs the formulation of the statements in the language, such as spelling, order of words, punctuation, etc.
Source Code: A program written in a high-level language is called source code.
We need to translate the source code into machine language using a compiler or an interpreter so that it can be understood by the computer.
Decomposition is a process to ‘decompose’ or break down a complex problem into smaller subproblems. It is helpful when we have to solve any big or complex problem.
- Breaking down a complex problem into sub problems also means that each subproblem can be examined in detail.
- Each subproblem can be solved independently and by different persons (or teams).
- Having different teams working on different sub-problems can also be advantageous because specific sub-problems can be assigned to teams who are experts in solving such problems.
Once the individual sub-problems are solved, it is necessary to test them for their correctness and integrate them to get the complete solution.

- Input Output in Python

Related Posts

Society, Law, and Ethics: Societal Impacts – Notes
Data structure: stacks – notes.

Python Revision Tour I : Basics of Python – Notes

Introduction to Python Module – Notes

Sorting Techniques in Python – Notes
Dictionary handling in python – notes, tuples manipulation in python notes, list manipulation – notes, leave a comment cancel reply.
You must be logged in to post a comment.
You cannot copy content of this page

IMAGES
VIDEO
COMMENTS
Introduction to Flowcharts. It is basically a diagrammatic representation of an algorithm. Furthermore, it uses various symbols and arrows to describe the beginning, ending, and flow of the program. Moreover, the programmers use it to depicting the flow of data and instructions while problem-solving. Flowcharting is the process of drawing a ...
The word "algorithm" relates to the name of the mathematician Al-khowarizmi, which means a procedure or a technique. Programmer commonly uses an algorithm for planning and solving the problems. An algorithm is a specific set of meaningful instructions written in a specific order for carrying out or solving a specific problem.
1.1: Activity 1 - Introduction to Algorithms and Problem Solving. In this learning activity section, the learner will be introduced to algorithms and how to write algorithms to solve tasks faced by learners or everyday problems. Examples of the algorithm are also provided with a specific application to everyday problems that the learner is ...
This video is Part - 1 of Algorithms, Flowcharts, Introduction to Problem Solving Algorithm and Flowchart for Beginners , Introduction to Problem Solving, Al...
A flowchart is a graphical representation of an algorithm.it should follow some rules while creating a flowchart. Rule 1: Flowchart opening statement must be 'start' keyword. Rule 2: Flowchart ending statement must be 'end' keyword. Rule 3: All symbols in the flowchart must be connected with an arrow line.
Algorithm: Step1: Start Step2: Read\input the first num1. Step3: Read\input the second num2. Step4: Sum. num1+num2 // calculation of sum Step5: Print Sum Step6: End. Problem 3: Convert temperature Fahrenheit to Celsius Inputs to the algorithm: Temperature in Fahrenheit Expected output: Temperature in Celsius.
Explain the role of each. 1.3: Activity 3 - Using pseudo-codes and flowcharts to represent algorithms is shared under a CC BY-SA license and was authored, remixed, and/or curated by LibreTexts. The student will learn how to design an algorithm using either a pseudo code or flowchart. Pseudo code is a mixture of English like statements, some ...
Examples of flowcharts in programming. 1. Add two numbers entered by the user. Flowchart to add two numbers. 2. Find the largest among three different numbers entered by the user. Flowchart to find the largest among three numbers. 3. Find all the roots of a quadratic equation ax2+bx+c=0.
Overview, Objectives, and Key Terms¶. In this lesson, we'll dive right into the basic logic needed to plan one's program, significantly extending the process identified in Lesson 2.We'll examine algorithms for several applications and illustrate solutions using flowcharts and pseudocode.Along the way, we'll see for the first time the three principal structures in programming logic ...
In the New Diagram window, select Flowchart and click Next. You can start from an empty diagram or start from a flowchart template or flowchart example provided. Let's start from a blank diagram. Select Blank and click Next. Enter the name of the flowchart and click OK. Let's start by creating a Start symbol.
Pseudocode is a description of an algorithm using everyday wording, but molded to appear similar to a simplified programming language. In code-based flowcharts, common ANSI shapes are ovals for terminals, arrows for flowlines, rhomboids for inputs and outputs, rhombuses for decisions, and rectangles for processes.
Algorithms. 1. Introduction. In this tutorial, we'll study how to represent relevant programming structures into a flowchart, thus exploring how to map an algorithm to a flowchart and vice-versa. First, we'll understand why using pseudocode and flowcharts to design an algorithm before actually implementing it with a specific programming ...
This book is designed to equip the reader with all of the best followed, efficient, well-structured program logics in the form of flowcharts and algorithms. The basic purpose of flowcharting is to create the sequence of steps for showing the solution to problems through arithmetic and/or logical manipulations used to instruct computers. The applied and illustrative examples from different ...
Problem-Solving Flowcharts is a graphical representation used to break down problem or process into smaller, manageable parts, identify the root causes and outline a step-by-step solution. It helps in visually organizing information and showing the relationships between various parts of the problem. This type of flowcharts consists of different ...
By using an example, describe how the concept of algorithms can be well presented to a group of students being introduced to it. 1.1: Activity 1 - Introduction to Algorithms and Problem Solving is shared under a license and was authored, remixed, and/or curated by LibreTexts. In this learning activity section, the learner will be introduced to ...
CBSE Exam, class 12. About Press Copyright Contact us Creators Advertise Developers Terms Privacy Policy & Safety How YouTube works Test new features NFL Sunday Ticket
To perform a cause-and-effect analysis, follow these steps. 1. Start with a problem statement. The problem statement is usually placed in a box or another shape at the far right of your page. Draw a horizontal line, called a "spine" or "backbone," along the center of the page pointing to your problem statement. 2.
This video describes algorithm, flowchart and Pseudocode in very easy way with examples. #Algorithm_and_Flowcharts #Pseudocode#magnustrainingacademyalgorith...
CHAPTER 1 Algorithms and Flowcharts 1.1 ALGORITHMS. In order to solve a problem using a computer, we must first express the procedure used to solve the problem in terms of computer instructions. A computer program is just a collection of these instructions, that are necessary to solve a specific problem. The approach or method that is used to solve the problem is known as an algorithm.
To practice creating a flowchart, think about the steps that you take to solve this problem. Instructions: Click HERE to go to Lucidchart.com . Click HERE to open the TIME FOR LUNCH Flowchart. Click on File and choose to Make a Copy. Follow the instructions on the TIME FOR LUNCH Flowchart to fill in the correct text in the flowchart symbols.
Program. An algorithm is defined as sequence of steps to solve a problem (task). A flowchart is pictorial (graphical) representation of an algorithm. Set of instructions. Instruction is a command to the computer to do some task. Algorithm can also be defined as a plan to solve a problem and represents its logic. A picture is worth of 1000 words.
Flowchart. 1. An algorithm is a step-by-step procedure to solve a problem. A flowchart is a diagram created with different shapes to show the flow of data. 2. The algorithm is complex to understand. A flowchart is easy to understand. 3. In the algorithm, plain text is used.
Step 1: Find the numbers (divisors) which can divide the given numbers. Step 2: Then find the largest common number from these two lists. A finite sequence of steps required to get the desired output is called an algorithm. Algorithm has a definite beginning and a definite end, and consists of a finite number of steps.