

Excel Tutorial: How To Use Excel For Research
- Introduction
- Understanding The Excel Interface
- Basic Data Entry And Formatting
- Formulas And Functions
- Data Analysis Tools
- Collaboration And Security
Conclusion & Best Practices
Introduction to excel for research.
Excel is a powerful tool that is widely used in both academic and professional settings for managing and analyzing research data. Its user-friendly interface and robust features make it an essential tool for researchers looking to organize and analyze their data efficiently.
Overview of Excel’s capabilities for managing and analyzing research data
- Data Organization: Excel allows researchers to easily input, organize, and store large amounts of data in a structured manner.
- Data Analysis: Excel includes a wide range of functions and tools for performing complex data analysis, such as statistical calculations, charts, and graphs.
- Data Visualization: Researchers can use Excel to create visually appealing charts and graphs to present their findings in a clear and concise manner.
- Data Sharing: Excel files can be easily shared with collaborators, making it a convenient tool for collaborative research projects.
Importance of Excel in academic and professional research environments
Excel plays a crucial role in academic and professional research environments due to its versatility and effectiveness in managing research data. Researchers rely on Excel to organize, analyze, and present their data in a way that is easily understandable and accessible. Whether conducting a small-scale experiment or a large-scale research project, Excel provides the tools needed to streamline the research process and draw meaningful conclusions from the data.
Initial steps to setting up a research project in Excel
- Define Research Objectives: Before setting up a research project in Excel, it is important to clearly define the research objectives and determine the type of data that will need to be collected and analyzed.
- Create a Data Entry Sheet: Start by creating a data entry sheet in Excel, with each column representing a different variable or data point that will be collected.
- Import Existing Data: If you have existing data that needs to be imported into Excel, use the import function to bring the data into your Excel sheet.
- Apply Formatting: Apply formatting to the data entry sheet to make it easier to read and navigate, such as using bold headers for each column and shading alternate rows for better visibility.
- Set up Formulas and Functions: Use Excel’s built-in formulas and functions to perform basic calculations and data analysis tasks, such as summing a column of numbers or calculating averages.
- Importance of Excel in research
- Basic functions for data analysis
- Advanced features for research projects
- Creating visualizations for presenting data
- Tips for efficient data management
Organizing Data Effectively
When conducting research using Excel, organizing your data effectively is crucial for easy access and analysis. By structuring your data tables, utilizing Excel's sorting and filtering features, and implementing named ranges, you can streamline your research process and make data referencing and formula calculations more efficient.
Structuring data tables for ease of use and access
One of the first steps in using Excel for research is to structure your data tables in a clear and organized manner. This involves labeling your columns and rows appropriately, using headers to identify different categories of data, and ensuring that each piece of information is entered into the correct cell.
Tip: Use freeze panes to keep headers visible as you scroll through large datasets, making it easier to reference and analyze your data.
Utilizing Excel’s sorting and filtering features to manage large datasets
Excel offers powerful sorting and filtering features that allow you to quickly organize and analyze large datasets. By sorting your data based on specific criteria, you can identify trends, outliers, and patterns more easily. Filtering allows you to display only the data that meets certain criteria, making it easier to focus on specific subsets of your data.
Tip: Use the 'Sort' and 'Filter' buttons on the Excel toolbar to quickly access these features and customize your data display.
Implementing named ranges for better data referencing and formulas
Named ranges in Excel allow you to assign a specific name to a range of cells, making it easier to reference that data in formulas and calculations. By using named ranges, you can make your formulas more readable and reduce the risk of errors when referencing data across multiple worksheets or workbooks.
Tip: To create a named range, select the range of cells you want to name, then go to the 'Formulas' tab and click on 'Define Name.' Enter a descriptive name for your range and click 'OK' to save it.
Data Analysis Tools in Excel
Excel is a powerful tool that can be used for a wide range of research tasks, including data analysis. In this chapter, we will explore some key Excel functions and formulas that are particularly relevant to research, as well as how to use PivotTables for summarizing and analyzing data, and how to leverage the Analysis ToolPak for advanced statistical analysis.
Overview of key Excel functions and formulas relevant to research
When conducting research, it is essential to be able to manipulate and analyze data effectively. Excel offers a variety of functions and formulas that can help with this process. Some key functions and formulas that are commonly used in research include:
- VLOOKUP: This function allows you to search for a value in a table and return a corresponding value from another column.
- IF: This function allows you to perform a logical test and return one value if the test is true and another value if the test is false.
- AVERAGE: This function calculates the average of a range of values.
- STDEV: This function calculates the standard deviation of a range of values, which is useful for measuring the variability of data.
Using PivotTables for summarizing and analyzing data
PivotTables are a powerful feature in Excel that allow you to summarize and analyze large amounts of data quickly and easily. With PivotTables, you can create custom reports, analyze trends, and identify patterns in your data.
To create a PivotTable, simply select the data you want to analyze, go to the Insert tab, and click on PivotTable. From there, you can drag and drop fields into the rows, columns, and values areas to customize your report. You can also apply filters, sort data, and format the PivotTable to suit your needs.
Leveraging the Analysis ToolPak for advanced statistical analysis
The Analysis ToolPak is an Excel add-in that provides a collection of advanced statistical analysis tools. These tools can help you perform complex data analysis tasks, such as regression analysis, correlation analysis, and t-tests.
To enable the Analysis ToolPak, go to the File tab, click on Options, select Add-Ins, and then click on the Analysis ToolPak option. Once the Analysis ToolPak is enabled, you can access a wide range of statistical functions and tools by clicking on the Data tab and selecting Data Analysis.
Data Visualization Techniques
When it comes to conducting research, one of the most important aspects is being able to effectively visualize and present your data. Excel offers a variety of tools and features that can help you create visually appealing charts and graphs to illustrate your research findings. Let's explore some key data visualization techniques in Excel:
Creating charts and graphs to illustrate research findings
Charts and graphs are powerful tools for summarizing and presenting data in a visual format. Excel provides a wide range of chart types, including bar graphs, pie charts, line graphs, and more. To create a chart in Excel, simply select the data you want to visualize, then click on the 'Insert' tab and choose the type of chart you want to create.
Pro tip: Use different chart types to highlight different aspects of your data. For example, a pie chart can be useful for showing proportions, while a line graph can be used to show trends over time.
Customizing visuals for clarity and impact in presentations
Customizing your visuals is key to ensuring that your data is presented clearly and effectively. Excel allows you to customize every aspect of your charts and graphs, from colors and fonts to axis labels and data labels. To customize a chart in Excel, simply click on the chart and then use the 'Chart Tools' options to make changes.
Pro tip: Use consistent colors and fonts throughout your visuals to create a cohesive and professional look. Adding data labels can also help clarify the information presented in your charts.
Using Sparklines for mini-graphs within cells to show trends
Sparklines are small, simple charts that can be inserted directly into individual cells in Excel. These mini-graphs are a great way to show trends and patterns within your data without taking up a lot of space. To insert a sparkline in Excel, select the cell where you want the sparkline to appear, then click on the 'Insert' tab and choose the type of sparkline you want to create.
Pro tip: Sparklines are especially useful for comparing data across multiple rows or columns. You can easily spot trends and patterns at a glance, making them a valuable tool for data analysis.
Managing Literature and Citations
When conducting research, it is essential to keep track of the various sources and references you come across. Excel can be a powerful tool to help you manage your literature and citations efficiently. Here are some tips on how to utilize Excel for this purpose:
Tracking research sources and references within Excel
One of the most basic yet effective ways to manage your literature and citations in Excel is to create a spreadsheet where you can list all the sources you have used. You can include columns for the author's name, publication year, title of the source, and any other relevant information. This will help you keep track of where you found your information and easily reference it later.
Utilizing hyperlinks for quick access to online resources
Excel allows you to insert hyperlinks into your spreadsheet, which can be incredibly useful for quick access to online resources. You can link directly to the websites where you found your sources, making it easy to revisit them when needed. Simply highlight the text you want to turn into a hyperlink, right-click, and select 'Hyperlink' to insert the URL.
Creating a dynamic literature review table with automated update features
For a more advanced approach, you can create a dynamic literature review table in Excel that automatically updates when you add new sources. By using Excel's functions such as VLOOKUP or INDEX-MATCH, you can pull information from your source list into your literature review table. This will save you time and ensure that your literature review is always up to date.
Collaborating with Others
When conducting research, collaboration with team members is essential for efficiency and accuracy. Excel offers several features that can facilitate teamwork and streamline the research process.
Sharing research data securely with team members
Excel allows you to securely share research data with team members by utilizing password protection and encryption. By password protecting your Excel files, you can control who has access to the data and ensure that sensitive information remains confidential. Additionally, you can encrypt your files to add an extra layer of security, especially when sharing data through email or cloud services.
Utilizing Excel's Track Changes and Comments features for team collaboration
Excel's Track Changes feature allows team members to make edits to the research data while keeping a record of all changes made. This feature is particularly useful when multiple team members are working on the same dataset, as it helps track who made which changes and when. Additionally, the Comments feature in Excel enables team members to leave notes and feedback on specific cells or sections of the data, promoting effective communication and collaboration.
Leveraging cloud services for real-time data access and editing
Cloud services such as Microsoft OneDrive or Google Drive can be integrated with Excel to enable real-time data access and editing. By storing your Excel files on the cloud, team members can access the data from anywhere with an internet connection and collaborate simultaneously. This eliminates the need for emailing files back and forth and ensures that everyone is working on the most up-to-date version of the research data.
After learning how to use Excel for research, it is important to keep in mind some key points to ensure the integrity and replicability of your results. By following best practices and avoiding common pitfalls, you can make the most out of Excel for your research projects.
A Summary of key points on using Excel for research
- Organize your data: Properly structure your data in Excel by using separate sheets for different types of information.
- Use formulas and functions: Take advantage of Excel's powerful functions to perform calculations and analysis on your data.
- Visualize your data: Create charts and graphs to present your findings in a clear and concise manner.
- Document your process: Keep track of your steps and decisions by adding comments and notes in your Excel sheets.
Common pitfalls to avoid
- Ignoring data backup: Always make sure to regularly back up your Excel files to prevent data loss.
- Not using version control: Use version control tools or features in Excel to track changes and revisions in your research.
Best practices for maintaining data integrity and ensuring replicability of results
- Validate your data: Double-check your data entries and formulas to ensure accuracy and consistency.
- Protect your data: Use password protection and encryption to secure sensitive information in your Excel files.
- Share your work: Collaborate with colleagues by sharing your Excel files and documenting your methodology for transparency.
Related aticles

The Benefits of Excel Dashboards for Data Analysts

Unlock the Power of Real-Time Data Visualization with Excel Dashboards

Unlocking the Potential of Excel's Data Dashboard

Unleashing the Benefits of a Dashboard with Maximum Impact in Excel

Exploring Data Easily and Securely: Essential Features for Excel Dashboards

Unlock the Benefits of Real-Time Dashboard Updates in Excel

Unleashing the Power of Excel Dashboards

Understanding the Benefits and Challenges of Excel Dashboard Design and Development

Leverage Your Data with Excel Dashboards

Crafting the Perfect Dashboard for Excel

An Introduction to Excel Dashboards

How to Create an Effective Excel Dashboard
- Choosing a selection results in a full page refresh.
- Machine Learning
- Google Analytics
- Artificial Intelligence
- Financial Accounting
- Illustrator
- Digital Art
- After Effects
- Operating System
- Cloud Computing
- Influencer Marketing
- Email Marketing
- Digital Marketing
- Content Marketing
- Affiliate Marketing

Excel is a powerful tool that can be used for scientific research and analysis. With its vast array of functions, tools, and features, it has become a go-to software for many researchers and analysts. In this blog, we will explore how to use Excel for scientific research and analysis.
Data Management
The first step in any scientific research and analysis is to manage data effectively. Excel allows users to store and organize data in spreadsheets, making it easy to work with. To manage data effectively, users can create tables and charts, add formulas, and use conditional formatting to highlight important information.
Data Analysis
Once data is organized, it’s time to analyze it. Excel provides numerous functions for data analysis, including regression analysis, hypothesis testing, and correlation analysis. These functions enable researchers to identify trends, patterns, and relationships in their data, making it easier to draw conclusions and make recommendations.
Data Visualization
Data visualization is a critical part of scientific research and analysis. Excel provides several options for visualizing data, including charts, graphs, and histograms. These tools can help researchers understand the data better and communicate their findings to others effectively.
Statistical Analysis
Statistical analysis is an essential part of scientific research and analysis. Excel has a wide range of statistical functions that enable researchers to analyze data and draw meaningful conclusions. These functions include t-tests, ANOVA, and chi-square tests.
Graphical Analysis
Graphical analysis is another critical component of scientific research and analysis. Excel provides a range of tools for creating graphs and charts, including scatter plots, line charts, and bar charts. These graphical tools enable researchers to visualize data and identify trends quickly.
Data Manipulation
In scientific research and analysis, it’s often necessary to manipulate data. Excel provides a range of tools for manipulating data, including sorting, filtering, and conditional formatting. These tools can help researchers identify outliers and anomalies, making it easier to draw accurate conclusions.
Collaboration and Sharing
Excel allows researchers to collaborate and share data with others easily. It enables users to share spreadsheets via email, OneDrive, or SharePoint, making it easy to work with others remotely. Excel also enables users to protect data and restrict access, ensuring data security and integrity.
Quality Control
Excel can also be used for quality control purposes in scientific research and analysis. By using functions like conditional formatting and data validation, researchers can identify errors and inconsistencies in their data. This can help ensure that the data used for analysis is accurate and reliable.
Macros and Custom Functions
Excel allows users to create custom macros and functions, which can help automate repetitive tasks and streamline workflows. This can be particularly useful in scientific research and analysis, where data sets can be large and complex. By automating certain tasks, researchers can save time and reduce the risk of errors.
Importing and Exporting Data
Excel also provides options for importing and exporting data from other software and applications. For example, researchers can import data from a laboratory instrument or export data to a statistical software package. This flexibility enables researchers to work with data from a wide range of sources and ensures compatibility with other tools and software.
Pivot Tables
Pivot tables are a powerful tool in Excel that can help researchers analyze and summarize large data sets quickly. Pivot tables enable users to rearrange and summarize data, making it easier to identify trends and patterns. This can be particularly useful when working with large and complex data sets.
Data Mining
Excel also provides options for data mining, which involves using statistical algorithms to identify patterns and relationships in data. For example, researchers can use Excel’s data mining tools to identify trends in sales data or identify commonalities between different samples. This can help researchers identify new research questions or opportunities.
Conclusion: Excel is an incredibly powerful tool for scientific research and analysis. With its vast array of functions, tools, and features, it provides researchers with the ability to manage, analyze, and visualize data effectively. By utilizing Excel, researchers can draw meaningful conclusions and make informed recommendations, advancing their scientific research and analysis.
If you’re looking to enhance your expertise in Excel , LearnTube has got you covered with an array of online courses tailored to your needs. With the help of our specialized learning app and WhatsApp bot, you can enjoy a seamless learning experience. Our platform offers an extensive range of courses that cater to both novices and seasoned learners. For valuable insights, explore our diverse selection of courses on our website .

More from author
Top aws interview questions & answers 2024, how much will i earn as a flutter developer the ultimate salary guide for 2024, top companies hiring flutter developers in 2024, leave a reply cancel reply.
Save my name, email, and website in this browser for the next time I comment.
Related posts
How to use excel for sales forecasting and pipeline management.

Latest posts
Want to stay up to date with the latest news.
We would love to hear from you! Please fill in your details and we will stay in touch. It's that simple!
LearnTube by CareerNinja is a platform with 200+ Free courses, 900+ hiring partners that will help you with placement and internship opportunities. So study along with 2Lakh+ users today!
Latest Posts
Most popular, 15 hidden photoshop features you probably didn’t know about, debugging django applications: tips and tricks, how to become a data analyst from scratch, fast access.
- Business & Finance
- Information Technology
- Data Science
- Design & Creative
- Programming
© CareerNinja 2022 | All rights reserved | Made with Love
Public Health
Preparing Data in Excel
- Center for Global Health and Development
- Center for Preparedness and Emergency Response Solutions
- Center for Collaboration on Research Design and Analysis
- CCORDA Scope of Services
- When to Contact CCORDA
- Request for CCORDA Services
- CCORDA Service Fee
- Educational Opportunities
- Grant Preparation
- Preparing Data in Excel
- Authorship
- Administrative Core and Membership
- Contact CCORDA
- Center for Health Policy
- Center for Health Policy Analysis and Rural Health Research
- Central States Center for Agricultural Safety and Health
- Center for Reducing Health Disparities
The members of CCORDA have expertise in design and planning of studies, including preparation of data collection forms and database creation. We encourage researchers to include CCORDA in all phases of the study from design to analysis and dissemination of results. Some researchers collect and enter their own data for analysis. Accurate data entry is critical for the success of the study. We have prepared some helpful hints for entering data into an Excel Workbook for ease in statistical analysis.
Microsoft Excel can be a useful platform to enter and maintain research study data. Excel is fairly easy to learn and use. Researchers can use Excel's simple statistical and plotting functions to help gain insight into their data. However, most research projects require more extensive statistical techniques that can be most easily performed using additional statistical software packages such as SAS or SPSS software.
In order to have your data easily imported into a statistical software package we have developed these guidelines for data entry into Excel.
Here is a good example of data entry into an Excel file followed by guidelines for data entry.
Good Excel Data Sheet:
Guidelines:.
- Include a unique identifying number for each case.
- Be sure that each variable name is unique (no duplicate variable names).
- Variable names must start with a letter.
- Do not include special characters (#, !, ?, %, etc.) or spaces in your variable names.
- Choose readily recognizable names for variables - but not too long (<= 16 characters best).
- Don’t enter data such as "120/80" for blood pressure. Enter systolic blood pressure as one variable and diastolic blood pressure as another variable. Don't enter data as "A,C,D" or "BDF" if there are three possible answers to a question. Include a separate column for each answer.
- Two digit years can cause problems for statistical software when reading data from Excel files. The best format for dates is mm/dd/yyyy, where mm is a 2 digit month, dd is a 2 digit day and yyyy is a 4 digit year.
- Missing data can cause a multitude of problems. To enter a missing data value either enter a blank or an "impossible" numeric code (for numbers) or an easily recognizable single digit character code for character (trying to avoid mixing numeric and character data). Be sure, if you use a missing value code, that it cannot be confused with a "real" data value.
- When entering data keep the same format throughout.
Bad Example
Notice in the Good Example above that the date variable has the same format (mm/dd/yyyy) and the sex variable is consistent throughout in both case and type (character variable). In the Bad Example the date variable is in different formats without a 4 digit year for all the observations. The sex variable is still a character variable, but statistical software will read this variable as having six different levels instead of two.
- If you decide to use multiple sheets for you data, follow the variable naming conventions for the tabs that name the sheets (keep the names simple and unique).
- For example, treated versus non-treated patients can be handled by column variable that has a code for Treated (yes/no).
- These features can be used on other separate "subset" or "analysis" spreadsheets that are for the investigator, but not the statistician or programmer.
Data Dictionary:
- Be sure the effort you are putting forth is necessary. The CCORDA member should be able to tell you precisely what form the data needs to be in to suit its conversion and analysis.
- Photography
- Video Lecture Tips
Scott Kuban
How to enter research data into excel.
As a professor that often leads the data and analysis of scholarly research projects, and collaborates across many universities, I have encountered good, bad, and downright terrible data being passed around in excel files. This is usually the result of Ph.D. students still moving up the learning curve but can be the result of other issues. So I created this document to help students not be terrible at hand-collecting, recording, transferring, and (if we absolutely must) manipulating data in excel. Further, research professors may find a tip that allows them to further optimize their already no-doubt finely-honed data skills. This -much like the vaunted U.S. Constitution- will be a living document that evolves and grows with time. Constitution constructionist trolling aside, this simply means that I will be updating this document as I think of new tips or students find new ways to anger me with the data sent to me for a project. Tips are numbered merely for easy reference not to confer some order or importance upon them. Importance and/or recency of data anger will be conferred with exclamation points and/or italics. That said, the number 1 rule is pretty important.
Why should I care? First, there is the classic computer science mantra: garbage in, garbage out. Heaven forbid, but badly input data could, if not corrected along the way by a professor overseeing the work, bias a project’s results that will be submitted to a conference or journal. Second (and more likely with skilled researchers guiding the project), poorly collected data negatively impacts a research project through additional time wasted getting the data to merge properly, cleaning the messy data, and analyzing models with poorly thought out variables. The latter usually results in additional data collecting (if still possible) to replace the poorly thought out variables with better ones. All this wasted time and effort also creates frustration. If the same person is doing all of these tasks, you are only hurting yourself by ignoring these tips. If a student is collecting data poorly for a professor this can lead to… unpleasantries. Avoid future pain by following these rules.
Note: While using excel is a reasonable choice for data that must be hand-collected, it should be an absolute last resort for otherwise interacting with the data. And no, already knowing how to do something in excel rather than learning how to do it in SAS, Stata, or R is not a valid reason. Don’t be lazy.
- A column in excel represents a single variable that someone will do statistics on later! Treat it as such!!! This means a) figuring out what the variable will be later in the model to determine how the data should be entered and b) only entering that type of data. For instance, faced with collecting if an executive is a CEO a) figuring out that a binary variable is a wise choice for this b) entering a 1 or 0 only!!! Rather than the terrible text strings that often become an incoherent combination of YES, y, no, YeS, 1, Y, N, NO, Co-CEO, Interm CEO, [blank], Interm CEO that was later approved to be full CEO, NA, N/A, I couldn’t find this one, Not applicable, President Only, etc.
- Use dummy variables whenever possible. Many, many things can be converted into one or more dummies if you consider it first. So instead of ‘executive position’ with a bunch of free form text (similar to the example text in #1) create a dummy for each position: CEO, COO, CFO, etc.
- Expand your dummy variables as needed rather than breaking the #1 rule! For instance, after setting up dummies in #2 if one encounters a Co-CEO instead of abandoning your principals and writing “Co-CEO” in the column for CEO, create a new Co-CEO column that can still be coded with a 1 or 0. Make a note (see #4) as to whether Co-CEOs are still coded as a CEO (i.e., is the Co-CEO variable additive to the CEO variable or replacing it).
- Put any notes in a separate column or columns. Depending on the amount and type of data being collected in excel a single ‘notes’ column may suffice or it may be better to create a notes field for each variable that needs it. Name it something obvious like executive_scandal_notes for notes on the executive_scandal variable.
- Enter dates numerically (no text months) and consistently!!! Generally, this should be either: 2020/3/25 or 3/25/2020. Yes, doing the placeholder zeros (e.g., 2020/03/25) is a little cleaner but most programs can handle importing correctly without them and people tend to struggle with including them. I often see a huge mix of date styles in a single column: 3/25/1999, March 25th, 1999, 3-25-1999, 3.25.1999, Mar 25, Mar 25 99, 25th Mar 1999, etc. Which neither imports well or is easy to clean with a script as it is inconsistent (e.g., a script splitting on the /, or grabbing the final 4 characters for the year).
- Never change an ID in excel. These are often used to merge the excel data with other data so if you change the ID the merge will fail. Instead, create a new column such as ID_updated with the change you want to make. This allows for merging on the newly updated ID without throwing away the old ID through your reckless action.
- Unless you explicitly know otherwise, assume every variable is an ID variable (or otherwise similarly important). Disk space is practically free while time is incredibly valuable , so instead of changing data in an existing variable (column) make a new variable (column) to make your changes. For instance, to get the stock market reaction to an event the date often will need to not the event_date but the first day the stock market was open following the event_date. The programs that retrieve stock market data also want the data formatted in a particular way. This, therefore, presents two temptations to change the event_date while retrieving this additional data – don’t do it. Make a new stock_reaction_date variable and leave the event_date unmolested so that one can easily merge the new data into the existing dataset.
- Really it is best to avoid changing any variables data if at all possible. In addition to breaking merges if the variable is an ID, the variable in question may undergo cleaning and or other manipulation in code after import that your changes might break thus also wasting others’ precious time. This is extremely likely when adding additional data (usually at the request of reviewers) later in a project. Again, disk space is practically free while time is incredibly valuable so make another column and use another 0.0000001% of your disk space rather than potentially waste hours of time.
- Be careful of text IDs with preceding zeros (e.g., 0023817). Excel likes to throw these zeros away. One must make the column a ‘text’ format (rather than general, number, etc) to keep it from doing this. Compustat’s unique ID named gvkey is such a variable.
- Don’t hand make a variable that can be created in a program. For instance, perhaps one’s eventual model will consider if CEOs are fired the same day a scandal is announced by the firm. Collect the two dates (see #5) in two variables scandal_announcement_date and CEO_fired_date, but do not create a human entered dummy (it should be a dummy see #2) CEO_fired_on_announce_day as one can easily and without mistakes create this dummy in Stata/SAS/R by comparing the two dates.
- Any time one wants to enter N/A in a variable consider if a) the way you are creating this variable is a good one or if b) one merely doesn’t understand what N/A actually means. A) Could you use a different coding and/or additional variables (see #3) to capture the data without a useless N/A that both breaks #1 and doesn’t capture whatever is driving you to put N/A in the first place? B) If you are entering N/A into a mutually exclusive dummy you are using it wrong. E.g., CEO_has_former_CEO_experience has to be a 1 or a 0 (or a missing if one doesn’t know) the newly hired CEO either was a CEO before or not, therefore N/A makes no sense. And senseless data makes everyone unhappy.
- Watch out for spaces before and after data being entered. Macs particularly like to “help you” by adding a space after any and every word ever because using the space bar is not elegant or something. Depending on the data an extra space can break things on import or later in analysis and are a pain to locate as visually the data looks right.
- If you are asked to fill in missing data in excel, don’t change a bunch of other things without checking with your professor first. You may be changing IDs needed to merge your collected missing data back into the dataset or otherwise messing up the dataset (see #6, #7, and #8 ).
- Do not use multiple tabs in excel. If you are using multiple tabs in excel this means that you are likely doing some combination of the following: creating unnecessary duplicates, reusing variable names that can only be told apart by referencing the tab names, using variable names that are generally unclear without the tab names, and/or collecting data in a format different than the rest of the data that will require additional work to merge.
- The variable name (top excel row) of the data should a short but meaningful name. Preferably in lowercase with underscores for spaces unless the variable exists somewhere else already then it should match that other naming exactly. For instance, firm_age is obvious in the data it contains, but even more complicated variables such as firm_FEC_total_amt_cycle reasonably conveys that is the firm’s total amount of FEC (federal election commission tracked campaign contribution) dollars in an election cycle (rather than in a year). Stata’s limit of 32 characters only allows so much description in the name but it should be helpful without referencing the longer variable label.
- The top excel row is for the variable names of the data below it and nothing else. This is not a place for notes to self (see #4) or even explanations of the data below. If you need a note to explain the data collected below, the variable is either ill-conceived (see #1, #2, and #3) or poorly named (see #15), or both.
Research collections
Innovation by (and beyond) the numbers: a history of research collaborations in excel.
Published April 13, 2021
Share this page
- Share on Facebook
- Share on Twitter
- Share on LinkedIn
- Share on Reddit
- Subscribe to our RSS feed
Microsoft Excel is one of the world’s most important software tools, relied upon by users worldwide to create, understand, model, predict, and collaborate. As the Excel team works to leverage new areas of computer science – advancements in programming languages, NLP, Artificial Intelligence, Machine Learning – they turn to Microsoft Research both to leverage the incredible work done in the organization as well as to help co-create a vision for what Excel should look like years into the future. The Excel team has built multiple long-term relationships with labs in Cambridge, China, and Redmond working in areas across data types, programming languages, analytics, web architecture, and error detection, many of which employ artificial intelligence, natural language processing, and machine learning. Not only has this allowed the Excel team to deliver innovation that would simply not have been possible otherwise, but it has also put research in a strategic role with material impact on the vision and resultant roadmap for Excel. Simply put, Microsoft researchers are now a core part of the Excel team helping create the product’s future. David Gainer, Vice President of Product, Office
Not only is Microsoft Excel the world’s most widely used spreadsheet, it could be argued that it is also the world’s most widely used programming language. There are tens of millions of self-described professional and hobbyist developers worldwide: yet hundreds of millions of people use Excel, and many of them use it to build themselves sophisticated tools that go far beyond the original capabilities of a spreadsheet. Excel provides ordinary users with tools for deriving insights from data without necessarily needing to learn a complex programming language or data visualization techniques – a particularly important and useful benefit in a world that is awash in data. In doing so, Excel helped democratize and accelerate the field of data science.
In fact, Excel recently became Turing-complete with the availability of LAMBDA , which allows users to define new functions written in Excel’s own formula language. Having achieved Turing-completeness, it is now theoretically possible to solve any classical computation problem using the application.
This milestone is the latest in a long history of collaboration and exploration among researchers and product engineers to expand the capabilities of Excel – particularly, moving beyond scalar values (numbers, strings and Booleans) to encompass richer data types and a richer semantic understanding of that data. For nearly 20 years, researchers across several Microsoft labs have used spreadsheets as the starting point for advances in programming languages and techniques, as well as novel applications of AI, data mining and analytics, knowledge computing, natural language processing and software analytics. At the same time, working side-by-side with product teams to understand Excel users’ needs and behavior has surfaced new problems for researchers to solve, and inspired new research directions in programming languages and human-computer interaction.
This research collection recounts the long history of research collaboration with and contributions to Excel, including work from the Calc Intelligence and Spreadsheet Intelligence projects, the Data, Knowledge and Intelligence , Knowledge Computing and Software Analytics groups, as well as several other researchers and groups throughout the company.
Explore more
- Podcast Advancing Excel as a programming language with Andy Gordon and Simon Peyton Jones
- Podcast Functional Programming Languages and the Pursuit of Laziness with Dr. Simon Peyton Jones
- Podcast How Programming Languages Quietly Run the World with Dr. Ben Zorn
Microsoft Research Podcast

AI Frontiers: Models and Systems with Ece Kamar
Ece Kamar explores short-term mitigation techniques to make these models viable components of the AI systems that give them purpose and shares the long-term research questions that will help maximize their value.
Researchers Simon Peyton-Jones , Margaret Burnett and Alan Blackwell publish A User-Centered Approach to Functions in Excel , which describes potential extensions to Excel that integrate user-defined functions into the spreadsheet grid – highlighting how programming language insights can be applied to a product not normally considered as a programming language. The following year, they publish Champagne Prototyping: A Research Technique for Early Evaluation of Complex End-User Programming Systems , which introduces new evaluation techniques for changes to end-user programming systems that are inexpensive to do, yet retain the credibility of evaluating changes with real users of the environment. These techniques were used in early studies into the benefits of user-defined functions within Excel – a research direction that laid the first stones on the road to LAMBDA and other product enhancements.
While returning from a conference, researcher Sumit Gulwani has a chance conversation with an Excel user that inspires further research into programming by example (PBE) and, later, a shipping feature in Excel 2013. Building on his experience in program verification and program synthesis, he worked with the product team to create Flash Fill, which automates tedious tasks by implementing code based on an example of what the user wants to do. Variants of this technology later shipped as part of PowerShell and Azure Operations Management Suite, and ideas from the related PROSE program synthesis project have been implemented in many other Microsoft products and services. The pioneering vision and impact of Flash Fill shipping in Microsoft Excel, reaching millions of users, has inspired numerous subsequent research and product offerings exploring the power of program synthesis to empower non-programmers.
- Blog Flash Fill Gives Excel a Smart Charge
- Group PROSE
- Podcast Program synthesis and the art of programming by intent with Dr. Sumit Gulwani
- Publication Automating String Processing in Spreadsheets using Input-Output Examples
- Publication Spreadsheet Data Manipulation using Examples
Researchers and Excel program managers begin speaking with customers to gather more ideas for enhancements to Excel. The collected ideas were organized in a spreadsheet, naturally, and the most promising ideas were highlighted in yellow – the foundation for what would be internally called Project Yellow – a focused collaboration between researchers and product teams that eventually grew to incorporate capabilities such as logic abstraction and data typing into Excel.
Meanwhile, researcher Andy Gordon and his collaborators published Tabular: A Schema-Driven Probabilistic Programming Language , which proposes a new kind of programming language for machine learning wherein programs are written by annotating existing relational schemas with probabilistic model expressions – a development with potential applications for spreadsheets, among other things. These ideas were explored in subsequent papers over the next several years, and Gordon would later work more closely with the Excel team on Project Yellow.
- Publication Probabilistic Programs as Spreadsheet Queries
- Publication Fabular: regression formulas as probabilistic programming
Microsoft researchers and Excel program managers continue to explore and refine the ideas they collected, drawing from ongoing research publications as well as further user research and scenario development work. They began developing early prototypes, and working with product leadership to define a plan to turn these ideas into usable features.
Meanwhile, researchers continue to publish work that proposes new capabilities for spreadsheets, as well as new programming approaches that could be relevant to people using them to develop increasingly sophisticated tools. In the Data, Knowledge and Intelligence group in Microsoft Research Asia, researchers kick off the IN4 initiative (Interactive Intuitive Instant Insights), which works to enable two-way interaction between users and systems: where systems don’t just respond to user requests, they can identify and surface recommendations. (This builds on previous work in software analytics research that began in 2009.) This work leads to several features that ship as part of Excel in subsequent years.
- Publication Braincel: Interactive visual machine learning in spreadsheets
- Publication FlashRelate: Extracting Relational Data from Semi-Structured Spreadsheets Using Examples
- Publication User Interaction Models for Disambiguation in Programming by Example

Project Yellow begins to move from user research and brainstorming to development, with the creation of a more concrete plan and resource requirements to begin adding new capabilities to Excel. This work is recounted in a 2020 presentation to industry customers.
In April 2018, two new data types – geography and stocks – are initially made available to Excel users who are part of the product’s Insiders program, and later rolled out to all users. This draws in part from Microsoft Research Asia researchers’ work on automated entity identification. Also that year, Excel added the ability to compute array values that spill over into adjacent cells, another product of collaboration between researchers and the program group.
Meanwhile, other researchers at Microsoft continue to explore other ways to enhance spreadsheets, including the use of neural networks and automatic extraction of insights from multi-dimensional data (a concept later implemented in Excel as Excel Ideas / Analyze Data (opens in new tab) ), while the Calc Intelligence group explored new ideas such as implementing multiple-representation spreadsheets to better detect and fix errors and perform abstract operations.
In 2016, researchers at Microsoft Research Asia begin work on AnnaTalk, which enables users to query data using natural language – rather than writing a formula, users can ask Excel for “average sales per country,” for instance, as if they were talking with a data analyst. This taps into not just natural language capabilities, but also tabular intelligence: the ability to recognize and understand semantic data in tables (such as column and row titles), and the ability to recognize entities or data types within tabular data. This functionality is made available to PowerBI mobile users in 2017, and later ships to all Excel users in 2019. Some of the underlying entity recognition technology is used in several other Microsoft products and services, and has also been open-sourced (opens in new tab) .
Another area of research is the development of tools for spreadsheet users that better match the sophistication and capabilities of those available to software developers, such as tools to identify bugs. For instance, the Melford classifier referenced below uses neural networks to identify common spreadsheet errors – such as the inclusion of a number where a formula should be – that have been responsible for significant financial losses.
At an internal company hackathon, the Calc Intelligence team creates a working demo for Calc Anywhere, a research vision to bring formula calculation to web applications such as Word or Teams, or even in Wikipedia. The demo, which showed formula evaluation within Word, won the hackathon and attracted the attention of a team of Excel developers based in Israel who were looking to implement client-side estimation in Excel for the web. Client-side estimation can dramatically improve the performance of web-based spreadsheets by evaluating formulas locally instead of in the cloud. The researchers and developers collaborated to rewrite the demo’s code in TypeScript, which became Calc.ts. This functionality began rolling out to customers in 2018.
Building on the Project Yellow work, Microsoft researchers in Cambridge formally establish the Calc Intelligence project in 2018, which aims to bring intelligence to end-user programming, and in particular to spreadsheets – transcending grids and formulas to enhance and extend the spreadsheet, inspired by the many ways that users have re-purposed them as programming environments.
- Blog Calc.ts in Excel for the web – Microsoft Garage
- Blog Ideas in Excel – Office Support
- Blog New Data Types in Excel – Microsoft Garage
- Download Microsoft.Recognizers.Text
- Publication Automated Refactoring of Nested-IF Formulae in Spreadsheets
- Publication Calculation View: multiple-representation editing in spreadsheets
- Publication ExceLint: Automatically Finding Spreadsheet Formula Errors
- Publication Expandable Group Identification in Spreadsheets
- Publication Extracting Top-K Insights from Multi-dimensional Data
- Publication How do people learn to use spreadsheets? (Work in progress)
- Publication Learning Latent Semantic Annotations for Grounding Natural Language to Structured Data
- Publication Melford: Using Neural Networks to Find Spreadsheet Errors
- Publication Operation-guided Neural Networks for High Fidelity Data-To-Text Generation
- Publication TableSense: Spreadsheet Table Detection with Convolutional Neural Networks
Ideas in Excel (now called Analyze Data) is made available to Excel users. This functionality draws from work in several areas from Microsoft Research, including the natural language capabilities developed as part of AnnaTalk and several efforts focused on understanding the semantic structure of tabular data. Together, these research breakthroughs enable a more natural and fluid way of manipulating and visualizing data in spreadsheets, while also working more proactively to suggest ideas to users.
While development continues on scenarios and features identified by Project Yellow, including the implementation of first-class records and dynamic arrays, researchers across the company continue to use spreadsheets as a venue for research, as well as a testbed for explorations into user behavior. Key developments include using machine learning to identify and apply semantic understanding to content, as well as determining user intent; studies on how users perceive and manage uncertainty using spreadsheets despite their inherent limitations for doing so; and studies of the potential applicability to spreadsheets of probabilistic programming.
- Blog Influencing mainstream software—Applying programming language research ideas to transform spreadsheets
- Publication End-User Probabilistic Programming
- Publication QuickInsights: Quick and Automatic Discovery of Insights from Multi-Dimensional Data
- Publication Semantic Structure Extraction for Spreadsheet Tables with a Multi-task Learning Architecture
- Publication Somewhere Around That Number: An Interview Study of How Spreadsheet Users Manage Uncertainty
- Video Spreadsheet Understanding Using Statistics and Deep Learning
- Blog LAMBDA: The ultimate Excel worksheet function
Project Yellow reaches a milestone with the introduction of LAMBDA, which allows users to define new functions written in Excel’s own formula language. These newly-defined functions can call other LAMBDA-defined functions, to arbitrary depth, even recursively – making Excel Turing-complete.
While this is a major milestone for Project Yellow, it is by no means the end of the story. In the publications below, researchers use spreadsheets as the starting point for a wide variety of research projects – from using neural networks to automatically format tables, to furthering spreadsheets’ semantic understanding of the information they contain, to understanding the overlap between spreadsheet use and programming. These ideas promise to further enhance spreadsheet software used by hundreds of millions of people every day, while also helping to advance the state of the art in software development and human-computer interaction.
- Blog Connect to your own data with more new data types in Excel – M365 Blog
- Publication Elastic Sheet-Defined Functions: Generalising Spreadsheet Functions to Variable-Size Input Arrays
- Publication Excello: exploring spreadsheets for music composition
- Publication Gridlets: Reusing Spreadsheet Grids
- Publication Higher-Order Spreadsheets with Spilled Arrays
- Publication Learning Formatting Style Transfer and Structure Extraction for Spreadsheet Tables with a Hybrid Neural Network Architecture
- Publication LinkingPark: An Integrated Approach for Semantic Table Interpretation
- Publication Neural Formatting for Spreadsheet Tables
- Publication Pen-based Interaction with Spreadsheets in Mobile Virtual Reality
- Publication Spreadsheet Comprehension: Guesswork, Giving up and Going back to the Author
- Publication Spreadsheet Use and Programming Experience: an Exploratory Survey
- Publication Table2Analysis: Modeling and Recommendation of Common Analysis Patterns for Multi-Dimensional Data
- Publication Understanding and Inferring Units in Spreadsheets
Continue reading

Research Focus: Week of March 18, 2024

Research Focus: Week of January 22, 2024

Research Focus: Week of September 11, 2023

Research Focus: Week of July 3, 2023
Research areas.
Research Groups
- Software Analytics
- Knowledge Computing
- Data, Knowledge, and Intelligence
Related tools
- Microsoft.Recognizers.Text
Related projects
- Calc Intelligence
- Spreadsheet Intelligence
- Follow on Twitter
- Like on Facebook
- Follow on LinkedIn
- Subscribe on Youtube
- Follow on Instagram
Share this page:
- Find My Rep
You are here
Sage online ordering services will be unavailable due to system maintenance on May 18th between 2:00 am and 8:00 am UK time If you need assistance, please contact Sage at [email protected] . Thank you for your patience and we apologise for the inconvenience.
Using Microsoft Excel for Social Research
- Charlotte Brookfield - Cardiff University, Cardiff, UK
- Description
Providing step-by-step instructions for how to use Microsoft Excel for doing statistics, Charlotte Brookfield discusses different stages of the research process, from first planning to writing and presenting your research. With a focus on conducting robust data analysis, the book is reassuring, clear and straightforward, helping you to:
· Learn important data skills, such as preparing, cleaning and managing data
· Reduce anxiety about approaching statistics and quantitative data
· Boost your employability, showing you how to develop transferable skills, such as effective time management
Whether you’re learning data skills for the first time or translating your statistics knowledge from other software, this book will help you successfully carry out social research in any setting with confidence, via an engaging pedagogy that includes: colour-coded chapters by difficulty, activities, 'Remember' boxes, further reading and skills checklists.
Supplements
This is an invaluable resource for people learning statistics. Brookfield provides a clear, accessible and engaging introduction to using Excel to explore, analyze and report quantitative data.
It makes perfect sense to train our students in Microsoft Excel: not only does the programme have increased functionality for social research, but it is also a staple in many graduate workplaces. This text is distinct from other Excel help guides in that it is explicitly designed around the social research process and with undergraduate students in mind. Using real-life datasets and tools such as ‘reminder boxes’, it is a highly comprehensive, engaging and accessible resource for introductory quantitative research methods modules.
This is the book I have been waiting for. We have learned that employers value Excel and that many small workplaces cannot afford SPSS licences. This covers everything we would do in SPSS (possibly excepting recoding variables). Sold.
Preview this book
For instructors.
Please select a format:
Select a Purchasing Option
- Electronic Order Options VitalSource Amazon Kindle Google Play eBooks.com Kobo

Related Products

Free Download 📥
Literature review catalogue (excel template).

Crafting a high-quality literature review is a lot of work . Failure to keep track of all the literature you consume can result in a lot of wasted time . You need to get (and stay) organized – in other words, you need a literature review catalog .
We developed a template, just for you.
Now you can keep on top of your literature using our intuitive literature review spreadsheet-based catalogue template. The spreadsheet will not only keep everything organized; it will also provide a summary of key metrics.
Need a template for the actual literature review chapter ? You can get that here .

How to use the Excel template effectively.
A quick overview. The first tab (labelled “Literature”) is where you’ll record specific details of all the reading you’ll do. The second tab (labelled “Literature Summary”) will auto-populate with descriptive statistics of the input as you enter data.

The last two tabs are simply scratchpads for you to dump any additional resources you find along the way. In particular, we’ve made a tab for theoretical frameworks (you can simply dump screengrabs here and caption them) and a tab for measures and scales (the same principle applies). Measures and scales are specific to quantitative methodologies, but you could just as easily use this tab to jot down existing questionnaires if you’re taking a qualitative approach.
Getting started.
The process is straightforward. For every piece of literature that you read , you log it as a line item. We’d encourage you to record everything you read. Something might seem irrelevant at first read, but you’ll be surprised how the focus of your research can change over time, leading you to inevitably ask the dreaded question, “where did I see that article again?”. Therefore, l og every piece of reading, regardless of perceived relevance at the time of reading . You’ll thank yourself later.
While you’re doing this, we’d encourage you to simultaneously capture the literature piece in your reference manager. We usually recommend Mendeley , but any of the popular reference management tools will do the trick. The key thing is to capture the references while you’re reading (and not when you’re writing, as this breaks your flow).
What goes where.
For every piece of literature you read, you’ll need to capture the following details:
- Author – Enter the author(s) surname(s). The format you use here is up to you – just be consistent.
- Year – Straightforward. Enter the year of publication only – no month is required.
- Title – Enter the title exactly as it is shown on the book cover, journal article front page, presentation deck, etc. If you can copy and paste, do so. It’s easy to make mistakes on the long titles.
- Category 1, 2 and 3 – Here, you’ll create categories and subcategories, which you can use at a later stage to help you find relevant literature. It is up to you what categories you want to use and how much detail you want to add here. At the very least, your choice of categories should be logical, comprehensive and mutually exclusive.
- Document type – Click the drop-down arrow next to the cell and select an appropriate document type, for example, journal article, blog post, etc. If nothing matches your document type, you can use the “Other” field.
- Publication setting – the two main options here are academic and practitioner. Academic refers to the classic academic sources such as textbooks and journal articles, while practitioner refers to publications such as industry reports, company reports, industry magazines, etc. There is also a mixed option here.
- Theoretical refers to situations where an author is proposing a hypothetical theory or concept, but not testing it.
- Empirical refers to situations where an author is testing the said theory by using some form of real-world observation.
- Naturally, some literature will feature both of these (i.e. a model is hypothesized and then tested empirically).
- Key arguments – Here you need to note the key takeaways of the respective piece of literature in relation to your research question(s) and objective(s). This is the most important column , so spend some time providing rich, detailed notes here. Keep in mind that you will be able to search and filter this column at a later stage, so use keywords that make sense.
- Context – Here you should briefly note the context of the specific literature piece. For example, what industry, country, competitive context, etc. did it take place in? When it comes time to justify why your research is worth undertaking, you will likely need to draw on this column’s contents to demonstrate that research has not been undertaken within your specific context (i.e. is it unique?).
- Methodology – Use this drop-down to note the primary methodology (qualitative, quantitative or mixed) used within the specific literature piece. As with the previous item (context), you will likely draw on this when you justify the choice of methodology for your research (i.e. which methodology is commonly used in the field?).
- Key quotes – If there are any specific author quotations that you feel might be useful in your dissertation, add them here. Remember to include the page number if you’re using the Harvard referencing system.
- My notes – Lastly, if there is anything else you feel might be useful, drop it here. You can also create additional columns if you need them.
Finding what you need.
Over time, you will build up a substantial list of literature. When you need to find something, whether it’s a specific piece of literature, a collection of literature within a category, or a summary of a specific author’s publication, you can use the following Excel features:
- Find (Ctrl + F) – good for searching for specific keywords
- Filter – good for filtering groups (for example, categories 1- 3, methodology or publication setting)
- Sort – good for arranging numerical data (for example, publication year)
Once you’ve completed your reading, remember to have a look at the second tab (“Literature Summary”) for an overview of key statistics. As mentioned previously, some of these statistics can help you justify your choice of topic or methodology. Additionally, a review here may reveal that your literature is aged , or that you need to improve your balance of academic and practitioner literature.

Psst… there’s more!
This post is an extract from our bestselling short course, Literature Review Bootcamp . If you want to work smart, you don't want to miss this .
You Might Also Like:

161 Comments

Hi, I can’t open the excel file, can you please check it? Thank you so much for your helpful contents!

Sure, no problem. We’ve checked the file and it is opening correctly. Please give it another go.

Hi,do you have a vidoe on how to popolate the informatino in the spreed sheet ?if you have it i will like to have one.

Please may I know what you mean by categories or subcategories on your literature review catalogue? This also includes keywords.
I’ve downloaded it, but unable to enter any information. Is it possible to receive it as an excel document that I can save onto my documents, as I’m using an android phone?

The Theoretical Framework of the Excel File is empty, sir…
This document is a template for you to populate with the relevant literature, models and frameworks from your reading. As such, it doesn’t contain any literature.

Thank you for such a useful video tutorial. Learnt a lot!
Pleasure, Zhanna!

you are amazing….the way you patiently reply to almost every enquiry is remarkable. Keep it up Derek.

Very helpful as usual. Thank you so much.

I need an examplary literature review in mycology (botany) if you can provide it on any botanical topic so I would be able to start my Lit.review.

Why don’t you just ask him to do your thesis for you?

What an invaluable presentation. Makes literature review so simple.

Thanks for the feedback, Tebogo. Good luck writing your literature review 🙂

Very useful! Thanks.
Pleasure, Maureen 🙂

Great tips! Just starting mine now….so I am using your template….to a mil!!

I need this tamplate, its amazing, I will need your consideration on related work. Thank you

Really agreed

Hello, I am trying to download the excel but I am not receiving the email. Can it be that there is a technical problem or does it take some time to send it?
Thanks for your comment. It can take a few minutes for the email to go through. Please also check your spam box.

Yes, I am also facing the same problem brother. Just check it once. Thanking you..!

Thanks for this very nice explanation
Great to hear that 🙂

very useful
Glad to hear that 🙂

Thanks for the template. It helped in organizing my literature review and writing process
You’re welcome

Hi, thanks for sharing this file, very helpful! I’d like to share it with my students. Could you please advise on how to give proper credits (reference) to your work? Cheers, G
Hi Gianpiero
That’s great. Here’s the Harvard reference:
Jansen, D., 2019. Literature Review Excel Template (Spreadsheet/Matrix) – Grad Coach. [online] Grad Coach. Available at: https://gradcoach.com/how-to-manage-the-literature-review/ > [Accessed 6 April 2020].
Kind regards,

Thank u Derek Your lectures are effectively informative and easily understood. They are clear and organized.

I’m so glad I came across this website. Thank you Derek !!!
You’re welcome, Rabia 🙂

Dear Derek,
Thanks for your extremely useful video tutorials. Please can you send me a link to open your Lit Review Excel Templates.
Thanks for your feedback. You can download the template following the instructions in the orange box.
All the best with your studies!

great effort

Thank you for this document. I am in the beginning stages of the dissertation process.
You’re welcome, Jerry 🙂

The video on literature review was very useful. I especially like the cataloging suggestion.
Great to hear that, Rishi. All the best for your research!

I`m busy writing my minor dissertation my master’s in engineering. I’m following your videos on youtube for writing a literature review. I’m looking for the excel sheet to save a list of references.

The literature video was helpful. Thank you. I haven’t received the excel template its been a week now . Please assist me .
Hi Morakane
That’s very unusual. At most, it should take a few minutes. Please re-attempt the download (use an alternative address if need be).

Thank you for the template. it seems useful to organize my literature review.
You’re very welcome.

Thank you for this informative site and all the tips. Very useful for my research.
You’re welcome, Feyi.

Currently writing a dissertation for a masters in social sciences. Found the youtube videos which are of great help.
You’re most welcome 🙂 Good luck with your literature review.

Thank you very much for the support!!

your videos are great helpful.
Glad to hear that! Good luck with your lit review.

You are the BEST
Thanks for the feedback, Annie. I wish you best of luck with your literature review.

where is the download link for the excel template?
Hi Lebogang
The download is below the first image. Good luck with your literature review!

Your videos literally saved me!!!! Due to recent issues, most of my classes were cancelled and i was completely lost. No words can explain how much grateful i am to you!!
Glad to hear we helped you! Good luck with your literature review.

You guys are the kinds of people who should survive covid-19. You are the type of people we really need in this planet. You are a star. You really saved me from many headaches. Thank you very much for the useful videos and the literature organisation spreadsheet.
Thanks for the kind words, Abel. All the best for your literature review!

Thanks so much for your video. I have consistently received comments that my arguments don’t flow well and I could never figure out how to successfully fix this issue. Now I feel I have a plan and someone to help me and provide feedback if I still don’t get it quite well. Looking forward to getting an improved mark on my next Lit review Thank you
Great to hear that, Helen. Good luck with your future literature reviews!

Excellent lecture
Thanks Biren – good luck with your literature review
i have watched your video on three steps to write a literature review and i found it very useful. thank you for sharing. keep it up.
Thanks again

Thank you for providing such excellent information and sources. Your videos helped me so much. I was on the verge of quitting. Thank you again for your videos and recommended tools.
Great to hear that, Tanya. All the best for your literature review, and for your research.

The video was very informative and timely for me. I am about to start, so Gradcoach is a source I will be revisiitng
Thanks, Nina – glad to hear that. Good luck with your literature review 🙂

hey your video is awesome I had to make an assignment on literature Review and it helped me to get an outline on how I should start ! i was fed of reading books and online articles. Your video served as a boon and clarified my thought process – how I should move forward .Thank you so much!
Great to hear that, Kavita. All the best with your literature review!
Hi Derek, I have tried unsuccessfully to download the Excel template but it keeps bringing me back to this comment section. Is it a technical issue? Kindly help.
Sorry about that. Can you please send me a screenshot of what you’re seeing – [email protected] . I will send you the template as well.
Best of luck with your literature review.

This is so very helpful!! I am writing my first lit review within a proposal (rather last minute, yikes) and this is so helpful to stay organized!
Pleasure. Good luck with your lit review 🙂

Hi i like the video,it is very helpful especially now that I am working on my proposal for thesis project….Hope I will be able to use the excel template to organize for my literature review
Great to hear that, Faith. All the best with your literature review!

hey Derek this video is absolutely amazing. One problem though I’m one of the few that are struggling to download excel. I keep clicking on it and nothing happens.
Thanks for letting us know. Please email me a screenshot of your error and I’ll sort you out – [email protected]
Thanks, Derek

Thanks a lot! Very well explained and easy to follow…now I guess I have no excuse to actually do the work 😉
Thanks for your comment! Good luck with your literature review.

Your video is very informative and useful. Thanks a lot. I also want to try the template but I can’t the find the download link…
The download button is below the main image.

Very helpful thank you

Hi! It is a big help for beginners, such as me. Thanks a lot for sharing!

Thank you. All the best with your literature review.

This is brilliant, Pls sir, in writing a review article, how deep can u go. Is it necessary to go down to the inception of your area of research?

How do I know the country/region of research article?
This will usually be covered somewhere in the article itself.

I would like this free resource
You’re welcome to download it. The download button is below the main image. Good luck with your literature review 🙂

I’d love to have this resource pls. Thank you so much
You’re welcome to download it. The download button is below the main image.

Thanks for the you tube videos. they are very informative

Thank you so much for the full tutorial with so much detailed information. I’m a Ph.D. Candidate in China. The whole syllabus of the Ph.D. program sucks. Thanks again for sharing all this helpful information. I hope your team will getting better in the future!
You’re very welcome. Good luck writing your literature review.

It’s such a big help for me. Thank you!

I’ve watched your video on writing a research proposal. I am interested in the lit review excel template.

I have watched your lecture video on writing a research proposal. I am interested in the literature review excel template and the book write smarter not harder.

It is very helpful. Thank you for your experience sharing.
You’re welcome – good luck with your literature review 🙂

Good afternoon, I recall listening/seeing in 1 of your videos *of saving the abstract (PDF) together with the excel database. How do you do this? is it also with this excel sheet
Thank you ..your videos are a confidence booster
*How To Write A Literature Review In 3 Steps (Full Tutorial)

Wonderful work !!! Please share more !!!! I will be very happy.

Thanks so much for your precision in your presentation. I have not yet started practicing but it’s one of the best I have come across. More grease to your elbows.

I love every video on research that you ve made so far. Thanks a lot

انت رائع جدا

You’re welcome. Good luck with your literature review 🙂

Excellent work. Very helpful. I am starting in this beautiful activity of writing papers with my research . I am learning a lot. Thank you very much.
Glad to hear that. Good luck writing up your research papers!

Thank you so much for the free Excel document! It’s such a huge time-saver!
You’re most welcome, Rebecca. Good luck writing your literature review 🙂

I am so grateful that I have found you on YouTube!
In the meantime, is it better to make another excel file for another variable of the same thesis or just put all articles of all variables in 1 excel file?
Thank you very much!

The notes have been very helpful to me thank you very much for sharing
You’re most welcome, Juan 🙂

Just recently seen your youtube video. Its very information. I usually gets running out of words while writing literature review. Example: XX et al investigated, YY et al shown that, ZZ et al demonstrated…….. After 4-5 references, I feels like again am repeating the words investigated, demonstrated… Could you please shoe some references with a set of vocabularies that can be used while writing literature review section.
Thank you in advance

Thank you so much. Amazing tutorial. Am feeling educated now. Lol…
Glad to hear that, Frank. Good luck with your literature review!

Very helpful stuff, thank you so much for the free Excel! I’m going to use it for my DBA and get your YT channel.

Hi, thank you for the great insights! I was unable download the template even though I completed the form. Would you be able to help me?

Derek thanks for sharing your sacrifices. I love the clarity and confidence, it takes experience to do such.

I just downloaded the excel template for LR coupled with the explanation on how to use. I found it useful, thank you!

Do you have any recommendations for adding Key quotes from a reference ?

Great content. Template very useful

Awesome! An answer to my prayer. I found this in time I need it most. Thank you for the spirit of service.
You’re most welcome, Jojo. Good luck with your literature review.

I am really impressed. This discussion helped me a lot to reconsider a lot of issues.
Thanks for the kind words. Good luck with your literature review!

This is amazing! I really like the guidance you are giving here. However, can you throw more light on the ‘category’ columns for me? I’m really nit clear on that. Thanks
Thanks for your comment. Please see my reply to Sasquia’s question re the same thing.
Good luck with your research!

I have been sitting on an enormous amount of articles for months with difficulties in organizing them until i discovered your video on literature review (YouTube). It brought me to this page where you also had a free template for us. Research process is so much bearable now than i expected. Highly recommended for all researchers. Thank you very much.

Great template. Quick question: Are the categories KEYWORDS that I draw from each source? or pre-planned TOPICS that I come up with to organize the source content?
Thanks for your comment. You can use the category columns in whichever way works for you. It would be different for each student depending on the nature of their research and their research objectives.

Hi there, can you suggest how the corresponding literature resources are best saved into a document folder for retrieval later.
I have seen some suggesting using a unique identifier in a master tab in the spreadsheet so as to be able to create a separate tab for quotes or similar thus using the id as the link
But no one has gone on to say if they are also saving the source document in a folder and naming it 57 or author last name, title or other.
I checked out your Literature Kickstarter and the screen shot of the articles didn’t look to correspond with the catalogue. Have been meaning to sort out my reference folders for sometime and am inspired by the use of an excel spreadsheet but not sure what to name files (currently saved in theme folders) Any help would be gratefully received. Thanks

I am happy if I get a catalogue excel template on the research are of zeolite synthesis from local clay for water treatment mechanism. I need help.

I love the template! But I would like to change the name of some of the headings, used in the dropdown, i.e. change “Audio Recording” to “Podcast”. How could I do that?

Very helpful!

Great!!! Very handy.

Thankyou so much. The excel file is really helpful. This really means and is helping a lot for me.

Hello, please, how can i get your excel document to catacogue the ideas for my literature review. Can you also assist on how to build the methodology section of my literature review? Thank you in advance.

I’m a student from Indonesia..This is very useful for me.. Thank you Derek..

What is the better, download all literatures and then log them into the excel sheet or do that for one by one?

Dear Derek.
I was utterly stressed when taking on an MSc Educational Leadership distance learning degree after 30 years of no academic studying. However, I found your literature review tutorial on Youtube and I immediately experienced a sense of calm direction. I am working full time in the Cayman Islands and am native Afrikaans speaking, so it was such a great help with my literature review for my first assignment. However, I have to write an evaluative essay for my second module and can not find any tutorial done by you about this. Do you perhaps have a template I could use? I have also used your services for editing and proofreading and am super grateful for the amazing help I have received! THANK YOU!

Hi Mr Derek,
It really really helps me to summarise my LR in Excel form and start-up writing

Hi Derek I have tried to download the template and it has failed to. I am not receiving the email either, could this be network issues.
Hi Derek I have been able to download the template. thank you for all your support. let me get started

I have downloaded the template. I would like to print out the guide so I can easily follow. Hope that is fine with you.

THANKS A LOTTTTT This template is exactly the one I needed when reading the literature review for my Bachelor’s dissertation

Thank you so much for your support ,I have downloaded your template and it is amazing .

Derek, The products you and the team members have put together continue to provide exemplary help as I finish the journey toward completing my dissertation! I wish I would have known of GradCoach during both of my MBAs. It could have helped alleviate a lot of time and frustration! I look forward to learning and seeing new things as I complete the dissertation.
Thanks for the kind words 🙂

Can data will be entered in excel sheet automatically like in Mendeley or i have to enter manually, pl?

Thank you GRADCOACH, I’m keenly following your tutorials as I’m about to start my literature review. These videos have been very helpful. So for the literature review you recommend only checking abstract, introduction and conclusion of the relevant literature?

Thanks for providing such an amazing resource.
I wish I knew about this when I was doing my masters. I’m doing my PhD now and sitting on Word files of reference lists and quotes I made for my MEd. This catalog will help me to keep everything more organized in one place. I’ve already started making your template my own by adding additional columns that are important for my research topic. One of the best features of your template is the Literature summary page. My question is how do I get the information I put into my new columns to auto-populate with descriptive statistics on the Literature Summary page?

Hi, I still don’t understand what you would put as ‘Category 1’, ‘Category 2’, ‘Category X’. Are they like the sort of big topics covered in the paper?

This is very helpful

Thank you so much for this summary of the process. I found your advice so helpful, and will apply it to improve the way I write. One small problem: I can´t get the Excel spreadsheet to download: every time I press on the button, it takes me back to the top of the screen.
Trackbacks/Pingbacks
- What Is A Literature Review (In A Dissertation Or Thesis) - Grad Coach - […] theses and any other credible sources of information that relate to your topic. You’ll then summarise and catalogue these for easy…
Submit a Comment Cancel reply
Your email address will not be published. Required fields are marked *
Save my name, email, and website in this browser for the next time I comment.
- Print Friendly

- Spartanburg Community College Library
- SCC Research Guides
Organizing Your Research
- Source Table

Another way of organizing your sources could be to use a source table in Word or Excel to keep all of your notes in one place. Using a source table in a program like Word or Excel can help you see all of your notes at once and could help you see the connections between your sources easily. You could list out the different quotes or main ideas from each source to make sure they align well with your thesis statement.
There are a lot of ways that you can organize your table, and you should choose the method that makes the most sense to you. In your table, be sure to include the source name, author, page number (if available), and sections for the direct quotes or paraphrases you want to include.
Below are templates you can use to organize your research using Word or Excel. Feel free to edit the template to organize sources in a way that works best for you.
- Excel Source Table Template Create a Source Table in Excel to organize research.
- Word Source Table Template Create a Source Table in Microsoft Word to organize research.
- << Previous: Research Note Cards
- Next: Research Outlines >>
- Research Note Cards
- Research Outlines
- Recommended Resources
Questions? Ask a Librarian

- Last Updated: May 8, 2024 9:31 AM
- URL: https://libguides.sccsc.edu/organizeresearch
Giles Campus | 864.592.4764 | Toll Free 866.542.2779 | Contact Us
Copyright © 2024 Spartanburg Community College. All rights reserved.
Info for Library Staff | Guide Search
Return to SCC Website

Add or change research services
Through Research options , you can customize options to suit your research needs such as including or excluding reference books or research sites. You can activate services for searching, add new services, and remove others from your computer. You can also turn on Parental Control, which helps to protect children from finding potentially offensive or disturbing material.
Tip: If you're using Word for Microsoft 365 you might want to take a look at the similarly-named, but much more powerful, Researcher feature. You can learn more at Research your paper easily within Word
Step 1: Find the Research feature
Click Review > Research.
For Outlook the Review tab only appears in the message inspector, so you need to start a new message first.
Step 2: Find research options
Near the bottom of the Research task pane, click Research Options .

Another way to find the research options is to click File > Options > Trust Center . Next, click the Trust Center Settings button to open the Trust Center dialog. Now click the Privacy Options tab and then click the Research Options button.
Step 3: Set the research options you want

Do one or more of the following:
To activate or remove research services, check or uncheck the check boxes you want, and then click OK .
To add research services, click Add Services , select or type the Internet address for the service you want in the Address box, and then click Add . The service is automatically enabled for searching, and it will appear in the Search for list the next time you open the Research task pane.

To add a Microsoft SharePoint Portal Server site, type or copy and paste the following URL into the Address box:
http://your root directory/_vti_bin/search.asmx
To remove a service provider and all of its research services, click Update/Remove , select the provider you want to remove, click Remove > Close .
To turn on Parental Control, click Parental Control , select the options you want, and then click Close .

Need more help?
Want more options.
Explore subscription benefits, browse training courses, learn how to secure your device, and more.

Microsoft 365 subscription benefits

Microsoft 365 training

Microsoft security

Accessibility center
Communities help you ask and answer questions, give feedback, and hear from experts with rich knowledge.

Ask the Microsoft Community

Microsoft Tech Community

Windows Insiders
Microsoft 365 Insiders
Was this information helpful?
Thank you for your feedback.
- Contact sales
Start free trial
15 Excel Spreadsheet Templates for Tracking Tasks, Costs and Time
Still using spreadsheets to manage your projects? Revolutionize your project management with ProjectManager. Plan projects, manage resources and track progress with powerful features the whole team can use.
Excel spreadsheet templates are a great tool to track the costs, time and performance of your team. We’ve collected ProjectManager’s 15 best Excel spreadsheet templates for tracking that you can download and use for free.
1. Dashboard Template
A dashboard is how you keep track of your work, including the time spent on tasks, what you’re spending and if you’re making progress as planned. ProjectManager’s free dashboard template for Excel gives you an overview of how you’re doing on your work. This information is vital to know if you’re overspending or running behind on your schedule.

ProjectManager’s free dashboard template has several widgets that monitor metrics in your work. For example, there’s a color-coded task graph that shows if your tasks are complete, in progress, not started or overdue. There’s also a workload chart for managing teams and making sure their workload is balanced.
There’s another task graph that measures the duration of the tasks, which is helpful in seeing what’s getting done on time and what’s taking too long. Finally, there’s a cost bar chart to help you stay on budget.
This Excel dashboard template can manage your work, but it’s a static document that must be updated manually. Project tracking software automates that process. ProjectManager is better than Excel spreadsheet templates as it helps to accumulate real-time data, crunch the numbers and display it. Get started with ProjectManager free today.

Not all project management software offers the same project dashboards. ProjectManager’s project dashboard comes equipped with the right project management features to help you keep track of time, tasks, costs and more.
2. Task Tracker Template
ProjectManager’s free task tracker for Excel template can organize and keep track of your work. It’s similar to a to-do list, where you just need to add the work and manage it. Having a task list is the first step to controlling your work.
This task tracker spreadsheet captures the details of your work. Add the name of the task and include dependent tasks. You can assign it to yourself or someone on your team.
Next, set the priority and when you expect to finish. Finally, there’s a column to mark its status, which is essential to track your work. It has everything you need to track your tasks at a basic level with an Excel spreadsheet.
3. Budget Spreadsheet for Cost Tracking
Managing costs in your work is as important as meeting deadlines. ProjectManager’s free budget template for Excel helps you keep to your budget by tracking your financial details on one spreadsheet.

Tasks cost money, and the budget defines the costs of the resources you’ll employ to deliver those tasks to completion. First, the spreadsheet template has a numbered list that corresponds to your work breakdown structure (WBS) . Then, there are labor costs including planned vs. actual hours plus the cost per hour. Materials are broken down by units and cost per unit.
There’s also room for other line items on your budget, which include travel, equipment, fixed and miscellaneous costs. Finally, there are columns to collect the budgeted and actual cost for each line item, then a balance showing if the line item is above or under budget.
Related: How to Track Project Expenses
4. Timeline Template
ProjectManager’s free timeline template in Excel is perfect for scheduling your project from start to finish in Excel. It’s a way to view all your tasks and keep on schedule. You can even add milestones!

To get started with this free timeline template, you first need to list your tasks and give them a name. Each task must have a start date and an end date, plus the time you think it’ll take to complete.
You add all that data to the left side of the template, which is a normal tracking spreadsheet. Then, on the right, you’ll see the timeline that lays out your tasks as horizontal bars across a timeline. It’s easy to see how long it’ll take to complete each task.
Excel spreadsheet templates are good for beginners, but if you want to take your planning even further, upgrade to online software that lets you build timelines in minutes. ProjectManager has online project timelines that update instantly as the team collaborates on tasks. Track costs, workload, planned vs actual progress and more. Get started for free.

5. Action Plan Spreadsheet
Managing work means outlining the steps you must complete to achieve your goals. Use ProjectManager’s free action plan spreadsheet for Excel to track tasks and detail the strategy you’ll use to complete your work on time and within budget.

We’ve broken up this action plan template into three sections. The first is the action steps, which note the priority and list tasks, phases and assignments. There’s also space to note the status of your tasks and track their progress.
Section two of this Excel spreadsheet template is a timeline, with start and due dates, including planned hours. Finally, section three focuses on resources; for example, which department is responsible for which task, what materials are needed and what are the resource costs?
6. Status Report Template
Knowing where you are at any particular point in the project life cycle is how you manage time and costs. Our free status report template is a great tool to track your progress and stay on schedule.

This free status report template is made up of five sections: project information, project status summary, project health, risk management overview and a conclusion that includes recommendations for the future.
A status report is a cornerstone of tracking your work. It’s used in project management and work management alike because it gives managers a picture of their planned vs actual progress. It’s also a powerful tool when presenting to stakeholders.
7. Risk Tracking Spreadsheet
No matter how well-planned your work is, there are unknowns that can impact your progress. Use ProjectManager’s free risk register spreadsheet to help you plan for risks in your work.
This free risk register for Excel has columns to ID the risk to make it easier to track. There’s a column to describe the risk and explain how it’ll impact the work you’re doing if it goes from a risk to an actual issue .
For each risk you identify on the template, you can add a risk response, which is the response you’ll take if the risk actualizes. You can also note the risk level. Then, if you’re working in a team, you can assign the risk so that the team member is responsible for identifying and rectifying it.
8. Change Tracking Spreadsheet
Download ProjectManager’s free change tracking spreadsheet for Microsoft Excel to manage change when it impacts your work management. It’ll help you control change so it doesn’t make you spend too much overtime or incur additional costs.

A change log Excel spreadsheet is one of the most important Microsoft Excel templates we offer. It’s a spreadsheet template that captures change when it happens. You can number changes for better tracking and note when the change first came up and who discovered or requested it.
You can then prioritize the change, and you or a team member can take ownership to see it through to completion. The Excel spreadsheet tracks the change from discovery to recovery and ensures that no change order is lost in the cracks.
9. Time Tracking Spreadsheet
There’s no better template to track the time you spend on your tasks than with ProjectManager’s free time tracking spreadsheet . This timesheet is great for you or team members to record the amount of time spent on work.

This timesheet Excel spreadsheet template has space for your name or the name of the employee, their department, supervisor and hourly rate. The template collects their hours, such as their start time and end time for their workday. There’s even a place to add overtime and lunch.
Then, the total for the week is added and multiplied by the pay rate to show the total amount the employee is owed. Finally, there’s a line for the employee to sign and the supervisor to look it over and sign it, if accurate.
10. Multiple Project Tracking Template
When you’re managing a portfolio or program, you have to monitor all your projects in one place to make insightful decisions as to how to allocate resources. Using our free multiple-project tracking template for Excel gives you a high-level overview of every project for which you’re responsible.
Once you download the free Excel template, you’ll find it’s formatted with three projects, one stacked on top of the other. You can copy and paste to add as many projects as needed. You can also add columns if you need to track something not already on the template.
Each project spreadsheet allows you to list all the project tasks by name and description, as well as if they’re dependent on another task. There’s space to add who’s assigned to each task. Each task has a start and planned end date, and planned cost, with an actual end date and actual cost to help you track the project.
11. Issue Tracking Template
Issues are problems that arise while executing your project. These issues must be quickly identified and resolved to keep the project on schedule and within its budget. With our free issue-tracking template for Excel , you have the tools to monitor the progress of resolving those issues.
The free template is ideal to capture risks, which become issues if they in fact show up in your project. When they do, you already have them described in the template and what their potential impact is. Next, you can define its priority, from low to critical, which helps you determine which risks need your immediate attention.
There’s also a place to note the date the issue first was discovered and when it was closed, as well as the team member who’s responsible for resolving it. Finally, the free template states the department that’s handling the issue and there’s a column to note its status when tracking the issue.
12. To-Do List Template
Everyone has work to do, and getting that work done efficiently requires task management. At its most basic, that means having a list of your tasks. It’s the first step to getting organized. That’s where our free to-do list for Excel comes in handy.

A to-do list is a simple but highly effective tool. Simply list the tasks you’ve been assigned or you can even use it for household chores. Next, you’ll want to give each task a start and due date. This is the duration or timeframe in which you want the work completed.
Now, you’ll want to track your progress. The free to-do list template shows the percentage complete for each task. It’s a satisfying feeling to see the cell move from 25 percent to 100 percent. Then there’s a column to note the progress. Before you know it, your work is done.
13. Inventory Template
If you’re a manufacturer or have a company with which you carry stock that you need to run your business, then you need our free inventory template for Excel . Use it to prevent production delays by keeping track of what you’re warehousing.

Use this free template to record the level of your inventory and track its turnover. First, each line is numbered to make it easier to find the item you want. Then the item is listed and described, with the unit price noted and the quantity you have in stock.
Now you can calculate the inventory price, which is the unit price multiplied by the number in stock. This Excel spreadsheet template does this automatically. There’s a column to note whether you need to reorder, what level to reorder, how long it takes to restock and what that reorder quantity should be.
14. Progress Report Template
Project reports are essential for a number of reasons. One, they help you monitor your progress and performance, and two, they’re a great tool for keeping stakeholders updated. Our free progress report template for Word captures an overview of the activities and tasks that occurred over a specific period.

The free progress report is broken up into a number of different sections. There’s a summary, which provides a quick overview of what’s to follow, including pertinent data, such as the project scope, schedule, cost and risk for the time period being reported on.
Then there’s a section in this Excel spreadsheet template that goes over the tasks that have been executed over a period of time covered in the report. There’s space to note the status of tasks that aren’t yet completed and a section to list issues, talk about the budget and more. It’s a great way to capture a snapshot of the project in time.
15. Work Schedule Template
Need help managing your human resources or operations planning? Check out our free work schedule template for Excel . This free template lists all your employees and their working hours, including responsibilities, over a day, week or month.

Use the work schedule template to keep your employees productive and help with tracking your resource utilization and scheduling. You can also use it to prioritize tasks and balance your team’s workload, which leads to greater productivity and happier employees.
Our free spreadsheet template has a weekly and monthly work schedule. Both list your employees, their tasks, which project they’re working on and then their hours, either day-by-day or over the course of a month. This will help most organizations and even long-term projects.
Use ProjectManager to Track Time, Costs and Tasks Better Than Excel
Templates and Excel spreadsheets for tracking are great, but as noted, they can only do so much. ProjectManager is online work management software that connects everyone, no matter where they work, what time, department or skill level. It does so in real-time to ensure that everyone is collaborating and working on the most recent data.
Automatically Fill Out Timesheets
Take timesheets, for example. Instead of having your employee fill out the timesheet, ProjectManager’s timesheets autofill their tasks and update the time they’ve spent. This streamlines payroll but also offers a window into tracking the time they spend on their tasks. That way, you know if they’re meeting their quota. Once submitted, timesheets are locked and secure.

Work the Way That Suits You
Multiple project views allow everyone on the team to work how they want. Managers can plan ahead on Gantt charts that show all their tasks on a timeline. The duration bar that connects each task’s start and end dates automatically shows progress based on how much of it is shaded. Teams can use task lists, kanban boards or calendars if they prefer, all of which are updated and show progress. No tool is more flexible for planning and tracking work.

Generate One-Click Reports in Seconds
Tracking time, costs and more is easy with ProjectManager’s one-click reports. Get status reports, reports on tasks, timesheets, expenses and more. These reports take complicated data and turn it into insightful and easy-to-read reports to monitor progress and more. Reports can also be filtered to see only the data you want and then shared to keep stakeholders updated.

Related Excel Project Management Content
While Excel is not a project management software, it can still be a very helpful for managing various aspects of your projects. That’s why we’ve created dozens of blogs, templates and guides to help you use Excel for project management.
- Essential Excel Report Templates
- Free Manufacturing Excel Templates
- Free Excel Construction Templates
- Free Word & Excel Templates for Business
- How to Create a Project Timeline in Excel (Free Template Included)
- How to Make a Gantt Chart In Excel Step-By-Step (Template Included)
- 25 Must-Have Project Management Excel Templates and Spreadsheets
ProjectManager is award-winning project management software for teams. Our real-time tool tracks time, costs and more to ensure you’re always on schedule and never spending over your budget. Join the 35,000+ people using our software to track tasks, cost and time. Get started with ProjectManager free today.

Deliver your projects on time and on budget
Start planning your projects.
Thomas' Miniblog
Technology, digital insights and more, accidentally open the research pane here is how to disable it in office (excel, word).
The Research pane is a small utility build in some Office applications. It allows to search the meaning of a word, get synonyms, pronunciation…
The Research Pane is, however, often opened by accident. When pressing the ALT key and clicking, the window opens on the right side. This can be very annoying to say the least. I had the same issue for a long time and I wanted to disable the Research pane completely, so it would not appear again by accident when hitting that ALT key during my work. Here is how!
Here are the steps to disable the Research pane in Excel and Word:
- Open Excel, and open a new empty file .
- Now press ALT+F11 keys to open the Visual Basic for Applications window.
- You now have a Visual Basic editor open. Press CTRL+G keys to open the Immediate Window .
- In that new window, paste the following: Application.CommandBars(“Research”).Enabled = False and press ENTER key
- Save your work ( CTRL+S )
Note that after pressing ENTER, nothing will appear to happen. There will be no confirmation or information pop-up that will say ‘success’ or ‘operation completed’. Don’t worry at this stage, this means the command was executed correctly and successfully.
The very last step is to close the Office windows (Excel and/or Word). Once re-opened, the annoying Research pane will no longer appear.
13 thoughts on “ Accidentally open the Research Pane? Here is how to disable it in Office (Excel, Word) ”
Thank You, Thank You, THANK YOU!!! Trust Microsoft to implement something that completely brings your work to a halt… I couldn’t even type text into a cell. The research pane appeared upon selecting any cell, with some crazy irrelevant search text and searching Spanish & French dictionaries enabled (I speak English and located in Australia). All of my shortcut keys became disabled. I have a .xlsm workbook that opens hidden whenever I start Excel and it contains a host of VB code and shortcut key assignments that I use all the time. Including (believe it or not) all my Excel 4 macros that I wrote back in the 1990’s. Why would I still use those you might ask? Because they can be undone, they are basically menu commands in text form. Try to do any of these simple operations in VB and WHAM, your undo stream is cleared and you cannot undo. Sorry for the rant – I got a bit worked up, just gradually calming down again, now that I can continue working normally!
Run-time error ‘9’:
Subscript out of range
Didn’t work, don’t know what that error means.
if you copy paste it from the above solution the double quotes are not copied properly. Hence type the double quotes from keyboard.
That’s it.
Thanks so much for this. i had the same issue, but manually typing the double quotes fixed the issue.
omg ty ty ty
if you copy pasted it from the above solution the double quotes are not copied properly. Hence type the double quotes from keyboard.
Thank you so much!
I tried but I am getting error popup-
Runtime error – `9′
Thank you so much.
My Excel was responding when I press ALT+F11 at all. Therefore, I went turn on Developer to open up VBA screen. Copy paste the code you gave, and it works.
Really appreciate!!!!
The only thing that happens when I press Alt+F11 is the document just moves down to the taskbar
This remedy saved me a lot of aggravation. Thanks! (also the note re entering the double-quotes manually)
I got the “Run time error “9”. Subscript out of range.” message after the press enter. Please help
Thank you For your help! This happened to me and I could find no way out of it. We’re good now!
Leave a Reply Cancel reply
Your email address will not be published. Required fields are marked *
Schedule a Demo
How to switch off research in excel.

Too many steps?
Try sourcetable..
Struggling with the automatic research feature in Excel that disrupts your workflow? Our step-by-step guide simplifies the process of turning off this feature, ensuring a more streamlined experience.
Learn how to disable research in Excel quickly and regain control over your spreadsheet tasks. We'll also explore why Sourcetable offers a more user-friendly alternative for managing this function.
How to Switch Off Research in Excel
Disable the research task pane.
To disable the Research Task Pane, also known as the Research Explorer Bar in Excel, you have multiple options. You can either disable the Bing bar in your web browser or edit the system registry manually to remove the feature.
Disable Bing Bar
Disabling the Bing bar on your web browser is a straightforward method to switch off the Research Task Pane in Excel. This action will prevent the task pane from being accessible through Excel.
Edit the Registry
For a more advanced method, you can directly edit the registry to disable the Research Task Pane. This requires technical knowledge and should be done with caution.
Remove Services
Another effective method is to remove all the services that the Research Task Pane utilizes, which will result in the feature being disabled in Excel.
Key Combination Triggers
Be aware that the Research Pane in Excel may appear when using certain key combinations like Ctrl+Whatever or Alt+Whatever. Even after disabling the Research Pane, it might still be accessed manually if not fully disabled.
Common Use Cases
Excel vs. sourcetable: a comprehensive comparison.
Discover the differences between traditional spreadsheets and the innovative Sourcetable platform. Excel's familiar interface meets Sourcetable's integrated data solutions and AI copilot.
Maximize productivity with Sourcetable's AI copilot, a feature absent in Excel. Experience seamless formula creation and template generation, leaving complex tasks to intelligent automation.
Streamline data management by consolidating multiple sources in Sourcetable. Unlike Excel, Sourcetable eliminates the need for manual data imports, enhancing efficiency and accuracy.
Utilize Sourcetable's chat interface for intuitive command execution, a contrast to Excel's traditional function input. Simplify your workflow with conversational AI assistance.
Choose Sourcetable for an all-in-one data querying experience, surpassing Excel's singular spreadsheet environment. Integrate, analyze, and manage data effortlessly with Sourcetable's advanced features.
No guides needed. Ask Sourcetable AI

Recommended How To Guides
- How to... Close Research Option In Excel
- How to... Disable Research Pop Up In Excel
- How to... Disable Research Pane In Excel
- How to... Remove Research In Excel
- How to... Stop Solver In Excel
- How to... Turn Off Auto Save In Excel
- How to... Turn Off Temporary View In Excel
Start working with Live Data
Analyze data, automate reports and create live dashboards for all your business applications, without code. get unlimited access free for 14 days..
Excel Sample Data (Free Download 13 Sample Datasets)
Sample data in Excel refers to datasets used for practice purposes. While learning various Excel features and functions, or performing data analysis in Excel, users often need a sample dataset.
In this Excel tutorial, you will find 13 ideal Excel sample data. These sample datasets will cover a wide variety of areas such as sales, finance, management, sports, movies, etc. so that you can get your preferred type of data.
A set of sample data in Excel consists of multiple rows and columns. Each row represents a single observation and each column depicts a single variable. The sample data can be in xlsx or csv file format and users can download the files to get the dataset. Users can also use various Excel functions and features to load data from online sources and create their own datasets.
With meaningful sample data in Excel, users can perform various testing, learning, development, and data analysis tasks.
Here are 13 ideal sets of sample data in Excel:
Project Management Sample Data
A project management sample data is suitable for various types of data filtering, analyzing, and visualizing. Here are the variables that we have included in the sample data:
- Project Name
- Assigned to
- Days Required
Here is a preview of the project management dataset:

Download Sample Workbook
Inventory Records Sample Data in Excel
Inventory management records consist of product and stock information. In our sample dataset, we have included the following fields:
- Product Name
- Opening Stock
- Purchase/Stock-in
- Number of Units Sold
- Hand-in-stock
- Cost Price Per Unit
- Cost Price Total
Here is a preview of the inventory records sample data:

Call Center Customer Satisfaction Data
Call centers deal with customer service and receive various types of feedback from customers. In our Call Center Customer Satisfaction data, we have included the following fields:
- Customer Name
- Call Timestamp
- Response Time
- Call Duration
- Call Center
Here is a preview of our sample data:

Supermarket Sales Sample Data in Excel
Supermarket sales sample data is a popular dataset for learning and practicing your Excel skills. Here is the list of variables we have included in our supermarket sales sample data:
- Retail Price
- Order Quantity
Here is a preview of the sample supermarket sales data in Excel:

Download Practice Workbook
Employee Management Data
Employee management data contains information on all employees in an organization. In our sample employee management data in Excel, we have listed the following variables:
- Employee ID
- Designation
- Annual Salary
Here is a preview of the employee management data:

Technological Product Sample Data
Any technological product information requires various specifications. In our sample dataset, we have listed the following specifications:
- Country of Origin
- Release Date
The following image shows a preview of our sample technological product dataset:

Engineering and Manufacturing Sample Data
Engineered or manufactured products also require various specifications. Here is the list of variables we have included in our sample engineering and manufacturing sample data:
- Manufacturer
- Stock Quantity
Here is a preview of the sample dataset:

Students Marksheet Sample Data in Excel
A student mark sheet contains the student identifiers and marks in various subjects. In our sample students marksheet dataset, we have listed the following variables:
- Marks in Mathematics
- Marks in Physics
- Marks in Chemistry
Here is a preview of the sample student marksheet dataset:

2022 FIFA World Cup Performance Data
In our sample dataset, we have listed the information of each player from the World Cup-winning Argentina team. Here is the list of variables we have included:
- Player Name
- Jersey Number
- Appearances
- Goals Scored
- Assists Provided
- Dribbles per 90 Min
- Interceptions per 90 Min
- Tackles per 90 Min
- Total Duels Won per 90 Min
You can preview the sample dataset in the following image:

Tokyo Olympic Data
This sample dataset contains the team names, number of Gold, Silver, Bronze, and total medals, and ranking of teams (based on gold medal and total medal count) in the Tokyo Olympics. Here is a preview of the sample dataset:

Healthcare Insurance Sample Data in Excel
The price of healthcare insurance depends on various factors such as current age, BMI, smoking habits, etc. In our sample healthcare insurance dataset, we have listed the following variables:
- Smoking Status
- Insurance Price

Travel Destination Distance Data in Excel
While deciding on a travel destination, we need to take the distance, available travel modes, travel duration, etc. factors into consideration. In our sample travel destination dataset, we have listed the following variables:
- Source City
- Source Latitude
- Source Longitude
- Destination City
- Destination Latitude
- Destination Longitude
- Distance (in km)
- Distance (in mile)
- Travel Mode

Netflix Movies Sample Data
The movie dataset provided in this section contains the following variables:
- IMDb Rating
You can preview the dataset in the image below:

This ends our article on Excel sample data. We provided 13 ideal sample data that you can download as an xlsx file. After downloading the workbook, you can use the dataset directly in that workbook. You can also copy or import the sample data to your target workbook using Excel functions and features. We hope that the provided datasets were helpful to you. If you have any feedback or queries on this article, feel free to share them in the comment section.
Excel Sample Data: Knowledge Hub
- GST State Code List in Excel
- Historical Data of NSE Stocks in Excel
<< Go Back to Learn Excel
What is ExcelDemy?
Tags: Learn Excel

Seemanto Saha graduated in Industrial and Production Engineering from Bangladesh University of Engineering and Technology. He has been with ExcelDemy for a year, where he wrote 40+ articles and reviewed 50+ articles. He has also worked on the ExcelDemy Forum and solved 50+ user problems. Currently, he is working as a team leader for ExcelDemy. His role is to guide his team to write reader-friendly content. His interests are Advanced Excel, Data Analysis, Charts & Dashboards, Power Query,... Read Full Bio

Thanks for the DATA SETS !

Hello Margit ,
You are most welcome.
Regards ExcelDemy

Thank you so much
Hello Usama Jamil ,

I needed Oil parameters Offshore Foundation design 2015 excel sheet access
Hello Ameer Ahmed ,
We don’t have any dataset you asked for and your question is not clear enough. Our datasets are given in the article.

Thank you so much for the data sets.
Hello Gaurav,

Where are the solutions to these problems? Would like to check against what I did
Hello Cynthia Satterwhite ,
Neither any problem nor any solution are given. These dataset are given to practice by yourself.

Wow Great Readymade Excel Sheets, Can You provide any excel sheet to maintain monthly calibration details for internal lab
Hello Karunesh Pandey ,
As calibration details varies with lab type we can provide you the criteria. You can fill out your information and edit the list.

nice work thank you ! I need dataset for students, subjects, teachers and departments hope U help.

Hello Fulad
Thanks for your compliment! As you requested, you can use the following dataset, which contains data with your mentioned fields:
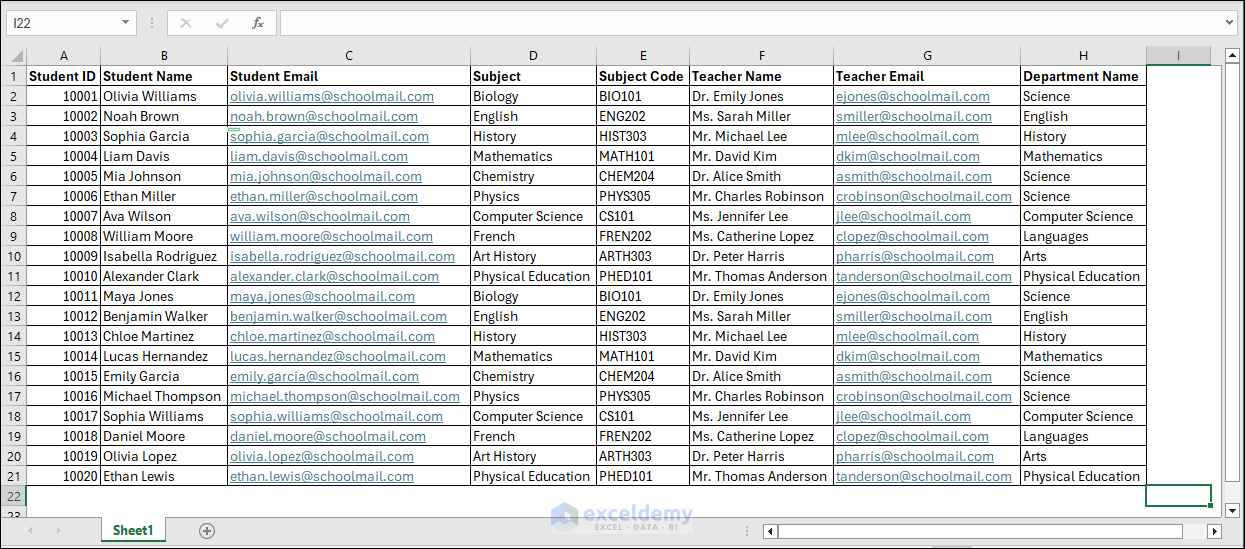
You can download the workbook from the following link:
DOWNLOAD WORKBOOK
I hope you have found the dataset you were looking for; good luck.
Regards Lutfor Rahman Shimanto ExcelDemy
Leave a reply Cancel reply
ExcelDemy is a place where you can learn Excel, and get solutions to your Excel & Excel VBA-related problems, Data Analysis with Excel, etc. We provide tips, how to guide, provide online training, and also provide Excel solutions to your business problems.
Contact | Privacy Policy | TOS
- User Reviews
- List of Services
- Service Pricing

- Create Basic Excel Pivot Tables
- Excel Formulas and Functions
- Excel Charts and SmartArt Graphics
- Advanced Excel Training
- Data Analysis Excel for Beginners

Advanced Excel Exercises with Solutions PDF
- Kutools for Excel
- Kutools for Outlook
- Kutools for Word
- Setup Made Simple
- End User License Agreement
- Get 4 Software Bundle
- 60-Day Refund
- Tips & Tricks for Excel (3000+)
- Tips & Tricks for Outlook (1200+)
- Tips & Tricks for Word (300+)
- Excel Functions (498)
- Excel Formulas (350)
- Excel Charts
- Outlook Tutorials
- About Us Our Team
Feature Tutorials
- Search Search more
- Retrieve License Lost License?
- Report a Bug Bug Report
- Forum Post in Forum
How to disable the research task pane in Excel?

In Excel, when you press Alt key and then click one cell in worksheet, a Research pane will appear at right of the sheet at the same time as left screenshot shown. This will be annoying. If you want to disable this pane, and make it no longer displayed when you apply Alt + Click in Excel. From this article, I will introduce you an easy way to solve it.
Disable the research task pane in Excel with VBA code
Disable the research task pane in excel with an easy feature.
Do with the following operations to disable the research task pane in Excel:
1 . Launch your workbook, and then hold down the Alt + F11 keys in Excel, and it opens the Microsoft Visual Basic for Applications window .
2 . In the opened VB Editor, press Ctrl + G to open the Immediate Window , and then copy and paste this code Application.CommandBars("Research").Enabled = False into the Immediate box, and press Enter key on the keyboard, see screenshot:

3 . Then save and close this VB Editor, and now, when you press Alt key and click the cell in the worksheet, the research task pane will not display any more.
Note : If you need to make the research task pane appear again in your workbook, please copy and paste this code Application.CommandBars("Research").Enabled = True into the Immediate box to replace the original code, and remember to press Enter key.
If you have installed Kutools for Excel , with its Disable research pane option, you can disable this pane quickly and easily as below demo shown:
Tips: To apply this Disable research pane feature, firstly, you should download the Kutools for Excel , and then apply the feature quickly and easily.
After installing Kutools for Excel , please do as this:
1 . Click Kutools > Show & Hide > View Options , see screemshot:

2 . In the View Options dialog box, please check Disable research pane option under the Other box, see screenshot:

3 . Then click Ok to close this dialog box, now, the Research Pane will be disabled, and it will not be displayed any more.
Note : If you want to enable this Research pane, just uncheck the Disable research pane option in the View Options dialog box.
Click to Download Kutools for Excel and free trial Now!
More articles:
- Disable Cut, Copy And Paste Functions In Excel
- Supposing you have a workbook with important data which you need to protect from being cut, copied and pasted. How to achieve it? This article provides a VBA method for you to disable the cut, copy and paste functions at the same time in an Excel workbook.
- Disable Double-Click On Cell Border In Excel
- Normally, we double click on a cell to edit the cell content, however, the cursor jumps to bottom of the worksheet data as you may click on the cell border accidentally as following screenshot shown. This may be annoying if there are multiple rows, you should scroll up to the clicked cell. This article, I will talk about how to disable double-click on cell border in Excel.
- Disable F1 Help Key In Excel
- When you edit an Excel file, you may always use F2 key to edit the contents of a cell. But, you usually press F1 key instead, it will pop out the Helper dialog box. This may be very boring when you need to use the F2 key time and time again. In this article, I will introduce some quick methods to solve this problem.
- Enable Or Disable Button Based On Cell Value In Excel
- This article, I will talk about some methods to enable or disable button based on cell value in Excel worksheet.
- Prevent/Disable Automatic Hyperlinks In Excel
- As we all known, Excel create clickable hyperlinks automatically when we input the web addresses into cells. Maybe, sometimes, this is somewhat annoying. Today, I will introduce some quick tricks for you to prevent automatic hyperlinks in Excel.
Best Office Productivity Tools
Supports Office/Excel 2007-2021 and 365 | Available in 44 Languages | Easy to Uninstall Completely
Supercharge Your Excel Skills with Kutools for Excel, and Experience Efficiency Like Never Before. Kutools for Excel Offers Over 300 Advanced Features to Boost Productivity and Save Time. Click Here to Get The Feature You Need The Most...
Office Tab Brings Tabbed interface to Office, and Make Your Work Much Easier
- Enable tabbed editing and reading in Word, Excel, PowerPoint , Publisher, Access, Visio and Project.
- Open and create multiple documents in new tabs of the same window, rather than in new windows.
- Increases your productivity by 50%, and reduces hundreds of mouse clicks for you every day!
Contribute to the Microsoft 365 and Office forum! Click here to learn more 💡
April 9, 2024
Contribute to the Microsoft 365 and Office forum!
Click here to learn more 💡
Excel Forum Top Contributors: HansV MVP - Ashish Mathur - Andreas Killer - Jim_ Gordon - Riny_van_Eekelen ✅
May 10, 2024
Excel Forum Top Contributors:
HansV MVP - Ashish Mathur - Andreas Killer - Jim_ Gordon - Riny_van_Eekelen ✅
- Search the community and support articles
- Microsoft 365 and Office
- Search Community member
Ask a new question
How to disable the research pane in Excel?
The research pane automatically pops up while using Excel. Not sure is there any trigger keys for this. But I'm unable to disable the research pop ups once it is activated. Currently we close all the excel files and reopen them only then the pane is disabled.
Is there any way to disable the pane permanently?
- Subscribe to RSS feed
Report abuse
Reported content has been submitted
Replies (2)
Start Excel.
Press Alt+F11 to activate the Visual Basic Editor.
Press Ctrl+G to activate the Immediate window.
Enter the following line, or copy/paste it from this post into the Immediate window: Application.CommandBars("Research").Enabled = False
With the insertion point anywhere in the line, press Enter.
Press Alt+F4 to close the Visual Basic Editor.
The Research task pane shouldn't appear any more.
12 people found this reply helpful
Was this reply helpful? Yes No
Sorry this didn't help.
Great! Thanks for your feedback.
How satisfied are you with this reply?
Thanks for your feedback, it helps us improve the site.
Thanks for your feedback.
- Microsoft Agent |
It could be add-ins on your Excel.
Try disable all the add-ins.

Question Info
- For business
- Norsk Bokmål
- Ελληνικά
- Русский
- עברית
- العربية
- ไทย
- 한국어
- 中文(简体)
- 中文(繁體)
- 日本語

Excel at work, start a family, be beautiful — How Latinas feel the pressure to do it all
M ost Latinas feel pressure to play a key role in several aspects of their lives, including succeeding at work, caring for children and doing the cooking and cleaning at their houses, according to a new report by the Pew Research Center.
Concretely, two in three respondents said they felt pressure to excel at work at some point. 16% said that was the case for them "extremely often." 51% felt pressure to provide care for children in their family, with 16% checking the extremely often box as well, but fewer claiming to have this feeling very or somewhat often.
An even larger majority said they face pressure to do the cooking and cleaning at home, with 43% answering they feel this a great deal. One in four said a fair amount and an additional 16% faces some pressure.
The report links the pressure with "traditional cultural values carried over from Latin America," something that may have led them to "produce pressure from family or a community to place the needs of others ahead of their own, be passive or subordinate to others, or be virtuous or chaste."
Latinas say men feel these pressures too, but they are much less likely than women. No response category for men had more than 37% of positive answers, whereas no answer for women had less than 39%.
The category with the most positive answers for men (37%) was "being beautiful/handsome," whereas 62% of women reported the same pressure. The largest contrast involves the cooking and cleaning at home, with 68% of women saying this compared to 19% for men.
"Hispanic men generally agree that Hispanic women face more pressure than Hispanic men to do things associated with gender roles for women. For example, 57% of Hispanic men say Hispanic women face pressure to cook and clean at home, compared with 18% who say Hispanic men face this pressure."
Latinas born in the U.S. are far more likely than immigrants to feel these kinds of pressure. Out of five categories listed for this section, including getting married and having children, having few sexual partners and being pleasant, the former reported more pressure than the latter in all.
Looking at age differences, "Latinas who are young adults, college graduates, U.S. born, Democrats or don't have children are more likely to say that sexism against women at work is at least a somewhat big problem."
These feelings, however, don't mean respondents are unhappy. "88% of Latinas are either extremely or very satisfied (56%) or somewhat satisfied (32%) with their family life. And 86% say they are extremely or very happy (43%) or somewhat happy (43%) with how things are going in their lives these days," Pew detailed.
Related Articles
- Latino men seen as largest group of 'diverse' voters who support Trump in a matchup with Biden
- 2024 Elections in Florida: 72% of Latinas, Black and Asian women support abortion access, poll says

- SUGGESTED TOPICS
- The Magazine
- Newsletters
- Managing Yourself
- Managing Teams
- Work-life Balance
- The Big Idea
- Data & Visuals
- Reading Lists
- Case Selections
- HBR Learning
- Topic Feeds
- Account Settings
- Email Preferences
Research: What Companies Don’t Know About How Workers Use AI
- Jeremie Brecheisen

Three Gallup studies shed light on when and why AI is being used at work — and how employees and customers really feel about it.
Leaders who are exploring how AI might fit into their business operations must not only navigate a vast and ever-changing landscape of tools, but they must also facilitate a significant cultural shift within their organizations. But research shows that leaders do not fully understand their employees’ use of, and readiness for, AI. In addition, a significant number of Americans do not trust business’ use of AI. This article offers three recommendations for leaders to find the right balance of control and trust around AI, including measuring how their employees currently use AI, cultivating trust by empowering managers, and adopting a purpose-led AI strategy that is driven by the company’s purpose instead of a rules-heavy strategy that is driven by fear.
If you’re a leader who wants to shift your workforce toward using AI, you need to do more than manage the implementation of new technologies. You need to initiate a profound cultural shift. At the heart of this cultural shift is trust. Whether the use case for AI is brief and experimental or sweeping and significant, a level of trust must exist between leaders and employees for the initiative to have any hope of success.
- Jeremie Brecheisen is a partner and managing director of The Gallup CHRO Roundtable.
Partner Center
Cyber students excel in research, contests

Article By: Clark Leonard
University of North Georgia (UNG) cybersecurity students excelled in competitions this spring and in having their research presented at conferences.
The students took third place overall at the National Cyber Exercise (NCX) hosted by the National Security Agency (NSA) at the Maritime Conference Center near Baltimore, Maryland. UNG was the top in-person team at the event with the U.S. Military Academy at West Point and the U.S. Air Force Academy, the highest finishers, participating remotely.

UNG beat out the U.S. Coast Guard Academy, the U.S. Naval Academy, and the senior military colleges, including Norwich University, Texas A&M University, The Citadel, Virginia Military Institute, and Virginia Tech.
UNG's Elite Team placed second overall in the final Cyber Combat Exercise.
Cadet Matthew Perrino, a senior from Woodstock, Georgia, pursuing a degree in cybersecurity , was grateful to see the hard work of his group pay off at NCX. It reinforced the need for teamwork in the profession.
"Leading side by side is the best way to lead in cyber. You can't just tell people what to do," Perrino said. "You have to go in there and help them and work on projects together."
Paul Kim, a senior from Suwanee, Georgia, pursuing a degree in cybersecurity, also enjoyed the communal aspect of the competition and the way it pushed him out of his comfort zone.
"Don't prevent yourself from becoming better. People are too scared to fail or break boundaries that they feel confined to," Kim said. "I have realized I could reach out to the Institute for Cyber Operations and others."
UNG’s 21-student roster rotated in and out across three teams in four half-day exercises, capped off by UNG's NCX Elite Team that finished second in the Cyber Combat Exercise. That Elite Team included Kim, Sawyer Shepherd, Tyler Vaughan, Wolf Helm, and James Booker.
UNG students also had their research reach wide audiences at major conferences.
Cooper Warrington, a May graduate with a degree in cybersecurity, won the Best Application of Theory Award at the Northeast Decision Sciences Institute, held in Cambridge, Massachusetts. Dr. Tamirat Abegaz , associate professor of computer science, presented Warrington's paper, "A Comparative Analysis of ChatGPT, Bard, Snapchat, Hugging, and Perplexity on Unintentional Biases," on his behalf.
"After being nervous for a whole semester, it felt really good to win the award," Warrington, a Flowery Branch, Georgia, resident, said. "This experience has helped my confidence."
Abegaz also presented student Douglas Sausser's paper, "Exploring Evasion Attacks & Adversarial Defenses," at the conference.

Students Andrew Clements, who is pursuing a degree in cybersecurity, and Tyler Lurie, who is pursuing a Master of Science in computer science , each presented at International Academy of Business Disciplines Conference in Las Vegas, Nevada, in a session chaired by Dr. Jason Porter , UNG associate professor of computer science.
Clements presented with Abegaz and Dr. Bryson Payne , professor of computer science and coordinator of student cyber programs, on "Anomaly Detection: Distinguishing AI-Generated Work from Student-Created Submissions." Lurie presented with Payne on "The Weaknesses of Multi-Factor Authentication: Why a New Approach to Account Security Is Needed."
Zachary Simmons, a senior from Stockbridge, Georgia, pursuing a degree in cybersecurity, was one of 15 UNG students to earn scholarships for SANS Institute cybersecurity training through their strong finishes in the Cyber FastTrack competition. He already has two SANS cyber certifications and looks forward to gaining more through the scholarship. His combination of a strong Cyber FastTrack finish and already having some certifications earned him scholar with honors status, a distinction also reached by Kim and Austin Sanders.
"The SANS courses help you learn so much," Simmons said.
Payne pointed to the immense value professionally and monetarily of the SANS cyber training scholarships.
"The great thing about the Cyber FastTrack competition was that it provided our winning scholars with free SANS training and certification vouchers," Payne said. "Our cyber students carry these industry-leading certifications through graduation and into exciting, high-paying careers in government, military and private companies in Georgia and across the country."
UNG is designated by the NSA and the Department of Homeland Security as a National Center of Academic Excellence in Cyber Defense.
The mission of UNG's Institute for Cyber Operations is to develop highly capable cyber professionals and leaders for the private, nonprofit, military, and government sectors. UNG accomplishes this through innovative co-curricular opportunities, interdisciplinary research in emerging threats and solutions, relevant community outreach, and fostering a sustainable ecosystem to support cyber operations education.

Fortune ranks part-time MBA second in state

Student wins scholarship from supply chain group

Bootcamp teaches cadets about logistics
- Login/Settings

Temp Research Assistant
Categories: Research
Department: Dean's Office CNPD
- Grand Forks, North Dakota, United States
- Remote, North Dakota, United States
- Temporary Staff
- Closing on: May 21 2024
Salary/Position Classification
- $19-$20 Hourly, Non-Exempt (Eligible for overtime)
- 5-10 hours per week
- 100% Remote Work Availability: Yes
- Hybrid Work Availability: Yes
Purpose of Position
This position is needed to assist with activities required to meet a grant's objectives.
Duties & Responsibilities
- Assist in database searches and literature reviews/summaries
- Assist in preparing and submitting IRB applications
- Data cleaning/coding; working in excel to clean and code a large set of variables and preparing data for statistical software like SPSS, Plus
- Basic data analysis
- Assist with proofing and copyediting manuscripts/proposals.
- Assist with creating professional presentation materials, including PowerPoints, to disseminate report findings to stakeholders and/or conference presentations.
- Attend meetings with PI and other colleagues, if necessary
- Commitment to the UND CNPD’s mission to provide excellent and collaborative education, scholarship, and service to advance human well-being for all, with an emphasis on rural and underserved populations.
Required Competencies
- Excellent and accountable written and verbal communication skills
- High level of organizational skills to assist with research activities in a timely manner
- Proficiency in conducting database searches and literature reviews
- Experience working with manipulating data in excel and/or other statistical software programs
- Creativity in thinking and initiative
- Ability to interact well with diverse populations, including faculty and staff
Minimum Requirements
- Master's degree in Social Work or a related discipline
- Successful completion of a Criminal History Background Check
In compliance with federal law, all persons hired will be required to verify identity and eligibility to work in the US and to complete the required employment eligibility verification form upon hire. This position does not support visa sponsorship for continued employment.
Please submit your application before the application deadline.
Please note, all employment postings close at 11:55pm CST. Part-time/Temporary positions are posted for a minimum of 3 business days.
Want to be notified of similar opportunities?
Thank you for your interest in applying to the University of North Dakota
Other UND Career Openings
Clinical assistant professor, master of arts online counseling, research assistant-dr. jielun zhang, additional information.
Find out why Grand Forks is Cooler .
All information listed in this position announcement will be used by Human Resources, the Hiring Department, and EO/Title IX for screening, interviewing and selection purposes.
Please email the Human Resources Department at [email protected] or contact us by phone at 701.777.4226. If you anticipate needing any type of accommodation to participate in any portion of the University's employment process, including completion of the online application process, please contact our office in advance of your participation or visit.
Veteran’s Preference
Veterans claiming preference must submit all proof of eligibility by the closing date. Proof of eligibility includes a DD-214 or a copy of NGB 22 from National Guard or Reserve (with a unit located in ND) or certification from the applicant's unit command that the individual is expected to be discharged or released from active duty in the uniformed services under other than dishonorable conditions not later than one hundred twenty days after the date of the submission of the certification. If claiming disabled veteran status, proof of eligibility includes a DD-214 and a current letter of disability dated within the past year.
Confidentiality of Application Materials
Pursuant to NDCC 44-04-18.27, applications and any records related to the applications that identify an applicant are confidential, except records related to the finalists of the position, which are open to the public after the search committee has identified the top three or more finalists who will be invited to campus.
EEO Statement
The University of North Dakota is an Affirmative Action/Equal Opportunity Employer. All qualified applicants will receive consideration for employment without regard to race, color, religion, sex, sexual orientation, gender identity, national origin, disability or other protected characteristic. Women, minorities, veterans, individuals with disabilities, and members of other underrepresented groups are especially encouraged to apply. Applicants are invited to provide information regarding their gender, race and/or ethnicity, veteran’s status and disability status as part of the application process. This information will remain confidential and separate from your application.
Clery Statement
In compliance with the Jeanne Clery Disclosure of Campus Security Policy and Campus Crime Statistics Act, the University of North Dakota publishes an Annual Security and Fire Safety Report. The report includes the university’s policies, procedures, and programs concerning safety and security, as well as three years of crime statistics for our campus. As a prospective employee, you are entitled to a copy of this report. The report and statistical data can be found online at UND.edu. You may also request a paper copy of the report from the UND Police Department located at 3851 Campus Road, Grand Forks, ND, 58202.
This website uses cookies.
We use cookies to personalize content such as job recommendations, and to analyze our traffic. You consent to our cookies if you click "I Accept". If you click on "I Do Not Accept", then we will not use cookies but you may have a deteriorated user experience. You can change your settings by clicking on the Settings link on the top right of the device
Numbers, Facts and Trends Shaping Your World
Read our research on:
Full Topic List
Regions & Countries
- Publications
- Our Methods
- Short Reads
- Tools & Resources
Read Our Research On:
- A Majority of Latinas Feel Pressure To Support Their Families or To Succeed at Work
Expectations to excel at work and to do housework, be beautiful and start a family are top pressures
Table of contents.
- The impact of gender, Hispanic identity and skin color on the lives of Latinas
- 2. Pressures Latinas face in their lives
- 3. Life satisfaction and sources of joy for Latinas
- Acknowledgments
- The American Trends Panel survey methodology

Pew Research Center surveyed 5,078 Hispanic adults, including 2,600 Hispanic women, in an effort to better understand Latinas’ life experiences, the pressures they face and where they find joy. The survey was conducted from Nov. 6 to Nov. 19, 2023, and includes 1,524 respondents from the Center’s American Trends Panel and an additional 3,554 from Ipsos’ KnowledgePanel.
Respondents on both panels are recruited through national, random sampling of residential addresses. Recruiting panelists by mail ensures that nearly all U.S. adults have a chance of selection. This gives us confidence that any sample can represent the whole population (see our Methods 101 explainer on random sampling). For more information on this survey, refer to its methodology and questionnaire .
The terms Hispanic and Latino are used interchangeably in this report.
The terms Latinas and Hispanic women are used interchangeably throughout this report to refer to U.S. adult women who self-identify as Hispanic or Latino, regardless of their racial identity.
Foreign born refers to persons born outside of the 50 U.S. states or the District of Columbia. For the purposes of this report, foreign born also refers to those born in Puerto Rico. Although individuals born in Puerto Rico are U.S. citizens by birth, they are grouped with the foreign born because they are born into a Spanish-dominant culture and because on many points their attitudes, views and beliefs are much closer to those of Hispanics born outside the U.S. than to Hispanics born in the 50 U.S. states or D.C., even those who identify themselves as being of Puerto Rican origin.
The terms foreign born and immigrant are used interchangeably in this report. Immigrants are also considered first-generation Americans.
U.S. born refers to persons born in the 50 U.S. states or D.C.
Second generation refers to people born in the 50 U.S. states or D.C. with at least one immigrant parent.
Third or higher generation refers to people born in the 50 U.S. states or D.C., with both parents born in the 50 U.S. states or D.C.
Throughout this report, Democrats are respondents who identify politically with the Democratic Party or those who are independent or identify with some other party but lean toward the Democratic Party. Similarly, Republicans are those who identify politically with the Republican Party and those who are independent or identify with some other party but lean toward the Republican Party.
More than half of Latinas say they often feel pressure to provide for their loved ones at home or succeed in their jobs, mirroring the life stressors experienced by women across the United States today.
Latinas feel cross-pressured in other ways too, as they juggle cultural expectations around gender roles rooted in Latin America and those rooted in the U.S. Majorities of Latinas say that U.S. Hispanic women face pressure to do housework, be beautiful and start families.

Despite these life pressures, 88% of Latinas are either extremely or very satisfied (56%) or somewhat satisfied (32%) with their family life. And 86% say they are extremely or very happy (43%) or somewhat happy (43%) with how things are going in their lives these days.
At 22.2 million, Latinas account for 17% of all adult women in the U.S. today. The population grew 5.6 million from 2010 to 2022, the largest increase of any major female racial or ethnic group.
Moreover, most Latina adults have recent immigrant connections, with 77% being either immigrants themselves (52%) or having at least one immigrant parent (25%). 1
Some Latinas in the U.S. grow up with traditional cultural values carried over from Latin America. This can produce pressure from family or a community to place the needs of others ahead of their own, be passive or subordinate to others, or be virtuous or chaste – characteristics related to marianismo . At the same time, some Latinas may also feel pressure to achieve success in their own right in academics or a career .
These findings emerge from Pew Research Center’s bilingual National Survey of Latinos, conducted Nov. 6-19, 2023, among 5,078 Hispanic adults. The survey explores what it’s like to be a Latina in the U.S. today.
In addition to life pressures ( Chapter 2 ), the report explores Latinas’ views on sexism against women in media, schools, family and the workplace, and their experiences with harassment and discrimination ( Chapter 1 ). Other topics include Latinas’ views of their general happiness and life satisfaction and where they find joy in life ( Chapter 3 ).
Pressures Latinas say they face at home and work

- 53% of Latinas say they often feel pressure to support their family in some way, by caring for children or elderly family members, supporting their family financially or living close to family.
- 39% of Latinas say they often feel pressure to be successful in their job or career.
- Overall, 63% of Latinas say they often feel family pressures or work pressures.
Hispanic men also feel life pressures. About half (49%) of Hispanic men say they often feel pressure to support their family in some way, and 40% say they face pressure to be successful at work. Overall, 59% of Hispanic men say they often feel pressure from family or work.

However, Latinas are more likely to say Hispanic women face pressures such as cooking and cleaning at home, being pleasant to others, and starting a family than to say this about Hispanic men. Among Latinas:
- 68% of Latinas say Hispanic women face a great deal or fair amount of pressure to cook and clean at home, compared with 19% who say the same is true for Hispanic men.
- 62% say Hispanic women face pressure to be beautiful, such as by dressing nicely, wearing makeup or doing their hair and nails. By comparison, 37% of Latinas say Hispanic men face pressure to be handsome, such as by dressing nicely or styling their hair.
- 56% say Hispanic women face pressure to get married and have children, while 36% say the same of Hispanic men.
Hispanic men generally agree that Hispanic women face more pressure than Hispanic men to do things associated with gender roles for women. For example, 57% of Hispanic men say Hispanic women face pressure to cook and clean at home, compared with 18% who say Hispanic men face this pressure.
Among Latina adults, those who are U.S. born are more likely than immigrants to say Hispanic women as a group face pressure to do things tied to idealized gender roles.

- 66% of U.S.-born Latinas say Hispanic women face a great deal or fair amount of pressure to get married and have children, compared with 47% of Latina immigrants who say U.S. Hispanic women face these pressures.
- 76% of U.S.-born Latinas say Hispanic women in the U.S. face a great deal or fair amount of pressure to cook and clean at home, compared with 59% of immigrant Latinas.
- 68% of U.S.-born Latinas say Hispanic women face a great deal or fair amount of pressure to be beautiful, compared with 56% of immigrant Latinas.

About half of Hispanic women say sexism against women is a problem in different settings, including at work and in entertainment media. Hispanic men are less likely to say so.
- 52% of Hispanic women say sexism against women is at least a somewhat big problem in the workplace, compared with 44% of Hispanic men.
- 48% of Hispanic women say sexism against women is a problem in schools, while 37% of Hispanic men say this.
- Among English speakers, 50% of Hispanic women say sexism against women is a problem in English-language music, compared with 40% of Hispanic men. 2
- Among Hispanic adults, 47% of women say sexism against women is a problem in English-language movies and TV, versus 36% of men.
- Among Spanish speakers, 46% of Hispanic women say sexism against women is a problem in Spanish-language movies and TV, compared with 36% of Hispanic men. 3
Latinas’ views vary by age on pressures, sexism and harassment
Younger Latinas are more likely than older Latinas to say:
- They often face pressure to succeed at work or live close to their family ( Chapter 2 ).
- Sexism against women is a big problem in the workplace ( Chapter 1 ).
- They have experienced harassment or discrimination in the past year ( Chapter 1 ).
For new research on the economic gains Latinas have made in the last two decades, read “ Half of Latinas Say Hispanic Women’s Situation Has Improved Over the Past Decade, Expect More Gains .”
- Latinas’ population size and growth rate from 2010 to 2022 were calculated using the 2010 and 2022 American Community Surveys through IPUMS. Latinas’ shares that are foreign born or second generation were calculated using the 2023 Current Population Survey ASEC, also through IPUMS. ↩
- Asked only of those who say they can carry on a conversation in English at least “a little.” ↩
- Asked only of those who say they can carry on a conversation in Spanish at least “a little.” ↩
Sign up for our weekly newsletter
Fresh data delivery Saturday mornings
Sign up for The Briefing
Weekly updates on the world of news & information
- Economics, Work & Gender
- Gender & Work
- Gender Equality & Discrimination
- Gender Roles
- Happiness & Life Satisfaction
- Hispanic/Latino Identity
- Hispanics/Latinos
Half of Latinas Say Hispanic Women’s Situation Has Improved in the Past Decade and Expect More Gains
How hispanic americans get their news, latinos’ views on the migrant situation at the u.s.-mexico border, about 1 in 10 restaurants in the u.s. serve mexican food, key facts about hispanic eligible voters in 2024, most popular, report materials.
1615 L St. NW, Suite 800 Washington, DC 20036 USA (+1) 202-419-4300 | Main (+1) 202-857-8562 | Fax (+1) 202-419-4372 | Media Inquiries
Research Topics
- Age & Generations
- Coronavirus (COVID-19)
- Economy & Work
- Family & Relationships
- Gender & LGBTQ
- Immigration & Migration
- International Affairs
- Internet & Technology
- Methodological Research
- News Habits & Media
- Non-U.S. Governments
- Other Topics
- Politics & Policy
- Race & Ethnicity
- Email Newsletters
ABOUT PEW RESEARCH CENTER Pew Research Center is a nonpartisan fact tank that informs the public about the issues, attitudes and trends shaping the world. It conducts public opinion polling, demographic research, media content analysis and other empirical social science research. Pew Research Center does not take policy positions. It is a subsidiary of The Pew Charitable Trusts .
Copyright 2024 Pew Research Center
Research Finance Analyst II, Research Operations
Research administration.
- 1 Boston Medical Center Place, Boston, Massachusetts
Position: Research Finance Analyst II, Finance Administration
Location: Boston, MA
Schedule: 40 hours per week, Hybrid
At Boston Medical Center (BMC), our diverse staff works together for one goal — to provide exceptional and equitable care to improve the health of the people of Boston. Our bold vision to transform health care is powered by our respect for our patients and our commitment to ensure everyone who comes through our doors has a positive experience.
You’ll find a supportive work environment at BMC, with rich opportunities throughout your career for training, development, and growth and where you’ll have the tools you need to take charge of your own practice environment.
POSITION SUMMARY:
The Research Finance Analyst II is the key sponsored program financial contact for department administrators, principal investigators and BMC central research administration related to monitoring, controlling, and reporting of grants and contracts. The position performs, on a daily basis, analysis of accounts and communication with the BMC research community, sponsors and central BMC research administration personnel. The Research Finance Analyst II is responsible for monitoring and communicating about the fiscal management of grants and contracts in accordance with government regulations, donor requirements, and Hospital policy.
JOB RESPONSIBILITIES:
- The Research Finance Analyst II will be assigned a sponsored projects portfolio, for which he or she performs all grant related post-award functions according to the terms and conditions of the sponsor, including, award setup and update, budget and expense analysis, monthly invoicing, and financial reporting.
- Responsible for communicating with investigators, department administrators regarding post-award financial management of sponsored funds, including spending versus budget, unbilled and billed amounts, aged receivables/collection items, un-reconciled accounts, and deficits. Meets to review status of accounts.
- Performs all financial closeout functions according to the terms and conditions of the sponsor and Hospital policy, including, reconciliation of the grant, preparation and submission of financial reports, final invoicing, purchase order liquidations, carryover of available funds, and AR follow-up.
- As necessary communicates with sponsors for problem resolution, outstanding receivables, budget adjustments and information gathering.
- May be responsible for: shared inbox management, accounts receivable management, vendor invoices/uploads, processing journal entries, purchase order management, LOC draw prep, BU salary approvals and monthly invoice/upload, FFR and grant ending notifications, and subrecipient invoice review and payment.
- Assists in supporting internal and external sponsor audits, pulling together supporting documentation and liaising with department staff to meet audit needs.
(The above statements in this job description are intended to depict the general nature and level of work assigned to the employee(s) in this job. The above is not intended to represent an exhaustive list of accountable duties and responsibilities required).
JOB REQUIREMENTS
- BS/BA or equivalent work experience preferred, preferably in Accounting, Finance, or Business
EXPERIENCE:
- Requires two to five years of relevant work experience, preferably in an Accounting or Financial role
KNOWLEDGE AND SKILLS:
Requires strong computer skills, including a comprehensive knowledge of Microsoft Office, particularly Excel
- Individual should have strong interpersonal skills with a high degree of analytical ability and capable of communicating effectively, both verbally and written
- The ideal candidate will possess strong deductive reasoning skills and the ability to work both independently and as part of a team are required
JOB BENEFITS:
- Competitive pay
- Tuition reimbursement and tuition remission programs
- Highly subsidized medical, dental, and vision insurance options
- Career Advancement/Professional Development: Access a wealth of ongoing training and development opportunities that will not only enhance your skills but also expand your knowledge base especially for individuals pursuing careers in medicine or biomedical research.
- Pioneering Research: Engage in groundbreaking research projects that are driving the forefront of biomedical science.
ABOUT THE DEPARTMENT:
As the primary teaching hospital for Boston University Chobanian & Avedisian School of Medicine and BU schools of public health and dentistry, intellectual rigor shapes our inquiries. Our research is led by a belief that skin color, zip code, and financial circumstances shouldn’t dictate health.
Boston Medical Center is an Equal Opportunity/Affirmative Action Employer. If you need accommodation for any part of the application process because of a medical condition or disability, please send an e-mail to [email protected] or call 617-638-8582 to let us know the nature of your request.
Equal Opportunity Employer/Disabled/Veterans
Privacy policy
By clicking Submit, you acknowledge that you are willing to receive messages from Boston Medical Center relating to the status of your application or other recruitment related information to any mobile / cell phone number entered in the form above. You can easily opt-out of receiving messages by replying STOP to any messages you receive.
Not the right fit? Check out these other jobs
Scientific writer/editor, office of the chief scientific officer, patient hospitality service rep, food and nutrition (40hrs rotating day/eves and weekends), patient hospitality service rep, food and nutrition (40hrs rotating day/eves), project management specialist, central processing technician ii (40 hours, evenings), refer a friend.
Your information:
Apply for this job now
EEO & Accommodation Statement Boston Medical Center is an equal employment/affirmative action employer. We ensure equal employment opportunities for all, without regard to race, color, religion, sex, national origin, age, disability, veteran status, sexual orientation, gender identity and/or expression or any other non-job-related characteristic. If you need accommodation for any part of the application process because of a medical condition or disability, please send an e-mail to [email protected] or call 617-638-8582 to let us know the nature of your request
E-Verify Program Boston Medical Center participates in the Electronic Employment Verification Program. As an E-Verify employer, prospective employees of BMC must complete a background check and receive medical clearance before beginning their employment at the hospital.
Federal Trade Commission Statement: According to the FTC, there has been a rise in employment offer scams. Our current job openings are listed on our website and applications are received only through our website. We do not ask or require downloads of any applications, or “apps” job offers are not extended over text messages or social media platforms. We do not ask individuals to purchase equipment for or prior to employment. To avoid becoming a victim of an employment offer scam, please follow these tips from the FTC: FTC Tips
Join the BMC Talent Community
Before you go, don't forget to join our talent community!
We use cookies to make your interactions with our website more meaningful. They help us better understand how our websites are used, so we can tailor content for you. For more information about the different cookies we are using, read the Privacy Statement . By continuing to navigate the site, you agree to the use of cookies on our behalf.
IMAGES
VIDEO
COMMENTS
Data Analysis Tools in Excel. Excel is a powerful tool that can be used for a wide range of research tasks, including data analysis. In this chapter, we will explore some key Excel functions and formulas that are particularly relevant to research, as well as how to use PivotTables for summarizing and analyzing data, and how to leverage the Analysis ToolPak for advanced statistical analysis.
Dr. Brookfield was a Sage Research Methods Community Mentor in Residence in 2021. Microsoft Excel is a spreadsheet software which allows users to input and analyse data. It also enables users to create tables, graphs and even infographics to effectively present research findings. Microsoft Excel can be helpful at all stages of a research project.
The first step in any scientific research and analysis is to manage data effectively. Excel allows users to store and organize data in spreadsheets, making it easy to work with. To manage data effectively, users can create tables and charts, add formulas, and use conditional formatting to highlight important information. Data Analysis.
Microsoft Excel can be a useful platform to enter and maintain research study data. Excel is fairly easy to learn and use. Researchers can use Excel's simple statistical and plotting functions to help gain insight into their data. However, most research projects require more extensive statistical techniques that can be most easily performed ...
Simply select a cell in a data range > select the Analyze Data button on the Home tab. Analyze Data in Excel will analyze your data, and return interesting visuals about it in a task pane. If you're interested in more specific information, you can enter a question in the query box at the top of the pane, and press Enter.
However, Microsoft Excel can also be used to aid the analysis of qualitative data. Specifically, it can help you organise and sort large amounts of data. For example, once you have transcribed your qualitative data, it can be useful to create a table summarising your codes or themes (see example below). You can then use the filter function in ...
Be careful of text IDs with preceding zeros (e.g., 0023817). Excel likes to throw these zeros away. One must make the column a 'text' format (rather than general, number, etc) to keep it from doing this. Compustat's unique ID named gvkey is such a variable. Don't hand make a variable that can be created in a program.
As the Excel team works to leverage new areas of computer science - advancements in programming languages, NLP, Artificial Intelligence, Machine Learning - they turn to Microsoft Research both to leverage the incredible work done in the organization as well as to help co-create a vision for what Excel should look like years into the future.
Description. Statistical Analysis and Research using Excel is a blended learning program of theoretical knowledge with its application in Microsoft Excel software. This course is a base to all the analytical studies and research studies. It is focused on more industry relevant examples and situations, where in you learn how you actually need to ...
Preview. Providing step-by-step instructions for how to use Microsoft Excel for doing statistics, Charlotte Brookfield discusses different stages of the research process, from first planning to writing and presenting your research. With a focus on conducting robust data analysis, the book is reassuring, clear and straightforward, helping you to:
I therefore add anything related to my work: books, policies, blog posts. Here are two pointers for your Major Spreadsheet: First, start early and add often. I add to my Major Spreadsheet whenever I come across an article pertinent to my research area (graduate students with mental health challenges and disabilities).
We developed a template, just for you. Now you can keep on top of your literature using our intuitive literature review spreadsheet-based catalogue template. The spreadsheet will not only keep everything organized; it will also provide a summary of key metrics. Download The Literature Catalogue Template (Free)
This is MS Excel Full Course | Analysis of a Research, Study or Survey in MS Excel (Part 1)In this video tutorial (Part 1), we discuss steps of a research or...
In your table, be sure to include the source name, author, page number (if available), and sections for the direct quotes or paraphrases you want to include. Below are templates you can use to organize your research using Word or Excel. Feel free to edit the template to organize sources in a way that works best for you.
To activate or remove research services, check or uncheck the check boxes you want, and then click OK. To add research services, click Add Services, select or type the Internet address for the service you want in the Address box, and then click Add. The service is automatically enabled for searching, and it will appear in the Search for list ...
Auto-suggest helps you quickly narrow down your search results by suggesting possible matches as you type.
We've collected ProjectManager's 15 best Excel spreadsheet templates for tracking that you can download and use for free. 1. Dashboard Template. A dashboard is how you keep track of your work, including the time spent on tasks, what you're spending and if you're making progress as planned. ProjectManager's free dashboard template for ...
Open Excel, and open a new empty file. Now press ALT+F11 keys to open the Visual Basic for Applications window. You now have a Visual Basic editor open. Press CTRL+G keys to open the Immediate Window. In that new window, paste the following: Application.CommandBars("Research").Enabled = False and press ENTER key; Save your work (CTRL+S)
Key Combination Triggers. Be aware that the Research Pane in Excel may appear when using certain key combinations like Ctrl+Whatever or Alt+Whatever. Even after disabling the Research Pane, it might still be accessed manually if not fully disabled.
In this Excel tutorial, you will find 13 ideal Excel sample data. These sample datasets will cover a wide variety of areas such as sales, finance, management, sports, movies, etc. so that you can get your preferred type of data. A set of sample data in Excel consists of multiple rows and columns. Each row represents a single observation and ...
After installing Kutools for Excel, please do as this: 1. Click Kutools > Show & Hide > View Options, see screemshot: 2. In the View Options dialog box, please check Disable research pane option under the Other box, see screenshot: 3. Then click Ok to close this dialog box, now, the Research Pane will be disabled, and it will not be displayed ...
Start Excel. Press Alt+F11 to activate the Visual Basic Editor. Press Ctrl+G to activate the Immediate window. With the insertion point anywhere in the line, press Enter. Press Alt+F4 to close the Visual Basic Editor. The Research task pane shouldn't appear any more. It could be add-ins on your Excel. Try disable all the add-ins.
Learn the fundamentals of using X data for academic research with tailored get-started guides. Or, take your current use of the API further with tutorials, code samples, and tools. Curated datasets. Free, no-code datasets are intended to make it easier for academics to study topics that are of frequent interest to the research community.
Concretely, two in three respondents said they felt pressure to excel at work at some point. 16% said that was the case for them "extremely often." 51% felt pressure to provide care for children ...
Three Gallup studies shed light on when and why AI is being used at work — and how employees and customers really feel about it. Leaders who are exploring how AI might fit into their business ...
Article By: Clark Leonard. University of North Georgia (UNG) cybersecurity students excelled in competitions this spring and in having their research presented at conferences. The students took third place overall at the National Cyber Exercise (NCX) hosted by the National Security Agency (NSA) at the Maritime Conference Center near Baltimore ...
Salary/Position Classification $19-$20 Hourly, Non-Exempt (Eligible for overtime) 5-10 hours per week 100% Remote Work Availability: Yes Hybrid Work Availability: Yes Purpose of Position This position is needed to assist with activities required to meet a grant's objectives. Duties & Responsibilities Assist in database searches and literature reviews/summaries Assist in preparing and ...
Expectations to excel at work and to do housework, be beautiful and start a family are top pressures (Clockwise from top left: SDI Productions, Patricio Nahuelhual, adamkaz, PeopleImages, all via Getty Images) How we did this. Pew Research Center surveyed 5,078 Hispanic adults, including 2,600 Hispanic women, in an effort to better understand ...
Position: Research Finance Analyst II, Finance AdministrationLocation: Boston, MASchedule: 40 hours per week, HybridABOUT BMC:At Boston Medical Center (BMC), our diverse staff works together for one goal — to provide exceptional and equitable care to improve the health of the people of Boston. Our bold vision to transform health care is powered by our respect for our patients and our ...