
The Importance of Data Analysis in Research
Studying data is amongst the everyday chores of researchers. It’s not a big deal for them to go through hundreds of pages per day to extract useful information from it. However, recent times have seen a massive jump in the amount of data available. While it’s certainly good news for researchers to get their hands on more data that could result in better studies, it’s also no less than a headache.
Thankfully, the rising trend of data science in the past years has also meant a sharp rise in data analysis techniques . These tools and techniques save a lot of time in hefty processes a researcher has to go through and allow them to finish the work of days in minutes!
As a famous saying goes,
“Information is the oil of the 21st century , and analytics is the combustion engine.”
– Peter Sondergaard , senior vice president, Gartner Research.
So, if you’re also a researcher or just curious about the most important data analysis techniques in research, this article is for you. Make sure you give it a thorough read, as I’ll be dropping some very important points throughout the article.
What is the Importance of Data Analysis in Research?
Data analysis is important in research because it makes studying data a lot simpler and more accurate. It helps the researchers straightforwardly interpret the data so that researchers don’t leave anything out that could help them derive insights from it.
Data analysis is a way to study and analyze huge amounts of data. Research often includes going through heaps of data, which is getting more and more for the researchers to handle with every passing minute.
Hence, data analysis knowledge is a huge edge for researchers in the current era, making them very efficient and productive.
What is Data Analysis?
Once the data is cleaned , transformed , and ready to use, it can do wonders. Not only does it contain a variety of useful information, studying the data collectively results in uncovering very minor patterns and details that would otherwise have been ignored.
So, you can see why it has such a huge role to play in research. Research is all about studying patterns and trends, followed by making a hypothesis and proving them. All this is supported by appropriate data.
Further in the article, we’ll see some of the most important types of data analysis that you should be aware of as a researcher so you can put them to use.
The Role of Data Analytics at The Senior Management Level

From small and medium-sized businesses to Fortune 500 conglomerates, the success of a modern business is now increasingly tied to how the company implements its data infrastructure and data-based decision-making. According
The Decision-Making Model Explained (In Plain Terms)

Any form of the systematic decision-making process is better enhanced with data. But making sense of big data or even small data analysis when venturing into a decision-making process might
13 Reasons Why Data Is Important in Decision Making

Data is important in decision making process, and that is the new golden rule in the business world. Businesses are always trying to find the balance of cutting costs while
Types of Data Analysis: Qualitative Vs Quantitative
Looking at it from a broader perspective, data analysis boils down to two major types. Namely, qualitative data analysis and quantitative data analysis. While the latter deals with the numerical data, comprising of numbers, the former comes in the non-text form. It can be anything such as summaries, images, symbols, and so on.
Both types have different methods to deal with them and we’ll be taking a look at both of them so you can use whatever suits your requirements.
Qualitative Data Analysis
As mentioned before, qualitative data comprises non-text-based data, and it can be either in the form of text or images. So, how do we analyze such data? Before we start, here are a few common tips first that you should always use before applying any techniques.
Now, let’s move ahead and see where the qualitative data analysis techniques come in. Even though there are a lot of professional ways to achieve this, here are some of them that you’ll need to know as a beginner.
Narrative Analysis
If your research is based upon collecting some answers from people in interviews or other scenarios, this might be one of the best analysis techniques for you. The narrative analysis helps to analyze the narratives of various people, which is available in textual form. The stories, experiences, and other answers from respondents are used to power the analysis.
The important thing to note here is that the data has to be available in the form of text only. Narrative analysis cannot be performed on other data types such as images.
Content Analysis
Content analysis is amongst the most used methods in analyzing quantitative data. This method doesn’t put a restriction on the form of data. You can use any kind of data here, whether it’s in the form of images, text, or even real-life items.
Here, an important application is when you know the questions you need to know the answers to. Upon getting the answers, you can perform this method to perform analysis to them, followed by extracting insights from it to be used in your research. It’s a full-fledged method and a lot of analytical studies are based solely on this.
Grounded Theory
Grounded theory is used when the researchers want to know the reason behind the occurrence of a certain event. They may have to go through a lot of different use cases and comparing them to each other while following this approach. It’s an iterative approach and the explanations keep on being modified or re-created till the researchers end up on a suitable conclusion that satisfies their specific conditions.
So, make sure you employ this method if you need to have certain qualitative data at hand and you need to know the reason why something happened, based on that data.
Discourse Analysis
Discourse analysis is quite similar to narrative analysis in the sense that it also uses interactions with people for the analysis purpose. The only difference is that the focal point here is different. Instead of analyzing the narrative, the researchers focus on the context in which the conversation is happening.
The complete background of the person being questioned, including his everyday environment, is used to perform the research.
Quantitative Analysis
Quantitative analysis involves any kind of analysis that’s being done on numbers. From the most basic analysis techniques to the most advanced ones, quantitative analysis techniques comprise a huge range of techniques. No matter what level of research you need to do, if it’s based on numerical data, you’ll always have efficient analysis methods to use.
There are two broad ways here; Descriptive statistics and inferential analysis .
However, before applying the analysis methods on numerical data, there are a few pre-processing steps that need to be done. These steps are used to make the data ‘ready’ for applying the analysis methods.
Make sure you don’t miss these steps, or you will end up drawing biased conclusions from the data analysis. IF you want to know why data is the key in data analysis and problem-solving, feel free to check out this article here . Now, about the steps for PRE-PROCESSING THE QUANTITATIVE DATA .
Descriptive Statistics
Descriptive statistics is the most basic step that researchers can use to draw conclusions from data. It helps to find patterns and helps the data ‘speak’. Let’s see some of the most common data analysis techniques used to perform descriptive statistics .
Mean is nothing but the average of the total data available at hand. The formula is simple and tells what average value to expect throughout the data.
The median is the middle value available in the data. It lets the researchers estimate where the mid-point of the data is. It’s important to note that the data needs to be sorted to find the median from it.
The mode is simply the most frequently occurring data in the dataset. For example, if you’re studying the ages of students in a particular class, the model will be the age of most students in the class.
- Standard Deviation
Numerical data is always spread over a wide range and finding out how much the data is spread is quite important. Standard deviation is what lets us achieve this. It tells us how much an average data point is far from the average.
Related Article: The Best Programming Language for Statistics
Inferential Analysis
Inferential statistics point towards the techniques used to predict future occurrences of data. These methods help draw relationships between data and once it’s done, predicting future data becomes possible.
- Correlation
Correlation s the measure of the relationship between two numerical variables. It measures the degree of their relation, whether it is causal or not.
For example, the age and height of a person are highly correlated. If the age of a person increases, height is also likely to increase. This is called a positive correlation.
A negative correlation means that upon increasing one variable, the other one decreases. An example would be the relationship between the age and maturity of a random person.
Regression aims to find the mathematical relationship between a set of variables. While the correlation was a statistical measure, regression is a mathematical measure that can be measured in the form of variables. Once the relationship between variables is formed, one variable can be used to predict the other variable.
This method has a huge application when it comes to predicting future data. If your research is based upon calculating future occurrences of some data based on past data and then testing it, make sure you use this method.
A Summary of Data Analysis Methods
Now that we’re done with some of the most common methods for both quantitative and qualitative data, let’s summarize them in a tabular form so you would have something to take home in the end.
Before we close the article, I’d like to strongly recommend you to check out some interesting related topics:
That’s it! We have seen why data analysis is such an important tool when it comes to research and how it saves a huge lot of time for the researchers, making them not only efficient but more productive as well.
Moreover, the article covers some of the most important data analysis techniques that one needs to know for research purposes in today’s age. We’ve gone through the analysis methods for both quantitative and qualitative data in a basic way so it might be easy to understand for beginners.
Emidio Amadebai
As an IT Engineer, who is passionate about learning and sharing. I have worked and learned quite a bit from Data Engineers, Data Analysts, Business Analysts, and Key Decision Makers almost for the past 5 years. Interested in learning more about Data Science and How to leverage it for better decision-making in my business and hopefully help you do the same in yours.
Recent Posts
Causal vs Evidential Decision-making (How to Make Businesses More Effective)
In today’s fast-paced business landscape, it is crucial to make informed decisions to stay in the competition which makes it important to understand the concept of the different characteristics and...
Bootstrapping vs. Boosting
Over the past decade, the field of machine learning has witnessed remarkable advancements in predictive techniques and ensemble learning methods. Ensemble techniques are very popular in machine...

- Skip to main content
- Skip to primary sidebar
- Skip to footer
- QuestionPro

- Solutions Industries Gaming Automotive Sports and events Education Government Travel & Hospitality Financial Services Healthcare Cannabis Technology Use Case NPS+ Communities Audience Contactless surveys Mobile LivePolls Member Experience GDPR Positive People Science 360 Feedback Surveys
- Resources Blog eBooks Survey Templates Case Studies Training Help center
Home Market Research
Data Analysis in Research: Types & Methods

Content Index
Why analyze data in research?
Types of data in research, finding patterns in the qualitative data, methods used for data analysis in qualitative research, preparing data for analysis, methods used for data analysis in quantitative research, considerations in research data analysis, what is data analysis in research.
Definition of research in data analysis: According to LeCompte and Schensul, research data analysis is a process used by researchers to reduce data to a story and interpret it to derive insights. The data analysis process helps reduce a large chunk of data into smaller fragments, which makes sense.
Three essential things occur during the data analysis process — the first is data organization . Summarization and categorization together contribute to becoming the second known method used for data reduction. It helps find patterns and themes in the data for easy identification and linking. The third and last way is data analysis – researchers do it in both top-down and bottom-up fashion.
LEARN ABOUT: Research Process Steps
On the other hand, Marshall and Rossman describe data analysis as a messy, ambiguous, and time-consuming but creative and fascinating process through which a mass of collected data is brought to order, structure and meaning.
We can say that “the data analysis and data interpretation is a process representing the application of deductive and inductive logic to the research and data analysis.”
Researchers rely heavily on data as they have a story to tell or research problems to solve. It starts with a question, and data is nothing but an answer to that question. But, what if there is no question to ask? Well! It is possible to explore data even without a problem – we call it ‘Data Mining’, which often reveals some interesting patterns within the data that are worth exploring.
Irrelevant to the type of data researchers explore, their mission and audiences’ vision guide them to find the patterns to shape the story they want to tell. One of the essential things expected from researchers while analyzing data is to stay open and remain unbiased toward unexpected patterns, expressions, and results. Remember, sometimes, data analysis tells the most unforeseen yet exciting stories that were not expected when initiating data analysis. Therefore, rely on the data you have at hand and enjoy the journey of exploratory research.
Create a Free Account
Every kind of data has a rare quality of describing things after assigning a specific value to it. For analysis, you need to organize these values, processed and presented in a given context, to make it useful. Data can be in different forms; here are the primary data types.
- Qualitative data: When the data presented has words and descriptions, then we call it qualitative data . Although you can observe this data, it is subjective and harder to analyze data in research, especially for comparison. Example: Quality data represents everything describing taste, experience, texture, or an opinion that is considered quality data. This type of data is usually collected through focus groups, personal qualitative interviews , qualitative observation or using open-ended questions in surveys.
- Quantitative data: Any data expressed in numbers of numerical figures are called quantitative data . This type of data can be distinguished into categories, grouped, measured, calculated, or ranked. Example: questions such as age, rank, cost, length, weight, scores, etc. everything comes under this type of data. You can present such data in graphical format, charts, or apply statistical analysis methods to this data. The (Outcomes Measurement Systems) OMS questionnaires in surveys are a significant source of collecting numeric data.
- Categorical data: It is data presented in groups. However, an item included in the categorical data cannot belong to more than one group. Example: A person responding to a survey by telling his living style, marital status, smoking habit, or drinking habit comes under the categorical data. A chi-square test is a standard method used to analyze this data.
Learn More : Examples of Qualitative Data in Education
Data analysis in qualitative research
Data analysis and qualitative data research work a little differently from the numerical data as the quality data is made up of words, descriptions, images, objects, and sometimes symbols. Getting insight from such complicated information is a complicated process. Hence it is typically used for exploratory research and data analysis .
Although there are several ways to find patterns in the textual information, a word-based method is the most relied and widely used global technique for research and data analysis. Notably, the data analysis process in qualitative research is manual. Here the researchers usually read the available data and find repetitive or commonly used words.
For example, while studying data collected from African countries to understand the most pressing issues people face, researchers might find “food” and “hunger” are the most commonly used words and will highlight them for further analysis.
LEARN ABOUT: Level of Analysis
The keyword context is another widely used word-based technique. In this method, the researcher tries to understand the concept by analyzing the context in which the participants use a particular keyword.
For example , researchers conducting research and data analysis for studying the concept of ‘diabetes’ amongst respondents might analyze the context of when and how the respondent has used or referred to the word ‘diabetes.’
The scrutiny-based technique is also one of the highly recommended text analysis methods used to identify a quality data pattern. Compare and contrast is the widely used method under this technique to differentiate how a specific text is similar or different from each other.
For example: To find out the “importance of resident doctor in a company,” the collected data is divided into people who think it is necessary to hire a resident doctor and those who think it is unnecessary. Compare and contrast is the best method that can be used to analyze the polls having single-answer questions types .
Metaphors can be used to reduce the data pile and find patterns in it so that it becomes easier to connect data with theory.
Variable Partitioning is another technique used to split variables so that researchers can find more coherent descriptions and explanations from the enormous data.
LEARN ABOUT: Qualitative Research Questions and Questionnaires
There are several techniques to analyze the data in qualitative research, but here are some commonly used methods,
- Content Analysis: It is widely accepted and the most frequently employed technique for data analysis in research methodology. It can be used to analyze the documented information from text, images, and sometimes from the physical items. It depends on the research questions to predict when and where to use this method.
- Narrative Analysis: This method is used to analyze content gathered from various sources such as personal interviews, field observation, and surveys . The majority of times, stories, or opinions shared by people are focused on finding answers to the research questions.
- Discourse Analysis: Similar to narrative analysis, discourse analysis is used to analyze the interactions with people. Nevertheless, this particular method considers the social context under which or within which the communication between the researcher and respondent takes place. In addition to that, discourse analysis also focuses on the lifestyle and day-to-day environment while deriving any conclusion.
- Grounded Theory: When you want to explain why a particular phenomenon happened, then using grounded theory for analyzing quality data is the best resort. Grounded theory is applied to study data about the host of similar cases occurring in different settings. When researchers are using this method, they might alter explanations or produce new ones until they arrive at some conclusion.
LEARN ABOUT: 12 Best Tools for Researchers
Data analysis in quantitative research
The first stage in research and data analysis is to make it for the analysis so that the nominal data can be converted into something meaningful. Data preparation consists of the below phases.
Phase I: Data Validation
Data validation is done to understand if the collected data sample is per the pre-set standards, or it is a biased data sample again divided into four different stages
- Fraud: To ensure an actual human being records each response to the survey or the questionnaire
- Screening: To make sure each participant or respondent is selected or chosen in compliance with the research criteria
- Procedure: To ensure ethical standards were maintained while collecting the data sample
- Completeness: To ensure that the respondent has answered all the questions in an online survey. Else, the interviewer had asked all the questions devised in the questionnaire.
Phase II: Data Editing
More often, an extensive research data sample comes loaded with errors. Respondents sometimes fill in some fields incorrectly or sometimes skip them accidentally. Data editing is a process wherein the researchers have to confirm that the provided data is free of such errors. They need to conduct necessary checks and outlier checks to edit the raw edit and make it ready for analysis.
Phase III: Data Coding
Out of all three, this is the most critical phase of data preparation associated with grouping and assigning values to the survey responses . If a survey is completed with a 1000 sample size, the researcher will create an age bracket to distinguish the respondents based on their age. Thus, it becomes easier to analyze small data buckets rather than deal with the massive data pile.
LEARN ABOUT: Steps in Qualitative Research
After the data is prepared for analysis, researchers are open to using different research and data analysis methods to derive meaningful insights. For sure, statistical analysis plans are the most favored to analyze numerical data. In statistical analysis, distinguishing between categorical data and numerical data is essential, as categorical data involves distinct categories or labels, while numerical data consists of measurable quantities. The method is again classified into two groups. First, ‘Descriptive Statistics’ used to describe data. Second, ‘Inferential statistics’ that helps in comparing the data .
Descriptive statistics
This method is used to describe the basic features of versatile types of data in research. It presents the data in such a meaningful way that pattern in the data starts making sense. Nevertheless, the descriptive analysis does not go beyond making conclusions. The conclusions are again based on the hypothesis researchers have formulated so far. Here are a few major types of descriptive analysis methods.
Measures of Frequency
- Count, Percent, Frequency
- It is used to denote home often a particular event occurs.
- Researchers use it when they want to showcase how often a response is given.
Measures of Central Tendency
- Mean, Median, Mode
- The method is widely used to demonstrate distribution by various points.
- Researchers use this method when they want to showcase the most commonly or averagely indicated response.
Measures of Dispersion or Variation
- Range, Variance, Standard deviation
- Here the field equals high/low points.
- Variance standard deviation = difference between the observed score and mean
- It is used to identify the spread of scores by stating intervals.
- Researchers use this method to showcase data spread out. It helps them identify the depth until which the data is spread out that it directly affects the mean.
Measures of Position
- Percentile ranks, Quartile ranks
- It relies on standardized scores helping researchers to identify the relationship between different scores.
- It is often used when researchers want to compare scores with the average count.
For quantitative research use of descriptive analysis often give absolute numbers, but the in-depth analysis is never sufficient to demonstrate the rationale behind those numbers. Nevertheless, it is necessary to think of the best method for research and data analysis suiting your survey questionnaire and what story researchers want to tell. For example, the mean is the best way to demonstrate the students’ average scores in schools. It is better to rely on the descriptive statistics when the researchers intend to keep the research or outcome limited to the provided sample without generalizing it. For example, when you want to compare average voting done in two different cities, differential statistics are enough.
Descriptive analysis is also called a ‘univariate analysis’ since it is commonly used to analyze a single variable.
Inferential statistics
Inferential statistics are used to make predictions about a larger population after research and data analysis of the representing population’s collected sample. For example, you can ask some odd 100 audiences at a movie theater if they like the movie they are watching. Researchers then use inferential statistics on the collected sample to reason that about 80-90% of people like the movie.
Here are two significant areas of inferential statistics.
- Estimating parameters: It takes statistics from the sample research data and demonstrates something about the population parameter.
- Hypothesis test: I t’s about sampling research data to answer the survey research questions. For example, researchers might be interested to understand if the new shade of lipstick recently launched is good or not, or if the multivitamin capsules help children to perform better at games.
These are sophisticated analysis methods used to showcase the relationship between different variables instead of describing a single variable. It is often used when researchers want something beyond absolute numbers to understand the relationship between variables.
Here are some of the commonly used methods for data analysis in research.
- Correlation: When researchers are not conducting experimental research or quasi-experimental research wherein the researchers are interested to understand the relationship between two or more variables, they opt for correlational research methods.
- Cross-tabulation: Also called contingency tables, cross-tabulation is used to analyze the relationship between multiple variables. Suppose provided data has age and gender categories presented in rows and columns. A two-dimensional cross-tabulation helps for seamless data analysis and research by showing the number of males and females in each age category.
- Regression analysis: For understanding the strong relationship between two variables, researchers do not look beyond the primary and commonly used regression analysis method, which is also a type of predictive analysis used. In this method, you have an essential factor called the dependent variable. You also have multiple independent variables in regression analysis. You undertake efforts to find out the impact of independent variables on the dependent variable. The values of both independent and dependent variables are assumed as being ascertained in an error-free random manner.
- Frequency tables: The statistical procedure is used for testing the degree to which two or more vary or differ in an experiment. A considerable degree of variation means research findings were significant. In many contexts, ANOVA testing and variance analysis are similar.
- Analysis of variance: The statistical procedure is used for testing the degree to which two or more vary or differ in an experiment. A considerable degree of variation means research findings were significant. In many contexts, ANOVA testing and variance analysis are similar.
- Researchers must have the necessary research skills to analyze and manipulation the data , Getting trained to demonstrate a high standard of research practice. Ideally, researchers must possess more than a basic understanding of the rationale of selecting one statistical method over the other to obtain better data insights.
- Usually, research and data analytics projects differ by scientific discipline; therefore, getting statistical advice at the beginning of analysis helps design a survey questionnaire, select data collection methods , and choose samples.
LEARN ABOUT: Best Data Collection Tools
- The primary aim of data research and analysis is to derive ultimate insights that are unbiased. Any mistake in or keeping a biased mind to collect data, selecting an analysis method, or choosing audience sample il to draw a biased inference.
- Irrelevant to the sophistication used in research data and analysis is enough to rectify the poorly defined objective outcome measurements. It does not matter if the design is at fault or intentions are not clear, but lack of clarity might mislead readers, so avoid the practice.
- The motive behind data analysis in research is to present accurate and reliable data. As far as possible, avoid statistical errors, and find a way to deal with everyday challenges like outliers, missing data, data altering, data mining , or developing graphical representation.
LEARN MORE: Descriptive Research vs Correlational Research The sheer amount of data generated daily is frightening. Especially when data analysis has taken center stage. in 2018. In last year, the total data supply amounted to 2.8 trillion gigabytes. Hence, it is clear that the enterprises willing to survive in the hypercompetitive world must possess an excellent capability to analyze complex research data, derive actionable insights, and adapt to the new market needs.
LEARN ABOUT: Average Order Value
QuestionPro is an online survey platform that empowers organizations in data analysis and research and provides them a medium to collect data by creating appealing surveys.
MORE LIKE THIS

How Can I Help You? — Tuesday CX Thoughts
Jun 5, 2024

Why Multilingual 360 Feedback Surveys Provide Better Insights
Jun 3, 2024

Raked Weighting: A Key Tool for Accurate Survey Results
May 31, 2024

Top 8 Data Trends to Understand the Future of Data
May 30, 2024
Other categories
- Academic Research
- Artificial Intelligence
- Assessments
- Brand Awareness
- Case Studies
- Communities
- Consumer Insights
- Customer effort score
- Customer Engagement
- Customer Experience
- Customer Loyalty
- Customer Research
- Customer Satisfaction
- Employee Benefits
- Employee Engagement
- Employee Retention
- Friday Five
- General Data Protection Regulation
- Insights Hub
- Life@QuestionPro
- Market Research
- Mobile diaries
- Mobile Surveys
- New Features
- Online Communities
- Question Types
- Questionnaire
- QuestionPro Products
- Release Notes
- Research Tools and Apps
- Revenue at Risk
- Survey Templates
- Training Tips
- Uncategorized
- Video Learning Series
- What’s Coming Up
- Workforce Intelligence
Data Analysis in Quantitative Research
- Reference work entry
- First Online: 13 January 2019
- Cite this reference work entry

- Yong Moon Jung 2
1873 Accesses
2 Citations
Quantitative data analysis serves as part of an essential process of evidence-making in health and social sciences. It is adopted for any types of research question and design whether it is descriptive, explanatory, or causal. However, compared with qualitative counterpart, quantitative data analysis has less flexibility. Conducting quantitative data analysis requires a prerequisite understanding of the statistical knowledge and skills. It also requires rigor in the choice of appropriate analysis model and the interpretation of the analysis outcomes. Basically, the choice of appropriate analysis techniques is determined by the type of research question and the nature of the data. In addition, different analysis techniques require different assumptions of data. This chapter provides introductory guides for readers to assist them with their informed decision-making in choosing the correct analysis models. To this end, it begins with discussion of the levels of measure: nominal, ordinal, and scale. Some commonly used analysis techniques in univariate, bivariate, and multivariate data analysis are presented for practical examples. Example analysis outcomes are produced by the use of SPSS (Statistical Package for Social Sciences).
This is a preview of subscription content, log in via an institution to check access.
Access this chapter
- Available as PDF
- Read on any device
- Instant download
- Own it forever
- Available as EPUB and PDF
- Durable hardcover edition
- Dispatched in 3 to 5 business days
- Free shipping worldwide - see info
Tax calculation will be finalised at checkout
Purchases are for personal use only
Institutional subscriptions
Armstrong JS. Significance tests harm progress in forecasting. Int J Forecast. 2007;23(2):321–7.
Article Google Scholar
Babbie E. The practice of social research. 14th ed. Belmont: Cengage Learning; 2016.
Google Scholar
Brockopp DY, Hastings-Tolsma MT. Fundamentals of nursing research. Boston: Jones & Bartlett; 2003.
Creswell JW. Research design: qualitative, quantitative, and mixed methods approaches. Thousand Oaks: Sage; 2014.
Fawcett J. The relationship of theory and research. Philadelphia: F. A. Davis; 1999.
Field A. Discovering statistics using IBM SPSS statistics. London: Sage; 2013.
Grove SK, Gray JR, Burns N. Understanding nursing research: building an evidence-based practice. 6th ed. St. Louis: Elsevier Saunders; 2015.
Hair JF, Black WC, Babin BJ, Anderson RE, Tatham RD. Multivariate data analysis. Upper Saddle River: Pearson Prentice Hall; 2006.
Katz MH. Multivariable analysis: a practical guide for clinicians. Cambridge: Cambridge University Press; 2006.
Book Google Scholar
McHugh ML. Scientific inquiry. J Specialists Pediatr Nurs. 2007; 8 (1):35–7. Volume 8, Issue 1, Version of Record online: 22 FEB 2007
Pallant J. SPSS survival manual: a step by step guide to data analysis using IBM SPSS. Sydney: Allen & Unwin; 2016.
Polit DF, Beck CT. Nursing research: principles and methods. Philadelphia: Lippincott Williams & Wilkins; 2004.
Trochim WMK, Donnelly JP. Research methods knowledge base. 3rd ed. Mason: Thomson Custom Publishing; 2007.
Tabachnick, B. G., & Fidell, L. S. (2013). Using multivariate statistics. Boston: Pearson Education.
Wells CS, Hin JM. Dealing with assumptions underlying statistical tests. Psychol Sch. 2007;44(5):495–502.
Download references
Author information
Authors and affiliations.
Centre for Business and Social Innovation, University of Technology Sydney, Ultimo, NSW, Australia
Yong Moon Jung
You can also search for this author in PubMed Google Scholar
Corresponding author
Correspondence to Yong Moon Jung .
Editor information
Editors and affiliations.
School of Science and Health, Western Sydney University, Penrith, NSW, Australia
Pranee Liamputtong
Rights and permissions
Reprints and permissions
Copyright information
© 2019 Springer Nature Singapore Pte Ltd.
About this entry
Cite this entry.
Jung, Y.M. (2019). Data Analysis in Quantitative Research. In: Liamputtong, P. (eds) Handbook of Research Methods in Health Social Sciences. Springer, Singapore. https://doi.org/10.1007/978-981-10-5251-4_109
Download citation
DOI : https://doi.org/10.1007/978-981-10-5251-4_109
Published : 13 January 2019
Publisher Name : Springer, Singapore
Print ISBN : 978-981-10-5250-7
Online ISBN : 978-981-10-5251-4
eBook Packages : Social Sciences Reference Module Humanities and Social Sciences Reference Module Business, Economics and Social Sciences
Share this entry
Anyone you share the following link with will be able to read this content:
Sorry, a shareable link is not currently available for this article.
Provided by the Springer Nature SharedIt content-sharing initiative
- Publish with us
Policies and ethics
- Find a journal
- Track your research
Data Analysis
- Introduction to Data Analysis
- Quantitative Analysis Tools
- Qualitative Analysis Tools
- Mixed Methods Analysis
- Geospatial Analysis
- Further Reading

What is Data Analysis?
According to the federal government, data analysis is "the process of systematically applying statistical and/or logical techniques to describe and illustrate, condense and recap, and evaluate data" ( Responsible Conduct in Data Management ). Important components of data analysis include searching for patterns, remaining unbiased in drawing inference from data, practicing responsible data management , and maintaining "honest and accurate analysis" ( Responsible Conduct in Data Management ).
In order to understand data analysis further, it can be helpful to take a step back and understand the question "What is data?". Many of us associate data with spreadsheets of numbers and values, however, data can encompass much more than that. According to the federal government, data is "The recorded factual material commonly accepted in the scientific community as necessary to validate research findings" ( OMB Circular 110 ). This broad definition can include information in many formats.
Some examples of types of data are as follows:
- Photographs
- Hand-written notes from field observation
- Machine learning training data sets
- Ethnographic interview transcripts
- Sheet music
- Scripts for plays and musicals
- Observations from laboratory experiments ( CMU Data 101 )
Thus, data analysis includes the processing and manipulation of these data sources in order to gain additional insight from data, answer a research question, or confirm a research hypothesis.
Data analysis falls within the larger research data lifecycle, as seen below.
( University of Virginia )
Why Analyze Data?
Through data analysis, a researcher can gain additional insight from data and draw conclusions to address the research question or hypothesis. Use of data analysis tools helps researchers understand and interpret data.
What are the Types of Data Analysis?
Data analysis can be quantitative, qualitative, or mixed methods.
Quantitative research typically involves numbers and "close-ended questions and responses" ( Creswell & Creswell, 2018 , p. 3). Quantitative research tests variables against objective theories, usually measured and collected on instruments and analyzed using statistical procedures ( Creswell & Creswell, 2018 , p. 4). Quantitative analysis usually uses deductive reasoning.
Qualitative research typically involves words and "open-ended questions and responses" ( Creswell & Creswell, 2018 , p. 3). According to Creswell & Creswell, "qualitative research is an approach for exploring and understanding the meaning individuals or groups ascribe to a social or human problem" ( 2018 , p. 4). Thus, qualitative analysis usually invokes inductive reasoning.
Mixed methods research uses methods from both quantitative and qualitative research approaches. Mixed methods research works under the "core assumption... that the integration of qualitative and quantitative data yields additional insight beyond the information provided by either the quantitative or qualitative data alone" ( Creswell & Creswell, 2018 , p. 4).
- Next: Planning >>
- Last Updated: May 3, 2024 9:38 AM
- URL: https://guides.library.georgetown.edu/data-analysis

- Research Process
When Data Speak, Listen: Importance of Data Collection and Analysis Methods
- 3 minute read
- 17.2K views
Table of Contents
With the recent advent of digital tools, the rise in data manipulation has become a key challenge. And so, the scientific community has begun taking a more careful look at scientific malpractice involving data manipulation. But why are data so important in scientific research?
Role of data in science
Reliable data facilitates knowledge generation and reproducibility of key scientific protocols and experiments. For each step of a research project, from data collection to knowledge generation, researchers need to pay careful attention to data analysis to ensure that their results are robust.
In science, data are used to confirm or reject a hypothesis, which can fundamentally change the research landscape. Thus, with respect to the outcome of a specific study, data are expected to fit one of two patterns. However, data may not conform to an apparent pattern. When this happens, researchers may engage in malpractices or use unreliable data collection and analysis methods, jeopardising their reputation and career. Hence, it is necessary to resist the temptation to cherry-pick data. Always let the data speak for itself.
There are two ways to ensure the integrity of data and results.
Data validation
Data validation is a streamlined process that ensures the quality and accuracy of collected data. Inaccurate data may keep a researcher from uncovering important discoveries or lead to spurious results. At times, the amount of data collected might help unravel existing patterns that are important.
The data validation process can also provide a glimpse into the patterns within the data, preventing you from forming incorrect hypotheses.
In addition, data validation can also confirm the legitimacy of your study, and help you get a clearer picture of what your study reveals.
Analytical method validation
Analytical method validation confirms that a method is suitable for its intended purpose and will result in high-quality, accurate results.
Often, different analytical methods can produce surprisingly varying results, despite using the same dataset. Therefore, it is necessary to ensure that the methods fit the purpose of your research, a feature referred to as ‘system suitability’. This is one of the main objectives of analytical method validation. The other objective of analytical method validation is ensuring the results’ robustness (ability of your method to provide reliable results under various conditions) and reproducibility (ease with which your work can be repeated in a new setting). Reproducibility is important because it allows other researchers to confirm your findings (which can make your work more impactful) or refute your results if unique conditions in your lab favour one result over others. Moreover, as a collaborative enterprise, scientific research rewards the use and sharing of clearly defined analytical processes.
In the long run, it is rewarding for researchers to double-check their dataset and analytical methods than make the data fit an expected pattern.
While data are the crux of a scientific study, unless it is acquired and validated using the most suitable methods of data and method validation, it may fail to produce authentic and legitimate results. To get useful tips on how to collect and validate data, feel free to approach Elsevier Author Services . Our experts will support you throughout your research journey, ensuring that your results are reproducible, robust, and valid.

Choosing the Right Research Methodology: A Guide for Researchers

- Publication Process
Publishing Biomedical Research: What Rules Should You Follow?
You may also like.

Descriptive Research Design and Its Myriad Uses

Five Common Mistakes to Avoid When Writing a Biomedical Research Paper

Making Technical Writing in Environmental Engineering Accessible

To Err is Not Human: The Dangers of AI-assisted Academic Writing

Why is data validation important in research?

Writing a good review article

Scholarly Sources: What are They and Where can You Find Them?
Input your search keywords and press Enter.
What Is Data Analysis in Research? Why It Matters & What Data Analysts Do

Data analysis in research is the process of uncovering insights from data sets. Data analysts can use their knowledge of statistical techniques, research theories and methods, and research practices to analyze data. They take data and uncover what it’s trying to tell us, whether that’s through charts, graphs, or other visual representations. To analyze data effectively you need a strong background in mathematics and statistics, excellent communication skills, and the ability to identify relevant information.
Read on for more information about data analysis roles in research and what it takes to become one.
In this article – What is data analysis in research?
What is data analysis in research?
Why data analysis matters, what is data science, data analysis for quantitative research, data analysis for qualitative research, what are data analysis techniques in research, what do data analysts do, in related articles.
- How to Prepare for Job Interviews: Steps to Nail it!
- Finding Topics for Literature Review: The Pragmatic Guide
- How to Write a Conference Abstract: 4 Key Steps to Set Your Submission Apart
- The Ultimate Guide to White Papers: What, Why and How
- What is an Investigator’s Brochure in Pharma?
Data analysis is looking at existing data and attempting to draw conclusions from it. It is the process of asking “what does this data show us?” There are many different types of data analysis and a range of methods and tools for analyzing data. You may hear some of these terms as you explore data analysis roles in research – data exploration, data visualization, and data modelling. Data exploration involves exploring and reviewing the data, asking questions like “Does the data exist?” and “Is it valid?”.
Data visualization is the process of creating charts, graphs, and other visual representations of data. The goal of visualization is to help us see and understand data more quickly and easily. Visualizations are powerful and can help us uncover insights from the data that we may have missed without the visual aid. Data modelling involves taking the data and creating a model out of it. Data modelling organises and visualises data to help us understand it better and make sense of it. This will often include creating an equation for the data or creating a statistical model.
Data analysis is important for all research areas, from quantitative surveys to qualitative projects. While researchers often conduct a data analysis at the end of the project, they should be analyzing data alongside their data collection. This allows researchers to monitor their progress and adjust their approach when needed.
The analysis is also important for verifying the quality of the data. What you discover through your analysis can also help you decide whether or not to continue with your project. If you find that your data isn’t consistent with your research questions, you might decide to end your research before collecting enough data to generalize your results.
Data science is the intersection between computer science and statistics. It’s been defined as the “conceptual basis for systematic operations on data”. This means that data scientists use their knowledge of statistics and research methods to find insights in data. They use data to find solutions to complex problems, from medical research to business intelligence. Data science involves collecting and exploring data, creating models and algorithms from that data, and using those models to make predictions and find other insights.
Data scientists might focus on the visual representation of data, exploring the data, or creating models and algorithms from the data. Many people in data science roles also work with artificial intelligence and machine learning. They feed the algorithms with data and the algorithms find patterns and make predictions. Data scientists often work with data engineers. These engineers build the systems that the data scientists use to collect and analyze data.
Data analysis techniques can be divided into two categories:
- Quantitative approach
- Qualitative approach
Note that, when discussing this subject, the term “data analysis” often refers to statistical techniques.
Qualitative research uses unquantifiable data like unstructured interviews, observations, and case studies. Quantitative research usually relies on generalizable data and statistical modelling, while qualitative research is more focused on finding the “why” behind the data. This means that qualitative data analysis is useful in exploring and making sense of the unstructured data that researchers collect.
Data analysts will take their data and explore it, asking questions like “what’s going on here?” and “what patterns can we see?” They will use data visualization to help readers understand the data and identify patterns. They might create maps, timelines, or other representations of the data. They will use their understanding of the data to create conclusions that help readers understand the data better.
Quantitative research relies on data that can be measured, like survey responses or test results. Quantitative data analysis is useful in drawing conclusions from this data. To do this, data analysts will explore the data, looking at the validity of the data and making sure that it’s reliable. They will then visualize the data, making charts and graphs to make the data more accessible to readers. Finally, they will create an equation or use statistical modelling to understand the data.
A common type of research where you’ll see these three steps is market research. Market researchers will collect data from surveys, focus groups, and other methods. They will then analyze that data and make conclusions from it, like how much consumers are willing to spend on a product or what factors make one product more desirable than another.
Quantitative methods
These are useful in quantitatively analyzing data. These methods use a quantitative approach to analyzing data and their application includes in science and engineering, as well as in traditional business. This method is also useful for qualitative research.
Statistical methods are used to analyze data in a statistical manner. Data analysis is not limited only to statistics or probability. Still, it can also be applied in other areas, such as engineering, business, economics, marketing, and all parts of any field that seeks knowledge about something or someone.
If you are an entrepreneur or an investor who wants to develop your business or your company’s value proposition into a reality, you will need data analysis techniques. But if you want to understand how your company works, what you have done right so far, and what might happen next in terms of growth or profitability—you don’t need those kinds of experiences. Data analysis is most applicable when it comes to understanding information from external sources like research papers that aren’t necessarily objective.
A brief intro to statistics
Statistics is a field of study that analyzes data to determine the number of people, firms, and companies in a population and their relative positions on a particular economic level. The application of statistics can be to any group or entity that has any kind of data or information (even if it’s only numbers), so you can use statistics to make an educated guess about your company, your customers, your competitors, your competitors’ customers, your peers, and so on. You can also use statistics to help you develop a business strategy.
Data analysis methods can help you understand how different groups are performing in a given area—and how they might perform differently from one another in the future—but they can also be used as an indicator for areas where there is better or worse performance than expected.
In addition to being able to see what trends are occurring within an industry or population within that industry or population—and why some companies may be doing better than others—you will also be able to see what changes have been made over time within that industry or population by comparing it with others and analyzing those differences over time.
Data mining
Data mining is the use of mathematical techniques to analyze data with the goal of finding patterns and trends. A great example of this would be analyzing the sales patterns for a certain product line. In this case, a data mining technique would involve using statistical techniques to find patterns in the data and then analyzing them using mathematical techniques to identify relationships between variables and factors.
Note that these are different from each other and much more advanced than traditional statistics or probability.
As a data analyst, you’ll be responsible for analyzing data from different sources. You’ll work with multiple stakeholders and your job will vary depending on what projects you’re working on. You’ll likely work closely with data scientists and researchers on a daily basis, as you’re all analyzing the same data.
Communication is key, so being able to work with others is important. You’ll also likely work with researchers or principal investigators (PIs) to collect and organize data. Your data will be from various sources, from structured to unstructured data like interviews and observations. You’ll take that data and make sense of it, organizing it and visualizing it so readers can understand it better. You’ll use this data to create models and algorithms that make predictions and find other insights. This can include creating equations or mathematical models from the data or taking data and creating a statistical model.
Data analysis is an important part of all types of research. Quantitative researchers analyze the data they collect through surveys and experiments, while qualitative researchers collect unstructured data like interviews and observations. Data analysts take all of this data and turn it into something that other researchers and readers can understand and make use of.
With proper data analysis, researchers can make better decisions, understand their data better, and get a better picture of what’s going on in the world around them. Data analysis is a valuable skill, and many companies hire data analysts and data scientists to help them understand their customers and make better decisions.
Similar Posts

Length of Literature Review: Guidelines and Best Practices
A literature review is an essential component of many research projects, providing a comprehensive overview of the existing knowledge and studies on a particular topic. One question that often arises when writing a literature review is how long it should be. In this article, we will explore the factors that influence the length of a…

5 Steps to Crafting the Perfect White Paper: A Comprehensive Guide with Examples
Are you looking to create a white paper that effectively communicates your ideas and engages your audience? Look no further! In this blog article, we’ll provide you with a comprehensive guide on how to craft the perfect white paper. From defining your purpose and audience to formatting and design, we’ll cover all the essential steps…

Referencing a Book Harvard Style: Tips for Every Writer
Introduction Harvard Style is the standard way to reference books in academic papers and other writing. Referencing a book Harvard style could be tricky. But, it’s a style you should be familiar with as a medical writer — and it can help you write better. As a medical writer, you need to know how to…

How to Write a Clinical Evaluation Report in Pharma
A clinical evaluation report (CER) is an essential document that records the findings of a clinical trial. It plays an important role in determining the safety and efficacy of a drug. A CER is prepared by a medical researcher after concluding the evaluation process of participants from clinical trials. The function of a CER is…

How to Edit Documents in Word in the Most Effective Way
As a medical writer or any writer for that matter, you’ll come across a situation where you need to edit documents in Word. Microsoft Word is a very useful and popular program used for creating documents of all kinds. It’s also a complex tool with lots of features, which can make using it feel overwhelming…

Best Way to Use a Plagiarism Checker – Grammarly
If you’re writing any kind of scientific paper, you know that it’s important to use good grammar and spelling. This means that checking your work for errors is one of the best ways to improve your writing. That’s why nearly every student has checked their papers with a plagiarism checker, whether they were worried they…
Privacy Overview
Your Modern Business Guide To Data Analysis Methods And Techniques

Table of Contents
1) What Is Data Analysis?
2) Why Is Data Analysis Important?
3) What Is The Data Analysis Process?
4) Types Of Data Analysis Methods
5) Top Data Analysis Techniques To Apply
6) Quality Criteria For Data Analysis
7) Data Analysis Limitations & Barriers
8) Data Analysis Skills
9) Data Analysis In The Big Data Environment
In our data-rich age, understanding how to analyze and extract true meaning from our business’s digital insights is one of the primary drivers of success.
Despite the colossal volume of data we create every day, a mere 0.5% is actually analyzed and used for data discovery , improvement, and intelligence. While that may not seem like much, considering the amount of digital information we have at our fingertips, half a percent still accounts for a vast amount of data.
With so much data and so little time, knowing how to collect, curate, organize, and make sense of all of this potentially business-boosting information can be a minefield – but online data analysis is the solution.
In science, data analysis uses a more complex approach with advanced techniques to explore and experiment with data. On the other hand, in a business context, data is used to make data-driven decisions that will enable the company to improve its overall performance. In this post, we will cover the analysis of data from an organizational point of view while still going through the scientific and statistical foundations that are fundamental to understanding the basics of data analysis.
To put all of that into perspective, we will answer a host of important analytical questions, explore analytical methods and techniques, while demonstrating how to perform analysis in the real world with a 17-step blueprint for success.
What Is Data Analysis?
Data analysis is the process of collecting, modeling, and analyzing data using various statistical and logical methods and techniques. Businesses rely on analytics processes and tools to extract insights that support strategic and operational decision-making.
All these various methods are largely based on two core areas: quantitative and qualitative research.
To explain the key differences between qualitative and quantitative research, here’s a video for your viewing pleasure:
Gaining a better understanding of different techniques and methods in quantitative research as well as qualitative insights will give your analyzing efforts a more clearly defined direction, so it’s worth taking the time to allow this particular knowledge to sink in. Additionally, you will be able to create a comprehensive analytical report that will skyrocket your analysis.
Apart from qualitative and quantitative categories, there are also other types of data that you should be aware of before dividing into complex data analysis processes. These categories include:
- Big data: Refers to massive data sets that need to be analyzed using advanced software to reveal patterns and trends. It is considered to be one of the best analytical assets as it provides larger volumes of data at a faster rate.
- Metadata: Putting it simply, metadata is data that provides insights about other data. It summarizes key information about specific data that makes it easier to find and reuse for later purposes.
- Real time data: As its name suggests, real time data is presented as soon as it is acquired. From an organizational perspective, this is the most valuable data as it can help you make important decisions based on the latest developments. Our guide on real time analytics will tell you more about the topic.
- Machine data: This is more complex data that is generated solely by a machine such as phones, computers, or even websites and embedded systems, without previous human interaction.
Why Is Data Analysis Important?
Before we go into detail about the categories of analysis along with its methods and techniques, you must understand the potential that analyzing data can bring to your organization.
- Informed decision-making : From a management perspective, you can benefit from analyzing your data as it helps you make decisions based on facts and not simple intuition. For instance, you can understand where to invest your capital, detect growth opportunities, predict your income, or tackle uncommon situations before they become problems. Through this, you can extract relevant insights from all areas in your organization, and with the help of dashboard software , present the data in a professional and interactive way to different stakeholders.
- Reduce costs : Another great benefit is to reduce costs. With the help of advanced technologies such as predictive analytics, businesses can spot improvement opportunities, trends, and patterns in their data and plan their strategies accordingly. In time, this will help you save money and resources on implementing the wrong strategies. And not just that, by predicting different scenarios such as sales and demand you can also anticipate production and supply.
- Target customers better : Customers are arguably the most crucial element in any business. By using analytics to get a 360° vision of all aspects related to your customers, you can understand which channels they use to communicate with you, their demographics, interests, habits, purchasing behaviors, and more. In the long run, it will drive success to your marketing strategies, allow you to identify new potential customers, and avoid wasting resources on targeting the wrong people or sending the wrong message. You can also track customer satisfaction by analyzing your client’s reviews or your customer service department’s performance.
What Is The Data Analysis Process?

When we talk about analyzing data there is an order to follow in order to extract the needed conclusions. The analysis process consists of 5 key stages. We will cover each of them more in detail later in the post, but to start providing the needed context to understand what is coming next, here is a rundown of the 5 essential steps of data analysis.
- Identify: Before you get your hands dirty with data, you first need to identify why you need it in the first place. The identification is the stage in which you establish the questions you will need to answer. For example, what is the customer's perception of our brand? Or what type of packaging is more engaging to our potential customers? Once the questions are outlined you are ready for the next step.
- Collect: As its name suggests, this is the stage where you start collecting the needed data. Here, you define which sources of data you will use and how you will use them. The collection of data can come in different forms such as internal or external sources, surveys, interviews, questionnaires, and focus groups, among others. An important note here is that the way you collect the data will be different in a quantitative and qualitative scenario.
- Clean: Once you have the necessary data it is time to clean it and leave it ready for analysis. Not all the data you collect will be useful, when collecting big amounts of data in different formats it is very likely that you will find yourself with duplicate or badly formatted data. To avoid this, before you start working with your data you need to make sure to erase any white spaces, duplicate records, or formatting errors. This way you avoid hurting your analysis with bad-quality data.
- Analyze : With the help of various techniques such as statistical analysis, regressions, neural networks, text analysis, and more, you can start analyzing and manipulating your data to extract relevant conclusions. At this stage, you find trends, correlations, variations, and patterns that can help you answer the questions you first thought of in the identify stage. Various technologies in the market assist researchers and average users with the management of their data. Some of them include business intelligence and visualization software, predictive analytics, and data mining, among others.
- Interpret: Last but not least you have one of the most important steps: it is time to interpret your results. This stage is where the researcher comes up with courses of action based on the findings. For example, here you would understand if your clients prefer packaging that is red or green, plastic or paper, etc. Additionally, at this stage, you can also find some limitations and work on them.
Now that you have a basic understanding of the key data analysis steps, let’s look at the top 17 essential methods.
17 Essential Types Of Data Analysis Methods
Before diving into the 17 essential types of methods, it is important that we go over really fast through the main analysis categories. Starting with the category of descriptive up to prescriptive analysis, the complexity and effort of data evaluation increases, but also the added value for the company.
a) Descriptive analysis - What happened.
The descriptive analysis method is the starting point for any analytic reflection, and it aims to answer the question of what happened? It does this by ordering, manipulating, and interpreting raw data from various sources to turn it into valuable insights for your organization.
Performing descriptive analysis is essential, as it enables us to present our insights in a meaningful way. Although it is relevant to mention that this analysis on its own will not allow you to predict future outcomes or tell you the answer to questions like why something happened, it will leave your data organized and ready to conduct further investigations.
b) Exploratory analysis - How to explore data relationships.
As its name suggests, the main aim of the exploratory analysis is to explore. Prior to it, there is still no notion of the relationship between the data and the variables. Once the data is investigated, exploratory analysis helps you to find connections and generate hypotheses and solutions for specific problems. A typical area of application for it is data mining.
c) Diagnostic analysis - Why it happened.
Diagnostic data analytics empowers analysts and executives by helping them gain a firm contextual understanding of why something happened. If you know why something happened as well as how it happened, you will be able to pinpoint the exact ways of tackling the issue or challenge.
Designed to provide direct and actionable answers to specific questions, this is one of the world’s most important methods in research, among its other key organizational functions such as retail analytics , e.g.
c) Predictive analysis - What will happen.
The predictive method allows you to look into the future to answer the question: what will happen? In order to do this, it uses the results of the previously mentioned descriptive, exploratory, and diagnostic analysis, in addition to machine learning (ML) and artificial intelligence (AI). Through this, you can uncover future trends, potential problems or inefficiencies, connections, and casualties in your data.
With predictive analysis, you can unfold and develop initiatives that will not only enhance your various operational processes but also help you gain an all-important edge over the competition. If you understand why a trend, pattern, or event happened through data, you will be able to develop an informed projection of how things may unfold in particular areas of the business.
e) Prescriptive analysis - How will it happen.
Another of the most effective types of analysis methods in research. Prescriptive data techniques cross over from predictive analysis in the way that it revolves around using patterns or trends to develop responsive, practical business strategies.
By drilling down into prescriptive analysis, you will play an active role in the data consumption process by taking well-arranged sets of visual data and using it as a powerful fix to emerging issues in a number of key areas, including marketing, sales, customer experience, HR, fulfillment, finance, logistics analytics , and others.

As mentioned at the beginning of the post, data analysis methods can be divided into two big categories: quantitative and qualitative. Each of these categories holds a powerful analytical value that changes depending on the scenario and type of data you are working with. Below, we will discuss 17 methods that are divided into qualitative and quantitative approaches.
Without further ado, here are the 17 essential types of data analysis methods with some use cases in the business world:
A. Quantitative Methods
To put it simply, quantitative analysis refers to all methods that use numerical data or data that can be turned into numbers (e.g. category variables like gender, age, etc.) to extract valuable insights. It is used to extract valuable conclusions about relationships, differences, and test hypotheses. Below we discuss some of the key quantitative methods.
1. Cluster analysis
The action of grouping a set of data elements in a way that said elements are more similar (in a particular sense) to each other than to those in other groups – hence the term ‘cluster.’ Since there is no target variable when clustering, the method is often used to find hidden patterns in the data. The approach is also used to provide additional context to a trend or dataset.
Let's look at it from an organizational perspective. In a perfect world, marketers would be able to analyze each customer separately and give them the best-personalized service, but let's face it, with a large customer base, it is timely impossible to do that. That's where clustering comes in. By grouping customers into clusters based on demographics, purchasing behaviors, monetary value, or any other factor that might be relevant for your company, you will be able to immediately optimize your efforts and give your customers the best experience based on their needs.
2. Cohort analysis
This type of data analysis approach uses historical data to examine and compare a determined segment of users' behavior, which can then be grouped with others with similar characteristics. By using this methodology, it's possible to gain a wealth of insight into consumer needs or a firm understanding of a broader target group.
Cohort analysis can be really useful for performing analysis in marketing as it will allow you to understand the impact of your campaigns on specific groups of customers. To exemplify, imagine you send an email campaign encouraging customers to sign up for your site. For this, you create two versions of the campaign with different designs, CTAs, and ad content. Later on, you can use cohort analysis to track the performance of the campaign for a longer period of time and understand which type of content is driving your customers to sign up, repurchase, or engage in other ways.
A useful tool to start performing cohort analysis method is Google Analytics. You can learn more about the benefits and limitations of using cohorts in GA in this useful guide . In the bottom image, you see an example of how you visualize a cohort in this tool. The segments (devices traffic) are divided into date cohorts (usage of devices) and then analyzed week by week to extract insights into performance.

3. Regression analysis
Regression uses historical data to understand how a dependent variable's value is affected when one (linear regression) or more independent variables (multiple regression) change or stay the same. By understanding each variable's relationship and how it developed in the past, you can anticipate possible outcomes and make better decisions in the future.
Let's bring it down with an example. Imagine you did a regression analysis of your sales in 2019 and discovered that variables like product quality, store design, customer service, marketing campaigns, and sales channels affected the overall result. Now you want to use regression to analyze which of these variables changed or if any new ones appeared during 2020. For example, you couldn’t sell as much in your physical store due to COVID lockdowns. Therefore, your sales could’ve either dropped in general or increased in your online channels. Through this, you can understand which independent variables affected the overall performance of your dependent variable, annual sales.
If you want to go deeper into this type of analysis, check out this article and learn more about how you can benefit from regression.
4. Neural networks
The neural network forms the basis for the intelligent algorithms of machine learning. It is a form of analytics that attempts, with minimal intervention, to understand how the human brain would generate insights and predict values. Neural networks learn from each and every data transaction, meaning that they evolve and advance over time.
A typical area of application for neural networks is predictive analytics. There are BI reporting tools that have this feature implemented within them, such as the Predictive Analytics Tool from datapine. This tool enables users to quickly and easily generate all kinds of predictions. All you have to do is select the data to be processed based on your KPIs, and the software automatically calculates forecasts based on historical and current data. Thanks to its user-friendly interface, anyone in your organization can manage it; there’s no need to be an advanced scientist.
Here is an example of how you can use the predictive analysis tool from datapine:

**click to enlarge**
5. Factor analysis
The factor analysis also called “dimension reduction” is a type of data analysis used to describe variability among observed, correlated variables in terms of a potentially lower number of unobserved variables called factors. The aim here is to uncover independent latent variables, an ideal method for streamlining specific segments.
A good way to understand this data analysis method is a customer evaluation of a product. The initial assessment is based on different variables like color, shape, wearability, current trends, materials, comfort, the place where they bought the product, and frequency of usage. Like this, the list can be endless, depending on what you want to track. In this case, factor analysis comes into the picture by summarizing all of these variables into homogenous groups, for example, by grouping the variables color, materials, quality, and trends into a brother latent variable of design.
If you want to start analyzing data using factor analysis we recommend you take a look at this practical guide from UCLA.
6. Data mining
A method of data analysis that is the umbrella term for engineering metrics and insights for additional value, direction, and context. By using exploratory statistical evaluation, data mining aims to identify dependencies, relations, patterns, and trends to generate advanced knowledge. When considering how to analyze data, adopting a data mining mindset is essential to success - as such, it’s an area that is worth exploring in greater detail.
An excellent use case of data mining is datapine intelligent data alerts . With the help of artificial intelligence and machine learning, they provide automated signals based on particular commands or occurrences within a dataset. For example, if you’re monitoring supply chain KPIs , you could set an intelligent alarm to trigger when invalid or low-quality data appears. By doing so, you will be able to drill down deep into the issue and fix it swiftly and effectively.
In the following picture, you can see how the intelligent alarms from datapine work. By setting up ranges on daily orders, sessions, and revenues, the alarms will notify you if the goal was not completed or if it exceeded expectations.

7. Time series analysis
As its name suggests, time series analysis is used to analyze a set of data points collected over a specified period of time. Although analysts use this method to monitor the data points in a specific interval of time rather than just monitoring them intermittently, the time series analysis is not uniquely used for the purpose of collecting data over time. Instead, it allows researchers to understand if variables changed during the duration of the study, how the different variables are dependent, and how did it reach the end result.
In a business context, this method is used to understand the causes of different trends and patterns to extract valuable insights. Another way of using this method is with the help of time series forecasting. Powered by predictive technologies, businesses can analyze various data sets over a period of time and forecast different future events.
A great use case to put time series analysis into perspective is seasonality effects on sales. By using time series forecasting to analyze sales data of a specific product over time, you can understand if sales rise over a specific period of time (e.g. swimwear during summertime, or candy during Halloween). These insights allow you to predict demand and prepare production accordingly.
8. Decision Trees
The decision tree analysis aims to act as a support tool to make smart and strategic decisions. By visually displaying potential outcomes, consequences, and costs in a tree-like model, researchers and company users can easily evaluate all factors involved and choose the best course of action. Decision trees are helpful to analyze quantitative data and they allow for an improved decision-making process by helping you spot improvement opportunities, reduce costs, and enhance operational efficiency and production.
But how does a decision tree actually works? This method works like a flowchart that starts with the main decision that you need to make and branches out based on the different outcomes and consequences of each decision. Each outcome will outline its own consequences, costs, and gains and, at the end of the analysis, you can compare each of them and make the smartest decision.
Businesses can use them to understand which project is more cost-effective and will bring more earnings in the long run. For example, imagine you need to decide if you want to update your software app or build a new app entirely. Here you would compare the total costs, the time needed to be invested, potential revenue, and any other factor that might affect your decision. In the end, you would be able to see which of these two options is more realistic and attainable for your company or research.
9. Conjoint analysis
Last but not least, we have the conjoint analysis. This approach is usually used in surveys to understand how individuals value different attributes of a product or service and it is one of the most effective methods to extract consumer preferences. When it comes to purchasing, some clients might be more price-focused, others more features-focused, and others might have a sustainable focus. Whatever your customer's preferences are, you can find them with conjoint analysis. Through this, companies can define pricing strategies, packaging options, subscription packages, and more.
A great example of conjoint analysis is in marketing and sales. For instance, a cupcake brand might use conjoint analysis and find that its clients prefer gluten-free options and cupcakes with healthier toppings over super sugary ones. Thus, the cupcake brand can turn these insights into advertisements and promotions to increase sales of this particular type of product. And not just that, conjoint analysis can also help businesses segment their customers based on their interests. This allows them to send different messaging that will bring value to each of the segments.
10. Correspondence Analysis
Also known as reciprocal averaging, correspondence analysis is a method used to analyze the relationship between categorical variables presented within a contingency table. A contingency table is a table that displays two (simple correspondence analysis) or more (multiple correspondence analysis) categorical variables across rows and columns that show the distribution of the data, which is usually answers to a survey or questionnaire on a specific topic.
This method starts by calculating an “expected value” which is done by multiplying row and column averages and dividing it by the overall original value of the specific table cell. The “expected value” is then subtracted from the original value resulting in a “residual number” which is what allows you to extract conclusions about relationships and distribution. The results of this analysis are later displayed using a map that represents the relationship between the different values. The closest two values are in the map, the bigger the relationship. Let’s put it into perspective with an example.
Imagine you are carrying out a market research analysis about outdoor clothing brands and how they are perceived by the public. For this analysis, you ask a group of people to match each brand with a certain attribute which can be durability, innovation, quality materials, etc. When calculating the residual numbers, you can see that brand A has a positive residual for innovation but a negative one for durability. This means that brand A is not positioned as a durable brand in the market, something that competitors could take advantage of.
11. Multidimensional Scaling (MDS)
MDS is a method used to observe the similarities or disparities between objects which can be colors, brands, people, geographical coordinates, and more. The objects are plotted using an “MDS map” that positions similar objects together and disparate ones far apart. The (dis) similarities between objects are represented using one or more dimensions that can be observed using a numerical scale. For example, if you want to know how people feel about the COVID-19 vaccine, you can use 1 for “don’t believe in the vaccine at all” and 10 for “firmly believe in the vaccine” and a scale of 2 to 9 for in between responses. When analyzing an MDS map the only thing that matters is the distance between the objects, the orientation of the dimensions is arbitrary and has no meaning at all.
Multidimensional scaling is a valuable technique for market research, especially when it comes to evaluating product or brand positioning. For instance, if a cupcake brand wants to know how they are positioned compared to competitors, it can define 2-3 dimensions such as taste, ingredients, shopping experience, or more, and do a multidimensional scaling analysis to find improvement opportunities as well as areas in which competitors are currently leading.
Another business example is in procurement when deciding on different suppliers. Decision makers can generate an MDS map to see how the different prices, delivery times, technical services, and more of the different suppliers differ and pick the one that suits their needs the best.
A final example proposed by a research paper on "An Improved Study of Multilevel Semantic Network Visualization for Analyzing Sentiment Word of Movie Review Data". Researchers picked a two-dimensional MDS map to display the distances and relationships between different sentiments in movie reviews. They used 36 sentiment words and distributed them based on their emotional distance as we can see in the image below where the words "outraged" and "sweet" are on opposite sides of the map, marking the distance between the two emotions very clearly.

Aside from being a valuable technique to analyze dissimilarities, MDS also serves as a dimension-reduction technique for large dimensional data.
B. Qualitative Methods
Qualitative data analysis methods are defined as the observation of non-numerical data that is gathered and produced using methods of observation such as interviews, focus groups, questionnaires, and more. As opposed to quantitative methods, qualitative data is more subjective and highly valuable in analyzing customer retention and product development.
12. Text analysis
Text analysis, also known in the industry as text mining, works by taking large sets of textual data and arranging them in a way that makes it easier to manage. By working through this cleansing process in stringent detail, you will be able to extract the data that is truly relevant to your organization and use it to develop actionable insights that will propel you forward.
Modern software accelerate the application of text analytics. Thanks to the combination of machine learning and intelligent algorithms, you can perform advanced analytical processes such as sentiment analysis. This technique allows you to understand the intentions and emotions of a text, for example, if it's positive, negative, or neutral, and then give it a score depending on certain factors and categories that are relevant to your brand. Sentiment analysis is often used to monitor brand and product reputation and to understand how successful your customer experience is. To learn more about the topic check out this insightful article .
By analyzing data from various word-based sources, including product reviews, articles, social media communications, and survey responses, you will gain invaluable insights into your audience, as well as their needs, preferences, and pain points. This will allow you to create campaigns, services, and communications that meet your prospects’ needs on a personal level, growing your audience while boosting customer retention. There are various other “sub-methods” that are an extension of text analysis. Each of them serves a more specific purpose and we will look at them in detail next.
13. Content Analysis
This is a straightforward and very popular method that examines the presence and frequency of certain words, concepts, and subjects in different content formats such as text, image, audio, or video. For example, the number of times the name of a celebrity is mentioned on social media or online tabloids. It does this by coding text data that is later categorized and tabulated in a way that can provide valuable insights, making it the perfect mix of quantitative and qualitative analysis.
There are two types of content analysis. The first one is the conceptual analysis which focuses on explicit data, for instance, the number of times a concept or word is mentioned in a piece of content. The second one is relational analysis, which focuses on the relationship between different concepts or words and how they are connected within a specific context.
Content analysis is often used by marketers to measure brand reputation and customer behavior. For example, by analyzing customer reviews. It can also be used to analyze customer interviews and find directions for new product development. It is also important to note, that in order to extract the maximum potential out of this analysis method, it is necessary to have a clearly defined research question.
14. Thematic Analysis
Very similar to content analysis, thematic analysis also helps in identifying and interpreting patterns in qualitative data with the main difference being that the first one can also be applied to quantitative analysis. The thematic method analyzes large pieces of text data such as focus group transcripts or interviews and groups them into themes or categories that come up frequently within the text. It is a great method when trying to figure out peoples view’s and opinions about a certain topic. For example, if you are a brand that cares about sustainability, you can do a survey of your customers to analyze their views and opinions about sustainability and how they apply it to their lives. You can also analyze customer service calls transcripts to find common issues and improve your service.
Thematic analysis is a very subjective technique that relies on the researcher’s judgment. Therefore, to avoid biases, it has 6 steps that include familiarization, coding, generating themes, reviewing themes, defining and naming themes, and writing up. It is also important to note that, because it is a flexible approach, the data can be interpreted in multiple ways and it can be hard to select what data is more important to emphasize.
15. Narrative Analysis
A bit more complex in nature than the two previous ones, narrative analysis is used to explore the meaning behind the stories that people tell and most importantly, how they tell them. By looking into the words that people use to describe a situation you can extract valuable conclusions about their perspective on a specific topic. Common sources for narrative data include autobiographies, family stories, opinion pieces, and testimonials, among others.
From a business perspective, narrative analysis can be useful to analyze customer behaviors and feelings towards a specific product, service, feature, or others. It provides unique and deep insights that can be extremely valuable. However, it has some drawbacks.
The biggest weakness of this method is that the sample sizes are usually very small due to the complexity and time-consuming nature of the collection of narrative data. Plus, the way a subject tells a story will be significantly influenced by his or her specific experiences, making it very hard to replicate in a subsequent study.
16. Discourse Analysis
Discourse analysis is used to understand the meaning behind any type of written, verbal, or symbolic discourse based on its political, social, or cultural context. It mixes the analysis of languages and situations together. This means that the way the content is constructed and the meaning behind it is significantly influenced by the culture and society it takes place in. For example, if you are analyzing political speeches you need to consider different context elements such as the politician's background, the current political context of the country, the audience to which the speech is directed, and so on.
From a business point of view, discourse analysis is a great market research tool. It allows marketers to understand how the norms and ideas of the specific market work and how their customers relate to those ideas. It can be very useful to build a brand mission or develop a unique tone of voice.
17. Grounded Theory Analysis
Traditionally, researchers decide on a method and hypothesis and start to collect the data to prove that hypothesis. The grounded theory is the only method that doesn’t require an initial research question or hypothesis as its value lies in the generation of new theories. With the grounded theory method, you can go into the analysis process with an open mind and explore the data to generate new theories through tests and revisions. In fact, it is not necessary to collect the data and then start to analyze it. Researchers usually start to find valuable insights as they are gathering the data.
All of these elements make grounded theory a very valuable method as theories are fully backed by data instead of initial assumptions. It is a great technique to analyze poorly researched topics or find the causes behind specific company outcomes. For example, product managers and marketers might use the grounded theory to find the causes of high levels of customer churn and look into customer surveys and reviews to develop new theories about the causes.
How To Analyze Data? Top 17 Data Analysis Techniques To Apply

Now that we’ve answered the questions “what is data analysis’”, why is it important, and covered the different data analysis types, it’s time to dig deeper into how to perform your analysis by working through these 17 essential techniques.
1. Collaborate your needs
Before you begin analyzing or drilling down into any techniques, it’s crucial to sit down collaboratively with all key stakeholders within your organization, decide on your primary campaign or strategic goals, and gain a fundamental understanding of the types of insights that will best benefit your progress or provide you with the level of vision you need to evolve your organization.
2. Establish your questions
Once you’ve outlined your core objectives, you should consider which questions will need answering to help you achieve your mission. This is one of the most important techniques as it will shape the very foundations of your success.
To help you ask the right things and ensure your data works for you, you have to ask the right data analysis questions .
3. Data democratization
After giving your data analytics methodology some real direction, and knowing which questions need answering to extract optimum value from the information available to your organization, you should continue with democratization.
Data democratization is an action that aims to connect data from various sources efficiently and quickly so that anyone in your organization can access it at any given moment. You can extract data in text, images, videos, numbers, or any other format. And then perform cross-database analysis to achieve more advanced insights to share with the rest of the company interactively.
Once you have decided on your most valuable sources, you need to take all of this into a structured format to start collecting your insights. For this purpose, datapine offers an easy all-in-one data connectors feature to integrate all your internal and external sources and manage them at your will. Additionally, datapine’s end-to-end solution automatically updates your data, allowing you to save time and focus on performing the right analysis to grow your company.

4. Think of governance
When collecting data in a business or research context you always need to think about security and privacy. With data breaches becoming a topic of concern for businesses, the need to protect your client's or subject’s sensitive information becomes critical.
To ensure that all this is taken care of, you need to think of a data governance strategy. According to Gartner , this concept refers to “ the specification of decision rights and an accountability framework to ensure the appropriate behavior in the valuation, creation, consumption, and control of data and analytics .” In simpler words, data governance is a collection of processes, roles, and policies, that ensure the efficient use of data while still achieving the main company goals. It ensures that clear roles are in place for who can access the information and how they can access it. In time, this not only ensures that sensitive information is protected but also allows for an efficient analysis as a whole.
5. Clean your data
After harvesting from so many sources you will be left with a vast amount of information that can be overwhelming to deal with. At the same time, you can be faced with incorrect data that can be misleading to your analysis. The smartest thing you can do to avoid dealing with this in the future is to clean the data. This is fundamental before visualizing it, as it will ensure that the insights you extract from it are correct.
There are many things that you need to look for in the cleaning process. The most important one is to eliminate any duplicate observations; this usually appears when using multiple internal and external sources of information. You can also add any missing codes, fix empty fields, and eliminate incorrectly formatted data.
Another usual form of cleaning is done with text data. As we mentioned earlier, most companies today analyze customer reviews, social media comments, questionnaires, and several other text inputs. In order for algorithms to detect patterns, text data needs to be revised to avoid invalid characters or any syntax or spelling errors.
Most importantly, the aim of cleaning is to prevent you from arriving at false conclusions that can damage your company in the long run. By using clean data, you will also help BI solutions to interact better with your information and create better reports for your organization.
6. Set your KPIs
Once you’ve set your sources, cleaned your data, and established clear-cut questions you want your insights to answer, you need to set a host of key performance indicators (KPIs) that will help you track, measure, and shape your progress in a number of key areas.
KPIs are critical to both qualitative and quantitative analysis research. This is one of the primary methods of data analysis you certainly shouldn’t overlook.
To help you set the best possible KPIs for your initiatives and activities, here is an example of a relevant logistics KPI : transportation-related costs. If you want to see more go explore our collection of key performance indicator examples .

7. Omit useless data
Having bestowed your data analysis tools and techniques with true purpose and defined your mission, you should explore the raw data you’ve collected from all sources and use your KPIs as a reference for chopping out any information you deem to be useless.
Trimming the informational fat is one of the most crucial methods of analysis as it will allow you to focus your analytical efforts and squeeze every drop of value from the remaining ‘lean’ information.
Any stats, facts, figures, or metrics that don’t align with your business goals or fit with your KPI management strategies should be eliminated from the equation.
8. Build a data management roadmap
While, at this point, this particular step is optional (you will have already gained a wealth of insight and formed a fairly sound strategy by now), creating a data governance roadmap will help your data analysis methods and techniques become successful on a more sustainable basis. These roadmaps, if developed properly, are also built so they can be tweaked and scaled over time.
Invest ample time in developing a roadmap that will help you store, manage, and handle your data internally, and you will make your analysis techniques all the more fluid and functional – one of the most powerful types of data analysis methods available today.
9. Integrate technology
There are many ways to analyze data, but one of the most vital aspects of analytical success in a business context is integrating the right decision support software and technology.
Robust analysis platforms will not only allow you to pull critical data from your most valuable sources while working with dynamic KPIs that will offer you actionable insights; it will also present them in a digestible, visual, interactive format from one central, live dashboard . A data methodology you can count on.
By integrating the right technology within your data analysis methodology, you’ll avoid fragmenting your insights, saving you time and effort while allowing you to enjoy the maximum value from your business’s most valuable insights.
For a look at the power of software for the purpose of analysis and to enhance your methods of analyzing, glance over our selection of dashboard examples .
10. Answer your questions
By considering each of the above efforts, working with the right technology, and fostering a cohesive internal culture where everyone buys into the different ways to analyze data as well as the power of digital intelligence, you will swiftly start to answer your most burning business questions. Arguably, the best way to make your data concepts accessible across the organization is through data visualization.
11. Visualize your data
Online data visualization is a powerful tool as it lets you tell a story with your metrics, allowing users across the organization to extract meaningful insights that aid business evolution – and it covers all the different ways to analyze data.
The purpose of analyzing is to make your entire organization more informed and intelligent, and with the right platform or dashboard, this is simpler than you think, as demonstrated by our marketing dashboard .

This visual, dynamic, and interactive online dashboard is a data analysis example designed to give Chief Marketing Officers (CMO) an overview of relevant metrics to help them understand if they achieved their monthly goals.
In detail, this example generated with a modern dashboard creator displays interactive charts for monthly revenues, costs, net income, and net income per customer; all of them are compared with the previous month so that you can understand how the data fluctuated. In addition, it shows a detailed summary of the number of users, customers, SQLs, and MQLs per month to visualize the whole picture and extract relevant insights or trends for your marketing reports .
The CMO dashboard is perfect for c-level management as it can help them monitor the strategic outcome of their marketing efforts and make data-driven decisions that can benefit the company exponentially.
12. Be careful with the interpretation
We already dedicated an entire post to data interpretation as it is a fundamental part of the process of data analysis. It gives meaning to the analytical information and aims to drive a concise conclusion from the analysis results. Since most of the time companies are dealing with data from many different sources, the interpretation stage needs to be done carefully and properly in order to avoid misinterpretations.
To help you through the process, here we list three common practices that you need to avoid at all costs when looking at your data:
- Correlation vs. causation: The human brain is formatted to find patterns. This behavior leads to one of the most common mistakes when performing interpretation: confusing correlation with causation. Although these two aspects can exist simultaneously, it is not correct to assume that because two things happened together, one provoked the other. A piece of advice to avoid falling into this mistake is never to trust just intuition, trust the data. If there is no objective evidence of causation, then always stick to correlation.
- Confirmation bias: This phenomenon describes the tendency to select and interpret only the data necessary to prove one hypothesis, often ignoring the elements that might disprove it. Even if it's not done on purpose, confirmation bias can represent a real problem, as excluding relevant information can lead to false conclusions and, therefore, bad business decisions. To avoid it, always try to disprove your hypothesis instead of proving it, share your analysis with other team members, and avoid drawing any conclusions before the entire analytical project is finalized.
- Statistical significance: To put it in short words, statistical significance helps analysts understand if a result is actually accurate or if it happened because of a sampling error or pure chance. The level of statistical significance needed might depend on the sample size and the industry being analyzed. In any case, ignoring the significance of a result when it might influence decision-making can be a huge mistake.
13. Build a narrative
Now, we’re going to look at how you can bring all of these elements together in a way that will benefit your business - starting with a little something called data storytelling.
The human brain responds incredibly well to strong stories or narratives. Once you’ve cleansed, shaped, and visualized your most invaluable data using various BI dashboard tools , you should strive to tell a story - one with a clear-cut beginning, middle, and end.
By doing so, you will make your analytical efforts more accessible, digestible, and universal, empowering more people within your organization to use your discoveries to their actionable advantage.
14. Consider autonomous technology
Autonomous technologies, such as artificial intelligence (AI) and machine learning (ML), play a significant role in the advancement of understanding how to analyze data more effectively.
Gartner predicts that by the end of this year, 80% of emerging technologies will be developed with AI foundations. This is a testament to the ever-growing power and value of autonomous technologies.
At the moment, these technologies are revolutionizing the analysis industry. Some examples that we mentioned earlier are neural networks, intelligent alarms, and sentiment analysis.
15. Share the load
If you work with the right tools and dashboards, you will be able to present your metrics in a digestible, value-driven format, allowing almost everyone in the organization to connect with and use relevant data to their advantage.
Modern dashboards consolidate data from various sources, providing access to a wealth of insights in one centralized location, no matter if you need to monitor recruitment metrics or generate reports that need to be sent across numerous departments. Moreover, these cutting-edge tools offer access to dashboards from a multitude of devices, meaning that everyone within the business can connect with practical insights remotely - and share the load.
Once everyone is able to work with a data-driven mindset, you will catalyze the success of your business in ways you never thought possible. And when it comes to knowing how to analyze data, this kind of collaborative approach is essential.
16. Data analysis tools
In order to perform high-quality analysis of data, it is fundamental to use tools and software that will ensure the best results. Here we leave you a small summary of four fundamental categories of data analysis tools for your organization.
- Business Intelligence: BI tools allow you to process significant amounts of data from several sources in any format. Through this, you can not only analyze and monitor your data to extract relevant insights but also create interactive reports and dashboards to visualize your KPIs and use them for your company's good. datapine is an amazing online BI software that is focused on delivering powerful online analysis features that are accessible to beginner and advanced users. Like this, it offers a full-service solution that includes cutting-edge analysis of data, KPIs visualization, live dashboards, reporting, and artificial intelligence technologies to predict trends and minimize risk.
- Statistical analysis: These tools are usually designed for scientists, statisticians, market researchers, and mathematicians, as they allow them to perform complex statistical analyses with methods like regression analysis, predictive analysis, and statistical modeling. A good tool to perform this type of analysis is R-Studio as it offers a powerful data modeling and hypothesis testing feature that can cover both academic and general data analysis. This tool is one of the favorite ones in the industry, due to its capability for data cleaning, data reduction, and performing advanced analysis with several statistical methods. Another relevant tool to mention is SPSS from IBM. The software offers advanced statistical analysis for users of all skill levels. Thanks to a vast library of machine learning algorithms, text analysis, and a hypothesis testing approach it can help your company find relevant insights to drive better decisions. SPSS also works as a cloud service that enables you to run it anywhere.
- SQL Consoles: SQL is a programming language often used to handle structured data in relational databases. Tools like these are popular among data scientists as they are extremely effective in unlocking these databases' value. Undoubtedly, one of the most used SQL software in the market is MySQL Workbench . This tool offers several features such as a visual tool for database modeling and monitoring, complete SQL optimization, administration tools, and visual performance dashboards to keep track of KPIs.
- Data Visualization: These tools are used to represent your data through charts, graphs, and maps that allow you to find patterns and trends in the data. datapine's already mentioned BI platform also offers a wealth of powerful online data visualization tools with several benefits. Some of them include: delivering compelling data-driven presentations to share with your entire company, the ability to see your data online with any device wherever you are, an interactive dashboard design feature that enables you to showcase your results in an interactive and understandable way, and to perform online self-service reports that can be used simultaneously with several other people to enhance team productivity.
17. Refine your process constantly
Last is a step that might seem obvious to some people, but it can be easily ignored if you think you are done. Once you have extracted the needed results, you should always take a retrospective look at your project and think about what you can improve. As you saw throughout this long list of techniques, data analysis is a complex process that requires constant refinement. For this reason, you should always go one step further and keep improving.
Quality Criteria For Data Analysis
So far we’ve covered a list of methods and techniques that should help you perform efficient data analysis. But how do you measure the quality and validity of your results? This is done with the help of some science quality criteria. Here we will go into a more theoretical area that is critical to understanding the fundamentals of statistical analysis in science. However, you should also be aware of these steps in a business context, as they will allow you to assess the quality of your results in the correct way. Let’s dig in.
- Internal validity: The results of a survey are internally valid if they measure what they are supposed to measure and thus provide credible results. In other words , internal validity measures the trustworthiness of the results and how they can be affected by factors such as the research design, operational definitions, how the variables are measured, and more. For instance, imagine you are doing an interview to ask people if they brush their teeth two times a day. While most of them will answer yes, you can still notice that their answers correspond to what is socially acceptable, which is to brush your teeth at least twice a day. In this case, you can’t be 100% sure if respondents actually brush their teeth twice a day or if they just say that they do, therefore, the internal validity of this interview is very low.
- External validity: Essentially, external validity refers to the extent to which the results of your research can be applied to a broader context. It basically aims to prove that the findings of a study can be applied in the real world. If the research can be applied to other settings, individuals, and times, then the external validity is high.
- Reliability : If your research is reliable, it means that it can be reproduced. If your measurement were repeated under the same conditions, it would produce similar results. This means that your measuring instrument consistently produces reliable results. For example, imagine a doctor building a symptoms questionnaire to detect a specific disease in a patient. Then, various other doctors use this questionnaire but end up diagnosing the same patient with a different condition. This means the questionnaire is not reliable in detecting the initial disease. Another important note here is that in order for your research to be reliable, it also needs to be objective. If the results of a study are the same, independent of who assesses them or interprets them, the study can be considered reliable. Let’s see the objectivity criteria in more detail now.
- Objectivity: In data science, objectivity means that the researcher needs to stay fully objective when it comes to its analysis. The results of a study need to be affected by objective criteria and not by the beliefs, personality, or values of the researcher. Objectivity needs to be ensured when you are gathering the data, for example, when interviewing individuals, the questions need to be asked in a way that doesn't influence the results. Paired with this, objectivity also needs to be thought of when interpreting the data. If different researchers reach the same conclusions, then the study is objective. For this last point, you can set predefined criteria to interpret the results to ensure all researchers follow the same steps.
The discussed quality criteria cover mostly potential influences in a quantitative context. Analysis in qualitative research has by default additional subjective influences that must be controlled in a different way. Therefore, there are other quality criteria for this kind of research such as credibility, transferability, dependability, and confirmability. You can see each of them more in detail on this resource .
Data Analysis Limitations & Barriers
Analyzing data is not an easy task. As you’ve seen throughout this post, there are many steps and techniques that you need to apply in order to extract useful information from your research. While a well-performed analysis can bring various benefits to your organization it doesn't come without limitations. In this section, we will discuss some of the main barriers you might encounter when conducting an analysis. Let’s see them more in detail.
- Lack of clear goals: No matter how good your data or analysis might be if you don’t have clear goals or a hypothesis the process might be worthless. While we mentioned some methods that don’t require a predefined hypothesis, it is always better to enter the analytical process with some clear guidelines of what you are expecting to get out of it, especially in a business context in which data is utilized to support important strategic decisions.
- Objectivity: Arguably one of the biggest barriers when it comes to data analysis in research is to stay objective. When trying to prove a hypothesis, researchers might find themselves, intentionally or unintentionally, directing the results toward an outcome that they want. To avoid this, always question your assumptions and avoid confusing facts with opinions. You can also show your findings to a research partner or external person to confirm that your results are objective.
- Data representation: A fundamental part of the analytical procedure is the way you represent your data. You can use various graphs and charts to represent your findings, but not all of them will work for all purposes. Choosing the wrong visual can not only damage your analysis but can mislead your audience, therefore, it is important to understand when to use each type of data depending on your analytical goals. Our complete guide on the types of graphs and charts lists 20 different visuals with examples of when to use them.
- Flawed correlation : Misleading statistics can significantly damage your research. We’ve already pointed out a few interpretation issues previously in the post, but it is an important barrier that we can't avoid addressing here as well. Flawed correlations occur when two variables appear related to each other but they are not. Confusing correlations with causation can lead to a wrong interpretation of results which can lead to building wrong strategies and loss of resources, therefore, it is very important to identify the different interpretation mistakes and avoid them.
- Sample size: A very common barrier to a reliable and efficient analysis process is the sample size. In order for the results to be trustworthy, the sample size should be representative of what you are analyzing. For example, imagine you have a company of 1000 employees and you ask the question “do you like working here?” to 50 employees of which 49 say yes, which means 95%. Now, imagine you ask the same question to the 1000 employees and 950 say yes, which also means 95%. Saying that 95% of employees like working in the company when the sample size was only 50 is not a representative or trustworthy conclusion. The significance of the results is way more accurate when surveying a bigger sample size.
- Privacy concerns: In some cases, data collection can be subjected to privacy regulations. Businesses gather all kinds of information from their customers from purchasing behaviors to addresses and phone numbers. If this falls into the wrong hands due to a breach, it can affect the security and confidentiality of your clients. To avoid this issue, you need to collect only the data that is needed for your research and, if you are using sensitive facts, make it anonymous so customers are protected. The misuse of customer data can severely damage a business's reputation, so it is important to keep an eye on privacy.
- Lack of communication between teams : When it comes to performing data analysis on a business level, it is very likely that each department and team will have different goals and strategies. However, they are all working for the same common goal of helping the business run smoothly and keep growing. When teams are not connected and communicating with each other, it can directly affect the way general strategies are built. To avoid these issues, tools such as data dashboards enable teams to stay connected through data in a visually appealing way.
- Innumeracy : Businesses are working with data more and more every day. While there are many BI tools available to perform effective analysis, data literacy is still a constant barrier. Not all employees know how to apply analysis techniques or extract insights from them. To prevent this from happening, you can implement different training opportunities that will prepare every relevant user to deal with data.
Key Data Analysis Skills
As you've learned throughout this lengthy guide, analyzing data is a complex task that requires a lot of knowledge and skills. That said, thanks to the rise of self-service tools the process is way more accessible and agile than it once was. Regardless, there are still some key skills that are valuable to have when working with data, we list the most important ones below.
- Critical and statistical thinking: To successfully analyze data you need to be creative and think out of the box. Yes, that might sound like a weird statement considering that data is often tight to facts. However, a great level of critical thinking is required to uncover connections, come up with a valuable hypothesis, and extract conclusions that go a step further from the surface. This, of course, needs to be complemented by statistical thinking and an understanding of numbers.
- Data cleaning: Anyone who has ever worked with data before will tell you that the cleaning and preparation process accounts for 80% of a data analyst's work, therefore, the skill is fundamental. But not just that, not cleaning the data adequately can also significantly damage the analysis which can lead to poor decision-making in a business scenario. While there are multiple tools that automate the cleaning process and eliminate the possibility of human error, it is still a valuable skill to dominate.
- Data visualization: Visuals make the information easier to understand and analyze, not only for professional users but especially for non-technical ones. Having the necessary skills to not only choose the right chart type but know when to apply it correctly is key. This also means being able to design visually compelling charts that make the data exploration process more efficient.
- SQL: The Structured Query Language or SQL is a programming language used to communicate with databases. It is fundamental knowledge as it enables you to update, manipulate, and organize data from relational databases which are the most common databases used by companies. It is fairly easy to learn and one of the most valuable skills when it comes to data analysis.
- Communication skills: This is a skill that is especially valuable in a business environment. Being able to clearly communicate analytical outcomes to colleagues is incredibly important, especially when the information you are trying to convey is complex for non-technical people. This applies to in-person communication as well as written format, for example, when generating a dashboard or report. While this might be considered a “soft” skill compared to the other ones we mentioned, it should not be ignored as you most likely will need to share analytical findings with others no matter the context.
Data Analysis In The Big Data Environment
Big data is invaluable to today’s businesses, and by using different methods for data analysis, it’s possible to view your data in a way that can help you turn insight into positive action.
To inspire your efforts and put the importance of big data into context, here are some insights that you should know:
- By 2026 the industry of big data is expected to be worth approximately $273.4 billion.
- 94% of enterprises say that analyzing data is important for their growth and digital transformation.
- Companies that exploit the full potential of their data can increase their operating margins by 60% .
- We already told you the benefits of Artificial Intelligence through this article. This industry's financial impact is expected to grow up to $40 billion by 2025.
Data analysis concepts may come in many forms, but fundamentally, any solid methodology will help to make your business more streamlined, cohesive, insightful, and successful than ever before.
Key Takeaways From Data Analysis
As we reach the end of our data analysis journey, we leave a small summary of the main methods and techniques to perform excellent analysis and grow your business.
17 Essential Types of Data Analysis Methods:
- Cluster analysis
- Cohort analysis
- Regression analysis
- Factor analysis
- Neural Networks
- Data Mining
- Text analysis
- Time series analysis
- Decision trees
- Conjoint analysis
- Correspondence Analysis
- Multidimensional Scaling
- Content analysis
- Thematic analysis
- Narrative analysis
- Grounded theory analysis
- Discourse analysis
Top 17 Data Analysis Techniques:
- Collaborate your needs
- Establish your questions
- Data democratization
- Think of data governance
- Clean your data
- Set your KPIs
- Omit useless data
- Build a data management roadmap
- Integrate technology
- Answer your questions
- Visualize your data
- Interpretation of data
- Consider autonomous technology
- Build a narrative
- Share the load
- Data Analysis tools
- Refine your process constantly
We’ve pondered the data analysis definition and drilled down into the practical applications of data-centric analytics, and one thing is clear: by taking measures to arrange your data and making your metrics work for you, it’s possible to transform raw information into action - the kind of that will push your business to the next level.
Yes, good data analytics techniques result in enhanced business intelligence (BI). To help you understand this notion in more detail, read our exploration of business intelligence reporting .
And, if you’re ready to perform your own analysis, drill down into your facts and figures while interacting with your data on astonishing visuals, you can try our software for a free, 14-day trial .
Table of Contents
What is data analysis, why is data analysis important, what is the data analysis process, data analysis methods, applications of data analysis, top data analysis techniques to analyze data, what is the importance of data analysis in research, future trends in data analysis, choose the right program, what is data analysis: a comprehensive guide.

In the contemporary business landscape, gaining a competitive edge is imperative, given the challenges such as rapidly evolving markets, economic unpredictability, fluctuating political environments, capricious consumer sentiments, and even global health crises. These challenges have reduced the room for error in business operations. For companies striving not only to survive but also to thrive in this demanding environment, the key lies in embracing the concept of data analysis . This involves strategically accumulating valuable, actionable information, which is leveraged to enhance decision-making processes.
If you're interested in forging a career in data analysis and wish to discover the top data analysis courses in 2024, we invite you to explore our informative video. It will provide insights into the opportunities to develop your expertise in this crucial field.
Data analysis inspects, cleans, transforms, and models data to extract insights and support decision-making. As a data analyst , your role involves dissecting vast datasets, unearthing hidden patterns, and translating numbers into actionable information.
Data analysis plays a pivotal role in today's data-driven world. It helps organizations harness the power of data, enabling them to make decisions, optimize processes, and gain a competitive edge. By turning raw data into meaningful insights, data analysis empowers businesses to identify opportunities, mitigate risks, and enhance their overall performance.
1. Informed Decision-Making
Data analysis is the compass that guides decision-makers through a sea of information. It enables organizations to base their choices on concrete evidence rather than intuition or guesswork. In business, this means making decisions more likely to lead to success, whether choosing the right marketing strategy, optimizing supply chains, or launching new products. By analyzing data, decision-makers can assess various options' potential risks and rewards, leading to better choices.
2. Improved Understanding
Data analysis provides a deeper understanding of processes, behaviors, and trends. It allows organizations to gain insights into customer preferences, market dynamics, and operational efficiency .
3. Competitive Advantage
Organizations can identify opportunities and threats by analyzing market trends, consumer behavior , and competitor performance. They can pivot their strategies to respond effectively, staying one step ahead of the competition. This ability to adapt and innovate based on data insights can lead to a significant competitive advantage.
Become a Data Science & Business Analytics Professional
- 11.5 M Expected New Jobs For Data Science And Analytics
- 28% Annual Job Growth By 2026
- $46K-$100K Average Annual Salary
Post Graduate Program in Data Analytics
- Post Graduate Program certificate and Alumni Association membership
- Exclusive hackathons and Ask me Anything sessions by IBM
Data Analyst
- Industry-recognized Data Analyst Master’s certificate from Simplilearn
- Dedicated live sessions by faculty of industry experts
Here's what learners are saying regarding our programs:
Felix Chong
Project manage , codethink.
After completing this course, I landed a new job & a salary hike of 30%. I now work with Zuhlke Group as a Project Manager.
Gayathri Ramesh
Associate data engineer , publicis sapient.
The course was well structured and curated. The live classes were extremely helpful. They made learning more productive and interactive. The program helped me change my domain from a data analyst to an Associate Data Engineer.
4. Risk Mitigation
Data analysis is a valuable tool for risk assessment and management. Organizations can assess potential issues and take preventive measures by analyzing historical data. For instance, data analysis detects fraudulent activities in the finance industry by identifying unusual transaction patterns. This not only helps minimize financial losses but also safeguards the reputation and trust of customers.
5. Efficient Resource Allocation
Data analysis helps organizations optimize resource allocation. Whether it's allocating budgets, human resources, or manufacturing capacities, data-driven insights can ensure that resources are utilized efficiently. For example, data analysis can help hospitals allocate staff and resources to the areas with the highest patient demand, ensuring that patient care remains efficient and effective.
6. Continuous Improvement
Data analysis is a catalyst for continuous improvement. It allows organizations to monitor performance metrics, track progress, and identify areas for enhancement. This iterative process of analyzing data, implementing changes, and analyzing again leads to ongoing refinement and excellence in processes and products.
The data analysis process is a structured sequence of steps that lead from raw data to actionable insights. Here are the answers to what is data analysis:
- Data Collection: Gather relevant data from various sources, ensuring data quality and integrity.
- Data Cleaning: Identify and rectify errors, missing values, and inconsistencies in the dataset. Clean data is crucial for accurate analysis.
- Exploratory Data Analysis (EDA): Conduct preliminary analysis to understand the data's characteristics, distributions, and relationships. Visualization techniques are often used here.
- Data Transformation: Prepare the data for analysis by encoding categorical variables, scaling features, and handling outliers, if necessary.
- Model Building: Depending on the objectives, apply appropriate data analysis methods, such as regression, clustering, or deep learning.
- Model Evaluation: Depending on the problem type, assess the models' performance using metrics like Mean Absolute Error, Root Mean Squared Error , or others.
- Interpretation and Visualization: Translate the model's results into actionable insights. Visualizations, tables, and summary statistics help in conveying findings effectively.
- Deployment: Implement the insights into real-world solutions or strategies, ensuring that the data-driven recommendations are implemented.
1. Regression Analysis
Regression analysis is a powerful method for understanding the relationship between a dependent and one or more independent variables. It is applied in economics, finance, and social sciences. By fitting a regression model, you can make predictions, analyze cause-and-effect relationships, and uncover trends within your data.
2. Statistical Analysis
Statistical analysis encompasses a broad range of techniques for summarizing and interpreting data. It involves descriptive statistics (mean, median, standard deviation), inferential statistics (hypothesis testing, confidence intervals), and multivariate analysis. Statistical methods help make inferences about populations from sample data, draw conclusions, and assess the significance of results.
3. Cohort Analysis
Cohort analysis focuses on understanding the behavior of specific groups or cohorts over time. It can reveal patterns, retention rates, and customer lifetime value, helping businesses tailor their strategies.
4. Content Analysis
It is a qualitative data analysis method used to study the content of textual, visual, or multimedia data. Social sciences, journalism, and marketing often employ it to analyze themes, sentiments, or patterns within documents or media. Content analysis can help researchers gain insights from large volumes of unstructured data.
5. Factor Analysis
Factor analysis is a technique for uncovering underlying latent factors that explain the variance in observed variables. It is commonly used in psychology and the social sciences to reduce the dimensionality of data and identify underlying constructs. Factor analysis can simplify complex datasets, making them easier to interpret and analyze.
6. Monte Carlo Method
This method is a simulation technique that uses random sampling to solve complex problems and make probabilistic predictions. Monte Carlo simulations allow analysts to model uncertainty and risk, making it a valuable tool for decision-making.
7. Text Analysis
Also known as text mining , this method involves extracting insights from textual data. It analyzes large volumes of text, such as social media posts, customer reviews, or documents. Text analysis can uncover sentiment, topics, and trends, enabling organizations to understand public opinion, customer feedback, and emerging issues.
8. Time Series Analysis
Time series analysis deals with data collected at regular intervals over time. It is essential for forecasting, trend analysis, and understanding temporal patterns. Time series methods include moving averages, exponential smoothing, and autoregressive integrated moving average (ARIMA) models. They are widely used in finance for stock price prediction, meteorology for weather forecasting, and economics for economic modeling.
9. Descriptive Analysis
Descriptive analysis involves summarizing and describing the main features of a dataset. It focuses on organizing and presenting the data in a meaningful way, often using measures such as mean, median, mode, and standard deviation. It provides an overview of the data and helps identify patterns or trends.
10. Inferential Analysis
Inferential analysis aims to make inferences or predictions about a larger population based on sample data. It involves applying statistical techniques such as hypothesis testing, confidence intervals, and regression analysis. It helps generalize findings from a sample to a larger population.
11. Exploratory Data Analysis (EDA)
EDA focuses on exploring and understanding the data without preconceived hypotheses. It involves visualizations, summary statistics, and data profiling techniques to uncover patterns, relationships, and interesting features. It helps generate hypotheses for further analysis.
12. Diagnostic Analysis
Diagnostic analysis aims to understand the cause-and-effect relationships within the data. It investigates the factors or variables that contribute to specific outcomes or behaviors. Techniques such as regression analysis, ANOVA (Analysis of Variance), or correlation analysis are commonly used in diagnostic analysis.
13. Predictive Analysis
Predictive analysis involves using historical data to make predictions or forecasts about future outcomes. It utilizes statistical modeling techniques, machine learning algorithms, and time series analysis to identify patterns and build predictive models. It is often used for forecasting sales, predicting customer behavior, or estimating risk.
14. Prescriptive Analysis
Prescriptive analysis goes beyond predictive analysis by recommending actions or decisions based on the predictions. It combines historical data, optimization algorithms, and business rules to provide actionable insights and optimize outcomes. It helps in decision-making and resource allocation.
Our Data Analyst Master's Program will help you learn analytics tools and techniques to become a Data Analyst expert! It's the pefect course for you to jumpstart your career. Enroll now!
Data analysis is a versatile and indispensable tool that finds applications across various industries and domains. Its ability to extract actionable insights from data has made it a fundamental component of decision-making and problem-solving. Let's explore some of the key applications of data analysis:
1. Business and Marketing
- Market Research: Data analysis helps businesses understand market trends, consumer preferences, and competitive landscapes. It aids in identifying opportunities for product development, pricing strategies, and market expansion.
- Sales Forecasting: Data analysis models can predict future sales based on historical data, seasonality, and external factors. This helps businesses optimize inventory management and resource allocation.
2. Healthcare and Life Sciences
- Disease Diagnosis: Data analysis is vital in medical diagnostics, from interpreting medical images (e.g., MRI, X-rays) to analyzing patient records. Machine learning models can assist in early disease detection.
- Drug Discovery: Pharmaceutical companies use data analysis to identify potential drug candidates, predict their efficacy, and optimize clinical trials.
- Genomics and Personalized Medicine: Genomic data analysis enables personalized treatment plans by identifying genetic markers that influence disease susceptibility and response to therapies.
- Risk Management: Financial institutions use data analysis to assess credit risk, detect fraudulent activities, and model market risks.
- Algorithmic Trading: Data analysis is integral to developing trading algorithms that analyze market data and execute trades automatically based on predefined strategies.
- Fraud Detection: Credit card companies and banks employ data analysis to identify unusual transaction patterns and detect fraudulent activities in real time.
4. Manufacturing and Supply Chain
- Quality Control: Data analysis monitors and controls product quality on manufacturing lines. It helps detect defects and ensure consistency in production processes.
- Inventory Optimization: By analyzing demand patterns and supply chain data, businesses can optimize inventory levels, reduce carrying costs, and ensure timely deliveries.
5. Social Sciences and Academia
- Social Research: Researchers in social sciences analyze survey data, interviews, and textual data to study human behavior, attitudes, and trends. It helps in policy development and understanding societal issues.
- Academic Research: Data analysis is crucial to scientific physics, biology, and environmental science research. It assists in interpreting experimental results and drawing conclusions.
6. Internet and Technology
- Search Engines: Google uses complex data analysis algorithms to retrieve and rank search results based on user behavior and relevance.
- Recommendation Systems: Services like Netflix and Amazon leverage data analysis to recommend content and products to users based on their past preferences and behaviors.
7. Environmental Science
- Climate Modeling: Data analysis is essential in climate science. It analyzes temperature, precipitation, and other environmental data. It helps in understanding climate patterns and predicting future trends.
- Environmental Monitoring: Remote sensing data analysis monitors ecological changes, including deforestation, water quality, and air pollution.
1. Descriptive Statistics
Descriptive statistics provide a snapshot of a dataset's central tendencies and variability. These techniques help summarize and understand the data's basic characteristics.
2. Inferential Statistics
Inferential statistics involve making predictions or inferences based on a sample of data. Techniques include hypothesis testing, confidence intervals, and regression analysis. These methods are crucial for drawing conclusions from data and assessing the significance of findings.
3. Regression Analysis
It explores the relationship between one or more independent variables and a dependent variable. It is widely used for prediction and understanding causal links. Linear, logistic, and multiple regression are common in various fields.
4. Clustering Analysis
It is an unsupervised learning method that groups similar data points. K-means clustering and hierarchical clustering are examples. This technique is used for customer segmentation, anomaly detection, and pattern recognition.
5. Classification Analysis
Classification analysis assigns data points to predefined categories or classes. It's often used in applications like spam email detection, image recognition, and sentiment analysis. Popular algorithms include decision trees, support vector machines, and neural networks.
6. Time Series Analysis
Time series analysis deals with data collected over time, making it suitable for forecasting and trend analysis. Techniques like moving averages, autoregressive integrated moving averages (ARIMA), and exponential smoothing are applied in fields like finance, economics, and weather forecasting.
7. Text Analysis (Natural Language Processing - NLP)
Text analysis techniques, part of NLP , enable extracting insights from textual data. These methods include sentiment analysis, topic modeling, and named entity recognition. Text analysis is widely used for analyzing customer reviews, social media content, and news articles.
8. Principal Component Analysis
It is a dimensionality reduction technique that simplifies complex datasets while retaining important information. It transforms correlated variables into a set of linearly uncorrelated variables, making it easier to analyze and visualize high-dimensional data.
9. Anomaly Detection
Anomaly detection identifies unusual patterns or outliers in data. It's critical in fraud detection, network security, and quality control. Techniques like statistical methods, clustering-based approaches, and machine learning algorithms are employed for anomaly detection.
10. Data Mining
Data mining involves the automated discovery of patterns, associations, and relationships within large datasets. Techniques like association rule mining, frequent pattern analysis, and decision tree mining extract valuable knowledge from data.
11. Machine Learning and Deep Learning
ML and deep learning algorithms are applied for predictive modeling, classification, and regression tasks. Techniques like random forests, support vector machines, and convolutional neural networks (CNNs) have revolutionized various industries, including healthcare, finance, and image recognition.
12. Geographic Information Systems (GIS) Analysis
GIS analysis combines geographical data with spatial analysis techniques to solve location-based problems. It's widely used in urban planning, environmental management, and disaster response.
- Uncovering Patterns and Trends: Data analysis allows researchers to identify patterns, trends, and relationships within the data. By examining these patterns, researchers can better understand the phenomena under investigation. For example, in epidemiological research, data analysis can reveal the trends and patterns of disease outbreaks, helping public health officials take proactive measures.
- Testing Hypotheses: Research often involves formulating hypotheses and testing them. Data analysis provides the means to evaluate hypotheses rigorously. Through statistical tests and inferential analysis, researchers can determine whether the observed patterns in the data are statistically significant or simply due to chance.
- Making Informed Conclusions: Data analysis helps researchers draw meaningful and evidence-based conclusions from their research findings. It provides a quantitative basis for making claims and recommendations. In academic research, these conclusions form the basis for scholarly publications and contribute to the body of knowledge in a particular field.
- Enhancing Data Quality: Data analysis includes data cleaning and validation processes that improve the quality and reliability of the dataset. Identifying and addressing errors, missing values, and outliers ensures that the research results accurately reflect the phenomena being studied.
- Supporting Decision-Making: In applied research, data analysis assists decision-makers in various sectors, such as business, government, and healthcare. Policy decisions, marketing strategies, and resource allocations are often based on research findings.
- Identifying Outliers and Anomalies: Outliers and anomalies in data can hold valuable information or indicate errors. Data analysis techniques can help identify these exceptional cases, whether medical diagnoses, financial fraud detection, or product quality control.
- Revealing Insights: Research data often contain hidden insights that are not immediately apparent. Data analysis techniques, such as clustering or text analysis, can uncover these insights. For example, social media data sentiment analysis can reveal public sentiment and trends on various topics in social sciences.
- Forecasting and Prediction: Data analysis allows for the development of predictive models. Researchers can use historical data to build models forecasting future trends or outcomes. This is valuable in fields like finance for stock price predictions, meteorology for weather forecasting, and epidemiology for disease spread projections.
- Optimizing Resources: Research often involves resource allocation. Data analysis helps researchers and organizations optimize resource use by identifying areas where improvements can be made, or costs can be reduced.
- Continuous Improvement: Data analysis supports the iterative nature of research. Researchers can analyze data, draw conclusions, and refine their hypotheses or research designs based on their findings. This cycle of analysis and refinement leads to continuous improvement in research methods and understanding.
Data analysis is an ever-evolving field driven by technological advancements. The future of data analysis promises exciting developments that will reshape how data is collected, processed, and utilized. Here are some of the key trends of data analysis:
1. Artificial Intelligence and Machine Learning Integration
Artificial intelligence (AI) and machine learning (ML) are expected to play a central role in data analysis. These technologies can automate complex data processing tasks, identify patterns at scale, and make highly accurate predictions. AI-driven analytics tools will become more accessible, enabling organizations to harness the power of ML without requiring extensive expertise.
2. Augmented Analytics
Augmented analytics combines AI and natural language processing (NLP) to assist data analysts in finding insights. These tools can automatically generate narratives, suggest visualizations, and highlight important trends within data. They enhance the speed and efficiency of data analysis, making it more accessible to a broader audience.
3. Data Privacy and Ethical Considerations
As data collection becomes more pervasive, privacy concerns and ethical considerations will gain prominence. Future data analysis trends will prioritize responsible data handling, transparency, and compliance with regulations like GDPR . Differential privacy techniques and data anonymization will be crucial in balancing data utility with privacy protection.
4. Real-time and Streaming Data Analysis
The demand for real-time insights will drive the adoption of real-time and streaming data analysis. Organizations will leverage technologies like Apache Kafka and Apache Flink to process and analyze data as it is generated. This trend is essential for fraud detection, IoT analytics, and monitoring systems.
5. Quantum Computing
It can potentially revolutionize data analysis by solving complex problems exponentially faster than classical computers. Although quantum computing is in its infancy, its impact on optimization, cryptography , and simulations will be significant once practical quantum computers become available.
6. Edge Analytics
With the proliferation of edge devices in the Internet of Things (IoT), data analysis is moving closer to the data source. Edge analytics allows for real-time processing and decision-making at the network's edge, reducing latency and bandwidth requirements.
7. Explainable AI (XAI)
Interpretable and explainable AI models will become crucial, especially in applications where trust and transparency are paramount. XAI techniques aim to make AI decisions more understandable and accountable, which is critical in healthcare and finance.
8. Data Democratization
The future of data analysis will see more democratization of data access and analysis tools. Non-technical users will have easier access to data and analytics through intuitive interfaces and self-service BI tools , reducing the reliance on data specialists.
9. Advanced Data Visualization
Data visualization tools will continue to evolve, offering more interactivity, 3D visualization, and augmented reality (AR) capabilities. Advanced visualizations will help users explore data in new and immersive ways.
10. Ethnographic Data Analysis
Ethnographic data analysis will gain importance as organizations seek to understand human behavior, cultural dynamics, and social trends. This qualitative data analysis approach and quantitative methods will provide a holistic understanding of complex issues.
11. Data Analytics Ethics and Bias Mitigation
Ethical considerations in data analysis will remain a key trend. Efforts to identify and mitigate bias in algorithms and models will become standard practice, ensuring fair and equitable outcomes.
Our Data Analytics courses have been meticulously crafted to equip you with the necessary skills and knowledge to thrive in this swiftly expanding industry. Our instructors will lead you through immersive, hands-on projects, real-world simulations, and illuminating case studies, ensuring you gain the practical expertise necessary for success. Through our courses, you will acquire the ability to dissect data, craft enlightening reports, and make data-driven choices that have the potential to steer businesses toward prosperity.
Having addressed the question of what is data analysis, if you're considering a career in data analytics, it's advisable to begin by researching the prerequisites for becoming a data analyst. You may also want to explore the Post Graduate Program in Data Analytics offered in collaboration with Purdue University. This program offers a practical learning experience through real-world case studies and projects aligned with industry needs. It provides comprehensive exposure to the essential technologies and skills currently employed in the field of data analytics.
Program Name Data Analyst Post Graduate Program In Data Analytics Data Analytics Bootcamp Geo All Geos All Geos US University Simplilearn Purdue Caltech Course Duration 11 Months 8 Months 6 Months Coding Experience Required No Basic No Skills You Will Learn 10+ skills including Python, MySQL, Tableau, NumPy and more Data Analytics, Statistical Analysis using Excel, Data Analysis Python and R, and more Data Visualization with Tableau, Linear and Logistic Regression, Data Manipulation and more Additional Benefits Applied Learning via Capstone and 20+ industry-relevant Data Analytics projects Purdue Alumni Association Membership Free IIMJobs Pro-Membership of 6 months Access to Integrated Practical Labs Caltech CTME Circle Membership Cost $$ $$$$ $$$$ Explore Program Explore Program Explore Program
1. What is the difference between data analysis and data science?
Data analysis primarily involves extracting meaningful insights from existing data using statistical techniques and visualization tools. Whereas, data science encompasses a broader spectrum, incorporating data analysis as a subset while involving machine learning, deep learning, and predictive modeling to build data-driven solutions and algorithms.
2. What are the common mistakes to avoid in data analysis?
Common mistakes to avoid in data analysis include neglecting data quality issues, failing to define clear objectives, overcomplicating visualizations, not considering algorithmic biases, and disregarding the importance of proper data preprocessing and cleaning. Additionally, avoiding making unwarranted assumptions and misinterpreting correlation as causation in your analysis is crucial.
Data Science & Business Analytics Courses Duration and Fees
Data Science & Business Analytics programs typically range from a few weeks to several months, with fees varying based on program and institution.
Learn from Industry Experts with free Masterclasses
Data science & business analytics.
How Can You Master the Art of Data Analysis: Uncover the Path to Career Advancement
Develop Your Career in Data Analytics with Purdue University Professional Certificate
Career Masterclass: How to Get Qualified for a Data Analytics Career
Recommended Reads
Big Data Career Guide: A Comprehensive Playbook to Becoming a Big Data Engineer
Why Python Is Essential for Data Analysis and Data Science?
All the Ins and Outs of Exploratory Data Analysis
The Rise of the Data-Driven Professional: 6 Non-Data Roles That Need Data Analytics Skills
Exploratory Data Analysis [EDA]: Techniques, Best Practices and Popular Applications
The Best Spotify Data Analysis Project You Need to Know
Get Affiliated Certifications with Live Class programs
- PMP, PMI, PMBOK, CAPM, PgMP, PfMP, ACP, PBA, RMP, SP, and OPM3 are registered marks of the Project Management Institute, Inc.
Log in using your username and password
- Search More Search for this keyword Advanced search
- Latest content
- Current issue
- Write for Us
- BMJ Journals More You are viewing from: Google Indexer
You are here
- Volume 3, Issue 3
- Data analysis in qualitative research
- Article Text
- Article info
- Citation Tools
- Rapid Responses
- Article metrics
- Sally Thorne , RN, PhD
- School of Nursing, University of British Columbia Vancouver, British Columbia, Canada
https://doi.org/10.1136/ebn.3.3.68
Statistics from Altmetric.com
Request permissions.
If you wish to reuse any or all of this article please use the link below which will take you to the Copyright Clearance Center’s RightsLink service. You will be able to get a quick price and instant permission to reuse the content in many different ways.
Unquestionably, data analysis is the most complex and mysterious of all of the phases of a qualitative project, and the one that receives the least thoughtful discussion in the literature. For neophyte nurse researchers, many of the data collection strategies involved in a qualitative project may feel familiar and comfortable. After all, nurses have always based their clinical practice on learning as much as possible about the people they work with, and detecting commonalities and variations among and between them in order to provide individualised care. However, creating a database is not sufficient to conduct a qualitative study. In order to generate findings that transform raw data into new knowledge, a qualitative researcher must engage in active and demanding analytic processes throughout all phases of the research. Understanding these processes is therefore an important aspect not only of doing qualitative research, but also of reading, understanding, and interpreting it.
For readers of qualitative studies, the language of analysis can be confusing. It is sometimes difficult to know what the researchers actually did during this phase and to understand how their findings evolved out of the data that were collected or constructed. Furthermore, in describing their processes, some authors use language that accentuates this sense of mystery and magic. For example, they may claim that their conceptual categories “emerged” from the data 1 —almost as if they left the raw data out overnight and awoke to find that the data analysis fairies had organised the data into a coherent new structure that explained everything! In this EBN notebook, I will try to help readers make sense of some of the assertions that are made about qualitative data analysis so that they can develop a critical eye for when an analytical claim is convincing and when it is not.
Qualitative data
Qualitative data come in various forms. In many qualitative nursing studies, the database consists of interview transcripts from open ended, focused, but exploratory interviews. However, there is no limit to what might possibly constitute a qualitative database, and increasingly we are seeing more and more creative use of such sources as recorded observations (both video and participatory), focus groups, texts and documents, multi-media or public domain sources, policy manuals, photographs, and lay autobiographical accounts.
Qualitative analytic reasoning processes
What makes a study qualitative is that it usually relies on inductive reasoning processes to interpret and structure the meanings that can be derived from data. Distinguishing inductive from deductive inquiry processes is an important step in identifying what counts as qualitative research. Generally, inductive reasoning uses the data to generate ideas (hypothesis generating), whereas deductive reasoning begins with the idea and uses the data to confirm or negate the idea (hypothesis testing). 2 In actual practice, however, many quantitative studies involve much inductive reasoning, whereas good qualitative analysis often requires access to a full range of strategies. 3 A traditional quantitative study in the health sciences typically begins with a theoretical grounding, takes direction from hypotheses or explicit study questions, and uses a predetermined (and auditable) set of steps to confirm or refute the hypothesis. It does this to add evidence to the development of specific, causal, and theoretical explanations of phenomena. 3 In contrast, qualitative research often takes the position that an interpretive understanding is only possible by way of uncovering or deconstructing the meanings of a phenomenon. Thus, a distinction between explaining how something operates (explanation) and why it operates in the manner that it does (interpretation) may be a more effective way to distinguish quantitative from qualitative analytic processes involved in any particular study.
Because data collection and analysis processes tend to be concurrent, with new analytic steps informing the process of additional data collection and new data informing the analytic processes, it is important to recognise that qualitative data analysis processes are not entirely distinguishable from the actual data. The theoretical lens from which the researcher approaches the phenomenon, the strategies that the researcher uses to collect or construct data, and the understandings that the researcher has about what might count as relevant or important data in answering the research question are all analytic processes that influence the data. Analysis also occurs as an explicit step in conceptually interpreting the data set as a whole, using specific analytic strategies to transform the raw data into a new and coherent depiction of the thing being studied. Although there are many qualitative data analysis computer programs available on the market today, these are essentially aids to sorting and organising sets of qualitative data, and none are capable of the intellectual and conceptualising processes required to transform data into meaningful findings.
Specific analytic strategies
Although a description of the actual procedural details and nuances of every qualitative data analysis strategy is well beyond the scope of a short paper, a general appreciation of the theoretical assumptions underlying some of the more common approaches can be helpful in understanding what a researcher is trying to say about how data were sorted, organised, conceptualised, refined, and interpreted.
CONSTANT COMPARATIVE ANALYSIS
Many qualitative analytic strategies rely on a general approach called “constant comparative analysis”. Originally developed for use in the grounded theory methodology of Glaser and Strauss, 4 which itself evolved out of the sociological theory of symbolic interactionism, this strategy involves taking one piece of data (one interview, one statement, one theme) and comparing it with all others that may be similar or different in order to develop conceptualisations of the possible relations between various pieces of data. For example, by comparing the accounts of 2 different people who had a similar experience, a researcher might pose analytical questions like: why is this different from that? and how are these 2 related? In many qualitative studies whose purpose it is to generate knowledge about common patterns and themes within human experience, this process continues with the comparison of each new interview or account until all have been compared with each other. A good example of this process is reported in a grounded theory study of how adults with brain injury cope with the social attitudes they face (see Evidence-Based Nursing , April 1999, p64).
Constant comparison analysis is well suited to grounded theory because this design is specifically used to study those human phenomena for which the researcher assumes that fundamental social processes explain something of human behaviour and experience, such as stages of grieving or processes of recovery. However, many other methodologies draw from this analytical strategy to create knowledge that is more generally descriptive or interpretive, such as coping with cancer, or living with illness. Naturalistic inquiry, thematic analysis, and interpretive description are methods that depend on constant comparative analysis processes to develop ways of understanding human phenomena within the context in which they are experienced.
PHENOMENOLOGICAL APPROACHES
Constant comparative analysis is not the only approach in qualitative research. Some qualitative methods are not oriented toward finding patterns and commonalities within human experience, but instead seek to discover some of the underlying structure or essence of that experience through the intensive study of individual cases. For example, rather than explain the stages and transitions within grieving that are common to people in various circumstances, a phenomenological study might attempt to uncover and describe the essential nature of grieving and represent it in such a manner that a person who had not grieved might begin to appreciate the phenomenon. The analytic methods that would be employed in these studies explicitly avoid cross comparisons and instead orient the researcher toward the depth and detail that can be appreciated only through an exhaustive, systematic, and reflective study of experiences as they are lived.
Although constant comparative methods might well permit the analyst to use some pre-existing or emergent theory against which to test all new pieces of data that are collected, these more phenomenological approaches typically challenge the researcher to set aside or “bracket” all such preconceptions so that they can work inductively with the data to generate entirely new descriptions and conceptualisations. There are numerous forms of phenomenological research; however, many of the most popular approaches used by nurses derive from the philosophical work of Husserl on modes of awareness (epistemology) and the hermeneutic tradition of Heidegger, which emphasises modes of being (ontology). 5 These approaches differ from one another in the degree to which interpretation is acceptable, but both represent strategies for immersing oneself in data, engaging with data reflectively, and generating a rich description that will enlighten a reader as to the deeper essential structures underlying a particular human experience. Examples of the kinds of human experience that are amenable to this type of inquiry are the suffering experienced by individuals who have a drinking problem (see Evidence-Based Nursing , October 1998, p134) and the emotional experiences of parents of terminally ill adolescents (see Evidence-Based Nursing , October 1999, p132). Sometimes authors explain their approaches not by the phenomenological position they have adopted, but by naming the theorist whose specific techniques they are borrowing. Colaizzi and Giorgi are phenomenologists who have rendered the phenomenological attitude into a set of manageable steps and processes for working with such data and have therefore become popular reference sources among phenomenological nurse researchers.
ETHNOGRAPHIC METHODS
Ethnographic research methods derive from anthropology's tradition of interpreting the processes and products of cultural behaviour. Ethnographers documented such aspects of human experience as beliefs, kinship patterns and ways of living. In the healthcare field, nurses and others have used ethnographic methods to uncover and record variations in how different social and cultural groups understand and enact health and illness. An example of this kind of study is an investigation of how older adults adjust to living in a nursing home environment (see Evidence-Based Nursing , October 1999, p136). When a researcher claims to have used ethnographic methods, we can assume that he or she has come to know a culture or group through immersion and engagement in fieldwork or participant observation and has also undertaken to portray that culture through text. 6 Ethnographic analysis uses an iterative process in which cultural ideas that arise during active involvement “in the field” are transformed, translated, or represented in a written document. It involves sifting and sorting through pieces of data to detect and interpret thematic categorisations, search for inconsistencies and contradictions, and generate conclusions about what is happening and why.
NARRATIVE ANALYSIS AND DISCOURSE ANALYSIS
Many qualitative nurse researchers have discovered the extent to which human experience is shaped, transformed, and understood through linguistic representation. The vague and subjective sensations that characterise cognitively unstructured life experiences take on meaning and order when we try to articulate them in communication. Putting experience into words, whether we do this verbally, in writing, or in thought, transforms the actual experience into a communicable representation of it. Thus, speech forms are not the experiences themselves, but a socially and culturally constructed device for creating shared understandings about them. Narrative analysis is a strategy that recognises the extent to which the stories we tell provide insights about our lived experiences. 7 For example, it was used as a strategy to learn more about the experiences of women who discover that they have a breast lump (see Evidence-Based Nursing , July 1999, p93). Through analytic processes that help us detect the main narrative themes within the accounts people give about their lives, we discover how they understand and make sense of their lives.
By contrast, discourse analysis recognises speech not as a direct representation of human experience, but as an explicit linguistic tool constructed and shaped by numerous social or ideological influences. Discourse analysis strategies draw heavily upon theories developed in such fields as sociolinguistics and cognitive psychology to try to understand what is represented by the various ways in which people communicate ideas. They capitalise on critical inquiry into the language that is used and the way that it is used to uncover the societal influences underlying our behaviours and thoughts. 8 Thus, although discourse analysis and narrative analysis both rely heavily on speech as the most relevant data form, their reasons for analysing speech differ. The table ⇓ illustrates the distinctions among the analytic strategies described above using breast cancer research as an example.
- View inline
General distinctions between selected qualitative research approaches: an illustration using breast cancer research
Cognitive processes inherent in qualitative analysis
The term “qualitative research” encompasses a wide range of philosophical positions, methodological strategies, and analytical procedures. Morse 1 has summarised the cognitive processes involved in qualitative research in a way that can help us to better understand how the researcher's cognitive processes interact with qualitative data to bring about findings and generate new knowledge. Morse believes that all qualitative analysis, regardless of the specific approach, involves:
comprehending the phenomenon under study
synthesising a portrait of the phenomenon that accounts for relations and linkages within its aspects
theorising about how and why these relations appear as they do, and
recontextualising , or putting the new knowledge about phenomena and relations back into the context of how others have articulated the evolving knowledge.
Although the form that each of these steps will take may vary according to such factors as the research question, the researcher's orientation to the inquiry, or the setting and context of the study, this set of steps helps to depict a series of intellectual processes by which data in their raw form are considered, examined, and reformulated to become a research product.
Quality measures in qualitative analysis
It used to be a tradition among qualitative nurse researchers to claim that such issues as reliability and validity were irrelevant to the qualitative enterprise. Instead, they might say that the proof of the quality of the work rested entirely on the reader's acceptance or rejection of the claims that were made. If the findings “rang true” to the intended audience, then the qualitative study was considered successful. More recently, nurse researchers have taken a lead among their colleagues in other disciplines in trying to work out more formally how the quality of a piece of qualitative research might be judged. Many of these researchers have concluded that systematic, rigorous, and auditable analytical processes are among the most significant factors distinguishing good from poor quality research. 9 Researchers are therefore encouraged to articulate their findings in such a manner that the logical processes by which they were developed are accessible to a critical reader, the relation between the actual data and the conclusions about data is explicit, and the claims made in relation to the data set are rendered credible and believable. Through this short description of analytical approaches, readers will be in a better position to critically evaluate individual qualitative studies, and decide whether and when to apply the findings of such studies to their nursing practice.
- ↵ Morse JM. “Emerging from the data”: the cognitive processes of analysis in qualitative inquiry. In: JM Morse, editor. Critical issues in qualitative research methods . Thousand Oaks, CA: Sage, 1994:23–43.
- ↵ Holloway I. Basic concepts for qualitative research . Oxford: Blackwell Science, 1997.
- ↵ Schwandt TA. Qualitative inquiry: a dictionary of terms . Thousand Oaks, CA: Sage, 1997.
- ↵ Glaser BG, Strauss AL. The discovery of grounded theory . Hawthorne, NY: Aldine, 1967.
- ↵ Ray MA. The richness of phenomenology: philosophic, theoretic, and methodologic concerns. In: J M Morse, editor. Critical issues in qualitative research methods . Thousand Oaks, CA: Sage, 1994:117–33.
- ↵ Boyle JS. Styles of ethnography. In: JM Morse, editor. Critical issues in qualitative research methods .. Thousand Oaks, CA: Sage, 1994:159–85.
- ↵ Sandelowski M. We are the stories we tell: narrative knowing in nursing practice. J Holist Nurs 1994 ; 12 : 23 –33. OpenUrl CrossRef PubMed
- ↵ Boutain DM. Critical language and discourse study: their transformative relevance for critical nursing inquiry. ANS Adv Nurs Sci 1999 ; 21 : 1 –8.
- ↵ Thorne S. The art (and science) of critiquing qualitative research. In: JM Morse, editor. Completing a qualitative project: details and dialogue . Thousand Oaks, CA: Sage, 1997:117–32.
Read the full text or download the PDF:
Thrive On: The Campaign for Utica University → Delays Due to Weather → -->

What Does a Data Analyst Do? A Job Breakdown
April 22, 2024
The surge of digitalization across industries has sparked a revolution in how companies understand and use their data. At the heart of this revolution are data analysts, the professionals who meticulously explore, process, and interpret data to unearth valuable insights.
If you’re looking to ride this wave, understanding the ins and outs of a data analyst's role is crucial. In this article, we’ll shed light on what a data analyst does, the skills they need to be effective, and the industries in need of their services.
First, what is data analysis?
Data analysis is the foundation upon which modern business strategies are built. It involves scrutinizing, cleansing, transforming, and modeling data with the goal of discovering useful information to support decision-making.
In the current business landscape, data analysis acts as a compass, guiding companies through complex market dynamics, customer preferences, and operational efficiency. The insights gleaned from data analysis enable businesses to innovate and stay competitive in their respective markets.
What does a data analyst do?
In the simplest terms, a data analyst's core responsibility is to make sense of data. They collect, process, and model data to discover trends and patterns, which ultimately guide strategic business decisions. The data analyst role is interdisciplinary in that it sits at the intersection of statistics, technology, and business acumen.
Common data analyst duties:
- Data collection: Data analysts often develop and manage databases, collecting raw data from various internal and external sources.
- Data cleaning and transformation: The gathered data is often plagued with errors and redundancies. Data analysts clean and transform it into a reliable format for analysis.
- Data modeling: Using statistical methods, analysts build models that can predict outcomes or uncover trends in the data.
- Data visualization: Once meaningful trends are discovered, analysts create reports and dashboards to visualize them for stakeholders using tools like Tableau or Power BI.
- Data insights: The final and arguably most important step is to extract actionable insights from the data and present these findings in a business context.
What skills do data analysts need to succeed?
The data analyst job description demands a unique combination of skills that span both technical prowess and interpersonal abilities. To excel in this position, one must have a deep understanding of data manipulation tools and programming languages. Equally important are the soft skills that support the technical aspects of the job.
Let's take a closer look at some important data analyst skills:
Technical skills for data analysts:
- Statistics: A firm grasp of statistical techniques is non-negotiable. It includes understanding distributions, hypothesis testing, and regression analysis.
- Data tools: Mastering tools like R, Python, and SQL is pivotal for managing, analyzing, and reporting on data.
- Database knowledge: Familiarity with database technologies (relational or NoSQL) is important for extracting and managing data.
- Machine learning: An understanding of machine learning models can elevate data predictions and insights.
Transferrable skills for data analysts:
- Analytical thinking: The ability to break down complex problems and execute projects with precise logic is important for this role.
- Communication: Data analysts must be adept at translating technical findings into actionable insights for non-technical stakeholders.
- Teamwork: Collaborating with team members on various aspects of data projects is common, so strong collaboration skills are key.
- Curiosity: A thirst for understanding the 'why' behind the data trends is essential for continuous learning and improved analysis.
Where do data analysts work?
An appealing aspect of a career in data analytics is its extreme versatility and broad applicability. Virtually every organization has access to some type of data that could help inform business decisions.
This universal need for data-driven insights opens up a variety of opportunities for professionals in the field. In fact, jobs in this sector are projected to grow at a rate much faster than average, according to the U.S. Bureau of Labor Statistics.
While every field could benefit from this role, there are some that are especially reliant on data analyst skills. Here’s a look at five industries where data analysts are in high demand.
Top industries for data analysts:
- Finance: In banking and investment firms, data analysts assess financial risks and predict market trends. They utilize advanced statistical tools and models to help make data-driven decisions about where to allocate resources and how to mitigate potential financial losses.
- Healthcare: Data analysts mine health records to identify patterns and trends that can significantly improve patient outcomes and increase operational efficiencies. This analytical approach enables healthcare providers to offer more personalized and effective care, ultimately enhancing the overall quality of healthcare services.
- Retail: Analytics play a crucial role in deciphering customer behavior patterns, optimizing inventory levels, and accurately forecasting future sales. By analyzing vast amounts of data, retailers can make informed decisions about product placement, promotional strategies, and stock management.
- Supply Chain: Data analysts are critical for optimizing logistics and operations. They use data to forecast demand, manage inventory levels, streamline shipping and delivery processes, and minimize costs. By analyzing supplier performance, transportation patterns, and warehouse efficiency, they help ensure that products move efficiently from point A to point B.
- Energy: In the energy sector, data analysts help predict consumption patterns, optimize resource allocation, and enhance sustainability efforts. By analyzing data from a variety of sources, they inform strategies for renewable energy development, efficient grid management, and reducing environmental impact.
Build a career in data analytics
The role of a data analyst is vital in today’s landscape where data is an indispensable asset. It's a career that offers both high demand and high job satisfaction for those with an analytical mind and appetite for continual learning.
If this describes you and you’re interested in capitalizing on the demand for data analysts, take the first step on this promising career path by exploring education opportunities. Utica University offers industry-relevant online programs that blend academic coursework with practical, hands-on learning experiences – all administered by faculty who are experts in the industry.
Learn more by exploring our Business Data Analytics program today!
Ready to Take the Next Step?

Request Information
We're excited you're interested in learning more about Utica University. Please fill out and submit the form, and we'll be in touch shortly!
I authorize Utica University and its representatives to contact me via SMS or phone. By submitting this form, I am providing my consent. Message and data rates may apply.
I would like to see logins and resources for:
For a general list of frequently used logins, you can also visit our logins page .
2024 Theses Doctoral
Statistically Efficient Methods for Computation-Aware Uncertainty Quantification and Rare-Event Optimization
He, Shengyi
The thesis covers two fundamental topics that are important across the disciplines of operations research, statistics and even more broadly, namely stochastic optimization and uncertainty quantification, with the common theme to address both statistical accuracy and computational constraints. Here, statistical accuracy encompasses the precision of estimated solutions in stochastic optimization, as well as the tightness or reliability of confidence intervals. Computational concerns arise from rare events or expensive models, necessitating efficient sampling methods or computation procedures. In the first half of this thesis, we study stochastic optimization that involves rare events, which arises in various contexts including risk-averse decision-making and training of machine learning models. Because of the presence of rare events, crude Monte Carlo methods can be prohibitively inefficient, as it takes a sample size reciprocal to the rare-event probability to obtain valid statistical information about the rare-event. To address this issue, we investigate the use of importance sampling (IS) to reduce the required sample size. IS is commonly used to handle rare events, and the idea is to sample from an alternative distribution that hits the rare event more frequently and adjusts the estimator with a likelihood ratio to retain unbiasedness. While IS has been long studied, most of its literature focuses on estimation problems and methodologies to obtain good IS in these contexts. Contrary to these studies, the first half of this thesis provides a systematic study on the efficient use of IS in stochastic optimization. In Chapter 2, we propose an adaptive procedure that converts an efficient IS for gradient estimation to an efficient IS procedure for stochastic optimization. Then, in Chapter 3, we provide an efficient IS for gradient estimation, which serves as the input for the procedure in Chapter 2. In the second half of this thesis, we study uncertainty quantification in the sense of constructing a confidence interval (CI) for target model quantities or prediction. We are interested in the setting of expensive black-box models, which means that we are confined to using a low number of model runs, and we also lack the ability to obtain auxiliary model information such as gradients. In this case, a classical method is batching, which divides data into a few batches and then constructs a CI based on the batched estimates. Another method is the recently proposed cheap bootstrap that is constructed on a few resamples in a similar manner as batching. These methods could save computation since they do not need an accurate variability estimator which requires sufficient model evaluations to obtain. Instead, they cancel out the variability when constructing pivotal statistics, and thus obtain asymptotically valid t-distribution-based CIs with only few batches or resamples. The second half of this thesis studies several theoretical aspects of these computation-aware CI construction methods. In Chapter 4, we study the statistical optimality on CI tightness among various computation-aware CIs. Then, in Chapter 5, we study the higher-order coverage errors of batching methods. Finally, Chapter 6 is a related investigation on the higher-order coverage and correction of distributionally robust optimization (DRO) as another CI construction tool, which assumes an amount of analytical information on the model but bears similarity to Chapter 5 in terms of analysis techniques.
- Operations research
- Stochastic processes--Mathematical models
- Mathematical optimization
- Bootstrap (Statistics)
- Sampling (Statistics)

More About This Work
- DOI Copy DOI to clipboard
- Research and Economic Development
- UB Directory
Published June 3, 2024
research news
IBM director of research explains how AI can help companies leverage data

Dario Gil, IBM senior vice president and director of research, discusses “Exploring the Future of AI for Maximum Industry Impact” at the sixth edition of the UB | AI Chat Series, held at UB’s Center of Excellence in Bioinformatics and Life Sciences on the Downtown Campus. Photo: Douglas Levere
By TOM DINKI
Dario Gil, IBM senior vice president and director of research, wants you to think about artificial intelligence differently.
While large language models like ChatGPT and their ability to converse may get much of the attention, Gil says the real value of AI is in the unprecedented amount of data that it can analyze and what we as humans then do with that analysis.
“Don’t be an AI user, be an AI value creator,” Gil told an audience of UB faculty, students and stakeholders Friday on the Downtown Campus. “Use the technology but think more structurally about how to create value in whatever domain you are in, whether you’re a professor or student or an institution. A lot of this is going to be taking the data in your fields and going on this journey of unlocking its true value by embracing the power of this new representation and fully exploiting what it gives us.”
Gil gave the keynote address of the sixth edition of the UB | AI Chat Series, titled “Exploring the Future of AI for Maximum Industry Impact.”
The event included a panel featuring Gil and other officials from some of the nation’s leading businesses. Moderated by Kemper Lewis, dean of the School of Engineering and Applied Sciences, the panelists discussed the ways their companies are currently using AI and how they’ll use it in the future.

UB engineering dean Kemper Lewis (far right, at the podium) moderates a panel of industry leaders that includes (from left) Jose Pinto, Chris Tolomeo and Dario Gil. Photo: Douglas Levere
A clear consensus emerged: AI will help companies take full advantage of their data.
Gil, who directs IBM’s strategies in AI, semiconductors and quantum computing, explained how AI, neural networks in particular, transform our information — documents, images and even speech — and transform them into what’s known in the AI field as tokens. Foundational models can intake tens of trillions of these tokens, worth many terabytes of data.
“When you actually represent information in that fashion, you can establish semantic connections [much easier]. In this high-dimensional space, the distance between those representations tells you something about how connected those pieces of information are,” Gil said. “While we can only think in three dimensions, the machines don’t care how many dimensions there are. So it turns out to be a very powerful way to establish connections.”
Another panelist, Chris Tolomeo, senior vice president and head of banking services for M&T Bank, says the company is already using AI to confirm new customers’ identities and catch check fraud.
“I think the promise of AI will simplify things to make it much easier for both our customers and our employees,” he said.
However, he also offered caution.
“There’s high expectations that things will happen very quickly, and history tells us technology tends to be very difficult and expensive,” he said. “Not to downplay the potential, but making sure we’re doing things with the right expectations.”
AI will also transform health care and research. Allison Brashear, vice president for health sciences and dean of the Jacobs School of Medicine and Biomedical Sciences, envisions AI conducting predictive modeling for who is at risk for Alzheimer’s disease or a heart attack.
“That’s the aspiration here: Go from fixing people after they are sick to fixing people before they are sick,” Brashear said.

From left: Provost A. Scott Weber; Dario Gil, IBM senior vice president and director of research; Venu Govindaraju, vice president for research and economic development; and Jinjun Xiong, SUNY Empire Innovation Professor and director of the Institute for Artificial Intelligence and Data Science, pose for a photo at the UB | AI Chat Series. Photo: Douglas Levere
With UB recently being named the home of Empire AI and its supercomputing center, Gil also offered some insight on what the university can expect. IBM just recently built another supercomputing center for AI in Texas.
“You’re going to go on this journey with Empire AI of creating foundational infrastructure that will allow people in their own fields to go and create their own foundation models or build from ones in the community and expand it,” he said. “This is going to be a collaborative and community endeavor, and of course to do this, not only do you need to have data and expertise, you need a lot of computing power.”
Last month, IBM open-sourced its series of AI foundation models, Granite.
“The future of AI is to be open. This is an indispensable element to make it safe, innovative and distribute economic benefits to the world,” Gil said. “It is indispensable for the future of universities. If we go down a path where AI becomes closed … it’s going to be a real catastrophe for universities.”
- 6/3/24 IBM director of research explains how AI can help companies leverage data
- 5/30/24 New Yorker creates healthy snack that celebrates Asian American heritage
- 5/29/24 HWI to join UB, strengthening medical science research and education in WNY
- 5/24/24 Buffalo trio uses technology to change real estate
- Go back to Main Menu
- Client Log In
- MSCI Client Support Site
- Barra PortfolioManager
- MSCI ESG Manager
- MSCI ESG Direct
- Global Index Lens
- MSCI Real Assets Analytics Portal
- RiskManager 3
- CreditManager
- RiskManager 4
- Index Monitor
- MSCI Datscha
- MSCI Real Capital Analytics
- Total Plan/Caissa
- MSCI Fabric
- MSCI Carbon Markets
Navigation Menu
- Our Clients
Insights on MSCI One
Institutional client designed indexes (icdis), total portfolio footprinting, esg trends to watch, factor models, visualizing investment data.
- Our Solutions
- Go back to Our Solutions
- Analytics Overview
- Crowding Solutions
- Fixed Income Analytics
- Managed Solutions
- Multi-asset Class Factor Models
- Portfolio Management
- Quantitative Investment Solutions
- Regulatory Solutions
- Risk Insights
- Climate Investing
- Climate Investing Overview
Implied Temperature Rise
Trends 2024.
- Biodiversity
- Carbon Markets
- Climate Lab Enterprise
- Real Estate Climate Solutions
- Sustainable Investing
- Sustainable Investing Overview
ESG and Climate Funds in Focus
What is esg, role of capital in the net-zero revolution.
- Sustainability Reporting Services
- Factor Investing
- Factor Investing Overview
MSCI Japan Equity Factor Model
- Equity Factor Models
- Factor Indexes
- Indexes Overview
Index Education
Msci climate action corporate bond indexes.
- Client-Designed
- Direct Indexing
- Fixed Income
- Private Real Assets
Thematic Exposure Standard
- Go back to Indexes
- Resources Overview
MSCI Indexes Underlying Exchange Traded Products
- Communications
- Equity Factsheets
- Derivatives
- Methodology
- Performance
- Private Capital
- Private Capital Overview
Global Private Capital Performance Review
- Total Plan (formerly Caissa)
- Carbon Footprinting
- Private Capital Indexes
- Private Company Data Connect
- Real Assets
- Real Assets Overview
2024 Trends to Watch in Real Assets
- Index Intel
- Portfolio Services
- Property Intel
- Private Real Assets Indexes
- Real Capital Analytics
- Research & Insights
- Go back to Research & Insights
- Research & Insights Overview
- Multi-Asset Class
- Real Estate
- Sustainability
- Events Overview
Capital for Climate Action Conference
- Data Explorer
- Developer Community
- Technology and Data
2022 Annual Report
- Go back to Who We Are
- Corporate Responsibility
- Corporate Responsibility Overview
- Enabling Sustainable Investing
- Environmental Sustainability
- Governance Practices
- Social Practices
- Sustainability Reports and Policies
- Diversity, Equity and Inclusion
Henry A. Fernandez
- Recognition
Main Search
Esg rating hero banner, esg ratings.
Measuring a company’s resilience to long-term, financially relevant ESG risks
Social Sharing
Esg rating intro para, what is an msci esg rating.
MSCI ESG Ratings aim to measure a company’s management of financially relevant ESG risks and opportunities. We use a rules-based methodology to identify industry leaders and laggards according to their exposure to ESG risks and how well they manage those risks relative to peers. Our ESG Ratings range from leader (AAA, AA), average (A, BBB, BB) to laggard (B, CCC). We also rate equity and fixed income securities, loans, mutual funds, ETFs and countries.
ESG Ratings video
How do MSCI ESG Ratings work? What are significant ESG risks? What does a poor rating look like? How can you use them?
Download Transcript (PDF, 120 KB) (opens in a new tab)
ESG ratings
Download brochure (PDF, 1.08 MB) (opens in a new tab)
How do MSCI ESG Ratings work?
How does msci esg ratings work.
ESG risks and opportunities can vary by industry and company. Our MSCI ESG Ratings model identifies the ESG risks, (what we call Key Issues), that are most material to a GICS® sub-industry or sector. With over 13 years of live track history we have been able to examine and refine our model to identify the E, S, and G Key Issues which are most material to an industry.
View our Key Issues framework | ESG Methodologies (opens in a new tab) | What MSCI’s ESG Ratings are and are not
ESG Ratings module
A company lagging its industry based on its high exposure and failure to manage significant ESG risks
A company with a mixed or unexceptional track record of managing the most significant ESG risks and opportunities relative to industry peers
A company leading its industry in managing the most significant ESG risks and opportunities
Explore our ESG transparency tools
Contact sales
Explore our ESG Transparency Tools content - part 1
Explore the Implied Temperature Rise, Decarbonization Targets, MSCI ESG Rating and Key ESG Issues of over 2,900 companies.
Explore E, S & G Key Issues by GICS® sub-industry or sector and their contribution to companies' ESG Ratings.
Example: Explore the data metrics and sources used to determine the MSCI ESG Rating of a US-based producer of paper products.
Explore our ESG Transparency Tools content - part 2
ESG Fund Ratings aim to measure the resilience of mutual funds and ETFs to long term risks and opportunities.
Explore ESG and climate metrics for all MSCI equity, fixed income and blended indexes regulated by the EU.
ESG ratings Tabs
Integrating esg ratings into the investment process: key features.
A growing body of client, industry and MSCI research has shown the value of integrating MSCI ESG Ratings to manage and mitigate risks and identify opportunities. We are proud to work with over 1,700 clients worldwide that help inform and improve our ESG Research, including our ESG Ratings methodology and coverage. Investor clients use MSCI ESG Ratings as follows.
Fundamental / quant analyses
Portfolio construction / risk management, benchmarking / index-based product development, disclosure and reporting for regulators and stakeholders, engagement & thought leadership.
- Stock analysis
- ESG Ratings used for security selection or within systematic strategies
- ESG Factor in quant model- identify long term trends and arbitrage opportunities
- Adjust discounted cashflow models
- Identify leaders and laggards to support construction
- Use ratings and underlying scores to inform asset allocation
- Stress testing, and risk and performance attribution analysis
- ESG as a Factor in Global Equity Models
- MSCI ESG Ratings are used in many of MSCI’s 1,500 equity and fixed indexes
- Select policy or performance benchmark
- Develop Exchange-Traded-Funds and other index-based products
- Make regulatory disclosures
- Report to clients & stakeholders
- Demonstrate ESG transparency and leadership
- Engage companies and external stakeholders
- Provide transparency through client reporting
- Conduct thematic or industry research
ESG rating Key benefits
Key product features:.
We rate over 8,500 companies (14,000 issuers including subsidiaries) and more than 680,000 equity and fixed income securities globally (as of October 2020), collecting thousands of data points for each company.
MSCI ESG Research Experience and Leadership
Msci esg research experience and leadership.
- We have over 40 years 2 of experience measuring and modelling ESG performance of companies. We are recognized as a ‘Gold Standard data provider’3 and voted 'Best Firm for SRI research' and ‘Best Firm for Corporate Governance research' for the last four years 3
- We were the first ESG provider to assess companies based on industry materiality, dating back to 1999. Only dataset with live history (13+ years) demonstrating economic relevance
- Objective rules based ESG ratings, with an average 45% of data, 5 coming from alternative data sources, utilizing AI tech to extract and verify unstructured data
- First ESG ratings provider to measure and embed companies’ ESG risk exposure 4
ESG Ratings Related Content
Related content, .rel-cont-head{ font-size: 31px important; line-height: 38px important; } sustainable investing.
Companies with strong MSCI ESG Ratings profiles may be better positioned for future challenges and experience fewer instances of bribery, corruption and fraud. Learn how our sustainability solutions can provide insights into risks and opportunities.
Climate and Net-Zero Solutions
To empower investors to analyze and report on their portfolios’ exposures to transition and physical climate risk. 1 .
Sustainable Finance
ESG and climate regulation and disclosure resource center for institutional investors, managers and advisors.
ESG ratings footnotes
MSCI ESG Research LLC. is a Registered Investment Adviser under the Investment Adviser Act of 1940. The most recent SEC Form ADV filing, including Form ADV Part 2A, is available on the U.S. SEC’s website at www.adviserinfo.sec.gov (opens in a new tab) .
MIFID2/MIFIR notice: MSCI ESG Research LLC does not distribute or act as an intermediary for financial instruments or structured deposits, nor does it deal on its own account, provide execution services for others or manage client accounts. No MSCI ESG Research product or service supports, promotes or is intended to support or promote any such activity. MSCI ESG Research is an independent provider of ESG data, reports and ratings based on published methodologies and available to clients on a subscription basis.
ESG ADV 2A (PDF, 354 KB) (opens in a new tab) ESG ADV 2B (brochure supplement) (PDF, 232 KB) (opens in a new tab)
1 GICS®, the global industry classification standard jointly developed by MSCI Inc. and S&P Global.
2 Through our legacy companies KLD, Innovest, IRRC, and GMI Ratings.
3 Deep Data Delivery Standard http://www.deepdata.ai/
4 Through our legacy companies KLD, Innovest, IRRC, and GMI Ratings. Origins of MSCI ESG Ratings established in 1999. Produced time series data since 2007.
5 Source: MSCI ESG Research 2,434 constituents of the MSCI ACWI Index as of November 30, 2017.
UtmAnalytics
Suggested Searches
- Climate Change
- Expedition 64
- Mars perseverance
- SpaceX Crew-2
- International Space Station
- View All Topics A-Z
Humans in Space
Earth & climate, the solar system, the universe, aeronautics, learning resources, news & events.

55 Years Ago: Star Trek Final Episode Airs, Relationship with NASA Endures

Space Station Research Advances NASA’s Plans to Explore the Moon, Mars

What’s Up: June 2024 Skywatching Tips from NASA
- Search All NASA Missions
- A to Z List of Missions
- Upcoming Launches and Landings
- Spaceships and Rockets
- Communicating with Missions
- James Webb Space Telescope
- Hubble Space Telescope
- Why Go to Space
- Commercial Space
- Destinations
- Living in Space
- Explore Earth Science
- Earth, Our Planet
- Earth Science in Action
- Earth Multimedia
- Earth Science Researchers
- Pluto & Dwarf Planets
- Asteroids, Comets & Meteors
- The Kuiper Belt
- The Oort Cloud
- Skywatching
- The Search for Life in the Universe
- Black Holes
- The Big Bang
- Dark Energy & Dark Matter
- Earth Science
- Planetary Science
- Astrophysics & Space Science
- The Sun & Heliophysics
- Biological & Physical Sciences
- Lunar Science
- Citizen Science
- Astromaterials
- Aeronautics Research
- Human Space Travel Research
- Science in the Air
- NASA Aircraft
- Flight Innovation
- Supersonic Flight
- Air Traffic Solutions
- Green Aviation Tech
- Drones & You
- Technology Transfer & Spinoffs
- Space Travel Technology
- Technology Living in Space
- Manufacturing and Materials
- Science Instruments
- For Kids and Students
- For Educators
- For Colleges and Universities
- For Professionals
- Science for Everyone
- Requests for Exhibits, Artifacts, or Speakers
- STEM Engagement at NASA
- NASA's Impacts
- Centers and Facilities
- Directorates
- Organizations
- People of NASA
- Internships
- Our History
- Doing Business with NASA
- Get Involved
- Aeronáutica
- Ciencias Terrestres
- Sistema Solar
- All NASA News
- Video Series on NASA+
- Newsletters
- Social Media
- Media Resources
- Upcoming Launches & Landings
- Virtual Events
- Sounds and Ringtones
- Interactives
- STEM Multimedia

Webb Finds Plethora of Carbon Molecules Around Young Star

NASA Scientists Take to the Seas to Study Air Quality

NASA to Change How It Points Hubble Space Telescope

NASA Astronauts Practice Next Giant Leap for Artemis

Former Astronaut David R. Scott

NASA Mission Flies Over Arctic to Study Sea Ice Melt Causes

Twin NASA Satellites Ready to Help Gauge Earth’s Energy Balance

Solid State Quantum Magnetometers—Seeking out water worlds from the quantum world

C.12 Planetary Instrument Concepts for the Advancement of Solar System Observations POC Change

B.10 Heliophysics Flight Opportunities Studies Correction

Mountain Rain or Snow Volunteers Broke Records This Winter

ARMD Solicitations

Winners Announced in Gateways to Blue Skies Aeronautics Competition

NASA, Industry to Start Designing More Sustainable Jet Engine Core

Tech Today: Measuring the Buzz, Hum, and Rattle

Artemis Generation Shines During NASA’s 2024 Lunabotics Challenge

Ames Science Directorate’s Stars of the Month, June 2024

Ted Michalek: Engineering from Apollo to Artemis

Aerospace Trailblazer: Shirley Holland-Hunt’s Visionary Leadership Transforms Space Exploration

Diez maneras en que los estudiantes pueden prepararse para ser astronautas

Astronauta de la NASA Marcos Berríos

Resultados científicos revolucionarios en la estación espacial de 2023
Nasa releases new high-quality, near real-time air quality data.

Charles G. Hatfield
Earth science public affairs officer, nasa langley research center.
NASA has made new data available that can provide air pollution observations at unprecedented resolutions – down to the scale of individual neighborhoods. The near real-time data comes from the agency’s TEMPO (Tropospheric Emissions: Monitoring of Pollution) instrument, which launched last year to improve life on Earth by revolutionizing the way scientists observe air quality from space. This new data is available from the Atmospheric Science Data Center at NASA’s Langley Research Center in Hampton, Virginia.
“TEMPO is one of NASA’s Earth observing instruments making giant leaps to improve life on our home planet,” said NASA Administrator Bill Nelson. “NASA and the Biden-Harris Administration are committed to addressing the climate crisis and making climate data more open and available to all. The air we breathe affects everyone, and this new data is revolutionizing the way we track air quality for the benefit of humanity.”
To view this video please enable JavaScript, and consider upgrading to a web browser that supports HTML5 video
The TEMPO mission gathers hourly daytime scans of the atmosphere over North America from the Atlantic Ocean to the Pacific Coast, and from Mexico City to central Canada. The instrument detects pollution by observing how sunlight is absorbed and scattered by gases and particles in the troposphere, the lowest layer of Earth’s atmosphere.
“All the pollutants that TEMPO is measuring cause health issues,” said Hazem Mahmoud, science lead at NASA Langley’s Atmospheric Science Data Center. “We have more than 500 early adopters using these datasets right away. We expect to see epidemiologists and health experts using this data in the near future. Researchers studying the respiratory system and the impact of these pollutants on people’s health will find TEMPO’s measurements invaluable.”
An early adopter program has allowed policymakers and other air quality stakeholders to understand the capabilities and benefits of TEMPO’s measurements . Since October 2023, the TEMPO calibration and validation team has been working to evaluate and improve TEMPO data products.
We have more than 500 early adopters that will be using these datasets right away.

hazem mahmoud
NASA Data Scientist
“Data gathered by TEMPO will play an important role in the scientific analysis of pollution,” said Xiong Liu, senior physicist at the Smithsonian Astrophysical Observatory and principal investigator for the mission. “For example, we will be able to conduct studies of rush hour pollution, linkages of diseases and health issues to acute exposure of air pollution, how air pollution disproportionately impacts underserved communities, the potential for improved air quality alerts, the effects of lightning on ozone, and the movement of pollution from forest fires and volcanoes.”
Measurements by TEMPO include air pollutants such as nitrogen dioxide, formaldehyde, and total column ozone.
“Poor air quality exacerbates pre-existing health issues, which leads to more hospitalizations,” said Jesse Bell, executive director at the University of Nebraska Medical Center’s Water, Climate, and Health Program. Bell is an early adopter of TEMPO’s data.
Bell noted that there is a lack of air quality data in rural areas since monitoring stations are often hundreds of miles apart. There is also an observable disparity in air quality from neighborhood to neighborhood.
“Low-income communities, on average, have poorer air quality than more affluent communities,” said Bell. “For example, we’ve conducted studies and found that in Douglas County, which surrounds Omaha, the eastern side of the county has higher rates of pediatric asthma hospitalizations. When we identify what populations are going to the hospital at a higher rate than others, it’s communities of color and people with indicators of poverty. Data gathered by TEMPO is going to be incredibly important because you can get better spatial and temporal resolution of air quality across places like Douglas County.”
Determining sources of air pollution can be difficult as smoke from wildfires or pollutants from industry and traffic congestion drift on winds. The TEMPO instrument will make it easier to trace the origin of some pollutants.
“The National Park Service is using TEMPO data to gain new insight into emerging air quality issues at parks in southeast New Mexico,” explained National Park Service chemist, Barkley Sive. “Oil and gas emissions from the Permian Basin have affected air quality at Carlsbad Caverns and other parks and their surrounding communities. While pollution control strategies have successfully decreased ozone levels across most of the United States, the data helps us understand degrading air quality in the region.”
The TEMPO instrument was built by BAE Systems, Inc., Space & Mission Systems (formerly Ball Aerospace) and flies aboard the Intelsat 40e satellite built by Maxar Technologies. The TEMPO Ground System, including the Instrument Operations Center and the Science Data Processing Center, are operated by the Smithsonian Astrophysical Observatory, part of the Center for Astrophysics | Harvard & Smithsonian.
To learn more about TEMPO visit: https://nasa.gov/tempo
Related Terms
- Tropospheric Emissions: Monitoring of Pollution (TEMPO)
- Langley Research Center
Explore More

The Mountain Rain or Snow project asks volunteers to track rain, snow, and mixed precipitation all winter…

- Open access
- Published: 27 May 2024
Discovery of novel RNA viruses through analysis of fungi-associated next-generation sequencing data
- Xiang Lu 1 , 2 na1 ,
- Ziyuan Dai 3 na1 ,
- Jiaxin Xue 2 na1 ,
- Wang Li 4 ,
- Ping Ni 4 ,
- Juan Xu 4 ,
- Chenglin Zhou 4 &
- Wen Zhang 1 , 2 , 4
BMC Genomics volume 25 , Article number: 517 ( 2024 ) Cite this article
408 Accesses
3 Altmetric
Metrics details
Like all other species, fungi are susceptible to infection by viruses. The diversity of fungal viruses has been rapidly expanding in recent years due to the availability of advanced sequencing technologies. However, compared to other virome studies, the research on fungi-associated viruses remains limited.
In this study, we downloaded and analyzed over 200 public datasets from approximately 40 different Bioprojects to explore potential fungal-associated viral dark matter. A total of 12 novel viral sequences were identified, all of which are RNA viruses, with lengths ranging from 1,769 to 9,516 nucleotides. The amino acid sequence identity of all these viruses with any known virus is below 70%. Through phylogenetic analysis, these RNA viruses were classified into different orders or families, such as Mitoviridae , Benyviridae , Botourmiaviridae , Deltaflexiviridae , Mymonaviridae , Bunyavirales , and Partitiviridae . It is possible that these sequences represent new taxa at the level of family, genus, or species. Furthermore, a co-evolution analysis indicated that the evolutionary history of these viruses within their groups is largely driven by cross-species transmission events.
Conclusions
These findings are of significant importance for understanding the diversity, evolution, and relationships between genome structure and function of fungal viruses. However, further investigation is needed to study their interactions.
Peer Review reports
Introduction
Viruses are among the most abundant and diverse biological entities on Earth; they are ubiquitous in the natural environment but difficult to culture and detect [ 1 , 2 , 3 ]. In recent decades, the significant advancements in omics have transformed the field of virology and enabled researchers to detect potential viruses in a variety of environmental samples, helping us to expand the known diversity of viruses and explore the “dark matter” of viruses that may exist in vast quantities [ 4 ]. In most cases, the hosts of these newly discovered viruses exhibit only asymptomatic infections [ 5 , 6 ], and they even play an important role in maintaining the balance, stability, and sustainable development of the biosphere [ 7 ]. But some viruses may be involved in the emergence and development of animal or plant diseases. For example, the tobacco mosaic virus (TMV) causes poor growth in tobacco plants, while norovirus is known to cause diarrhea in mammals [ 8 , 9 ]. In the field of fungal research, viral infections have significantly reduced the yield of edible fungi, thereby attracting increasing attention to fungal diseases caused by viruses [ 10 ]. However, due to their apparent relevance to health [ 11 ], fungal-associated viruses have been understudied compared to viruses affecting humans, animals, or plants.
Mycoviruses (also known as fungal viruses) are widely distributed in various fungi and fungal-like organisms [ 12 ]. The first mycoviruses were discovered in the 1960s by Hollings M in the basidiomycete Agaricus bisporus , an edible cultivated mushroom [ 13 ]. Shortly thereafter, Ellis LF et al. reported mycoviruses in the ascomycete Penicillium stoloniferum , confirming that viral dsRNA is responsible for interferon stimulation in mammals [ 13 , 14 , 15 ]. In recent years, the diversity of known mycoviruses has rapidly increased with the development and widespread application of sequencing technologies [ 16 , 17 , 18 , 19 , 20 ]. According to the classification principles of the International Committee for the Taxonomy of Viruses (ICTV), mycoviruses are currently classified into 24 taxa, consisting of 23 families and 1 genus ( Botybirnavirus ) [ 21 ]. Most mycoviruses belong to double-stranded (ds) RNA viruses, such as families Totiviridae , Partitiviridae , Reoviridae , Chrysoviridae , Megabirnaviridae , Quadriviridae , and genus Botybirnavirus , or positive-sense single-stranded (+ ss) RNA viruses, such as families Alphaflexiviridae , Gammaflexiviridae , Barnaviridae , Hypoviridae , Endornaviridae , Metaviridae and Pseudoviridae . However, negative-sense single-stranded (-ss) RNA viruses (family Mymonaviridae ) and single-stranded (ss) DNA viruses (family Genomoviridae ) have also been described [ 22 ]. The taxonomy of mycoviruses is continually refined as novel mycoviruses that cannot be classified into any established taxon are identified. While the vast majority of fungi-infecting viruses do not show infection characteristics and have no significant impact on their hosts, some mycoviruses have inhibitory effects on the phenotype of the host, leading to hypovirulence in phytopathogenic fungi [ 23 ]. The use of environmentally friendly, low-virulence-related mycoviruses such as Chryphonectria hypovirus 1 (CHV-1) for biological control has been considered a viable alternative to chemical fungicides [ 24 ]. With the deepening of research, an increasing number of mycoviruses that can cause fungal phenotypic changes have been identified [ 3 , 23 , 25 ]. Therefore, understanding the distribution of these viruses and their effects on hosts will allow us to determine whether their infections can be prevented and treated.
To explore the viral dark matter hidden within fungi, this study collected over 200 available fungal-associated libraries from approximately 40 Bioprojects in the Sequence Read Archive (SRA) database, uncovering novel RNA viruses within them. We further elucidated the genetic relationships between known viruses and these newfound ones, thereby expanding our understanding of fungal-associated viruses and providing assistance to viral taxonomy.
Materials and methods
Genome assembly.
To discover novel fungal-associated viruses, we downloaded 236 available libraries from the SRA database, corresponding to 32 fungal species (Supplementary Table 1). Pfastq-dump v0.1.6 ( https://github.com/inutano/pfastq-dump ) was used to convert SRA format files to fastq format files. Subsequently, Bowtie2 v2.4.5 [ 26 ] was employed to remove host sequences. Primer sequences of raw reads underwent trimming using Trim Galore v0.6.5 ( https://www.bioinformatics.babraham.ac.uk/projects/trim_galore ), and the resulting files underwent quality control with the options ‘–phred33 –length 20 –stringency 3 –fastqc’. Duplicated reads were marked using PRINSEQ-lite v0.20.4 (-derep 1). All SRA datasets were then assembled in-house pipeline. Paired-end reads were assembled using SPAdes v3.15.5 [ 27 ] with the option ‘-meta’, while single-end reads were assembled with MEGAHIT v1.2.9 [ 28 ], both using default parameters. The results were then imported into Geneious Prime v2022.0.1 ( https://www.geneious.com ) for sorting and manual confirmation. To reduce false negatives during sequence assembly, further semi-automatic assembly of unmapped contigs and singlets with a sequence length < 500 nt was performed. Contigs with a sequence length > 1,500 nt after reassembly were retained. Individual contigs were then used as references for mapping to the raw data using the Low Sensitivity/Fastest parameter in Geneious Prime. In addition, mixed assembly was performed using MEGAHIT in combination with BWA v0.7.17 [ 29 ] to search for unused reads that might correspond to low-abundance contigs.
Searching for novel viruses in fungal libraries
We identified novel viral sequences present in fungal libraries through a series of steps. To start, we established a local viral database, consisting of the non-redundant protein (nr) database downloaded in August 2023, along with IMG/VR v3 [ 30 ], for screening assembled contigs. The contigs labeled as “viruses” and exhibiting less than 70% amino acid (aa) sequence identity with the best match in the database were imported into Geneious Prime for manual mapping. Putative open reading frames (ORFs) were predicted by Geneious Prime using built-in parameters (Minimum size: 100) and were subsequently verified by comparison to related viruses. The annotations of these ORFs were based on comparisons to the Conserved Domain Database (CDD). The sequences after manual examination were subjected to genome clustering using MMseqs2 (-k 0 -e 0.001 –min-seq-id 0.95 -c 0.9 –cluster-mode 0) [ 31 ]. After excluding viruses with high aa sequence identity (> 70%) to known viruses, a dataset containing a total of 12 RNA viral sequences was obtained. The non-redundant fungal virus dataset was compared against the local database using the BLASTx program built in DIAMOND v2.0.15 [ 32 ], and significant sequences with a cut-off E-value of < 10 –5 were selected. The coverage of each sequence in all libraries was calculated using the pileup tool in BBMap. Taxonomic identification was conducted using TaxonKit [ 33 ] software, along with the rma2info program integrated into MEGAN6 [ 34 ]. The RNA secondary structure prediction of the novel viruses was conducted using RNA Folding Form V2.3 ( http://www.unafold.org/mfold/applications/rna-folding-form-v2.php ).
Phylogenetic analysis
To infer phylogenetic relationships, nucleotide and their encoded protein sequences of reference strains belonging to different groups of corresponding viruses were downloaded from the NCBI GenBank database, along with sequences of proposed species pending ratification. Related sequences were aligned using the alignment program within the CLC Genomics Workbench 10.0, and the resulting alignment was further optimized using MUSCLE in MEGA-X [ 35 ]. Sites containing more than 50% gaps were temporarily removed from the alignments. Maximum-likelihood (ML) trees were then constructed using IQ-TREE v1.6.12 [ 36 ]. All phylogenetic trees were created using IQ-TREE with 1,000 bootstrap replicates (-bb 1000) and the ModelFinder function (-m MFP). Interactive Tree Of Life (iTOL) was used for visualizing and editing phylogenetic trees [ 37 ]. Colorcoded distance matrix analysis between novel viruses and other known viruses were performed with Sequence Demarcation Tool v1.2 [ 38 ].
To illustrate cross-species transmission and co-divergence between viruses and their hosts across different virus groups, we reconciled the co-phylogenetic relationships between these viruses and their hosts. The evolutionary tree and topologies of the hosts involved in this study were obtained from the TimeTree [ 39 ] website by inputting their Latin names. The viruses in the phylogenetic tree for which the host cannot be recognized through published literature or information provided by the authors are disregarded. The co-phylogenetic plots (or ‘tanglegram’) generated using the R package phytools [ 40 ] visually represent the correspondence between host and virus trees, with lines connecting hosts and their respective viruses. The event-based program eMPRess [ 41 ] was employed to determine whether the pairs of virus groups and their hosts undergo coevolution. This tool reconciles pairs of phylogenetic trees according to the Duplication-Transfer-Loss (DTL) model [ 42 ], employing a maximum parsimony formulation to calculate the cost of each coevolution event. The cost of duplication, host-jumping (transfer), and extinction (loss) event types were set to 1.0, while host-virus co-divergence was set to zero, as it was considered the null event.
Data availability
The data reported in this paper have been deposited in the GenBase in National Genomics Data Center [ 43 ], Beijing Institute of Genomics, Chinese Academy of Sciences/China National Center for Bioinformation, under accession numbers C_AA066339.1-C_AA066350.1 that are publicly accessible at https://ngdc.cncb.ac.cn/genbase . Please refer to Table 1 for details.
Twelve novel RNA viruses associated with fungi
We investigated fungi-associated novel viruses by mining publicly available metagenomic and transcriptomic fungal datasets. In total, we collected 236 datasets, which were categorized into four fungal phyla: Ascomycota (159), Basidiomycota (47), Chytridiomycota (15), and Zoopagomycota (15). These phyla corresponded to 20, 8, 2, and 2 different fungal genera, respectively (Supplementary Table 1). A total of 12 sequences containing complete coding DNA sequences (CDS) for RNA-dependent RNA polymerase (RdRp) have been identified, ranging in length from 1,769 nt to 9,516 nt. All of these sequences have less than 70% aa identity with RdRp sequences from any currently known virus (ranging from 32.97% to 60.43%), potentially representing novel families, genera, or species (Table 1 ). Some of the identified sequences were shorter than the reference genomes of RNA viruses, suggesting that these viral sequences represented partial sequences of viral genomes. To exclude the possibility of transient viral infections in hosts or de novo assembly artefacts in co-infection detection, we extracted the nucleotide sequences of the coding regions of these 12 sequences and mapped them to all collected libraries to compute coverage (Supplementary Table 2). The results revealed varying degrees of read matches for these viral genomes across different libraries, spanning different fungal species. Although we only analyzed sequences longer than 1,500 nt, it is worth noting that we also discovered other viral reads in many libraries. However, we were unable to assemble them into sufficiently long contigs, possibly due to library construction strategies or sequencing depth. In any case, this preliminary finding reveals a greater diversity of fungal-associated viruses than previously considered.
Positive-sense single-stranded RNA viruses
(i) mitoviridae.
Members of the family Mitoviridae (order Cryppavirales ) are monopartite, linear, positive-sense ( +) single-stranded (ss) RNA viruses with genome size of approximately 2.5–2.9 kb [ 44 ], carrying a single long open reading frame (ORF) which encodes a putative RdRp. Mitoviruses have no true virions and no structural proteins, virus genome is transmitted horizontally through mating or vertically from mother to daughter cells [ 45 ]. They use mitochondria as their sites of replication and have typical 5' and 3' untranslated regions (UTRs) of varying sizes, which are responsible for viral translation and replicase recognition [ 46 ]. According to the taxonomic principles of ICTV, the viruses belonging to the family Mitoviridae are divided into four genera, namely Duamitovirus , Kvaramitovirus , Triamitovirus and Unuamitovirus . In this study, two novel viruses belonging to the family Mitoviridae were identified in the same library (SRR12744489; Species: Thielaviopsis ethacetica ), named Thielaviopsis ethacetica mitovirus 1 (TeMV01) and Thielaviopsis ethacetica mitovirus 2 (TeMV02), respectively (Fig. 1 A). The genome sequence of TeMV01 spans 2,689 nucleotides in length with a GC content of 32.2%. Its 5' and 3' UTRs comprise 406 nt and 36 nt, respectively. Similarly, the genome sequence of TeMV02 extends 3,087 nucleotides in length with a GC content of 32.6%. Its 5' and 3' UTRs consist of 553 and 272 nt, respectively. The 5' and 3' ends of both genomes are predicted to have typical stem-loop structures (Fig. 1 B). In order to determine the evolutionary relationship between these two mitoviruses and other known mitoviruses, phylogenetic analysis based on RdRp showed that viral strains were divided into 2 genetic lineages in the genera Duamitovirus and Unuamitovirus (Fig. 1 C). In the genus Unuamitovirus , TeMV01 was clustered with Ophiostoma mitovirus 4, exhibiting the highest aa identity of 51.47%, while in the genus Duamitovirus , TeMV02 was clustered with a strain isolated from Plasmopara viticola , showing the highest aa identity of 42.82%. According to the guidelines from the ICTV regarding the taxonomy of the family Mitoviridae , a species demarcation cutoff of < 70% aa sequence identity is established [ 47 ]. Drawing on this recommendation and phylogenetic inferences, these two viral strains could be presumed to be novel viral species [ 48 ].

Identification of novel positive-sense single-stranded RNA viruses in fungal sequencing libraries. A Genome organization of two novel mitoviruses; the putative ORF for the viral RdRp is depicted by a green box, and the predicted conserved domain region is displayed in a gray box. B Predicted RNA secondary structures of the 5'- and 3'-terminal regions. C ML phylogenetic tree of members of the family Mitoviridae . The best-fit model (LG + F + R6) was estimated using IQ-Tree model selection. The bootstrap value is shown at each branch, with the newly identified viruses represented in red font. D The genome organization of GtBeV is depicted at the top; in the middle is the ML phylogenetic tree of members of the family Benyviridae . The best-fit model (VT + F + R5) was estimated using IQ-Tree model selection. The bootstrap value is shown at each branch, with the newly identified virus represented in red font. At the bottom is the distance matrix analysis of GeBeV identified in Gaeumannomyces tritici . Pairwise sequence comparison produced with the RdRp amino acid sequences within the ML tree. E The genome organization of CrBV is depicted at the top; in the middle is the ML phylogenetic tree of members of the family Botourmiaviridae . The best-fit model (VT + F + R5) was estimated using IQ-Tree model selection. The bootstrap value is shown at each branch, with the newly identified virus represented in red font. At the bottom is the distance matrix analysis of CrBV identified in Clonostachys rosea . Pairwise sequence comparison produced with the RdRp amino acid sequences within the ML tree
(ii) Benyviridae
The family Benyviridae is comprised of multipartite plant viruses that are rod-shaped, approximately 85–390 nm in length and 20 nm in diameter. Within this family, there is a single genus, Benyvirus [ 49 ]. It is reported that one species within this genus,Beet necrotic yellow vein virus, can cause widespread and highly destructive soil-borne ‘rhizomania’ disease of sugar beet [ 50 ]. A full-length RNA1 sequence related to Benyviridae has been detected from Gaeumannomyces tritici (ERR3486062), with a length of 6,479 nt. It possesses a poly(A) tail at the 3' end and is temporarily designated as Gaeumannomyces tritici benyvirus (GtBeV). BLASTx results indicate a 34.68% aa sequence identity with the best match found (Fig. 1 D). The non-structural polyprotein CDS of RNA1 encodes a large replication-associated protein of 1,688 amino acids with a molecular mass of 190 kDa. Four domains were predicted in this polyprotein corresponding to representative species within the family Benyviridae . The viral methyltransferase (Mtr) domain spans from nucleotide position 386 to 1411, while the RNA helicase (Hel) domain occupies positions 2113 to 2995 nt. Additionally, the protease (Pro) domain is located between positions 3142 and 3410 nt, and the RdRp domain is located at 4227 to 4796 nt. A phylogenetic analysis was conducted by integrating RdRp sequences of viruses closely related to GtBeV. The result revealed that GtBeV clustered within the family Benyviridae , exhibiting substantial evolutionary divergence from any other sequences. Consequently, this virus likely represents a novel species in the family Benyviridae .
(iii) Botourmiaviridae
The family Botourmiaviridae comprises viruses infecting plants and filamentous fungi, which may possess mono- or multi-segmented genomes [ 51 ]. Recent research has led to a rapid expansion in the number of viruses within the family Botourmiaviridae , increasing from the confirmed 4 genera in 2020 to a total of 12 genera. A contig identified from Clonostachys rosea (ERR5928658) using the BLASTx method exhibited similarity to viruses in the family Botourmiaviridae . After manual mapping, a 2,903 nt-long genome was obtained, tentatively named Clonostachys rosea botourmiavirus (CrBV), which includes a complete RdRP region (Fig. 1 E). Based on phylogenetic analysis using RdRp, CrBV clustered with members of the genus Magoulivirus , sharing 56.58% aa identity with a strain identified from Eclipta prostrata . However, puzzlingly, according to the ICTV's Genus/Species demarcation criteria, members of different genera/species within the family Botourmiaviridae share less than 70%/90% identity in their complete RdRP amino acid sequences. Furthermore, the RdRp sequences with accession numbers NC_055143 and NC_076766, both considered to be members of the genus Magoulivirus , exhibited only 39.05% aa identity to each other. Therefore, CrBV should at least be considered as a new species within the family Botourmiaviridae .
(iv) Deltaflexiviridae
An assembled sequence of 3,425 nucleotides in length Lepista sordida deltaflexivirus (LsDV), derived from Lepista sordida (DRR252167) and showing homology to Deltaflexiviridae within the order Tymovirales , was obtained. The Tymovirales comprises five recognized families: Alphaflexiviridae , Betaflexiviridae , Deltaflexiviridae , Gammaflexiviridae , and Tymoviridae [ 52 ]. The Deltaflexiviridae currently only includes one genus, the fungal-associated deltaflexivirus; they are mostly identified in fungi or plants pathogens [ 53 ]. LsDV was predicted to have a single large ORF, VP1, which starts with an AUG codon at nt 163–165 and ends with a UAG codon at nt 3,418–3,420. This ORF encodes a putative polyprotein of 1,086 aa with a calculated molecular mass of 119 kDa. Two conserved domains within the VP1 protein were identified: Hel and RdRp (Fig. 2 A). However, the Mtr was missing, indicating that the 5' end of this polyprotein is incomplete. According to the phylogenetic analysis of RdRp, LsDV was closely related to viruses of the family Deltaflexiviridae and shared 46.61% aa identity with a strain (UUW06602) isolated from Macrotermes carbonarius . Despite this, according to the species demarcation criteria proposed by ICTV, because we couldn't recover the entire replication-associated polyprotein, LsDV cannot be regarded as a novel species at present.

Identification of novel members of family Deltaflexiviridae and Toga-like virus in fungal sequencing libraries. A On the right side of the image is the genome organization of LsDV; the putative ORF for the viral RdRp is depicted by a green box, and the predicted conserved domain region is displayed in a gray box. ML phylogenetic tree of members of the family Deltaflexiviridae . The best-fit model (VT + F + R6) was estimated using IQ-Tree model selection. The bootstrap value is shown at each branch, with the newly identified virus represented in red font. B The genome organization of GtTlV is depicted at the top; the putative ORF for the viral RdRp is depicted by a green box, and the predicted conserved domain region is displayed in a gray box. ML phylogenetic tree of members of the order Martellivirales . The best-fit model (LG + R7) was estimated using IQ-Tree model selection. The bootstrap value is shown at each branch, with the newly identified virus represented in red font
(v) Toga-like virus
Members of the family Togaviridae are primarily transmitted by arthropods and can infect a wide range of vertebrates, including mammals, birds, reptiles, amphibians, and fish [ 54 ]. Currently, this family only contains a single confirmed genus, Alphavirus . A contig was discovered in Gaeumannomyces tritici (ERR3486058), it is 7,588 nt in length with a complete ORF encoding a putative protein of 1,928 aa, which had 60.43% identity to Fusarium sacchari alphavirus-like virus 1 (QIQ28421) with 97% coverage. Phylogenetic analysis showed that it did not cluster with classical alphavirus members such as VEE, WEE, EEE, SF complex [ 54 ], but rather with several sequences annotated as Toga-like that were available (Fig. 2 B). It was provisionally named Gaeumannomyces tritici toga-like virus (GtTIV). However, we remain cautious about the accuracy of these so-called Toga-like sequences, as they show little significant correlation with members of the order Martellivirales .
Negative-sense single-stranded RNA viruses
(i) mymonaviridae.
Mymonaviridae is a family of linear, enveloped, negative-stranded RNA genomes in the order Mononegavirales , which infect fungi. They are approximately 10 kb in size and encode six proteins [ 55 ]. The famliy Mymonaviridae was established to accommodate Sclerotinia sclerotiorum negative-stranded RNA virus 1 (SsNSRV-1), a novel virus discovered in a hypovirulent strain of Sclerotinia sclerotiorum [ 56 ]. According to the ICTV, the family Mymonaviridae currently includes 9 genera, namely Auricularimonavirus , Botrytimonavirus , Hubramonavirus , Lentimonavirus , Penicillimonavirus , Phyllomonavirus , Plasmopamonavirus , Rhizomonavirus and Sclerotimonavirus . Two sequences originating from Gaeumannomyces tritici (ERR3486068) and Aspergillus puulaauensis (DRR266546), respectively, and associated with the family Mymonaviridae , have been identified and provisionally named Gaeumannomyces tritici mymonavirus (GtMV) and Aspergillus puulaauensis mymonavirus (ApMV). GtMV is 9,339 nt long with a GC content of 52.8%. It was predicted to contain 5 discontinuous ORFs, with the largest one encoding RdRp. Additionally, a nucleoprotein and three hypothetical proteins with unknown function were also predicted. A multiple alignment of nucleotide sequences among these ORFs identified a semi-conserved sequence, 5'-UAAAA-CUAGGAGC-3', located downstream of each ORF (Fig. 3 A). These regions are likely gene-junction regions in the GtMV genome, a characteristic feature shared by mononegaviruses [ 57 , 58 ]. For ApMV, a complete RdRp CDS with a length of 1,978 aa was predicted. The BLASTx searches showed that GtMV shared 45.22% identity with the RdRp of Soybean leaf-associated negative-stranded RNA virus 2 (YP_010784557), while ApMV shared 55.90% identity with the RdRp of Erysiphe necator associated negative-stranded RNA virus 23 (YP_010802816). The representative members of the family Mymonaviridae were included in the phylogenetic analysis. The results showed that GtMV and ApMV clustered closely with members of the genera Sclerotimonavirus and Plasmopamonavirus , respectively (Fig. 3 B). Members of the genus Plasmopamonavirus are about 6 kb in size and encode for a single protein. Therefore, GtMV and ApMV should be considered as representing new species within their respective genera.

Identification of two new members in the family Mymonaviridae . A At the top is the nucleotide multiple sequence alignment result of GtMV with the reference genomes. the putative ORF for the viral RdRp is depicted by a green box, the predicted nucleoprotein is displayed in a yellow box, and three hypothetical proteins are displayed in gray boxes. The comparison of putative semi-conserved regions between ORFs in GtMV is displayed in the 5' to 3' orientation, with conserved sequences are highlighted. At the bottom is the genome organization of AmPV; the putative ORF for the viral RdRp is depicted by a green box. B ML phylogenetic tree of members of the family Mymonaviridae . The best-fit model (LG + F + R6) was estimated using IQ-Tree model selection. The bootstrap value is shown at each branch, with the newly identified viruses represented in red font
(ii) Bunyavirales
The Bunyavirales (the only order in the class Ellioviricetes ) is one of the largest groups of segmented negative-sense single-stranded RNA viruses with mainly tripartite genomes [ 59 ], which includes many pathogenic strains that infect arthropods(such as mosquitoes, ticks, sand flies), plants, protozoans, and vertebrates, and even cause severe human diseases. Order Bunyavirales consists of 14 viral families, including Arenaviridae , Cruliviridae , Discoviridae , Fimoviridae , Hantaviridae , Leishbuviridae , Mypoviridae , Nairoviridae , Peribunyaviridae , Phasmaviridae , Phenuiviridae , Tospoviridae , Tulasviridae and Wupedeviridae . In this study, three complete or near complete RNA1 sequences related to bunyaviruses were identified and named according to their respective hosts: CoBV ( Conidiobolus obscurus bunyavirus; SRR6181013; 7,277 nt), GtBV ( Gaeumannomyces tritici bunyavirus; ERR3486069; 7,364 nt), and TaBV ( Thielaviopsis aethacetica bunyavirus; SRR12744489; 9,516 nt) (Fig. 4 A). The 5' and 3' terminal RNA segments of GtBV and TaBV complement each other, allowing the formation of a panhandle structure [ 60 ], which plays an essential role as promoters of genome transcription and replication [ 61 ], except for CoBV, as the 3' terminal of CoBV has not been fully obtained (Fig. 4 B). BLASTx results indicated that these three viruses had identities ranging from 32.97% to 54.20% to the best matches in the GenBank database. Phylogenetic analysis indicated that CoBV was classified into the family Phasmaviridae , with distant relationships to any of its genera; GtBV clustered well with members of the genus Entovirus of family Phenuiviridae ; while TaBV did not cluster with any known members of families within Bunyavirales , hence provisionally placed within the Bunya-like group (Fig. 4 C). Therefore, these three sequences should be considered as potential new family, genus, or species within the order Bunyavirales .

Identification of three new members in the order Bunyavirales . A The genome organization of CoBV, GtBV, and TaBV; the putative ORF for the viral RdRp is depicted by a green box, and the predicted conserved domain region is displayed in a gray box. B The complementary structures formed at the 5' and 3' ends of GtBV and TaBV. C ML phylogenetic tree of members of the order Bunyavirales . The best-fit model (VT + F + R8) was estimated using IQ-Tree model selection. The bootstrap value is shown at each branch, with the newly identified viruses represented in red font
Double-stranded RNA viruses
Partitiviridae.
The Partitiviridae is a family of small, non-enveloped viruses, approximately 35–40 nm in diameter, with bisegmented double-stranded (ds) RNA genomes. Each segment is about 1.4–3.0 kb in size, resulting in a total size about 4 kb [ 62 ]. The family Partitiviridae is now divided into five genera: Alphapartitivirus , Betapartiivirus , Cryspovirus , Deltapartitivirus and Gammapartitivirus . Each genus has characteristic hosts: plants or fungi for Alphapartitivirus and Betapartitivirus , fungi for Gammapartitivirus , plants for Deltapartitivirus , and protozoa for Cryspovirus [ 62 ]. A complete dsRNA1 sequence Neocallimastix californiae partitivirus (NcPV) retrieved from Neocallimastix californiae (SRR15362281) has been identified as being associated with the family Partitiviridae . The BLASTp result indicated that it shared the highest aa identity of 41.5% with members of the genus Gammapartitivirus . According to the phylogenetic tree constructed based on RdRp, NcPV was confirmed to fall within the genus Gammapartitivirus (Fig. 5 ). Typical members of the genus Gammapartitivirus have two segments in their complete genome, namely dsRNA1 and dsRNA2, encoding RdRp and coat protein, respectively [ 62 ]. The larger dsRNA1 segment of NcPV measures 1,769 nt in length, with a GC content of 35.8%. It contains a single ORF encoding a 561 aa RdRp. A CDD search revealed that the RdRp of NcPV harbors a catalytic region spanning from 119 to 427aa. Regrettably, only the complete dsRNA1 segment was obtained. According to the classification principles of ICTV, due to the lack of information regarding dsRNA2, we are unable to propose it as a new species. It is worth noting that according to the Genus demarcation criteria ( https://ictv.global/report/chapter/partitiviridae/partitiviridae ), members of the genus Gammapartitivirus should have a dsRNA1 length ranging from 1645 to 1787 nt, and the RdRp length should fall between 519 and 539 aa. However, the length of dsRNA1 in NcPV is 1,769 nt, with RdRp being 561 aa, challenging this classification criterion. In fact, multiple strains have already exceeded this criterion, such as GenBank accession numbers: WBW48344, UDL14336, QKK35392, among others.

Identification of a new member in the family Partitiviridae . The genome organization of NcPV is depicted at the top; the putative ORF for the viral RdRp is depicted by a green box, and the predicted conserved domain region is displayed in a gray box. At the bottom is the ML phylogenetic tree of members of the family Partitiviridae . The best-fit model (VT + F + R4) was estimated using IQ-Tree model selection. The bootstrap value is shown at each branch, with the newly identified virus represented in red font
Long-term evolutionary relationships between fungal-associated viruses and hosts
Understanding the co-divergence history between viruses and hosts helps reveal patterns of virus transmission and infection and influences the biodiversity and stability of ecosystems. To explore the frequency of cross-species transmission and co-divergence among fungi-associated viruses, we constructed tanglegrams illustrating the interconnected evolutionary histories of viral families and their respective hosts through phylogenetic trees (Fig. 6 A). The results indicated that cross-species transmission (Host-jumping) consistently emerged as the most frequent evolutionary event among all groups of RNA viruses examined in this study (median, 66.79%; range, 60.00% to 79.07%) (Fig. 6 B). This finding is highly consistent with the evolutionary patterns of RNA viruses recently identified by Mifsud et al. in their extensive transcriptome survey of plants [ 63 ]. Members of the families Botourmiaviridae (79.07%) and Deltaflexiviridae (72.41%) were most frequently involved in cross-species transmission. The frequencies of co-divergence (median, 20.19%; range, 6.98% to 27.78%), duplication (median, 10.60%; range, 0% to 22.45%), and extinction (median, 2.42%; range, 0% to 5.56%) events involved in the evolution of fungi-associated viruses gradually decrease. Specifically, members of the family Benyviridae exhibited the highest frequency of co-divergence events, which also supports the findings reported by Mifsud et al.; certain studies propose that members of Benyviridae are transmitted via zoospores of plasmodiophorid protist [ 64 ]. It's speculated that the ancestor of these viruses underwent interkingdom horizontal transfer between plants and protists over evolutionary timelines [ 65 ]. Members of the family Mitoviridae showed the highest frequency of duplication events; and members of the families Benyviridae and Partitiviridae demonstrated the highest frequency of extinction events. Not surprisingly, this result is influenced by the current limited understanding of virus-host relationships. On one hand, viruses whose hosts cannot be recognized through published literature or information provided by authors have been overlooked. On the other hand, the number of viruses recorded in reference databases represents just the tip of the iceberg within the entire virosphere. The involvement of a more extensive sample size in the future should change this evolutionary landscape.

Co-evolutionary analysis of virus and host. A Tanglegram of phylogenetic trees for virus orders/families and their hosts. Lines and branches are color-coded to indicate host clades. The cophylo function in phytools was employed to enhance congruence between the host (left) and virus (right) phylogenies. B Reconciliation analysis of virus groups. The bar chart illustrates the proportional range of possible evolutionary events, with the frequency of each event displayed at the top of its respective column
Our understanding of the interactions between fungi and their associated viruses has long been constrained by insufficient sampling of fungal species. Advances in metagenomics in recent decades have led to a rapid expansion of the known viral sequence space, but it is far from saturated. The diversity of hosts, the instability of the viral structures (especially RNA viruses), and the propensity to exchange genetic material with other host viruses all contribute to the unparalleled diversity of viral genomes [ 66 ]. Fungi are diverse and widely distributed in nature and are closely related to humans. A few fungi can parasitize immunocompromised humans, but their adverse effects are limited. As decomposers in the biological chain, fungi can decompose the remains of plants and animals and maintain the material cycle in the biological world [ 67 ]. In agricultural production, many fungi are plant pathogens, and about 80% of plant diseases are caused by fungi. However, little is currently known about the diversity of mycoviruses and how these viruses affect fungal phenotypes, fungal-host interactions, and virus evolution, and the sequencing depth of fungal libraries in most public databases only meets the needs of studying bacterial genomes. Sampling viruses from a larger diversity of fungal hosts should lead to new and improved evolutionary scenarios.
RNA viruses are widespread in deep-sea sediments [ 68 ], freshwater [ 69 ], sewage [ 70 ], and rhizosphere soils [ 71 ]. Compared to DNA viruses, RNA viruses are less conserved, prone to mutation, and can transfer between different hosts, potentially forming highly differentiated and unrecognized novel viruses. This characteristic increases the difficulty of monitoring these viruses. Previously, all discovered mycoviruses were RNA viruses. Until 2010, Yu et al. reported the discovery of a DNA virus, namely SsHADV-1, in fungi for the first time [ 72 ]. Subsequently, new fungal-related DNA viruses are continually being identified [ 73 , 74 , 75 ]. Currently, viruses have been found in all major groups of fungi, and approximately 100 types of fungi can be infected by viruses, instances exist where one virus can infect multiple fungi, or one fungus can be infected by several viruses simultaneously. The transmission of mycoviruses differs from that of animal and plant viruses and is mainly categorized into vertical and horizontal transmission [ 76 ]. Vertical transmission refers to the spread of the mycovirus to the next generation through the sexual or asexual spores of the fungus, while horizontal transmission refers to the spread of the mycovirus from one strain to another through fusion between hyphae. In the phylum Ascomycota , mycoviruses generally exhibit a low ability to transmit vertically through ascospores, but they are commonly transmitted vertically to progeny strains through asexual spores [ 77 ].
In this study, we identified two novel species belonging to different genera within the family Mitoviridae . Interestingly, they both simultaneously infect the same fungus— Thielaviopsis ethacetica , the causal agent of pineapple sett rot disease in sugarcane [ 78 ]. Previously, a report identified three different mitoviruses in Fusarium circinatum [ 79 ]. These findings suggest that there may be a certain level of adaptability or symbiotic relationship among members of the family Mitoviridae . Benyviruses are typically considered to infect plants, but recent evidence suggests that they can also infect fungi, such as Agaricus bisporus [ 80 ], further reinforced by the virus we discovered in Gaeumannomyces tritici . Moreover, members of the family Botourmiaviridae commonly exhibit a broad host range, with viruses closely related to CrBV capable of infecting members of Eukaryota , Viridiplantae , and Metazoa , in addition to fungi (Supplementary Fig. 1). The LsDV identified in this study shared the closest phylogenetic relationship with a virus identified from Macrotermes carbonarius in southern Vietnam (17_N1 + N237) [ 81 ]. M. carbonarius is an open-air foraging species that collects plant litter and wood debris to cultivate fungi in fungal gardens [ 82 ], termites may act as vectors, transmitting deltaflexivirus to other fungi. Furthermore, the viruses we identified, typically associated with fungi, also deepen their connections with species from other kingdoms on the tanglegram tree. For example, while Partitiviridae are naturally associated with fungi and plants, NcPV also shows close connections with Metazoa . In fact, based largely on phylogenetic predictions, various eukaryotic viruses have been found to undergo horizontal transfer between organisms of plants, fungi, and animals [ 83 ]. The rice dwarf virus was demonstrated to infect both plant and insect vectors [ 84 ]; moreover, plant-infecting rhabdoviruses, tospoviruses, and tenuiviruses are now known to replicate and spread in vector insects and shuttle between plants and animals [ 85 ]. Furthermore, Bian et al. demonstrated that plant virus infection in plants enables Cryphonectria hypovirus 1 to undergo horizontal transfer from fungi to plants and other heterologous fungal species [ 86 ].
Recent studies have greatly expanded the diversity of mycoviruses [ 87 , 88 ]. Gilbert et al. [ 20 ] investigated publicly available fungal transcriptomes from the subphylum Pezizomycotina, resulting in the detection of 52 novel mycoviruses; Myers et al. [ 18 ] employed both culture-based and transcriptome-mining approaches to identify 85 unique RNA viruses across 333 fungi; Ruiz-Padilla et al. identified 62 new mycoviral species from 248 Botrytis cinerea field isolates; Zhou et al. identified 20 novel viruses from 90 fungal strains (across four different macrofungi species) [ 89 ]. However, compared to these studies, our work identified fewer novel viruses, possibly due to the following reasons: 1) The libraries from the same Bioproject are usually from the same strains (or isolates). Therefore, there is a certain degree of redundancy in the datasets collected for this study. 2) Contigs shorter than 1,500 nt were discarded, potentially resulting in the oversight of short viral molecules. 3) Establishing a threshold of 70% aa sequence identity may also lead to the exclusion of certain viruses. 4) Some poly(A)-enriched RNA-seq libraries are likely to miss non-polyadenylated RNA viral genomes.
Taxonomy is a dynamic science, evolving with improvements in analytical methods and the emergence of new data. Identifying and rectifying incorrect classifications when new information becomes available is an ongoing and inevitable process in today's rapidly expanding field of virology. For instance, in 1975, members of the genera Rubivirus and Alphavirus were initially grouped under the family Togaviridae ; however, in 2019, Rubivirus was reclassified into the family Matonaviridae due to recognized differences in transmission modes and virion structures [ 90 ]. Additionally, the conflicts between certain members of the genera Magoulivirus and Gammapartitivirus mentioned here and their current demarcation criteria (e.g., amino acid identity, nucleotide length thresholds) need to be reconsidered.
Taken together, these findings reveal the potential diversity and novelty within fungal-associated viral communities and discuss the genetic similarities among different fungal-associated viruses. These findings advance our understanding of fungal-associated viruses and suggest the importance of subsequent in-depth investigations into the interactions between fungi and viruses, which will shed light on the important roles of these viruses in the global fungal kingdom.
Availability of data and materials
The data reported in this paper have been deposited in the GenBase in National Genomics Data Center, Beijing Institute of Genomics, Chinese Academy of Sciences/China National Center for Bioinformation, under accession numbers C_AA066339.1-C_AA066350.1 that are publicly accessible at https://ngdc.cncb.ac.cn/genbase . Please refer to Table 1 for details.
Leigh DM, Peranic K, Prospero S, Cornejo C, Curkovic-Perica M, Kupper Q, et al. Long-read sequencing reveals the evolutionary drivers of intra-host diversity across natural RNA mycovirus infections. Virus Evol. 2021;7(2):veab101. https://doi.org/10.1093/ve/veab101 . Epub 2022/03/19 PubMed PMID: 35299787; PubMed Central PMCID: PMCPMC8923234.
Article PubMed PubMed Central Google Scholar
Ghabrial SA, Suzuki N. Viruses of plant pathogenic fungi. Annu Rev Phytopathol. 2009;47:353–84. https://doi.org/10.1146/annurev-phyto-080508-081932 . Epub 2009/04/30 PubMed PMID: 19400634.
Article CAS PubMed Google Scholar
Ghabrial SA, Caston JR, Jiang D, Nibert ML, Suzuki N. 50-plus years of fungal viruses. Virology. 2015;479–480:356–68. https://doi.org/10.1016/j.virol.2015.02.034 . Epub 2015/03/17 PubMed PMID: 25771805.
Chen YM, Sadiq S, Tian JH, Chen X, Lin XD, Shen JJ, et al. RNA viromes from terrestrial sites across China expand environmental viral diversity. Nat Microbiol. 2022;7(8):1312–23. https://doi.org/10.1038/s41564-022-01180-2 . Epub 2022/07/29 PubMed PMID: 35902778.
Pearson MN, Beever RE, Boine B, Arthur K. Mycoviruses of filamentous fungi and their relevance to plant pathology. Mol Plant Pathol. 2009;10(1):115–28. https://doi.org/10.1111/j.1364-3703.2008.00503.x . Epub 2009/01/24 PubMed PMID: 19161358; PubMed Central PMCID: PMCPMC6640375.
Santiago-Rodriguez TM, Hollister EB. Unraveling the viral dark matter through viral metagenomics. Front Immunol. 2022;13:1005107. https://doi.org/10.3389/fimmu.2022.1005107 . Epub 2022/10/04 PubMed PMID: 36189246; PubMed Central PMCID: PMCPMC9523745.
Article CAS PubMed PubMed Central Google Scholar
Srinivasiah S, Bhavsar J, Thapar K, Liles M, Schoenfeld T, Wommack KE. Phages across the biosphere: contrasts of viruses in soil and aquatic environments. Res Microbiol. 2008;159(5):349–57. https://doi.org/10.1016/j.resmic.2008.04.010 . Epub 2008/06/21 PubMed PMID: 18565737.
Guo W, Yan H, Ren X, Tang R, Sun Y, Wang Y, et al. Berberine induces resistance against tobacco mosaic virus in tobacco. Pest Manag Sci. 2020;76(5):1804–13. https://doi.org/10.1002/ps.5709 . Epub 2019/12/10 PubMed PMID: 31814252.
Villabruna N, Izquierdo-Lara RW, Schapendonk CME, de Bruin E, Chandler F, Thao TTN, et al. Profiling of humoral immune responses to norovirus in children across Europe. Sci Rep. 2022;12(1):14275. https://doi.org/10.1038/s41598-022-18383-6 . Epub 2022/08/23 PubMed PMID: 35995986.
Zhang Y, Gao J, Li Y. Diversity of mycoviruses in edible fungi. Virus Genes. 2022;58(5):377–91. https://doi.org/10.1007/s11262-022-01908-6 . Epub 2022/06/07 PubMed PMID: 35668282.
Shkoporov AN, Clooney AG, Sutton TDS, Ryan FJ, Daly KM, Nolan JA, et al. The human gut virome is highly diverse, stable, and individual specific. Cell Host Microbe. 2019;26(4):527–41. https://doi.org/10.1016/j.chom.2019.09.009 . Epub 2019/10/11 PubMed PMID: 31600503.
Botella L, Janousek J, Maia C, Jung MH, Raco M, Jung T. Marine Oomycetes of the Genus Halophytophthora harbor viruses related to Bunyaviruses. Front Microbiol. 2020;11:1467. https://doi.org/10.3389/fmicb.2020.01467 . Epub 2020/08/08 PubMed PMID: 32760358; PubMed Central PMCID: PMCPMC7375090.
Kotta-Loizou I. Mycoviruses and their role in fungal pathogenesis. Curr Opin Microbiol. 2021;63:10–8. https://doi.org/10.1016/j.mib.2021.05.007 . Epub 2021/06/09 PubMed PMID: 34102567.
Ellis LF, Kleinschmidt WJ. Virus-like particles of a fraction of statolon, a mould product. Nature. 1967;215(5101):649–50. https://doi.org/10.1038/215649a0 . Epub 1967/08/05 PubMed PMID: 6050227.
Banks GT, Buck KW, Chain EB, Himmelweit F, Marks JE, Tyler JM, et al. Viruses in fungi and interferon stimulation. Nature. 1968;218(5141):542–5. https://doi.org/10.1038/218542a0 . Epub 1968/05/11 PubMed PMID: 4967851.
Jia J, Fu Y, Jiang D, Mu F, Cheng J, Lin Y, et al. Interannual dynamics, diversity and evolution of the virome in Sclerotinia sclerotiorum from a single crop field. Virus Evol. 2021;7(1):veab032. https://doi.org/10.1093/ve/veab032 .
Mu F, Li B, Cheng S, Jia J, Jiang D, Fu Y, et al. Nine viruses from eight lineages exhibiting new evolutionary modes that co-infect a hypovirulent phytopathogenic fungus. Plos Pathog. 2021;17(8):e1009823. https://doi.org/10.1371/journal.ppat.1009823 . Epub 2021/08/25 PubMed PMID: 34428260; PubMed Central PMCID: PMCPMC8415603.
Myers JM, Bonds AE, Clemons RA, Thapa NA, Simmons DR, Carter-House D, et al. Survey of early-diverging lineages of fungi reveals abundant and diverse Mycoviruses. mBio. 2020;11(5):e02027. https://doi.org/10.1128/mBio.02027-20 . Epub 2020/09/10 PubMed PMID: 32900807; PubMed Central PMCID: PMCPMC7482067.
Ruiz-Padilla A, Rodriguez-Romero J, Gomez-Cid I, Pacifico D, Ayllon MA. Novel Mycoviruses discovered in the Mycovirome of a Necrotrophic fungus. MBio. 2021;12(3):e03705. https://doi.org/10.1128/mBio.03705-20 . Epub 2021/05/13 PubMed PMID: 33975945; PubMed Central PMCID: PMCPMC8262958.
Gilbert KB, Holcomb EE, Allscheid RL, Carrington JC. Hiding in plain sight: new virus genomes discovered via a systematic analysis of fungal public transcriptomes. Plos One. 2019;14(7):e0219207. https://doi.org/10.1371/journal.pone.0219207 . Epub 2019/07/25 PubMed PMID: 31339899; PubMed Central PMCID: PMCPMC6655640.
Khan HA, Telengech P, Kondo H, Bhatti MF, Suzuki N. Mycovirus hunting revealed the presence of diverse viruses in a single isolate of the Phytopathogenic fungus diplodia seriata from Pakistan. Front Cell Infect Microbiol. 2022;12:913619. https://doi.org/10.3389/fcimb.2022.913619 . Epub 2022/07/19 PubMed PMID: 35846770; PubMed Central PMCID: PMCPMC9277117.
Kotta-Loizou I, Coutts RHA. Mycoviruses in Aspergilli: a comprehensive review. Front Microbiol. 2017;8:1699. https://doi.org/10.3389/fmicb.2017.01699 . Epub 2017/09/22 PubMed PMID: 28932216; PubMed Central PMCID: PMCPMC5592211.
Garcia-Pedrajas MD, Canizares MC, Sarmiento-Villamil JL, Jacquat AG, Dambolena JS. Mycoviruses in biological control: from basic research to field implementation. Phytopathology. 2019;109(11):1828–39. https://doi.org/10.1094/PHYTO-05-19-0166-RVW . Epub 2019/08/10 PubMed PMID: 31398087.
Rigling D, Prospero S. Cryphonectria parasitica, the causal agent of chestnut blight: invasion history, population biology and disease control. Mol Plant Pathol. 2018;19(1):7–20. https://doi.org/10.1111/mpp.12542 . Epub 2017/02/01 PubMed PMID: 28142223; PubMed Central PMCID: PMCPMC6638123.
Okada R, Ichinose S, Takeshita K, Urayama SI, Fukuhara T, Komatsu K, et al. Molecular characterization of a novel mycovirus in Alternaria alternata manifesting two-sided effects: down-regulation of host growth and up-regulation of host plant pathogenicity. Virology. 2018;519:23–32. https://doi.org/10.1016/j.virol.2018.03.027 . Epub 2018/04/10 PubMed PMID: 29631173.
Langmead B, Salzberg SL. Fast gapped-read alignment with Bowtie 2. Nat Methods. 2012;9(4):357–9. https://doi.org/10.1038/nmeth.1923 . Epub 2012/03/06 PubMed PMID: 22388286; PubMed Central PMCID: PMCPMC3322381.
Prjibelski A, Antipov D, Meleshko D, Lapidus A, Korobeynikov A. Using SPAdes De Novo assembler. Curr Protoc Bioinform. 2020;70(1):e102. https://doi.org/10.1002/cpbi.102 . Epub 2020/06/20 PubMed PMID: 32559359.
Article CAS Google Scholar
Li D, Luo R, Liu CM, Leung CM, Ting HF, Sadakane K, et al. MEGAHIT v1.0: A fast and scalable metagenome assembler driven by advanced methodologies and community practices. Methods. 2016;102:3–11. https://doi.org/10.1016/j.ymeth.2016.02.020 . Epub 2016/03/26 PubMed PMID: 27012178.
Li H, Durbin R. Fast and accurate long-read alignment with Burrows-Wheeler transform. Bioinformatics. 2010;26(5):589–95. https://doi.org/10.1093/bioinformatics/btp698 . Epub 2010/01/19 PubMed PMID: 20080505; PubMed Central PMCID: PMCPMC2828108.
Roux S, Paez-Espino D, Chen IA, Palaniappan K, Ratner A, Chu K, et al. IMG/VR v3: an integrated ecological and evolutionary framework for interrogating genomes of uncultivated viruses. Nucleic Acids Res. 2021;49(D1):D764–75. https://doi.org/10.1093/nar/gkaa946 . Epub 2020/11/03 PubMed PMID: 33137183; PubMed Central PMCID: PMCPMC7778971.
Mirdita M, Steinegger M, Soding J. MMseqs2 desktop and local web server app for fast, interactive sequence searches. Bioinformatics. 2019;35(16):2856–8. https://doi.org/10.1093/bioinformatics/bty1057 . Epub 2019/01/08 PubMed PMID: 30615063; PubMed Central PMCID: PMCPMC6691333.
Buchfink B, Reuter K, Drost HG. Sensitive protein alignments at tree-of-life scale using DIAMOND. Nat Methods. 2021;18(4):366–8. https://doi.org/10.1038/s41592-021-01101-x . Epub 2021/04/09 PubMed PMID: 33828273; PubMed Central PMCID: PMCPMC8026399.
Shen W, Ren H. TaxonKit: A practical and efficient NCBI taxonomy toolkit. J Genet Genomics. 2021;48(9):844–50. https://doi.org/10.1016/j.jgg.2021.03.006 . Epub 2021/05/19 PubMed PMID: 34001434.
Article PubMed Google Scholar
Gautam A, Felderhoff H, Bagci C, Huson DH. Using AnnoTree to get more assignments, faster, in DIAMOND+MEGAN microbiome analysis. mSystems. 2022;7(1):e0140821. https://doi.org/10.1128/msystems.01408-21 . Epub 2022/02/23 PubMed PMID: 35191776; PubMed Central PMCID: PMCPMC8862659.
Kumar S, Stecher G, Li M, Knyaz C, Tamura K. MEGA X: molecular evolutionary genetics analysis across computing platforms. Mol Biol Evol. 2018;35(6):1547–9. https://doi.org/10.1093/molbev/msy096 . Epub 2018/05/04 PubMed PMID: 29722887; PubMed Central PMCID: PMCPMC5967553.
Minh BQ, Schmidt HA, Chernomor O, Schrempf D, Woodhams MD, von Haeseler A, et al. IQ-TREE 2: new models and efficient methods for phylogenetic inference in the genomic era. Mol Biol Evol. 2020;37(5):1530–4. https://doi.org/10.1093/molbev/msaa015 . Epub 2020/02/06 PubMed PMID: 32011700; PubMed Central PMCID: PMCPMC7182206.
Letunic I, Bork P. Interactive Tree of Life (iTOL) v6: recent updates to the phylogenetic tree display and annotation tool. Nucleic Acids Res (2024). https://doi.org/10.1093/nar/gkae268
Muhire BM, Varsani A, Martin DP. SDT: a virus classification tool based on pairwise sequence alignment and identity calculation. Plos One. 2014;9(9):e108277. https://doi.org/10.1371/journal.pone.0108277 . Epub 2014/09/27 PubMed PMID: 25259891; PubMed Central PMCID: PMCPMC4178126.
Kumar S, Suleski M, Craig JM, Kasprowicz AE, Sanderford M, Li M, et al. TimeTree 5: an expanded resource for species divergence times. Mol Biol Evol. 2022;39(8):msac174. https://doi.org/10.1093/molbev/msac174 . Epub 2022/08/07 PubMed PMID: 35932227; PubMed Central PMCID: PMCPMC9400175.
Revell LJ. phytools 2.0: an updated R ecosystem for phylogenetic comparative methods (and other things). PeerJ. 2024;12:e16505. https://doi.org/10.7717/peerj.16505 . Epub 2024/01/09 PubMed PMID: 38192598; PubMed Central PMCID: PMCPMC10773453.
Santichaivekin S, Yang Q, Liu J, Mawhorter R, Jiang J, Wesley T, et al. eMPRess: a systematic cophylogeny reconciliation tool. Bioinformatics. 2021;37(16):2481–2. https://doi.org/10.1093/bioinformatics/btaa978 . Epub 2020/11/21 PubMed PMID: 33216126.
Ma W, Smirnov D, Libeskind-Hadas R. DTL reconciliation repair. BMC Bioinformatics. 2017;18(Suppl 3):76. https://doi.org/10.1186/s12859-017-1463-9 . Epub 2017/04/01 PubMed PMID: 28361686; PubMed Central PMCID: PMCPMC5374596.
Members C-N, Partners. Database resources of the national genomics data center, China national center for bioinformation in 2024. Nucleic Acids Res. 2024;52(D1):D18–32. https://doi.org/10.1093/nar/gkad1078 . Epub 2023/11/29 PubMed PMID: 38018256; PubMed Central PMCID: PMCPMC10767964.
Article Google Scholar
Shafik K, Umer M, You H, Aboushedida H, Wang Z, Ni D, et al. Characterization of a Novel Mitovirus infecting Melanconiella theae isolated from tea plants. Front Microbiol. 2021;12: 757556. https://doi.org/10.3389/fmicb.2021.757556 . Epub 2021/12/07 PubMed PMID: 34867881; PubMed Central PMCID: PMCPMC8635788
Kamaruzzaman M, He G, Wu M, Zhang J, Yang L, Chen W, et al. A novel Partitivirus in the Hypovirulent isolate QT5–19 of the plant pathogenic fungus Botrytis cinerea. Viruses. 2019;11(1):24. https://doi.org/10.3390/v11010024 . Epub 2019/01/06 PubMed PMID: 30609795; PubMed Central PMCID: PMCPMC6356794.
Akata I, Keskin E, Sahin E. Molecular characterization of a new mitovirus hosted by the ectomycorrhizal fungus Albatrellopsis flettii. Arch Virol. 2021;166(12):3449–54. https://doi.org/10.1007/s00705-021-05250-4 . Epub 2021/09/24 PubMed PMID: 34554305.
Walker PJ, Siddell SG, Lefkowitz EJ, Mushegian AR, Adriaenssens EM, Alfenas-Zerbini P, et al. Recent changes to virus taxonomy ratified by the international committee on taxonomy of viruses (2022). Arch Virol. 2022;167(11):2429–40. https://doi.org/10.1007/s00705-022-05516-5 . Epub 2022/08/24 PubMed PMID: 35999326; PubMed Central PMCID: PMCPMC10088433.
Alvarez-Quinto R, Grinstead S, Jones R, Mollov D. Complete genome sequence of a new mitovirus associated with walking iris (Trimezia northiana). Arch Virol. 2023;168(11):273. https://doi.org/10.1007/s00705-023-05901-8 . Epub 2023/10/17 PubMed PMID: 37845386.
Gilmer D, Ratti C, Ictv RC. ICTV Virus taxonomy profile: Benyviridae. J Gen Virol. 2017;98(7):1571–2. https://doi.org/10.1099/jgv.0.000864 . Epub 2017/07/18 PubMed PMID: 28714846; PubMed Central PMCID: PMCPMC5656776.
Wetzel V, Willlems G, Darracq A, Galein Y, Liebe S, Varrelmann M. The Beta vulgaris-derived resistance gene Rz2 confers broad-spectrum resistance against soilborne sugar beet-infecting viruses from different families by recognizing triple gene block protein 1. Mol Plant Pathol. 2021;22(7):829–42. https://doi.org/10.1111/mpp.13066 . Epub 2021/05/06 PubMed PMID: 33951264; PubMed Central PMCID: PMCPMC8232027.
Ayllon MA, Turina M, Xie J, Nerva L, Marzano SL, Donaire L, et al. ICTV Virus taxonomy profile: Botourmiaviridae. J Gen Virol. 2020;101(5):454–5. https://doi.org/10.1099/jgv.0.001409 . Epub 2020/05/08 PubMed PMID: 32375992; PubMed Central PMCID: PMCPMC7414452.
Xiao J, Wang X, Zheng Z, Wu Y, Wang Z, Li H, et al. Molecular characterization of a novel deltaflexivirus infecting the edible fungus Pleurotus ostreatus. Arch Virol. 2023;168(6):162. https://doi.org/10.1007/s00705-023-05789-4 . Epub 2023/05/17 PubMed PMID: 37195309.
Canuti M, Rodrigues B, Lang AS, Dufour SC, Verhoeven JTP. Novel divergent members of the Kitrinoviricota discovered through metagenomics in the intestinal contents of red-backed voles (Clethrionomys gapperi). Int J Mol Sci. 2022;24(1):131. https://doi.org/10.3390/ijms24010131 . Epub 2023/01/09 PubMed PMID: 36613573; PubMed Central PMCID: PMCPMC9820622.
Hermanns K, Zirkel F, Kopp A, Marklewitz M, Rwego IB, Estrada A, et al. Discovery of a novel alphavirus related to Eilat virus. J Gen Virol. 2017;98(1):43–9. https://doi.org/10.1099/jgv.0.000694 . Epub 2017/02/17 PubMed PMID: 28206905.
Jiang D, Ayllon MA, Marzano SL, Ictv RC. ICTV Virus taxonomy profile: Mymonaviridae. J Gen Virol. 2019;100(10):1343–4. https://doi.org/10.1099/jgv.0.001301 . Epub 2019/09/04 PubMed PMID: 31478828.
Liu L, Xie J, Cheng J, Fu Y, Li G, Yi X, et al. Fungal negative-stranded RNA virus that is related to bornaviruses and nyaviruses. Proc Natl Acad Sci U S A. 2014;111(33):12205–10. https://doi.org/10.1073/pnas.1401786111 . Epub 2014/08/06 PubMed PMID: 25092337; PubMed Central PMCID: PMCPMC4143027.
Zhong J, Li P, Gao BD, Zhong SY, Li XG, Hu Z, et al. Novel and diverse mycoviruses co-infecting a single strain of the phytopathogenic fungus Alternaria dianthicola. Front Cell Infect Microbiol. 2022;12:980970. https://doi.org/10.3389/fcimb.2022.980970 . Epub 2022/10/15 PubMed PMID: 36237429; PubMed Central PMCID: PMCPMC9552818.
Wang W, Wang X, Tu C, Yang M, Xiang J, Wang L, et al. Novel Mycoviruses discovered from a Metatranscriptomics survey of the Phytopathogenic Alternaria Fungus. Viruses. 2022;14(11):2552. https://doi.org/10.3390/v14112552 . Epub 2022/11/25 PubMed PMID: 36423161; PubMed Central PMCID: PMCPMC9693364.
Sun Y, Li J, Gao GF, Tien P, Liu W. Bunyavirales ribonucleoproteins: the viral replication and transcription machinery. Crit Rev Microbiol. 2018;44(5):522–40. https://doi.org/10.1080/1040841X.2018.1446901 . Epub 2018/03/09 PubMed PMID: 29516765.
Li P, Bhattacharjee P, Gagkaeva T, Wang S, Guo L. A novel bipartite negative-stranded RNA mycovirus of the order Bunyavirales isolated from the phytopathogenic fungus Fusarium sibiricum. Arch Virol. 2023;169(1):13. https://doi.org/10.1007/s00705-023-05942-z . Epub 2023/12/29 PubMed PMID: 38155262.
Ferron F, Weber F, de la Torre JC, Reguera J. Transcription and replication mechanisms of Bunyaviridae and Arenaviridae L proteins. Virus Res. 2017;234:118–34. https://doi.org/10.1016/j.virusres.2017.01.018 . Epub 2017/02/01 PubMed PMID: 28137457; PubMed Central PMCID: PMCPMC7114536.
Vainio EJ, Chiba S, Ghabrial SA, Maiss E, Roossinck M, Sabanadzovic S, et al. ICTV Virus taxonomy profile: Partitiviridae. J Gen Virol. 2018;99(1):17–8. https://doi.org/10.1099/jgv.0.000985 . Epub 2017/12/08 PubMed PMID: 29214972; PubMed Central PMCID: PMCPMC5882087.
Mifsud JCO, Gallagher RV, Holmes EC, Geoghegan JL. Transcriptome mining expands knowledge of RNA viruses across the plant Kingdom. J Virol. 2022;96(24):e0026022. https://doi.org/10.1128/jvi.00260-22 . Epub 2022/06/01 PubMed PMID: 35638822; PubMed Central PMCID: PMCPMC9769393.
Tamada T, Kondo H. Biological and genetic diversity of plasmodiophorid-transmitted viruses and their vectors. J Gen Plant Pathol. 2013;79:307–20.
Dolja VV, Krupovic M, Koonin EV. Deep roots and splendid boughs of the global plant virome. Annu Rev Phytopathol. 2020;58:23–53.
Koonin EV, Dolja VV, Krupovic M, Varsani A, Wolf YI, Yutin N, et al. Global organization and proposed Megataxonomy of the virus world. Microbiol Mol Biol Rev. 2020;84(2):e00061. https://doi.org/10.1128/MMBR.00061-19 . Epub 2020/03/07 PubMed PMID: 32132243; PubMed Central PMCID: PMCPMC7062200.
Osono T. Role of phyllosphere fungi of forest trees in the development of decomposer fungal communities and decomposition processes of leaf litter. Can J Microbiol. 2006;52(8):701–16. https://doi.org/10.1139/w06-023 . Epub 2006/08/19 PubMed PMID: 16917528.
Li Z, Pan D, Wei G, Pi W, Zhang C, Wang JH, et al. Deep sea sediments associated with cold seeps are a subsurface reservoir of viral diversity. ISME J. 2021;15(8):2366–78. https://doi.org/10.1038/s41396-021-00932-y . Epub 2021/03/03 PubMed PMID: 33649554; PubMed Central PMCID: PMCPMC8319345.
Hierweger MM, Koch MC, Rupp M, Maes P, Di Paola N, Bruggmann R, et al. Novel Filoviruses, Hantavirus, and Rhabdovirus in freshwater fish, Switzerland, 2017. Emerg Infect Dis. 2021;27(12):3082–91. https://doi.org/10.3201/eid2712.210491 . Epub 2021/11/23 PubMed PMID: 34808081; PubMed Central PMCID: PMCPMC8632185.
La Rosa G, Iaconelli M, Mancini P, Bonanno Ferraro G, Veneri C, Bonadonna L, et al. First detection of SARS-CoV-2 in untreated wastewaters in Italy. Sci Total Environ. 2020;736:139652. https://doi.org/10.1016/j.scitotenv.2020.139652 . Epub 2020/05/29 PubMed PMID: 32464333; PubMed Central PMCID: PMCPMC7245320.
Sutela S, Poimala A, Vainio EJ. Viruses of fungi and oomycetes in the soil environment. FEMS Microbiol Ecol. 2019;95(9):fiz119. https://doi.org/10.1093/femsec/fiz119 . Epub 2019/08/01 PubMed PMID: 31365065.
Yu X, Li B, Fu Y, Jiang D, Ghabrial SA, Li G, et al. A geminivirus-related DNA mycovirus that confers hypovirulence to a plant pathogenic fungus. Proc Natl Acad Sci U S A. 2010;107(18):8387–92. https://doi.org/10.1073/pnas.0913535107 . Epub 2010/04/21 PubMed PMID: 20404139; PubMed Central PMCID: PMCPMC2889581.
Li P, Wang S, Zhang L, Qiu D, Zhou X, Guo L. A tripartite ssDNA mycovirus from a plant pathogenic fungus is infectious as cloned DNA and purified virions. Sci Adv. 2020;6(14):eaay9634. https://doi.org/10.1126/sciadv.aay9634 . Epub 2020/04/15 PubMed PMID: 32284975; PubMed Central PMCID: PMCPMC7138691.
Khalifa ME, MacDiarmid RM. A mechanically transmitted DNA Mycovirus is targeted by the defence machinery of its host, Botrytis cinerea. Viruses. 2021;13(7):1315. https://doi.org/10.3390/v13071315 . Epub 2021/08/11 PubMed PMID: 34372522; PubMed Central PMCID: PMCPMC8309985.
Yu X, Li B, Fu Y, Xie J, Cheng J, Ghabrial SA, et al. Extracellular transmission of a DNA mycovirus and its use as a natural fungicide. Proc Natl Acad Sci U S A. 2013;110(4):1452–7. https://doi.org/10.1073/pnas.1213755110 . Epub 2013/01/09 PubMed PMID: 23297222; PubMed Central PMCID: PMCPMC3557086.
Nuss DL. Hypovirulence: mycoviruses at the fungal-plant interface. Nat Rev Microbiol. 2005;3(8):632–42. https://doi.org/10.1038/nrmicro1206 . Epub 2005/08/03 PubMed PMID: 16064055.
Coenen A, Kevei F, Hoekstra RF. Factors affecting the spread of double-stranded RNA viruses in Aspergillus nidulans. Genet Res. 1997;69(1):1–10. https://doi.org/10.1017/s001667239600256x . Epub 1997/02/01 PubMed PMID: 9164170.
Freitas CSA, Maciel LF, Dos Correa Santos RA, Costa O, Maia FCB, Rabelo RS, et al. Bacterial volatile organic compounds induce adverse ultrastructural changes and DNA damage to the sugarcane pathogenic fungus Thielaviopsis ethacetica. Environ Microbiol. 2022;24(3):1430–53. https://doi.org/10.1111/1462-2920.15876 . Epub 2022/01/08 PubMed PMID: 34995419.
Martinez-Alvarez P, Vainio EJ, Botella L, Hantula J, Diez JJ. Three mitovirus strains infecting a single isolate of Fusarium circinatum are the first putative members of the family Narnaviridae detected in a fungus of the genus Fusarium. Arch Virol. 2014;159(8):2153–5. https://doi.org/10.1007/s00705-014-2012-8 . Epub 2014/02/13 PubMed PMID: 24519462.
Deakin G, Dobbs E, Bennett JM, Jones IM, Grogan HM, Burton KS. Multiple viral infections in Agaricus bisporus - characterisation of 18 unique RNA viruses and 8 ORFans identified by deep sequencing. Sci Rep. 2017;7(1):2469. https://doi.org/10.1038/s41598-017-01592-9 . Epub 2017/05/28 PubMed PMID: 28550284; PubMed Central PMCID: PMCPMC5446422.
Litov AG, Zueva AI, Tiunov AV, Van Thinh N, Belyaeva NV, Karganova GG. Virome of three termite species from Southern Vietnam. Viruses. 2022;14(5):860. https://doi.org/10.3390/v14050860 . Epub 2022/05/29 PubMed PMID: 35632601; PubMed Central PMCID: PMCPMC9143207.
Hu J, Neoh KB, Appel AG, Lee CY. Subterranean termite open-air foraging and tolerance to desiccation: Comparative water relation of two sympatric Macrotermes spp. (Blattodea: Termitidae). Comp Biochem Physiol A Mol Integr Physiol. 2012;161(2):201–7. https://doi.org/10.1016/j.cbpa.2011.10.028 . Epub 2011/11/17 PubMed PMID: 22085890.
Kondo H, Botella L, Suzuki N. Mycovirus diversity and evolution revealed/inferred from recent studies. Annu Rev Phytopathol. 2022;60:307–36. https://doi.org/10.1146/annurev-phyto-021621-122122 . Epub 2022/05/25 PubMed PMID: 35609970.
Fukushi T. Relationships between propagative rice viruses and their vectors. 1969.
Google Scholar
Sun L, Kondo H, Bagus AI. Cross-kingdom virus infection. Encyclopedia of Virology: Volume 1–5. 4th Ed. Elsevier; 2020. pp. 443–9. https://doi.org/10.1016/B978-0-12-809633-8.21320-4 .
Bian R, Andika IB, Pang T, Lian Z, Wei S, Niu E, et al. Facilitative and synergistic interactions between fungal and plant viruses. Proc Natl Acad Sci U S A. 2020;117(7):3779–88. https://doi.org/10.1073/pnas.1915996117 . Epub 2020/02/06 PubMed PMID: 32015104; PubMed Central PMCID: PMCPMC7035501.
Chiapello M, Rodriguez-Romero J, Ayllon MA, Turina M. Analysis of the virome associated to grapevine downy mildew lesions reveals new mycovirus lineages. Virus Evol. 2020;6(2):veaa058. https://doi.org/10.1093/ve/veaa058 . Epub 2020/12/17 PubMed PMID: 33324489; PubMed Central PMCID: PMCPMC7724247.
Sutela S, Forgia M, Vainio EJ, Chiapello M, Daghino S, Vallino M, et al. The virome from a collection of endomycorrhizal fungi reveals new viral taxa with unprecedented genome organization. Virus Evol. 2020;6(2):veaa076. https://doi.org/10.1093/ve/veaa076 . Epub 2020/12/17 PubMed PMID: 33324490; PubMed Central PMCID: PMCPMC7724248.
Zhou K, Zhang F, Deng Y. Comparative analysis of viromes identified in multiple macrofungi. Viruses. 2024;16(4):597. https://doi.org/10.3390/v16040597 . Epub 2024/04/27 PubMed PMID: 38675938; PubMed Central PMCID: PMCPMC11054281.
Siddell SG, Smith DB, Adriaenssens E, Alfenas-Zerbini P, Dutilh BE, Garcia ML, et al. Virus taxonomy and the role of the International Committee on Taxonomy of Viruses (ICTV). J Gen Virol. 2023;104(5):001840. https://doi.org/10.1099/jgv.0.001840 . Epub 2023/05/04 PubMed PMID: 37141106; PubMed Central PMCID: PMCPMC10227694.
Download references
Acknowledgements
All authors participated in the design, interpretation of the studies and analysis of the data and review of the manuscript; WZ and CZ contributed to the conception and design; XL, ZD, JXU, WL and PN contributed to the collection and assembly of data; XL, ZD and JXE contributed to the data analysis and interpretation.
This research was supported by National Key Research and Development Programs of China [No.2023YFD1801301 and 2022YFC2603801] and the National Natural Science Foundation of China [No.82341106].
Author information
Xiang Lu, Ziyuan Dai and Jiaxin Xue are equally contributed to this works.
Authors and Affiliations
Institute of Critical Care Medicine, The Affiliated People’s Hospital, Jiangsu University, Zhenjiang, 212002, China
Xiang Lu & Wen Zhang
Department of Microbiology, School of Medicine, Jiangsu University, Zhenjiang, 212013, China
Xiang Lu, Jiaxin Xue & Wen Zhang
Department of Clinical Laboratory, Affiliated Hospital 6 of Nantong University, Yancheng Third People’s Hospital, Yancheng, Jiangsu, China
Clinical Laboratory Center, The Affiliated Taizhou People’s Hospital of Nanjing Medical University, Taizhou, 225300, China
Wang Li, Ping Ni, Juan Xu, Chenglin Zhou & Wen Zhang
You can also search for this author in PubMed Google Scholar
Contributions
Corresponding authors.
Correspondence to Juan Xu , Chenglin Zhou or Wen Zhang .
Ethics declarations
Ethics approval and consent to participate.
Not applicable.
Consent for publication
Competing interests.
The authors declare no competing interests.
Additional information
Publisher’s note.
Springer Nature remains neutral with regard to jurisdictional claims in published maps and institutional affiliations.
Supplementary Information
Supplementary material 1., supplementary material 2., supplementary material 3., rights and permissions.
Open Access This article is licensed under a Creative Commons Attribution 4.0 International License, which permits use, sharing, adaptation, distribution and reproduction in any medium or format, as long as you give appropriate credit to the original author(s) and the source, provide a link to the Creative Commons licence, and indicate if changes were made. The images or other third party material in this article are included in the article's Creative Commons licence, unless indicated otherwise in a credit line to the material. If material is not included in the article's Creative Commons licence and your intended use is not permitted by statutory regulation or exceeds the permitted use, you will need to obtain permission directly from the copyright holder. To view a copy of this licence, visit http://creativecommons.org/licenses/by/4.0/ . The Creative Commons Public Domain Dedication waiver ( http://creativecommons.org/publicdomain/zero/1.0/ ) applies to the data made available in this article, unless otherwise stated in a credit line to the data.
Reprints and permissions
About this article
Cite this article.
Lu, X., Dai, Z., Xue, J. et al. Discovery of novel RNA viruses through analysis of fungi-associated next-generation sequencing data. BMC Genomics 25 , 517 (2024). https://doi.org/10.1186/s12864-024-10432-w
Download citation
Received : 19 March 2024
Accepted : 20 May 2024
Published : 27 May 2024
DOI : https://doi.org/10.1186/s12864-024-10432-w
Share this article
Anyone you share the following link with will be able to read this content:
Sorry, a shareable link is not currently available for this article.
Provided by the Springer Nature SharedIt content-sharing initiative
BMC Genomics
ISSN: 1471-2164
- Submission enquiries: [email protected]
- General enquiries: [email protected]
Hurricane Research Division

Hurricane Research
Dynamics and physics.
Visit the Dynamics & Physics Page
Observing Techniques
Visit the Observing Systems Page
Modeling and Prediction
Visit the Modeling & Prediction Page
Data Assimilation
Visit the Data Assimilation Page
Hurricane Impacts
Visit the Impacts Page
Featured Projects

Saharan Air Layer
Effects on Atlantic Tropical Cyclones

Extratropical Transition
Forecasting Impacts in Midlatitudes

Real-Time Doppler Winds
Analyzing & Delivering Data in “Real-Time”

Observing System Experiments
Using Aircraft Data
Hurricane Field Program
Experiments, flight plans and, operational maps and information for 2024, hurricane data, previous years data by storm.
View previous years' data by storm on our Data Page. Includes wind speed, temperature and humidity profiles, radar and visuals, and more.
Hurricane Model Viewer
Graphical products for experimental NOAA models and operational models.
2023 Field Program Data
All encompassing data suite includes wind speed, temperature and humidity profiles, radar and visuals, and more.
Research Capability & Expertise
Each WP-3D aircraft has three radars: nose, lower fuselage, and tail. The nose radar (a solid-state C-band radar with a 5° circular beam) is used strictly for flight safety and is not recorded for research purposes. The lower fuselage and tail radars are used for operational and research purposes. The G-IV aircraft has a nose and a tail radar too.
Expendables Dropwindsondes are deployed from the aircraft and drift down on a parachute measuring vertical profiles of pressure, temperature, humidity and wind as they fall. They are released from the both the WP-3D and G-IV aircraft over data-sparse oceanic regions. Airborne eXpendable BathyThermographs (AXBT) Airborne eXpendable Current Profilers (AXCP) Airborne eXpendable Conductivity Temperature and Depth probes (AXCTD) Drifting buoys
Oceanographic instruments may be deployed from the WP-3D aircraft either from external chutes using explosive cads or from an internal drop chute. They activate upon hitting the ocean surface and radio sea temperature, salinity, and current information back to computers aboard the aircraft.
Visit Expendables Page
Remote Sensing
Among the suite of airborne remote sensing instruments available on the WP-3D aircraft for the purpose of measuring surface winds in and around tropical cyclones are the Stepped Frequency Microwave Radiometer and the C-band scatterometer (C-SCAT). The C-SCAT conically scans the ocean surfaceobtaining backscatter measurements from 20° to 50° off nadir
C-Band Scatterometer (C-SCAT) The C-SCAT antenna is a microstrip phased array whose main lobe can be pointed at 20°, 30°, 40°, and 50° off nadir. The antenna is rotated in azimuth at 30 rpm. Thus, conical scans of the ocean surface are repeated every 2 s (0.25 km at 125 m/s ground speed).
Data assimilation is a technique by which numerical model data and observations are combined to obtain an analysis that best represents the state of the atmospheric phenomena of interest. At HRD, the focus is on the utilization of a wide range of observations for the state analysis of tropical systems and their near environments to study their structure and physical/dynamical processes, and to improve numerical forecasts. Research includes the development and application of a state-of-the-art ensemble-based data assimilation system (the Hurricane Ensemble Data Assimilation System – HEDAS) with the operational Hurricane Weather Research and Forecast model, using airborne, satellite and other observations. In parallel, Observing System Simulation Experiments are conducted for the systematic evaluation of proposed observational platforms geared toward the better sampling of tropical weather systems.
AOML developed the high-resolution HWRF model, the first 3 km-resolution regional model to be officially adopted and run operationally by the National Hurricane Center at the start of the 2012 hurricane season. This state-of-the-art research involved the following key elements:
High-resolution numerical model developments; Advancements to physical parameterizations for hurricane models based on observations; And above all, advancements in the basic understanding of hurricane processes.
In collaboration with NCEP‘s Environmental Modeling Center, and with the vital support of NOAA‘s Hurricane Forecast Improvement Project (HFIP), we are fully committed for years to come to the development and further advancement of NOAA‘s HWRF modeling system. A basin-sale version of the HWRF model is now in transition to operations. Visit the Hurricane Modeling and Prediction page to learn more.
News & Events

Unveiling the innovative advancements in hurricane modeling
June 4, 2024
With an active hurricane season on the horizon, the need for reliable hurricane forecasting is at the forefront of our minds. Heightened sea surface temperatures, weakened vertical wind shear, and an enhanced West African monsoon are expected to contribute to the development of tropical cyclones in the Atlantic. To predict these developing storms, meteorologists employ models that rely on current observations and mathematical calculations to predict a storm’s behavior and track. These models are complex and utilize inputs from a variety of sources including historic, numeric, oceanic, and atmospheric data to generate their predictions.
Developments in Hurricane Model Contributed to its Lasting Legacy
Innovative Flight Patterns Boost Hurricane Forecast Accuracy, NOAA Study Finds
12 Days of AOML Research
AOML awarded for exceptional science and communications accomplishments
Improvements in Forecasting, Weather, Floods and Hurricanes
Providing research to make forecasts better.
This overview report includes work on the Hurricane Analysis and Forecasting System (HAFS) , a set of moving, high-resolution nests around tropical cyclones in the global weather model, and the AOML Hurricane Model Viewer .

Featured Publication

Alaka Jr, G. J., Zhang, X., & Gopalakrishnan, S. G. (2022). High-definition hurricanes: improving forecasts with storm-following nests. Bulletin of the American Meteorological Society , 103 (3), E680-E703.
Abstract: To forecast tropical cyclone (TC) intensity and structure changes with fidelity, numerical weather prediction models must be “high definition,” i.e., horizontal grid spacing ≤ 3 km, so that they permit clouds and convection and resolve sharp gradients of momentum and moisture in the eyewall and rainbands. Storm-following nests are computationally efficient at fine resolutions, providing a practical approach to improve TC intensity forecasts. Under the Hurricane Forecast Improvement Project, the operational Hurricane Weather Research and Forecasting (HWRF) system was developed to include telescopic, storm-following nests for a single TC per model integration.
Download Full Paper
High-Definition Hurricanes: Improving Forecasts with Storm-Following Nests

Looking for scientific literature? Visit our Publication Database.
Dropsondes Measure Important Atmospheric Conditions
Airborne radar.
As our Hurricane Hunter Scientists make passes through the storm, they release small sensor packages on parachutes called dropsondes. These instruments provide measurements of temperature, pressure, humidity and wind as they descend through the storm. See more of our videos on YouTube.

Frequently Asked Questions about Hurricanes
Why don't nuclear weapons destroy hurricanes.
Radioactive fallout from such an operation would far outweigh the benefits and may not alter the storm. Additionally, the amount of energy that a storm produces far outweighs the energy produced by one nuclear weapon.
How Much Energy is Released from a Hurricane?
The energy released from a hurricane can be explained in two ways: the total amount of energy released by the condensation of water droplets (latent heat), or the amount of kinetic energy generated to maintain the strong, swirling winds of a hurricane. The vast majority of the latent heat released is used to drive the convection of a storm, but the total energy released from condensation is 200 times the world-wide electrical generating capacity, or 6.0 x 10 14 watts per day. If you measure the total kinetic energy instead, it comes out to about 1.5 x 10 12 watts per day, or ½ of the world-wide electrical generating capacity. It would seem that although wind energy seems the most obvious energetic process, it is actually the latent release of heat that feeds a hurricane’s momentum.
What Causes Tropical Cyclones?
In addition to hurricane-favorable conditions such as temperature and humidity, many repeating atmospheric phenomenon contribute to causing and intensifying tropical cyclones. For example, African Easterly Waves are winds in the lower troposphere (ocean surface to 3 miles above) that travel from Africa at speeds of about 3mph westward as a result of the African Easterly Jet. These winds are seen from April until November. About 85% of intense hurricanes and about 60% of smaller storms have their origin in African Easterly waves.
The Saharan Air Layer is another significant seeding phenomenon for tropical storms. It is a mass of dry, mineral-rich, dusty air that forms over the Sahara from late spring to early fall and moves over the tropical North Atlantic every 3-5 days at speeds of 22-55mph (10-25 meters per second). The air mass is 1-2 miles deep, exists in the lower troposphere, and can be as wide as the continental US. These air masses have significant moderating impacts on tropical cyclone intensity and formation because the dry, intense air can both deprive the storm of moisture and interfere with its convection by increasing the wind shear.
Many tropical cyclones form due to these larger scale atmospheric factors. Hurricanes that form fairly close in our basin are called Cape Verde hurricanes, named for the location where they are formed. Cape Verde origin hurricanes can be up to five per year, with an average of around two.
Why are Tropical Cyclones Always Worse on the Right Side?
If a hurricane is moving to the west, the right side would be to the north of the storm, if it is heading north, then the right side would be to the east of the storm. The movement of a hurricane can be broken into two parts- the spiral movement and its forward movement. If the hurricane is moving forward, the side of the spiral with winds parallel and facing forward in the direction of movement will go faster, because you are adding two velocities together. The side of the spiral parallel to the movement, but going in the opposite direction will be slower, because you must subtract the velocity moving away (backwards) from the forward velocity.
For example, a hurricane with 90mph winds moving at 10mph would have a 100mph wind speed on the right (forward-moving) side and 80 mph on the side with the backward motion.
How are Hurricanes Named?
During the 19th century, hurricane names were inspired by everything from saints to wives to unpopular politicians. In 1978, it was agreed that the National Hurricane Center would use alternating men and women’s names following the practice adopted by Australia’s bureau of Meteorology three years earlier in 1975.
Today, a list of potential names is published by the United Nations World Meteorological Organization for the Atlantic basin. These names extend into 2023, and the list repeats every seventh year. If a particularly damaging storm occurs, the name of that storm is retired. Storms retired in 2017 include Harvey, Irma, Maria, and Nate. If there are more storms than names on the list in a given season, the National Hurricane Center will name them using the Greek alphabet. Lastly, if a storm happens to move across basins, it keeps the original name. The only time it is renamed if it dissipates to a tropical disturbance and reforms.
With Hurricane Hunters Dr. Frank Marks & Commander Justin Kibbey

Shirley Murillo
305.361.4509
| Shirley Murillo
Acting Director, Hurricane Research Division

Aaron Poyer
301.427.9619
| Aaron Poyer
Acting Deputy Director, Hurricane Research Division
Our Field Photos
Scientists and Hurricane Hunters Paul Reasor and Robert Rogers preparing for flight into Hurricane Barry. Photo Credit, NOAA AOML.
The Global Hawk unmanned aircraft can fly continuously for 24 hours in a storm, collecting critical atmospheric data. Photo Credit, NOAA AOML.
Sunrise photo above the clouds from a hurricane hunter aircraft. Photo Credit, NOAA AOML.
Frank Marks Takes a Selfie with Ms. Piggy- The P3 aircraft have nicknames. This one is called Miss Piggy after one of Jim Henson’s The Muppets character. Photo Credit, NOAA AOML.
Photo of the P3 flying science lab on the tarmac ready for its next flight. Photo Credit, NOAA AOML.
Scientist drops scientific instruments into the hurricane below to take measurements that improve our forecasts. Photo Credit, NOAA AOML.
The eye of a hurricane as seen by a P3 aircraft. Photo Credit, NOAA AOML.
Hurricane researchers Paul Reasor (L) and Rob Rogers (R) are hard at work analyzing data during their flight into Tropical Storm Barry. Photo Credit: NOAA.

An official website of the United States government
The .gov means it’s official. Federal government websites often end in .gov or .mil. Before sharing sensitive information, make sure you’re on a federal government site.
The site is secure. The https:// ensures that you are connecting to the official website and that any information you provide is encrypted and transmitted securely.
- Publications
- Account settings
Preview improvements coming to the PMC website in October 2024. Learn More or Try it out now .
- Advanced Search
- Journal List
- Can J Hosp Pharm
- v.68(3); May-Jun 2015
Qualitative Research: Data Collection, Analysis, and Management
Introduction.
In an earlier paper, 1 we presented an introduction to using qualitative research methods in pharmacy practice. In this article, we review some principles of the collection, analysis, and management of qualitative data to help pharmacists interested in doing research in their practice to continue their learning in this area. Qualitative research can help researchers to access the thoughts and feelings of research participants, which can enable development of an understanding of the meaning that people ascribe to their experiences. Whereas quantitative research methods can be used to determine how many people undertake particular behaviours, qualitative methods can help researchers to understand how and why such behaviours take place. Within the context of pharmacy practice research, qualitative approaches have been used to examine a diverse array of topics, including the perceptions of key stakeholders regarding prescribing by pharmacists and the postgraduation employment experiences of young pharmacists (see “Further Reading” section at the end of this article).
In the previous paper, 1 we outlined 3 commonly used methodologies: ethnography 2 , grounded theory 3 , and phenomenology. 4 Briefly, ethnography involves researchers using direct observation to study participants in their “real life” environment, sometimes over extended periods. Grounded theory and its later modified versions (e.g., Strauss and Corbin 5 ) use face-to-face interviews and interactions such as focus groups to explore a particular research phenomenon and may help in clarifying a less-well-understood problem, situation, or context. Phenomenology shares some features with grounded theory (such as an exploration of participants’ behaviour) and uses similar techniques to collect data, but it focuses on understanding how human beings experience their world. It gives researchers the opportunity to put themselves in another person’s shoes and to understand the subjective experiences of participants. 6 Some researchers use qualitative methodologies but adopt a different standpoint, and an example of this appears in the work of Thurston and others, 7 discussed later in this paper.
Qualitative work requires reflection on the part of researchers, both before and during the research process, as a way of providing context and understanding for readers. When being reflexive, researchers should not try to simply ignore or avoid their own biases (as this would likely be impossible); instead, reflexivity requires researchers to reflect upon and clearly articulate their position and subjectivities (world view, perspectives, biases), so that readers can better understand the filters through which questions were asked, data were gathered and analyzed, and findings were reported. From this perspective, bias and subjectivity are not inherently negative but they are unavoidable; as a result, it is best that they be articulated up-front in a manner that is clear and coherent for readers.
THE PARTICIPANT’S VIEWPOINT
What qualitative study seeks to convey is why people have thoughts and feelings that might affect the way they behave. Such study may occur in any number of contexts, but here, we focus on pharmacy practice and the way people behave with regard to medicines use (e.g., to understand patients’ reasons for nonadherence with medication therapy or to explore physicians’ resistance to pharmacists’ clinical suggestions). As we suggested in our earlier article, 1 an important point about qualitative research is that there is no attempt to generalize the findings to a wider population. Qualitative research is used to gain insights into people’s feelings and thoughts, which may provide the basis for a future stand-alone qualitative study or may help researchers to map out survey instruments for use in a quantitative study. It is also possible to use different types of research in the same study, an approach known as “mixed methods” research, and further reading on this topic may be found at the end of this paper.
The role of the researcher in qualitative research is to attempt to access the thoughts and feelings of study participants. This is not an easy task, as it involves asking people to talk about things that may be very personal to them. Sometimes the experiences being explored are fresh in the participant’s mind, whereas on other occasions reliving past experiences may be difficult. However the data are being collected, a primary responsibility of the researcher is to safeguard participants and their data. Mechanisms for such safeguarding must be clearly articulated to participants and must be approved by a relevant research ethics review board before the research begins. Researchers and practitioners new to qualitative research should seek advice from an experienced qualitative researcher before embarking on their project.
DATA COLLECTION
Whatever philosophical standpoint the researcher is taking and whatever the data collection method (e.g., focus group, one-to-one interviews), the process will involve the generation of large amounts of data. In addition to the variety of study methodologies available, there are also different ways of making a record of what is said and done during an interview or focus group, such as taking handwritten notes or video-recording. If the researcher is audio- or video-recording data collection, then the recordings must be transcribed verbatim before data analysis can begin. As a rough guide, it can take an experienced researcher/transcriber 8 hours to transcribe one 45-minute audio-recorded interview, a process than will generate 20–30 pages of written dialogue.
Many researchers will also maintain a folder of “field notes” to complement audio-taped interviews. Field notes allow the researcher to maintain and comment upon impressions, environmental contexts, behaviours, and nonverbal cues that may not be adequately captured through the audio-recording; they are typically handwritten in a small notebook at the same time the interview takes place. Field notes can provide important context to the interpretation of audio-taped data and can help remind the researcher of situational factors that may be important during data analysis. Such notes need not be formal, but they should be maintained and secured in a similar manner to audio tapes and transcripts, as they contain sensitive information and are relevant to the research. For more information about collecting qualitative data, please see the “Further Reading” section at the end of this paper.
DATA ANALYSIS AND MANAGEMENT
If, as suggested earlier, doing qualitative research is about putting oneself in another person’s shoes and seeing the world from that person’s perspective, the most important part of data analysis and management is to be true to the participants. It is their voices that the researcher is trying to hear, so that they can be interpreted and reported on for others to read and learn from. To illustrate this point, consider the anonymized transcript excerpt presented in Appendix 1 , which is taken from a research interview conducted by one of the authors (J.S.). We refer to this excerpt throughout the remainder of this paper to illustrate how data can be managed, analyzed, and presented.
Interpretation of Data
Interpretation of the data will depend on the theoretical standpoint taken by researchers. For example, the title of the research report by Thurston and others, 7 “Discordant indigenous and provider frames explain challenges in improving access to arthritis care: a qualitative study using constructivist grounded theory,” indicates at least 2 theoretical standpoints. The first is the culture of the indigenous population of Canada and the place of this population in society, and the second is the social constructivist theory used in the constructivist grounded theory method. With regard to the first standpoint, it can be surmised that, to have decided to conduct the research, the researchers must have felt that there was anecdotal evidence of differences in access to arthritis care for patients from indigenous and non-indigenous backgrounds. With regard to the second standpoint, it can be surmised that the researchers used social constructivist theory because it assumes that behaviour is socially constructed; in other words, people do things because of the expectations of those in their personal world or in the wider society in which they live. (Please see the “Further Reading” section for resources providing more information about social constructivist theory and reflexivity.) Thus, these 2 standpoints (and there may have been others relevant to the research of Thurston and others 7 ) will have affected the way in which these researchers interpreted the experiences of the indigenous population participants and those providing their care. Another standpoint is feminist standpoint theory which, among other things, focuses on marginalized groups in society. Such theories are helpful to researchers, as they enable us to think about things from a different perspective. Being aware of the standpoints you are taking in your own research is one of the foundations of qualitative work. Without such awareness, it is easy to slip into interpreting other people’s narratives from your own viewpoint, rather than that of the participants.
To analyze the example in Appendix 1 , we will adopt a phenomenological approach because we want to understand how the participant experienced the illness and we want to try to see the experience from that person’s perspective. It is important for the researcher to reflect upon and articulate his or her starting point for such analysis; for example, in the example, the coder could reflect upon her own experience as a female of a majority ethnocultural group who has lived within middle class and upper middle class settings. This personal history therefore forms the filter through which the data will be examined. This filter does not diminish the quality or significance of the analysis, since every researcher has his or her own filters; however, by explicitly stating and acknowledging what these filters are, the researcher makes it easer for readers to contextualize the work.
Transcribing and Checking
For the purposes of this paper it is assumed that interviews or focus groups have been audio-recorded. As mentioned above, transcribing is an arduous process, even for the most experienced transcribers, but it must be done to convert the spoken word to the written word to facilitate analysis. For anyone new to conducting qualitative research, it is beneficial to transcribe at least one interview and one focus group. It is only by doing this that researchers realize how difficult the task is, and this realization affects their expectations when asking others to transcribe. If the research project has sufficient funding, then a professional transcriber can be hired to do the work. If this is the case, then it is a good idea to sit down with the transcriber, if possible, and talk through the research and what the participants were talking about. This background knowledge for the transcriber is especially important in research in which people are using jargon or medical terms (as in pharmacy practice). Involving your transcriber in this way makes the work both easier and more rewarding, as he or she will feel part of the team. Transcription editing software is also available, but it is expensive. For example, ELAN (more formally known as EUDICO Linguistic Annotator, developed at the Technical University of Berlin) 8 is a tool that can help keep data organized by linking media and data files (particularly valuable if, for example, video-taping of interviews is complemented by transcriptions). It can also be helpful in searching complex data sets. Products such as ELAN do not actually automatically transcribe interviews or complete analyses, and they do require some time and effort to learn; nonetheless, for some research applications, it may be a valuable to consider such software tools.
All audio recordings should be transcribed verbatim, regardless of how intelligible the transcript may be when it is read back. Lines of text should be numbered. Once the transcription is complete, the researcher should read it while listening to the recording and do the following: correct any spelling or other errors; anonymize the transcript so that the participant cannot be identified from anything that is said (e.g., names, places, significant events); insert notations for pauses, laughter, looks of discomfort; insert any punctuation, such as commas and full stops (periods) (see Appendix 1 for examples of inserted punctuation), and include any other contextual information that might have affected the participant (e.g., temperature or comfort of the room).
Dealing with the transcription of a focus group is slightly more difficult, as multiple voices are involved. One way of transcribing such data is to “tag” each voice (e.g., Voice A, Voice B). In addition, the focus group will usually have 2 facilitators, whose respective roles will help in making sense of the data. While one facilitator guides participants through the topic, the other can make notes about context and group dynamics. More information about group dynamics and focus groups can be found in resources listed in the “Further Reading” section.
Reading between the Lines
During the process outlined above, the researcher can begin to get a feel for the participant’s experience of the phenomenon in question and can start to think about things that could be pursued in subsequent interviews or focus groups (if appropriate). In this way, one participant’s narrative informs the next, and the researcher can continue to interview until nothing new is being heard or, as it says in the text books, “saturation is reached”. While continuing with the processes of coding and theming (described in the next 2 sections), it is important to consider not just what the person is saying but also what they are not saying. For example, is a lengthy pause an indication that the participant is finding the subject difficult, or is the person simply deciding what to say? The aim of the whole process from data collection to presentation is to tell the participants’ stories using exemplars from their own narratives, thus grounding the research findings in the participants’ lived experiences.
Smith 9 suggested a qualitative research method known as interpretative phenomenological analysis, which has 2 basic tenets: first, that it is rooted in phenomenology, attempting to understand the meaning that individuals ascribe to their lived experiences, and second, that the researcher must attempt to interpret this meaning in the context of the research. That the researcher has some knowledge and expertise in the subject of the research means that he or she can have considerable scope in interpreting the participant’s experiences. Larkin and others 10 discussed the importance of not just providing a description of what participants say. Rather, interpretative phenomenological analysis is about getting underneath what a person is saying to try to truly understand the world from his or her perspective.
Once all of the research interviews have been transcribed and checked, it is time to begin coding. Field notes compiled during an interview can be a useful complementary source of information to facilitate this process, as the gap in time between an interview, transcribing, and coding can result in memory bias regarding nonverbal or environmental context issues that may affect interpretation of data.
Coding refers to the identification of topics, issues, similarities, and differences that are revealed through the participants’ narratives and interpreted by the researcher. This process enables the researcher to begin to understand the world from each participant’s perspective. Coding can be done by hand on a hard copy of the transcript, by making notes in the margin or by highlighting and naming sections of text. More commonly, researchers use qualitative research software (e.g., NVivo, QSR International Pty Ltd; www.qsrinternational.com/products_nvivo.aspx ) to help manage their transcriptions. It is advised that researchers undertake a formal course in the use of such software or seek supervision from a researcher experienced in these tools.
Returning to Appendix 1 and reading from lines 8–11, a code for this section might be “diagnosis of mental health condition”, but this would just be a description of what the participant is talking about at that point. If we read a little more deeply, we can ask ourselves how the participant might have come to feel that the doctor assumed he or she was aware of the diagnosis or indeed that they had only just been told the diagnosis. There are a number of pauses in the narrative that might suggest the participant is finding it difficult to recall that experience. Later in the text, the participant says “nobody asked me any questions about my life” (line 19). This could be coded simply as “health care professionals’ consultation skills”, but that would not reflect how the participant must have felt never to be asked anything about his or her personal life, about the participant as a human being. At the end of this excerpt, the participant just trails off, recalling that no-one showed any interest, which makes for very moving reading. For practitioners in pharmacy, it might also be pertinent to explore the participant’s experience of akathisia and why this was left untreated for 20 years.
One of the questions that arises about qualitative research relates to the reliability of the interpretation and representation of the participants’ narratives. There are no statistical tests that can be used to check reliability and validity as there are in quantitative research. However, work by Lincoln and Guba 11 suggests that there are other ways to “establish confidence in the ‘truth’ of the findings” (p. 218). They call this confidence “trustworthiness” and suggest that there are 4 criteria of trustworthiness: credibility (confidence in the “truth” of the findings), transferability (showing that the findings have applicability in other contexts), dependability (showing that the findings are consistent and could be repeated), and confirmability (the extent to which the findings of a study are shaped by the respondents and not researcher bias, motivation, or interest).
One way of establishing the “credibility” of the coding is to ask another researcher to code the same transcript and then to discuss any similarities and differences in the 2 resulting sets of codes. This simple act can result in revisions to the codes and can help to clarify and confirm the research findings.
Theming refers to the drawing together of codes from one or more transcripts to present the findings of qualitative research in a coherent and meaningful way. For example, there may be examples across participants’ narratives of the way in which they were treated in hospital, such as “not being listened to” or “lack of interest in personal experiences” (see Appendix 1 ). These may be drawn together as a theme running through the narratives that could be named “the patient’s experience of hospital care”. The importance of going through this process is that at its conclusion, it will be possible to present the data from the interviews using quotations from the individual transcripts to illustrate the source of the researchers’ interpretations. Thus, when the findings are organized for presentation, each theme can become the heading of a section in the report or presentation. Underneath each theme will be the codes, examples from the transcripts, and the researcher’s own interpretation of what the themes mean. Implications for real life (e.g., the treatment of people with chronic mental health problems) should also be given.
DATA SYNTHESIS
In this final section of this paper, we describe some ways of drawing together or “synthesizing” research findings to represent, as faithfully as possible, the meaning that participants ascribe to their life experiences. This synthesis is the aim of the final stage of qualitative research. For most readers, the synthesis of data presented by the researcher is of crucial significance—this is usually where “the story” of the participants can be distilled, summarized, and told in a manner that is both respectful to those participants and meaningful to readers. There are a number of ways in which researchers can synthesize and present their findings, but any conclusions drawn by the researchers must be supported by direct quotations from the participants. In this way, it is made clear to the reader that the themes under discussion have emerged from the participants’ interviews and not the mind of the researcher. The work of Latif and others 12 gives an example of how qualitative research findings might be presented.
Planning and Writing the Report
As has been suggested above, if researchers code and theme their material appropriately, they will naturally find the headings for sections of their report. Qualitative researchers tend to report “findings” rather than “results”, as the latter term typically implies that the data have come from a quantitative source. The final presentation of the research will usually be in the form of a report or a paper and so should follow accepted academic guidelines. In particular, the article should begin with an introduction, including a literature review and rationale for the research. There should be a section on the chosen methodology and a brief discussion about why qualitative methodology was most appropriate for the study question and why one particular methodology (e.g., interpretative phenomenological analysis rather than grounded theory) was selected to guide the research. The method itself should then be described, including ethics approval, choice of participants, mode of recruitment, and method of data collection (e.g., semistructured interviews or focus groups), followed by the research findings, which will be the main body of the report or paper. The findings should be written as if a story is being told; as such, it is not necessary to have a lengthy discussion section at the end. This is because much of the discussion will take place around the participants’ quotes, such that all that is needed to close the report or paper is a summary, limitations of the research, and the implications that the research has for practice. As stated earlier, it is not the intention of qualitative research to allow the findings to be generalized, and therefore this is not, in itself, a limitation.
Planning out the way that findings are to be presented is helpful. It is useful to insert the headings of the sections (the themes) and then make a note of the codes that exemplify the thoughts and feelings of your participants. It is generally advisable to put in the quotations that you want to use for each theme, using each quotation only once. After all this is done, the telling of the story can begin as you give your voice to the experiences of the participants, writing around their quotations. Do not be afraid to draw assumptions from the participants’ narratives, as this is necessary to give an in-depth account of the phenomena in question. Discuss these assumptions, drawing on your participants’ words to support you as you move from one code to another and from one theme to the next. Finally, as appropriate, it is possible to include examples from literature or policy documents that add support for your findings. As an exercise, you may wish to code and theme the sample excerpt in Appendix 1 and tell the participant’s story in your own way. Further reading about “doing” qualitative research can be found at the end of this paper.
CONCLUSIONS
Qualitative research can help researchers to access the thoughts and feelings of research participants, which can enable development of an understanding of the meaning that people ascribe to their experiences. It can be used in pharmacy practice research to explore how patients feel about their health and their treatment. Qualitative research has been used by pharmacists to explore a variety of questions and problems (see the “Further Reading” section for examples). An understanding of these issues can help pharmacists and other health care professionals to tailor health care to match the individual needs of patients and to develop a concordant relationship. Doing qualitative research is not easy and may require a complete rethink of how research is conducted, particularly for researchers who are more familiar with quantitative approaches. There are many ways of conducting qualitative research, and this paper has covered some of the practical issues regarding data collection, analysis, and management. Further reading around the subject will be essential to truly understand this method of accessing peoples’ thoughts and feelings to enable researchers to tell participants’ stories.
Appendix 1. Excerpt from a sample transcript
The participant (age late 50s) had suffered from a chronic mental health illness for 30 years. The participant had become a “revolving door patient,” someone who is frequently in and out of hospital. As the participant talked about past experiences, the researcher asked:
- What was treatment like 30 years ago?
- Umm—well it was pretty much they could do what they wanted with you because I was put into the er, the er kind of system er, I was just on
- endless section threes.
- Really…
- But what I didn’t realize until later was that if you haven’t actually posed a threat to someone or yourself they can’t really do that but I didn’t know
- that. So wh-when I first went into hospital they put me on the forensic ward ’cause they said, “We don’t think you’ll stay here we think you’ll just
- run-run away.” So they put me then onto the acute admissions ward and – er – I can remember one of the first things I recall when I got onto that
- ward was sitting down with a er a Dr XXX. He had a book this thick [gestures] and on each page it was like three questions and he went through
- all these questions and I answered all these questions. So we’re there for I don’t maybe two hours doing all that and he asked me he said “well
- when did somebody tell you then that you have schizophrenia” I said “well nobody’s told me that” so he seemed very surprised but nobody had
- actually [pause] whe-when I first went up there under police escort erm the senior kind of consultants people I’d been to where I was staying and
- ermm so er [pause] I . . . the, I can remember the very first night that I was there and given this injection in this muscle here [gestures] and just
- having dreadful side effects the next day I woke up [pause]
- . . . and I suffered that akathesia I swear to you, every minute of every day for about 20 years.
- Oh how awful.
- And that side of it just makes life impossible so the care on the wards [pause] umm I don’t know it’s kind of, it’s kind of hard to put into words
- [pause]. Because I’m not saying they were sort of like not friendly or interested but then nobody ever seemed to want to talk about your life [pause]
- nobody asked me any questions about my life. The only questions that came into was they asked me if I’d be a volunteer for these student exams
- and things and I said “yeah” so all the questions were like “oh what jobs have you done,” er about your relationships and things and er but
- nobody actually sat down and had a talk and showed some interest in you as a person you were just there basically [pause] um labelled and you
- know there was there was [pause] but umm [pause] yeah . . .
This article is the 10th in the CJHP Research Primer Series, an initiative of the CJHP Editorial Board and the CSHP Research Committee. The planned 2-year series is intended to appeal to relatively inexperienced researchers, with the goal of building research capacity among practising pharmacists. The articles, presenting simple but rigorous guidance to encourage and support novice researchers, are being solicited from authors with appropriate expertise.
Previous articles in this series:
Bond CM. The research jigsaw: how to get started. Can J Hosp Pharm . 2014;67(1):28–30.
Tully MP. Research: articulating questions, generating hypotheses, and choosing study designs. Can J Hosp Pharm . 2014;67(1):31–4.
Loewen P. Ethical issues in pharmacy practice research: an introductory guide. Can J Hosp Pharm. 2014;67(2):133–7.
Tsuyuki RT. Designing pharmacy practice research trials. Can J Hosp Pharm . 2014;67(3):226–9.
Bresee LC. An introduction to developing surveys for pharmacy practice research. Can J Hosp Pharm . 2014;67(4):286–91.
Gamble JM. An introduction to the fundamentals of cohort and case–control studies. Can J Hosp Pharm . 2014;67(5):366–72.
Austin Z, Sutton J. Qualitative research: getting started. C an J Hosp Pharm . 2014;67(6):436–40.
Houle S. An introduction to the fundamentals of randomized controlled trials in pharmacy research. Can J Hosp Pharm . 2014; 68(1):28–32.
Charrois TL. Systematic reviews: What do you need to know to get started? Can J Hosp Pharm . 2014;68(2):144–8.
Competing interests: None declared.
Further Reading
Examples of qualitative research in pharmacy practice.
- Farrell B, Pottie K, Woodend K, Yao V, Dolovich L, Kennie N, et al. Shifts in expectations: evaluating physicians’ perceptions as pharmacists integrated into family practice. J Interprof Care. 2010; 24 (1):80–9. [ PubMed ] [ Google Scholar ]
- Gregory P, Austin Z. Postgraduation employment experiences of new pharmacists in Ontario in 2012–2013. Can Pharm J. 2014; 147 (5):290–9. [ PMC free article ] [ PubMed ] [ Google Scholar ]
- Marks PZ, Jennnings B, Farrell B, Kennie-Kaulbach N, Jorgenson D, Pearson-Sharpe J, et al. “I gained a skill and a change in attitude”: a case study describing how an online continuing professional education course for pharmacists supported achievement of its transfer to practice outcomes. Can J Univ Contin Educ. 2014; 40 (2):1–18. [ Google Scholar ]
- Nair KM, Dolovich L, Brazil K, Raina P. It’s all about relationships: a qualitative study of health researchers’ perspectives on interdisciplinary research. BMC Health Serv Res. 2008; 8 :110. [ PMC free article ] [ PubMed ] [ Google Scholar ]
- Pojskic N, MacKeigan L, Boon H, Austin Z. Initial perceptions of key stakeholders in Ontario regarding independent prescriptive authority for pharmacists. Res Soc Adm Pharm. 2014; 10 (2):341–54. [ PubMed ] [ Google Scholar ]
Qualitative Research in General
- Breakwell GM, Hammond S, Fife-Schaw C. Research methods in psychology. Thousand Oaks (CA): Sage Publications; 1995. [ Google Scholar ]
- Given LM. 100 questions (and answers) about qualitative research. Thousand Oaks (CA): Sage Publications; 2015. [ Google Scholar ]
- Miles B, Huberman AM. Qualitative data analysis. Thousand Oaks (CA): Sage Publications; 2009. [ Google Scholar ]
- Patton M. Qualitative research and evaluation methods. Thousand Oaks (CA): Sage Publications; 2002. [ Google Scholar ]
- Willig C. Introducing qualitative research in psychology. Buckingham (UK): Open University Press; 2001. [ Google Scholar ]
Group Dynamics in Focus Groups
- Farnsworth J, Boon B. Analysing group dynamics within the focus group. Qual Res. 2010; 10 (5):605–24. [ Google Scholar ]
Social Constructivism
- Social constructivism. Berkeley (CA): University of California, Berkeley, Berkeley Graduate Division, Graduate Student Instruction Teaching & Resource Center; [cited 2015 June 4]. Available from: http://gsi.berkeley.edu/gsi-guide-contents/learning-theory-research/social-constructivism/ [ Google Scholar ]
Mixed Methods
- Creswell J. Research design: qualitative, quantitative, and mixed methods approaches. Thousand Oaks (CA): Sage Publications; 2009. [ Google Scholar ]
Collecting Qualitative Data
- Arksey H, Knight P. Interviewing for social scientists: an introductory resource with examples. Thousand Oaks (CA): Sage Publications; 1999. [ Google Scholar ]
- Guest G, Namey EE, Mitchel ML. Collecting qualitative data: a field manual for applied research. Thousand Oaks (CA): Sage Publications; 2013. [ Google Scholar ]
Constructivist Grounded Theory
- Charmaz K. Grounded theory: objectivist and constructivist methods. In: Denzin N, Lincoln Y, editors. Handbook of qualitative research. 2nd ed. Thousand Oaks (CA): Sage Publications; 2000. pp. 509–35. [ Google Scholar ]
Numbers, Facts and Trends Shaping Your World
Read our research on:
Full Topic List
Regions & Countries
Publications
- Our Methods
- Short Reads
- Tools & Resources
Read Our Research On:
Internet & Technology
6 facts about americans and tiktok.
62% of U.S. adults under 30 say they use TikTok, compared with 39% of those ages 30 to 49, 24% of those 50 to 64, and 10% of those 65 and older.
Many Americans think generative AI programs should credit the sources they rely on
Americans’ use of chatgpt is ticking up, but few trust its election information, whatsapp and facebook dominate the social media landscape in middle-income nations, sign up for our internet, science, and tech newsletter.
New findings, delivered monthly
Electric Vehicle Charging Infrastructure in the U.S.
64% of Americans live within 2 miles of a public electric vehicle charging station, and those who live closest to chargers view EVs more positively.
When Online Content Disappears
A quarter of all webpages that existed at one point between 2013 and 2023 are no longer accessible.
A quarter of U.S. teachers say AI tools do more harm than good in K-12 education
High school teachers are more likely than elementary and middle school teachers to hold negative views about AI tools in education.
Teens and Video Games Today
85% of U.S. teens say they play video games. They see both positive and negative sides, from making friends to harassment and sleep loss.
Americans’ Views of Technology Companies
Most Americans are wary of social media’s role in politics and its overall impact on the country, and these concerns are ticking up among Democrats. Still, Republicans stand out on several measures, with a majority believing major technology companies are biased toward liberals.
22% of Americans say they interact with artificial intelligence almost constantly or several times a day. 27% say they do this about once a day or several times a week.
About one-in-five U.S. adults have used ChatGPT to learn something new (17%) or for entertainment (17%).
Across eight countries surveyed in Latin America, Africa and South Asia, a median of 73% of adults say they use WhatsApp and 62% say they use Facebook.
5 facts about Americans and sports
About half of Americans (48%) say they took part in organized, competitive sports in high school or college.
REFINE YOUR SELECTION
Research teams, signature reports.
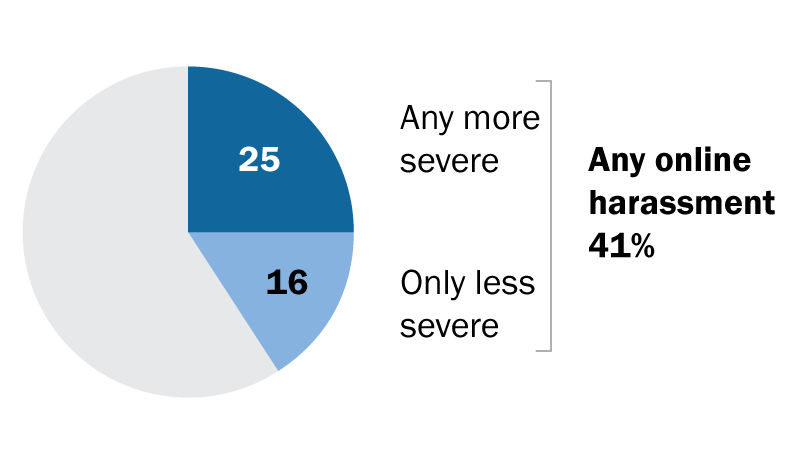
The State of Online Harassment
Roughly four-in-ten Americans have experienced online harassment, with half of this group citing politics as the reason they think they were targeted. Growing shares face more severe online abuse such as sexual harassment or stalking
Parenting Children in the Age of Screens
Two-thirds of parents in the U.S. say parenting is harder today than it was 20 years ago, with many citing technologies – like social media or smartphones – as a reason.
Dating and Relationships in the Digital Age
From distractions to jealousy, how Americans navigate cellphones and social media in their romantic relationships.
Americans and Privacy: Concerned, Confused and Feeling Lack of Control Over Their Personal Information
Majorities of U.S. adults believe their personal data is less secure now, that data collection poses more risks than benefits, and that it is not possible to go through daily life without being tracked.
Americans and ‘Cancel Culture’: Where Some See Calls for Accountability, Others See Censorship, Punishment
Social media fact sheet, digital knowledge quiz, video: how do americans define online harassment.
1615 L St. NW, Suite 800 Washington, DC 20036 USA (+1) 202-419-4300 | Main (+1) 202-857-8562 | Fax (+1) 202-419-4372 | Media Inquiries
Research Topics
- Email Newsletters
ABOUT PEW RESEARCH CENTER Pew Research Center is a nonpartisan fact tank that informs the public about the issues, attitudes and trends shaping the world. It conducts public opinion polling, demographic research, media content analysis and other empirical social science research. Pew Research Center does not take policy positions. It is a subsidiary of The Pew Charitable Trusts .
© 2024 Pew Research Center
IMAGES
VIDEO
COMMENTS
Data analysis is important in research because it makes studying data a lot simpler and more accurate. It helps the researchers straightforwardly interpret the data so that researchers don't leave anything out that could help them derive insights from it. Data analysis is a way to study and analyze huge amounts of data.
data analysis, the process of systematically collecting, cleaning, transforming, describing, modeling, and interpreting data, generally employing statistical techniques. Data analysis is an important part of both scientific research and business, where demand has grown in recent years for data-driven decision making.Data analysis techniques are used to gain useful insights from datasets, which ...
Definition of research in data analysis: According to LeCompte and Schensul, research data analysis is a process used by researchers to reduce data to a story and interpret it to derive insights. The data analysis process helps reduce a large chunk of data into smaller fragments, which makes sense. Three essential things occur during the data ...
Introduction. Statistical analysis is necessary for any research project seeking to make quantitative conclusions. The following is a primer for research-based statistical analysis. It is intended to be a high-level overview of appropriate statistical testing, while not diving too deep into any specific methodology.
For many researchers unfamiliar with qualitative research, determining how to conduct qualitative analyses is often quite challenging. Part of this challenge is due to the seemingly limitless approaches that a qualitative researcher might leverage, as well as simply learning to think like a qualitative researcher when analyzing data. From framework analysis (Ritchie & Spencer, 1994) to content ...
This article is a practical guide to conducting data analysis in general literature reviews. The general literature review is a synthesis and analysis of published research on a relevant clinical issue, and is a common format for academic theses at the bachelor's and master's levels in nursing, physiotherapy, occupational therapy, public health and other related fields.
Written by Coursera Staff • Updated on Nov 29, 2023. Data analysis is the practice of working with data to glean useful information, which can then be used to make informed decisions. "It is a capital mistake to theorise before one has data. Insensibly one begins to twist facts to suit theories, instead of theories to suit facts," Sherlock ...
Abstract. Quantitative data analysis serves as part of an essential process of evidence-making in health and social sciences. It is adopted for any types of research question and design whether it is descriptive, explanatory, or causal. However, compared with qualitative counterpart, quantitative data analysis has less flexibility.
Data analysis can be quantitative, qualitative, or mixed methods. Quantitative research typically involves numbers and "close-ended questions and responses" (Creswell & Creswell, 2018, p. 3).Quantitative research tests variables against objective theories, usually measured and collected on instruments and analyzed using statistical procedures (Creswell & Creswell, 2018, p. 4).
Data validation is a streamlined process that ensures the quality and accuracy of collected data. Inaccurate data may keep a researcher from uncovering important discoveries or lead to spurious results. At times, the amount of data collected might help unravel existing patterns that are important. The data validation process can also provide a ...
The first step in a data analysis plan is to describe the data collected in the study. This can be done using figures to give a visual presentation of the data and statistics to generate numeric descriptions of the data. Selection of an appropriate figure to represent a particular set of data depends on the measurement level of the variable.
Data analysis in research is the process of uncovering insights from data sets. Data analysts can use their knowledge of statistical techniques, research theories and methods, and research practices to analyze data. They take data and uncover what it's trying to tell us, whether that's through charts, graphs, or other visual representations.
A method of data analysis that is the umbrella term for engineering metrics and insights for additional value, direction, and context. By using exploratory statistical evaluation, data mining aims to identify dependencies, relations, patterns, and trends to generate advanced knowledge.
What Is the Importance of Data Analysis in Research? Uncovering Patterns and Trends: Data analysis allows researchers to identify patterns, trends, and relationships within the data. By examining these patterns, researchers can better understand the phenomena under investigation. For example, in epidemiological research, data analysis can ...
Abstract. Statistical methods involved in carrying out a study include planning, designing, collecting data, analysing, drawing meaningful interpretation and reporting of the research findings. The statistical analysis gives meaning to the meaningless numbers, thereby breathing life into a lifeless data. The results and inferences are precise ...
By harnessing the power of data analysis, researchers can unlock valuable insights, drive innovation, and make informed decisions that positively impact their research outcomes. Data Analysis Techniques. In the realm of research, data analysis plays a crucial role in extracting meaningful insights and drawing conclusions from collected data.
Research is a scientific field which helps to generate new knowledge and solve the existing problem. So, data analysis is the crucial part of research which makes the result of the study more ...
Written by Coursera Staff • Updated on Apr 19, 2024. Data analysis is the practice of working with data to glean useful information, which can then be used to make informed decisions. "It is a capital mistake to theorize before one has data. Insensibly one begins to twist facts to suit theories, instead of theories to suit facts," Sherlock ...
Unquestionably, data analysis is the most complex and mysterious of all of the phases of a qualitative project, and the one that receives the least thoughtful discussion in the literature. For neophyte nurse researchers, many of the data collection strategies involved in a qualitative project may feel familiar and comfortable. After all, nurses have always based their clinical practice on ...
They'll break down data silos. They'll invest in and leverage advanced analytics to combine new, innovative sources of data with their own insights. They'll pivot on a dime and create new ...
Common data analyst duties: Data collection: Data analysts often develop and manage databases, collecting raw data from various internal and external sources. Data cleaning and transformation: The gathered data is often plagued with errors and redundancies. Data analysts clean and transform it into a reliable format for analysis.
The thesis covers two fundamental topics that are important across the disciplines of operations research, statistics and even more broadly, namely stochastic optimization and uncertainty quantification, with the common theme to address both statistical accuracy and computational constraints. Here, statistical accuracy encompasses the precision of estimated solutions in stochastic optimization ...
Dario Gil, IBM senior vice president and director of research, wants you to think about artificial intelligence differently. While large language models like ChatGPT and their ability to converse may get much of the attention, Gil says the real value of AI is in the unprecedented amount of data that it can analyze and what we as humans then do with that analysis.
Data pre-processing and exploration: Exploratory data analysis is defined in data science as an approach to analyzing datasets to summarize their key characteristics, often with visual methods . This examines a broad data collection to discover initial trends, attributes, points of interest, etc. in an unstructured manner to construct ...
Objective rules based ESG ratings, with an average 45% of data, 5 coming from alternative data sources, utilizing AI tech to extract and verify unstructured data. First ESG ratings provider to measure and embed companies' ESG risk exposure 4. MSCI ESG Research LLC. is a Registered Investment Adviser under the Investment Adviser Act of 1940.
The near real-time data comes from the agency's TEMPO (Tropospheric Emissions: Monitoring of Pollution) instrument, which launched last year to improve life on Earth by revolutionizing the way scientists observe air quality from space. This new data is available from the Atmospheric Science Data Center at NASA's Langley Research Center in ...
Like all other species, fungi are susceptible to infection by viruses. The diversity of fungal viruses has been rapidly expanding in recent years due to the availability of advanced sequencing technologies. However, compared to other virome studies, the research on fungi-associated viruses remains limited. In this study, we downloaded and analyzed over 200 public datasets from approximately 40 ...
The Hurricane Research Division improves forecasts and helps NOAA create a weather-ready nation by collecting observations, assimilating data, and streamlining modeling and prediction sciences. Observations we collect during our annual Hurricane Field Program are used by forecast offices around the globe to better understand how to characterize ...
DATA ANALYSIS AND MANAGEMENT. If, as suggested earlier, doing qualitative research is about putting oneself in another person's shoes and seeing the world from that person's perspective, the most important part of data analysis and management is to be true to the participants.
Americans' Views of Technology Companies. Most Americans are wary of social media's role in politics and its overall impact on the country, and these concerns are ticking up among Democrats. Still, Republicans stand out on several measures, with a majority believing major technology companies are biased toward liberals. short readsApr 3, 2024.