Oasis Theory Links Climate Change and the Invention of Agriculture
Desiccation at the End of the Pleistocene Could Be the Catalyst
- Ancient Civilizations
- Excavations
- History of Animal and Plant Domestication
- M.A., Anthropology, University of Iowa
- B.Ed., Illinois State University
The Oasis Theory (known variously as the Propinquity Theory or Desiccation Theory) is a core concept in archaeology, referring to one of the main hypotheses about the origins of agriculture: that people started to domesticate plants and animals because they were forced to, because of climate change .
The fact that people changed from hunting and gathering to farming as a subsistence method has never seemed like a logical choice. To archaeologists and anthropologists, hunting and gathering in a universe of limited population and plentiful resources is less demanding work than plowing, and certainly more flexible. Agriculture requires cooperation, and living in settlements reaps social impacts, like diseases, ranking, social inequality , and division of labor.
Most European and American social scientists in the first half of the 20th century simply didn't believe that human beings were naturally inventive or inclined to change their ways of life unless compelled to do so. Nevertheless, at the end of the last Ice Age , people did reinvent their method of living.

What Do Oases Have to Do With the Origins of Agriculture?
The Oasis Theory was defined by Australian-born archaeologist Vere Gordon Childe [1892-1957], in his 1928 book, The Most Ancient Near East . Childe was writing decades before the invention of radiocarbon dating and a half-century before the serious collection of the vast amount of climatic information that we have today had begun. He argued that at the end of the Pleistocene, North Africa and the Near East experienced a period of desiccation, a period of an increased occurrence of drought, with higher temperatures and decreased precipitation. That aridity, he argued, drove both people and animals to congregate at oases and river valleys; that propinquity created both population growth and a closer familiarity with plants and animals. Communities developed and were pushed out of the fertile zones, living on the edges of the oases where they were forced to learn how to raise crops and animals in places that were not ideal.
Childe was not the first scholar to suggest that cultural change can be driven by environmental change--that was American geologist Raphael Pumpelly [1837-1923] who suggested in 1905 that central Asian cities collapsed because of desiccation. But during the first half of the 20th century, the available evidence suggested that farming appeared first on the dry plains of Mesopotamia with the Sumerians, and the most popular theory for that adoption was environmental change.
Modifying the Oasis Theory
Generations of scholars beginning in the 1950s with Robert Braidwood , in the 1960s with Lewis Binford , and in the 1980s with Ofer Bar-Yosef , built, dismantled, rebuilt, and refined the environmental hypothesis. And along the way, dating technologies and the ability to identify evidence and timing of past climate change blossomed. Since then, oxygen-isotope variations have allowed scholars to develop detailed reconstructions of the environmental past, and a vastly improved picture of past climate change has been developed.
Maher, Banning, and Chazen recently compiled comparative data on radiocarbon dates on cultural developments in the Near East and radiocarbon dates on climatic events during that period. They noted there is substantial and growing evidence that the transition from hunting and gathering to agriculture was a very long and variable process, lasting thousands of years in some places and with some crops. Further, the physical effects of climate change also were and are variable across the region: some regions were severely impacted, others less so.
Maher and colleagues concluded that climate change alone cannot have been the sole trigger for specific shifts in technological and cultural change. They add that that doesn't disqualify climatic instability as providing the context for the long transition from mobile hunter-gatherer to sedentary agricultural societies in the Near East, but rather that the process was simply far more complex than the Oasis theory can sustain.
Childe's Theories
To be fair, though, throughout his career, Childe didn't simply attribute cultural change to environmental change: he said that you had to include significant elements of social change as drivers as well. Archaeologist Bruce Trigger put it this way, restating Ruth Tringham's comprehensive review of a handful of Childe biographies: "Childe viewed every society as containing within itself both progressive and conservative tendencies which are linked by dynamic unity as well as by persistent antagonism. The latter provides the energy that in the long run brings about irreversible social change. Hence every society contains within itself the seeds for the destruction of its present state and the creation of a new social order."
- Braidwood RJ. 1957. Jericho and its Setting in Near Eastern History . Antiquity 31(122):73-81.
- Braidwood RJ, Çambel H, Lawrence B, Redman CL, and Stewart RB. 1974. Beginnings of Village-Farming Communities in Southeastern Turkey--1972. Proceedings of the National Academy of Sciences 71(2):568-572.
- Childe VG. 1969. New Light on the Most Ancient East . London: Norton & Company.
- Childe VG. 1928. The Most Ancient Near East . London: Norton & Company.
- Maher LA, Banning EB, and Chazan M. 2011. Oasis or Mirage? Assessing the Role of Abrupt Climate Change in the Prehistory of the Southern Levant . Cambridge Archaeological Journal 21(01):1-30.
- Trigger BG. 1984. Childe and Soviet Archaeology. Australian Archaeology 18:1-16.
- Tringham R. 1983. V. Gordon Childe 25 Years After: His Relevance for the Archaeology of the Eighties. Journal of Field Archaeology 10(1):85-100.
- Verhoeven M. 2011. The Birth of a Concept and the Origins of the Neolithic: A History of Prehistoric Farmers in the Near East. Paléorient oasis37(1):75-87.
- Weisdorf JL. 2005. From Foraging To Farming: Explaining The Neolithic Revolution. Journal of Economic Surveys 19(4):561-586.
- Wright HE. 1970. Environmental Changes and the Origin of Agriculture in the near East. BioScience 20(4):210-217.
- Broad Spectrum Revolution
- A Beginner's Guide to the Neolithic Period
- Climate Change and the Origins of Agriculture
- Hilly Flanks
- The Culture-Historical Approach: Social Evolution and Archaeology
- The Eight Founder Crops and the Origins of Agriculture
- Sedentism, Community-Building, Began 12,000 Years Ago
- Pre-Pottery Neolithic: Farming and Feasting Before Pottery
- Adze: Part of an Ancient Woodworking Toolkit
- Kuk Swamp: Early Agriculture in Papua New Guinea
- All About the Fish Weir
- What Is an Agrarian Society?
- Yuchanyan and Xianrendong Caves - Oldest Pottery in the World
- Mesolithic Period, Hunter-Gatherer-Fishers in Europe
- An Introduction to Sumer in Ancient History
- Funnel Beaker Culture: First Farmers of Scandinavia
How to Conduct Research on Your Farm or Ranch
The process.
or call (301) 779-1007 to order.

Following these 10 steps will help you develop a successful on-farm research project.
- Identify your research question and objective.
- Develop a research hypothesis.
- Decide what you will measure and what data you will collect.
- Develop an experimental design.
- Choose the location and map out your field plots.
- Implement the project.
- Make observations and keep records throughout the season.
- Collect research data.
- Analyze the data.
- Interpret the data and draw conclusions.
Each of these steps is expanded on below, providing an overview of the entire on-farm research process from initial planning to implementation to drawing final conclusions. Keep in mind that the focus here is on crop-based research, but the same process applies in livestock- or pasture-based systems.
TABLE 1: From Research Question to Research Hypothesis
STEP 1: Identify your research question and objective. Identifying your research question involves moving from the general to the specific—from ideas or hunches to a clear objective—and selecting just one yes-or-no question to answer. In developing your question, consider your own capabilities and if the information needed to answer the question is actually measurable. The question will usually ask whether a new approach is an improvement over the current one or if it will help you meet some goal or objective. Here are some sample research questions:
- Can a legume cover crop substitute for my standard commercial nitrogen fertilizer application?
- Will a new tomato variety produce a higher yield than the standard tomato variety that I usually plant?
- Can I eliminate a particular pesticide application, replace it with a more environmentally sound approach, and increase my bottom line per acre?
- Will changing my tillage practices change the amount of irrigation I need? Or, if I switch to a no-till or reduced-tillage system, will my yields be reduced?
You can think of the research question as a comparison between two or more practices. The examples above compare: a cover crop versus commercial fertilizer; the performance of one variety versus another; a pesticide versus an alternative pest control practice; and a current tillage practice versus a reduced-tillage practice. The practices compared in the research project are called treatments. To further clarify your intent, you may also want to re-write the research question as an objective. Using the legume-cover crop example above, an objective based on that question might look like this: My objective is to determine if a legume cover crop will supply enough nitrogen to meet the needs of my subsequent cash crop.
If you are having trouble articulating your research question or objective, talk to other farmers or an agricultural advisor to help clarify your thinking. Again, keep it simple: The simpler the research question, the simpler the project will be to conduct.
STEP 2: Develop a research hypothesis. Your research hypothesis stems directly from the research question or objective. A hypothesis is simply a clear statement of what you expect the outcome of your experiment to be, based on the limited evidence you have at hand. A well-written hypothesis statement can be confirmed (or denied) with actual data. In fact, the hypothesis gives an indication of what will actually be measured in the experiment. A well-developed hypothesis will help you obtain the most useful and practical information for the time and resources you invest in your research project. Possible hypothesis statements for the research questions outlined above are summarized in Table 1.
STEP 3: Decide what you will measure and what data you will collect. The next step in planning your on-farm research project is to determine the data you will be collecting. Your research hypothesis should give you a general idea, but now is the time to be specific: What will you measure and record in order to answer your question and test the validity of your hypothesis? This is also the time to decide what techniques you will use to get your data, looking at factors such as cost, practicality and feasibility.
In many crop research projects you will be collecting yield data, but depending on your project, you might also be collecting data on soil nutrient levels, crop development, plant health, plant height, leaf number, chlorophyll content, pest numbers, yield quality parameters (e.g., protein, Brix levels, fruit size, insect damage, moisture, etc.), costs or anything else you want to know about. The key determinant in deciding what to measure is whether the information will be useful in answering your research question.
Say, for example, you are looking at whether a higher planting density reduces weed competition in the field. Once you have your treatments defined (i.e., narrower row spacing and/or more plants within the row), you will need to decide what you will measure as an indicator of weed competition. Some possible options include percent weed cover at specific time intervals during the growing season, or the weight of weed biomass. You might also measure the effect of higher planting density on both weed density and final crop yield. Remember that each variable you decide to measure will come with its own time commitment in data collection and analysis, and may incur costs.
Drawing Conclusions
Be careful about drawing too many conclusions from your data, particularly about the relationship between various effects that you observe. For example, if you planted a cover crop and found that it provided both improved weed control and higher yield, you cannot conclude that the higher yield was caused by the reduction in weeds. Like many practices, a cover crop will cause many changes that can influence yield, ones that you may not be measuring in your research.
STEP 4: Develop an experimental design. It is tempting to rush through the previous steps and start planning what the experiment will look like in the field. But the task of designing your experiment should flow from the previous steps. Experimental design includes arranging treatments in the field so that error and bias are reduced, and data can be accurately analyzed using statistics. Experimental design and statistical analysis (step 9) go hand in hand: If an experiment has a poor design, you cannot have confidence in the data. For example, see the profile of farmer Steve Groff , who studied grafting to control disease in high tunnel tomatoes. In the first year, a mistake was made in the experimental design that prevented him from addressing some of his research questions, and the mistake was corrected for the second year.
There are several standard experimental design layouts used in on-farm research. Which one you choose will be based primarily on the number of treatments you are investigating. You can explore experimental design concepts and techniques in more detail in the next section, Basics of Experimental Design . If possible, plan your experiment for at least two growing seasons to increase the reliability of your results.
STEP 5: Choose the location and map out your field plots. After you have figured out your experimental design, you are ready to choose a location and design your field setup. You should be specific about plot size and layout, how the crop will be planted, which treatments are to be applied in each plot, and any other important aspects of managing the plots. Some guiding principles to help site your project:
- Select a field that has the right characteristics for what you are testing. Look at the field history and make sure there are no major problems that might prevent you from establishing the plots, or that could negate your results.
- Research plots should be accessible and easy to maintain. To facilitate management, for example, you may want to set up plots that run the length of the field and are wide enough for one or two tractor passes. It should be located close to the home farm so you can make observations regularly.
- Each treatment plot should be large enough to collect the data you need. If you can, separate your treatments with buffers to reduce cross-contamination.
- To moderate the effect of external variation, choose an area that is as uniform as possible in terms of soil characteristics, management history or slope, to name a few important types of variation.
- If there is some variation in the field that cannot be avoided, such as slope, drainage or soil type, try to set up your plots so that they are as uniform as possible with respect to field conditions. Since it is not always possible to achieve this, you can use blocking, replication and randomization to separate out the effect of field variability from the actual treatment effects. More information on these techniques is provided in the next section, Basics of Experimental Design .
- Keep in mind that land adjacent to the research plots can also have an impact on your research due to runoff, pesticide drift or by harboring pests that migrate into the research plots. This is potentially another source of external variation. To control these effects, establish a border or buffer zone around the entire research project. Ideally, a buffer should be a minimum of one tractor pass on all sides, or larger if conditions permit. Your technical advisor can help you determine what is most appropriate for your particular project.
- Last, create a detailed plot map for your chosen location based on your research design.
See Figures 3 and 4 for examples of plot maps that incorporate these principles.
STEP 6: Implement the project. Now that you are ready to implement the project, begin by establishing the research plots based on the map you created. Measure and mark your plots with clearly visible stakes or flags. In order to prevent mishaps with the project, make sure you discuss plot design, location, timeframe (one year or multiyear) and implementation with your entire farm crew, and share the detailed plot map with everyone involved.
Throughout the experiment, be careful to manage all plots exactly the same , except for the treatments (the practices you are testing or comparing.) For example, if your experiment is a comparison of two different varieties of tomatoes, plant all the plots on the same day using exactly the same planting technique, make the same number of passes with the tractor on all plots, cultivate all the plots in the same way and use the same pest control techniques in all plots. Follow this same principle when you set up your treatments. If you are comparing fertilizer treatments, for example, set the equipment for the first application rate and fertilize all the plots that are to receive that rate at the same time. Then change the setting for your second application rate and do all the plots assigned to receive that rate, and so on. The goal is to standardize as much as possible the techniques by which all field work is done. If possible, have the same group of people involved throughout the project so that there is consistency in how the plots are managed.
Most importantly, plan ahead and communicate . Before you start any field work, create a management plan and calendar for the project. Be specific about how the plots and the crop will be managed, how and when treatments are to be applied, and what data will be collected and how. Then make sure you review this plan with everyone who will be involved in the project. Good planning and communication can help ensure that the project is implemented correctly, that the work is done on time, and that you have the equipment and labor available when you need it.
STEP 7: Make observations and keep records throughout the season. Separate from your actual data collection (step 8), make observations and take notes throughout the season on influential factors such as rainfall, temperature, other weather events, seedling emergence, crop growth, soil condition, pest problems, field operations or anything else that seems relevant. Keeping a designated notebook, file or spreadsheet with this information will help you interpret your data and put your research results in context. In some cases, your observations will apply to the entire experiment: “Plants in all plots appear to be suffering from the extended dry period.” In others, you may want to record observations about specific plots or treatments: “Plants in treatment A appear taller than treatment B.” If you notice such differences between treatments, you may decide to measure those differences, even if you did not plan to do so originally.
STEP 8: Collect research data. For successful data collection:
- Be highly organized and specify your data collection techniques ahead of time.
- Prepare your data record sheets beforehand and have all your copies ready to fill out.
- If you are collecting samples, have all your bags or containers labeled accurately and organized by treatment and plot to facilitate the process.
- Remember to keep all treatments and plots separate! Do not lump data together thinking that you will be able to just take an average. Doing so will invalidate your data.
- If you are measuring yield, try to harvest from the center of the plots for your research data and, again, keep each treatment and plot separate. You will eventually harvest the whole area, but do not include buffer rows in your data.
- If you are measuring other effects (e.g., soil characteristics, weed cover, disease or insect damage, etc.), use random sampling procedures.
- Allow adequate time for sampling. For instance, expect plant sampling in 12 experimental units to take at least four hours; collecting soil samples will likely take longer.
STEP 9: Analyze data. Statistics are the most common tool used to determine if any differences observed in the treatments or comparisons are truly a result of the change in practice or merely a result of chance, due to natural variation. The statistical techniques that you will use to analyze your data depend on the research design you have used. You can learn to do your own data analysis, either by hand or with a statistical software program. In most situations, you will also want to consult with your technical advisor or Cooperative Extension personnel for guidance and assistance with your data analysis. The most common designs and statistical tests for on-farm research are discussed in more detail in the Experimental Design and Statistical Analysis sections.
STEP 10: Interpret the data and draw conclusions. Now that you have analyzed the data from your on-farm research, what do the results tell you? What can you infer from the data, and how can you apply that information to your farm? The statistical analysis you use will indicate whether or not there is a real or “significant” difference in the treatments, practices or varieties you are comparing. If there is a difference, and you feel confident about the results, you may decide to begin making changes in your farming practices.
But before you proceed, first discuss your results with your management team, other farmers or Cooperative Extension staff; it is always good to get a second opinion. Even then, you may still want to repeat the study for a second or third year to confirm the results and enhance the reliability of the data. If you are not sure of the results, or if the data seems off base, then you will need to dig deeper to determine what might explain the findings. Refer back to the observations and notes you made throughout the season (step 7). Was there some kind of environmental effect you did not anticipate? Did rainfall or temperature patterns over the course of the experiment influence the outcome? Was there a problem with how the plots were managed or in how the treatments were applied? Again, discuss your thinking with others before you decide how to proceed. Most important in this final stage of your project is to be objective and to be careful about making major changes in your management until you have accurate and reliable information.
Hold a Field Day to Share Your Results
Whatever questions prompted you to engage in on-farm research, it is likely that other farmers and ranchers in your community will have the same questions. Sharing your research results, particularly if they have the potential to improve your operation’s sustainability, may inspire others to make similar changes and try new practices, which allows you to provide an important service to your community. Field days, including hands-on activities and demonstrations, are among producers’ most preferred ways of learning new methods and practices.
If you find that organizing a field day is time consuming, check out SARE’s Farmer Field Day Toolkit , a comprehensive online resource with tips and tools to help you organize a successful field day. Resources include a planning checklist, schedule of tasks, field sign templates, a sample press release and more.
- Reference Manager
- Simple TEXT file
People also looked at
Original research article, agricultural drought and its potential impacts: enabling decision-support for food security in vulnerable regions.

- 1 Centre for Environmental Management, University of the Free State, Bloemfontein, South Africa
- 2 Department of Geography and Environmental Science, University of Fort Hare, Alice, South Africa
Increasing demand for food and environmental stressors are some of the most challenging problems that human societies face today and these have encouraged new studies to examine drought impacts on food production. Seeking to discuss these important issues in the South African context, this study analyzed the impacts of drought on food security in one of the country's largest commercial agricultural land (Free State Province). Earth observation and crop data were acquired from Application for Extracting and Exploring Analysis Ready Samples (AppEEARS) and GrainSA databases, respectively for years 2011/2012–2020/2021 over Free State Province. Two crops namely, maize and sorghum were obtained from the database and analyzed accordingly to quantify drought impacts on the two crops. The result reveals that the years 2015 and 2018 were affected by extreme drought events (<10%) where the majority of the study area was impacted. Years 2011, 2016, 2018, and 2019 were severely affected by drought (>30%) and impacted the agricultural sector in the study area. Findings further revealed that maize production observed the lowest recorded in the year 2014 and 2015 with about 223,600 and 119,050 tons, respectively. More so, results further showed that sorghum production recorded the lowest production in years 2019, 2016, and 2015 with about 23,600, 24,640, and 24,150 tons, in that order during the period of study. The results confirm the impacts of drought on maize and sorghum productions in the year 2015 and other years that recorded the lowest productions during drought years. This development might have impacted food security in the study area, and this outcome will enable decision-making bodies on food security to enhance improved strategy in vulnerable areas.
Introduction
Drought's key characteristics, such as their inherently wide spatial and temporal extent, the large number of people impacted, or the massive economic loss, have caused logistic and financial challenges all over the world ( Berhan et al., 2013 ; Enenkel et al., 2015 ). Droughts and associated food shortages are high on humanitarian relief groups' priority lists, and the bulk of online disaster platforms focus on disaster that strikes quickly (for instance, floods, hurricanes, earthquakes, or other storms) and little to no attention focus on drought and its occurrences. The difficulty of operational drought forecasting systems to produce valid predictions about the location, magnitude, and type of assistance needed in the medium to long term, i.e., several months ahead of time, is a serious flaw ( Khadr, 2016 ; Hao et al., 2018 ; Kreibich et al., 2019 ). Even in cases where predictions were made, such as warnings of severe drought conditions in Sub-Saharan Africa ( Ahmed, 2020 ; Fava and Vrieling, 2021 ), there is still a lack of response on the ground ( Enenkel et al., 2015 ). Furthermore, large-scale drought predictions have failed in industrialized countries such as the United States ( Schiermeier, 2013 ; Anderson et al., 2018 ; Daigh et al., 2018 ). This is exacerbated by the fact that there is no universally agreed definition of drought ( Enenkel et al., 2015 ), and climate change impacts on global drought patterns ( Enenkel et al., 2015 ; Salami et al., 2021 ), as well as global food security ( Dhankher and Foyer, 2018 ; Purakayastha et al., 2019 ). Simultaneously, teleconnections must be considered, such as the impact of anomalies in sea surface temperatures on drought episodes in Sub-Saharan Africa, which have influenced the complexity of already sophisticated models and evaluations. Furthermore, because different types of drought, such as meteorological, agricultural, and hydrological, have varied socio-economic consequences, a single physically measurable drought parameter for all of these scenarios is not attainable ( Orimoloye et al., 2019 ; Ekundayo et al., 2020 , 2021 ).
In recent decades, significant progress has been made in sustaining global food production. Nonetheless, feeding 9.8 billion people by 2050 would be a challenge, particularly in drought-prone and arid regions of the developing world ( He et al., 2019 ). Droughts, for example, are a regular occurrence in Sub-Saharan Africa, particularly South Africa ( Orimoloye et al., 2021a , b ), and can be exacerbated by other variables (such as heat waves, floods, and violence; Ropo et al., 2017 ). Food production shocks (i.e., unexpected losses and increases in price) have been more common in all sectors including food industries during the last five decades ( Cottrell et al., 2019 ; He et al., 2019 ). Extreme weather causes half of these shocks ( Cottrell et al., 2019 ), with disproportionate effects on countries with little coping capability, such as farmers' ability to diversify food production or governments' ability to import food or provide insurance. The 2017 Kenya drought, for example, prompted a national emergency and left about 2.5 million people hungry ( Gichure, 2017 ; He et al., 2019 ). The impact of increased drought risk due to climate change ( Naumann et al., 2018 ; He et al., 2019 ) can be mitigated through more effective adaptation methods, measures and innovative research, which will aid progress toward achieving the second United Nations Sustainable Development Goal (SDG; i.e., zero hunger). If multiple interrelated SDG goals are to be achieved at the same time (e.g., SDG2 to ensure food security, SDG6 to ensure water security, and SDG13 to foster resilience), synchronous challenges emerge, as they interact across a range of spatial and temporal scales, resulting in diverse trade-offs, synergies, and even competing policy responses with scale-dependent impacts ( Obersteiner et al., 2016 ; Gao and Bryan, 2017 ). Understanding the interactions between drought and food security is critical for policymakers and stakeholders to develop adaptation policies that effectively reduce the effects of drought on agricultural production and increase societal resilience to future drought-induced emergencies, all while meeting competing demands and enhancing environmental sustainability.
Recently, South Africa observed drought events that affected various sectors including agriculture and water resources. The National Disaster Management Center has declared a drought disaster due to the persistent drought conditions in the South African provinces including Free State Province and national resources are being mobilized to assist affected individuals including farmers ( Tembile, 2021 ). South Africa is facing severe pressure with respect to water security due to an increased water demand with increasing population, poor planning and management of water resources, limited investment into water reservoir infrastructure, and recurring droughts over the past decade. Droughts are common in South Africa, however, in recent years there has been a trend toward more multi-year droughts. Summer rainfall time series for several portions of South Africa, particularly the Eastern Cape and neighboring KwaZulu Natal Province, show greater multi-year droughts from the late 1970's to the late 1970's than from 1950 to the late 1970's ( Blamey et al., 2018 ). After a prolonged drought from 2015 to 2018, the Western Cape Province was named a disaster region in February 2018 ( Pienaar and Boonzaaier, 2018 ; Orimoloye et al., 2019 ; Mahlalela et al., 2020 ). Drought disaster zones were proclaimed in the Eastern Cape and Free State provinces in 2019, following severe water shortages in several urban and rural areas ( Mahlalela et al., 2020 ; Orimoloye et al., 2021a ).
Assessing agricultural drought and its potential impacts on food security in vulnerable regions is very crucial especially in drought-prone areas. The implications of agricultural droughts on food supplies may be quantified, which helps policymakers make more sustainable agricultural decisions. It necessitates a thorough evaluation of the relationships between spatiotemporal drought fluctuations, farming systems, irrigation effects, and water resource availability. Various techniques of dealing with such issues have been reported. Survey methodology, for example, is useful for gathering first-hand information on how the drought has affected crop production and how farmers have reacted to drought ( Campbell et al., 2011 ; Savari et al., 2021 ). In this paper, I, therefore, concentrate on agricultural drought impacts on food production in Free State Province South Africa. Findings from this study will enable decision support for food security in the affected areas. Despite the challenges associated with climate hazards such as drought disasters, recent technological, and methodological developments are helping to rapidly improve agricultural outputs ( Balogun et al., 2020 ; Dyosi et al., 2021 ). The emergence of space-based information is providing valuable outcomes at the high spatial and temporal resolutions with accurate maps, this can help smallholder-dominated farmers to plan for future drought events. Findings from this study can help in building greater resilience to drought and mitigate its scourges on agricultural sectors, societies, and economies.
Data and Methods
As presented in Figure 1 , the study took place in the Free State Province of South Africa. The Republic of South Africa is divided into nine provinces, one of which is the Free State. Bloemfontein is South Africa's judicial capital and the province's largest city. In the study area, there are a few additional notable towns, predominantly mining, and agricultural communities. The province is located between 26.6 ° S and 30.7 ° S latitudes, and 24.3 ° E and 29.8 ° E Greenwich meridian lengths. The climate of the province is mostly semi-arid, according to the Köppen climatic classification. The geography of the province is complex, with all surfaces above 1,000 m reaching 1,800 m in the north-eastern and eastern Free State. The province is divided into five municipal districts for administrative purposes (Fezile Dabi, Lejweleputswa, Motheo, Thabo Mofutsanyane and Xhariep). However, in November, December, and January, the region enjoys monthly mean sunlight hours of around 319.5, 296.5, and 296.3 h, respectively, with annual sunshine hours and total precipitation of ~3,312.3 and 559 mm, respectively. The region receives the least amount of rain (0 mm) in July and the most amount of rain (70 mm) in January, which correspond to the winter and summer seasons, respectively ( Orimoloye et al., 2021b ). In June, daily mean temperatures vary from 17 to 29°C. In January, daily mean temperatures range from 17 to 29°C. During the months of June and July, the coldest temperatures occur at night. The vegetation dominant in the area is grassland. A better understanding of the spatiotemporal evaluation of drought events will help to identify drought-affected areas and its potential impacts on food security in the Free State Province.

Figure 1 . Map of the study area.
The Terra product from the Moderate Resolution Imaging Spectroradiometer (MODIS) was used to determine the occurrence of drought in the study area. Temperature and precipitation were acquired from NASA's Prediction of Worldwide Energy Resource database; MODIS was downloaded via the Application for Extracting and Exploring Analysis Ready Samples (AppEEARS; Abdi et al., 2019 ; AppEEARS Team., 2020 ). The MODIS instrument is used by both the Terra and Aqua missions. It has a 2,330 km viewing swath and views the whole Earth's surface every 1–2 days. Its detectors collect data with three spatial resolutions of 250, 500, and 1,000 m and measure 36 spectral bands between 0.405 and 14.385 m. MODIS data, along with data from other sensors aboard the Terra and Aqua satellites, is relayed to ground stations via the Tracking and Data Relay Satellite System (TDRSS). The data will subsequently be forwarded to the EOS (Earth Observing System) Data and Operations System at Goddard Space Flight Center (EDOS; AppEEARS Team., 2020 ; Hu, 2020 ). The MODIS Adaptive Processing System (MODAPS) produces level 1A, level 1B, geolocation, and cloud mask products, as well as high-level MODIS land surface and atmosphere products, which are divided into three DAACs (Distributed Active Archive Centers) for distribution to the research and application community ( Sundaresan et al., 2014 ). The MODIS direct broadcast signal can be used to gather regional data directly from the satellite by users with a compatible x-band receiving device. The data (MOD13Q1 and the layers of interest: EVI and pixel reliability) was requested using an area sample, and the output was configured as GeoTIFF with geographic projection ( Kring, 2007 ; Sundaresan et al., 2014 ). The VIs were created at 16-day intervals, with low-quality data removed using a MODIS-specific compositing process based on product QA. The Pixel Reliability Quality Assurance (QA) layer of MOD13Q1 was used to mask or correct pixels affected by atmospheric disturbances such as clouds. The layer classifies the efficiency of the vegetation index from−1 to 5, although for this analysis, good, and poor values are classed as 0 and 1, respectively. In the pixel reliability bands, poor and marginal data are accepted as acceptable accuracy and were considered for the investigation. Agricultural information was acquired from GrainSA database.
The drought conditions in the region were determined using the Vegetation Condition Index (VCI) based on the relative Normalized Vegetation Difference Index (NDVI) modification with regard to the minimum historical NDVI value as indicated by Kogan (1995) . As a result, the VCI compares the current Vegetation Index (VI), such as the NDVI or the Enhanced Vegetation Index (EVI), to the values found inside a given pixel in past years during the same time period. The VCI was calculated using Equation 1 as shown below.
where VCI ijk is the VCI value for the pixel i during week/month/ day of the years (DOY j ) for year k , VI ijk is the weekly/monthly/DOYs VI value for pixel i in week/month/DOY j for year k whereby both the NDVI or EVI can be utilized as VI, VI i , min and VI i, max is the multiyear minimum and maximum VI, respectively, for pixel i .
The resulting percentage of the measured VI value in previous years was placed in the middle of the two extremes (minimum and maximum). As a result, lower and higher values indicate poor and good drought conditions, respectively. The method utilized in this study, namely, estimating drought occurrences with VCI using R programming, is based on EVI, which has several key values or benefits over other vegetative indices, such as NDVI. First, no reflected light distortions are caused by airborne particles; second, no reflected light distortions caused by ground cover vegetation. Adapted from UN-SPIDER recommended practices ( http://www.unspider.org/advisory-support/recommended-practices/recommended-practice-drought-monitoring ), Figure 2 shows the planning, pre-processing, and data processing operations. Maize and sorghum yields were analyzed using Microsoft excel to identify their trends and also determine the potential impacts of drought on crop yields.

Figure 2 . Flow chart.
Evaluation of drought events and its potential impacts on food production Free State Province has been presented in this study. Results reveal that drought patterns and severity varied from one place to another, which shows that the impacts can be varied especially on agricultural sector between the years 2011 and 2020. Information in Figure 3 presents drought episodes over the study area for the period of study using space-based information to quantify drought potential impacts on food security in the affected areas. From the findings, it was noted that the year 2015 and 2018 were extremely affected by drought events, this connotes that the affected years would have been impacted in terms of food production and other water-reliant sectors. It has been noted previously that there is a significant increase in mild drought events in the Free State Province, from shorter time steps (first decade) to longer time steps (third decade; Botai et al., 2016 ). During the year 2015, the Free State Province appears to have had more droughts. Drought categories have substantial implications for a variety of sectors, including agriculture and water. According to a study, drought reduced agricultural productivity in South Africa by 8.4% in 2015. The livestock industry, for example, had a 15% drop in national herd stock as a result of the drought ( Matlou et al., 2021 ). The result further reveals that years 2017 was severely affected by drought where some areas are more impacted than others. This variability may be due to several factors, such as topography, rainfall amount, human and natural activities ( Ayanlade et al., 2018 ). Drought periods affect the agricultural sector the most compared to other sectors (mining, manufacturing, construction, trade, transport, finance, and community service; Matlou et al., 2021 ).

Figure 3 . Drought events for the year 2011–2020.
Years 2011 and 2019 were moderately affected by drought as presented in Figure 3 and Table 1 . Farmers may lose resources such as capital if drought damages their crops during these years. If the farmers water supply is insufficient, they may be forced to spend more money on irrigation or drill more wells, or produce lower yields during the affected years ( Baudoin et al., 2017 ; Kuwayama et al., 2019 ). Ranchers may have to pay more money on livestock feed and water. Results further reveal that years 2012 and 2014 observed no drought episodes which connote that these 2 years may not be directly affected by drought except the prolonged drought events from the previous years ( Nguyen et al., 2018 ). Extreme climate events, including prolonged drought, may establish long-lasting effects on soil biotic and abiotic properties, thus influencing ecosystem functions including primary productivity in subsequent years ( Nguyen et al., 2018 ).

Table 1 . Potential drought impacts on agricultural products between 2011 and 2020.
Information in Figures 4 , 5 present agricultural productions between year 2011 and 2020 for maize and sorghum productions, respectively. Since agricultural drought is caused by below-average precipitation and/or above-average temperatures and wind, which evaporate moisture from soils and plants, this in turn influences crops yield ( Madadgar et al., 2017 ; Leng and Hall, 2019 ; Orimoloye et al., 2021d ). The study area recorded the lowest maize yield in year 2015 with about 1191 tons, followed by year 2014 with about 2,236 tons. The lowest maize production recorded in year 2015 corroborates with the extreme drought event in the same year ( Figure 3 and Table 1 ). The primary direct economic impact of drought in the agricultural sector is crop failure and pasture losses and this can severely affect income ( Madadgar et al., 2017 ; Liu et al., 2018 ; Leng and Hall, 2019 ; Orimoloye et al., 2021a , c ). Findings further reveal that years 2016, 2019, and 2020 recorded 5,110, 4,700, and 4,492 tons, respectively. This is further supported by drought evaluations where these 3 years observed moderate drought episodes, this may also be influenced by the drought events. Studies have shown that yield loss risk tends to grow faster when experiencing a shift in drought severity from moderate to severe conditions ( Leng and Hall, 2019 ; Orimoloye et al., 2021a , d ). This analysis shows that variability in drought trends plays an important role in determining drought impacts, through reducing or amplifying drought-driven yield loss risk ( Leng and Hall, 2019 ).

Figure 4 . Maize for year 2011–2020.

Figure 5 . Sorghum for year 2011–2020.
Sorghum production between year 2011 and 2020 is presented in Figure 4 . Total average yield (t/ha) for sorghum show that 0.9 (2016), 1.3 (2015), and 2.2 (2013) were recorded in the study area. Year 2013 recorded 139,200 tons of sorghum yields while years 2015, 2016, and 2018 recorded the lowest sorghum production with about 24,150, 24,640, and 23,600, respectively during the period ( Figure 4 ).
Drought is an extreme stage of the hydrological cycle that occurs when water availability is lower than typical ( Orimoloye et al., 2019 ; Adedeji et al., 2020 ). Droughts typically begin with a lack of precipitation (meteorological drought), which can be aggravated by increased evapotranspiration owing to high temperatures, which can spread to the land surface and result in reduced soil moisture (agricultural drought) and streamflow (called hydrological drought). Water stress during drought slows down crop root growth, delays maturation and reduces agricultural productivity ( Ge et al., 2012 ; Piscitelli et al., 2021 ). Drought occurrence is critical because crop yield susceptibility to water stress varies by development stage, which is linked to the fundamental biophysical principles of crop growth ( Oliveira and Araújo, 2021 ). As a result, drought impacts on agricultural productivity must be assessed independently for particular growth stages, which is more relevant for agricultural water management ( Orimoloye et al., 2021d ). Space-based assessments of drought are important tools for estimating drought impacts on crop yields ( Derese et al., 2018 ; Orimoloye et al., 2021c ) but these are inherently scale-dependent, ranging from the farm level at the local level to the global scale. This highlights the need for space-based information approaches ( Orimoloye et al., 2021c ) to simultaneously consider the joint distribution of the spatial and temporal footprint of drought. Such approaches can be combined with model-based large ensembles for more robust quantification of agricultural risk, this can also consider whether risk assessments are transferable across scales.
Drought tolerance may arise from extra copies of key genes, and sorghum's efficient photosynthetic pathway may be cobbled together from existing photosynthetic genes and duplicated genes that shifted their function over millions of years in order to withstand drought episodes (Citations). Droughts in the study area, infestation, insects, birds, and diseases, a lack of varieties with farmers' preferred traits and high yield potential, limited policy support, a lack of improved seed system, poor sorghum production practices and crop input application, and poor soil fertility may all have contributed to the decline in sorghum productivity ( Derese et al., 2018 ). Among the sorghum production constraints listed, severe drought in the post-flowering stage may be the most significant over time. A large number of farmers in the affected area may need to produce medium-maturing sorghum cultivars with high grain and biomass yields that can be planted at normal planting times yet avoid post-flowering drought ( Azu et al., 2021 ; Abreha et al., 2022 ).
Analysis from this study revealed spatio-temporal distributions of drought and crop trends over the study area ( Table 1 ). From the findings, drought event implications on agricultural products were identified, it was noted that the years that experienced drought episodes witnessed a decline in crop yields. For instance, the year 2015 observed extreme drought, both crops explored in the study experienced a drop in their yields, this also repeated in the year 2018 with potential drought impacts on agricultural productions ( Madadgar et al., 2017 ; Liu et al., 2018 ; Leng and Hall, 2019 ). Persistent drought episodes can influence food insecurity as this has been recorded in previous studies ( Cottrell et al., 2019 ; He et al., 2019 ). This can sometimes cause problems for downstream agriculture, particularly when the growing season for crops and peak food demand periods do not coincide. The amount to which trade-offs exist, however, is determined by the duration and spatial footprint of droughts.
Improved Decision-Support for Agricultural Droughts in Vulnerable Region
There are a number of new technological developments that could support drought risk reduction. Here we will focus on space-based information that could be better integrated to improve decision-support especially in combatting drought disasters. The approach used in this study will improve agricultural drought monitoring in the drought-affected area ( Enenkel et al., 2015 ; Brandt et al., 2017 ). This will help in gaining a better understanding of the uncertainty of long-term drought forecasts and how this information can be integrated with satellite-derived soil moisture and its potential influence on food security. For example, year 2015 observed extreme drought where both crops explored in the study observed declined in productions, this also repeated in the year 2018 with potential drought impacts on agricultural productions. These years can be examined to know how drought events have affected the area especially, agricultural production and to suggest possible practices to avert future occurrence. More so, integration of non-environmental information that can contribute to drought impact may be considered.
The most important question is: what can science do to help people make better decisions regarding drought hazards? The integrated and modification of existing technologies, including various satellite-based systems and people's experiences, is one logical and promising option. Organizations like AppEEARS (Application for Extracting and Exploring Analysis Ready Samples), USGS (United States Geological Survey), EUMETSAT (European Organization for the Exploitation of Meteorological Satellites), and NOAA (National Oceanic and Atmospheric Administration) provide a wide range of satellite-derived datasets that are operational, near real-time, and free of charge (or with a minimal and low-cost receiving station). Datasets obtained from sensors, in addition to some of the more regularly used remote sensing products, can be delivered at a spatial resolution that is worth considering to complement or replace in-situ observations. Local measurement flaws including inadequate coverage and lack of spatial consistency are frequently compensated for using these databases. The interaction of drought-inducing main climatic elements (rainfall, temperature, soil moisture, evapotranspiration, and vegetation) is reasonably well-understood ( Enenkel et al., 2015 ; Afuye et al., 2021a , b ). One key issue is that large-scale planning necessitates accurate drought forecasts several months in advance, which are currently insufficient ( Yaseen and Shahid, 2021 ). Another concern is that agricultural drought is only one of several potential causes of food insecurity. High degrees of vulnerability induced by interacting socio-economic factors, such as political turmoil and rising or fluctuating food costs, often encourage famine. In fact, the methods for monitoring environmental anomalies and their socioeconomic consequences are hardly comparable. Researchers should engage more closely with end-users in a multi-disciplinary manner in order to establish a holistic drought monitoring system. This strategy will help by identifying the current weak links and suggesting future mitigation strategies.
This study presented agricultural drought and its potential impacts in order to enable decision-support for food security in vulnerable societies. Analysis from this study revealed spatio-temporal distributions of drought and crop trends over the study area. The outcomes from this study revealed drought event implications on agricultural products, it was also noted that the years that experienced drought episodes witnessed a decline in crop yields. For example, year 2015 observed extreme drought, both crops explored in the study experienced a decrease in agricultural productions, this was also repeated in the year 2018 with potential drought impacts on agricultural productions during the same period. The consequence of drought is a translation of failure of early warning, local action, disaster preparedness and lack of external support. The approach for monitoring drought anomalies and their agricultural impact is hardly comparable. Scientists should engage more closely with the affected parties (farmers and water-reliant sectors), end-users in a multi-disciplinary manner in order to establish a holistic drought monitoring system. This strategy will help by identifying the current weak links and suggesting future mitigation strategies. Consequently, it is necessary to appraise drought disasters by incorporating climate information, environmental and economic implications of drought in the study area and the surrounding environments, this will help in identifying the contributing factors and the actual impacts of its occurrences in the region.
Data Availability Statement
The raw data supporting the conclusions of this article will be made available by the authors, without undue reservation.
Author Contributions
The author confirms being the sole contributor of this work and has approved it for publication.
Conflict of Interest
The author declares that the research was conducted in the absence of any commercial or financial relationships that could be construed as a potential conflict of interest.
Publisher's Note
All claims expressed in this article are solely those of the authors and do not necessarily represent those of their affiliated organizations, or those of the publisher, the editors and the reviewers. Any product that may be evaluated in this article, or claim that may be made by its manufacturer, is not guaranteed or endorsed by the publisher.
Abdi, O., Shirvani, Z., and Buchroithner, M. F. (2019). Forest drought-induced diversity of Hyrcanian individual-tree mortality affected by meteorological and hydrological droughts by analyzing moderate resolution imaging spectroradiometer products and spatial autoregressive models over northeast Iran. Agri. For. Meteorol . 275, 265–276. doi: 10.1016/j.agrformet.2019.05.029
CrossRef Full Text | Google Scholar
Abreha, K. B., Enyew, M., Carlsson, A. S., Vetukuri, R. R., Feyissa, T., Motlhaodi, T., et al. (2022). Sorghum in dryland: morphological, physiological, and molecular responses of sorghum under drought stress. Planta 255, 1–23. doi: 10.1007/s00425-021-03799-7
PubMed Abstract | CrossRef Full Text | Google Scholar
Adedeji, O., Olusola, A., James, G., Shaba, H. A., Orimoloye, I. R., Singh, S. K., et al. (2020). Early warning systems development for agricultural drought assessment in Nigeria. Environ. Monit. Assess. 192, 1–21. doi: 10.1007/s10661-020-08730-3
Afuye, G. A., Kalumba, A. M., Busayo, E. T., and Orimoloye, I. R. (2021a). A bibliometric review of vegetation response to climate change. Environ. Sci. Poll. Res. 7, 1–13. doi: 10.1007/s11356-021-16319-7
Afuye, G. A., Kalumba, A. M., and Orimoloye, I. R. (2021b). Characterisation of vegetation response to climate change: a review. Sustainability 13:7265. doi: 10.3390/su13137265
Ahmed, S. M. (2020). Impacts of drought, food security policy and climate change on performance of irrigation schemes in Sub-saharan Africa: the case of Sudan. Agri. Water Manag . 232:106064. doi: 10.1016/j.agwat.2020.106064
Anderson, G. J., Lucas, D. D., and Bonfils, C. (2018). Uncertainty analysis of simulations of the turn-of-the-century drought in the Western United States. J. Geophys. Res. Atmos . 123, 13–219. doi: 10.1029/2017JD027824
AppEEARS Team. (2020). Application for Extracting and Exploring Analysis Ready Samples (AppEEARS). Ver. 2.44 . Sioux Falls, SD: NASA EOSDIS Land Processes Distributed Active Archive Center (LP DAAC), USGS/Earth Resources Observation and Science (EROS) Center. Available online at: https://lpdaacsvc.cr.usgs.gov/appeears (accessed June 2021).
Google Scholar
Ayanlade, A., Radeny, M., Morton, J. F., and Muchaba, T. (2018). Rainfall variability and drought characteristics in two agro-climatic zones: an assessment of climate change challenges in Africa. Sci. Tot. Environ . 630, 728–737. doi: 10.1016/j.scitotenv.2018.02.196
Azu, E., Elegba, W., Asare, A. T., Blege, P. K., Amoatey, H. M., and Danquah, E. Y. (2021). Responses of smallholder farmers on sorghum production preferences and constraints in the Upper East Region of Ghana. J. Agri. Extens. Rural Dev . 13, 202–216. doi: 10.5897/JAERD2021.1260
Balogun, A. L., Marks, D., Sharma, R., Shekhar, H., Balmes, C., Maheng, D., et al. (2020). Assessing the potentials of digitalization as a tool for climate change adaptation and sustainable development in urban centres. Sustain. Cities Soc . 53:101888. doi: 10.1016/j.scs.2019.101888
Baudoin, M. A., Vogel, C., Nortje, K., and Naik, M. (2017). Living with drought in South Africa: lessons learnt from the recent El Niño drought period. Int. J. Disast. Risk Reduct . 23, 128–137. doi: 10.1016/j.ijdrr.2017.05.005
Berhan, G., Hill, S., Tadesse, T., and Atnafu, S. (2013). Drought prediction system for improved climate change mitigation. IEEE Trans. Geosci. Remote Sens . 52, 4032–4037. doi: 10.1109/TGRS.2013.2279020
Blamey, R. C., Kolusu, S. R., Mahlalela, P., Todd, M. C., and Reason, C. J. C. (2018). The role of regional circulation features in regulating El Niño climate impacts over southern Africa: a comparison of the 2015/2016 drought with previous events. Int. J. Climatol . 38, 4276–4295. doi: 10.1002/joc.5668
Botai, C. M., Botai, J. O., Dlamini, L. C., Zwane, N. S., and Phaduli, E. (2016). Characteristics of droughts in South Africa: a case study of free state and North West Provinces. Water 8:439. doi: 10.3390/w8100439
Brandt, P., Kvakić, M., Butterbach-Bahl, K., and Rufino, M. C. (2017). How to target climate-smart agriculture? Concept and application of the consensus-driven decision support framework “targetCSA”. Agri. Syst . 151, 234–245. doi: 10.1016/j.agsy.2015.12.011
Campbell, D., Barker, D., and McGregor, D. (2011). Dealing with drought: small farmers and environmental hazards in southern St. Elizabeth, Jamaica. Appl. Geogr . 31, 146–158. doi: 10.1016/j.apgeog.2010.03.007
Cottrell, R. S., Nash, K. L., Halpern, B. S., Remenyi, T. A., Corney, S. P., Fleming, A., et al. (2019). Food production shocks across land and sea. Nat. Sustainabil . 2, 130–137. doi: 10.1038/s41893-018-0210-1
Daigh, A. L., Dick, W. A., Helmers, M. J., Lal, R., Lauer, J. G., Nafziger, E., et al. (2018). Yields and yield stability of no-till and chisel-plow fields in the Midwestern US Corn Belt. Field Crops Res . 218, 243–253. doi: 10.1016/j.fcr.2017.04.002
Derese, S. A., Shimelis, H., Laing, M., and Mengistu, F. (2018). The impact of drought on sorghum production, and farmer's varietal and trait preferences, in the north eastern Ethiopia: implications for breeding. Acta Agri. Scand. Sect. B Soil Plant Sci . 68, 424–436. doi: 10.1080/09064710.2017.1418018
Dhankher, O. P., and Foyer, C. H. (2018). Climate Resilient Crops for Improving Global Food Security and Safety. doi: 10.1111/pce.13207
Dyosi, M., Kalumba, A. M., Magagula, H. B., Zhou, L., and Orimoloye, I. R. (2021). Drought conditions appraisal using geoinformatics and multi-influencing factors. Environ. Monitor. Assess . 193, 1–19. doi: 10.1007/s10661-021-09126-7
Ekundayo, O. Y., Okogbue, E. C., Akinluyi, F. O., Kalumba, A. M., and Orimoloye, I. R. (2020). Spatiotemporal drought assessment using vegetation health index and standardized precipitation index over Sudano-Sahelian region of Nigeria. Afri. Geogr. Rev. 2020, 1–13. doi: 10.1080/19376812.2020.1841658
Ekundayo, O. Y., Okogbue, E. C., Akinluyi, F. O., Kalumba, A. M., and Orimoloye, I. R. (2021). “Geoinformatics approach to desertification evaluationusing vegetation cover changes in the Sudano-Sahelian Region of Nigeria from 2000 to 2010,” in Re-envisioning Remote Sensing Applications (Boca Raton, FL: CRC Press), 261–270. doi: 10.1201/9781003049210-18
Enenkel, M., See, L., Bonifacio, R., Boken, V., Chaney, N., Vinck, P., et al. (2015). Drought and food security–Improving decision-support via new technologies and innovative collaboration. Glob. Food Security 4, 51–55. doi: 10.1016/j.gfs.2014.08.005
Fava, F., and Vrieling, A. (2021). Earth observation for drought risk financing in pastoral systems of sub-Saharan Africa. Curr. Opin. Environ. Sustainabil . 48, 44–52. doi: 10.1016/j.cosust.2020.09.006
Gao, L., and Bryan, B. A. (2017). Finding pathways to national-scale land-sector sustainability. Nature 544, 217–222. doi: 10.1038/nature21694
Ge, T., Sui, F., Bai, L., Tong, C., and Sun, N. (2012). Effects of water stress on growth, biomass partitioning, and water-use efficiency in summer maize (Zea mays L.) throughout the growth cycle. Acta Physiol. Plant . 34, 1043–1053. doi: 10.1007/s11738-011-0901-y
Gichure, R. W. (2017). Effects of Drought on Crop Production and Coping Mechanisms Undertaken by Small Scale Farmers: a Case of Makueni County, Kenya . (Doctoral dissertation), University of Nairobi, Nairobi, Kenya.
Hao, Z., Singh, V. P., and Xia, Y. (2018). Seasonal drought prediction: advances, challenges, and future prospects. Rev. Geophys . 56, 108–141. doi: 10.1002/2016RG000549
He, X., Estes, L., Konar, M., Tian, D., Anghileri, D., Baylis, K., et al. (2019). Integrated approaches to understanding and reducing drought impact on food security across scales. Curr. Opin. Environ. Sustainabil . 40, 43–54. doi: 10.1016/j.cosust.2019.09.006
Hu, Z. (2020). Earth Observation for the Assessment of Long-Term Snow Dynamics in European Mountains-Analysing 35-Year Snowline Dynamics in Europe Based on High Resolution Earth Observation Data between 1984 and 2018 . (Doctoral dissertation), Universität Würzburg, Würzburg, Germany.
Khadr, M. (2016). Forecasting of meteorological drought using Hidden Markov Model (case study: the upper Blue Nile river basin, Ethiopia). Ain Shams Eng. J . 7, 47–56. doi: 10.1016/j.asej.2015.11.005
Kogan, F. N. (1995). Application of vegetation index and brightness temperature for drought detection. Adv. Space Res . 15, 91–100. doi: 10.1016/0273-1177(95)00079-T
Kreibich, H., Blauhut, V., Aerts, J. C., Bouwer, L. M., Van Lanen, H. A., Mejia, A., et al. (2019). How to improve attribution of changes in drought and flood impacts. Hydrol. Sci. J . 64, 1–18. doi: 10.1080/02626667.2018.1558367
Kring, D. A. (2007). Guidebook to the Geology of Barringer Meteorite Crater, Arizona (Aka Meteor Crater) . (Houston: Lunar and Planetary Institute), 150.
Kuwayama, Y., Thompson, A., Bernknopf, R., Zaitchik, B., and Vail, P. (2019). Estimating the impact of drought on agriculture using the US Drought Monitor. Am. J. Agri. Econ . 101, 193–210. doi: 10.1093/ajae/aay037
Leng, G., and Hall, J. (2019). Crop yield sensitivity of global major agricultural countries to droughts and the projected changes in the future. Sci. Tot. Environ . 654, 811–821. doi: 10.1016/j.scitotenv.2018.10.434
Liu, X., Pan, Y., Zhu, X., Yang, T., Bai, J., and Sun, Z. (2018). Drought evolution and its impact on the crop yield in the North China Plain. J. Hydrol . 564, 984–996. doi: 10.1016/j.jhydrol.2018.07.077
Madadgar, S., AghaKouchak, A., Farahmand, A., and Davis, S. J. (2017). Probabilistic estimates of drought impacts on agricultural production. Geophys. Res. Lett . 44, 7799–7807. doi: 10.1002/2017GL073606
Mahlalela, P. T., Blamey, R. C., Hart, N. C. G., and Reason, C. J. C. (2020). Drought in the Eastern Cape region of South Africa and trends in rainfall characteristics. Climate Dyn . 55, 2743–2759. doi: 10.1007/s00382-020-05413-0
Matlou, R., Bahta, Y. T., Owusu-Sekyere, E., and Jordaan, H. (2021). Impact of agricultural drought resilience on the welfare of smallholder livestock farming households in the Northern Cape Province of South Africa. Land 10:562. doi: 10.3390/land10060562
Naumann, G., Alfieri, L., Wyser, K., Mentaschi, L., Betts, R. A., Carrao, H., et al. (2018). Global changes in drought conditions under different levels of warming. Geophys. Res. Lett . 45, 3285–3296. doi: 10.1002/2017GL076521
Nguyen, L. T., Osanai, Y., Lai, K., Anderson, I. C., Bange, M. P., Tissue, D. T., et al. (2018). Responses of the soil microbial community to nitrogen fertilizer regimes and historical exposure to extreme weather events: flooding or prolonged-drought. Soil Biol. Biochem . 118, 227–236. doi: 10.1016/j.soilbio.2017.12.016
Obersteiner, M., Walsh, B., Frank, S., Havlík, P., Cantele, M., Liu, J., et al. (2016). Assessing the land resource–food price nexus of the Sustainable Development Goals. Sci. Adv . 2:e1501499. doi: 10.1126/sciadv.1501499
Oliveira, C. D. D. P., and Araújo, J. F. (2021). Analysis of the agroecological zone method in predicting the impact of climate change on agriculture. Int. J. Adv. Res. Sci. Eng. Technol. 8. doi: 10.22161/ijaers.89.10
Orimoloye, I. R., Belle, J. A., and Ololade, O. O. (2021a). Drought disaster monitoring using MODIS derived index for drought years: a space-based information for ecosystems and environmental conservation. J. Environ. Manag . 284:112028. doi: 10.1016/j.jenvman.2021.112028
Orimoloye, I. R., Ololade, O. O., and Belle, J. A. (2021c). Satellite-based application in drought disaster assessment using terra MOD13Q1 data across free state province, South Africa. J. Environ. Manag . 285:112112. doi: 10.1016/j.jenvman.2021.112112
Orimoloye, I. R., Ololade, O. O., Mazinyo, S. P., Kalumba, A. M., Ekundayo, O. Y., Busayo, E. T., et al. (2019). Spatial assessment of drought severity in Cape Town area, South Africa. Heliyon 5:e02148. doi: 10.1016/j.heliyon.2019.e02148
Orimoloye, I. R., Olusola, A. O., Ololade, O., and Adelabu, S. (2021d). A persistent fact: reflections on drought severity evaluation over Nigerian Sahel using MOD13Q1. Arab. J. Geosci . 14, 1–18. doi: 10.1007/s12517-021-08369-5
Orimoloye, I. R., Zhou, L., M., and Kalumba, A. M. (2021b). Drought disaster risk adaptation through ecosystem services-based solutions: way forward for South Africa. Sustainability 13:4132. doi: 10.3390/su13084132
Pienaar, L. O. U. W., and Boonzaaier, J. O. H. A. N. N. (2018). Drought Policy Brief Western Cape Agriculture . Elsenburg: Western Cape Department of Agriculture (WCDoA) and the Bureau for Food and Agricultural Policy (BFAP).
Piscitelli, L., Colovic, M., Aly, A., Hamze, M., Todorovic, M., Cantore, V., et al. (2021). Adaptive agricultural strategies for facing water deficit in sweet maize production: a case study of a semi-arid mediterranean region. Water 13:3285. doi: 10.3390/w13223285
Purakayastha, T. J., Bera, T., Bhaduri, D., Sarkar, B., Mandal, S., Wade, P., et al. (2019). A review on biochar modulated soil condition improvements and nutrient dynamics concerning crop yields: pathways to climate change mitigation and global food security. Chemosphere 227, 345–365. doi: 10.1016/j.chemosphere.2019.03.170
Ropo, O. I., Perez, M. S., Werner, N., and Enoch, T. I. (2017). Climate variability and heat stress index have increasing potential ill-health and environmental impacts in the East London, South Africa. Int. J. Appl. Eng. Res . 12, 6910–6918.
Salami, S. O., Adegbaju, O. D., Idris, O. A., Jimoh, M. O., Olatunji, T. L., Omonona, S., et al. (2021). South African wild fruits and vegetables under a changing climate: the implications on health and economy. South African J. Bot . doi: 10.1016/j.sajb.2021.08.038
Savari, M., Eskandari Damaneh, H., and Damaneh, H. E. (2021). Factors influencing farmers' management behaviors toward coping with drought: evidence from Iran. J. Environ. Plan. Manag . 64, 2021–2046. doi: 10.1080/09640568.2020.1855128
Schiermeier, Q. (2013). Climate models fail to ‘predict'US droughts. Nat. News 496:284. doi: 10.1038/496284a
Sundaresan, J., Santosh, K. M., Déri, A., Roggema, R., and Singh, R. (2014). Geospatial Technologies and Climate Change . Cham: Springer International Publishing. doi: 10.1007/978-3-319-01689-4
Tembile, S. (2021). South Africa: Worst in 100 Years - Drought in All Three Cape Provinces Declared a National Disaster . Available online at: https://allafrica.com/stories/202107220210.html (accessed June 2021).
Yaseen, Z. M., and Shahid, S. (2021). Drought index prediction using data intelligent analytic models: a review. Intelligent Data Analytics for Decision-Support Systems in Hazard Mitigation 2021, 1–27. doi: 10.1007/978-981-15-5772-9_1
Keywords: agricultural drought, Earth observation data, food security, potential impacts, decision-support
Citation: Orimoloye IR (2022) Agricultural Drought and Its Potential Impacts: Enabling Decision-Support for Food Security in Vulnerable Regions. Front. Sustain. Food Syst. 6:838824. doi: 10.3389/fsufs.2022.838824
Received: 18 December 2021; Accepted: 13 January 2022; Published: 11 February 2022.
Reviewed by:
Copyright © 2022 Orimoloye. This is an open-access article distributed under the terms of the Creative Commons Attribution License (CC BY) . The use, distribution or reproduction in other forums is permitted, provided the original author(s) and the copyright owner(s) are credited and that the original publication in this journal is cited, in accordance with accepted academic practice. No use, distribution or reproduction is permitted which does not comply with these terms.
*Correspondence: Israel R. Orimoloye, orimoloyeisrael@gmail.com ; orcid.org/0000-0001-5058-2799
This article is part of the Research Topic
Feeding the Growing Cities of Sub-Saharan Africa: Challenges of Urban Food Systems, Food Security, Urban Agriculture, and Sustainability

An official website of the United States government
The .gov means it’s official. Federal government websites often end in .gov or .mil. Before sharing sensitive information, make sure you’re on a federal government site.
The site is secure. The https:// ensures that you are connecting to the official website and that any information you provide is encrypted and transmitted securely.
- Publications
- Account settings
Preview improvements coming to the PMC website in October 2024. Learn More or Try it out now .
- Advanced Search
- Journal List
- Front Plant Sci
Impact of climate change on agricultural production; Issues, challenges, and opportunities in Asia
Muhammad habib-ur-rahman.
1 Institute of Crop Science and Resource Conservation (INRES), Crop Science Group, University of Bonn, Bonn, Germany
2 Department of Agronomy, MNS-University of Agriculture, Multan, Pakistan
Ashfaq Ahmad
3 Asian Disaster Preparedness Center, Islamabad, Pakistan
4 Department of Agronomy, University of Agriculture Faisalabad, Faisalabad, Pakistan
Muhammad Usama Hasnain
Hesham f. alharby.
5 Department of Biological Sciences, Faculty of Science, King Abdulaziz University, Jeddah, Saudi Arabia
Yahya M. Alzahrani
Atif a. bamagoos, khalid rehman hakeem.
6 Princess Dr. Najla Bint Saud Al-Saud Center for Excellence Research in Biotechnology, King Abdulaziz University, Jeddah, Saudi Arabia
7 Department of Public Health, Daffodil International University, Dhaka, Bangladesh
Saeed Ahmad
8 Institute of Plant Breeding and Biotechnology, MNS-University of Agriculture, Multan, Pakistan
9 Department of Agronomy, The Islamia University, Bahwalpur, Pakistan
Wajid Nasim
Shafaqat ali.
10 Department of Environmental Science and Engineering, Government College University, Faisalabad, Pakistan
Fatma Mansour
11 Department of Economics, Business and Economics Faculty, Siirt University, Siirt, Turkey
Ayman EL Sabagh
12 Department of Agronomy, Faculty of Agriculture, Kafrelsheikh University, Kafrelsheikh, Egypt
13 Department of Field Crops, Faculty of Agriculture, Siirt University, Siirt, Turkey
Agricultural production is under threat due to climate change in food insecure regions, especially in Asian countries. Various climate-driven extremes, i.e., drought, heat waves, erratic and intense rainfall patterns, storms, floods, and emerging insect pests have adversely affected the livelihood of the farmers. Future climatic predictions showed a significant increase in temperature, and erratic rainfall with higher intensity while variability exists in climatic patterns for climate extremes prediction. For mid-century (2040–2069), it is projected that there will be a rise of 2.8°C in maximum temperature and a 2.2°C in minimum temperature in Pakistan. To respond to the adverse effects of climate change scenarios, there is a need to optimize the climate-smart and resilient agricultural practices and technology for sustainable productivity. Therefore, a case study was carried out to quantify climate change effects on rice and wheat crops and to develop adaptation strategies for the rice-wheat cropping system during the mid-century (2040–2069) as these two crops have significant contributions to food production. For the quantification of adverse impacts of climate change in farmer fields, a multidisciplinary approach consisted of five climate models (GCMs), two crop models (DSSAT and APSIM) and an economic model [Trade-off Analysis, Minimum Data Model Approach (TOAMD)] was used in this case study. DSSAT predicted that there would be a yield reduction of 15.2% in rice and 14.1% in wheat and APSIM showed that there would be a yield reduction of 17.2% in rice and 12% in wheat. Adaptation technology, by modification in crop management like sowing time and density, nitrogen, and irrigation application have the potential to enhance the overall productivity and profitability of the rice-wheat cropping system under climate change scenarios. Moreover, this paper reviews current literature regarding adverse climate change impacts on agricultural productivity, associated main issues, challenges, and opportunities for sustainable productivity of agriculture to ensure food security in Asia. Flowing opportunities such as altering sowing time and planting density of crops, crop rotation with legumes, agroforestry, mixed livestock systems, climate resilient plants, livestock and fish breeds, farming of monogastric livestock, early warning systems and decision support systems, carbon sequestration, climate, water, energy, and soil smart technologies, and promotion of biodiversity have the potential to reduce the negative effects of climate change.
Introduction
Asia is the most populous subcontinent in the world (UNO, 2015 ), comprising 4.5 billion people—about 60% of the total world population. Almost 70% of the total population lives in rural areas and 75% of the rural population are poor and most at risk due to climate change, particularly in arid and semi-arid regions (Yadav and Lal, 2018 ; Population of Asia, 2019 ). The population in Asia is projected to reach up to 5.2 billion by 2050, and it is, therefore, challenging to meet the food demands and ensure food security in Asia (Rao et al., 2019 ). In this context, Asia is the region most likely to attribute to population growth rate, and more prone to higher temperatures, drought, flooding, and rising sea level (Guo et al., 2018 ; Hasnat et al., 2019 ). In Asia, diversification in income of small and poor farmers and increasing urbanization is shocking for agricultural productivity. Asia is the home of a third of the world's population and the majority of poor families, most of which are engaged in agriculture (World Bank, 2018 ). We can expect diversification of adverse climate change effects on the agriculture sector due to diversity of farming and cropping systems with dependence on climate. According to the sixth assessment report of IPCC, higher risks of flood and drought make Asian agricultural productivity highly susceptible to changing climate (IPCC, 2019 ). Climate change has already adversely affected economic growth and development in Asia, although there is low emission of greenhouse gasses (GHG) in this region (Gouldson et al., 2016 ; Ahmed et al., 2019a ). Still, China and India are major contributors to global carbon dioxide emission; the share of each Asian country in cumulative global carbon dioxide emission is presented in Figures 1 , ,2. 2 . Although GHGs emission from the agriculture sector is lower than the others, it still has a negative impact. Emission of GHGs from different agricultural components and contribution to emissions can be found in Figure 3 . However, the contribution of Asian countries in GHGs including land use changes and forestry is described in Figure 4 .

Share of each Asian country in cumulative global carbon dioxide emission (1751–2019; Source: OWID based on CDIAC and Global Carbon Project).

Carbon dioxide (CO 2 ) emission from different Asian countries (source: International Energy Statistics https://cdiac.ess-dive.lbl.gov/home.html ; Carbon Dioxide Information Analysis Center, Environmental Sciences Division, Oak Ridge National Laboratory, Tennessee, United States).

Sources of greenhouse gasses (GHGs) emission from different Asian countries with respect to agricultural components (Source: CAIT climate data explorer via . Climate Watch ( https://www.climatewatchdata.org/data-explorer/historical-emissions ).

Total greenhouse gasses (GHGs) emission includes emissions from land use changes and forestry from Asian countries (measured in tons of carbon dioxide equivalents [CO 2 -e] (Source: CAIT climate data explorer via Climate Watch).
Asia is facing alarming challenges due to climate change and variability as illustrated by various climatic models predicting the global mean temperature will increase by 1.5°C between 2030 and 2050 if it continues to increase at the current rate (IPCC, 2019 ). In arid areas of the western part of China, Pakistan, and India, it is also projected that there will be a significant increase in temperature (IPCC, 2019 ). During monsoon season, there would be an increase in erratic rainfall of high intensity across the region. In South and Southeast Asia, there would be an increase in aridity due to a reduction in winter rainfall. Due to climatic abnormalities, there will be a 0.1 m increase in sea level by 2,100 across the globe (IPCC, 2019 ). In Asia, an increase in heat waves, hot and dry days, and erratic and unsure rainfall patterns is projected, while dust storms and tropical cyclones are predicted to be worse in the future (Gouldson et al., 2016 ). Natural disasters are the main reason behind the agricultural productivity (crops and livestock) losses in Asia, including extreme temperature, storms and wildfires (23%), floods (37%), drought (19%), and pest and animal diseases infestation (9%) which accounted for 10 USD billions in amount (FAO, 2015 ). During the last few decades, tropical cyclones in the Pacific have occurred with increased frequency and intensity. South Asia consisted of 262 million malnourished inhabitants, which made South Asia the most food insecure region across the globe (FAO, 2015 ; Rasul et al., 2019 ). In remote dry lands and deserts, the rural population is more vulnerable to climate change due to the scarcity of natural resources.
In Asia, climate variability (temperature and rainfall) and climate-driven extremes (flood, drought, heat stress, cold waves, and storms) have several negative impacts on the agriculture sector (FAO, 2016 ), especially in the cropping system which has a major role in food security, and thus created the food security issues and challenges in Asia (Cai et al., 2016 ; Aryal et al., 2019 ). The rice-wheat cropping system, a major cropping system which fills half of the food demand in Asia, is under threat due to climate change (Ghaffar et al., 2022 ). Climate change adversely affects both the quantity and quality of wheat and rice crops (Din et al., 2022 ; Wasaya et al., 2022 ). For instance, the protein content and grain yield of wheat have been reduced because of the negative impacts of increasing temperature (Asseng et al., 2019 ). The temperature rise has decreased the crop-growing period, and crop evapotranspiration ultimately reduced wheat yield (Azad et al., 2018 ). Adverse impacts of climate change and variability on winter wheat yield in China are attributed to increased average temperature during the growing period (Geng et al., 2019 ). Climate change is also adversely affecting the quality traits especially protein content, and sugars and starch percentages in grains of wheat. Elevated carbon dioxide and high temperatures increase the growth traits while decreasing the protein content in wheat grains (Asseng et al., 2019 ). Similarly, drought stress also reduces the protein content and soluble sugars of the wheat crop (Rakszegi et al., 2019 ; Hussein et al., 2022 ). The decline in the starch content in wheat grains has also been observed under drought stress (Noori and Taliman, 2022 ). Similarly, heat stress also causes a decline in the protein content, soluble sugar, and starch content in wheat grains (Zahra et al., 2021 ; Iqbal et al., 2022 ; Zhao et al., 2022 ). Climate change also negatively affects the quality of wheat products as the rise in temperature causes a reduction in protein content, sugars, and starch. It is assessed that rise in temperature by 1–4°C could decrease the wheat yield up to 17.6% in the Egyptian North Nile Delta (Kheir et al., 2019 ). In China, crop phenology has changed because of both climate variability and crop management practices (Liu et al., 2018 ). Both climate change scenarios and human management practices have adversely affected wheat phenology in India and China (Lv et al., 2013 ; Ren et al., 2019 ). The elevated temperature has increased the infestation of the aphid population on wheat crops and ultimately reduced yield (Tian et al., 2019 ). There is a direct and strong correlation between diseases attached to climate change. For instance, the Fusarium head blight of wheat crops is caused by the Fusarium species and its chances of an attack were increased due to high humidity and hot environment (Shah et al., 2018 ). A similar study has shown a direct interaction between insect pests and diseases and higher temperature and carbon dioxide levels in rice production (Iannella et al., 2021 ; Tan et al., 2021 ; Tonnang et al., 2022 ).
Climate variability has marked several detriments to rice production in Asia. Climate variability has induced flood and drought, which have decreased the rice yield in South Asia and several other parts of Asia (Mottaleb et al., 2017 ). Heat stress, drought, flood, and cyclones have reduced the rice yield in South Asia (Cai et al., 2016 ; Quyen et al., 2018 ; Tariq et al., 2018 ). Thus, climate change-driven extremes, particularly heat and drought stress, have also become a serious threat for sustainable rice production globally (Xu et al., 2021 ). Higher temperatures for a longer period as well as water shortages reduce seed germination which lead to poor stand establishment and seedling vigor (Fahad et al., 2017 ; Liu et al., 2019 ). It has been reported that the exposure of rice crops to high temperatures (38°C day/30°C night) at the grain filling stage led to a reduction in grain weight of rice (Shi et al., 2017 ). Moreover, heat stress also reduces the panicle and spikelet's initiation and ultimately the number of spikelets and grains in the rice production system (Xu et al., 2020 ). Drought stress also adversely affects the reproductive stages and reduces the yield components especially spikelets per panicle, grain size, and grain weight of rice (Raman et al., 2012 ; Kumar et al., 2020 ; Sohag et al., 2020 ). GLAM-Rice model has projected rice yield will decrease ~45% in the 2080's under RCP 8.5 as compared to 1991–2000 in Southeast Asia (Chun et al., 2016 ). On the other hand, climate variability could reduce crop water productivity by 32% under RCP 4.5, or 29% under RCP 8.5 by 2080's in rice crops (Boonwichai et al., 2019 ). In China and Pakistan, high temperature adversely affects the booting and anthesis growth stages of rice ultimately resulting in yield reduction (Zafar et al., 2018 ; Nasir et al., 2020 ). Crop models like DSSAT and APSIM have projected a yield reduction of both rice and wheat crops up to 19 and 12% respectively by 2069 due to a rise of 2.8°C in maximum and 2.2°C in minimum temperature in Pakistan (Ahmad et al., 2019 ).
About 35 million farmers having 3% landholding are projected to convert their source of income (combined crop-livestock production systems) to simply livestock because of the negative impacts of climate change on the quality and quantity of pastures as predicted by future scenarios for 2050 in Asia (Thornton and Herrero, 2010 ). The livestock production sector also contributes 14.5% of global greenhouse emissions and drives climate variability (Downing et al., 2017 ). Directly, there would be higher disease infestation and reduced milk production and fertility rates in livestock because of climate extremes like heat waves (Das, 2018 ; Kumar et al., 2018 ). Indirectly, heat stress will reduce both the quantity and quality of available forage for livestock. Several studies have reported that heat stress reduces the protein and starch content in the grains of maize which is a widely used forage crop (Yang et al., 2018 ; Bheemanahalli et al., 2022 ). Similarly, heat stress also reduces the soluble sugar and protein content in the heat-sensitive cultivars of alfalfa which is also a major forage crop (Wassie et al., 2019 ). In this context, heat stress leads to a reduction in the quality of forage. There would be an increase in demand for livestock products, however, there would be a decrease in livestock heads under future climate scenarios (Downing et al., 2017 ). In Asia, a severe shortage of feed for livestock has imposed horrible effects on the livestock population which has been attributed as the result of extreme rainfall variability and drought conditions (Ma et al., 2018 ).
Timber forests have several significances in Asia, and non-timber forests are also significant sources of food, fiber, and medicines (Chitale et al., 2018 ). Unfortunately, climate change has imposed several negative impacts on forests at various levels in the form of productive traits, depletion of soil resources, carbon dynamics, and vegetation shifting in Asian countries. In India, forests are providing various services in terms of meeting the food demand of 300 million people, the energy demand of people living in rural areas up to 40%, and shelter to one-third of animals (Jhariya et al., 2019 ). In Bangladesh, forests are also vulnerable to climate variability as they are facing the increased risks of fires, rise in sea level, storm surges, coastal erosion, and landslides (Chow et al., 2019 ). Increased extreme drought events with higher frequency, intensity, and duration, and human activities, i.e., afforestation and deforestation, have adversely altered the forest structure (Xu et al., 2018 ). Hence, there is a need to evaluate climate adaptation strategies to restore forests in Asian countries in order to meet increased demands of food, fiber, and medicines. Agroforestry production is also under threat because of adverse climate change impacts such as depletion of natural resources, predominance of insect pests, diseases and unwanted species, increased damage on agriculture and forests, and enhanced food insecurity (De Zoysa and Inoue, 2014 ; Lima et al., 2022 ).
Asia also consists of good quality aquaculture (80% of aquaculture production worldwide) and fisheries (52% of wild caught fish worldwide) which are 77% of the total value addition (Nguyen, 2015 ; Suryadi, 2020 ). In Asia, various climatic extremes such as erratic rainfall, drought, floods, heat stress, salinity, cyclone, ocean acidification, and increased sea level have negatively affected aquaculture (Ahmad et al., 2019 ). For instance, Hilsailisha constituted the largest fishery in Bangladesh, India, and West Bengal and S. Yangi in China have lost their habitat because of climate variability (Jahan et al., 2017 ; Wang et al., 2019a ). Ocean acidification and warming of 1.5°C was closely associated with anthropogenic absorption of CO 2 . Increasing levels of ocean acidity is the main threat to algae and fish. Among various climate driven extremes like drought, flood, and temperature rising, drought is more dangerous as there is not sufficient rainfall especially for aquaculture (Adhikari et al., 2018 ). Similarly, erratic rainfall, irregular rainfall, storms, and temperature variability have posed late maturity in fish for breeding and other various problems (Islam and Haq, 2018 ).
The above-mentioned facts have indicated that agriculture, livestock, forestry, fishery, and aquaculture are under threat in the future and can drastically affect food security in Asia. This paper reviews the climate change and variability impacts on the cropping system (rice and wheat), livestock, forestry, fishery, and aquaculture and their issues, challenges, and opportunities. The objectives of the study are to: (i) Review the climate variability impacts on agriculture, livestock, forestry, fishery, and aquaculture in Asia; (ii) summarize the opportunities (adaptation and mitigation strategies) to minimize the drastic effects of climate variability in Asia; and (iii) evaluate the impact of climate change on rice-wheat farmer fields—A case study of Pakistan.
Impact of climate change and variability on agricultural productivity
Impact of climate change and variability on rice-wheat crops.
In many parts of Asia, a significant reduction in crop productivity is associated with a reduction in timely water and rainfall availability, and erratic and intense rainfall patterns during the last decades (Hussain et al., 2018 ; Aryal et al., 2019 ). Despite the increased crop production owing to the green revolution, there is a big challenge to sustain production and improve food security for poor rural populations in Asia under climate change scenarios (FAO, 2015 ; Ahmad et al., 2019 ). In the least developed countries, damage because of climactic changes may threaten food security and national economic productivity (Myers et al., 2017 ). Yield reductions in different crops (rice, wheat) varied within regions due to variations in climate patterns (Yu et al., 2018 ). CO 2 fertilization can increase crop productivity and balance the drastic effects of higher temperature in C 3 plants (Obermeier et al., 2017 ) but cannot reduce the effect of elevated temperature (Arunrat et al., 2018 ). Crop growth and development have been negatively influenced because of rising temperatures and rainfall variability (Rezaei et al., 2018 ; Asseng et al., 2019 ).
Rice and wheat are major contributors to food security in Asia. There is a big challenge to increase wheat production by 60% by 2050 to meet ever-enhancing food demands (Rezaei et al., 2018 ). In arid to semi-arid regions, declined crop productivity is attributed to an increase in temperature at lower latitudes. In China, drought and flood have reduced the rice, wheat, and maize yields and it is projected that these issues will affect crop productivity more significantly in the future (Chen et al., 2018 ). Rice is sensitive to a gradual rise in night temperature causing yield and biomass to reduce by 16–52% if the temperature increase is 2°C above the critical temperature of 24°C (Yang et al., 2017 ). In Asia, semi-arid to arid regions are under threat and are already facing the problem of drought stress and low productivity. The quality of wheat produce (protein content, sugars, and starch) and grain yield have reduced because of the negative impacts of increasing temperature and erratic rainfall with high intensity (Yang et al., 2017 ). In the Egyptian North Nile Delta (up to 17.6%), India, and China, the climate variability has decreased wheat yield significantly which is attributed to a rise in temperature, erratic rainfall and increasing insect pest infestation (Arunrat et al., 2018 ; Shah et al., 2018 ; Aryal et al., 2019 ; Kheir et al., 2019 ). In South Asia, rice yield in rain-fed areas has already decreased and it might reduce by 14% under the RCP 4.5 scenario while 10% under the RCP 8.5 scenario by 2080 (Chun et al., 2016 ). High temperature and drought have decreased the rice yield because of their adverse impacts on the booting and anthesis stage in Asia, especially in Pakistan and China (Zafar et al., 2018 ; Ahmad et al., 2019 ). Similarly, heat stress is a major threat to rice as it decreases the productive tillers, shrinkage of grains, and ultimately grain yield of rice (Wang et al., 2019b ). In Asia, climate change would affect upland rice (10 m ha) and rain-fed lowland rice (>13 million hectares). The projected production of rice and wheat crops by 2030 is presented in Table 1 .
Productivity shock due to climate change and variability on rice and wheat crop production by 2030.
Source: Gouldson et al. ( 2016 ), Asseng et al. ( 2019 ), Chow et al. ( 2019 ), Degani et al. ( 2019 ), Sanz-Cobena et al. ( 2019 ), and Suryadi ( 2020 ).
Minus sign (-) indicates the decrease in productivity while positive sign (+) indicates increase in productivity.
Impact of climate change and variability on livestock
In arid to semi-arid regions, the livestock sector is highly susceptible to increased temperature and reduced precipitation (Downing et al., 2017 ; Balamurugan et al., 2018 ). A temperature range of 10–30°C is comfortable for domestic livestock with a 3–5% reduction in animal feed intake with each degree rise in temperature. Similarly, the lower temperature would increase the requirement feed up to 59%. Moreover, drought and heat stress would drastically affect livestock production under climate change scenarios (Habeeb et al., 2018 ). Climate variability affects the occurrence and transmission of several diseases in livestock. For instance, Rift Valley Fever (RVF) due to an increase in precipitation, and tick-borne diseases (TBDs) due to a rise in temperature, have become epidemics for sheep, goats, cattle, buffalo, and camels (Bett et al., 2019 ). Different breeds of livestock show different responses to higher temperature and scarcity of water. In India, thermal stress has negative impacts on the reproduction traits of animals and ultimately poor growth and high mortality rates of poultry (Balamurugan et al., 2018 ; Chen et al., 2021 ; van Wettere et al., 2021 ). In dry regions of Asia, extreme variability in rainfall and drought stress would cause severe feed scarcity (Arunrat et al., 2018 ). It has been revealed that a high concentration of CO 2 reduces the quality of fodder like the reduction in protein, iron, zinc, and vitamins B1, B2, B5, and B9 (Ebi and Loladze, 2019 ). Future climate scenarios show that the pastures, grasslands, feedstuff quality and quantity, as well as biodiversity would be highly affected. Livestock productivity under future climate scenarios would affect the sustainability of rangelands, their carrying capacity and ecosystem buffering capacity, and grazing management, as well as the alteration in feed choice and emission of greenhouse gases (Nguyen et al., 2019 ).
Impact of climate change on forest
Climate variability has posed several negative impacts on forests including variations in productive traits, carbon dynamics, and vegetation shift, as well as the exhaustion of soil resources along with drought and heat stress in South Asian countries (Jhariya et al., 2019 ; Zhu et al., 2021 ). In Bangladesh, forests are vulnerable to climate variability due to increased risks of fires, rise in sea level, storm surges, coastal erosion and landslides, and ultimately reduction in forest area (Chow et al., 2019 ). Biodiversity protection, carbon sequestration, food, fiber, improvement in water quality, and medicinal products are considered major facilities provided by forests (Chitale et al., 2018 ). In contrast, trait-climate relationships and environmental conditions have drastically influenced structure, distribution, and forest ecology (Keenan, 2015 ). Higher rates of tree mortality and die-off have been induced in forest trees because of high temperature and often-dry events (Allen et al., 2015 ; Greenwood et al., 2017 ; Zhu et al., 2021 ). For instance, trees Sal, pine trees, and Garjan have been threatened by climate-driven continuing forest clearing, habitat alteration, and drought in South Asian countries (Wang et al., 2019). An increase in temperature and CO 2 fertilization has increased insect pest infestation for forest trees in North China (Bao et al., 2019 ). As rising temperature, elevated carbon dioxide (CO 2 ), and fluctuating precipitating patterns lead to the rapid development of insect pests and ultimately more progeny will attack forest trees (Raza et al., 2015 ). Hence, there is a need to develop adaptation strategies to restore forests to meet the increasing demand for food, fiber, and medicines in Asia.
Impact of climate change on aquaculture and fisheries
There is a vast difference in response to climate change scenarios of aquaculture in comparison to terrestrial agriculture due to greater control levels over the production environment under terrestrial agriculture (Ottaviani et al., 2017 ; Southgate and Lucas, 2019 ). Climatic-driven extremes such as drought, flood, cyclones, global warming, ocean acidification, irregular and erratic rainfall, salinity, and sea level rise have negatively affected aquaculture in South Asia (Islam and Haq, 2018 ; Ahmad et al., 2019 ). In Asia, various species such as Hilsa and algae have lost their habitats due to ocean acidification and temperature rise (Jahan et al., 2017 ). Increased water temperature and acidification of terrestrial agriculture have become dangerous for coral reefs and an increase in average temperature by 1°C for four successive weeks can cause bleaching of coral reefs in India and other parts of Asia (Hilmi et al., 2019 ; Lam et al., 2019 ). Ocean warming has caused severe damage to China's marine fisheries (Liang et al., 2018 ). In Pakistan, aquaculture and fisheries have lost their habitat quality, especially fish breeding grounds because of high cyclonic activity, sea level rise, temperature variability, and increased invasion of saline water near Indus Delta (Ali et al., 2019 ). It is revealed that freshwater and brackish aquaculture is susceptible to the negative effects of climate variability in several countries of Asia (Handisyde et al., 2017 ). It is also evaluated that extreme climate variability has deep impacts on wetlands and ultimately aquaculture in India (Sarkar and Borah, 2018 ).
Climate variability and change impact assessment
Agriculture has a complex structure and interactions with different components, which will make it uncertain in a future climate that is a serious risk to food security in the region. Consequently, it is essential to assess the negative impacts of climate change on agricultural productivity and develop adaptive strategies to combat climate change. Simulation models such as General Circulation Models (GCMs) and Representative Concentration Pathways (RCPs) are being used worldwide for the quantification of the negative effects of climate change on agriculture and are supporting the generation of future weather data (Rahman et al., 2018 ). Primary tools are also available that can estimate the negative impacts of changing climate on crop productivity, crucial for both availability and access to food. Crop models have the potential to describe the inside processes of crops by considering the temperature rise and elevated CO 2 at critical crop growth stages (Challinor et al., 2018 ). There are no advanced methods and technologies available to see the impact of climate variability and change on the production of livestock and crops other than the modeling approach (Asseng et al., 2014 ). There are also modeling tools available, and being used across the world, to quantify the impacts of climate change and variability on crops and livestock production (Ewert et al., 2015 ; Hoogenboom et al., 2015 ; Rahman et al., 2019 ). We decided to quantify the impacts of future climate on farmer's livelihood to study the complete agricultural system by adopting the comprehensive methodology of climate, crop, and economic modeling (RAPs) approaches and found the agricultural model inter-comparison and improvement project (AgMIP) as the best approach.
A case study—Agricultural model inter-comparison and improvement project
Impact of climate change on the productivity of rice and wheat crops.
Department for International Development (DFID) developed the Agricultural Model Inter-comparison and Improvement Project (Rosenzweig et al., 2013 ) which is an international collaborative effort to deeply investigate the influences of climate variability and change on crops' productivity in different cropping zones/systems across the world and in Pakistan. The mission of AgMIP is to improve the scientific capabilities for assessing the impact of climate variability on the agricultural production system and develop site-specific adaptation strategies to ensure food security at local to global scales. The review discussed above indicated that the agriculture sector is the most vulnerable due to climatic variability and change. Crop production is under threat in Asian countries—predominantly in developing countries. For instance, Pakistan is also highly vulnerable due to its geographical location with arid to semi-arid environmental conditions (Nasi et al., 2018 ; Ullah et al., 2019 ; Ghaffar et al., 2022 ). There would be impacts that are more adverse in arid and semi-arid regions in comparison to humid regions because of climate change and variability (Nasi et al., 2018 ; Ali et al., 2019 ). Future climate scenarios have uncertainty and the projected scenario of climate, especially precipitation, did not coincide with the production technology of crops (Rahman et al., 2018 ). Floods and drought are anticipated more due to variations in rainfall patterns, and dry seasons are expected to get drier in future. Developing regions of the globe are more sensitive to climate variability and change as these regions implement old technologies whereas developed regions can mediate climate-driven extremes through the implementation of modern technologies (Lybbert and Sumner, 2012 ). The extent of climate change and variability hazards in Pakistan is massive and may be further shocking in the future. Therefore, it is a matter of time to compute climate variability, impacts on crop production, and develop sustainable adaptation strategies to cope with the negative impact of climate change using AgMIP standards and protocols (AgMIP). The main objective is to formulate adaptation strategies to contradict potential climate change effects and support the livelihood of smallholder farmers in the identified area and circulate this particular information to farmers, extension workers, and policy-makers. Sialkot, Sheikhupura, Nankana sahib, Hafizabad, and Gujranwala are considered the hub of the rice-wheat cropping system (Ghaffar et al., 2022 ), with an area of 1.1 million hectares. The rice-wheat cropping system is a food basket and its sustainable productivity in future climates will ensure food security in the country and generally overall in the region.
Methodology of the case study
Field data collection.
Field data included the experimental trials and socio-economic data of 155 successive farmers' farms collected during an extensive survey of rice-wheat cropping zone from five-selected districts ( Figure 5 ). From each district, randomly two villages were selected from each division, randomly 30 respondents and 15 farms of true representation of the farming population from each village considered. Crop management data included all agronomic practices from sowing to harvesting such as planting time, planting density, fertilizers amount and organic matter amendment, irrigation amount and intervals, cultural operations, grain yield, and biomass production collected for both crops, rice and wheat, and overall, for all systems. Farm data for the rice-wheat cropping system were analyzed with crop and economic models to see the impact of climate variability on crop production.

Map of study location/sites in rice-wheat cropping zone of Pakistan.
Historic and future climatic data
Daily historic data was collected from the Pakistan Meteorological Department (PMD) for all study locations. The quality of observed weather data was checked following the protocol of the Agricultural Model Inter-comparison and Improvement Project (AgMIP) protocols (AgMIP, 2013 ). Station-based downscaling was performed with historic weather data from all study sites/locations in the rice-wheat cropping zone. For the zone/region, five GCMs (CCSM4, GFDL-ESM2M, MIROC5, HadGEM2-ES, and MPI-ESM-MR) of the latest CMIP5 family were engaged for the generation of climate projections for the mid-century period using the RCP 8.5 concentration scenario, and using the protocols and methodology developed by AgMIP (Ruane et al., 2013 , 2015 ; Rahman et al., 2018 ). GCMs were selected on the basis of different factors such as better performance in monsoon seasons, the record of accomplishment of publications, and the status of the model-developing institute. Under the RCP 8.5 scenario, an indication of warming ranges 2–3°C might be expected in all selected districts for the five CMIP5, GCMs in comparison to the baseline between the periods of 2040–2069. However, there is no uniform warming recorded under all 5 CMIP5 GCMs. For instance, CCSM4 and GFDL-ESM-2M showed uniform increased temperatures during April and September months. The outputs of the GCMs indicated large variability in the estimated values of precipitation. The HadGEM2-ES and GFDL-ESM2M projected mean of 200 and 100 mm between times 2040–2069, respectively. On average, a minor rise in annual rainfall (mm) is indicated by five GCMs in comparison to the baseline.
Crop models (DSSAT and APSIM)
To understand the agronomic practices and the impact of climate variability on the development and growth of plants, crop simulation models like DSSATv4.6 (Hoogenboom et al., 2015 , 2019 ) and APSIMv7.5 (Keating et al., 2003 ) were applied. Three field trials were conducted on rice and wheat crops during two growing seasons, to collect the data like phenology, crop growth (leaf area index, biomass accumulation), development, yield, and agronomic management data by following the standard procedure and protocols. Crop models are calibrated with experimental field data (phenology, growth, and yield data) under local environmental conditions by using soil and weather data. Crop models were further validated with farmers' field data of rice and wheat crops. Climate variability impact on both crops was assessed with historic data (baseline) and future climate data of mid-century in this region.
Tradeoff analysis model for multi-dimensional impact assessment
For the analysis of climate change impact socio-economic indicators, version 6.0.1 of the Tradeoff Analysis Model for Multi-Dimensional Impact Assessment (TOA-MD) Beta was employed (Antle, 2011 ; Antle et al., 2014 ). It is an economical and standard model employed for the analysis of technology adoption impact assessment and ecosystem services. Schematically illustrated, showing connections between the different models and the points of contact between them in terms of input-output in a different climate, crop and economic models and climate analysis is shown in Figure 6 . Various factors that may affect the anticipated values of the production system are technology, physical environment, social environment, and representative agricultural pathways (RAPs), hence it is necessary to distinguish these factors (Rosenzweig et al., 2013 ). RAPs are the qualitative storylines that can be translated into model parameters such as farm and household size, practices, policy, and production costs. For climate impact assessment, the dimensionality of the analysis is the main threat in scenario design. Farmers employ different systems for operating a base technology. For instance, system 1 included base climate, in system 2, farmers use hybrid climate, and in system 3, farmers use perturbed climate to cope with future climate with adaptation technology. The analysis gave the answer to three core questions (Rosenzweig et al., 2013 ). First, without the application RAPs of the core question, one-climate change impact assessments (CC-IA) were formulated. Second, analysis was again executed for examining the negative effects of climate change on future production systems. Third, analysis was executed for future adapted production systems through RAPs and adaptations. Two crop models, i.e., DSSAT and APSIM, outputs were used as the inputs of TOA-MD. Different statistical analyses like root mean square error (RMSE), mean percentage difference (MPD) d-stat, percent difference (PD), and coefficient of determination (R2) were used to check the accuracy of models.

Schematic illustration showing connections between the different models (climate, crop, and economic) and the points of contact between them in terms of input-output and climate analysis.
Farmers field data validation
Crop model simulation results regarding calibration and validation of both crops (rice and wheat) were in good agreement with the field experimental data. Both models were further validated using farmers' field data of rice and wheat crops in rice-wheat cropping zone after getting robust genetic coefficients. Model validation results of 155 farmers of rice and wheat crops indicated the good accuracy of both models (DSSAT, APSIM) and have a good range of statistical indices. Both of these crop models showed an improved ratio between projected and observed rice yield in farmers' fields with RMSE 409 and 440 kg ha −1 and d-stat 0.80 and 0.78, respectively. Similarly, the performance of models DSSAT and APSIM for a yield of wheat was also predicted with RMSE of 436 and 592 kg ha −1 and d-stat of 0.87, respectively.
Quantification of climate change impact by crop models
Climate change impact assessment results in the rice-wheat cropping zone of 155 farms indicated that yield reduction varied due to differences in GCM's behavior and variability in climatic patterns. It is predicted that mean rice yield reduction would be up to 15 and 17% for DSSAT and APSIM respectively during mid-century while yield reduction variation among GCMs are presented in Figure 7 . Rice indicated a yield decline ranging from 14.5 to 19.3% for the case of APSIM while mean yield reduction of the rice crop was between 8 and 30% with DSSAT. Reduction in production of wheat varied among GCMs as well as an overall reduction in yield in rice-wheat cropping systems. For wheat, with DSSAT would be a 14% reduction whereas for APSIM, the reduction would be 12%. GCMs reduction in wheat yield for midcentury (2040–2069) is shown in Figure 8 . Reduction in wheat yield for all 5 GCMs was from 10.6 to 12.3% in the case of APSIM while mean reduction in wheat yield was between 6.2 and 19%. As rice is a summer crop where the temperature is already high and, according to climate change scenarios, there is an increase in both maximum and minimum temperature, an increase in minimum temperature leads to more reduction in yield as compared to wheat being a winter season crop. It was hypothesized that the increase in night temperature (minimum temperature) leading to more losses in the summer season may be due to high temperature, particularly at anthesis and grain formation stages in rice crops, as it is already an irrigated crop and rainfall variability (more rainfall) cannot reduce the effect of high temperature in the rice yield as compared to the wheat crop.

Reduction in rice yield of APSIM and DSSAT models for 155 farms; variation with 5-GCMs in rice-wheat cropping system of Punjab-Pakistan.

Reduction in wheat yield of APSIM and DSSAT models for 155 farms; variation with 5-GCMs in rice-wheat cropping system of Punjab-Pakistan.
Climate change economic impact assessment and adaptations
Sensitivity of current agricultural production systems to climate change.
Climate change is damaging the present vulnerabilities of poor small farmers as their livelihood depends directly on agriculture. Noting various impacts of future climate (2040–2069) on a current production system (current technologies), we examine the vulnerability of the current production system used for the assessment of the adverse impacts of climate change on crop productivity and other socio-economic factors. Climate change impacts possible outcomes for five GCMs based on the estimation of yield generated by two crop models presented in Table 2 . In Table 3 , and the grain losses and net impacts as a percentage of average net returns for the first core question are given for each GCM. The analysis clearly shows the observed values of the mean yield of wheat and rice, which are estimated to be 18,915 kg and 18,349 kg/ farm respectively in the projected area. For all GCMs, observed average milk production was 3,267 liters per farm with a 12% average decline in yield found under livestock production. Losses were about 69–83% and from 72 to 76% for DSSAT and APSIM respectively as predicted by TOA-MD analysis because of the adverse effects of climate change situations. For DSSAT, percentage losses and gains in average net farm returns were from 13 to 15% and 23 to 30%, respectively. While gains were 14–15% and losses were from 25 to 27%, respectively for APSIM. Without adverse impacts of climate change, a net income of Rs. 0.54 per farm pragmatic was predicted by DSSAT and APSIM. However, DSSAT predicted Rs. 0.42–0.48 M per farm and APSIM predicted Rs. 0.45–0.47 M net income per farm under climate change for all GCMs. An increase in the poverty rate in climate change situations would be 33–38% for DSSAT and it would be 35–37% for APSIM, respectively while the rate of poverty with no adverse impacts of climate change would be 29%.
Relative yield summary of crop models.
r = ∑s2/∑s1, ∑s2, Time averaged mean of simulated future yield; ∑s1, Time averaged mean of simulated past yield.
Aggregated gains and losses with CCSM4 GCM (without adaptation and with trend) of DSSAT and APSIM.
Impacts of climate change on future agricultural production systems
In regard to the second core question, a comparison of system 1 (current climate and future production system) with system 2 (future climate and future production system in mid-century) was analyzed with the aid of TOA-MD using 5 GCMs. Mean wheat and rice yield reduction for DSSAT was from 6.2 to 19% and 8 to 30% respectively, and APSIM indicated a decline ranging from 10.6 to 12.3% and 14 to 19%, respectively. For all analyses of Q2, the projected mean yield was 25,073 kg per farm under rice production. While in the case of livestock for all analyses, the mean projected milk production was 3,267 L/farm with its mean decline in yield estimated to be about 12%. Percentage losses for DSSAT and APSIM would fluctuate between 57 and 70% and from 61 to 71%, respectively for all five GCMs.
Mean net farm returns for gains and losses, as a percentage for DSSAT would be 11–13% and from −16 to −22%, respectively. While the percentage of gains and losses would be between 10 and 15% and −17% and −19% in the case of APSIM, respectively. DSSAT predicted Rs. 89–100 thousand per person while APSIM predicted Rs. 93–97 thousand per person per capita income in changing climatic scenarios. For both crop models, the poverty rate will be 16% without climate change. While poverty rates will be from 17 to 19% in the case of DSSAT and ranging from 18 to 19% for APSIM with climate change ( Table 3 ).
Evaluation of potential adaptation strategies and representative agricultural pathways
Adaptation technologies for rice and wheat crops ( Table 4 ) are used in crop growth models and economic TOA-MD model analysis ( Table 5 ) for simulating the sound effects of prospective adaptation strategies on both adapters and non-adapters distribution. This TOA-MD analysis compared “system 1” (incorporating RAPs) and “system 2” (incorporating RAPs and adapted technology) for the rice-wheat system in the mid-century based on crop models DSSAT and APSIM using 5 GCMs. The mean yield change of wheat and rice crops was from 60 to 72% for DSSAT and 70 to 80% for APSIM respectively, wheat crop indicated a change that ranges from 80 to 89% and 62 to 84% for all five GCMs ( Figure 9 ). Under livestock production, the estimated average production of milk exclusive of adaptation was 3,593 liters/farm for all analyses and for all cases indicates a 42% increase in average yield. The percentage of adopters due to adaptation technologies for DSSAT and APSIM in rice-wheat cropping systems would be between 92 and 93% and 93 and 94%, respectively. For DSSAT and APSIM estimated per head income with adaptation cases will be from Rs. 89 to 100 and 93 to 97 thousand and from Rs. 156 to 174 and 166 to 181 thousand per head, respectively in a year. Without and with adaptation, poverty would range between 17 and 19% and 12 and 13% respectively, for DSSAT and from 18 to 19% and 12 to 13%, respectively for APSIM ( Table 6 ). Climatic changes in the rice-wheat cropping areas of Punjab province will have less impact on the future systems after implementing the adaptation strategies, with a large and significant impact imposed by these adaptations.
Adaptation technology related to crop management used for crop models (DSSAT and PSIM) to cope with the negative impacts of climate change during mid-century (2040–2069).
Percentage change (% change) shows the percentage of farmers using the crop management practices related to crop models to reduce the adverse effects of climate change.
Adaptation technology related to socioeconomic used for crop models (DSSAT and APSIM) to cope with the negative impacts of climate change during mid-century (2040–2069).
Percentage change (% change) shows the percentage of farmers using the socioeconomic technology related to crop models to reduce the adverse effects of climate change.

Distribution of adopters and non-adopters for all 5 GCMs (with adaptation and with trend). The percentage of adopters due to adaptation technologies for DSSAT and APSIM in rice-wheat cropping system would be between 92 and 93% and 93 and 94%, respectively. For DSSAT and APSIM estimated per head income with adaptation cases will be from Rs. 89 to 100 and 93 to 97 thousand and from Rs. 156 to 174 and 166 to 181 thousand per head respectively in a year.
Projected adoption of adaptation package used in crop models for CCSM4 GCM during mid-century.
Opportunities in the era of climate change for agriculture
Scope of adaptation and mitigation strategies for sustainable agricultural production.
It is essential to assess the impact of climate variability on agricultural productivity and develop adaptation strategies/technology to cope with the negative effects to ensure sustainable production. The hazardous climate change effects can be reduced by adapting climate-smart and resilient agricultural practices, which will ensure food security and sustainable agricultural production (Zafar et al., 2018 ; Ahmad et al., 2019 ; Ahmed et al., 2019b ). Adaptation is the best way to handle climate variability and change as it has the potential to minimize hazardous climate change effects for sustainable production (IPCC, 2019 ). Innovative technologies and defensive adaptation can reduce the uncertain and harmful effects of climate on agricultural productivity.
Therefore, to survive the harmful climate change effects, the development and implementation of adaptation strategies are crucial. In developing countries, poverty, food insecurity and declined agricultural productivity are common issues, which indicate the need for mitigation and adaptation measures to sustain productivity (Clair and Lynch, 2010 ; Lybbert and Sumner, 2012 ; Mbow et al., 2014 ). At the national and regional level, the insurance of food security is the major criterion for the effectiveness of mitigation and adaptation. Integration of adaptation and mitigation strategies is a great challenge to promote sustainability and productivity. Climate resilient agricultural production systems can be developed and diversified with the integration of land, water, forest biodiversity, livestock, and aquaculture (Hanjra and Qureshi, 2010 ; Meena et al., 2019 ). Summary and overview of all below discussed potential opportunities are presented in Figure 10 .

Overview of opportunities including adaptations and mitigations strategies for sustainable agriculture production system in Asia.
Reduction in GHGs emission
Reduction in GHGs emissions from agriculture under marginal conditions and production of more food are the major challenges for the development of adaptation and mitigation measures (Smith and Olesen, 2010 ; Garnett, 2011 ; Fujimori et al., 2021 ). Similarly, it is an immediate need to control such practices in agriculture which lead to GHGs emissions, i.e., N 2 O emissions from the application of chemical fertilizers, and CH 4 emissions from livestock and rice production systems (Herrero et al., 2016 ; Allen et al., 2020 ). Similarly, alternate wetting and drying and rice intensification are important to reduce the GHGs emission from rice crops (Nasir et al., 2020 ). Carbon can be restored in soil by minimizing the tillage, reducing soil erosions, managing the acidity of the soil, and implementing crop rotation. By increasing grazing duration and rotational grazing of pastureland, sequestration of carbon can be achieved (Runkle et al., 2018 ). About 0.15 gigatonnes of CO 2 equal to the amount of CO 2 produced in 1 year globally, can be sequestered by adopting appropriate grazing measures (Henderson et al., 2015 ). Development of climate-resilient breeds of animals and plants with higher growth rates and lower GHGs emissions should be developed to survive under harsh climatic conditions. Focus further on innovative research and development for the development of climate-resilient breeds, especially for livestock (Thornton and Herrero, 2010 ; Henry et al., 2012 ; Phand and Pankaj, 2021 ).
Application of ICT and decision support system
To mitigate and adapt to the drastic effects of climate variability and change, information and communication technologies (ICTs) can also play a significant role by promoting green technologies and less energy-consuming technology (Zanamwe and Okunoye, 2013 ; Shafiq et al., 2014 ; Nizam et al., 2020 ). Timely provision of information from early warning systems (EWS) and automatic weather stations (AWS) on drought, floods, seasonal variability, and changing rainfall patterns can provide early warning about natural disasters and preventive measures (Meera et al., 2012 ; Imam et al., 2017 ), and it can also support farmers' efforts to minimize harmful effects on the ecosystems. Geographical information systems (GIS), wireless sensor networks (WSN), mobile technology (MT), web-based applications, satellite technology and UAV can be used to mitigate and adapt to the adverse effects of climate change (Kalas, 2009 ; Karanasios, 2011 ). Application of different climate, crop, and economic models may also help reduce the adverse effects of climate variability and change on crop production (Hoogenboom et al., 2011 , 2015 , 2019 ; Ewert et al., 2015 ).
Crop management and cropping system adaptations
Adaptation strategies have the potential to minimize the negative effect of climate variability by conserving water through changes in irrigation amount, timely application of irrigation water, and reliable water harvesting and conservation techniques (Zanamwe and Okunoye, 2013 ; Paricha et al., 2017 ). Crop-specific management practices like altering the sowing times (Meena et al., 2019 ), crop rotation, intercropping (Hassen et al., 2017 ; Moreira et al., 2018 ), and crop diversification and intensification have a significant positive contribution as adaptation strategies (Hisano et al., 2018 ; Degani et al., 2019 ). Meanwhile, replacement of fossil fuels by introducing new energy crops for sustainable production (Ruane et al., 2013 ) is also crucial for the sustainability of the system. Different kinds of adaptation actions (soil, water, and crop conservation, and well farm management) should be adapted in case of long-term increasing climate change and variability (Williams et al., 2019 ). Similarly, alteration in input use, changing fertilizer rates for increasing the quantity and quality of the produce, and introduction of drought resistant cultivars are some of the crucial adaptation approaches for sustainable production. Therefore, under uncertain environmental conditions, to ensure sustainable productivity, crops having climatic resilient genetic traits should also be introduced (Bailey-Serres et al., 2018 ; Raman et al., 2019 ). Similarly, to ensure the sound livelihood of farmers, it is important to develop resilient crop management as well as risk mitigation strategies.
Opportunities for a sustainable livestock production system
The integration of crop production, rearing of livestock and combined use of rice fields for both rice and fish production lead to enhancing the farmers' income through diversified farming (Alexander et al., 2018 ; Poonam et al., 2019 ). Similarly, variations in pasture rates and their rotation, alteration in grazing times, animal and forage species variation, and combination production of both crops and livestock are the activities related to livestock adaptation strategies (Kurukulasuriya and Rosenthal, 2003 ; Havlik et al., 2013 ). Under changing climate scenarios, sustainable production of livestock should coincide with supplementary feeds, management of livestock with a balanced diet, improved waste management methods, and integration with agroforestry (Thornton and Herrero, 2010 ; Renaudeau et al., 2012 ).
Carbon sequestration and soil management
Selection of more drought-resilient genotypes and combined plantation of hardwood and softwood species (Douglas-fir to species) are considered adaptive changes in forest management under future climate change scenarios (Kolstrom et al., 2011 ; Hashida and Lewis, 2019 ). Similarly, timber growth and harvesting patterns should be linked with rotation periods, and plantation in landscape patterns to reduce shifting and fire of forest tree species under climate-smart conditions for forest management to increase rural families' income for a sustainable agricultural ecosystem (Scherr et al., 2012 ). Although, conventional mitigation methods for the agriculture sector have a pivotal role in forest related strategies, some important measures are also included in which afforestation and reforestation should be increased but degradation and deforestation should be reduced and carbon sequestration can be increased (Spittlehouse, 2005 ; Seddon et al., 2018 ; Arehart et al., 2021 ). Carbon stock enhanced the carbon density of forest and wood products through longer rotation lengths and sustainable forest management (Rana et al., 2017 ; Sangareswari et al., 2018 ). Climate change impacts are reduced through adaptation strategies in agroforestry including tree cover outside the forests, increasing forest carbon stocks, conserving biodiversity, and reducing risks by maintaining soil health sustainability (Mbow et al., 2014 ; Dubey et al., 2019 ). Similarly, climate-smart soil management practices like reduction in grazing intensity, rotation-wise grazing, the inclusion of cover and legumes crops, agroforestry and conservation tillage, and organic amendments should also be promoted to enhance the carbon and nitrogen stocks in soil (Lal, 2007 ; Pineiro et al., 2010 ; Xiong et al., 2016 ; Garcia-Franco et al., 2018 ).
Opportunities for fisheries and aquaculture
Sustainable economic productivity of fisheries and aquaculture requires the adaptation of specific strategies, which leads to minimizing the risks at a small scale (Hanich et al., 2018 ). Therefore, to build up the adaptive capacity of poor rural farmers, measures should be carried out by identifying those areas where local production gets a positive response from variations in climatic conditions (Dagar and Minhas, 2016 ; Karmakar et al., 2018 ). Meanwhile, the need to build the climate-smart capacity of rural populations and other regions to mitigate the harmful impacts of climate change should be recognized. In areas which have flooded conditions and surplus water, the integration of aquaculture with agriculture in these areas provides greater advantages to saline soils through newly adapted aquaculture strategies, i.e, agroforestry (Ahmed et al., 2014 ; Dagar and Yadav, 2017 ; Suryadi, 2020 ). To enhance the food security and living standards of poor rural families, aquaculture and artificial stocking engage the water storage and irrigation structure (Prein, 2002 ; Ogello et al., 2013 ). In Asia, rice productivity is increased by providing nutrients by adapting rice-fish culture in which fish concertedly consume the rice stem borer (Poonam et al., 2019 ). Food productivity can be enhanced by the integration of pond fish culture with crop-livestock systems because it includes the utilization of residues from different systems (Prein, 2002 ; Ahmed et al., 2014 ; Dagar and Yadav, 2017 ; Garlock et al., 2022 ). It is important to compete with future challenges in the system by developing new strains which withstand high levels of salinity and poorer quality of water (Kataria and Verma, 2018 ; Lam et al., 2019 ).
Globally, and particularly in developing nations, variability in climatic patterns due to increased anthropogenic activity has become clear. Asia may face many problems because of changing climate, particularly in South Asian countries due to greater population, geographical location, and undeveloped technologies. The increased seasonal temperature would affect agricultural productivity adversely. Crop growth models with the assistance of climatic and economic models are helpful tools to predict climate change impacts and to formulate adaptation strategies. To respond to the adverse effects of climate change, sustainable productivity under climate-smart and resilient agriculture would be achieved by developing adaptation and mitigation strategies. AgMIP-Pakistan is a good specimen of climate-smart agriculture that would ensure crop productivity in changing climate. It is a multi-disciplinary plan of study for climate change impact assessment and development of the site and crop-specific adaptation technology to ensure food security. Adaptation technology, by modifications in crop management like sowing time and density, and nitrogen and irrigation application has the potential to enhance the overall productivity and profitability under climate change scenarios. The adaptive technology of the rice-wheat cropping system can be implemented in other regions in Asia with similar environmental conditions for sustainable crop production to ensure food security. Early warning systems and trans-disciplinary research across countries are needed to alleviate the harmful effects of climate change in vulnerable regions of Asia. Opportunities as discussed have the potential to minimize the negative effect of climate variability and change. This may include the promotion of agroforestry and mixed livestock and cropping systems, climate-smart water, soil, and energy-related technologies, climate resilient breeds for crops and livestock, and carbon sequestration to help enhance production under climate change. Similarly, the application of ICT-based technologies, EWS, AWS, and decision support systems for decision-making, precision water and nutrient management technologies, and crop insurance may be helpful for sustainable production and food security under climate change.
Author contributions
AA, MH-u-R, and AR: conceptualization, validation, and formal analysis. MH-u-R, SAh, AB, WN, AE, HA, KH, AA, FM, YA, and MH: methodology, editing, supervision, and project administration. Initial draft was prepared by MH-u-R and improved and read by all co-authors. All authors contributed to the article and approved the submitted version.
This research funded by the Deputyship for Research and Innovation, Ministry of Education in Saudi Arabia under grant number (IFPRP: 530-130-1442).
Conflict of interest
The authors declare that the research was conducted in the absence of any commercial or financial relationships that could be construed as a potential conflict of interest.
Publisher's note
All claims expressed in this article are solely those of the authors and do not necessarily represent those of their affiliated organizations, or those of the publisher, the editors and the reviewers. Any product that may be evaluated in this article, or claim that may be made by its manufacturer, is not guaranteed or endorsed by the publisher.
Acknowledgments
The authors extend their appreciation to Deputyship for Research & Innovation, Ministry of Education in Saudi Arabia for funding this research work through the project number (IFPRP: 530-130-1442) and King Abdulaziz University, DSR, Jeddah, Saudi Arabia.
- Adhikari S., Keshav C. A., Barlaya G., Rathod R., Mandal R. N., Ikmail S., et al.. (2018). Adaptation and mitigation strategies of climate change impact in freshwater aquaculture in some states of India . J. Fisheries Sci . 12 , 16–21. 10.21767/1307-234X.1000142 [ CrossRef ] [ Google Scholar ]
- AgMIP (2013). The Coordinated Climate-Crop Modeling Project C3MP: An Initiative of the Agricultural Model Inter Comparison and Improvement Project. C3 MP Protocols and Procedures . London. [ Google Scholar ]
- Ahmad S., Abbas G., Ahmed M., Fatima Z., Anjum M. A., Rasul G., et al.. (2019). Climate warming and management impact on the change of phenology of the rice-wheat cropping system in Punjab, Pakistan . Field Crops Res . 230 , 46–61. 10.1016/j.fcr.2018.10.008 [ CrossRef ] [ Google Scholar ]
- Ahmed A. U., Appadurai A. N., Neelormi S. (2019a). Status of climate change adaptation in South Asia region . Status Climate Change Adapt. Asia Pacific 18 , 125–152. 10.1007/978-3-319-99347-8_7 [ CrossRef ] [ Google Scholar ]
- Ahmed N., Thompson S., Glaser M. (2019b). Global aquaculture productivity, environmental sustainability, and climate change adaptability . Environ. Manage . 63 , 159–172. 10.1007/s00267-018-1117-3 [ PubMed ] [ CrossRef ] [ Google Scholar ]
- Ahmed N., Ward J. D., Saint C. P. (2014). Can integrated aquaculture-agriculture (IAA) produce “more crop per drop” . Food Sec . 6 , 767–779. 10.1007/s12571-014-0394-9 [ CrossRef ] [ Google Scholar ]
- Alexander K. S., Parry L., Thammavong P., Sacklokham S., Pasouvang S., Connell J. G., et al.. (2018). Rice farming systems in Southern Lao PDR: interpreting farmers' agricultural production decisions using Q methodology . Agric. Sys . 160 , 1–10. 10.1016/j.agsy.2017.10.018 [ CrossRef ] [ Google Scholar ]
- Ali S., Eum H. I., Cho J., Dan L., Khan F., Dairaku K., et al.. (2019). Assessment of climate extremes in future projections downscaled by multiple statistical downscaling methods over Pakistan . Atmos. Res . 222 , 114–133. 10.1016/j.atmosres.2019.02.009 [ CrossRef ] [ Google Scholar ]
- Allen C. D., Breshears D. D., McDowellm N. G. (2015). On underestimation of global vulnerability to tree mortality and forest die-off from hotter drought in the Anthropocene . Ecosphere . 6 , 1–55. 10.1890/ES15-00203.1 [ CrossRef ] [ Google Scholar ]
- Allen J., Pascual K. S., Romasanta R. R., Van Trinh M., Van Thach T., Van Hung N., et al.. (2020). Rice straw management effects on greenhouse gas emissions and mitigation options . Sustain. Rice Straw Manag. 9 , 145–159. 10.1007/978-3-030-32373-8_9 [ CrossRef ] [ Google Scholar ]
- Antle J. M. (2011). Parsimonious multi-dimensional impact assessment . Am. J. Agric. Econ . 93 , 1292–1311. 10.1093/ajae/aar052 [ CrossRef ] [ Google Scholar ]
- Antle J. M., Stoorvogel J. J., Valdivia R. O. (2014). New parsimonious simulation methods and tools to assess futurefood and environmental security of farm populations . Philos. Trans. Soc. Biol. Sci . 369 , 2012–2028. 10.1098/rstb.2012.0280 [ PMC free article ] [ PubMed ] [ CrossRef ] [ Google Scholar ]
- Arehart J. H., Hart J., Pomponi F., D'Amico B. (2021). Carbon sequestration and storage in the built environment . Sustain. Prod. Consum . 27 , 1047–1063. 10.1016/j.spc.2021.02.028 [ CrossRef ] [ Google Scholar ]
- Arunrat N., Pumijumnong N., Hatano R. (2018). Predicting local-scale impact of climate change on rice yield and soil organic carbon sequestration: a case study in Roi Et Province, Northeast Thailand . Agric. Sys . 164 , 58–70. 10.1016/j.agsy.2018.04.001 [ CrossRef ] [ Google Scholar ]
- Aryal J. P., Sapkota T. B., Khurana R., Khatri-Chhetri A., Jat M. L. (2019). Climate change and agriculture in South Asia: adaptation options in smallholder production systems . Environ. Develop. Sustain . 20 , 1–31. 10.1007/s10668-019-00414-4 [ CrossRef ] [ Google Scholar ]
- Asseng S., Ewert F., Martre P., Rotter R. P. (2014). Rising temperatures reduce global wheat production . Nat. Climate Change 5 , 143–147. 10.1038/nclimate2470 [ CrossRef ] [ Google Scholar ]
- Asseng S., Martre P., Maiorano A., Rotter R. P., O'leary G. J., Fitzgerald G. J., et al.. (2019). Climate change impact and adaptation for wheat protein . Glob. Change Biol . 64 , 155–173. 10.1111/gcb.14481 [ PubMed ] [ CrossRef ] [ Google Scholar ]
- Azad N., Behmanesh J., Rezaverdinejad V., Tayfeh R. H. (2018). Climate change impacts modeling on winter wheat yield under full and deficit irrigation in Myandoab-Iran . Arch. Agron. Soil Sci . 64 , 731–746. 10.1080/03650340.2017.1373187 [ CrossRef ] [ Google Scholar ]
- Bailey-Serres J., Parker J. E., Ainsworth E. A., Oldroyd G. E., Schroeder J. I. (2018). Genetic strategies for improving crop yields . Nature 575 , 109–118. 10.1038/s41586-019-1679-0 [ PMC free article ] [ PubMed ] [ CrossRef ] [ Google Scholar ]
- Balamurugan B., Tejaswi V., Priya K., Sasikala R., Karuthadurai T., Ramamoorthy M., et al.. (2018). Effect of global warming on livestock production and reproduction: an overview . Res. Rev . 6 , 12–18. [ Google Scholar ]
- Bao Y., Wang F., Tong S., Na L., Han A., Zhang J., et al.. (2019). Effect of drought on outbreaks of major forest pests, pine caterpillars ( Dendrolimus spp.), in Shandong Province, China . Forests 10 , 264–272. 10.3390/f10030264 [ CrossRef ] [ Google Scholar ]
- Bett B., Lindahl J., Delia G. (2019). Climate change and infectious livestock diseases: the case of Rift Valley fever and tick-borne diseases . Climate Smart Agri. Pap . 3 , 29–37. 10.1007/978-3-319-92798-5_3 [ CrossRef ] [ Google Scholar ]
- Bheemanahalli R., Vennam R. R., Ramamoorthy P., Reddy K. R. (2022). Effects of post-flowering heat and drought stresses on physiology, yield, and quality in maize ( Zea mays L.). Plant Stress 2022, 100106. 10.1016/j.stress.2022.100106 [ CrossRef ] [ Google Scholar ]
- Boonwichai S., Shrestha S., Babel M. S., Weesakul S., Datta A. (2019). Evaluation of climate change impacts and adaptation strategies on rainfed rice production in Songkhram River Basin, Thailand . Sci. Total Environ . 652 , 189–201. 10.1016/j.scitotenv.2018.10.201 [ PubMed ] [ CrossRef ] [ Google Scholar ]
- Cai Y., Bandara J. S., Newth D. A. (2016). Framework for integrated assessment of food production economics in South Asia under climate change . Environ. Model. Software 75 , 459–497. 10.1016/j.envsoft.2015.10.024 [ CrossRef ] [ Google Scholar ]
- Challinor A. J., Muller C., Asseng S., Deva C., Nicklin K. J., Wallach D., et al.. (2018). Improving the use of crop models for risk assessment and climate change adaptation . Agric. Sys . 159 , 296–306. 10.1016/j.agsy.2017.07.010 [ PMC free article ] [ PubMed ] [ CrossRef ] [ Google Scholar ]
- Chen H., Liang Z., Liu Y., Jiang Q., Xie S. (2018). Effects of drought and flood on crop production in China across 1949–2015: spatial heterogeneity analysis with Bayesian hierarchical modeling . Natural Hazards 92 , 525–541. 10.1007/s11069-018-3216-0 [ CrossRef ] [ Google Scholar ]
- Chen S., Yong Y., Ju X. (2021). Effect of heat stress on growth and production performance of livestock and poultry: mechanism to prevention . J. Thermal Biol . 99, 103019. 10.1016/j.jtherbio.2021.103019 [ PubMed ] [ CrossRef ] [ Google Scholar ]
- Chitale V., Silwal R., Matin M. (2018). Assessing the impacts of climate change on distribution of major non-timber forest plants in Chitwan Annapurna Landscape, Nepal . Resources 4 , 7–66. 10.3390/resources7040066 [ CrossRef ] [ Google Scholar ]
- Chow J., Khanom T., Hossain R., Khadim J. (2019). Forest management for climate change adaptation in Bangladesh . Confront. Climate Change Bangladesh 2 , 39–50. 10.1007/978-3-030-05237-9_4 [ CrossRef ] [ Google Scholar ]
- Chun J. A., Li S., Wang Q., Lee W. S., Lee E. J., Horstmann N., et al.. (2016). Assessing rice productivity and adaptation strategies for Southeast Asia under climate change through multi-scale crop modeling . Agric. Sys . 143 , 14–21. 10.1016/j.agsy.2015.12.001 [ CrossRef ] [ Google Scholar ]
- Clair S. B. S., Lynch J. P. (2010). The opening of Pandora's Box: climate change impacts on soil fertility and crop nutrition in developing countries . Plant Soil . 335 , 101–115. 10.1007/s11104-010-0328-z [ CrossRef ] [ Google Scholar ]
- Dagar J. C., Minhas P. S. (2016). Saline irrigation for productive agroforestry systems ,> in Agroforestry for the Management of Waterlogged Saline Soils and Poor-Quality Waters, Advances in Agroforestry , eds J. C. Dagar and P. S. Minhas (New Delhi: Springer), 13 , 145–161. 10.1007/978-81-322-2659-8_9 [ CrossRef ] [ Google Scholar ]
- Dagar J. C., Yadav R. K. (2017). Climate resilient approaches for enhancing productivity of saline agriculture . J. Soil Salinity Water Qual . 9 , 9–21. [ Google Scholar ]
- Das S. K. (2018). Impact of climate change (heat stress) on livestock: adaptation and mitigation strategies for sustainable production . Agric. Rev . 39 , 35–42. 10.18805/ag.R-1777 [ CrossRef ] [ Google Scholar ]
- De Zoysa M., Inoue M. (2014). Climate change impacts, agro-forestry adaptation and policy environment in Sri Lanka . Open J. Forest . 28 , 400–439. 10.4236/ojf.2014.45049 [ CrossRef ] [ Google Scholar ]
- Degani E., Leigh S. G., Barber H. M., Jones H. E., Lukac M., Sutton P., et al.. (2019). Crop rotations in a climate change scenario: short-term effects of crop diversity on resilience and ecosystem service provision under drought . Agric. Ecosys. Environ . 285, 106625. 10.1016/j.agee.2019.106625 [ CrossRef ] [ Google Scholar ]
- Din M. S. U., Mubeen M., Hussain S., Ahmad A., Hussain N., Ali M. A., et al.. (2022). World nations priorities on climate change and food security ,> in Building Climate Resilience in Agriculture (Cham: Springer; ), 365–384. 10.1007/978-3-030-79408-8_22 [ CrossRef ] [ Google Scholar ]
- Downing M. M. R., Nejadhashemi A. P., Harrigan T., Woznicki S. A. (2017). Climate change and livestock: impacts, adaptation, and mitigation . Climate Risk Manag . 16 , 145–163. 10.1016/j.crm.2017.02.001 [ CrossRef ] [ Google Scholar ]
- Dubey A., Malla M. A., Khan F., Chowdhary K., Yadav S., Kumar A., et al.. (2019). Soil microbiome: a key player for conservation of soil health under changing climate . Biodive. Conserv . 28 , 2405–2429. 10.1007/s10531-019-01760-5 [ CrossRef ] [ Google Scholar ]
- Ebi K. L., Loladze I. (2019). Elevated atmospheric CO 2 concentrations and climate change will affect our food's quality and quantity . Lancet Planetary Health 3 , 283–284. 10.1016/S2542-5196(19)30108-1 [ PubMed ] [ CrossRef ] [ Google Scholar ]
- Ewert F., Rötter R. P., Bindi M., Webber H., Trnka M., Kersebaum K. C., et al.. (2015). Crop modelling for integrated assessment of risk to food production from climate change . Environ. Model Soft . 26 , 287–303. 10.1016/j.envsoft.2014.12.003 [ CrossRef ] [ Google Scholar ]
- Fahad S., Bajwa A. A., Nazir U., Anjum S. A., Farooq A., Zohaib A., et al.. (2017). Crop production under drought and heat stress: plant responses and management options . Fron. Plant Sci . 9, 1147. 10.3389/fpls.2017.01147 [ PMC free article ] [ PubMed ] [ CrossRef ] [ Google Scholar ]
- FAO (2016). The Impact of Disasters on Agriculture: Addressing the Information Gap . Rome, 19. [ Google Scholar ]
- FAO IFAD, and WFP. (2015). The State of Food Insecurity in the World: Meeting the 2015 International Hunger Targets: Taking Stock of Uneven Progress. FAO, IFAD and WFP . Rome: FAO. [ PMC free article ] [ PubMed ] [ Google Scholar ]
- Fujimori S., Wu W., Doelman J., Frank S., Hristov J., Kyle P., et al.. (2021). Impacts of GHG Emissions Abatement Measures on Agricultural Market and Food Security (London: Nature Food; ). 10.21203/rs.3.rs-128167/v1 [ CrossRef ] [ Google Scholar ]
- Garcia-Franco N., Hobley E., Hübner R., Wiesmeier M. (2018). Climate-smart soil management in semiarid regions . Soil Manag. Climate Change 12 , 349–368. 10.1016/B978-0-12-812128-3.00023-9 [ CrossRef ] [ Google Scholar ]
- Garlock T., Asche F., Anderson J., Ceballos-Concha A., Love D. C., Osmundsen T. C., et al.. (2022). Aquaculture: the missing contributor in the food security agenda . Global Food Sec . 32, 100620. 10.1016/j.gfs.2022.100620 [ CrossRef ] [ Google Scholar ]
- Garnett T. (2011). Where are the best opportunities for reducing greenhouse gas emissions in the food system (including the food chain)? Food Policy 36 , S23–S32. 10.1016/j.foodpol.2010.10.010 [ CrossRef ] [ Google Scholar ]
- Geng X., Wang F., Ren W., Hao Z. (2019). Climate change impacts on winter wheat yield in Northern China . Adv. Meteorol . 4 , 11–12. 10.1155/2019/2767018 [ CrossRef ] [ Google Scholar ]
- Ghaffar A., Habib M. H. R., Ahmad S., Ahmad I., Khan M. A., Hussain J., et al.. (2022). Adaptations in Cropping System and Pattern for Sustainable Crops Production under Climate Change Scenarios . (Boca Raton, FL: CRC Press), 10. 10.1201/9781003286417-1 [ CrossRef ] [ Google Scholar ]
- Gouldson A., Colenbrander S., Sudmant A., Papargyropoulou E., Kerr N., McAnulla F., et al.. (2016). Cities and climate change mitigation: economic opportunities and governance challenges in Asia . Cities 54 , 11–19. 10.1016/j.cities.2015.10.010 [ CrossRef ] [ Google Scholar ]
- Greenwood S., Ruiz-Benito P., Martinez-Vilalta J., Lloret F., Kitzberger T., Allen C. D., et al.. (2017). Tree mortality across biomes is promoted by drought intensity, lower wood density and higher specific leaf area . Ecol. Lett . 20 , 539–553. 10.1111/ele.12748 [ PubMed ] [ CrossRef ] [ Google Scholar ]
- Guo H., Bao A., Ndayisaba F., Liu T., Jiapaer G., El-Tantawi A. M., et al.. (2018). Space-time characterization of drought events and their impacts on vegetation in Central Asia . J. Hydrol . 564 , 1165–1178. 10.1016/j.jhydrol.2018.07.081 [ CrossRef ] [ Google Scholar ]
- Habeeb A. A., Gad A. E., Atta A. M. (2018). Temperature-humidity indices as indicators to heat stress of climatic conditions with relation to production and reproduction of farm animals . Int. J. Biotechnol. Recent Adv . 1 , 35–50. 10.18689/ijbr-1000107 [ CrossRef ] [ Google Scholar ]
- Handisyde N., Telfer T. C., Ross L. G. (2017). Vulnerability of aquaculture-related livelihoods to changing climate at the global scale . Fish Fisheries 18 , 466–488. 10.1111/faf.12186 [ CrossRef ] [ Google Scholar ]
- Hanich Q., Wabnitz C. C., Ota Y., Amos M., Donato-Hunt C., Hunt A. (2018). Small-scale fisheries under climate change in the Pacific Islands region . Mar. Policy 88 , 279–284. 10.1016/j.marpol.2017.11.011 [ CrossRef ] [ Google Scholar ]
- Hanjra M. A., Qureshi M. E. (2010). Global water crisis and future food security in an era of climate change . Food Policy . 35 , 365–377. 10.1016/j.foodpol.2010.05.006 [ CrossRef ] [ Google Scholar ]
- Hashida Y., Lewis D. J. (2019). The intersection between climate adaptation, mitigation, and natural resources: an empirical analysis of forest management . J. Asso. Environ. Res. Econo . 18 , 6893–6926. 10.1086/704517 [ CrossRef ] [ Google Scholar ]
- Hasnat G. T., Kabir M. A., Hossain M. A. (2019). Major environmental issues and problems of South Asia, Particularly Bangladesh . Handb. Environ. Mater. Manag . 7 , 109–148. 10.1007/978-3-319-73645-7_7 [ CrossRef ] [ Google Scholar ]
- Hassen A., Talore D. G., Tesfamariam E. H., Friend M. A., Mpanza T. D. E. (2017). Potential use of forage-legume intercropping technologies to adapt to climate-change impacts on mixed crop-livestock systems in Africa: a review . Regional Environ. Change 68 , 1713–1724 10.1007/s10113-017-1131-7 [ CrossRef ] [ Google Scholar ]
- Havlik P., Valin H., Mosnier A., Obersteiner M., Baker J. S., Herrero M., et al.. (2013). Crop productivity and the global livestock sector: implications for land use change and greenhouse gas emissions . Am. J. Agric. Econ . 95 , 442–448. 10.1093/ajae/aas085 [ CrossRef ] [ Google Scholar ]
- Henderson B. B., Gerber P. J., Hilinski T. E., Falcucci A., Ojima D. S., Salvatore M., et al.. (2015). Greenhouse gas mitigation potential of the world's grazing lands: modeling soil carbon and nitrogen fluxes of mitigation practices . Agric. Ecosyst. Environ . 207 , 91–100. 10.1016/j.agee.2015.03.029 [ CrossRef ] [ Google Scholar ]
- Henry B., Charmley E., Eckard R., Gaughan J. B., Hegarty R. (2012). Livestock production in a changing climate: adaptation and mitigation research in Australia . Crop Pasture Sci . 63 , 191–202. 10.1071/CP11169 [ CrossRef ] [ Google Scholar ]
- Herrero M., Henderson B., Havlik P., Thornton P. K., Conant R. T., Smith P., et al.. (2016). Greenhouse gas mitigation potentials in the livestock sector . Nat. Climate Change 6 , 452–461. 10.1038/nclimate2925 [ CrossRef ] [ Google Scholar ]
- Hilmi N., Osborn D., Acar S., Bambridge T., Chlous F., Cinar M., et al.. (2019). Socio-economic tools to mitigate the impacts of ocean acidification on economies and communities reliant on coral reefs–a framework for prioritization . Reg. Stud. Mar. Sci . 100 , 559–566. 10.1016/j.rsma.2019.100559 [ CrossRef ] [ Google Scholar ]
- Hisano M., Searle E. B., Chen H. Y. (2018). Biodiversity as a solution to mitigate climate change impacts on the functioning of forest ecosystems . Biol. Rev . 93 , 439–456. 10.1111/brv.12351 [ PubMed ] [ CrossRef ] [ Google Scholar ]
- Hoogenboom G., Jones J. W., Wilkens P. W., Porter C. H., Boote K. J., Hunt L. A., et al.. (2011). Decision Support System for Agro-Technology System Transfer, Version 4.5 (CD-ROM). Honolulu: University of Hawaii, 69–77. [ Google Scholar ]
- Hoogenboom G., Jones J. W., Wilkens P. W., Porter C. H., Boote K. J., Hunt L. A., et al.. (2015). Decision Support System for Agrotechnology Transfer (DSSAT). Version 4.6 . Prosser, WA: DSSAT Foundation. [ Google Scholar ]
- Hoogenboom G., Porter C. H., Shelia V., Boote K. J., Singh U., White J. W., et al.. (2019). Decision Support System for Agrotechnology Transfer (DSSAT) Version 4.7.5.0 ( www.DSSAT.net ) . Gainesville, FL: DSSAT Foundation. [ Google Scholar ]
- Hussain J., Khaliq T., Ahmad A., Akhter J., Asseng S. (2018). Wheat responses to climate change and its adaptations: a focus on arid and semi-arid environment . Int. J. Environ. Res . 12 , 117–126. 10.1007/s41742-018-0074-2 [ CrossRef ] [ Google Scholar ]
- Hussein H. A. A., Alshammari S. O., Kenawy S. K., Elkady F. M., Badawy A. A. (2022). Grain-priming with L-arginine improves the growth performance of wheat ( Triticum aestivum L.) plants under drought stress . Plants 11 , 1219. 10.3390/plants11091219 [ PMC free article ] [ PubMed ] [ CrossRef ] [ Google Scholar ]
- Iannella M., De Simone W., D'Alessandro P., Biondi M. (2021). Climate change favours connectivity between virus-bearing pest and rice cultivations in sub-Saharan Africa, depressing local economies . PeerJ . 9, e12387. 10.7717/peerj.12387 [ PMC free article ] [ PubMed ] [ CrossRef ] [ Google Scholar ]
- Imam N., Hossain M. K., Saha T. R. (2017). Potentials and challenges of using ICT for climate change adaptation: a study of vulnerable community in riverine islands of bangladesh ,> in Catalyzing Development Through ICT Adoption , eds H. Kaur, E. Lechman, and A. Marszk (Cham: Springer; ), 89–110. 10.1007/978-3-319-56523-1_7 [ CrossRef ] [ Google Scholar ]
- IPCC (2019). Global warming of 1.5 ° C. Summary for Policy Makers. Switzerland: World Meteorological Organization, United Nations Environment Program, and Intergovernmental Panel on Climate Change . Bern. [ Google Scholar ]
- Iqbal N., Sehar Z., Fatma M., Umar S., Sofo A., Khan N. A. (2022). Nitric oxide and abscisic acid mediate heat stress tolerance through regulation of osmolytes and antioxidants to protect photosynthesis and growth in wheat plants . Antioxidants 11 , 372. 10.3390/antiox11020372 [ PMC free article ] [ PubMed ] [ CrossRef ] [ Google Scholar ]
- Islam M. S., Haq M. E. (2018). Vulnerability of aquaculture-based fish production systems to the impacts of climate change: insights from Inland Waters in Bangladesh . Bangladesh I 6 , 67–97. 10.1007/978-3-319-26357-1_3 [ CrossRef ] [ Google Scholar ]
- Jahan I., Ahsan D., Farque M. H. (2017). Fishers' local knowledge on impact of climate change and anthropogenic interferences on Hilsa fishery in South Asia: evidence from Bangladesh . Environ. Develop. Sustain . 17 , 461–478. 10.1007/s10668-015-9740-0 [ CrossRef ] [ Google Scholar ]
- Jhariya M. K., Yadav D. K., Banerjee A., Raj A., Meena R. S. (2019). Sustainable forestry under changing climate . Sustain. Agric. Forest. Environ Manag . 24 , 285–326. 10.1007/978-981-13-6830-1_9 [ CrossRef ] [ Google Scholar ]
- Kalas P. P. (2009). Planting the Knowledge Seed Adapting to climate change using ICTs Concepts, Current Knowledge and Innovative Examples . Pretoria: Building Communication Opportunities (BCO) Alliance. 10.13140/RG.2.2.17959.85921 [ CrossRef ] [ Google Scholar ]
- Karanasios S. T. A. N. (2011). New and Emergent ICTs and Climate Change in Developing Countries . Manchester: Center for Development Informatics, Institute for Development Policy and Management, SED, University of Manchester. [ Google Scholar ]
- Karmakar S., Purkait S., Das A., Samanta R., Kumar K. (2018). Climate change and Inland fisheries: impact and mitigation strategies . J. Exp. Zool. Ind . 21, 329–335. Avaiable online at: https://www.researchgate.net/publication/323546601_CLIMATE_CHANGE_AND_INLAND_FISHERIES_IMPACT_AND_MITIGATION_STRATEGIES
- Kataria S., Verma S. K. (2018). Salinity stress responses and adaptive mechanisms in major glycophytic crops: the story so far . Salinity Responses Tolerance Plants 1 , 1–39. 10.1007/978-3-319-75671-4_1 [ CrossRef ] [ Google Scholar ]
- Keating B. A., Carberry P. S., Hammer G. L., Probert M. E. (2003). An overview of APSIM a model designed for farming systems simulation . Eur. J. Agron . 18 , 267–288. 10.1016/S1161-0301(02)00108-9 [ CrossRef ] [ Google Scholar ]
- Keenan R. J. (2015). Climate change impacts and adaptation in forest management: a review . Ann. For. Sci . 72 , 145–167. 10.1007/s13595-014-0446-5 [ CrossRef ] [ Google Scholar ]
- Kheir A. M., El Baroudy A., Aiad M. A., Zoghdan M. G., El-Aziz M. A. A., Ali M. G., et al.. (2019). Impacts of rising temperature, carbon dioxide concentration and sea level on wheat production in North Nile delta . Sci. Total Environ . 651 , 3161–3173. 10.1016/j.scitotenv.2018.10.209 [ PubMed ] [ CrossRef ] [ Google Scholar ]
- Kolstrom M., Lindner M., Vilen T., Maroschek M., Seidl R., Lexer M. J., et al.. (2011). Reviewing the science and implementation of climate change adaptation measures in European forestry . Forest 2 , 961–982. 10.3390/f2040961 [ CrossRef ] [ Google Scholar ]
- Kumar S., Dwivedi S. K., Basu S., Kumar G., Mishra J. S., Koley T. K., et al.. (2020). Anatomical, agro-morphological and physiological changes in rice under cumulative and stage specific drought conditions prevailed in eastern region of India . Field Crops Res . 245, 107658. 10.1016/j.fcr.2019.107658 [ CrossRef ] [ Google Scholar ]
- Kumar V. S., Kumar R. P., Harikrishna C. H., Rani M. S. (2018). Effect of heat stress on production and reproduction performance of buffaloes-a review . Pharma Innov . 7, 629–633. Available online at: https://www.thepharmajournal.com/archives/2018/vol7issue4/PartJ/7-3-162-175.pdf
- Kurukulasuriya P., Rosenthal S. (2003). Climate Change and Agriculture: A Review of Impacts and Adaptations. Climate Change Series Paper No. 91 . Washington, DC: World Bank. [ Google Scholar ]
- Lal R. (2007). Carbon management in agricultural soils . Mitig. Adapt. Strateg. Glob. Chang . 12 , 303–322. 10.1007/s11027-006-9036-7 [ CrossRef ] [ Google Scholar ]
- Lam V. W., Chavanich S., Djoundourian S., Dupont S., Gaill F., Holzer G., et al.. (2019). Dealing with the effects of ocean acidification on coral reefs in the Indian Ocean and Asia . Reg. Stud. Marine Sci . 100 , 560–570. 10.1016/j.rsma.2019.100560 [ CrossRef ] [ Google Scholar ]
- Liang C., Xian W., Pauly D. (2018). Impacts of ocean warming on China's fisheries catches: an application of “mean temperature of the catch” concept . Front. Mar. Sci . 6 , 5–26. 10.3389/fmars.2018.00026 [ CrossRef ] [ Google Scholar ]
- Lima V. P., de Lima R. A. F., Joner F., Siddique I., Raes N., Ter Steege H. (2022). Climate change threatens native potential agroforestry plant species in Brazil . Sci. Rep . 12 , 1–14. 10.1038/s41598-022-06234-3 [ PMC free article ] [ PubMed ] [ CrossRef ] [ Google Scholar ]
- Liu J., Hasanuzzaman M., Wen H., Zhang J., Peng T., Sun H., et al.. (2019). High temperature and drought stress cause abscisic acid and reactive oxygen species accumulation and suppress seed germination growth in rice . Protoplasma 256 , 1217–1227. 10.1007/s00709-019-01354-6 [ PubMed ] [ CrossRef ] [ Google Scholar ]
- Liu Y., Chen Q., Ge Q., Dai J., Qin Y., Dai L., et al.. (2018). Modelling the impacts of climate change and crop management on phenological trends of spring and winter wheat in China . Agric. For. Meteorol . 248 , 518–526. 10.1016/j.agrformet.2017.09.008 [ CrossRef ] [ Google Scholar ]
- Lv Z., Liu X., Cao W., Zhu Y. (2013). Climate change impacts on regional winter wheat production in main wheat production regions of China . Agric. For. Meteorol . 171 , 234–248. 10.1016/j.agrformet.2012.12.008 [ CrossRef ] [ Google Scholar ]
- Lybbert T. J., Sumner D. A. (2012). Agricultural technologies for climate change in developing countries: policy options for innovation and technology diffusion . Food Policy 37 , 114–123. 10.1016/j.foodpol.2011.11.001 [ CrossRef ] [ Google Scholar ]
- Ma Q., Zhang J., Sun C., Zhang F., Wu R., Wu L. (2018). Drought characteristics and prediction during pasture growing season in Xilingol grassland, northern China . Theo. App. Climatol . 133 , 165–178. 10.1007/s00704-017-2150-5 [ CrossRef ] [ Google Scholar ]
- Mbow C., Smith P., Skole D., Duguma L., Bustamante M. (2014). Achieving mitigation and adaptation to climate change through sustainable agroforestry practices in Africa . Curr. Opin. Environ. Sustain . 6 , 8–14. 10.1016/j.cosust.2013.09.002 [ CrossRef ] [ Google Scholar ]
- Meena R. K., Verma T. P., Yadav R. P., Mahapatra S. K., Surya J. N., Singh D., et al.. (2019). Local perceptions and adaptation of indigenous communities to climate change: Evidences from High Mountain Pangi valley of Indian Himalayas . Ind. J. Trad. Knowl. 11 , 876–888. Available online at: https://www.researchgate.net/publication/343818597_Local_perceptions_and_adaptation_of_indigenous_communities_to_climate_change_Evidences_from_High_Mountain_Pangi_valley_of_Indian_Himalaya [ Google Scholar ]
- Meera S. N., Balaji V., Muthuraman P., Sailaja B., Dixit S. (2012). Changing roles of agricultural extension: harnessing information and communication technology (ICT) for adapting to stresses envisaged under climate change . Crop Stress Manag . 16 , 585–605. 10.1007/978-94-007-2220-0_19 [ CrossRef ] [ Google Scholar ]
- Moreira S. L., Pires C. V., Marcatti G. E., Santos R. H., Imbuzeiro H. M., Fernandes R. B. (2018). Intercropping of coffee with the palm tree, macauba, can mitigate climate change effects . Agric. Forest. Meteorol . 265 , 379–390. 10.1016/j.agrformet.2018.03.026 [ CrossRef ] [ Google Scholar ]
- Mottaleb K. A., Rejesus R. M., Murty M. V. R., Mohanty S., Li T. (2017). Benefits of the development and dissemination of climate-smart rice: ex ante impact assessment of drought-tolerant rice in South Asia . Miti. Adap. Strat. Global Change 22 , 879–901. 10.1007/s11027-016-9705-0 [ CrossRef ] [ Google Scholar ]
- Myers S. S., Smith M. R., Guth S., Golden C. D., Vaitla B., Mueller N. D., et al.. (2017). Climate change and global food systems: potential impacts on food security and undernutrition . Ann. Rev. Public Health . 38 , 259–277. 10.1146/annurev-publhealth-031816-044356 [ PubMed ] [ CrossRef ] [ Google Scholar ]
- Nasi W., Amin A., Fahad S. (2018). Future risk assessment byestimating historical heat wave trends with projected heat accumulation using SimCLIM climate model in Pakistan . Atmos. Res . 205 , 118–133. 10.1016/j.atmosres.2018.01.009 [ CrossRef ] [ Google Scholar ]
- Nasir I. R., Rasul F., Ahmad A. (2020). Climate change impacts and adaptations for fine, coarse, and hybrid rice using CERES-Rice . Environ. Sci. Pollut. Res . 27 , 9454–9464. 10.1007/s11356-019-07080-z [ PubMed ] [ CrossRef ] [ Google Scholar ]
- Nguyen H., Morrison J., Neven D. (2019). Changing food systems: implications for food security and nutrition . Sustain Food Agric . 21 , 153–168. 10.1016/B978-0-12-812134-4.00009-1 [ CrossRef ] [ Google Scholar ]
- Nguyen N. H. (2015). Genetic improvement for important farmed aquaculture species with a reference to carp, tilapia and prawns in Asia: achievements, lessons and challenges . Fish Fisheries 17 :483–506 10.1111/faf.12122 [ CrossRef ] [ Google Scholar ]
- Nizam H. A., Zaman K., Khan K. B., Batool R., Khurshid M. A., Shoukry A. M., et al.. (2020). Achieving environmental sustainability through information technology:“Digital Pakistan” initiative for green development . Environ. Sci. Poll. Res . 2 , 1–16. 10.1007/s11356-020-07683-x [ PubMed ] [ CrossRef ] [ Google Scholar ]
- Noori M. S., Taliman N. A. (2022). Effect of drought stress and chemical fertilizers on wheat productivity and grain and quality . Plant Prod. Gene 3 , 43–56. 10.34785/J020.2022.800 [ CrossRef ] [ Google Scholar ]
- Obermeier W. A., Lehnert L. W., Kammann C. I., Muller C., Grunhage L., Luterbacher J., et al.. (2017). Reduced CO 2 fertilization effect in temperate C 3 grasslands under more extreme weather conditions . Nat. Climate Change 7 , 137–148. 10.1038/nclimate3191 [ CrossRef ] [ Google Scholar ]
- Ogello E. O., Mlingi F. T., Nyonje B. M., Charo-Karisa H., Munguti J. M. (2013). Can integrated livestock-fish culture be a solution to East Afircan's food insecurity a review . Afr. J. Food Agric. Nut. Develop . 13 , 8058–8078. 10.18697/ajfand.59.12920 [ CrossRef ] [ Google Scholar ]
- Ottaviani D., De Young C., Tsuji S. (2017). Assessing water availability and economic social and nutritional contributions from inland capture fisheries and aquaculture: an indicator-based framework: a compilation of water-related indicators in selected African and Asian Countries . FAO Fisheries Aquacult. Circul . 11 , 16–21. [ Google Scholar ]
- Paricha A. M. P., Sethi K. C., Gupta V., Pathak A., Chhotray S. K. (2017). Soil water conservation for microcatchment water harvesting systems . J. Soil Sci. Plant Nutri . 8 , 55–59. [ Google Scholar ]
- Phand S., Pankaj P. K. (2021). Climate-resilient livestock farming to ensure food and nutritional security ,> in Climate Change and Resilient Food Systems (Singapore: Springer; ), 381–398. 10.1007/978-981-33-4538-6_15 [ CrossRef ] [ Google Scholar ]
- Pineiro G., Paruelo J. M., Oesterheld M., Jobbagy E. G. (2010). Pathways of grazing effects on soil organic carbon and nitrogen . Range Ecol. Manag . 63 , 109–119. 10.2111/08-255.1 [ CrossRef ] [ Google Scholar ]
- Poonam A., Saha S., Nayak P. K., Sinhababu D. P., Sahu P. K., Satapathy B. S., et al.. (2019). Rice-fish integrated farming systems for eastern India . J. Integrat. Agric . 6, 77–86. Available online at: https://www.semanticscholar.org/paper/Rice-Fish-Integrated-Farming-Systems-for-Eastern-Poonam-Saha/43040f2fe84dab3be27fd48785f040351278f25d
- Population of Asia (2019). Demographics: Density Ratios, Growth Rate, Clock, Rate of Men to Woman . Available online at: www. population of.net (accessed June 2, 2019). [ Google Scholar ]
- Prein M. (2002). Integration of aquaculture into crop–animal systems in Asia . Agric. Syst . 71 , 127–146. 10.1016/S0308-521X(01)00040-3 [ CrossRef ] [ Google Scholar ]
- Quyen N. H., Duong T. H., Yen B. T., Sebastian L. (2018). Impact of climate change on future rice production in the Mekong River Delta. Miti. Adap. Strat. Global Change .12, 55–59 . Available online at: https://hdl.handle.net/10568/99563
- Rahman M. H. U., Ahmad A., Wajid A. (2019). Application of CSM-CROPGRO-cotton model for cultivars and optimum planting dates: evaluation in changing semi-arid climate . Field Crop Res . 238 , 139–152. 10.1016/j.fcr.2017.07.007 [ CrossRef ] [ Google Scholar ]
- Rahman M. H. U., Ahmad A., Wang X., Wajid A., Nasim W., Hussain M., et al.. (2018). Multi-model projections of future climate and climate change impacts uncertainty assessment for cotton production in Pakistan . Agric. Forest Meteorol . 253 , 94–113. 10.1016/j.agrformet.2018.02.008 [ CrossRef ] [ Google Scholar ]
- Rakszegi M., Darko E., Lovegrove A., Molnár I., Lang L., Bed,o Z., et al.. (2019). Drought stress affects the protein and dietary fiber content of wholemeal wheat flour in wheat/Aegilops addition lines . PLoS ONE 14 , e0211892. 10.1371/journal.pone.0211892 [ PMC free article ] [ PubMed ] [ CrossRef ] [ Google Scholar ]
- Raman A., Verulkar S. B., Mandal N. P., Variar M., Shukla V. D., Dwivedi J. L., et al.. (2012). Drought yield index to select high yielding rice lines under different drought stress severities . Rice 5 , 1–12. 10.1186/1939-8433-5-31 [ PMC free article ] [ PubMed ] [ CrossRef ] [ Google Scholar ]
- Raman H., Uppal R. K., Raman R. (2019). Genetic solutions to improve resilience of canola to climate change . Genomic Designing Climate-Smart Oilseed Crops 8 , 75–131. 10.1007/978-3-319-93536-2_2 [ CrossRef ] [ Google Scholar ]
- Rana E., Thwaites R., Luck G. (2017). Trade-offs and synergies between carbon, forest diversity and forest products in Nepal community forests . Environ. Conserv . 44 , 5–13. 10.1017/S0376892916000448 [ CrossRef ] [ Google Scholar ]
- Rao N., Lawson E. T., Raditloaneng W. N., Solomon D., Angula M. N. (2019). Gendered vulnerabilities to climate change: insights from the semi-arid regions of Africa and Asia . Climate Develop . 11 , 14–26. 10.1080/17565529.2017.1372266 [ CrossRef ] [ Google Scholar ]
- Rasul G., Neupane N., Hussain A., Pasakhala B. (2019). Beyond hydropower: towards an integrated solution for water, energy and food security in South Asia . Int. J. Water Resour. Develop . 17 , 1–25. 10.1080/07900627.2019.1579705 [ CrossRef ] [ Google Scholar ]
- Raza M. M., Khan M. A., Arshad M., Sagheer M., Sattar Z., Shafi J., et al.. (2015). Impact of global warming on insects . Arch. Phytopathol. Plant Protection . 48 , 84–94. 10.1080/03235408.2014.882132 [ CrossRef ] [ Google Scholar ]
- Ren S., Qin Q., Ren H. (2019). Contrasting wheat phenological responses to climate change in global scale . Sci. Total Environ . 665 , 620–631. 10.1016/j.scitotenv.2019.01.394 [ PubMed ] [ CrossRef ] [ Google Scholar ]
- Renaudeau D., Collin A., Yahav S., De Basilio V., Gourdine J. L., Collier R. J. (2012). Adaptation to hot climate and strategies to alleviate heat stress in livestock production . Animal 6 , 707–728. 10.1017/S1751731111002448 [ PubMed ] [ CrossRef ] [ Google Scholar ]
- Rezaei E. E., Siebert S., Huging H., Ewert F. (2018). Climate change effect on wheat phenology depends on cultivar change . Sci. Rep . 8 , 48–91. 10.1038/s41598-018-23101-2 [ PMC free article ] [ PubMed ] [ CrossRef ] [ Google Scholar ]
- Rosenzweig C., Jones J. W., Hatfield J. L., Ruane A. C., Boote K. J. (2013). The agricultural model inter comparison and improvement project (AgMIP): protocols and pilot studies . Agric. For. Meteorol . 170 , 166–182. 10.1016/j.agrformet.2012.09.011 [ CrossRef ] [ Google Scholar ]
- Ruane A. C., Cecil L. D., Horton R. M., Gordon R., McCollum R., Brown D., et al.. (2013). Climate change impact uncertainties for maize in Panama: farm information, climate projections, and yield sensitivities . Agric. For. Meteorol . 170 , 132–145. 10.1016/j.agrformet.2011.10.015 [ CrossRef ] [ Google Scholar ]
- Ruane A. C., Goldberg R., Chryssanthacopoulos J. (2015). Climate forcing datasets for agricultural modeling: merged products for gap-filling and historical climate series estimation . Agric. Meteorol . 200 , 233–248. 10.1016/j.agrformet.2014.09.016 [ CrossRef ] [ Google Scholar ]
- Runkle B. R., SuvocCarev K., Reba M. L., Reavis C. W., Smith S. F., Chiu Y. L., et al.. (2018). Methane emission reductions from the alternate wetting and drying of rice fields detected using the eddy covariance method . Environ. Sci. Technol . 53 , 671–681. 10.1021/acs.est.8b05535 [ PubMed ] [ CrossRef ] [ Google Scholar ]
- Sangareswari M., Balasubramanian A., Palanikumaran B., Aswini D. (2018). Carbon sequestration potential of a few selected tree species in Coimbatore District, Tamil Nadu . Adv. Res . 2 , 1–7. 10.9734/AIR/2018/39676 [ CrossRef ] [ Google Scholar ]
- Sanz-Cobena A., Lassaletta L., Aguilera E., Del Prado A., Garnier J., Billen G., et al.. (2019). Strategies for greenhouse gas emissions mitigation in Mediterranean agriculture: a review . Agric. Ecosys. Environ . 238 , 5–24. 10.1016/j.agee.2016.09.038 [ CrossRef ] [ Google Scholar ]
- Sarkar U. K., Borah B. C. (2018). Flood plain wetland fisheries of India: with special reference to impact of climate change . Wetlands Ecol. Manag . 26 , 1–15. 10.1007/s11273-017-9559-6 [ CrossRef ] [ Google Scholar ]
- Scherr S. J., Shames S., Friedman R. (2012). From climate-smart agriculture to climate-smart landscapes . Agric. Food Sec . 1 , 12–17. 10.1186/2048-7010-1-12 [ CrossRef ] [ Google Scholar ]
- Seddon N., Turner B., Berry P., Chausson A., Girardin C. A. (2018). Why Nature-Based Solutions to Climate Change Must Be Grounded in Sound Biodiversity Science (England: Nature Climate Change; ), 65. 10.20944/preprints201812.0077.v1 [ CrossRef ] [ Google Scholar ]
- Shafiq F., Nadeem A., Ahsan K., Siddiq M. (2014). Role of ICT in climate change monitoring: a review study of ICT based climate change Monitoring services . Res. J. Recent Sci . 3 , 123–130. 10.4236/ajcc.2018.72010 [ CrossRef ] [ Google Scholar ]
- Shah L., Ali A., Yahya M., Zhu Y., Wang S., Si H., et al.. (2018). Integrated control of fusarium head blight and deoxynivalenol mycotoxin in wheat . Plant Pathol . 67 , 532–548. 10.1111/ppa.12785 [ CrossRef ] [ Google Scholar ]
- Shi W., Yin X., Struik P. C., Solis C., Xie F., Schmidt R. C., et al.. (2017). High day-and night-time temperatures affect grain growth dynamics in contrasting rice genotypes . J. Exper. Bot . 68 , 5233–5245. 10.1093/jxb/erx344 [ PMC free article ] [ PubMed ] [ CrossRef ] [ Google Scholar ]
- Smith P., Olesen J. E. (2010). Synergies between the mitigation of, and adaptation to, climate change in agriculture . J. Agric. Sci . 148 , 543–552. 10.1017/S0021859610000341 [ CrossRef ] [ Google Scholar ]
- Sohag A. A. M., Tahjib-Ul-Arif M., Brestic M., Afrin S., Sakil M. A., Hossain M. T., et al.. (2020). Exogenous salicylic acid and hydrogen peroxide attenuate drought stress in rice . Plant, Soil Environ . 66 , 7–13. 10.17221/472/2019-PSE [ CrossRef ] [ Google Scholar ]
- Southgate P. C., Lucas J. S. (2019). Principles of aquaculture . Aquaculture 3 , 19–40. 10.1007/s10499-012-9530-8 [ CrossRef ] [ Google Scholar ]
- Spittlehouse D. L. (2005). Integrating climate change adaptation into forest management . Forestry Chron . 81 , 691–695. 10.5558/tfc81691-5 [ CrossRef ] [ Google Scholar ]
- Suryadi F. X. (2020). Soil and Water Management Strategies for Tidal Lowlands in Indonesia . Boca Raton, FL: CRC Press. 10.1201/9780429333231 [ CrossRef ] [ Google Scholar ]
- Tan B. T., Fam P. S., Firdaus R. R., Tan M. L., Gunaratne M. S. (2021). Impact of climate change on rice yield in Malaysia: a panel data analysis . Agric . 11, 569. 10.3390/agriculture11060569 [ CrossRef ] [ Google Scholar ]
- Tariq M., Ahmad S., Fahad S. (2018). The impact of climate warmingand crop management on phenology of sunflower-based cropping systems in Punjab, Pakistan . Agric. For. Meteorol . 256 , 270–282. 10.1016/j.agrformet.2018.03.015 [ CrossRef ] [ Google Scholar ]
- Thornton P. K., Herrero M. (2010). Potential for reduced methane and carbon dioxide emissions from livestock and pasture management in the tropics . Proc. Nat. Acad. Sci. U. S. A . 107 , 19667–19672. 10.1073/pnas.0912890107 [ PMC free article ] [ PubMed ] [ CrossRef ] [ Google Scholar ]
- Tian B., Yu Z., Pei Y., Zhang Z., Siemann E., Wan S., et al.. (2019). Elevated temperature reduces wheat grain yield by increasing pests and decreasing soil mutualists . Pest Manag. Sci . 75 , 466–475. 10.1002/ps.5140 [ PubMed ] [ CrossRef ] [ Google Scholar ]
- Tonnang H. E., Sokame B. M., Abdel-Rahman E. M., Dubois T. (2022). Measuring and modelling crop yield losses due to invasive insect pests under climate change . Curr. Opin. Insect Sci . 2022, 100873. 10.1016/j.cois.2022.100873 [ PubMed ] [ CrossRef ] [ Google Scholar ]
- Ullah A., Ahmad I., Ahmad A. (2019). Assessing climate change impacts on pearl millet under arid and semi-arid environments usingCSM-CERES-Millet model . Environ. Sci. Pollut. Res . 26 , 6745–6757. 10.1007/s11356-018-3925-7 [ PubMed ] [ CrossRef ] [ Google Scholar ]
- UNO (2015). World Population Prospective. The 2015 Revision, Volume II: Demographic Profiles . New York, NY: United Nations Department of Economic and Social Affairs, 21–27 . Available online at: https://www.un.org/development/desa/pd/content/world-population-prospects-2015-revision-volume-ii-demographic-profiles
- van Wettere W. H., Kind K. L., Gatford K. L., Swinbourne A. M., Leu S. T., Hayman P. T., et al.. (2021). Review of the impact of heat stress on reproductive performance of sheep . J. Animal Sci. Biotechnol . 12 , 1–18. 10.1186/s40104-020-00537-z [ PMC free article ] [ PubMed ] [ CrossRef ] [ Google Scholar ]
- Wang X., Pederson N., Chen Z., Lawton K., Zhu C., Han S. (2019a). Recent rising temperatures drive younger and southern Korean pine growth decline . Sci. Total Environ . 649 , 1105–1116. 10.1016/j.scitotenv.2018.08.393 [ PubMed ] [ CrossRef ] [ Google Scholar ]
- Wang Y., Wang L., Zhou J., Hu S., Chen H., Xiang J., et al.. (2019b). Research progress on heat stress of rice at flowering stage . Rice Sci . 26 , 1–10. 10.1016/j.rsci.2018.06.009 [ CrossRef ] [ Google Scholar ]
- Wasaya A., Yasir T. A., Sarwar N., Mubeen K., Rajendran K., Hadifa A., et al.. (2022). Climate change and global rice security ,> in Modern Techniques of Rice Crop Production (Singapore: Springer; ), 13–26. 10.1007/978-981-16-4955-4_2 [ CrossRef ] [ Google Scholar ]
- Wassie M., Zhang W., Zhang Q., Ji K., Chen L. (2019). Effect of heat stress on growth and physiological traits of alfalfa ( Medicago sativa L.) and a comprehensive evaluation for heat tolerance . Agron 9 , 597. 10.3390/agronomy9100597 [ CrossRef ] [ Google Scholar ]
- Williams P. A., Crespo O., Abu M. (2019). Adapting to changing climate through improving adaptive capacity at the local level–the case of smallholder horticultural producers in Ghana . Climate Risk Manag . 23 ,124–135. 10.1016/j.crm.2018.12.004 [ CrossRef ] [ Google Scholar ]
- World Bank (2018). World BankOpen Data. Available online at: https://data.worldbank.org/.com (accessed January, 2021).
- Xiong D. P., Shi P. L., Zhang X. Z., Zou C. B. (2016). Effects of grazing exclusion on carbon sequestration and plant diversity in grasslands of China: a meta-analysis . Ecol. Eng . 94 , 647–655. 10.1016/j.ecoleng.2016.06.124 [ CrossRef ] [ Google Scholar ]
- Xu J., Henry A., Sreenivasulu N. (2020). Rice yield formation under high day and night temperatures-a prerequisite to ensure future food security . Plant Cell Environ . 43 , 1595–1608. 10.1111/pce.13748 [ PubMed ] [ CrossRef ] [ Google Scholar ]
- Xu P., Zhou T., Zhao X., Luo H., Gao S., Li Z., et al.. (2018). Diverse responses of different structured forest to drought in Southwest China through remotely sensed data . Int. J. App. Earth Observ. Geoinform . 69 , 217–225. 10.1016/j.jag.2018.03.009 [ CrossRef ] [ Google Scholar ]
- Xu Y., Chu C., Yao S. (2021). The impact of high-temperature stress on rice: challenges and solutions . Crop J . 9 , 963–976. 10.1016/j.cj.2021.02.011 [ CrossRef ] [ Google Scholar ]
- Yadav S. S., Lal R. (2018). Vulnerability of women to climate change in arid and semi-arid regions: the case of India and South Asia . J. Arid Environ . 149 , 4–17. 10.1016/j.jaridenv.2017.08.001 [ CrossRef ] [ Google Scholar ]
- Yang H., Gu X., Ding M., Lu W., Lu D. (2018). Heat stress during grain filling affects activities of enzymes involved in grain protein and starch synthesis in waxy maize . Sci. Rep . 8 , 1–9. 10.1038/s41598-018-33644-z [ PMC free article ] [ PubMed ] [ CrossRef ] [ Google Scholar ]
- Yang Z., Zhang Z., Zhang T., Fahad S., Cui K., Nie L., et al.. (2017). The effect of season-long temperature increases on rice cultivars grown in the central and southern regions of China . Front. Plant Sci . 8 , 1908–1927. 10.3389/fpls.2017.01908 [ PMC free article ] [ PubMed ] [ CrossRef ] [ Google Scholar ]
- Yu H., Zhang Q., Sun P., Song C. (2018). Impact of droughts on winter wheat yield in different growth stages during 2001–2016 in Eastern China . Int. J. Disaster Risk Sci . 9 , 376–391. 10.1007/s13753-018-0187-4 [ CrossRef ] [ Google Scholar ]
- Zafar S. A., Hameed A., Nawaz M. A., Wei M. A., Noor M. A., Hussain M. (2018). Mechanisms and molecular approaches for heat tolerance in rice ( Oryza sativa L.) under climate change scenario . J. Integrative Agric . 17 , 726–738. 10.1016/S2095-3119(17)61718-0 [ CrossRef ] [ Google Scholar ]
- Zahra N., Wahid A., Hafeez M. B., Ullah A., Siddique K. H. M., Farooq M. (2021). Grain development in wheat under combined heat and drought stress: Plant responses and management . Environ. Experi. Bot . 188, 104517. 10.1016/j.envexpbot.2021.104517 [ CrossRef ] [ Google Scholar ]
- Zanamwe N., Okunoye A. (2013). Role of information and communication technologies (ICTs) in mitigating, adapting to and monitoring climate change in developing countries . Int. Conf. ICT Africa, Harare, Zimbabwe 4 , 20–23. Available online at: https://www.semanticscholar.org/paper/Role-of-information-and-communication-technologies-Okunoye/4c987ba4dbef48157a2d287ecf2629ce242566e6 [ Google Scholar ]
- Zhao K., Tao Y., Liu M., Yang D., Zhu M., Ding J., et al.. (2022). Does temporary heat stress or low temperature stress similarly affect yield, starch, and protein of winter wheat grain during grain filling? J. Cereal Sci . 103, 103408. 10.1016/j.jcs.2021.103408 [ CrossRef ] [ Google Scholar ]
- Zhu X., Zhang S., Liu T., Liu Y. (2021). Impacts of heat and drought on gross primary productivity in China . Remote Sens . 13, 378. 10.3390/rs13030378 [ CrossRef ] [ Google Scholar ]
Click through the PLOS taxonomy to find articles in your field.
For more information about PLOS Subject Areas, click here .
Loading metrics
Open Access
Peer-reviewed
Research Article
Capturing farm diversity with hypothesis-based typologies: An innovative methodological framework for farming system typology development
Roles Conceptualization, Data curation, Formal analysis, Methodology, Validation, Visualization, Writing – original draft, Writing – review & editing
Affiliation Farming Systems Ecology, Wageningen University & Research, Wageningen, The Netherlands
Roles Conceptualization, Formal analysis, Investigation, Methodology, Validation, Writing – original draft, Writing – review & editing
Roles Conceptualization, Formal analysis, Investigation, Validation, Writing – original draft, Writing – review & editing
Roles Conceptualization, Formal analysis, Investigation, Validation, Visualization, Writing – original draft
Affiliations Farming Systems Ecology, Wageningen University & Research, Wageningen, The Netherlands, Plant Production Systems, Wageningen University & Research, Wageningen, The Netherlands
Roles Conceptualization, Supervision, Writing – original draft, Writing – review & editing
Affiliation Plant Production Systems, Wageningen University & Research, Wageningen, The Netherlands
Roles Conceptualization, Funding acquisition, Investigation, Methodology, Supervision, Writing – original draft
Roles Conceptualization, Formal analysis, Methodology, Validation, Writing – original draft, Writing – review & editing
Affiliation CIMMYT-Southern Africa, Harare, Zimbabwe
Roles Conceptualization, Funding acquisition, Project administration, Supervision, Writing – original draft, Writing – review & editing
* E-mail: [email protected]
- Stéphanie Alvarez,
- Carl J. Timler,
- Mirja Michalscheck,
- Wim Paas,
- Katrien Descheemaeker,
- Pablo Tittonell,
- Jens A. Andersson,
- Jeroen C. J. Groot
- Published: May 15, 2018
- https://doi.org/10.1371/journal.pone.0194757
- Reader Comments
Creating typologies is a way to summarize the large heterogeneity of smallholder farming systems into a few farm types. Various methods exist, commonly using statistical analysis, to create these typologies. We demonstrate that the methodological decisions on data collection, variable selection, data-reduction and clustering techniques can bear a large impact on the typology results. We illustrate the effects of analysing the diversity from different angles, using different typology objectives and different hypotheses, on typology creation by using an example from Zambia’s Eastern Province. Five separate typologies were created with principal component analysis (PCA) and hierarchical clustering analysis (HCA), based on three different expert-informed hypotheses. The greatest overlap between typologies was observed for the larger, wealthier farm types but for the remainder of the farms there were no clear overlaps between typologies. Based on these results, we argue that the typology development should be guided by a hypothesis on the local agriculture features and the drivers and mechanisms of differentiation among farming systems, such as biophysical and socio-economic conditions. That hypothesis is based both on the typology objective and on prior expert knowledge and theories of the farm diversity in the study area. We present a methodological framework that aims to integrate participatory and statistical methods for hypothesis-based typology construction. This is an iterative process whereby the results of the statistical analysis are compared with the reality of the target population as hypothesized by the local experts. Using a well-defined hypothesis and the presented methodological framework, which consolidates the hypothesis through local expert knowledge for the creation of typologies, warrants development of less subjective and more contextualized quantitative farm typologies.
Citation: Alvarez S, Timler CJ, Michalscheck M, Paas W, Descheemaeker K, Tittonell P, et al. (2018) Capturing farm diversity with hypothesis-based typologies: An innovative methodological framework for farming system typology development. PLoS ONE 13(5): e0194757. https://doi.org/10.1371/journal.pone.0194757
Editor: Iratxe Puebla, Public Library of Science, UNITED KINGDOM
Received: September 22, 2016; Accepted: March 10, 2018; Published: May 15, 2018
Copyright: © 2018 Alvarez et al. This is an open access article distributed under the terms of the Creative Commons Attribution License , which permits unrestricted use, distribution, and reproduction in any medium, provided the original author and source are credited.
Data Availability: Data are available in the manuscript and supporting information file. Additional data are from the Africa RISING/SIMLEZA project whose Project Coordinator and Chief Scientist for Africa RISING East and Southern Africa, respectively Irmgard Hoeschle-Zeledon (IITA) and Mateete Bekunda (IITA), may be contacted at [email protected] and [email protected] . Other contacts are available at https://africa-rising.net/contacts/ . The authors confirm that others have the same access to the data as the authors.
Funding: The fieldwork of this study was conducted within the Africa RISING/SIMLEZA research-for-development program in Zambia that is led by the International Institute of Tropical Agriculture (IITA). The research was partly funded by the United States Agency for International Development (USAID; https://www.usaid.gov/ ) as part of the US Government’s Feed the Future Initiative. The contents are the responsibility of the producing organizations and do not necessarily reflect the opinion of USAID or the U.S. Government. The CGIAR Research program Humidtropics and all the donors supported this research through their contributions to the CGIAR Fund. The funders had no role in study design, data collection and analysis, decision to publish, or preparation of the manuscript. For a list of Fund donors please see: https://www.cgiar.org/funders/ .
Competing interests: The authors have declared that no competing interests exist.
Introduction
Smallholder farming systems are highly heterogeneous in many characteristics such as individual farming households’ land access, soil fertility, cropping, livestock assets, off-farm activities, labour and cash availability, socio-cultural traits, farm development trajectories and livelihood orientations, e.g. [ 1 , 2 ]. Farm typologies can help to summarize this diversity among farming systems. Typology construction has been defined as a process of classification, description, comparison and interpretation or explanation of a set of elements on the basis of selected criteria, allowing reduction and simplification of a multiplicity of elements into a few basic/elementary types ([ 3 ] cited by [ 4 ]). As a result, farm typologies are a tool to comprehend the complexity of farming systems by providing a simplified representation of the diversity within the farming system by organizing farms into quite homogenous groups, the farm types. These identified farm types are defined as a specific combination of multiple features [ 5 – 7 ].
Capturing farming system heterogeneity through typologies is considered as a useful first step in the analysis of farm performance and rural livelihoods [ 8 – 9 ]. Farm typologies can be used for many purposes, for instance i) the selection of representative farms or prototype farms as case study objects, e.g. [ 10 – 12 ]; ii) the targeting or fine-tuning of interventions, for example by identifying opportunities and appropriate interventions per farm type, e.g. [ 13 – 18 ]; iii) for the extension of technologies, policies or ex-ante impact assessments to larger spatial or organizational scales (up-scaling and/or out-scaling), e.g. [ 19 – 22 ]; and iv) to support the identification of farm development trajectories and evolution patterns, e.g. [ 23 – 28 ].
Various approaches can be used to develop farm typologies [ 29 ]. The identification of criteria defining a farm type can be based on the knowledge of local stakeholders, such as extension workers and/or farmers, or derived from the analysis of data collected using farm household surveys which provide a large set of quantitative and qualitative variables to describe the farm household system [ 30 ]. Perrot et al. [ 26 ] proposed to define "aggregation poles" with local experts, i.e. virtual farms summarising the discriminating characteristics of a farm type, which can then be used as reference for the aggregation (manually or with statistical techniques) of actual farming households into specific farm types. Based on farm surveys and interviews, Capillon [ 6 ] used a (manual) step-by-step comparison of farm functioning to distinguish different types; this analysis focused on the tactical and strategic choices of farmers and on the overall objective of the household. Based on this approach, farm types were created using statistical techniques to first group farms according their structure, then within each of these structural groups, define individual farm types on the basis of their strategic choices and orientation [ 31 ]. Landais et al. [ 32 ] favoured the comparison of farming practices for the identification of farm types. Kostrowicki and Tyszkiewicz [ 33 ] proposed the identification of types based on the inherent farm characteristics in terms of social, organizational and technical, or economic criteria, and then representing these multiple dimensions in a typogram, i.e. a multi-axis graphic divided into quadrants, similar to a radar chart. Nowadays, statistical techniques have largely replaced the manual analysis of the survey data and the manual farm aggregation/comparison. Statistical techniques using multivariate analysis are one of the most commonly applied approaches to construct farm typologies, e.g. [ 34 – 41 ]. These approaches apply data-reduction techniques, i.e. combining multiple variables into a smaller number of ‘factors’ or ‘principal components’, and clustering algorithms on large databases.
Typologies are generally conditioned by their objective, the nature of the available data, and the farm sample [ 42 ]. Thus, the methodological decisions on data collection, variable selection, data-reduction and clustering have a large impact on the resulting typology. Furthermore, typologies tend to remain a research tool that is not often used by local stakeholders [ 42 ]. In order to make typologies more meaningful and used, we argue that typology development should involve local stakeholders (iteratively) and be guided by a hypothesis on the local agricultural features and the criteria for differentiating farm household systems. This hypothesis can be based on perceptions of, and theories on farm household functioning, constraints and opportunities within the local context, and the drivers and mechanisms of differentiation [ 43 – 44 ]. Drivers of differentiation can include biophysical conditions, and the variation therein, as well as socio-economic and institutional conditions such as policies, markets and farm household integration in value chains.
The objective of this article is to present a methodological approach for typology construction on the basis of an explicit hypothesis. Building on a case study of Zambia, we investigate how typology users’—here, two development projects—objectives and initial hypothesis regarding farm household diversity, impacts typology construction and consequently, its results. Based on this we propose a methodological framework for typology construction that utilizes a combination of expert knowledge, participatory approaches and multivariate statistical methods. We further discuss how an iterative process of hypothesis-refinement and typology development can inform participatory learning and dissemination processes, thus fostering specific adoption in addition to the fine-tuning and effective out-scaling of innovations.
Materials and methods
Typology construction in the eastern province, zambia.
We use a sample of smallholder farms in the Eastern Province of Zambia to illustrate the importance of hypothesis formulation in the first stages of the typology development. This will be done by showing the effects of using different hypotheses on the typology construction process and its results, while using the same dataset. Our experience with typology construction with stakeholders in Zambia made clear that i) the initial typology objective and hypotheses were not clearly defined nor made explicit at the beginning of the typology development, and ii) iterative feedbacks with local experts are needed to confirm the validity of the typology results.
The typology construction work in the Eastern Province of Zambia ( Fig 1 ) was performed for a collaboration between SIMLEZA (Sustainable Intensification of Maize-Legume Systems for the Eastern Province of Zambia) and Africa RISING (Africa Research in Sustainable Intensification for the Next Generation; https://africa-rising.net/ ); two research for development projects operating in the area. Africa RISING is led by IITA (International Institute of Tropical Agriculture; http://www.iita.org/ ) and aims to create opportunities for smallholder farm households to move out of hunger and poverty through sustainably intensified farming systems that improve food, nutrition, and income security, particularly for women and children, and conserve or enhance the natural resource base. SIMLEZA is a research project led by CIMMYT (International Maize and Wheat Improvement Center; http://www.cimmyt.org/ ) which, amongst other objectives, seeks to facilitate the adoption and adaptation of productive, resilient and sustainable agronomic practices for maize-legume cropping systems in Zambia’s Eastern Province. The baseline survey data that was used was collected by the SIMLEZA project in 2010/2011. The survey dataset ( S1 Dataset ) was used to develop three typologies using three different objectives, to investigate the effects that different hypotheses have on typology results.
- PPT PowerPoint slide
- PNG larger image
- TIFF original image
https://doi.org/10.1371/journal.pone.0194757.g001
Zambia’s Eastern Province is located on a plateau with flat to gently rolling landscapes at altitudes between 900 to 1200 m above sea level. The growing season lasts from November to April, with most of the annual rainfall of about 1000 mm falling between December and March [ 45 ]. Known for its high crop production potential, Eastern Zambia is considered the country’s ‘maize basket’ [ 46 ]. However, despite its high agricultural potential ( Table 1 ), the Eastern Province is one of the poorest regions of Zambia, with the majority of its population living below the US$1.25/day poverty line [ 47 ].
https://doi.org/10.1371/journal.pone.0194757.t001
The SIMLEZA baseline survey captured household data of about 800 households in three districts, Lundazi, Chipata and Katete ( Fig 1 ). Although smallholder farmers in these districts grow similar crops, including maize, cotton, tobacco, and legumes (such as cowpeas and soy beans), the relative importance of these crops, the livestock herd size and composition, and their market-orientation differ substantially, both between and within districts. The densely populated Chipata and Katete districts (respectively, 67.6 and 60.4 persons/km 2 ) [ 48 ] located along the main road connecting the Malawian and Zambian capital cities are characterised by highly intensive land use, relatively small land holdings and relatively small livestock numbers. The Lundazi district, by contrast, has rather extensive land-use and a low population density (22.4 persons/km 2 ) [ 48 ], and is characterised by large patches of unused and fallow lands, which are reminiscent of land-extensive slash and burn agriculture.
Alternative typology objectives and hypotheses
Iterative consultations with some of the SIMLEZA-project members in Zambia, informed the subsequent construction of three farm household typologies, all based on different objectives. The objective of the first typology (T1) was to classify the surveyed smallholder farms on the basis of the most distinguishing features of the farm structure (including crop and livestock components). The first hypothesis was that farm households could be grouped by farm structure, captured predominantly in terms of wealth indicators such as farm and herd size. When the resulting typology was not deemed useful by the local project members (because it did not focus enough on the cropping activities targeted by the project), a second typology was constructed with a new objective and hypothesis. The objective of the second typology (T2) was to differentiate farm households in terms of their farming resources (land and labour) and their integration of grain legumes (GL). The second hypothesis was that farming systems could be grouped according to their land and labour resources and their use of legumes, highlighting the labour and land resources (or constraints) of the groups integrating the most legumes. But again the resulting typology did not satisfy the local project members; they expected to see clear differences in the typology results across the three districts (Lundazi, Chipata and Katete), as the districts represented rather different farming contexts. Thus for the third typology (T3), the local partners hypothesized that the farm types and the possibilities for more GL integration would be strongly divergent for the three districts, due to differences in biophysical and socio-economic conditions ( Table 1 ). The hypothesis used was that the farm households could be grouped according to their land and labour resources and their use of legumes and that the resulting types would differ between the three districts. Therefore, the objective of the third typology focused on GL integration as for T2, but for the three districts separately (T3-Lundazi, T3-Chipata and T3-Katete).
Multivariate analysis on different datasets
On the basis of the household survey dataset, five sub-databases were extracted which corresponded to the three subsets of variables chosen to address the different typology objectives ( Table 2 ). The first two sub-databases included all three districts (T1 and T2) and the last three sub-databases corresponded to the subdivision of the data per district (T3). In each sub-database, some surveyed farms were identified as outliers and others had missing values; these farms were excluded from the multivariate analysis. A Principal Component Analysis (PCA) was conducted to reduce each dataset into a few synthetic variables, i.e. the first principal components (PCs). This was followed by an Agglomerative Hierarchical Clustering using the Ward’s minimum-variance method, which was applied on the outcomes of the PCA (PCs’ scores) to identify clusters. The Ward’s method minimizes within-cluster variation by comparing two clusters using the sum of squares between the two clusters, summed over all variables [ 49 ]. The number of clusters (i.e. farm types) was defined using the dendrogram shape, in particular the decrease of the dissimilarity index (“Height”) according to the increase of the number of clusters. The resulting types were interpreted by the means of the PCA results and put into perspective with the knowledge of the local reality. All the statistical analyses were executed in R (version 3.1.0, ade4 package; [ 50 ]).
https://doi.org/10.1371/journal.pone.0194757.t002
Results and discussion on the contrasting typologies
Of the five PCAs, the first four principal components explained between 55% and 64% of the variability in the five sub-databases (64, 55, 55, 57 and 62% for respectively T1, T2, and T3-Lundazi, T3-Chipata and T3-Katete). The four PCs are most strongly correlated to variables related to farm structure, labour use and income. The variables most correlated with PC1 were the size of the farmed land ( oparea ; five PCAs), the number of tropical livestock units ( tlu ; four PCAs), the cost of the hired labour ( hirecost ; four PCAs) and total income or income generated by cropping activities ( totincome or cropincome ; five PCAs) (Figs 2 , 3 and 4 ).
The red colour variables are the most explanatory of the horizontal axis (PC1); those in blue are the most explanatory variables of vertical axes (PC2, PC3 and PC4), thus defining the gradients.
https://doi.org/10.1371/journal.pone.0194757.g002
https://doi.org/10.1371/journal.pone.0194757.g003
The red coloured variables are the most explanatory of the horizontal axis (PC1); those in blue are the most explanatory variables of vertical axes (PC2) and those in violet are variables correlated with both PC1 and PC2.
https://doi.org/10.1371/journal.pone.0194757.g004
The following discriminant dimensions were more related to the specific objective of each typology. For the typology T1, PC1, PC2, PC3 and PC4 were related to the most important livestock activity (i.e. contribution of each livestock type to the total tropical livestock units (TLU) represented by cattleratio , chickenratio , pigratio and smallrumratio respectively), thus distinguishing the farms by their dominant livestock type ( Fig 2 ). The six resulting farm types are organized along a land and TLU gradient, from type 1 (larger farms) to type 6 (smaller farms). In addition to land and TLU, the farm types differed according their herd composition: large cattle herds for type 1 and type 2, mixed herds of cattle and small ruminants or pig for type 3, mostly pigs for type 4, small ruminant herds for type 5 and finally, mostly poultry for type 6 ( Fig 2 ).
For the typology T2, the labour constraints for land preparation ( preplabrat ) and weeding ( weedlabrat ) determined the second discriminant dimension (PC2), while the legume features (experience, legume evaluation and cropped legume proportion represented by legexp , legscore and legratio respectively) only appeared correlated to PC3 or PC4. However, these two last dimensions were not useful to discriminate the surveyed farms, since the farm types tended to overlap in PC3 and PC4 ( Fig 3 ). Therefore, while these were variables of interest (i.e. targeted in the T2-typology objective), no clear difference or trend across farm types was identified for the legume features in the multivariate results ( Fig 3 ). The five resulting farm types were also organized along a land and TLU gradient, which was correlated with the income generated per year from cropping activities ( cropincome ) and the hired labour ( hiredcost ), ranging from type 1 (higher resource-endowed farms employing a large amount of external labour) to type 5 (resource-constrained farms, using almost only family labour). Furthermore, type 4 and type 5 were characterized by their most time-consuming cropping activity, weeding and soil preparation respectively ( Fig 3 ).
For the typology T3, Lundazi, Chipata and Katete farms tended to primarily be distinguished according to a farm size, labour and income gradients ( Fig 4 ). The number of the livestock units ( tlu ) remained an important discriminant dimension that was correlated to either PC1 or PC2 in the three districts ( Fig 4 ). Although the selection of the variables was made to differentiate the farmers according to their legume practices ( legratio ), this dimension appeared only in PC3 or PC5, explaining less than 12% of the variability surveyed. Moreover, similarly to T2, the farm types identified were not clearly distinguishable on these dimensions. Thus, besides the clear differences among farms in terms of their land size, labour and income (PC1), farms were primarily segregated by their source of income, i.e. cropping activities ( cropincratio ) vs. animal activities ( anlincratio ) ( Fig 4 ). In T3-Lundazi, T3-Chipata and T3-Katete, the resulting farm types were also organized along a resource-endowment gradient, from type 1 (higher resource-endowed farms) to type 6 (resource-constrained farms). Additionally, they were distinguished by their main source of income: i) for T3-Lundazi, large livestock sales for type 2, mostly crop products sales (low livestock sales) for types 1, 3, 4, and 6, and off-farm activities for type 5; ii) for T3-Chipata, crop revenues for type 3, livestock sales for type 2 and mixed revenues from crop sales and off-farm activities for type 1, 4 and 5; iii) for T3-Katete, crop revenues for types 3 and 5, mixed revenues from crop sales and off-farm activities for type 1, 2 and 4, and mixed revenues from livestock sales and off-farm activities for type 6 ( Fig 4 ).
The overlap of the typologies is presented in Figs 5 and 6 . A strong overlap is indicated by a high percentage (and darker shading) in only one cell per row and column (Figs 5b and 6 ). The overlap between the presented typologies was not clear (Figs 5 and 6 ) despite the importance of farm size, labour and income in the first principle component (PC1) in all typologies. The best overlap was observed between the typology T2 and the typology T3 for the Chipata district (T3-Chipata). Moreover, the types 1 (i.e. farms with larger farm area, higher income and more labour used) overlapped between typologies: 69% of type 1 from T2 belonged to type 1 from T1 ( Fig 5 ) and, 100 and 89% of the types 1 from Lundazi and Katete, respectively, belonged to type 1 from T2 ( Fig 6 ). The majority of the unclassified farms (i.e. farms present in T1 but detected as outliers in T2 and T3) were related to the ‘wealthier’ types, type 1 and type 2 (Figs 5 and 6 ).
The ‘unclassified’ farms are farms that were included in T1 but were detected as outliers for T2. Fig 6a illustrates the overlapping between T1 and T2, comparing the individual position each farm in the two dendrogram of the two typologies, while Fig 6b quantifies the percentage of overlap between the two typologies.
https://doi.org/10.1371/journal.pone.0194757.g005
The intensity of the red colouring indicates the percentage of overlap.
https://doi.org/10.1371/journal.pone.0194757.g006
For the all the typologies (T1, T2, T3-Lundazi, T3-Chipata and T3-Katete), the main discriminating dimension was related to resource endowment: farm structure in terms of land area and/or animal numbers, labour use and income, which has been observed in many typology studies. In this case, the change in typology objective and the corresponding inclusion of variables from the dataset on legume integration (e.g. legratio ) did not result in a clearer separation among farm types in T2 when compared to T1. The importance of farm structure variables in explaining the datasets’ variability (Figs 2 , 3 and 4 ) resulted in overlap among typologies regarding the larger, more well-endowed farms, that comprised ca. 10% of the farms, but for types representing medium- and resource-constrained farms the overlap between typologies was limited (Figs 5 and 6 ).
The difference between typologies T2 and T3 relates to a scale change, i.e. from province to district scale. Zooming in on a smaller scale allows amplification of the local diversity. Indeed, the range of variation could be different at provincial level (i.e. here three districts were merged) when compared to the district level ( Table 1 ). Thus narrowing the study scale makes intra-district variability more visible, and potentially reveals new types leading to a segregation/splitting of one province-level type into several district-level types ( Fig 7 ). The differences between typologies that arise from scale differences highlight the importance of scale definition when investigating out-scaling and up-scaling of target interventions.
Distribution of observations of a quantitative variable (e.g. farm area) at the province level (level 1) and at the district level (level 2). The different colours are associated with different values classes within the variable. Zooming in from scale 1 to scale 2, magnifies the variation within the district, potentially revealing new classes.
https://doi.org/10.1371/journal.pone.0194757.g007
Methodological framework for typology construction
The proposed methodological framework ( Fig 8 ) aims to integrate statistical and participatory methods for hypothesis-based typology construction using quantitative data, to create a typology that is not only statistically sound and reproducible but is also firmly embedded in the local socio-cultural, economic and biophysical context. From a heterogeneous population of farms to the grouping into coherent farm types, the step-wise structure of this typology construction framework comprises the following steps: i) precisely state the objective of the typology; ii) formulate a hypothesis on farming systems diversity; iii) design a sampling method for data collection; iv) select the variables characterizing the farm households; v) cluster the farm households using multivariate statistics; and vi) verify and validate the typology result with the hypothesis and discuss the usability of the typology with (potential) typology users. This step-wise process can be repeated if the multivariate analysis results do not match the diversity of the targeted population as perceived by the validation panel and typology users ( Fig 8 ).
https://doi.org/10.1371/journal.pone.0194757.g008
Typology objectives, target population and expert panel
A farm typology is dependent on the project goals and the related research, innovation or development question [ 39 ], which determine the typology objective. This will affect the delineation of the system under study, i.e. the target population size, in socio-institutional and geographical dimensions. The socio-institutional aspects that affect the size of the target population include criteria such as the type of entities involved (e.g., farms, rural households or individual farmers) and some initial cut-off criteria. These cut-off criteria can help in reducing the population size, such as a minimum or maximum structural size or the production orientation (e.g., food production, commercial and/or export-oriented; conventional or organic). The geographical dimension will affect the size of the target population by determining the spatial scale of the study, which in turn can be influenced by natural or administrative boundaries or by biophysical conditions such as suitability for farming. The scale at which the study is conducted can amplify or reduce the diversity that is encountered ( Fig 7 ).
Stakeholders (including farmers) with a good knowledge of the local conditions and the target population and its dynamics can inform the various steps of the typology development, forming an expert panel for consultation throughout the typology construction process. The composition of the panel can be related to the objective of the typology. Existing stakeholder selection techniques, e.g. [ 51 – 52 ] can be used for the identification and selection of panel experts. The group of experts can be split into a ‘design panel’ that is involved in the construction of the typology, and a ‘validation panel’ for independent validation of the result (cf. Section ‘Hypothesis verification and typology validation’). Finally, involving local stakeholders who are embedded in the target population may trigger a broader local involvement in the research process, facilitating data collection and generating more feedback and acceptance and usability of the results [ 43 ].
Hypothesis on typology structure
A multiplicity of typologies could describe the same faming environment depending on the typology objective and thus the selected criteria for typology development [ 43 ]. In the proposed framework ( Fig 8 ), the typology development is based on the formulation of a hypothesis on the diversity of the target population by the local experts, the design panel, in order to guide the selection of variables to be used in the multivariate statistical analysis. The hypothesis relates to the main features of local agriculture, stakeholder assumptions and theories on farm functioning and livelihood strategies in the local context, and on their interpretation of the relevant external forces and mechanisms that can differentiate farm households. Heterogeneity can emerge in response to very diverse socio-cultural, economic and biophysical drivers that can vary in significance within the studied region. In addition to the primary discriminatory features, the hypothesis can also make the following features explicit; the most prominent types of farms that are expected, their relative proportions, the most crucial differences between the farm types, the gradients along which the farms may be organized and possible relationships or correlations between specific farm characteristics. These perceptions and theories about the local diversity in rural livelihoods and farm enterprises are often present but are not always made explicit; the hypothesis formulation by the design panel is meant to make these explicit and intelligible to the external researchers. Hence, the design panel is expected to reflect on the drivers and features of the farm diversity encountered in the targeted population and reach a consensus on the main differentiating criteria and, ideally, have a preliminary inventory of the expected farm types.
An example of a hypothesis formulated by local experts could be that farms are distinguished by the size of the livestock herd, their reliance on external feeds and their proximity to livestock sale-yards; thus, there may be a gradient from large livestock herds, very reliant on external feeds, and close the sale-yards, to small herds, less reliant on external feeds further away from sale-yards. The discussions of the design panel are guided by the general typology objective. The hypothesis can further be informed by other participatory methods, previous studies in the area or by field observations. This allows for a wide range of information to be used for the hypothesis consolidation. Most of the information compiled in the formulated hypothesis is qualitative, but can also be informed by maps and spatial data in geographical information systems. The statistical analysis that follows will use quantitative features and boundaries of the farm entities in the study region.
Data collection, sampling and key variables selection
The creation of a database on the target population is an essential step in the typology construction based on quantitative methods. The farm sampling needs to capture the diversity of the target population [ 41 ]. The size of the sample and the sampling method [ 53 ] affect the proportion of farms belonging to each resulting farm type; for instance a very small farm type is likely to be absent in a reduced sample. Thus the sampling process, notably the choice of sample size, should be guided by the initial hypothesis.
The survey questionnaire needs to reflect the hypothesis formulated in the previous step, i.e. containing at least the main features and differentiation criteria listed by the design panel. However, the survey can be designed to capture the entire farming system [ 1 , 8 ], collecting information related to all its components (i.e. household/family, cropping system, livestock system), their interactions, and the interactions with the biophysical environment in which the farming system is located (e.g. environmental context, economic context, socio-cultural context). The anticipated analytical methods to be applied, especially the multivariate techniques, also guide decisions about the nature of data (e.g. categorical or continuous data) to collect.
Finally, the selection of key variables for the multivariate analysis is adapted to the typology objective following the previous step of exchanges with the expert panel and hypothesis formulation. Together researchers and the expert design panel select the key variables that correspond to the formulated hypothesis. These selected key variables constitute a sub-database of the collected data, which will be used for the multivariate analysis. Kostrowicki [ 54 ] advised to favour integrative variables (i.e. combining several attributes) rather than elementary variables. The number of surveyed entities has to be larger than the number of key variables; a factor five is often advised [ 49 ].
Multivariate statistics
Multivariate statistical analysis techniques are useful to identify explanatory variables (discriminating variables) and to group farms into homogeneous groups that represent farm types. A standard approach is to apply a data-reduction method on the selected set of variables (key variables) to derive a smaller set of non-correlated components or factors. Then clustering techniques are applied to the coordinates of the farms on these new axes. Candidate data-reduction techniques include: i) Principal Component Analysis for quantitative (continuous or discrete) variables, e.g. [ 1 , 36 , 55 ]; ii) Multiple Correspondence Analysis for categorical variables, e.g. [ 33 ]; iii) Multiple Factorial Analysis for categorical variables organized in multi-table and multi-block data sets, e.g. [ 34 ]; iv) Hill and Smith Analysis for mixed quantitative and qualitative variables, e.g. [ 27 ]; v) Multidimensional scaling to build a classification configuration in a specific dimension, e.g. [ 41 , 56 ]; or vi) variable clustering to reduce qualitative and quantitative variables into a small set of (quantitative) “synthetic variables” used as input for the farm clustering, e.g. [ 57 ]. Although the number of key variables is reduced, the variability of the dataset is largely preserved. However, as a result of the multivariate analysis, not all the key variables selected will necessarily be retained as discriminating variables.
Subsequently, a classification method or clustering analysis (CA) can be applied on these components or factors to identify clusters that minimize variability within clusters and maximize differences between clusters. There are two methods of CA commonly used: i) Non-hierarchical clustering, i.e. a separation of observations/farms space into disjoint groups/types where the number of groups (k) is fixed; and ii) Hierarchical clustering, i.e. a stepwise aggregation of observations/farms space into disjoint groups/types (first each farm is a group all by itself, and then at each step, the two most similar groups are merged until only one group with all farms remains). The Agglomerative Hierarchical Clustering algorithm is often used in the typology construction process, e.g. [ 24 , 34 , 35 , 41 , 55 ]. The two clustering methods can be used together to combine the strengths of the two approaches, e.g. [ 15 , 58 , 59 ]. When used in combination, hierarchical clustering is used to estimate the number of clusters, while non-hierarchical clustering is used to calculate the cluster centres. Some statistical techniques exist to support the choice of the number of clusters and to test the robustness of the cluster results, such as clustergrams, slip-samples or bootstrapping techniques [ 49 , 60 , 61 ]. The “practical significance” of the cluster result has to be verified [ 49 ]. In practice, a limited number of farm types is often preferred, e.g. three to five for Giller et al. [ 8 ], and six to fifteen for Perrot and Landais [ 42 ].
Hypothesis verification and typology validation
The resulting farm types have to be conceptually meaningful, representative of and easily identifiable within the target population [ 62 ]. The farm types resulting from the multivariate and cluster analysis are thus compared with the initial hypothesis (cf. Section ‘Hypothesis on typology structure’; Fig 8 ), by comparing the number of types defined, their characteristics and their relative proportions in the target population. The correlations among variables that have emerged from the multivariate analysis can also be checked with local experts. This has to be part of an iterative process where the results of the statistical analysis are compared with the reality of the target population in discussion with the expert panels ( Fig 8 ). When involved in this process, local stakeholders can help in understanding the differences between the hypothesis and the results of the statistical analysis. In the case of results that deviate from the hypothesis, the multivariate and cluster analysis may need to be repeated using a different selection of variables, by examining outliers or the distributions of the selected variables. The discussion and feedback sessions with local stakeholders (‘design panel’ of experts) may need to be re-initiated until no new information emerges from the feedback sessions. Later, the driving effects of external conditions (such as biophysical and socio-economic features) on farming systems differentiation can be tested statistically analysing the relationships between the resulting farm types and external features variables.
Finally, when the design panel recognizes the farm types identified with the statistics analysis, an independent validation of the typology results and its usability by potential users is desired ( Fig 8 ). Preferably, to allow an independent verification of the constructed typology, a ‘validation panel’ should be independent of the design panel that formulated the hypothesis. The resulting typology is presented to the validation panel whose members are asked to compare it with their own knowledge on the local farming systems diversity. The objective of this last step is to, in hindsight, demonstrate that the simplified representation reflected in the typology is a reasonable representation of the target population and that the typology satisfies the project goals. Some criteria were proposed to support the validation process of the typology by the validation panel ([ 3 ] cited by [ 4 ]): i) Clarity –farm types should be clearly defined and thus understandable by the local stakeholders (including the validation panel); ii) Coherence –examples of existing farms should be identifiable by the local experts for each farm type, and, any gradient highlighted during the hypothesis formulation should be recognizable in the typology results; iii) Exhaustiveness –most of the target population should be included in the resulting farm types; iv) Economy –the typology should include only the necessary number of farm types to represent most of the target population diversity; and, v) Utility and acceptability –the typology should be accepted and judged as useful by the stakeholders (especially by the validation panel), for instance by providing diagnostics on the target population like the production constraints per identified farm type.
Thus, eventually the typology construction has gone through two triangulation processes: expert triangulation (by design panel and validation panel) and methodological triangulation (using statistical analysis and participatory methods).
General discussion
Importance of the learning process.
The hypothesis-based typology construction process constitutes a learning process for the stakeholders involved such as local experts, local policy makers and research for development (R4D) project leaders, and for the research team that develops the typology. For the local stakeholders, the process could lead to a more explicit articulation of the perceived (or theorised) diversity within the farming population and use of the constructed typology. The process involves an exchange of ideas and notions, and provides incentives to find consensus among different perspectives. Obviously, the resulting typology itself allows for reflection on the actual differences between farming households and on opportunities for farm development. By recognizing different farm types and the associated distributions of characteristics, typologies could also help farmers to identify development pathways through a comparison of their own farm household system with others ( Where am I ?), identifying successful tactics and strategies of other farm types ( What can I change ?) and their performances ( What improvement can I expect ?).
The research team not only gains a quantitative insight into the diversity and its distribution from the developed typology, but also obtains a detailed qualitative view on the target population, particularly if selected farms representing the identified farm types are studied in more detail. Indeed, the interactions with local experts and discussions about the interpretation of the typology could also provide insights into, for instance, socio-cultural dynamics and power relations within the farming population and local institutions, as well as other aspects not necessarily collected during the survey. For example, social mechanisms can become more visible to the researcher when the relationships between farm types are described during the discussions with the expert panels.
Farm/household dynamics
Farms are moving targets [ 8 ], while typologies based on one-time measurements or data collection surveys provide only a snapshot of farm situations at a certain period of time [ 54 ]. Due to farm dynamics, these typologies could become obsolete and hence it is preferable to regularly update typologies [ 28 , 29 ].
However, it has been argued that typologies based on participatory approaches tend to be more stable in time [ 29 ], because they are more qualitative and therefore could also integrate the local background and accumulated experience from the local participants. Consequently, the resulting qualitative types change less over time, although individual farms may change from one farm type to another [ 26 , 34 ]. Thus, the framework presented here would allow combining the longer-term (and more qualitative) vision of the local diversity from the local stakeholders including the general observed trend into the hypothesis formulation, and the shorter-term situation of individual households.
Typologies as social constructs
It is important to recognize that typology construction is a social process, and therefore that typologies are social constructs. The perspectives and biases of the various stakeholders in the typology construction process, including methodological decision-making by the research team (such as the selection of the key variables, selection of principal components and clusters, and their interpretation, etc.) shape the resulting typologies, and subsequently their usability in research and policy making. Consequently, participatory typology construction may be considered as an outcome of negotiation processes between different stakeholders aiming to reach consensus on the interpretation of heterogeneity within the smallholder farming population [ 63 ]. The consensus-oriented hypothesis formulation described here is also a way to mitigate the dominance of particular stakeholders in shaping the typology constructing process. Multiple consultations, feedbacks to the local stakeholders and the typology validation by the independent assessors (the validation panel) further limit the dominant influence of more powerful stakeholders.
Typology versus simpler farm classification
Taking into account multiple features of the farm household systems, typologies facilitate the comparison of these complex systems within a multi–dimensional space [ 7 ]. However, with multivariate analysis, the underlying structure of the data defines the ranking of dimensions in terms of their power to explain variability. Therefore, as shown previously (cf. Section ‘ Results and discussion on the contrasting typologies ’), there is no guarantee that the multivariate analysis will highlight one specific dimension targeted by the researcher or the intervention project. Thus, if the goal is simply to classify farms based on one or two dimensions, a simpler classification based only on one or two variables may suffice to define useful farm classes for the intervention project. For example, an intervention project focused on supporting new legume growers, could classify farm(er)s on their legume cultivated area and their years of experience with legume cultivation only. In that case, we would not use the term farm typology but rather farm classification.
Farm types and individual farmers
Farm typologies are groupings based on some selected criteria and the farm types tend to be homogeneous in these criteria, with some intra-group variability. Thus, typologies are useful for gathering farmers for discussion such that one would have groups of farmers who manage their farms similarly, have similar general strategies, or face similar constraints and have comparable opportunities. This is how typologies can be especially helpful in targeting interventions to specific farm types. However, individual farm differences remain; criteria that were not included in the typology and also individual farmer characteristics, such as values, culture, background or personal goals and projects can account for the observed individual farm differences. Thus, when interacting with individual farmers, much more farm-specific, social (household and community) and personal features can arise, for example their risk aversion or other hidden (non-surveyed) issues that would influence their adoption of novel interventions. This highlights the intra-type heterogeneity and also exposes the potential pitfalls when targeting interventions to be adopted by farmers.
Agricultural research and development projects that evaluate or promote specific agricultural practices and technologies usually provide a particular set of interventions, for instance oriented towards soil conservation, improvement of cropping systems or animal husbandry. The focus and aims of such projects shape also the differentiation of the project’s target population into farm types that are often used for targeting interventions. In addition, a project’s specific impact and out-scaling objectives influence the number of farmers targeted and the spatial scale at which the interventions need to be disseminated, thus influencing the farmer selection strategy. Constructing farm typologies can help to get a better handle on the existing heterogeneity within a targeted farming population. However, the methodological decisions on data collection, variable selection, data-reduction and clustering can bear a large impact on the typology construction process and its results. We argue that the typology construction should therefore be guided by a hypothesis on the diversity and distribution of the targeted population based both on the demands of the project and on prior knowledge of the study area. This will affect the farming household selection strategy, the data that will be collected and the statistical methods applied.
We combined hypothesis-based research, context specificities and methodological issues into a new framework for typology construction. This framework incorporates different triangulation processes to enhance the quality of typology results. First, a methodological triangulation process supports the fusion of i) ‘snapshot’ information from household surveys with ii) long-term qualitative knowledge derived from the accumulated experience of experts. This fusion results in the construction of a contextualized quantitative typology, which provides ample opportunities for exchange of knowledge between experts (including farmers) and researchers. Second, an expert triangulation process involving the ‘design panel’ and the ‘validation panel’, results in the reduced influence of individual subjectivity. As shown in the Zambian illustration, the typology results were highly sensitive to the typology objective and the corresponding selection of key variables, and scale of the study. Changing from one set of variables to another or, from one scale to another, resulted in the surveyed farms shifting between types (Figs 5 and 6 ). We have thus highlighted the importance of having a well-defined (and imbedded in local knowledge) typology objective and hypothesis at the beginning of the process. Taking into account both triangulation processes in the presented framework, we conclude that the framework facilitates a solid typology construction that provides a good basis for further evaluation of entry points for system innovation, exploration of tradeoffs and synergies between multiple (farmer) objectives and to inform decisions on improvements in farm performance.
Supporting information
S1 dataset. data used for the typology construction..
https://doi.org/10.1371/journal.pone.0194757.s001
Acknowledgments
The fieldwork of this study was conducted within the Africa RISING/SIMLEZA research-for-development program in Zambia that is led by the International Institute of Tropical Agriculture (IITA). The research was partly funded by the United States Agency for International Development (USAID; https://www.usaid.gov/ ) as part of the US Government’s Feed the Future Initiative. The contents are the responsibility of the producing organizations and do not necessarily reflect the opinion of USAID or the U.S. Government.
In addition, we would like to thank the CGIAR Research program Humidtropics and all donors who supported this research through their contributions to the CGIAR Fund. For a list of Fund donors please see: https://www.cgiar.org/funders/ .
- View Article
- Google Scholar
- 3. Legendre R. Dictionnaire actuel de l'éducation. Montréal, Guérin; 2005. French.
- 4. Larouche C. La validation d’une typologie des conceptions des universités en vue d’évaluer leur performance. Doctoral dissertation, Université Laval, Québec. 2011. www.theses.ulaval.ca/2011/27956/27956.pdf . French.
- 6. Capillon A. Typologie des exploitations agricoles: contribution à l’étude régionale des problèmes techniques. Tomes I et II. Doctoral dissertation, AgroParisTech (Institut National Agronomique Paris-Grignon). 1993. French.
- 18. Timler C, Michalscheck M, Alvarez S, Descheemaeker K, Groot JCJ. Exploring options for sustainable intensification through legume integration in different farm types in Eastern Zambia. In: Ӧborn I, Vanlauwe B, Phillips M, Thomas R, Atta-Krah K. Sustainable Intensification in Smallholder Agriculture: An Integrated Systems Research Approach. Routledge, Taylor & Francis Group 2016.
- PubMed/NCBI
- 23. Albaladejo C, Duvernoy I. La durabilité des exploitations agricoles de fronts pionniers vue comme une capacité d'évolution. In: Journées du Programme Environnement-Vie-Société ‘les Temps de l’Environnement’. Toulouse, France, 5–7 November 1997; 203–210. French.
- 33. Kostrowicki J, Tyszkiewicz W, editors. Agricultural Typology: Selected Methodological Materials. Instytut Geografii Polskiej Akademii Nauk. 1970.
- 40. Mbetid-Bessane E, Havard M, Nana PD, Djonnewa A, Djondang K, Leroy J. Typologies des exploitations agricoles dans les savanes d’Afrique centrale: un regard sur les méthodes utilisées et leur utilité pour la recherche et le développement. In: Savanes africaines: des espaces en mutation, des acteurs face à de nouveaux défis. Actes du colloque, Garoua, Cameroun, Cirad-Prasac. 2003. French.
- 42. Perrot C, Landais E. Exploitations agricoles: pourquoi poursuivre la recherche sur les méthodes typologiques?. Cahiers de la Recherche Développement. 1993; 33. French.
- 46. Aregheore EM. Country Pasture/Forage Resource Profiles Zambia. FAO. 2014. http://www.fao.org/ag/agp/AGPC/doc/Counprof/zambia/zambia.htm . Accessed: 15 September 2016.
- 47. Malapit HJ, Sproule K, Kovarik C, Meinzen-Dick RS, Quisumbing AR, Ramzan F, et al. Measuring progress toward empowerment: Women’s empowerment in agriculture index: Baseline report. International Food Policy Research Institute. 2014.
- 48. Central Statistics Office. 2011. http://www.zamstats.gov.zm . Accessed: 15 September 2015.
- 49. Hair JF, Black WC, Babin BJ, Anderson RE. Multivariate Data Analysis: A Global Perspective, Seventh Edition, Pearson. 2010.
- 53. Kumar R. Research methodology: a step-by-step guide for beginners, Fourth Edition. Sage, Los Angeles. 2014. http://www.uk.sagepub.com/kumar4e/
- 60. Mucha HJ. Assessment of Stability in Partitional Clustering Using Resampling Techniques. Archives of Data Science (Online First) 1. 2014.
Your Article Library
Theories of agriculture: locational theories of agriculture.

ADVERTISEMENTS:
Read this article to get information on 1. Von Thunen’s Location Theory 2. Von Thunen’s General Theory of Land Use 3. Relevance of von Thunen Model 4. Sinclair’s Theory and 5. Olof Jonasson’s Theory!
The locational analysis of agricultural land use provides an explanation of it. Some of the locational theories of agriculture and will mainly focus on Johann Heinrich von Thunen’s theory of agricultural location.
1. Von Thunen’s Location Theory :
The analysis of land use patterns has long been one of geography’s basic concerns. At first, it might appear as if agricultural land use is little affected by relative location, once the factor of a suitable market has been acknowledged. Indeed, the farmer does adapt his land use to site conditions, climate, land forms, and soils.
However, the effects of the market situation cannot be disposed of as easily as all that. Johann Heinrich von Thunen (1983-1850), a German economist and estate owner of the early 19th century, developed a theory of agricultural location that is still worth considering.
This model is based on an econometric analysis of his estates in Mecklenburg, near Rostock in Germany. Most of the data used in explaining his theory were obtained by him through practical experience. He attempted to construct a theoretical model of land use pattern, giving a particular arrangement of towns and villages in a situation experienced in Mecklenburg.
The main aim of von Thunen’s analysis was to show how and why agricultural land use varies with the distance from a market.
He had two basic models:
1. The intensity of production of a particular crop declines with the distance from the market. Intensity of production is a measure of the amount of inputs per unit area of land; for example, the greater the amount of money, labour and fertilisers, etc., that are used, the greater the intensity of agricultural production.
2. The type of land use will vary with the distance from the market.
The von Thunen’s location theory or model states that if environmental variables are held constant, then the farm product that achieves the highest profit will outbid all other products in the competition for location.
The competitive position of a crop or livestock activity (namely, how high the bidding needs go to secure a desirable site) will depend on the level of return anticipated from producing at the particular location.
A product with a high expected return and therefore, high rent-paying ability will be able to outbid a product with a lower profit level and, therefore, a relatively modest rent-bid ceiling.
By carefully compiling economic data on different farming activities on his own large estate Tellow in north-eastern Germany, von Thunen was able to determine the relative rent-paying abilities of each major agricultural product. Of course, the technology and agricultural products he managed in the early 19th century were different from those of today.
But, there are sufficient similarities to allow the analysis to be updated for our purpose. Moreover, his explanation was truly general, allowing his explanation approach to be applied to most contemporary agricultural situations.
Following von Thunen’s reasoning, the ranking of agricultural activities on the basis of rent-paying ability in the decreasing order are as follows:
Von Thunen’s theory is based on certain assumptions.
These are as follows:
1. There is an ‘isolated state’ (as von Thunen called his model economy), consisting of 1 market city and its agricultural hinterland.
2. This city is the market for surplus products from the hinterland and receives products from no other areas.
3. The hinterland ships its surpluses to no other market except the city.
4. There is a homogeneous physical environment, including a uniform plain around the city.
5. The hinterland is inhabited by farmers who wish to maximise their profits, and who adjust automatically to the market’s demands.
6. There is only one mode of transport – the horse and wagon (as this was 1826).
7. Transportation costs are directly proportional to distance, and are borne entirely by the farmers, who ship all produce in a fresh state.
Von Thunen’s model examines the location of several crops in relation to the market.
The location of crops, according to him, is determined by:
(i) The market prices,
(ii) Transport costs, and
(iii) The yield per hectare.
The transport cost varies with the bulk and the perishability of the product. The crop with the highest locational rent for the unit of land will always be grown, since, it gives the greatest returns and all farmers attempt to maximise their profit. Two crops may have the same production costs and yields but difference in transport costs (per ton/kilometre) and market prices influence the decision-making of the farmers. If commodity A is more costly to transport per ton/kilometre and it has a higher market price, A will be grown closer to the market than В (Figure 14.1).

The locational rent of A decreases more rapidly than that of B, because of A’s higher transport costs. As the market price of A is greater than B, the total revenue is higher at the market for A than B.
Thus, the market of the locational rent of A is greater than B, because production costs are the same and no transport costs are incurred. If the market price of В was greater than that of A, A would not be grown at all.
In his model von Thunen has explained three stages of the growth of agricultural landscape in an isolated state as shown in Figure 14.2.

The single urban centre and undifferentiated landscape of von Thunen’s model landscape is portrayed in Figure 14.2. Where are the most desirable farming locations situated? For every farmer, regardless of the crop or type of livestock raised, the answer is indisputable: as close as possible to the central market. The market is the destination for agricultural goods produced throughout the region.
Next, assume that all the land in the heretofore undifferentiated landscape is placed on the auction block at the same time. The myriad of vegetable, dairy, mixed crop and livestock, wheat, and cattle-ranch land users eagerly submit their rent-bids to the landowners. All these actors prefer to purchase the right to use farmland near the market.
However, vegetable farmers have a higher relative rent-paying ability near to the market than their competitors; hence, at the auction the vegetable farmers will outbid all the others. The vegetable producers will thereby acquire the right to farm the land adjacent to the market.
Since, the undifferentiated landscape presents no advantages of being on a particular side of the market, the land users will distribute themselves circularly around the centre so as to minimise their distance to the town.
The bidding continues after vegetable farmers are accommodated. Since, dairy farmers rank next highest in rent-paying ability, they will successfully outbid the remaining contestants for locations in the next most accessible zone. Dairy farmers, too, arrange themselves in a circular fashion.
There arises a definite formation of concentric rings of different land uses circumscribing the market (Figure 14.2-B). The remaining agricultural systems can be arranged concentrically around the market centre in the same fashion, according to their competitive economic positions. The completed pattern of production rings is shown in Figure 14.2-C.
2. Von Thunen’s General Theory of Land Use:
On the basis of the above-mentioned assumptions, von Thunen constructed a general land use model; having a number of concentric zones around a market town (its three stages of growth have already been mentioned).
The perishable, bulky and/or heavy products, according to this model, would be produced in the belts nearer to the town. The more distant belts would specialise in products which were less in weight and volume but fetched higher price in the market as they could afford to bear relatively higher transportation costs.
The final model was conceived as having specialised agricultural enterprises and crop-livestock combination. Each belt, according to von Thunen, specialises in the production of those agricultural commodities to which it was best suited (Figure 14.3).

It becomes clear from Figure 14.3 that the production of fresh milk (in the context of Europe) and vegetables was concentrated in the Zone I nearest to the city, because of the perishability of such products.
In this zone, the fertility of land was maintained by means of manuring and, if necessary, additional manure was brought from the city and transported to short distances to the farm.
The Zone II was used for production of wood, a bulky product in great demand in the city as a fuel in the early part of the 19th century. He showed, on the basis of his empirical data, that forestry yielded a higher locational rent, since its bulkiness meant relatively higher transport cost.
The Zone III represents crop farming where rye was an important market product, followed by other farming zones with a difference of the intensity of cultivation. As the distance from the market increased, so the intensity of rye production decreased with a consequent reduction in yields. There was no fallowing and manuring to maintain soil fertility.
In the next Zone IV the farming was less intensive. Farmers used a seven-year crop rotation in which rye occupied only one-seventh of the land. There was one year of rye, one of barley, one of oats, three of pastures and one of fallow.
The products sent to the market were rye, butter, cheese, and occasionally, live animals to be slaughtered in the city. These products did not perish so quickly as fresh milk and vegetables and could, therefore, be produced at a considerably greater distance from the market. In the most distant of the zones supplying rye to the city Zone V, farmers followed the three-field system.
This was a rotation system whereby one-third of the land was used for field crops, another one-third for pastures and the rest was left fallow. The farthest zone of all, i.e., Zone VI was the one of livestock farming. Because of the distance to the market, rye did not produce so high a rent as the production of butter, cheese or live animals (ranching). The rye produced in this zone was solely for the farm’s own consumption. Only animal produce were marketed.

The economic rent considering three crops (horticulture, forest products and intensive arable cereals) has been plotted in Figure 14.4, while Figure 14.5 shows a simplified model of concentric Figure 14.5 zones.
It may be seen from Figure 14.5 д simplified von Thunen’s model that Zone 1 in which the economic rent is high is devoted to horticulture (fruits and vegetables), while Zone II was devoted to forest products (like fuel wood) as the transportation cost of fuel wood is high. The Zone III is that of intensive arable land devoted to cereal crops.

In this model, the distinctive aspects are land values, land use intensity and transportation costs. A brief explanation of these aspects is as follows:
Land Values :
For agricultural land users the locations with better access (nearer) to the central market, bids up the value of land. Land values become so high that only those producers who yield the greatest locational rents can afford it.
A distance-decay relationship and an inverted cone is revealed, with land values declining as distance from the central peak increases. The locational advantage of proximity to the market is reflected in higher land values; as accessibility declines, so do land values.
Land Use Intensity :
In direct response to the land value pattern, land use intensities also decline with increasing distance from the centre.
Producers on farmland with better access to the central market must use that land intensively to produce high enough revenues to afford to be located there. This results in high person-hour inputs per unit area of land for central farms, thereby requiring large hired-labour forces.
Farm size is another indicator as to the intensiveness of agricultural production; farm size generally increases with increasing distance from central markets. High land prices encourage farms to be comprised of fewer acres.
Thus, in the inner zones, financing may be difficult to obtain on a scale necessary to support large farm operations. Relatively less capital intensive land (such as chicken sheds) will therefore, substitute for relatively more expensive land.
The lower value of outer farmland permits the more lavish or extensive use of agricultural space. Because, both the cost of land and farm size change with changing accessibility to the market and aggregate locational rent per farm can be fairly constant across the landscape. For example, the aggregate locational rent for a 50 acre vegetable farm in the inner production ring can be roughly equivalent to a 1,000 acre ranch in the most peripheral zone.
Transportation Costs :
The small variation of per farm aggregate locational rent across the Thunian zones is a result of site cost decreasing at approximately the same rate as transportation costs increase (Figure 14.6).
High land values near the market are in a sense payments for savings in product-movement costs. Moreover, inner-ring farming is distinguished by the production of goods that do not easily withstand long-distance transportation. Highly perishable commodities such as fruits, vegetables, and dairy products share this low transferability.

In fact, situations discussed in von Thunen’s model were that of early 19th century era. The original Thunian model contained forestry (in its second ring) near to market, because heavy weight wood used for fuel and construction was expensive to transport. By the second half of the 19th century, cheaper rail transportation changed the entire pattern.
Finally, von Thunen incorporated two examples of modifying factors in his classic model. The effect can clearly be seen of a navigable river where transport was speedier and cost only one-tenth as much as on land, together with the effect of smaller city acting as a competing market centre. Even the inclusion of only two modifications produces a much more complex land use pattern.
When all the simplifying assumptions are relaxed, as in reality, a complex land use pattern would be expected. The catalytic factor in von Thunen’s model was transport cost and the main assumption was the assumption of an ‘isolated state’. In the modified von Thunen model, the influence of fertility, subsidiary town, information, etc., has been incorporated.
The concentric zones of the model get modified under the impact of various physical, socio-economic and cultural factors. The influence of availability of information also substantially modifies the concentric zone of agricultural land use.
Critical Analysis :
The theory of agricultural location was presented by von Thunen in the early 19th century. Since then, several scholars including geographers have applied it in various parts of the world and have pointed out certain aspects which are not applicable in a way as pointed out by von Thunen.
Many aspects of this model have changed due to development in agricultural system, transportation system and also due to other technological developments. There are also certain regional geo-economic factors which not only direct but determine the pattern of agricultural land use.
The main points raised by scholars regarding this theory are as follows:
1. The conditions described in this model, i.e., in an isolated state, are hardly available in any region of the world. There are internal variations in climatic and soil conditions. The von Thunen’s assumptions that there are no spatial variations in soil types and climate are rare.
2. It is not necessary that all types of farming systems as described by von Thunen in his theory exist in all the regions. In many European countries location of types of farming in relation to market are no longer in existence.
3. The Thunen’s measures of economic rent and intensity are difficult to test because of their complexity. The measurement of number of man-days worked in a year, cost of labour per hectare or cost of total inputs per hectare is not uniform in intensive and extensive types of farming. Similar is the case with the measures of intensity,
4. Von Thunen himself has admitted that with the change in location of transportation or market centre the pattern of land use will also change.
5. The location of transport link and its direction used to change the pattern of agricultural land use is depicted in Figure 14.7 (a) and (b).

6. Similarly, if there are two market centres, the pattern of land use will be according to Figure 14.8.

7. In case of three market centres the land use pattern will emerge like in Figure 14.9.

8. The situation will be entirely different when there are several market centres in a region (Figure 14.10).

9. During the past 160 years, there have been sizeable changes in agricultural land use and the economy with which it interacts. The most important of the changes have been improvements in transportation technology; these improvements now permit a space-time convergence of distant places, thereby expanding the scale of possible economic organisation.
In von Thunen’s day, heavily loaded horse-drawn carts moved to market at the rate of about 1 mile an hour.
A journey from the wilderness edge to the market centre would require more than two full days, without pauses for rest. Therefore, the truest measure of economic distance in the Thunian model – the absolute mileage beyond which farming was simply too far from the market and could no longer yield locational rent — is in terms of a 50-hour time – distance.
If that 50-hour time – distance radius is constant as the Thunian farming system evolves, what would be its territorial extent today? It may be in thousands of kilometres in case of USA or Russia.
10. Environmental variables, as pointed out in connection with the physical limits model, are only a general locational constraint and play a passive role in shaping the distribution of modern commercial agriculture. In the human-technological context, the employment of artificial irrigation, chemical fertilisers, and the like, allows farmers to overcome most environmental barriers.
11 With changes in transportation conditions, the macro-Thunian system has also been modified since its emergence. A continuous process is involved that works to maximise locational utility. Demand for better access begets technological development, which results in transport innovation and culminates into change in pattern of agricultural land use.
12. Three kinds of economic empirical irregularities can be anticipated to influence the national Thunian pattern: transportation biases, distant concentrations of production that appear inconsistent with his model, and secondary markets.
13. The von Thunen model is also static and deterministic. Today, we know that economic growth and changes in demand will alter the spatial patterns of agricultural systems and land use, which in turn influence the rate of change. It might be possible to postulate a dynamic von Thunen model that could be applied to the changing conditions.
But, the model, despite these possible manipulations, is really static, since, it represents a land use system at one point in time, von Thunen was not concerned with transitional changes, since, he and most of the direct extenders of his model assumed that any change in technology, demand, or transport cost would automatically be accompanied by an adjustment in the land use system.
The Thunian model was developed in the early 19th century, since then, conditions have entirely been changed. Therefore, it is not desirable to accept this model in its original form as observed by many scholars. But this model is still considered to be significant in many ways.
3. Relevance of von Thunen Model :
Almost two hundred years ago, Johann Heinrich von Thunen demonstrated that the geographic pattern of agricultural land use was highly regular and predictable. He first described the pattern of land use within and surrounding his own large estate.
Based upon these descriptions he next formulated a hypothesis to explain the geographic pattern. His hypothesis was that the higher the cost of transportation, the lower the amount a tenant farmer would be willing to pay to use the land.
He expressed his hypothesis using clear and unambiguous mathematics. He reasoned that by placing reasonable numerical values into his mathematical formulation he could closely predict actual land values and land uses.
Among his general conclusions were that land values decline with increasing distance from the market centre; and that land values and land uses change as the various costs of production, transportation, and prices of agricultural commodities change.
Today, the cost and technology of transportation has had a dramatic effect upon the agricultural land use patterns that one would expect by applying von Thunen’s logic. Agricultural land use patterns that are evident surrounding market centres are thought to be historic remnants of a bygone era, or the result of administrative institutions whose existence brings about a usage to the historic patterns of land use. At the scale of the continent and the globe we now can observe von Thunen-like market forces and patterns of land use.
The von Thunen logical framework has been important in the evolution of our thinking of how land values and land uses came about in the modern city. Indeed, von Thunen’s general theory of land values and land uses has been important in the evolution of thought.
Von Thunen was one of the first to adopt the ‘new math’s’ of his era, calculus, and to apply that mathematics to a problem of the social sciences. He was a pioneer in the use of data for the verification of his normative theory, von Thunen’s innovative research method was similar in composition to what we would today call computer simulation. Indeed, much of the approach to social science thought today can be traced back to von Thunen’s general method of analysis as its precursor.
His contribution to modern thinking in the social sciences stands unparalleled. His general approach became diffused through its adoption by the leading scholars of the generations that followed him, and by their adoption of his general method in their own work, von Thunen’s application of his general method to his own land use theory became generally accessible only in the early 1950s when Edgar S. Dunn published his interpretation in English, von Thunen is no exception among the greats whose reasoning in time is recognised to have contained an error.
The beauty of using mathematics over mere verbalisation to express concepts or hypotheses is that when an error is made it can often be corrected irrefutably. Dunn found an error in von Thunen’s treatise and corrected it. It can be recalled from the discussion above that a caveat was to be presented to von Thunen’s general theory: once the hierarchical ranking of farming systems was established, such as that listed in Table 14.1, those of lower ranking would always be outbid by those of higher ranking should both happen to be competing for the same land.
Instead, Dunn correctly reasoned that since locational rent changed by a different amount for each agricultural product with distance from the central market, then at some locations a lower ranking farming system could indeed outbid a higher ranking farming system, even though positive rents were bid by the higher ranking farming system.
All over the world, scholars have tested and applied the von Thunen’s theory of agricultural location. The greatest importance of the theory lies in this fact that it has given a new direction of thinking, resulting into the modified way of its application.
Von Thunen himself relaxed certain assumptions of his model. First, he introduced a canal along which transportation costs were lower than by horse and wagon. The effect was to create a series of wedge-shaped land use zones along the canal. Second, he introduced a second and smaller market, around which he postulated that a series of separate zones would be created.
Similarly, we could relax the assumptions by introducing yet another means of transport, such as a railroad or allow variation in the physical environment.
The extent to which these relaxations affect the simple von Thunen model will depend on how they affect the simple conceptual framework put forward earlier.
Some researchers have used von Thunen’s model as a general framework for interpreting the spatial framework of the economy. Others have worked on a more direct basis. Thus, von Thunen’s model has been applied to the distribution of European agriculture in 1925.
Muller’s interpretation of a normative macro-Thunian model for the United States, anchored by a megalopolis, is shown in Figure 14.11. Its utility for explaining the national pattern of agricultural production is demonstrated as follows:

We begin again by relaxing the normative assumptions of the isolated state model, but this time with the realisation that empirical irregularities will be complex in the sophisticated economic space of the present-day continental United States.
However, because we are concerned only with the overall organisational framework of farming regions at a high level of spatial generalisation, the search is not complicated: if macro-Thunian processes have shaped the production pattern, then empirical response to them will be easily discernible.
The main task is to set up the investigation by cataloging physical-environmental and economic-empirical irregularities in order to derive an appropriate map of the expected real-world spatial pattern.

Empirical evidence of Thunian spatial systems is also widespread beyond the United States. Figure 14.12-A shows the macro-scale pattern of agricultural intensity for the European continent, which is sharply focused on the conurbation ringing the southern margin of the North Sea, from London and Paris to Copenhagen. By combining the American and European patterns and proceeding to a yet greater level of spatial aggregation, one can even perceive (in Figure 14.12-B) a global-scale Thunian system focused on the “world metropolis” that borders the North Atlantic Ocean.
Regarding application of the Thunian model in developing countries M.H. Hussain (2010) has observed that in many of the underdeveloped and developing countries of the world, in both the villages and towns, cropping belts are found. In the villages of the Great Plains of India similar patterns can be observed.
The highly fertile and adequately manured lands around the village settlements are devoted to the perishable and more fertility requiring crops, e.g., vegetables, potatoes, oats and orchards in the land lying in the middle belt; crops like rice, wheat, barley, pulses, sugarcane, gram, maize, etc., are grown subject to the texture, drainage and other properties of the soils.
In the outer fringes fodder crops and inferior cereals (bajra, millets) are sown. Alter the introduction of tube well irrigation in the great plains of India, this pattern has, however, been largely modified as the farmers with better inputs are able to produce perishable crops even in the distant fields from the settlements.
The consolidation of holdings in India has also modified the crop intensity rings as each of the farmers is interested in growing the commodities tor his family consumption as well as some marketable crops for earning cash to clear his arrears of land revenue and irrigation charges and to purchase the articles from the market for his family consumption.
In some of the developing countries like India, Pakistan and Mexico the introduction of HYV (high yielding variety) has disturbed the application of von Thunen model.
The fast development of means of transportation has made it possible to transport the perishable goods at long distances in short period of time. Thus, the model advocated by von Thunen is no longer operative in its original form.
Thunian distance relationships can also be discerned at the national level in smaller developed countries such as Uruguay. Allowing for that nation’s empirical irregularities, Ernst Griffin discovered that the expected Thunian pattern accorded nicely with the actual intensity of agricultural land use. Continuing down the level of generalisation continuum from mesoscale to microscale, Thunian influences are often observed to shape farming at the local level. Moreover, local agricultural productions in the less developed world, where technological conditions are more comparable to those of von Thunen s days, May even exhibit spatial structures reminiscent of von Thunen’s landscape.
Ronald Horvath found just such a pattern for the area surrounding Addis Ababa, Ethiopia. Of particular significance was his discovery of an expanding transportation-oriented eucalyptus forestry zone in its classical inner position.
4. Sinclair’s Theory :
Robert Sinclair (1967) has suggested an alternative land use pattern. Basically, his thoughts were based on von Thunen theory, but he inverted von Thunen model for the zone of anticipated urban encroachment-distance relationships. Robert Sinclair detected some interesting effects on production in the innermost agricultural land in the path of metropolitan encroachment.
Spreading urbanisation appears to influence agriculture several miles in advance of the built-up frontier because farmers realise they cannot compete against the coming much-higher location rents earned by urban land uses.
Thus, metropolitan expansion is perceived as a displacement threat in the affected inner rural zone, and this is reflected in the spatial behaviour of farmers. Those closest to the urban frontier feel most threatened and keep their agricultural investments minimised.
These investments rise with distance from the frontier to the outer edge of this zone of anticipation, where the specialised agriculture of the region takes over.
Sinclair postulated four types of farming, the fifth zone — specialised feed-grain livestock or Corn Belt agriculture – is the wider regional specialty beyond the belt of expanding urban influence (Figure 14.13).

Proceeding outward from the beginning of Sinclair’s Zone 1, they are: (i) urban farming, a hodgepodge of small producing units, scattered through the already subdivided outer suburban environment, which favours poultry-keeping, greenhouses, mushroom-raising, and other building-oriented uses; (ii) vacant and temporary grazing, where farmers leave much land empty to sell to urban land speculators at the most opportune moment and allow grazing only under short-term leases; (iii) transitory field crop and grazing, a transitional agricultural type dominated by farm uses, but with definite anticipation of near-future displacement, expressed by little investment beyond the short term; and (iv) dairying and field crop farming, wherein farmers begin to shift to more extensive agriculture with a view towards encroachment in the foreseeable future.
5. Olof Jonasson’s Theory :
Olof Jonasson, the Swedish geographer, modified the von Thunen’s model, relating to the economic rent of land in relation to market and means of transportations. The modified form of von Thunen’s model devised by Jonasson is given in Figure 14.14.

Details of each zone are as follows:
Zone 1: The city itself and immediate environs, green house, floriculture.
Zone 2: Truck products, fruits, potatoes and tobacco (and horses).
Zone 3: Dairy products, cattle for beef, sheep for mutton, veal, forage, oats, flax and fibers.
Zone 4: General farming, grain hay, livestock.
Zone 5: Bread cereals and flax for oil.
Zone 6: Cattle (beef and range); horses (range); and sheep (range); salt, smoked, refrigerated, and canned meats; bones; tallow and hides.
Zone 7: The outermost peripheral area, forests.
Jonasson has applied this model the agricultural landscape patterns of Europe in 1925. He observed that in Europe and North America, zones of agricultural land use were arranged about the industrial centres.
In both the continents, i. e., Europe and North America, the most intensive development of agriculture is the hay and pastures region in which the industrial centres are situated. Around these pastures are arranged concentrically the successive grades of land use — grain-growing, pasturing and forestry. Jonasson advocated a model similar to the model of von Thunen, around a theoretical isolated city in Europe.
Jonasson also found an identical pattern of distribution on Edwards Plateau in Texas. Jonasson’s model was also adopted by Valkenburg in 1952, when he prepared a map of intensity of agriculture in Europe.
Apart from above-mentioned modifications in von Thunen’s theory, there Are several studies that have been done among them the notable are Gotewald (1959), Chisholm (1968), Hall (1966), Horvath (1969) and Peet (1969)
A few economic and decision-making models/theories have also been presented.
Some of the notable models are:
(i) Input-output models.
(ii) Theory of optimum physical conditions and limits.
(iii) Theory of optimum economic conditions and limits.
(iv) Spatial equilibrium models.
(v) Game theory.
(vi) Diffusion models.
(vii) Behavioural models.
All the above-mentioned models/theories have been used to explain the locational aspects of the agricultural land use in some way or other. But the von Thunen’s theory still has relevance because it has given a new thinking in geographical studies of the agricultural land use pattern.
Related Articles:
- World Agriculture: 8 Important Types of World Agriculture
- Intensive Method of Agriculture: Location, Cropping Pattern and Features
No comments yet.
Leave a reply click here to cancel reply..
You must be logged in to post a comment.
Help | Advanced Search
Computer Science > Machine Learning
Title: application of machine learning in agriculture: recent trends and future research avenues.
Abstract: Food production is a vital global concern and the potential for an agritech revolution through artificial intelligence (AI) remains largely unexplored. This paper presents a comprehensive review focused on the application of machine learning (ML) in agriculture, aiming to explore its transformative potential in farming practices and efficiency enhancement. To understand the extent of research activity in this field, statistical data have been gathered, revealing a substantial growth trend in recent years. This indicates that it stands out as one of the most dynamic and vibrant research domains. By introducing the concept of ML and delving into the realm of smart agriculture, including Precision Agriculture, Smart Farming, Digital Agriculture, and Agriculture 4.0, we investigate how AI can optimize crop output and minimize environmental impact. We highlight the capacity of ML to analyze and classify agricultural data, providing examples of improved productivity and profitability on farms. Furthermore, we discuss prominent ML models and their unique features that have shown promising results in agricultural applications. Through a systematic review of the literature, this paper addresses the existing literature gap on AI in agriculture and offers valuable information to newcomers and researchers. By shedding light on unexplored areas within this emerging field, our objective is to facilitate a deeper understanding of the significant contributions and potential of AI in agriculture, ultimately benefiting the research community.
Submission history
Access paper:.
- HTML (experimental)
- Other Formats
References & Citations
- Google Scholar
- Semantic Scholar
BibTeX formatted citation
Bibliographic and Citation Tools
Code, data and media associated with this article, recommenders and search tools.
- Institution
arXivLabs: experimental projects with community collaborators
arXivLabs is a framework that allows collaborators to develop and share new arXiv features directly on our website.
Both individuals and organizations that work with arXivLabs have embraced and accepted our values of openness, community, excellence, and user data privacy. arXiv is committed to these values and only works with partners that adhere to them.
Have an idea for a project that will add value for arXiv's community? Learn more about arXivLabs .
- Chronicle Conversations
- Article archives
- Issue archives
- Join our mailing list

A Hypothesis of Hope for the Developing World
About the author, william dar.
About 99 per cent of climate change casualties take place in the developing world. While economic growth and development are priorities in all countries, the needs in developing and least developed countries are on a different scale altogether. Developing countries are constrained by their particular vulnerability to the impacts of fickle weather and climate. The poor in these countries are at a higher risk to future climate change, given their heavy dependence on agriculture, strong reliance on ecosystem services, rapid growth and concentration of population and relatively poor health services. Add to this gloomy scenario insufficient capacity to adapt to climate change impacts, inadequate infrastructure, meagre household income and savings and limited support from public services and you have a veritable time bomb ticking away.
Climate change, if left unchecked, will worsen food insecurity. Millions of people in countries that suffer from food insecurity will have to give up traditional crops and agricultural methods as they experience changes in the seasons that they have taken for granted. The vicious circle of reduced crop yield, resulting in lower income and fewer resources for the following year's planting season, leads to the poor becoming poorer. So what does that imply for about 1.5 billion people, nearly 60 per cent of the workforce in developing nations, who are engaged in agriculture? Since agriculture constitutes a much larger fraction of the Gross Domestic Product in developing countries, even a small percentage of loss in agricultural productivity could snowball into a larger proportionate income loss in a developing country than in an industrial one. And of all the potential damages which could occur from climate change, the damage to agriculture could be among the most devastating.
Climate change also threatens poverty reduction because poor people depend directly on endangered ecosystems and their services for their well-being. They also lack the resources to adequately defend themselves or to adapt rapidly to changing circumstances. And more importantly, their voices are not sufficiently heard in international discussions, particularly in climate change negotiations.
As a result of global warming, the type, frequency and intensity of extreme weather, such as tropical cyclones, floods, droughts and heavy precipitation, are expected to rise even with relatively small increases in average temperatures. New climate studies show that extreme heat waves are likely to become common in the tropics and subtropics by the end of the twenty-first century. Given the fact that 2 billion people already live in the driest parts of the world where climate change is projected to reduce yields even further, the challenge of putting enough food in 9 billion mouths by 2050 is daunting!
Unhindered climate change has the potential to negatively impact any prospects for sustainable development in developing countries. As rural communities across the developing world feel the pressures of climate change, high food prices and environmental and energy crises, never have new knowledge, technologies and policy insights been more critical.
A conducive and comprehensive policy environment that enhances opportunities for smallholders, given the climate change scenario, needs to encompass all levels: farm, regional, national and global. It must include adaptation strategies, more investment in agricultural research and extension, rural infrastructure, and access to markets for small farmers.
Adaptation to climate change needs to be integrated into developmental activities. Policies on adaptation should include changes in land use and timing of farming operations, adaptive breeding and technologies, irrigation infrastructure, water storage, and water management. In addition, long-term weather forecasting, dissemination of technology, creating drought and flood-resistant crop varieties, will require national and international planning and investment.
Climate change worsens water quality and availability in regions that are already water-stressed. Almost 95 per cent of water in developing countries is used to irrigate farmlands. Therefore, improving water management for drinking and agriculture by understanding water flows and water quality, improving rainwater harvesting, water storage and the diversification of irrigation techniques is critical. Greener practices, better erosion control and soil conservation measures, agro-forestry and forestry techniques, forest fire management and finding alternative clean energy sources as well as better town planning are some other steps that can be initiated to blunt the impacts of climate change. Agriculture's contribution to greenhouse gas emissions may be reduced by new crop planting and livestock breeding technologies. In addition, the emerging market for carbon emissions trading offers new opportunities for farmers to benefit from land management that sequesters carbon.
There is an urgent need for climate change adaptation and mitigation strategies to be integrated into national and regional development programmes. Developing countries also need to participate in a globally integrated approach to this problem. The crucial role of weather and climate services and products in developing adaptation solutions must be emphasized. Available climate information in developing countries must be taken stock of in order to ascertain where the systematic observation needs are most pressing. Collaboration between national and international providers of climate information and users in all sectors, and generating awareness among different user communities of the usefulness of such information, is crucial. Climate change assessment tools are needed that are more geographically precise and are more useful for agricultural policy, programme review and scenario assessment. These tools will more explicitly incorporate the biophysical constraints that affect agricultural productivity. Packaging this data for its effective use and rescuing historical meteorological data are equally important.
Among other important elements that should feature in any national and international approach to address climate change is to engage the private sector, lower costs through the inclusion of market mechanisms, and focus on development and dissemination of new technologies. A progressive policy environment should ideally include more investment in infrastructure and education; a renewed agenda for agricultural research and increased investment in agricultural research and development; sustainable agricultural and natural resource management practices; and advanced technologies that can generate climate-resilient crop varieties and better-adapted livestock breeds. Research that improves understanding and predictions of the interactions between climate change and agriculture should be funded. Collective action to build the livelihood options and risk management capacity of vulnerable groups would be another critical step. Capacity-building to integrate climate change into sectoral development plans, involving local communities in education on climate change and raising public awareness are unavoidable if we have to overcome the serious threats posed by climate change.
Unless steps are taken to initiate and strengthen cooperation among academic and research institutions, regional and international organizations and non-governmental organizations to provide opportunities for strengthening institutions and capacity building, dealing with climate change impacts may be unmanageable. Economic diversification to reduce dependence on climate-sensitive resources is an important adaptation strategy that must be promoted. Improved food security through crop diversification, developing local food banks for people and livestock and improving local food preservation needs to be encouraged.
Given the diversity of agro-ecological zones and their inherent problems, it is also essential to assemble, document and disseminate a comprehensive and action-oriented database of adaptation options of different farming and livelihood systems and agro-ecological zones, including measures and policies, to serve the needs of smallholder farmers.
Since farmers are often constrained by access to credit, facilitating better access to credit and agricultural inputs in order to intensify integrated production systems is a related area that needs attention. Catastrophic or weather-risk insurance and index insurance (insurance linked to a particular index such as rainfall, humidity, or crop yields rather than actual loss) can be used as new climate risk management tools in developing countries. The multilateral funds that have been pledged for climate change adaptation across developing countries currently amount to about $400 million -- a sharp contrast to the $4 to $86 billion needed annually, as estimated by experts and aid agencies. There is also a great need to mobilize resources to strengthen research on the impact of climate change on agriculture in different agro-ecological zones where empirical evidence and research results remain insufficient.
One area that has been neglected is gender diversity, which needs to be tackled to bring wider perspectives into decision making, since climate change and natural disasters have gender-differentiated impacts. Women can contribute significantly to this process.
Dealing with climate change is not just a matter of reducing carbon emissions of developed nations. Developing countries have themselves begun to increase their energy demand, but they do not have the same access to -- or resources for -- clean energy technology. However, the very countries that are most vulnerable are those that have contributed least to the current atmospheric concentrations of greenhouse gasses. Climate justice will be done if there is a responsibility among the historically largest contributors to assist them in achieving development goals in ways that contribute to adaptation and mitigation goals.
The recent L'Aquila Food Security Initiative linked the need for effective actions on global food security to that concerning climate change, sustainable management of water, land, soil and other natural resources, including the protection of biodiversity. Fundamental climate change mitigation and adaptation goals will be effectively met if agriculture is included in international climate negotiations such as the UN Climate Change Conference to be held in Copenhagen, in December 2009.
The International Crops Research Institute for the Semi-Arid Tropics (ICRISAT) addresses climate change concerns with programmes supportive of dryland agriculture. It does this by developing and using sophisticated techniques of predicting and forecasting the monsoons in the context of climate change; enabling collective action and rural institutions for agriculture and natural resource management; upscaling and outscaling its community watershed management model; rehabilitating degraded lands and diversifying livelihood systems for landless and vulnerable groups; and initiating government support for water saving options.
Recognizing that managing climatic uncertainty and adapting to change cannot be an end in itself, ICRISAT has integrated climate risk management across its research agenda. Its Integrated Genetic and Natural Resource Management (IGNRM) approach to climate proofing involves better drought and heat-tolerant crop varieties grown in farming as well as land-use systems that conserve water both in the crop's root zone and in the wells and reservoirs of villagers. ICRISAT believes that in order to adapt to climate change, agricultural communities and stakeholders need to first enhance their ability to cope better with the rainfall variability associated with current climates. The Institute is currently partnering with meteorological services, Consultative Group on International Agricultural Research (CGIAR) centres and climate science specialists in several projects pertaining to climate risk management in Asia and Africa. We are helping farmers devise ways to manage landscapes, soils and crops so that more of the water and nutrient resources are stored and used more efficiently and over a longer time period.
ICRISAT already possesses crops that are tolerant of heat and high soil temperatures, a knowledge and understanding of flowering maturities, information on genetic variation for water-use efficiency, short duration crops that escape terminal drought, as well as high yielding and disease-resistant crops. For instance, we have developed short-duration chickpea cultivars ICCV 2 (Shweta), ICCC 37 (Kranti) and KAK 2 and short-duration groundnut cultivar ICCV 91114 that escapes terminal drought. We recently developed a super-early pigeonpea that flowers in 32 days and matures in about 65-70 days We have integrated trees into traditional annual cropping systems to help reduce the impacts of winds and protect soils from erosion. ICRISAT has developed plants that resist pests and pathogens, such as downy mildew-resistant improved pearl millet hybrid HHB 67 in India; wilt-resistant high-yielding pigeonpea ICEAP 00040 in Malawi, Mozambique and Tanzania and rosette-resistant groundnuts in Uganda, to name a few. Guiding our crop adaptation work are crop growth simulation models that examine the disaggregated impact of a range of climate change scenarios on our mandate crops across the semi-arid tropics of the world.
ICRISAT has an evolutionary advantage since its mandate crops are already more adapted to heat and high soil temperatures. Our breeding strategy factors in these harsh and dry conditions. What we need to better understand are the physiological mechanism underlying heat tolerance; identify wider gene pools to develop crops of wider adaptability; and develop more effective screening techniques of germplasm for desired traits. ICRISAT is also responding to challenges by exploiting the potential of 'pro-poor' opportunities for biofuel production. Its BioPower initiative argues for more investments in bio-energy crops and systems to provide a major impetus for sustainable development; and for empowering the dryland poor to benefit, rather than marginalize, so that farmers can better cope with climate change or other stresses. The current activities include developing higher-yielding sweet sorghum varieties for food, fuel, feed and fodder; pilot-scaling pro-poor commercial startup partnerships in sweet sorghum bioethanol; and research-to-development alliances for pro-poor Jatropha plantation development for biodiesel.
ICRISAT studies have generated a "hypothesis of hope" which states that the impact of climate change on yields under low input agriculture is likely to be minimal, as other factors will continue to provide the overriding constraints to crop growth and yield. Secondly, the adoption of recommended improved crop, soil and water management practices, even under climate change, will result in substantially higher yields than farmers are currently obtaining in their low input systems. Thirdly, the adaptation of better "temperature-adapted" varieties could result in the almost complete mitigation of climate change effects that result from temperature increases.
In conclusion, if developing countries are to contribute meaningfully to efforts toward adaptation and mitigation of climate change impacts, they will need the strengthened capacity that comes with development.
The UN Chronicle is not an official record. It is privileged to host senior United Nations officials as well as distinguished contributors from outside the United Nations system whose views are not necessarily those of the United Nations. Similarly, the boundaries and names shown, and the designations used, in maps or articles do not necessarily imply endorsement or acceptance by the United Nations.

Cultural Diversity in the Digital Age: A Pillar for Sustainable Development
Two important issues affecting the protection and promotion of cultural diversity deserve our attention: the question of discoverability of local and national content, and the impact of generative artificial intelligence (AI).

“Bee Engaged with Youth” to Safeguard Bees and Other Pollinators
As we celebrate World Bee Day on 20 May, let us remember how crucial it is to prioritize efforts to protect bees and other pollinators. FAO is committed to supporting youth, who have a key role to play in fostering the transformative changes and future initiatives and activities needed to save our bees and other pollinators.

Digital Innovation—Key to Unlocking Sustainable Development
Digital tools have the potential to accelerate human progress, but those who are not online are most at risk of being left behind.
Documents and publications
- Yearbook of the United Nations
- Basic Facts About the United Nations
- Journal of the United Nations
- Meetings Coverage and Press Releases
- United Nations Official Document System (ODS)
- Africa Renewal
Libraries and Archives
- Dag Hammarskjöld Library
- UN Audiovisual Library
- UN Archives and Records Management
- Audiovisual Library of International Law
- UN iLibrary
News and media
- UN News Centre
- UN Chronicle on Twitter
- UN Chronicle on Facebook
The UN at Work
- 17 Goals to Transform Our World
- Official observances
- United Nations Academic Impact (UNAI)
- Protecting Human Rights
- Maintaining International Peace and Security
- The Office of the Secretary-General’s Envoy on Youth
- United Nations Careers
The impact of environmental regulation and economic expectations on crop-livestock integration among hog farmers: a field study from China
- Research Article
- Published: 01 June 2024
Cite this article

- Jing Cao 1 ,
- Jiapeng Xu 1 ,
- Huimin Cao 1 ,
- Fangfang Wang 1 ,
- Zhenyu Yan ORCID: orcid.org/0000-0002-3154-9763 1 &
- Taimoor Muhammad 1
Decoupling of crop-livestock systems increases the risks of pollution, waste of nutrient resources, and biodiversity loss. Crop-livestock integration (CLI) is an effective solution to these problems, and motivating farmers to adopt CLI is the key. Many countries have implemented environmental regulations (ER) aiming to influence farmers’ CLI adoption decisions. Based on a field study of 316 hog farmers from Shaanxi Province of China, this paper applies the triple-hurdle model to empirically examine the impacts of economic expectations (EE) and ER on CLI adoption decisions. It also verifies the income effect of CLI. The results are as follows: 90.5% of farmers are willing to adopt CLI, but the adoption rate is only 40.8% and the average integration degree is only 0.236; CLI not been widely popularized. EE and ER promote farmers’ CLI adoption significantly, while the impact of interaction between EE and ER on CLI adoption differs. IER weakens the positive impact of EE on farmers’ CLI integration degree, which has a “crowding out effect.” GER negatively moderates the impact of EE on farmers’ adoption willingness of CLI. CER strengthens the positive effect of EE on farmers’ adoption behavior and CLI integration degree. CLI increases the farmers’ income. These results contribute to our understanding of the mechanisms of CLI adoption decisions and sustainable policy optimization for green agricultural development.
This is a preview of subscription content, log in via an institution to check access.
Access this article
Price includes VAT (Russian Federation)
Instant access to the full article PDF.
Rent this article via DeepDyve
Institutional subscriptions
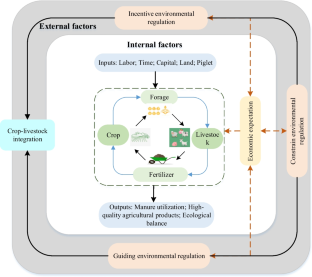
Data availability
All data needed to evaluate the conclusions in the paper are present in the paper.
When testing for sample selection errors, IMR was not significant. Therefore, only the test results of IMR are explained here, and the overall regression results are not reported (Models 1–8).
Asai M, Moraine M, Ryschawy J et al (2018) Critical factors for crop-livestock integration beyond the farm level: a cross-analysis of worldwide case studies. Land Use Policy 73:184–194. https://doi.org/10.1016/j.landusepol.2017.12.010
Article Google Scholar
Bai Z, Ma L, Jin S et al (2016) Nitrogen, phosphorus, and potassium flows through the manure management chain in China. Environ Sci Technol 50:13409–13418. https://doi.org/10.1021/acs.est.6b03348
Article CAS Google Scholar
Bai Z, Ma W, Ma L et al (2018) China’s livestock transition: driving forces, impacts, and consequences. Sci Adv 4:eaar8534. https://doi.org/10.1126/sciadv.aar8534
Bai Z, Fan X, Jin X et al (2022) Relocate 10 billion livestock to reduce harmful nitrogen pollution exposure for 90% of China’s population. Nat Food 3:152–160. https://doi.org/10.1038/s43016-021-00453-z
Bao W, Wu Y, Bao H (2024) Transaction costs, crop-livestock integration participation, and income effects in China. Front Sustain Food Syst 7:1247770. https://doi.org/10.3389/fsufs.2023.1247770
Barnes AP, Willock J, Hall C, Toma L (2009) Farmer perspectives and practices regarding water pollution control programmes in Scotland. Agric Water Manag 96:1715–1722. https://doi.org/10.1016/j.agwat.2009.07.002
Belay DG, Jensen JD (2020) ‘The scarlet letters’: information disclosure and self-regulation: evidence from antibiotic use in Denmark. J Environ Econ Manag 104:102385. https://doi.org/10.1016/j.jeem.2020.102385
Bell LW, Moore AD (2012) Integrated crop–livestock systems in Australian agriculture: trends, drivers and implications. Agric Syst 111:1–12. https://doi.org/10.1016/j.agsy.2012.04.003
Branca G, Perelli C (2020) ‘Clearing the air’: common drivers of climate-smart smallholder food production in Eastern and Southern Africa. J Clean Prod 270:121900. https://doi.org/10.1016/j.jclepro.2020.121900
Burke WJ, Myers RJ, Jayne TS (2015) A triple-hurdle model of production and market participation in Kenya’s dairy market. Am J Agric Econ 97:1227–1246. https://doi.org/10.1093/ajae/aav009
Cao D, Li H, Wang G, Huang T (2017) Identifying and contextualising the motivations for BIM implementation in construction projects: an empirical study in China. Int J Proj Manag 35:658–669. https://doi.org/10.1016/j.ijproman.2016.02.002
Carrer MJ, Maia AG, de Mello BrandãoVinholis M, de Souza Filho HM (2020) Assessing the effectiveness of rural credit policy on the adoption of integrated crop-livestock systems in Brazil. Land Use Policy 92:104468. https://doi.org/10.1016/j.landusepol.2020.104468
Chen Q, Xu Q, Yu X (2023) Triple-hurdle model analysis of aquaculture farmers’ multi-stage willingness to participate in green and healthy aquaculture actions in China: based on ecological cognition and environmental regulation perspectives. Front Sustain Food Syst 7:1211392. https://doi.org/10.3389/fsufs.2023.1211392
Cheng P, Li J, Zhang H, Cheng G (2023) Sustainable management behavior of farmland shelterbelt of farmers in ecologically fragile areas: empirical evidence from Xinjiang, China. Sustainability 15:2011. https://doi.org/10.3390/su15032011
Cortner O, Garrett RD, Valentim JF et al (2019) Perceptions of integrated crop-livestock systems for sustainable intensification in the Brazilian Amazon. Land Use Policy 82:841–853. https://doi.org/10.1016/j.landusepol.2019.01.006
Cui G, Liu Z (2022) The impact of environmental regulations and social norms on farmers’ chemical fertilizer reduction behaviors: an investigation of citrus farmers in southern China. Sustainability 14:8157. https://doi.org/10.3390/su14138157
de Groot JIM, Steg L (2009) Mean or green: which values can promote stable pro-environmental behavior? Conserv Lett 2:61–66. https://doi.org/10.1111/j.1755-263X.2009.00048.x
Dessart FJ, Barreiro-Hurlé J, Van Bavel R (2019) Behavioural factors affecting the adoption of sustainable farming practices: a policy-oriented review. Eur Rev Agric Econ 46:417–471. https://doi.org/10.1093/erae/jbz019
Dos Reis JC, Kamoi MYT, Latorraca D et al (2020) Assessing the economic viability of integrated crop−livestock systems in Mato Grosso, Brazil. Renew Agric Food Syst 35:631–642. https://doi.org/10.1017/S1742170519000280
dos Reis JC, Rodrigues GS, de Barros I et al (2021) Integrated crop-livestock systems: a sustainable land-use alternative for food production in the Brazilian Cerrado and Amazon. J Clean Prod 283:124580. https://doi.org/10.1016/j.jclepro.2020.124580
Du S, Liu J, Fu Z (2021a) The impact of village rules and formal environmental regulations on farmers’ cleaner production behavior: new evidence from China. Int J Environ Res Public Health 18:7311. https://doi.org/10.3390/ijerph18147311
Du S, Luo X, Huang Y et al (2021b) Risk perception, specialized agricultural services and rice farmers’ adoption behavior of biological pesticide technology. Resour Environ Yangtze Basin 30:1768–1779
Google Scholar
Finger R, Lehmann N (2012) Policy reforms to promote efficient and sustainable water use in Swiss agriculture. Water Policy 14:887–901. https://doi.org/10.2166/wp.2012.152
Garrett R, Niles M, Gil J et al (2017) Policies for reintegrating crop and livestock systems: a comparative analysis. Sustainability 9:473. https://doi.org/10.3390/su9030473
Garrett R, Ryschawy J, Bell L et al (2020) Drivers of decoupling and recoupling of crop and livestock systems at farm and territorial scales. Ecol Soc 25. https://doi.org/10.5751/ES-11412-250124
Gil JDB, Garrett R, Berger T (2016) Determinants of crop-livestock integration in Brazil: evidence from the household and regional levels. Land Use Policy 59:557–568. https://doi.org/10.1016/j.landusepol.2016.09.022
Gil JDB, Garrett RD, Rotz A et al (2018) Tradeoffs in the quest for climate smart agricultural intensification in Mato Grosso. Brazil Environ Res Lett 13:064025. https://doi.org/10.1088/1748-9326/aac4d1
Goodhue RE, Mohapatra S, Rausser GC (2010) Interactions between incentive instruments: contracts and quality in processing tomatoes. Am J Agric Econ 92:1283–1293. https://doi.org/10.1093/ajae/aaq061
Gu B (2022) Recoupling livestock and crops. Nat Food 3:102–103. https://doi.org/10.1038/s43016-022-00466-2
Guo Q, Li H, Li S, Nan L (2021) Research on farmers’ pro-environmental behavior from the perspective of paradox existing between behavior and willingness: taking the organic fertilizers application as an example. Resour Environ Yangtze Basin 30:212–224
Guo Z, Chen X, Zhang Y (2022) Impact of environmental regulation perception on farmers’ agricultural green production technology adoption: a new perspective of social capital. Technol Soc 71:102085. https://doi.org/10.1016/j.techsoc.2022.102085
Guo Q (2021) The fading relationship between agriculture and animal husbandry and its reconstruction. Chin Rural Econ 22–35. https://kns.cnki.net/kcms/detail/11.1262.F.20211011.0858.004.html
Hamazakaza P, Kabwe G, Kuntashula E et al (2022) Adoption of sustainable agriculture intensification in maize-based farming systems of Katete District in Zambia. Land 11:880. https://doi.org/10.3390/land11060880
Han Z, Han C, Shi Z et al (2023) Rebuilding the crop-livestock integration system in China ——based on the perspective of circular economy. J Clean Prod 393:136347. https://doi.org/10.1016/j.jclepro.2023.136347
Harper JK, Roth GW, Garalejić B, Škrbić N (2018) Programs to promote adoption of conservation tillage: a Serbian case study. Land Use Policy 78:295–302. https://doi.org/10.1016/j.landusepol.2018.06.028
Ji C, Jin S, Wang H, Ye C (2019) Estimating effects of cooperative membership on farmers’ safe production behaviors: evidence from pig sector in China. Food Policy 83:231–245. https://doi.org/10.1016/j.foodpol.2019.01.007
Jin S, Zhang B, Wu B et al (2020) Decoupling livestock and crop production at the household level in China. Nat Sustain 4:48–55. https://doi.org/10.1038/s41893-020-00596-0
Kaczan DJ, Swallow BM, Adamowicz WL (Vic) (2019) Forest conservation policy and motivational crowding: experimental evidence from Tanzania. Ecol Econ 156:444–453. https://doi.org/10.1016/j.ecolecon.2016.07.002
Kelifa A (2023) Review of Tobit, Heckman and double hurdle econometric models: supported with evidences from the studies conducted in Ethiopia. SN Bus Econ 3:104. https://doi.org/10.1007/s43546-023-00478-5
Khed VD, Krishna VV (2023) Agency and time poverty: linking decision-making powers and leisure time of male and female farmers of Central India. World Dev Perspect 29:100484. https://doi.org/10.1016/j.wdp.2022.100484
Knight J, Deng Q, Li S (2011) The puzzle of migrant labour shortage and rural labour surplus in China, China. Econ Rev 22:585–600. https://doi.org/10.1016/j.chieco.2011.01.006
Li Y, Wang B (2022) Environmental motivation or economic motivation? Explaining individuals’ intention to carry reusable bags for shopping in China. Front Psychol 13:972748. https://doi.org/10.3389/fpsyg.2022.972748
Li F, Ren J, Wimmer S et al (2020) Incentive mechanism for promoting farmers to plant green manure in China. J Clean Prod 267:122197. https://doi.org/10.1016/j.jclepro.2020.122197
Li Y, Sun Z, Accatino F et al (2021) Comparing specialised crop and integrated crop-livestock systems in China with a multi-criteria approach using the emergy method. J Clean Prod 314:127974. https://doi.org/10.1016/j.jclepro.2021.127974
Liu Z, Sun J, Zhu W, Qu Y (2021) Exploring impacts of perceived value and government regulation on farmers’ willingness to adopt wheat straw incorporation in China. Land 10:1051. https://doi.org/10.3390/land10101051
Lu Y, Tan Y, Wang H (2022) Impact of environmental regulation on green technology adoption by farmers microscopic investigation evidence from pig breeding in China. Front Environ Sci 10:885933. https://doi.org/10.3389/fenvs.2022.885933
Ma W, Abdulai A (2016) Does cooperative membership improve household welfare? Evidence from apple farmers in China. Food Policy 58:94–102. https://doi.org/10.1016/j.foodpol.2015.12.002
Ma L, Bai Z, Ma W et al (2019) Exploring future food provision scenarios for China. Environ Sci Technol 53:1385–1393. https://doi.org/10.1021/acs.est.8b04375
Martin G, Moraine M, Ryschawy J et al (2016) Crop–livestock integration beyond the farm level: a review. Agron Sustain Dev 36:53. https://doi.org/10.1007/s13593-016-0390-x
Mather DL, Jayne TS (2018) Fertilizer subsidies and the role of targeting in crowding out: evidence from Kenya. Food Secur 10:397–417. https://doi.org/10.1007/s12571-018-0773-8
Meraner M, Finger R (2019) Risk perceptions, preferences and management strategies: evidence from a case study using German livestock farmers. J Risk Res 22:110–135. https://doi.org/10.1080/13669877.2017.1351476
Midler E, Pascual U, Drucker AG et al (2015) Unraveling the effects of payments for ecosystem services on motivations for collective action. Ecol Econ 120:394–405. https://doi.org/10.1016/j.ecolecon.2015.04.006
Missiame A, Nyikal RA, Irungu P (2021) What is the impact of rural bank credit access on the technical efficiency of smallholder cassava farmers in Ghana? An endogenous switching regression analysis. Heliyon 7:e07102. https://doi.org/10.1016/j.heliyon.2021.e07102
Moraine M, Duru M, Nicholas P et al (2014) Farming system design for innovative crop-livestock integration in Europe. Anim Int J Anim Biosci 8:1204–1217. https://doi.org/10.1017/S1751731114001189
Niles MT, Garrett RD, Walsh D (2017) Ecological and economic benefits of integrating sheep into viticulture production. Agron Sustain Dev 38:1. https://doi.org/10.1007/s13593-017-0478-y
Pelletier LG, Tuson KM, Haddad NK (1997) Client motivation for therapy scale: a measure of intrinsic motivation, extrinsic motivation, and amotivation for therapy. J Pers Assess 68:414–435. https://doi.org/10.1207/s15327752jpa6802_11
Peterson CA, Deiss L, Gaudin ACM (2020) Commercial integrated crop-livestock systems achieve comparable crop yields to specialized production systems: a meta-analysis. PLoS One 15:e0231840. https://doi.org/10.1371/journal.pone.0231840
Poeschl M, Ward S, Owende P (2012) Environmental impacts of biogas deployment – part II: life cycle assessment of multiple production and utilization pathways. J Clean Prod 24:184–201. https://doi.org/10.1016/j.jclepro.2011.10.030
Prokopy LS, Floress K, Arbuckle JG et al (2019) Adoption of agricultural conservation practices in the United States: evidence from 35 years of quantitative literature. J Soil Water Conserv 74:520–534. https://doi.org/10.2489/jswc.74.5.520
Regan JT, Marton S, Barrantes O et al (2017) Does the recoupling of dairy and crop production via cooperation between farms generate environmental benefits? A case-study approach in Europe. Eur J Agron 82:342–356. https://doi.org/10.1016/j.eja.2016.08.005
Ryschawy J, Grillot M, Charmeau A et al (2022) A participatory approach based on the serious game Dynamix to co-design scenarios of crop-livestock integration among farms. Agric Syst 201:103414. https://doi.org/10.1016/j.agsy.2022.103414
Schut AGT, Cooledge EC, Moraine M et al (2021) Reintegration of crop-livestock systems in Europe: an overview. Front Agric Sci Eng 8:111. https://doi.org/10.15302/J-FASE-2020373
Shi H, Sui D, Wu H, Zhao M (2018a) The influence of social capital on farmers’ participation in watershed ecological management behavior: evidence from Heihe Basin. Chin Rural Econ 34–45. https://kns.cnki.net/kcms/detail/11.1262.F.20180201.1801.008.html
Shi Y, Yao L, Zhao M (2018b) The effect of social capital on herds men’s participation willingness in grassland community governance: an analysis based on triple-hurdle model. China Rural Surv 35–50. https://kns.cnki.net/kcms/detail/11.3586.F.20180507.1530.006.html
Shi ZH, Zhang H (2021) Research on social norms, environmental regulations and farmers’ choice of fertilization behavior. Chin J Agric Resour Reg Plan 42:51–61. https://doi.org/10.7621/cjarrp.1005-9121.20211107
Skaalsveen K, Ingram J, Urquhart J (2020) The role of farmers’ social networks in the implementation of no-till farming practices. Agric Syst 181:102824. https://doi.org/10.1016/j.agsy.2020.102824
Sneessens I, Veysset P, Benoit M et al (2016) Direct and indirect impacts of crop–livestock organization on mixed crop–livestock systems sustainability: a model-based study. Animal 10:1911–1922. https://doi.org/10.1017/S1751731116000720
Tan K, Cai G, Du Z et al (2023) Emergy synthesis of decoupling and recoupling crop-livestock systems under unified system boundary and modified indices. Sci Total Environ 877:162880. https://doi.org/10.1016/j.scitotenv.2023.162880
Trujillo-Barrera A, Pennings JME, Hofenk D (2016) Understanding producers’ motives for adopting sustainable practices: the role of expected rewards, risk perception and risk tolerance. Eur Rev Agric Econ 43:359–382. https://doi.org/10.1093/erae/jbv038
Wang X, Tan S (2020) Cost-efficiency analysis of rice-crayfish integrated land operation mode based on non-homogeneous DEA. China Land Sci 34:56–63. https://doi.org/10.11994/zgtdkx.20191225.105326
Wang TX, Teng CG, Zhang ZH (2020) Informal social support, environmental regulation and farmers’ film recycling behavior. J Arid Land Resour Environ 34:109–115. https://doi.org/10.13448/j.cnki.jalre.2020.218
Wang L, Song B, Wu J, Wang L (2022) An empirical study on the influence of environmental regulation and farmers’ cognition on the application behavior of organic fertilizer: based on the survey data of 741 farmers in YE county, PINGDINGSHAN city, Henan province. J Henan Univ Technol Soc Sci 38:57–67. https://doi.org/10.16433/j.cnki.cn41-1379.2022.03.014
Willett W, Rockström J, Loken B et al (2019) Food in the Anthropocene: the EAT–Lancet Commission on healthy diets from sustainable food systems. Lancet 393:447–492. https://doi.org/10.1016/S0140-6736(18)31788-4
Yang C, Liang X, Xue Y et al (2024) Can government regulation weak the gap between green production intention and behavior? Based on the perspective of farmers’ perceptions. J Clean Prod 434:139743. https://doi.org/10.1016/j.jclepro.2023.139743
Yang X, Qi Z (2022) The impact of expected return and technology subsidy on farmers’ adoption of agroecological technology: taking rice–crayfish co–culture technology as an example. J Huazhong Agric Univ Sci Ed 89–100. https://doi.org/10.13300/j.cnki.hnwkxb.2022.05.010
Zhang J, Chen M, Huang C, Lai Z (2022) Labor endowment, cultivated land fragmentation, and ecological farming adoption strategies among farmers in Jiangxi Province, China. Land 11:679. https://doi.org/10.3390/land11050679
Zhao J, Liu L, Qi J, Dong J (2022) Study on the influence of environmental regulation on the environmentally friendly behavior of farmers in China. Front Environ Sci 10:1009151. https://doi.org/10.3389/fenvs.2022.1009151
Zhao Y, Liu L, Zhao J (2023) Perceived benefits, environmental regulation and farmers ’ waste recycling behavior-taking duck farmers as an example. World Agric 98–110. https://doi.org/10.13856/j.cn11-1097/s.2023.04.009
Zhu X, Cai J (2016) The influences of perceived values and capability approach on farmers willingness to exit rural residential land and its intergenerational difference. China Land Sci 30:64–72. https://doi.org/10.11994/zgtdkx.20161024.124548
Download references
This work was supported by Key Think Tank Research Project of Shaanxi Province on “Social Sciences Helping County Economies Develop in High Quality” (2023ZD0662); Humanities and Social Sciences Project of Fundamental Research Funds for the Central Universities in 2023 (452023307); Soft Science Research Program of Shaanxi Province (2022KRM032; 2023-CX-RKX-103); and Social Science Foundation of Shaanxi Province (2021D058; 2022D022). The authors would like to thank the anonymous referees for their helpful suggestions and corrections on the earlier draft of our paper.
Author information
Authors and affiliations.
College of Economics and Management, Northwest A&F University, No. 3 Taicheng Road, Yangling, 712100, Shaanxi, People’s Republic of China
Jing Cao, Jiapeng Xu, Huimin Cao, Fangfang Wang, Zhenyu Yan & Taimoor Muhammad
You can also search for this author in PubMed Google Scholar
Contributions
Jing Cao: methodology; writing—original draft; writing—review and editing.
Jiapeng Xu: conceptualization, supervision, project administration, article modification.
Huimin Cao: data, research methods.
Fangfang Wang: data, research methods.
Zhenyu Yan: conceptualization, supervision, project administration, article modification.
Taimoor Muhammad: data, research methods.
Corresponding author
Correspondence to Zhenyu Yan .
Ethics declarations
Ethics approval.
Not applicable.
Consent to participate
Consent for publication, competing interests.
The authors declare no competing interests.
Additional information
Responsible Editor: Baojing Gu
Publisher's Note
Springer Nature remains neutral with regard to jurisdictional claims in published maps and institutional affiliations.
Rights and permissions
Springer Nature or its licensor (e.g. a society or other partner) holds exclusive rights to this article under a publishing agreement with the author(s) or other rightsholder(s); author self-archiving of the accepted manuscript version of this article is solely governed by the terms of such publishing agreement and applicable law.
Reprints and permissions
About this article
Cao, J., Xu, J., Cao, H. et al. The impact of environmental regulation and economic expectations on crop-livestock integration among hog farmers: a field study from China. Environ Sci Pollut Res (2024). https://doi.org/10.1007/s11356-024-33616-z
Download citation
Received : 03 January 2024
Accepted : 05 May 2024
Published : 01 June 2024
DOI : https://doi.org/10.1007/s11356-024-33616-z
Share this article
Anyone you share the following link with will be able to read this content:
Sorry, a shareable link is not currently available for this article.
Provided by the Springer Nature SharedIt content-sharing initiative
- Crop-livestock integration
- Economic expectations
- Environmental regulation
- Triple-hurdle model
- Pig farmers
- Find a journal
- Publish with us
- Track your research
Ancient Civilizations - The Silurian Hypothesis The Reality Revolution Podcast
- Health & Fitness
It's called the Silurian Hypothesis (and lest you think scientists aren't nerds, it's named after a bunch of Doctor Who aliens). Basically, it states that human beings might not be the first intelligent life forms to have evolved on this planet and that if there really were precursors some 100 million years ago, virtually all signs of them would have been lost by now. It might seem obvious that we'd see the signs of such a civilization — after all, there were dinosaurs 100 million years ago, and we know that because we've found their fossils. But they were around for more than 150 million years. That's important because it's not just about how old the ruins of this hypothetical civilization would be, nor how widespread it was. It's also about how long it was around. Humanity has spread across the globe in a remarkably short amount of time — over the course of about 100,000 years. If another species did the same, then our chances of spotting it in the geological record would be a whole lot smaller. For decades the archaeological community labored under the theory that human civilization began after the last Ice Age. The theory conjectured that, prior to that time, humans were no more than primitive hunter-gatherers incapable of communal organization or sophisticated abilities, and it was only after the last glacial period—following the melting of the 10,000 foot thick ice sheets that covered much of the northern portion of the world’s continents—that our human ancestors began to develop agriculture and complex economic and social structures, sometime around 4000 B.C. Archaeologists therefore theorized that the first cities did not develop until about 3500 B.C. in Mesopotamia and Egypt. Contemporary discoveries have dramatically transformed those theories. Modern research has unearthed buried civilizations and discovered submerged cities one after another—archaeology and anthropology now reconstruct an unsuspected antiquity of man—fresh discoveries prove all history false and paint a canvas of stunningly mysterious dimensions. What if ancient civilizations existed. What would it mean? Let's discuss it. 💰Large Sums Of Money Activation Trainings - 12 hours of training on activating the large sums of money reality https://realityrevolutioncon.com/largesumsofmoney 🎨 Buy My Art - Unique Sigil Magic and Energy Activation Through Flow Art and Voyages Through Space and Imagination. https://www.newearth.art/ 📕BUY MY BOOK! https://www.amazon.com/Reality-Revolution-Mind-Blowing-Movement-Hack/dp/154450618X/ 🎧Listen to my book on audible https://www.audible.com/pd/The-Reality-Revolution-Audiobook/B087LV1R5V ✨ Alternate Universe Reality Activation get full access to new meditations, new lectures, recordings from the reality con and the 90 day AURA meditation schedule https://realityrevolutionlive.com/aura45338118 🌎→The New Earth Activation trainings - Immerse yourself in 12 hours of content focused on the new earth with channeling, meditations, advanced training and access to the new earth https://realityrevolutioncon.com/newearth ✨Sign up for my newsletter and email list https://chiefexecutiveprime.activehosted.com/f/1 ✨Sign up for my newsletter and email list https://chiefexecutiveprime.activehosted.com/f/1 🌐Join The Reality Revolution – https://www.therealityrevolution.com ➡Join The Reality Revolution Facebook Group - https://www.facebook.com/groups/523814491927119/ ➡ Follow Us On Facebook https://www.facebook.com/The-Reality-Revolution-Podcast-Hosted-By-Brian-Scott-102555575116999 ➡Join The Reality Revolution Discord https://discord.gg/Xbh6H88D8k ➡ Join our Board On Reddit: https://www.reddit.com/r/TheRealityRevolution/ ➡Instagram: https://www.instagram.com/the_reality_revolution/ ➡Twitter: https://twitter.com/mediaprime ➡Spoutible: https://spoutible.com/BrianScott ➡Tumblr: https://www.tumblr.com/the-reality-revolution ➡Linkedin: https://www.li
- Episode Website
- More Episodes
Top Podcasts In Health & Fitness
COMMENTS
The hypothesis relates to the main features of local agriculture, stakeholder assumptions and theories on farm functioning and livelihood strategies in the local context, and on their interpretation of the relevant external forces and mechanisms that can differentiate farm households.
We can best understand ideas about the origins of agriculture from a historical perspective, considering the early theories first. Explanations of why domestication occurred include the oasis hypothesis, the natural-habitat hypothesis, the population-pressure hypothesis, the edge hypothesis, the social hypothesis, and more.
Updated on April 19, 2019. The Oasis Theory (known variously as the Propinquity Theory or Desiccation Theory) is a core concept in archaeology, referring to one of the main hypotheses about the origins of agriculture: that people started to domesticate plants and animals because they were forced to, because of climate change .
Abstract. Testing of hypothesis plays an important role in agricultural education and research. We draw conclusion on population (characteristics) based on available sample information, following ...
The onset of the Holocene ∼10,000 years ago is an attractive hypothesis for why agriculture began independently at this time because the warmer, wetter, higher CO 2 conditions of the Holocene generally encourage plant growth (Childe 1951, Sage 1995). The Holocene was also less prone than the Pleistocene to large climatic shifts that would be ...
Origins of Agriculture by Mark Nathan Cohen The papers in this special section are revised contributions to one of the Conversations in the Disciplines funded by the State University of New York and the SUNY College at Platts-burgh, held in Plattsburgh on October 7-9, 2007. This dis-cussion, titled "The Origins of Agriculture," brought ...
2. According to the second hypothesis, a shortage of food resources (primarily the lack of wild animals for the hunters) was the precondition for the development of agriculture. Reasons for this include an increase in human population density in combination with decreases in big-game species because of overhunting.
Farmers have been conducting "trial and error" experiments for centuries to gain knowledge about their production systems (Marchant et al., 2019).In modern agriculture, on-farm experimentation has played a significant role in research and extension activities by allowing the development and generalization of agronomic recommendations, from genotype selection at the regional scales to site ...
This result has been taken by the core area hypothesis as the evidence that underpins the argument for a single origin of agriculture. The core area hypothesis was widely accepted by archaeologists particularly when other archaeological material evidence, such as architectural buildings and chipped stone tools, shows that many cultural elements ...
Abstract. According to Karl Popper, economics and agricultural economics should be deemed scientifi c if the theories (hypotheses) are subject to strict tests. The testing of agro-economic theories goes back. 50 years in the USA, Canada, Europe, and Japan, and these methods are becoming increasingly part of educational research methodology.
Table 2.1 summarizes the main drivers and mechanisms of climate impact on cropping systems, which were reviewed by Bongaarts (1994), Rosenzweig et al. (2001), Boote et al. (2010), Kimball (2010), and Porter et al. (2014). Notably, direct climate impacts include both damage and benefits as well as opportunities for farm-level adaptations.
Energy consumption has become a requirement in the modern world, and without it, the economies of developing nations cannot prosper. Consistent economic growth is a challenge for countries of all economic levels, not just the less developed ones. We test the EKC hypothesis by analyzing the relationships between GDP growth, energy consumption, agricultural output, and the consequences of carbon ...
more information implied from the separation hypothesis than current tests. Key words: agricultural household model, separation hypothesis test, shadow wage. JEL codes: O12, Q12. Rural households, especially in developing countries, are systematically exposed to mar-ket imperfections.These imperfections lead to
The Process. or call (301) 779-1007 to order. Following these 10 steps will help you develop a successful on-farm research project. Identify your research question and objective. Develop a research hypothesis. Decide what you will measure and what data you will collect. Develop an experimental design. Choose the location and map out your field ...
Agriculture is vulnerable to climate change and a source of greenhouse gases (GHGs). Farmers face pressures to adjust agricultural systems to make them more resilient in the face of increasingly variable weather (adaptation) and reduce GHG production (mitigation). This research examines relationships between Iowa farmers' trust in ...
Hypothesis testing of agricultural data Zolzaya G. 1 , Usukhbayar B. 2* 1 - School of Economics and Business, Mongolian University of Life Sciences, Ula anbaatar ,
Increasing demand for food and environmental stressors are some of the most challenging problems that human societies face today and these have encouraged new studies to examine drought impacts on food production. Seeking to discuss these important issues in the South African context, this study analyzed the impacts of drought on food security in one of the country's largest commercial ...
Agriculture has a complex structure and interactions with different components, which will make it uncertain in a future climate that is a serious risk to food security in the region. Consequently, it is essential to assess the negative impacts of climate change on agricultural productivity and develop adaptive strategies to combat climate ...
Abstract. of agricultural developed Agricultural development development majority are of is a improvement of rural development. of material engaged and in However, agricultural social welfare practices as Therefore, development of income. a sustainable development agriculture sufficient agricultural objectives.
The hypothesis relates to the main features of local agriculture, stakeholder assumptions and theories on farm functioning and livelihood strategies in the local context, and on their interpretation of the relevant external forces and mechanisms that can differentiate farm households.
The locational analysis of agricultural land use provides an explanation of it. Some of the locational theories of agriculture and will mainly focus on Johann Heinrich von Thunen's theory of agricultural location. ... His hypothesis was that the higher the cost of transportation, the lower the amount a tenant farmer would be willing to pay ...
Food production is a vital global concern and the potential for an agritech revolution through artificial intelligence (AI) remains largely unexplored. This paper presents a comprehensive review focused on the application of machine learning (ML) in agriculture, aiming to explore its transformative potential in farming practices and efficiency enhancement. To understand the extent of research ...
ICRISAT studies have generated a "hypothesis of hope" which states that the impact of climate change on yields under low input agriculture is likely to be minimal, as other factors will continue ...
Developing a hypothesis (with example) Step 1. Ask a question. Writing a hypothesis begins with a research question that you want to answer. The question should be focused, specific, and researchable within the constraints of your project. Example: Research question.
Decoupling of crop-livestock systems increases the risks of pollution, waste of nutrient resources, and biodiversity loss. Crop-livestock integration (CLI) is an effective solution to these problems, and motivating farmers to adopt CLI is the key. Many countries have implemented environmental regulations (ER) aiming to influence farmers' CLI adoption decisions. Based on a field study of 316 ...
It's called the Silurian Hypothesis (and lest you think scientists aren't nerds, it's named after a bunch of Doctor Who aliens). ... that covered much of the northern portion of the world's continents—that our human ancestors began to develop agriculture and complex economic and social structures, sometime around 4000 B.C. ...