Urban Life vs. Rural Life
Living in cities or the countryside gives different experiences. These are changed by things like how people live, buildings and community activities. Life in the city is famous for its quick-moving lifestyle, modern setup and different ways people live together. Living in the countryside is marked by a slow speed, basic design and tight-knit groups of people who are often similar. In social life, too, cities do better when they have a lot of different people and things happening all the time.
On the other hand, rural areas are good at having close friends in smaller groups. People living in cities have many services, while those in the country might need help getting some facilities. They sometimes need to travel for specific needs. The piece will look closer at these differences. It will show extraordinary things about living in a city and countryside life better.
In cities, people with different backgrounds live close to each other and share thoughts. This creates a busy environment with many social talks (Woolrych et al. 2021). The busy city life gives us energy for our everyday tasks. On the contrary, life in the rural areas is known for tight-knit groups. Here, people often have strong ties and share common beliefs. The strong connections in small towns make their society closer and more connected.
Urban and rural areas have very different levels of access to facilities. Cities, being full of life and energy, offer many services. Some are high-quality healthcare, while others include many fun activities. This city environment meets the different needs and likes of a mixed group of people. On the other hand, some services might be available in rural areas. People there must make trips for essential things like doctor visits or cultural events (Dey et al., 2020). This shows a balance between living in the city, where items are easy to get, and the peacefulness of country life, where some help might need extra work or going places.
Looking at how fast everyday life goes is also very important. Usually, people in cities have fast-paced schedules because of job opportunities and many events. The city’s constant excitement, work choices and possibilities make an exciting life that needs change and quick thinking (Kayanan, 2022). On the other hand, life in rural areas is slower and focuses on nature and simplicity. Living away from the city is suitable for a peaceful family life, where your community plays an important daily role.
Picking between living in a city or the countryside depends on what someone likes and thinks is important. Towns are full of choices and helpers for people who want busy places with all sorts of folks. On the other hand, living in the country provides a calm place with solid ties to neighbours. This attracts people who like quiet lives and want to be more linked up with nature. The choice shows what one believes in, balancing the fun and ease of living in cities against a peaceful life with close friends found outside.

Whether I used the point-by-point or block method
I decided to use the block plan for my essay. I carefully divided topics of social life, facilities and everyday speed in urban and rural areas. I could deeply look at each part separately for both places. Separating these critical parts with the block method made it simpler to see how city and country life are different in a transparent way. This made my reasons more understandable and helped make my essay easier for readers to read. This allowed the people to get familiar with extraordinary things about each place and compare them all together.
Ways in which writing a comparison/contrast essay differs from the Narrative essay in Touchstone 1
To make a comparison/contrast essay, one needs to sort details differently than when writing a story. I focused on telling a tale in time order in the story-writing piece. This included events from my viewpoint. Meanwhile, the comparison/contrast essay needed a more careful way. This involved carefully studying what is similar and different. Switching from telling a story to giving an unbiased review made the two essays very different.
Part of the draft that I struggled with
While writing, I faced some trouble smoothly connecting ideas between paragraphs. Making sure the thoughts flowed well and stayed clear when going from city to countryside themes was a bit tricky. I had to carefully create each transition to ensure readers could easily follow the switch without confusion. Also, finding the right amount of detail for each point without making it too much for the reader was an ongoing challenge. It took a few revisions for clarity and brevity to get it right.
Dey, B., Mathew, J., & Chee-Hua, C. (2020). Influence of destination attractiveness factors and travel motivations on rural homestay choice: the moderating role of need for uniqueness. International Journal of Culture, Tourism and Hospitality Research, 14(4), 639-666. https://www.emerald.com/insight/content/doi/10.1108/IJCTHR-08-2019-0138/full/html
Kayanan, C. M. (2022). A critique of innovation districts: Entrepreneurial living and the burden of shouldering urban development. Environment and Planning A: Economy and Space, 54(1), 50-66. https://journals.sagepub.com/doi/abs/10.1177/0308518X211049445
Woolrych, R., Sixsmith, J., Fisher, J., Makita, M., Lawthom, R., & Murray, M. (2021). Constructing and negotiating social participation in old age: experiences of older adults living in urban environments in the United Kingdom. Ageing & Society, 41(6), 1398-1420. https://www.cambridge.org/core/journals/ageing-and-society/article/constructing-and-negotiating-social-participation-in-old-age-experiences-of-older-adults-living-in-urban-environments-in-the-united-kingdom/DFF7BE01F8E4D6766B6E252FA6B9F8FF
Cite This Work
To export a reference to this article please select a referencing style below:
Related Essays
Reasons why i should join the think tank team, the effects of aromatherapy on anxiety and sleep quality in cardiac patients: a randomized controlled trial, enhancing performance psychology: tailored strategies for overcoming high-pressure challenges in sports, essay on information technology, how can biotechnology be used to promote environmental sustainability, the advantages and disadvantages of space exploration, popular essay topics.
- American Dream
- Artificial Intelligence
- Black Lives Matter
- Bullying Essay
- Career Goals Essay
- Causes of the Civil War
- Child Abusing
- Civil Rights Movement
- Community Service
- Cultural Identity
- Cyber Bullying
- Death Penalty
- Depression Essay
- Domestic Violence
- Freedom of Speech
- Global Warming
- Gun Control
- Human Trafficking
- I Believe Essay
- Immigration
- Importance of Education
- Israel and Palestine Conflict
- Leadership Essay
- Legalizing Marijuanas
- Mental Health
- National Honor Society
- Police Brutality
- Pollution Essay
- Racism Essay
- Romeo and Juliet
- Same Sex Marriages
- Social Media
- The Great Gatsby
- The Yellow Wallpaper
- Time Management
- To Kill a Mockingbird
- Violent Video Games
- What Makes You Unique
- Why I Want to Be a Nurse
- Send us an e-mail
What is the difference between urban and rural life?

As a travel writer, I often find myself exploring the differences between urban and rural areas. These two types of environments offer unique experiences and lifestyles, each with its own set of advantages and disadvantages. In this article, I will delve into the contrasts between urban and rural life, providing insights from my own observations and research.
Urban Life: Vibrant and Dynamic
Living in an urban area, such as a city, suburb, or town, offers a multitude of benefits. Urban areas are characterized by their extensive development and access to modern infrastructure and connectivity, including airports, ports, railways, housing, and roads. The high population density and abundance of human structures, such as houses, commercial buildings, and bridges, contribute to the fast-paced and vibrant atmosphere of urban life.
One of the main advantages of urban living is the wide range of employment opportunities available. Urban areas tend to have a diverse job market, with various industries, businesses, and organizations. This can translate to better career prospects and higher salaries for urban dwellers.
Urban areas also boast better access to public services, including healthcare, education, and transportation. There are usually more schools, universities, hospitals, and transportation networks in urban areas, making it easier for residents to access these essential services. Additionally, urban areas often offer a plethora of cultural activities, entertainment options, and recreational facilities, providing residents with a vibrant social life.
Rural Life: Serene and Close-Knit Communities
On the other hand, rural areas are characterized by their lower population density and limited development in terms of infrastructure. Living in a rural area often means being surrounded by nature, with picturesque landscapes, open spaces, and fresh air. Rural communities are often closely knit, with residents enjoying a sense of community and belonging.
One of the main advantages of rural living is the lower cost of living. Compared to urban areas, the cost of housing, utilities, and daily expenses tends to be lower in rural areas. This can lead to a more affordable lifestyle and financial stability for rural residents. Additionally, rural areas often have a slower pace of life and less stress compared to the hustle and bustle of urban areas.
However, rural communities also face challenges. Access to quality healthcare services can be limited, with fewer hospitals and medical professionals in rural areas. Public transportation options may be lackluster, making it harder for individuals without private vehicles to get around. Moreover, rural areas may have poor infrastructure, including roads and internet connectivity. Educational attainment can also be lower in rural areas due to limited access to schools and universities.
FAQs about Urban and Rural Life
1. is it better to live in a city or in the countryside.
Both urban and rural living have their advantages and disadvantages. It ultimately depends on individual preferences and priorities. Urban areas offer more opportunities, access to services, and cultural activities, while rural areas provide a sense of community and closer connection to nature.
2. What are the main differences between urban and rural areas?
Urban areas have higher population densities, better access to infrastructure and amenities, and a greater variety of job opportunities. Rural areas, on the other hand, have lower population densities, a lower cost of living, and a stronger sense of community.
3. Is rural life healthier than urban life?
There are pros and cons to both rural and urban life when it comes to health. Rural areas may have lower pollution levels and a slower-paced lifestyle, which can contribute to better overall health. However, rural areas often lack access to quality healthcare services, which can be a disadvantage.
4. Why do people choose to live in rural areas?
Some people choose to live in rural areas to enjoy a slower pace of life, closer proximity to nature, and a stronger sense of community. Others appreciate the lower cost of living and the opportunity to have more space and privacy.
5. Are urban areas safer than rural areas?
Crime rates can vary between urban and rural areas, but it is not accurate to generalize that urban areas are less safe. While urban areas may have higher crime rates due to a larger population, rural areas may experience lower rates of certain types of crimes. Safety can vary depending on specific locations and circumstances.
6. What challenges do rural areas face?
Rural communities often face challenges such as limited access to healthcare, fewer job opportunities, inadequate infrastructure, and lower educational attainment. These factors can contribute to disparities in quality of life between rural and urban areas.
7. Can you have the best of both worlds?
Yes, it is possible to experience the best of both urban and rural life. Some people choose to live in suburban areas, which offer the convenience and amenities of urban areas while still providing a quieter and more spacious environment. Additionally, individuals can choose to work in urban areas while living in rural areas, enjoying the benefits of both lifestyles.
8. How can travelers experience both urban and rural environments?
Travelers can plan their trips to incorporate both urban and rural destinations. They can explore vibrant cities, visit cultural landmarks, and experience the energy of urban life. At the same time, they can venture into rural areas, hike through scenic landscapes, and immerse themselves in the tranquility of nature. This way, they can gain a deeper understanding of the differences and similarities between urban and rural life.
In conclusion, urban and rural areas offer distinct lifestyles and experiences. Urban areas boast advanced infrastructure, employment opportunities, and access to services, while rural areas provide a sense of community, lower cost of living, and closeness to nature. Each has its own advantages and challenges, and the choice between the two depends on individual preferences and priorities. Whether one prefers the fast-paced vibrancy of urban life or the serene tranquility of rural living, both environments have their own charm and allure. So, why not embrace the best of both worlds and explore the contrasts between urban and rural life?
About The Author
Kelli wheeler, leave a comment cancel reply.
Your email address will not be published. Required fields are marked *
Save my name, email, and website in this browser for the next time I comment.
Urban Versus Rural Areas: Compare and Contrast
Introduction, comparison of life in urban and rural areas, reference list.
There has been series of questions on the quality of having a superior or more favourable living condition or position between the rural and urban existence. However, High social status is the most important cardinal concern in the relation based on similarities and differences between rural versus urban course of human events and activities.
Despite the statement of facts and reasons used to support whichever locality as conducive and a better place to reside. Although, having qualities or abilities that merit recognition in some way there is comparison between the similarity and difference of both the urban and rural existence, and of great significance or value are the aspects of choosing or selecting the most suitable locality, noticeable heterogeneity, the state of being free of physical or psychological disease, illness, or malfunction, and the state of being employed or having a job manipulates both aspects of the comparison and even though, there is a mutual great advantages of living condition in both the rural and urban area, moreover, they both have an apparent same quantity, value, or measured amount of negative aspects.
In general, both the rural and urban areas are similar in status with respect to the relations between people or groups relations but hold opposing views in the issues of choice and multiplicity.
Consequently, the life in urban areas has quite a number of optimistic in addition to the pessimistic issues which provide a particular quality or character of the standard of living.
In spite of this, the life in the urban area creates avenue for diversity and choice compared to that of the rural area, for the fact that in the urban area there is wider choice variety on the standard of living and opportunities to explore from various options open to people.
For example, in the urban area, there is various choice of food which could show the way to general better health because of the assortment in diet.
In addition, the inhabitants of the urban areas benefit from the favourable possibility due to a combination of circumstances of accommodating various cultural or social events because of the diversity of choice compared to their rural counterparts. Consequently, they are more civilized and exposed to different culture and ethnicity within ethnic group.
In spite of this, there are various and wide choice of educational institutions, both in the private and public school district in the urban area compared to the rural area and this tend to or result in the possibility of an enhanced schooling.
Moreover, it is worthwhile noting that there is choice of employment alternative prospect due to the large number of businesses or establishments in the urban areas than the rural areas (Kottak, 2006, p.37). Besides this, the urban dwellers have more improved and equipped health care sectors and there is easy access to them compared to the rural dwellers.
Accordingly, human creativity Shine intensely in the urban areas more than the rural area (Hall, 1998, p.15). For a span of 1000 years, the urban areas have been the place where some particular activity is concentrated and the choice of business-related, technological progress, social relationships involving authority or power and ethnical life, thereby inducing into action by using its charm upon the whole country and areas.
The incontrovertible and advancement in severity characteristic to be considered of urban area compelling recognition by economic expert and historiographers contrast with the negative situation and the effect that it has on people and public health. Partly this evolves from a latent or potential state from the iconic point located with respect to surface features of the urban region on the ground that makes the urban area comprehensible by describing the relevant structure, operation or circumstances of poor health.
Research was conducted in Canada and showed that, “populations in the rural showed poorer health than the others in urban, both in general health gauges (i.e. infant mortality, standardized mortality, life expectancy at birth) and also in factors like motor vehicle accidents, being overweight not withstanding” (Mollenkopf, 2005, p.65). Less dependence on vehicles in urban areas may possibly be the consequence of as well as greater importance on walking. However, there are a several drawbacks to living in urban also.
Determining how urbanization affects poverty is essential and coloured by the reality that about one third of the people living in urban areas reside in slums (Sclar et al, 2005, p.901). These impoverished areas are typified by the poor physical and mental health conditions of their inhabitants and by inadequate services. Although some gains have been made on the public health front in urban areas, the benefits are clearly not universal, with urban slums matching some rural mortality and morbidity rates (Sclar et al, 2005, p.902).
However, as cities make good on their promise of better socioeconomic conditions, they can contribute to a downturn in the epidemic. Today, cities generally account for a much larger share of national economic production and have much greater potential than rural areas for reducing poverty and fulfilling aspirations (UNFPA, 2007)
In addition, the absence of daily stress experienced in cities from peripheral factors is a vital issue ((Mollenkopf, 2005, p.70). In as much as the rural area has minimal number of grocery stores and recreation centres, most people in the rural areas have vast lands which are of immense importance and usage. Urban areas theoretically offer more opportunities to deal with a changing population composition, but these would have to be materialized, in the practice, through better policies on a wide front.
Increases in the proportion of the rural population composed of older people have raised concerns about their wellbeing. On the one hand, rural dwellers in developing countries tend to be more vulnerable than the urban counterpart because of their higher incidence of poverty, greater transportation problems, and lack of access to social services and infrastructure (Montgomery, McGranahan, and Martine, 2008, p.262).
Living in rural areas however has its negative aspects too. Unlike urban areas, residents in the rural areas have no vast opportunities of choosing from different employment opportunities for they are not as many in the rural areas as they are in the urban setting. In other words, if there is any statement to be made, rural living has the best worth of life. There is a better ability of hooking up with people and the landscape. Although, the living standard of both the urban and rural area is comparable because they both entails an elevated level of adoption of the behaviour patterns of the surrounding culture. The inky difference is when it comes to the accessibility of choices and diversity, in particular when fundamental factors (healthcare, education, and employment options) are concerned.
Hall, P . (1998). Cities in Civilization – Culture, Innovation, and Urban Order. London: Weidenfeld & Nicholson.
Kottak, C., P. (2006). Anthropology : the exploration of human diversity. Columbus, OH: McGraw Hill Higher Education.
Mollenkopf, H. (2005). Enhancing mobility in later life. Amsterdam, The Netherland: IOS Press.
Montgomery, M., McGranahan, G., and Martine, G. (2008). The new global frontier: urbanization, poverty and environment in the 21st century. London: IIED.
Scalar, E. D., Garau, P. and Carolini, G. (2005). ‘The 21st century health challenge of slums and cities’ , The Lancet. 365, no 9462. 901-902.
UNFPA (2007). The State of the World’s Population 2007: Unleashing the Potential of Urban Growth. New York, NY: UNFPA.
Cite this paper
- Chicago (N-B)
- Chicago (A-D)
StudyCorgi. (2021, November 28). Urban Versus Rural Areas: Compare and Contrast. https://studycorgi.com/urban-versus-rural-areas-compare-and-contrast/
"Urban Versus Rural Areas: Compare and Contrast." StudyCorgi , 28 Nov. 2021, studycorgi.com/urban-versus-rural-areas-compare-and-contrast/.
StudyCorgi . (2021) 'Urban Versus Rural Areas: Compare and Contrast'. 28 November.
1. StudyCorgi . "Urban Versus Rural Areas: Compare and Contrast." November 28, 2021. https://studycorgi.com/urban-versus-rural-areas-compare-and-contrast/.
Bibliography
StudyCorgi . "Urban Versus Rural Areas: Compare and Contrast." November 28, 2021. https://studycorgi.com/urban-versus-rural-areas-compare-and-contrast/.
StudyCorgi . 2021. "Urban Versus Rural Areas: Compare and Contrast." November 28, 2021. https://studycorgi.com/urban-versus-rural-areas-compare-and-contrast/.
This paper, “Urban Versus Rural Areas: Compare and Contrast”, was written and voluntary submitted to our free essay database by a straight-A student. Please ensure you properly reference the paper if you're using it to write your assignment.
Before publication, the StudyCorgi editorial team proofread and checked the paper to make sure it meets the highest standards in terms of grammar, punctuation, style, fact accuracy, copyright issues, and inclusive language. Last updated: November 8, 2023 .
If you are the author of this paper and no longer wish to have it published on StudyCorgi, request the removal . Please use the “ Donate your paper ” form to submit an essay.
Essay on City Life Vs Village Life for Students and Children
500+ words essay on city life vs village life.
Village life reflects the rural lifestyle and city life shows the urban lifestyle. Life in both rural and urban areas has its own plus points and problems. One is quite different from each other. Traditionally, India is a predominantly rural country as Mahatma Gandhi had said, “The real India lives in villages”. Though India is mainly a land of villages, there are many cities as well in the country. Life in these big cities is quite different from life in a village. Let us consider, in brief, life in a big city and point out some of its important advantages and disadvantages.

Comparison: City life Vs Village life
The facility of education.
In big cities, there are good arrangements for education. The big college even universities are available. There are also a very large number of school both government and private in the big city. These arrangements do not exist in small towns and villages.
Medical Facility
Cities also provide sufficient medical facilities. Almost in every city, there are good hospitals in which the poor get free medicines and treatment. Many qualified doctors are also there to serve the sick and the suffering. Indeed lack of such medical arrangement is the main drawback of villages.
Amusement and Recreation
Cities also provide many opportunities for amusement and recreation. In every city, there are a number of cinema houses and multiplexes, where we can enjoy with family. Also, a number of restaurants and hotels are available for better food of variety. There are also many parks and gardens where we can enjoy the best natural beauty. Villages are always lacking such facilities.
The Opportunity of Employment
The most important advantages of cities are the availability of huge opportunity for employment . They are centers of trade and commerce as well as offices of many multinational companies . Persons with different qualifications can easily find jobs to suit them. In villages, employment is available mostly in farming. Due to farming, only seasonal jobs are available to a large population in villages.
Get the huge list of more than 500 Essay Topics and Ideas
Mixed Culture
Cities are having a variety of people from various cultures. But real India and its customs are highly visible in villages.
Natural Environment
It is fact villages are always natural due to be their self-creation by nature. On the other hand, most cities are manmade. Hence the natural environment of villages is their main attraction. In villages only we may have the charms of birds and flowers or the beauty of the day-dawn.
Pollution and Adulteration
City life is extremely unhealthy due to air pollution, water pollution, and noise pollution . The people are not getting fresh air to breathe or the clear sky to enjoy the sunshine. Also, food in the cities is dirty, unhealthy and adulterated. The villages are very much away from such drawbacks.
Population and Other Issues
In city life is very costly. People have to live with a lot of pomp and show. A simple life as in the villages is almost impossible in the city. Besides, the cities are over-crowded and it is very hard for people to get suitable accommodation. People in the city do not have much sympathy with others even with neighbors. The sympathy and close interdependence which is marked in the village’s life is entirely lacking in the city.
Thus, life in villages and in cities presents two contrasting pictures. There are positive as well as negative aspects of both. Therefore it is up to the individual to make the most of it irrespective of the rural or urban setting that one lives in. I, myself, like to live in a village in the close vicinity of a modern city so that I can enjoy the pleasures both of the city and the village.
Customize your course in 30 seconds
Which class are you in.

- Travelling Essay
- Picnic Essay
- Our Country Essay
- My Parents Essay
- Essay on Favourite Personality
- Essay on Memorable Day of My Life
- Essay on Knowledge is Power
- Essay on Gurpurab
- Essay on My Favourite Season
- Essay on Types of Sports
Leave a Reply Cancel reply
Your email address will not be published. Required fields are marked *
Download the App

Numbers, Facts and Trends Shaping Your World
Read our research on:
Full Topic List
Regions & Countries
- Publications
- Our Methods
- Short Reads
- Tools & Resources
Read Our Research On:
- What Unites and Divides Urban, Suburban and Rural Communities
Amid widening gaps in politics and demographics, Americans in urban, suburban and rural areas share many aspects of community life
Table of contents.
- 1. Demographic and economic trends in urban, suburban and rural communities
- 2. Urban, suburban and rural residents’ views on key social and political issues
- 3. How people in urban, suburban and rural communities see each other – and say others see them
- 4. Views of problems facing urban, suburban and rural communities
- 5. Americans’ satisfaction with and attachment to their communities
- 6. How urban, suburban and rural residents interact with their neighbors
- 7. Life satisfaction and social support in different communities
- Acknowledgments
- Methodology
- Appendix: Additional tables and maps
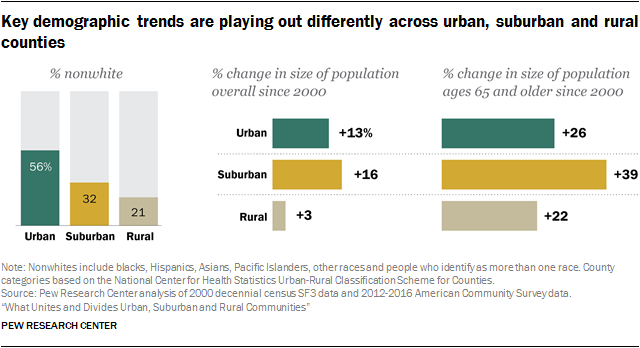
Large demographic shifts are reshaping America. The country is growing in numbers, it’s becoming more racially and ethnically diverse and the population is aging. But according to a new analysis by Pew Research Center, these trends are playing out differently across community types.
Urban areas are at the leading edge of racial and ethnic change, with nonwhites now a clear majority of the population in urban counties while solid majorities in suburban and rural areas are white. Urban and suburban counties are gaining population due to an influx of immigrants in both types of counties, as well as domestic migration into suburban areas. In contrast, rural counties have made only minimal gains since 2000 as the number of people leaving for urban or suburban areas has outpaced the number moving in. And while the population is graying in all three types of communities, this is happening more rapidly in the suburbs than in urban and rural counties.
At the same time, urban and rural communities are becoming increasingly different from each other politically . Adults in urban counties, long aligned with the Democratic Party, have moved even more to the left in recent years, and today twice as many urban voters identify as Democrats or lean Democratic as affiliate with the Republican Party. For their part, rural adults have moved more firmly into the Republican camp. More than half (54%) of rural voters now identify with or lean to the GOP, while 38% are Democrats or lean Democratic.
Against this backdrop, a new Pew Research Center survey finds that many urban and rural residents feel misunderstood and looked down on by Americans living in other types of communities. About two-thirds or more in urban and rural areas say people in other types of communities don’t understand the problems people face in their communities. And majorities of urban and rural residents say people who don’t live in their type of community have a negative view of those who do. In contrast, most suburbanites say people who don’t live in the suburbs have a positive view of those who do.
In exploring the attitudes, experiences and changing demographics of Americans in different types of communities, this report relies on two distinct approaches to defining urban, suburban and rural areas. For the analysis of findings from the new Pew Research Center survey (Chapters 2-7 of the report), references to urban, suburban and rural communities are based on respondents’ answer to the following question: “How would you describe the community where you currently live? (1) urban, (2) suburban, (3) rural.”
The analysis of how urban, suburban and rural communities are changing along demographic lines (Chapter 1), based on U.S. Census Bureau data, relies on county-level classifications created by the National Center for Health Statistics at the Centers for Disease Control and Prevention.
In determining how to draw the lines between “urban,” “suburban” and “rural” communities, Pew Research Center consulted a series of social scientists with expertise in this area. To be sure, there are many ways – and no one right way – to classify communities. Because the survey explored issues related to how Americans are experiencing life in their local communities, including how they relate to their neighbors and how attached they feel to their communities, we settled on a definition based on people’s description of the area where they live.
The classification based on counties used in the analysis of census data makes it more challenging to speak to the specific localities where Americans live, but it has the advantage of allowing for the data to be more easily linked among government data sources to analyze changes over time across the country.
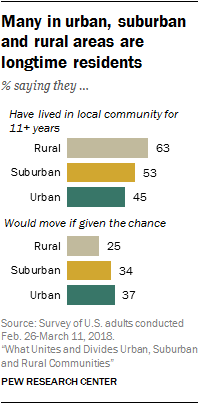
The divides that exist across urban, suburban and rural areas when it comes to views on social and political issues don’t necessarily extend to how people are experiencing life in different types of communities. Rural and suburban adults are somewhat more rooted in their local areas, but substantial shares in cities, suburbs and rural areas say they have lived in their communities for more than 10 years. And about six-in-ten in each type of community say they feel at least some sense of attachment to their communities, though relatively few say they are very attached.
For adults who currently live in or near the place where they grew up – roughly half in rural areas and about four-in-ten in cities and suburbs – family ties stand out as the most important reason why they have never left or why they moved back after living away. And, when it comes to their interactions with neighbors, urban, suburban and rural residents are about equally likely to say they communicate with them on a regular basis.
In addition, urban and rural residents share some of the same concerns. Roughly equal shares of urban (50%) and rural (46%) residents say that drug addiction is a major problem in their local community. When it comes to the availability of jobs, rural adults are somewhat more likely to say this is a major problem where they live (42% say so), but a substantial share of urban dwellers (34%) say the same, significantly higher than the share in suburban communities (22%). Other problems – such as access to affordable housing in cities and access to public transportation in rural areas – are felt more acutely in some areas than in others.
The nationally representative survey of 6,251 adults was conducted online Feb. 26-March 11, 2018, using Pew Research Center’s American Trends Panel . 1 It explores the attitudes and experiences of Americans in urban, suburban and rural areas, including their views on key social and political issues, how they see people in other types of communities, and how they’re living out their lives in their local communities. The survey sheds light on what divides and unites Americans across community types as well as on differences within urban, suburban and rural areas – sometimes driven by partisanship, sometimes by demographics. The study also includes a detailed analysis of demographic trends in urban, rural and suburban counties. Among the report’s key findings:
There are significant gaps in measures of economic well-being in urban, suburban and rural counties
In addition to the divergent demographic trends taking place in urban, suburban and rural communities, the analysis finds that rural counties lag behind their urban and suburban counterparts when it comes to some measures related to economic well-being. The average earnings per worker in urban areas were $49,515 in 2016, followed by $46,081 in the suburbs and $35,171 in rural areas, though these figures don’t account for differences in living costs across county types. And while the number of employed adults ages 25 to 54 rose in urban and suburban counties since 2000, it declined in rural counties overall.
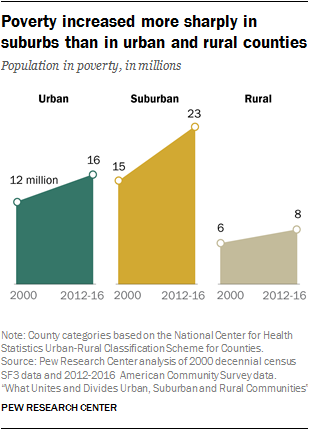
When it comes to the number of people living in poverty, however, the suburbs have seen much sharper increases since 2000 than urban or rural counties – a 51% increase, compared with 31% in cities and 23% in rural areas. Overall, the poverty rate is somewhat higher in rural (18%) and urban (17%) areas than in suburban (14%) counties.
Rural Americans, especially those without a college degree, are less optimistic about their financial future
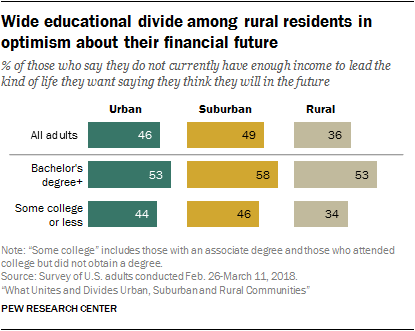
Majorities of Americans in urban (68%), suburban (59%) and rural (62%) communities say they don’t currently have enough income to lead the kind of life they want. But while about half of those in cities (46%) and suburbs (49%) who say this is the case believe they will have enough income in the future, rural residents are less optimistic: 63% of adults in rural areas who say they don’t currently have enough income to lead the kind of life they want don’t expect to in the future, while 36% think they eventually will.
The gap in financial optimism across community types is driven by a marked concern among rural residents without a bachelor’s degree. In rural areas, about a third (34%) of those with some college or less education who say they don’t currently have enough income to lead the kind of life they want think they will in the future; higher shares in cities (44%) and suburbs (46%) say this is the case. In contrast, similar shares of those with a bachelor’s degree or more education in urban (53%), suburban (58%) and rural (53%) areas think they will eventually have enough income to lead the kind of life they want.
Across community types, majorities say rural areas get less than their fair share of federal dollars
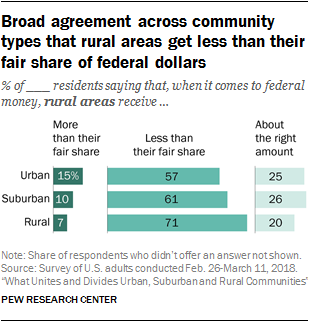
About seven-in-ten rural residents (71%), and somewhat narrower majorities in suburban (61%) and urban (57%) communities, say rural areas receive less than their fair share of federal dollars. These views don’t vary considerably across demographic or partisan lines.
When it comes to the amount urban areas receive from the federal government, about half of urban dwellers (49%) say cities receive less than their fair share; only about a third of those in suburbs and rural areas share this view. Across community types, Democrats are more likely than Republicans to say urban areas receive less than their fair share, while Republicans are more likely to say these types of communities receive more than their fair share. Similar shares of Democrats and Republicans within each community type say urban areas receive about the right amount of federal dollars.
About six-in-ten rural residents say the values of urban dwellers don’t align with theirs; 53% of urban residents say the same about the values of those in rural areas
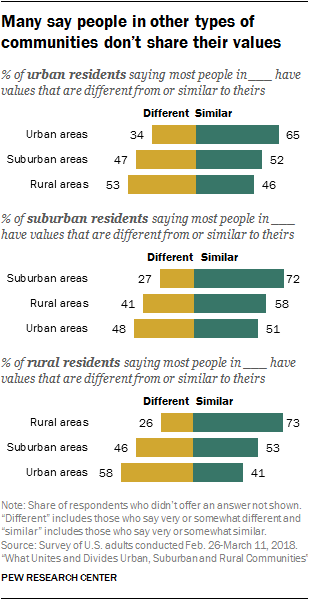
Most Americans say people who live in the same type of community as they do generally share their values, but they are less convinced that those in other types of communities do. For example, a majority of rural residents (58%) say the values of most people in urban areas are very or somewhat different from theirs.
Among urban dwellers, 53% see an urban-rural divide on values, while 46% say most people in rural areas have values that are similar to their own. About half in urban and rural areas say most people in suburbs share their values, while suburbanites are somewhat more likely to say most people in rural areas have values that are similar to their own (58%) than to say the same about those in urban areas (51%).
There’s a clear political dimension to these attitudes. For example, majorities of Republicans in urban (64%) and suburban (78%) communities say most people in rural areas share their values, while about six-in-ten Democrats in these communities say the values of most rural residents are different from theirs.
Conversely, Democrats in suburban and rural areas are far more likely than their Republican counterparts to say most people who live in cities share their values. Even among Republicans who live in urban areas, only about half (48%) say most people who live in cities share their values.
Urban and rural Americans differ sharply in their views of some key social and political issues, but in some cases this has more to do with partisanship than geography
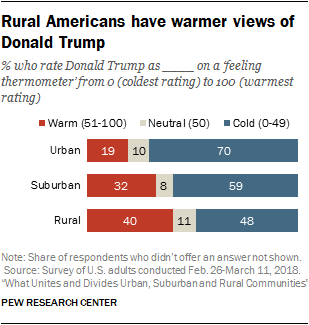
Americans in urban and rural communities have widely different views when it comes to social and political issues, including their assessments of President Donald Trump and opinions about race, immigration, same-sex marriage, abortion and the role of government.
In many cases, the differences between urban and rural residents can be attributed to the fact that rural areas tend to have a higher concentration of Republicans and Republican-leaning independents, while majorities in urban communities identify with or lean toward the Democratic Party. For example, while urban dwellers are far more likely than their rural counterparts to say abortion should be legal in all or most cases, that the government should do more to solve problems, and that whites benefit from advantages in society that black people do not have, these differences shrink when partisanship is taken into account. In other words, Democrats across community types share similar views on these issues, as do Republicans in urban, rural and suburban areas.
On other issues, differences across community types remain, even after controlling for partisanship. Rural Republicans are more likely than Republicans in urban areas to say the legalization of same-sex marriage is a bad thing for society, and they are also more likely to express very positive views of Trump. In turn, Democrats across community types express different views on immigration, with those in urban areas more likely than their rural counterparts to say the growing number of newcomers strengthens American society.
Seven-in-ten urban dwellers – vs. about half in rural areas – say it’s important to them to live in a community that is racially and ethnically diverse
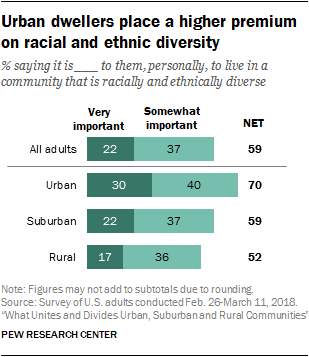
Rural residents are far more likely than their suburban and urban counterparts to say that, as far as they know, all or most of their neighbors are the same race or ethnicity as they are (69% vs. 53% and 43%, respectively). And urban residents place a much higher priority on living in a community that is racially and ethnically diverse than do those in suburban and rural areas: 70% of city dwellers say this is very or somewhat important to them, compared with a narrower majority of those in suburbs (59%) and about half in rural areas (52%).
Across community types, relatively few say all or most of their neighbors share their political views: About a quarter in urban (25%) and rural (24%) communities and 19% in the suburbs say this is the case. Perhaps not surprisingly, given the political makeup of urban and rural communities, majorities of Republicans in cities (59%) and Democrats in rural areas (57%) say only some or none of their neighbors share their political views.
Living among politically like-minded people is not a top priority for most Americans: Only one-in-ten or fewer in urban (10%), suburban (8%) and rural (6%) communities say it is very important to them personally to live in a community where most people share their political views. Still, many say this is at least somewhat important to them (46%, 43% and 38%, respectively).
Urban and rural residents see drug addiction as a top-tier problem in their local community
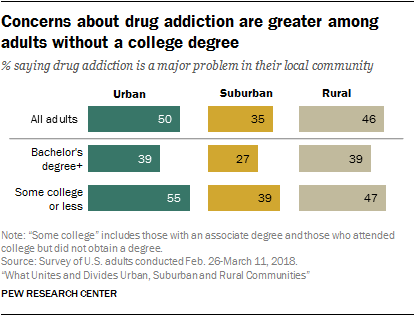
About half of urban (50%) and rural (46%) adults say drug addiction is a major problem where they live; a smaller but substantial share in the suburbs (35%) say the same about their local community.
Concerns about drug addiction vary significantly along socio-economic lines. Across community types, those without a bachelor’s degree are more likely than those with more education to say drug addiction is a major problem in their local community.
Certain problems are felt more deeply in some types of communities than in others. For example, rural adults are more likely than their urban and suburban counterparts to say access to public transportation and to high-speed internet are major problems. For their part, urban dwellers express greater concern than those in suburban and rural areas about the availability of affordable housing, crime, poverty and the quality of K-12 education in public schools.
About four-in-ten U.S. adults live in or near the community where they grew up
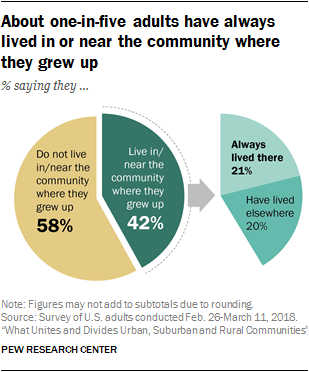
About half of rural residents (47%) say they live in or near the community where they grew up, including about a quarter (26%) who say they have always lived there. Among those in urban and suburban areas, about four-in-ten say they currently live in or near the community where they grew up (42% and 38%, respectively), with about one-in-five in each saying that has always been the case.
In urban, suburban and rural areas, more point to family ties than to any other factor as one of the main reasons why they stayed in the community where they grew up or why they left and later returned. About four-in-ten of those who left and came back (42%) and 35% of those who have lived in or near the same community their entire lives say they have done so to be near family. For both groups, factors related to the quality of life in the community, such as the cost of living, the climate, amenities, schools, or the sense of community, are the second most-cited reasons; 22% of those who left and returned and 17% of those who never left point to these factors.
About half of adults who have always lived in or near the community where they grew up (52%) say all or most of their extended family members live within an hour’s drive from them, compared with 38% of those who moved away and returned, and even smaller shares of those who don’t live in or near the community where they grew up (17%).
Across community types, relatively few say they feel very attached to the community where they live
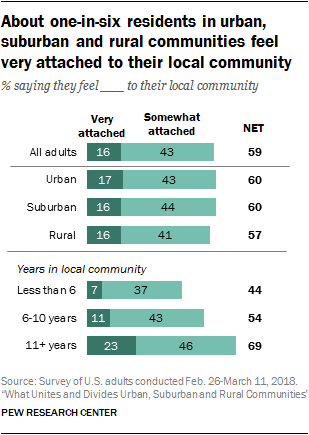
A majority of Americans (59%) say they feel some attachment to their local community, but only 16% say they feel very attached; 41% say they are not too or not at all attached to the community where they live. Adults in urban, suburban and rural areas report nearly identical levels of attachment to their local community.
In each of the three types of communities, those who have lived in their community for more than a decade and who have made connections with their neighbors are the most likely to feel a sense of attachment. About seven-in-ten adults who have lived in their community more than a decade (69%) say they feel very or somewhat attached to their local community, compared with 54% of those who have lived in their community six to 10 years and 44% of those who have done so less than six years. And while 77% of those who say they know all or most of their neighbors say they feel attached to their local community, a narrower majority of those who know some of their neighbors (55%) and about a third of those who don’t know any of their neighbors (32%) say the same.
Smaller shares of adults in rural areas than in cities and suburbs say they’d like to move away
About a third of U.S. adults (32%) say they would want to move to a different community if they could, while 37% say they would not want to move and 31% aren’t sure. One-in-four rural residents say they would move if given the chance, compared with 37% of those in urban areas and 34% of suburbanites. Among adults younger than 30, however, about an equal share in urban (42%) and rural (39%) areas say they would move if they could; 48% of young adults in the suburbs say the same.
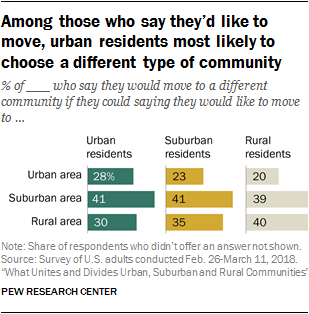
Among those who say they would want to move, many, particularly in suburban and rural areas, say they would like to stay in the same type of community. For example, about four-in-ten adults in the suburbs who would like to move (41%) say they would choose to move to another suburban community. Similarly, 40% of those in rural areas who report they would like to move say they would move to another rural community.
Among urban dwellers who say they would like to move, similar shares say they would like to stay in an urban area (28%) as say they would like to move to a rural community (30%). About four-in-ten (41%) would like to move to the suburbs.
Rural residents are more likely than those in cities or suburbs to say they know all or most of their neighbors, but no more likely to interact with them
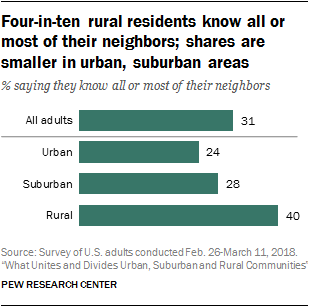
Four-in-ten adults in rural communities say they know all or most of their neighbors, compared with 28% in the suburbs and 24% in urban areas. However, among those who know at least some of their neighbors, rural Americans are no more likely than their urban and suburban counterparts to say they interact with them on a regular basis.
About half of adults who know at least some of their neighbors in urban (53%), suburban (49%) and rural (47%) communities say they have face-to-face conversations with a neighbor at least once a week. Other forms of communication, such as exchanging emails or text messages or talking on the phone with neighbors, are less common: About one-in-five or fewer in urban, rural and suburban areas say this happens at least once a week.
Americans are generally trusting of their neighbors, but those in suburban and rural areas are more so. For example, about six-in-ten of those in the suburbs (62%) and in rural communities (61%) say they have a neighbor they would trust with a set of keys to their home, compared with about half (48%) in urban areas.
There is little variation among those living in different types of communities in the share reporting they have social support, feel optimistic about their lives or feel lonely. And the idea that life in the city feels more hectic than life in the country is not borne out by the data – only about one-in-ten urban, suburban and rural residents say they always or almost always feel they are too busy to enjoy their lives.
For the analysis of findings from the new Pew Research Center survey (Chapters 2-7 of the report), references to “urban,” “suburban” and “rural” are based on respondents’ answer to the following question: “How would you describe the community where you currently live? (1) urban, (2) suburban, (3) rural.”
The analysis of how urban, suburban and rural communities are changing along demographic lines (Chapter 1), based on data from the U.S. Census Bureau, relies on county-level classifications created by the National Center for Health Statistics at the Centers for Disease Control and Prevention.
Throughout the report, the terms “urban” and “city” are used interchangeably.
All references to party affiliation include those who lean toward that party: Republicans include those who identify as Republicans and independents who say they lean toward the Republican Party, and Democrats include those who identify as Democrats and independents who say they lean toward the Democratic Party.
References to Millennials include adults who are ages 22 to 37 in 2018. Generation Xers include those who are ages 38 to 53, Baby Boomers include those who are 54 to 72 and members of the Silent Generation include those ages 73 to 90.
References to college graduates or people with a college degree comprise those with a bachelor’s degree or more. “Some college” includes those with an associate degree and those who attended college but did not obtain a degree. “High school” refers to those who have a high school diploma or its equivalent, such as a General Education Development (GED) certificate.
References to whites, blacks and Asians include only those who are non-Hispanic and identify as only one race. Hispanics are of any race. Nonwhites include blacks, Hispanics, other races and people who identify with more than one race.
“Upper class” refers to those who said they belong in the upper or upper-middle classes. “Lower class” refers to those who said they belong in the lower or lower-middle classes.
- The survey includes an oversample of adults living in rural areas. For more details, see the Methodology section of the report. ↩
Sign up for our weekly newsletter
Fresh data delivery Saturday mornings
Sign up for The Briefing
Weekly updates on the world of news & information
- Household Structure & Family Roles
- Religion & Social Values
- Rural, Urban and Suburban Communities
Support for legal abortion is widespread in many places, especially in Europe
Americans overwhelmingly say access to ivf is a good thing, among parents with young adult children, some dads feel less connected to their kids than moms do, most east asian adults say men and women should share financial and caregiving duties, parents, young adult children and the transition to adulthood, most popular, report materials.
- Interactive: How has your county changed?
- American Trends Panel Wave 32
1615 L St. NW, Suite 800 Washington, DC 20036 USA (+1) 202-419-4300 | Main (+1) 202-857-8562 | Fax (+1) 202-419-4372 | Media Inquiries
Research Topics
- Email Newsletters
ABOUT PEW RESEARCH CENTER Pew Research Center is a nonpartisan fact tank that informs the public about the issues, attitudes and trends shaping the world. It conducts public opinion polling, demographic research, media content analysis and other empirical social science research. Pew Research Center does not take policy positions. It is a subsidiary of The Pew Charitable Trusts .
Copyright 2024 Pew Research Center
Rural and urban areas: comparing lives using rural/urban classifications
- Published: 01 June 2011
- Volume 43 , pages 11–86, ( 2011 )
Cite this article

- Tim Pateman 1
380k Accesses
88 Citations
16 Altmetric
Explore all metrics
Most people have a clear impression of what the cities, towns and countryside look like in the UK, both physically and in terms of the lives of the people who live there. This article compares rural and urban areas statistically for themes such as working, earnings, services and population, using geographical classifications.
There is quantitative evidence that rural areas are better off than urban areas on a number of different measures, such as unemployment and crime, but there are substantial differences within both rural and urban areas. In a few respects rural areas are worse off. Analysis indicates that house prices are less affordable to local workers in rural areas than urban areas and the costs, travel time and carbon emissions resulting from transport tend to be higher in rural areas.
Using classifications that show sparse areas of England, some topics, such as incomes and qualifications, show ‘two countrysides’ – a better off, less sparse and more accessible one, and a less populous and isolated sparse countryside. Patterns within urban areas often differ, with the most urban areas of England frequently showing different trends from those in other places, and the widest variations.
This article shows that while no single rural/urban classification can be used for all geographies, using such a product helps to better understand the differing characteristics of rural and urban areas in a consistent, transparent way. This article will be of interest to those who wish to explore local authority or small area datasets, covering countries within the UK, for rural/urban differences, as well as those who wish to develop a greater understanding of rural/urban differences in general. It will also be of interest to those involved in local policy development and the allocation of resources within areas, as well as academics, journalists, researchers and members of the public with an interest in the classification and characteristics of rural and urban areas.
Beyond the census: a spatial analysis of health and deprivation in england.

Deprivation in England, 1971–2020

Inequality and income segregation in Brazilian cities: a nationwide analysis
Avoid common mistakes on your manuscript.
Introduction
Despite the continued spread of our towns and cities, the UK geographic landscape is still predominantly rural. Whichever classification is used, for all four countries in the UK, less than one-third of the land area is classified as urban. However, at least 60 per cent of the population is concentrated in these smaller urban areas.
The topographic differences between town and country might be expected to lead to very different experiences for their residents. Transport and access to services are the most obvious areas for study, and this article looks at these as well as population structures, education, health and the physical environment. Although the article does not look at change over time and the recent recession, there is an emphasis on household finances and working lives.
The rural/urban classifications established for different nations and geographies within the UK present excellent opportunities to examine all these themes. The aim of this paper is to apply seven recognised classifications to a variety of datasets to determine if differences and patterns exist in UK life according to how rural or urban a place is.
These classifications allow us to study not just specific places, but ‘place’ in general. They potentially allow differences between places to be shown for big groupings of people, and the bigger the groups, the more quickly or more cheaply robust statistics can be produced. In effect, classifications offer opportunities to help understand complex differences, with less information.
Seeing clear differences between broad groupings of areas may present opportunities for designing, implementing and monitoring policy; but it raises the question – are the differences positive or negative? What effects do they have on the people who live there? Qualitative research is better placed to answer that question Footnote 1 . However, official statistics can be used to consider whether barriers exist (in which case differences might be divisive), or whether people appear to be moving freely, in which case differences could be argued to represent genuine diversity and choice. Both rural and urban areas have been painted positively (idylls and cosmopolitan centres), and as traps. Statistical classifications allow us to dig deeper than stereotypes and impressions.
Some of the data used in the article were already aggregated to urban and rural area types. However, this is mainly an exercise in taking publicly available datasets, published at local authority or small area level, and matching to a rural/urban classification then aggregating the data directly.
It is worth noting that a wealth of data are available at the small area level from the 2001 Census. This was considered too out of date for analysis for this article. However, when 2011 Census data are released over the next few years there will be many opportunities for rural/urban analysis.
This article aims to complement the large volume and wide variety of rural/urban material published by other UK organisations. For England these include the Commission for Rural
Communities (CRC), the Department for Environment, Food and Rural Affairs (Defra) and the Office for National Statistics (ONS) through its Neighbourhood Statistics Service. The Welsh Government (WG) publishes topic reports and compendia, such as ‘Statistical Focus on Rural Wales’ which gives more information on the local authority level rural/urban classification used here.
The Scottish Government publishes rural/urban material, and, as with other countries, this is both in the form of dedicated reports (for example briefings and key facts documents) and as appendices or sub-sections of wider reports. Different government departments in Northern Ireland publish rural/urban statistics, including the Northern Ireland Statistics and Research Agency (NISRA), Department of Agriculture and Rural Development (DARD) and Department for Social Development (DSD).
The data used in the figures are available at:
www.statistics.gov.uk/downloads/themecompendia/RegionalSnapshot/rt43-rural-urban-areas.xls
Issues and limitations
There are a number of things to bear in mind when interpreting the material in this article.
Interpretation
Policies designed specifically for urban or rural areas might refer to extremes - inner cities or small villages. Using a statistical classification puts every place in a country, including the areas most people think of as suburbs, into either an urban or a rural area type
These classifications make it easy to slip into the ‘ecological fallacy’ - for example thinking of all people in the most deprived areas as deprived, when in fact many people in the most deprived areas are by no means ‘poor’ and the majority of deprived people do not live in deprived areas. Even the biggest rural/urban difference can obscure there being more variation within areas than there is between them
On the other hand, it is often hypothesised that neighbourhoods do affect people. For example, studies on deprivation and health sometimes show that even when many other factors are taken into account, simply living in a deprived neighbourhood is associated with poorer health
Classifications may feel wrong for particular areas. None of the classifications used in this article take account of the look and feel of a particular place, rather they are modelled using sets of definitions and rules
Presentation
In all cases areas can be split into urban and rural groups (or more accessible, less accessible for local authorities in Northern Ireland), but most classifications give at least one more detailed way of breaking down the data. This report shows a number of different ways of sub-dividing such classifications. However, not all the classifications offer breakdowns of urban areas
Urban and rural areas should not be compared using more than one classification, so in general each country is analysed separately
Data are not collected and published consistently across the UK, especially for devolved matters such as housing. Although many datasets used here are multi-country, sometimes there has only been space for data analysis for a single country
Data accuracy
In order that official statistics do not identify individual people or businesses, data are subject to disclosure control. In many cases the datasets here have been subject to some degree of rounding or suppression (where some data may not be available). Unfortunately this is more likely to affect smaller areas. Since this article aggregates published data, for local authority datasets the estimates for rural areas (which tend to be less populous) are likely to be less accurate
While some datasets, such as those covering crime and General Certificate of Secondary Education (GCSE) or equivalent scores, are derived from administrative sources, in most cases a sample survey has been used. All the figures in this report should be assumed to be estimates and subject to sampling variability, unless stated otherwise
Where national figures are published in this report, they may have been aggregated from local data, and therefore may differ from national figures published elsewhere. Different time periods, geographies and use of public (disclosure controlled) datasets may also make figures here difficult to compare with those elsewhere
Rural/urban classifications
This article uses two main types of classification to divide areas into rural and urban. To cover small area data and local authority level data for the four countries of the UK requires seven classifications. A summary of each of these, including the data used, publication links, and the headline proportions of urban and rural people, can be found in Appendix A. This section presents a map and a table of key population figures for each one.
Many alternative and older classifications exist - it was estimated in 2007 that 30 different definitions were in use across the UK (Scott, Gilbert and Gelan, 2007). Some classifications cover only some types of area - for example the Commission for Rural Communities’ uplands areas. Other products cover the whole of the UK, but do not focus on rural and urban issues alone. ONS’s Local Authority Classification and Output Area Classification products have some categories that show rural areas; however, these show different geographical distributions from those developed by or with Defra, and are not widely used as rural/urban classifications.
Dedicated rural/urban classifications are generally based on complex modelling exercises. Some aspects have been devised subjectively, for example, selecting the Valleys group of local authorities in Wales using local knowledge and existing policy area boundaries. Thresholds differ, so that any settlement with more than 10,000 people will be considered urban in any UK small area definition; however, settlements with between 3,500 and 10,000 people are treated differently in each classification. Several have been updated, and it is worth noting that a number of government organisations, including Communities and Local Government (CLG), Defra, ONS and WG, are jointly looking into updating the rural/urban definition covering small areas in England and Wales for use with 2011 Census outputs.
What makes a good rural/urban classification? A common approach is to take several continuous data variables, not just one, and look for clusters of areas. Commonly-used factors are population size, population concentration and remoteness (which can be measured as physical distance to other settlements, travel time, or a modelled measure of where people are in relation to each other known as ‘population potential’). Ultimately there is no limit to the kinds of settlements a classification can pick out. Vickers’ 2003 UK district classification Footnote 2 picks out area groupings such as ‘agricultural fringe’ and ‘averageville’ but this classification has seen less use in recent years than simpler definitions. The perfect classification would be comparable across different nations. Only the Eurostat ‘urban-rural typology’ Footnote 3 can offer this at the moment; however, because it is based on larger (NUTS 3 Footnote 4 ) areas than those used in this article, and it does not allow different kinds of urban area to be distinguished, it is not widely used in analyses such as those in this article.
The classifications used in this article are based on different sets of criteria. Individual classifications may have methodological limitations. Such issues tend to be set out in a methodology or technical report for each classification, links to some of which can be found in Appendix A .
The Rural/Urban Definition (England)
Map 1 , which uses a small area geography based on Middle Layer Super Output Areas (MSOAs), shows a complex patchwork of area types. Of particular note are the ‘sparse’ areas, both urban and rural, which are few in number, and concentrated in particular areas broadly round the fringes of the country. This definition picks out a far larger number of urban areas than the local authority definitions do, but groups them all together, so that, for example, Westminster and Weston-super-Mare are shown in the same group. It is also worth noting that Town and Fringe – Less Sparse areas almost always lie next to Urban – Less Sparse ones.
The Rural/Urban Definition for MSOAs 1 in England
Table 2 shows the predominance of the Urban – Less Sparse area type; no other area type in this report includes such a high proportion of people. There is an interesting symmetry in the difference between urban and rural areas: in England urban areas contain about 80 per cent of the population but cover roughly 20 per cent of the land area, rural areas cover roughly 80 per cent of the land and 20 per cent of the population. Some 42 million people live in urban England by this definition, and just under 10 million in rural England.
Sparse areas, which cover three narrower area types in both rural and urban areas, contain 1.4 per cent of the population. Only 15 per cent of this group are resident in urban areas and the remainder in rural areas. The Urban – Sparse area type, in particular, is very small with a population, of 114,000, which compares, for example, to that of the 2001 Census-defined urban areas of Southport or St Albans. Sparse area types should therefore be expected to have distinct characteristics where survey data are being analysed, as sample sizes are likely to be close to the acceptable minimum. A population pyramid showing the age structure for the rural and urban populations is presented in Figure 52 on page 63.
Population pyramid for England: by area type, mid-2009
The Rural/Urban Definition (Wales)
While the Rural/Urban Definition is the same for Wales (shown in Map 3 ) as for England, the aggregation of area types into urban and rural wider area types can in practice be done in different ways. For example, in Wales, the Town and Fringe area types may sometimes be divided into urban and rural areas by population size. This report follows the convention of classifying all town and fringe areas as rural.
The Rural/Urban Definition for MSOAs 1 in Wales
Table 4 shows that according to the Rural/Urban Definition two-thirds of people in Wales live in urban areas (just below 2 million people), and a third in rural areas (just above 1 million). One in seven Welsh people live in a sparse area; these cover just over 60 per cent of the land area of Wales. With 430,000 people, this is greater than the population of any urban area in Wales from the 2001 Census (Cardiff urban area had a population of 328,000), and roughly equivalent in population size to the Bristol or Sheffield urban areas in England. Higher proportions of the total population live in each sparse area type compared with England, and in most of the rural areas types. At 11 per cent of the population, the Village, Hamlet and Isolated Dwellings (VHID) – Sparse area type is the third biggest in population terms in Wales, and one that covers more than half of the total land area.
Roughly one in eight of the population lives in an area that is both rural and sparse, two in eight in less-sparse rural areas, and five in every eight in urban areas. A population pyramid showing the age structure for the population of Wales is presented in Figure 53 on page 64.
Population pyramid for Wales: by area type, mid–2009
Population by area type (England and Wales)
Figure 5 shows the population of England, Wales and each English region for the six narrower area types. There are three regions that have a similar proportion of their population living in rural areas to Wales: the South West (33 per cent), the East of England (31 per cent) and the East Midlands (29 per cent). Data for Figure 5 and subsequent figures area available at: www.statistics.gov.uk/downloads/theme_compendia/RegionalSnapshot/rt43-rural-urban-areas.xls
Population proportions: by area type, region and country, 2009
The Rural/Urban Local Authority Classification (England)
Map 6 shows which rural/urban area type each local authority in England falls into. Note that this is based on pre-April 2009 boundaries, which gives a higher level of geographical detail for some areas than using current boundaries Footnote 5 . However, the methodology for the classification based on the new boundaries has been updated, with a small number of changes, mostly resulting in local authorities moving between the Significant Rural and Other Urban area types. Where new boundaries have been used in this article, this is indicated. See Appendix A for more details.
Rural local authorities exist in all regions except London. Most regions have local authorities in all six narrower area types. Note that in some cases local authority types are defined by their population (for example, large urban local authorities have populations of 250,000 to 750,000 people); but the proportion of people in rural areas is used for other types (so Rural-80 local authorities have 80 per cent of their population living in rural areas). Table 7 details key population information for each area type.
Nearly two-thirds of England’s population live in urban local authorities, covering around 15 per cent of the total land area. The classification splits the population into area types of roughly equal numbers of people (with the exception of the much larger Major Urban area type) and similar levels of population growth.
The local authority classification for Wales
Map 8 shows the local authority rural/urban classification for Wales, used for example, in ‘A Statistical Focus on Rural Wales'. For more information, see Appendix A.
The map shows a continuous block of Rural local authority areas through the west, centre and north of the country. The Urban and Other area types are split across two different geographical blocks, in the north east and south of Wales. The Valleys local authorities are a group of ex-mining and industrial areas. The local authorities in this group contain the Heads of the Valleys Action Area which is the focus of a programme that takes action on deprivation.
All local authorities in Wales are a mix of urban and rural areas to some degree. There are urban areas within rural local authorities and the reverse.
Two-thirds of Wales’ population of about three million people live in urban local authorities. Such areas cover only a sixth of the total land area of Wales, as set out in Table 9 . These urban local authorities are split into three narrower area types of broadly equal population size. It is interesting to note that since mid-2001, populations in the Urban narrower area type have expanded the most, while Valleys local authorities have shown the smallest population growth of any area type. Population densities vary from nine people to every hectare in Urban local authority areas, to just one person to every two hectares in Rural ones.
The Scottish Government Urban Rural Classification
Map 10 shows the distribution of area types for Data zones in Scotland, using the classification with the largest number of area types of any of the classifications used in this article. Large Urban Areas (with populations greater than 125,000) cover Edinburgh, Glasgow, Dundee and Aberdeen. Very Remote Small Towns (which have populations between 3,000 and 10,000 people, and are more than 60 minutes by road and ferry to a settlement of more than 10,000 people) appear in all corners of the country, including the Western Isles and Shetland Isles. The sophisticated measure of remoteness, based on driving time rather than distance, makes a distinction between more accessible rural areas south of Edinburgh and Glasgow, and the more remote areas that start just a short distance north and west of Glasgow.
Scottish Government Urban Rural Classification for Data zones
The proportion of the population living in urban areas according to the Scottish Rural/Urban Classification (shown in Table 11 ) is more than 81 per cent, covering nearly 6 per cent of Scotland’s land area. This classification could therefore be said to give a ‘tighter’ urban group than the ‘Randall’ definition of local authorities (see below), picking up more people but covering a smaller area. Population growth rates differ too: post-2001 growth is similar in areas defined by local authorities, but far higher in rural areas when defined using Data zones. By contrast Very Remote Rural Areas contain 3 per cent of the population, but cover almost half of the land area.
Populations in all three narrower types of rural areas have shown at least moderate growth since 2001, and average 9 per cent for rural areas as a whole, which is far greater than for urban areas (1.2 per cent). The population within the Remote Small Towns and Very Remote Small Towns area types have actually declined over this period. The classification allows areas to be split by settlement type and remoteness as well. The remote group covers some 305,000 people; the very remote group is even smaller, at 225,000 people, although this is more than the current population of Aberdeen. A population pyramid for the Scottish population is presented in Figure 54 on page 65.
Population pyramid for Scotland: by area type, mid-2009
The 'Randall' definition of Scottish local authorities
Map 12 shows a much simpler geography than that of the small area classification in Map 10 . It gives a continuous stretch of Urban local authority areas, sandwiched between Rural local authority areas, running from Dundee in the east to the Isle of Arran, which is part of North Ayrshire local authority, in the west. Aberdeen, which lies in its own local authority area, is classified as Urban; however Inverness, which lies in the Highland Council area and has a low overall population density, is not. These examples show why the more refined small area classification is to be preferred, if data can be produced at the appropriate geographic level.
Some 70 per cent of Scotland’s population live in the 10 per cent of the land area covered by local authorities classified as Urban, according to the ‘Randall’ definition shown in Table 13 . Population densities are extremely low in Rural local authorities, with an average of one person to every five hectares of land.
The Northern Ireland Urban-Rural Classification of settlements
The Northern Ireland Urban-Rural Classification of settlements The Northern Ireland settlement classification in Map 14 does not give continuous spans of particular area types; rather it highlights and classifies particular settlements against a background of small villages, hamlets and open countryside. Less populous urban and more populous rural areas are clustered around Lough Neagh and Belfast, and lie roughly between the middle of the country and the east coast. There is a smaller cluster around Derry in the north west, but some of the larger settlements in the western part of the country are very isolated. Omagh in particular has few urban neighbours.
The Northern Ireland Urban-Rural Classification of settlements for output areas
Of Northern Ireland’s 1.8 million inhabitants, some 36 per cent, or around two-thirds of a million, live in rural areas ( Table 15 ). This is a slightly smaller proportion than in the local government district classification, yet it covers a much greater proportion of the land area – in other words the small area definition is much more precise. This is true of different levels of small area data too. The 2001 Census Output Area geography is used here, because data based on this geography are compatible with a number of other datasets. However, it gives a very slightly lower proportion of the population living in rural areas than data based on precise settlement boundaries.
Table 15 shows band A (Belfast) is the largest settlement area type by population size, with nearly a third of the population of Northern Ireland; bands B to G are much smaller, each covering 4 to 14 per cent of the population and up to 2 per cent of the land area. More than a quarter of the population, just less than half a million people, live in the most rural areas (band H), covering 91 per cent of the country. Population growth since 2001 has been highest in this settlement band and above average in other rural areas. A population pyramid for Northern Ireland is presented in Figure 55 on page 66.
Population pyramid for Northern Ireland: by area type, mid-2008
The less accessible/more accessible Northern Ireland local government district classification
This classification, shown in Map 16 , splits the country into two area types. The more accessible group of local authorities, sometimes referred to as ‘urban’, or simply ‘eastern’, is centred in and around Belfast. The less accessible group of local authorities or ‘western’ group can be used to define areas as rural, although this group includes Northern Ireland’s second most populous city, Derry.
Less accessible/more accessible Northern Ireland local government district classification
Table 17 shows that the Northern Ireland local government district classification defines a larger proportion of the total population as rural than the other classifications set out in this section, at 39 per cent of the population. However, this population lives in over two-thirds of the area of the country, suggesting the classification is picking out a distinct area type. Population growth in the less accessible, western group of local authorities has been almost twice that of the more accessible group since 2001.
Job locations
In 2008 the UK had an estimated 32 million jobs and 40 million people aged 16 to 64, which includes students, homemakers, those with multiple jobs, and others not actively seeking work. This jobs estimate is based on workplace location, and includes the self-employed, those on government training schemes and HM Forces. A ‘jobs density’ can be calculated by dividing the number of jobs in an area by the number of residents aged 16 to 64, and is one way of measuring disparities between the number of workers and jobs. It can be produced for local authority areas. The UK average is 0.79 jobs per person; national rates range from 0.71 in Wales to 0.80 in Scotland. This section aims to answer the question, are rural areas generally ‘dormitories’, with more workers than actual jobs? Figures 18 to 21 examine the patterns country by country.
In England two of the urban area types have the highest jobs densities, at 0.83 jobs per person for Other Urban Footnote 6 and 0.82 for Major Urban, the group of local authorities covering the cities with the biggest populations. There is no clear pattern among the other area types, and differences are small overall. Of the eight rural local authorities with jobs densities above one, six are in the Rural-80 group (the most rural areas). Some are self-contained by virtue of their geography – the Isles of Scilly, for example; others have historic importance – such as Stratford-on-Avon.
Of all urban local authorities, the City of London has an exceptionally high density of 37 jobs per resident aged 16 to 64; Westminster is next highest at 3.3. A number of London boroughs appear at the top and bottom of the urban rankings, with Lewisham showing the lowest jobs density in England at 0.41.
In Wales, the Valleys area type shows the lowest jobs density of any area type at 0.57 jobs per person, while local authorities in the Urban area type Footnote 7 have the highest jobs density at 0.87. The Rural area type jobs density is only a little lower than that of Wales as a whole. The highest jobs density is for an Urban local authority (Newport, 0.92), the lowest in a Valleys area (Blaenau Gwent, 0.49).
Jobs densities in Wales: by area type, 2008
Jobs densities in Scotland: by area type, 2008
Jobs densities in Northern Ireland: by area type, 2008
There are only small differences in jobs density between Urban and Rural areas in Scotland, with Urban areas showing a jobs density of 0.81 jobs per person, compared with Rural areas at 0.77. Some of the most isolated Rural local authorities have the highest jobs densities – Highland, Shetland Islands and Orkney Islands all have densities above 0.90. However, the highest jobs density, at 1.27, is in an Urban local authority – Aberdeen City – which may relate to jobs offshore in the oil and gas industries. This is three times as high as the lowest jobs density – 0.39 in East Renfrewshire (an Urban area).
The less accessible area type covering local authorities in the western part of Northern Ireland shows a lower than average jobs density, at 0.66 jobs per person. The highest value for this area type is 0.79 for Coleraine – so while this group has fewer jobs than might be expected, there are no highly isolated areas that have high jobs densities because commuting out of these areas is hard. Local authority areas in the more accessible area type vary substantially, from 0.38 in Carrickfergus to 1.33 in Belfast.
There is no evidence that rural areas are simply ‘dormitories’ in any country of the UK. If anything, urban areas could be said to contain a higher proportion of more ‘dormitory’ local authorities, with the highest and lowest jobs densities tending to appear in urban areas.
Working patterns
ONS’s Annual Population Survey (APS) is an on-going social survey based on the Labour Force Survey, which asks a large sample of people a variety of questions about working life. The records include the Rural/Urban (MSOA) Definition area type; Figure 22 examines the urban/rural and less sparse/sparse dimensions. It is worth noting that some aspects of working life not shown here, such as patterns of part-time working, display only very small differences across area types.
Working patterns in England: by area group, 2009/10
Self-employment and working from home (or being based at home) are both more common in rural areas of England than in urban areas. They are more common still in sparse areas, where people are twice as likely to be home-based or self-employed, as those in less sparse areas (one in four in sparse areas compared with roughly one in eight in less sparse areas). While Figure 18 shows that there are fewer jobs per worker than average in rural areas, Figure 22 shows that people access work in different ways in both rural and sparse areas compared with urban and less sparse areas.
Jobs densities in England: by area type, 2008
Rural areas have slightly higher proportions of people in higher managerial and professional occupations (12 per cent of people aged 16 to 64 compared with less than 10 per cent in urban areas), and lower proportions of people who have never worked (which include students) than urban areas. Interestingly, sparse areas show the reverse pattern, with about half the proportion of people in the higher managerial and professional occupation (some 6 per cent) compared with rural areas.
The APS asks a number of questions to estimate how many people want or need to work more than the standard hours for their job. There is no clear pattern in the results – respondents in urban or less sparse areas are somewhat more likely to have worked overtime recently, and to want to work more hours at their current rate of pay (classified as ‘underemployed’). Likewise, respondents in sparse areas are more likely than those in less sparse areas to have a second job (7 per cent of workers compared with 4 per cent in less sparse areas). Figure 23 shows the same data for Wales.
Working patterns in Wales: by area group, 2009/10
Working patterns in Wales show very similar rural/urban differences to those in England. Working based from home or being self employed are far more common in both rural and sparse areas than in urban and less sparse areas. Workers in higher managerial or professional occupations are slightly more common in rural areas and less common in sparse ones. There are only small differences in the proportions of people with second jobs; however, working overtime and wanting to work more hours at the same rate of pay (underemployment) are more common in urban and in less sparse areas.
The ONS Inter-Departmental Business Register (IDBR), from which the following data are taken, covers the vast majority of UK economic activity, using administrative records and survey estimates. The 2010 IDBR details nearly 2.2 million ‘local units’ in England, and around a further 113,000 in Wales. A local unit is defined as an individual business site, such as a branch of a national retail chain, located in a geographically identifiable place, as opposed to the parent ‘enterprise’ such as a head office. Local units are sometimes referred to as ‘businesses’, however, it is important to remember that they include public sector employers as well as those in the private sector. Figure 24 shows which of the 17 industries Footnote 8 showed the biggest differences in prevalence between rural and urban areas, using the small area (MSOA) Rural/Urban Definition. Is the rural economy dominated by farming?
Local business units in England for selected industries: by area type, 2010
There were nearly 560,000 rural local units in England in 2010, representing a quarter of all businesses (or some 23 per cent when agriculture, forestry and fishing units are excluded). Given that 19 per cent of all people live in rural areas, the prevalence of local units in rural areas might be greater than that expected, even when agriculture, forestry and fishing is excluded.
Figure 24 shows some of the largest percentage point differences in the prevalence of businesses in urban and rural areas by broad industry group. Just under 15 per cent of all rural local units were in the agriculture, forestry and fishing category, while retail represents a notably higher proportion of local units in urban areas. Construction has a higher proportion of the industry mix in rural areas than in urban areas, with one in eight Rural area units being in that industry. None of the 17 broad industry groups are absent from rural areas, with finance and insurance having the smallest proportion of total units by broad industry group in rural areas. Public administration and defence units, not shown, are also noticeably more prevalent in urban than rural areas, with just 18 per cent of these located in rural areas (compared with 26 per cent of all units).
Nearly half of Wales’ 110,000 local units were located in rural areas. When agriculture, forestry and fishing local units are excluded, this falls to 42 per cent of all local units. When compared with the population living in rural areas (34 per cent of the total population) this is higher than might be expected. Just under a quarter of all rural businesses were in the agriculture, forestry and fishing sector.
Figure 25 shows that several industries, and especially the retail category, have a higher share of the industry mix in urban areas than in rural areas. As is the case in England, there is no industry that shows a very strong urban or rural predominance, beyond agriculture, forestry and fishing. Public administration and defence local units (not shown) are less likely to be located in a rural area than local units are in general, with 37 per cent of such units present here. Two industries, health and finance and insurance (not shown), had fewer than a third of their units in rural areas (at 32 per cent in both cases).
Local business units in Wales for selected industries: by area type, 2010
In relation to their resident population, rural areas are home to a relatively high proportion of local units and they are more likely to be small employers. Some 75 per cent of rural units in both England and Wales have fewer than five employees; this compares with 66 per cent of urban local units in England and just under 60 per cent in Wales.
Unemployment and inactivity
The APS is the main source for official unemployment estimates at sub-regional level. Bespoke data were obtained from the survey using the more geographically detailed 2001 Census Output Area level definition, which separates ‘Villages’ from ‘Hamlets and Isolated Dwellings’. A disadvantage of looking at data this way is that sample sizes for the smallest area types, such as Very Remote Rural areas in Scotland, for example, will give less reliable results than for more populous area types. Figure 26 shows three key measures of economic activity for England for the financial year 2009/10 using the Output Area level definition. Figures 26 to 28 reflect an aggregation of narrower area types.
Labour market activity in England: by area type, 2009/10
Some 7.9 per cent of the economically active population of England was estimated to be unemployed in 2009/10, and 23 per cent of the population aged 16 to 64 was economically inactive. The rural/urban unemployment rates show clear differences, ranging from an estimated 8.6 per cent in urban areas (1.8 million people), to 5.2 per cent in rural areas (260,000 people).
The employment rate is higher and inactivity rate lower than the national average in rural areas. In the most rural settlement types unemployment was estimated at just 4 per cent, just over half the national average. Sparse areas differ in their labour market characteristics from rural areas Footnote 9 . On average, sparse areas have a relatively low unemployment rate close to that of the whole rural group, but a rate of economic inactivity that is only slightly below average.
Inactivity covers a broad range of circumstances. In rural areas generally, and in all three rural area types, below national average proportions of the population (aged 16 to 64) are economically inactive students, home-makers, or sick/disabled. However, there are above national average proportions of early retired people. Figure 27 shows the equivalent data for Wales.
Labour market activity in Wales: by area type, 2009/10
The rural/urban differences in Wales are generally smaller than in England. Unemployment is estimated at 6.2 per cent in rural areas, and is roughly half as high again in urban areas, at 9.6 per cent. Interestingly, all three labour market rates are close to average in Town and Fringe areas; the rural pattern is only seen in the Village, and Hamlet and Isolated Dwellings settlement types, where unemployment is less than two-thirds of the national average.
Figure 28 shows the equivalent data for Scotland. Some 7.3 per cent of the economically active population was estimated to be unemployed in 2009/10, and 23 per cent of the population aged 16 to 64 was economically inactive. There is a very strong rural/urban difference in Scottish working life. While in Urban Areas the unemployment rate was estimated to be 8.0 per cent, and 24 per cent of people aged 16 to 64 were economically inactive, Rural Areas had corresponding rates of 4.5 per cent and 20 per cent.
Labour market activity in Scotland: by area type, 2009/10
Compared with Scotland as a whole, economically inactive students or sick/disabled people represent lower proportions of the rural population aged 16 to 64; similar proportions are looking after homes or families, and a higher proportion of people are early-retired. Small Towns have employment and unemployment rates lying between those for Urban and Rural Areas; however, economic inactivity rates, and specific types of inactivity, are closer to those for rural areas generally.
Very Remote areas Footnote 10 had the highest employment rates at an estimated 80 per cent of the population aged 16 to 64 and Accessible areas the lowest at 71 per cent. The unemployment rate in very remote areas, at 3.3 per cent, was less than half that for Scotland as a whole. Unemployment rates for Remote areas show rates in between those of Very Remote and Accessible areas.
Income and earnings
Average incomes.
Differences in income, as distinct from earnings or overall wealth (which is difficult to measure at small area level), are a useful indicator of economic wellbeing. Modelled data for MSOAs show that in 2007/08 the average weekly gross income per household in England was £670, and £540 in Wales. When taking account of household composition (a process known as ‘equivalisation’), deductions such as tax, and housing costs, incomes fell to £420 and £380 respectively. Figure 29 shows how incomes in England vary by area type, using the small area (MSOA) definition. Are incomes higher in one type of area?
Average weekly household income: by area type, 2007/08
Considering areas by their rurality and sparsity, however income is measured; the most rural and the least sparse areas perform better. Total weekly income was as high as £751 per week in Village, Hamlet and Isolated Dwellings – Less Sparse (VHID – Less Sparse) households (equivalent to about £39,000 a year), and as low as £533 in Urban – Sparse households Footnote 11 (or about £28,000 a year). Urban – Sparse areas had lower incomes than average, ranging from 79 per cent of the national average when using total income, to 83 per cent when taking household structures into account (either before or after household costs). Among less sparse areas there is greater variation in incomes. The highest earning 10 per cent of Urban – Less Sparse MSOAs had almost twice the total income of the bottom 10 per cent of MSOAs. Wales, not shown in Figure 29 , shows similar patterns of differences between area types; however, the variations in income between area types tend to be smaller in value.
Poverty is conventionally measured by the proportion of all households that fall below the recognised poverty threshold, which is set at 60 per cent of the England and Wales mean weekly equivalised income (after housing costs). In 2007/08 for England and Wales this was estimated at £199 per week (or £862 per month). Figure 30 shows how poverty rates in Wales varied by small area (MSOA) type.
Percentage of households below poverty threshold: by area type, 2007/08
Both sparsity and rurality appear to affect poverty levels. VHID – Less Sparse Footnote 12 areas have the lowest estimated poverty rate at one household in five. Sparse areas that fall into the town and fringe or urban settlement types have the highest proportions of households below the poverty threshold; however, results may be less reliable for these areas because they each contain very small proportions of the total population and are more difficult to estimate. No area type is poverty free – there is often more variation within area types than there is between them.
England shows similar differences by area type; however, the two Town and Fringe area types have lower relative poverty. Both types of less-sparse rural area (Town and Fringe and VHID) show well below average poverty levels for England.
Across England and Wales there were 75 MSOAs where more than 50 per cent of households were in poverty, all in urban areas. Of these MSOAs only one was in Wales (in Cardiff) and 21 were in Birmingham. The highest percentage of households in poverty was in a Leicester MSOA at 68 per cent; the lowest level, at less than 5 per cent of households, was an MSOA in Wokingham, Berkshire. Both these MSOAs are classed as Urban – Less Sparse.
Earnings flow
The rural/urban differences in income suggest investigating the flow of earnings for people who earn in one area type and live in another area type. Are rural/urban areas self-sufficient, or dependent on well-paid jobs elsewhere? The ONS Annual Survey of Hours and Earnings (ASHE) estimates workers’ earnings based on both where people live and where they work, at local authority level Footnote 13 . The data in Figures 31 to 32 reflect a snapshot of weekly average earnings as at 1 April 2010. Areas types with a ‘positive’ flow are those where workers living in the area, regardless of where they work, earn more on average than those whose jobs are located in the area, regardless of where they live.
In England all three rural local authority area types have a positive earnings balance for each identified employee type ( Figure 31 ). Differences in the levels of these positive balances are similar for all three rural area types, suggesting that this situation doesn’t just cover people in rural areas adjacent to urban ones, commuting out to take high paid jobs. Conversely earnings are ‘flowing out’ of Major Urban areas at a higher level than in any other area type (that is, employees living in these areas earn less than those working there). The rural/urban earnings flow is much more pronounced for male and full-time workers, although it is important to recognise that more men than women work full-time.
Flow of earnings in England: by area and earner type, 2010
In Wales, for all types of employees, there is a net flow of earnings into Rural local authority areas from non-rural areas; and overall earnings are also flowing into Urban area type local authorities ( Figure 32 ). For the Other Footnote 14 area type, there is a net earnings outflow for males employees but a larger net earnings inflow for female employees. For both Other and Valleys local authority areas there is a net earnings outflow for all employees, though a net earnings inflow for part-time employees in Valleys areas. These findings suggest that there are important gender differences in earning flows, with women bringing net earnings into Rural and Other areas, and out of Valleys and Urban areas.
Flow of earnings in Wales: by area and earner type, 2010
Within Scotland there is a net earnings flow from Urban local authorities into Rural ones. This effect is more pronounced for full-time and male workers.
Services and life chances
Access to services.
Life in any type of area can be much harder if it takes disproportionately longer to travel to basic services, such as shops or GPs. Differences in travel times vary according to transport mode.
Scottish data, presented for Data zones, allow both area types and transport modes to be compared Footnote 15 . Figure 33 shows modelled driving times, which were developed for the Scottish Indices of Multiple Deprivation, for five services.
Average drive time to service: by area type, 2009
Driving times to most services for both urban and rural areas could be described as brief, at less than 10 minutes from all but the most remote rural areas. Shopping centres and GPs are typical of services that take longer to reach from both more rural and more remote areas. Driving times to libraries, not shown here, display a similar pattern.
Journey times to petrol stations and primary schools seem to be determined by ‘rurality’ alone, with all three types of rural area showing times that are high in relative terms, but still less than 10 minutes. Driving times to many services – police stations, banks, general stores, and nurseries – are also relatively higher in rural areas only, although the average driving times vary.
Small towns provide similar access to services compared with other urban areas, as do the less remote rural areas; only services such as higher education and citizens’ advice centres (not shown) are relatively quicker to access in the most urban areas (areas such as Aberdeen, Dundee, Edinburgh and Glasgow). Being remote therefore may only mean being remote from ‘specialist’ services, rather than everyday ones.
Public transport travel times shown in Figure 34 are relatively similar in urban areas and small towns areas, at typically 10 minutes for post offices, banks and general stores. Times for rural areas are much higher, rising to over an hour for access to chemists in the most remote rural areas (most of which are in the Shetland Islands). For people without access to a car, therefore, access to even the most everyday services may be a barrier to living in a rural area. Furthermore, the extent to which services can be accessed in different ways (for example by offering home delivery) may vary between area types.
Modelled travel time estimates for Lower Layer Super Output Areas (LSOAs) are published as part of the Department for Transport’s (DfT) 2009 Core Accessibility Indicators Footnote 16 . This shows that in 2009 on average eight key services (employment; primary schools; secondary schools; further education; GP; hospital; food store; and town centre) could be accessed within a reasonable time by 60 per cent of users in urban areas compared with 48 per cent in rural areas. Differences were highest for hospitals and town centres, but lowest for primary schools.
Analysis of the ‘employment centre’ estimates from this data source shows that similar proportions of people have (by walking or public transport) access to work in different kinds of areas. Bigger differences occur when looking at the availability of public transport required for these journeys. In less sparse urban areas the availability indicator is close to the maximum. It is far lower for sparser and more rural areas, and falls to just 40 per cent in Village, Hamlet and Isolated Dwellings (VHID) – Sparse areas Footnote 17 .
Data for Wales show estimated travel times for LSOAs for nine different services by public transport or walking. These data are the geographical access to services indicators for the Welsh Index of Multiple Deprivation 2008, produced by WG. Travel times are similar for urban areas and town and fringe areas, so most people can be said to have ‘reasonable’ levels of access. VHID – Less Sparse areas showed substantially higher travel times, while the equivalent sparse areas have travel times 40 per cent to 70 per cent higher again.
Internet access and use
There are multiple ways of measuring access to the internet: broadband coverage; actual take-up; speed of access; and how often people use it. Figures produced by Ofcom, the internet regulator, show survey results on internet access for urban and rural areas based on the ‘Locale classification’ which covers the whole of the UK Footnote 18 . In each UK country the proportion of people with access to the internet was somewhat higher in rural areas than urban ones. In Scotland, however, the difference was very small; although a slightly higher proportion of the rural population reported an intention to acquire internet access in the following year.
Is access to the internet a status symbol in rural areas, or a functional tool? Figure 35 shows the proportions of adults (defined here as aged 15 and over) with internet access reporting specific uses of the internet within each wider area type in England.
Use of different types of internet site: by area type, 2010
Although this is based on a small list of many possible internet uses, the findings do suggest that adults in rural areas with access to the internet are more likely to use each kind of site. The biggest difference occurs in the use of banking sites in rural areas, with a majority of adults in rural areas (51 per cent) reporting this use, compared with 44 per cent of urban area internet users. The internet seems to compensate for poorer access to physical services Footnote 19 .
Expenditure
The Living Costs and Food Survey uses respondent diaries to capture the expenditure of around 16,000 households across Great Britain. In the period 2007 to 2009 rural households on average spent an estimated £500 per week, 11 per cent more than the £450 spent on average by urban households. Note this definition combines the Defra Rural/Urban definition for England and Wales and the Scottish Government Urban Rural Classification. Figure 36 shows this spending broken down into categories, sorted in order of the absolute rural/urban difference in expenditure.
Average household weekly expenditure: by category and area type 2007 to 2009
There are two material aspects of rural life that may appear to make rural areas worse places to live: older, harder-to-heat housing stock, and poorer transport connections Footnote 20 . However, rural households are estimated to be spending less on total housing costs than urban ones (excluding mortgage interest payments and council tax), but substantially more on transport. The difference in transport spending is estimated to be just below £20 per week, or 43 per cent of the overall difference in expenditure between urban and rural households. Rural households also spend more on a range of goods and services, including food, restaurants and hotels and household goods and services. These figures could be interpreted to indicate that life in the countryside is more expensive; but equally it could be argued that people in the countryside are enjoying the benefits of higher disposable incomes.
Average travel time, by public transport: by area type, 2009
Early years
The Department for Education in England publishes rural/urban area figures comparing how teachers assess their pre-school pupils, entitled ‘Achievement in Early Years Foundation Stage Profile’. In 2010 some 76 per cent of all pre-school pupils living in urban areas achieved ‘78 points across all scales’ which is a recognised development standard, while 55 per cent were thought to show ‘a good level of development’. These figures are 7 and 6 percentage points lower than in rural areas, respectively. Is pre-school education better in rural areas? This is not necessarily the case when deprivation is considered, as Figure 37 shows.
Assessments of early years pupils: by deprivation decile and area type 2010
Comparing rural and urban areas within each 10 percentage point group of the Income Deprivation Affecting Children Index Footnote 21 (IDACI) shows only small differences in performance levels on the ‘78 or more points across all scales’ measure. There was little difference between rural and urban areas within the least deprived group. In the most deprived group, however, for the pre-school pupils living in approximately 81,000 urban areas, they outperformed those living in approximately 550 rural areas. For the ‘good level of development measure’ urban areas outperformed their equally-deprived rural counterparts in all but two deprivation groups, albeit by only a small margin. Overall then, it seems that low deprivation is important to a good start in the education system; area type only appears to have an influence through the fact that rural areas are less likely to be deprived.
GCSE and equivalent results
GCSE and equivalent qualification results are a very useful benchmark of education levels, providing a record (as opposed to survey-based estimates) of performance in the final year of compulsory education in England. In 2008/09, 51 per cent of eligible pupils achieved five or more A*–C grades at GCSE or equivalent including English and Maths. Some 54 per cent gained two or more A*–C GCSE grades or equivalent in science subjects. Figure 38 shows these by area type at the MSOA level.
Proportion of pupils achieving GCSE and equivalent targets: by area type, 2008/09
The proportion of pupils achieving the English and Maths target varied considerably, from 44 per cent for those living in Urban – Sparse Footnote 22 areas, to 61 per cent for those living in VHID – Less
Sparse areas. The difference between these two area types is even more extreme when looking at the target for science subjects. There is a broad pattern: the more rural an area is, the better its pupils’ results; the more sparse it is, the worse. However, as shown in Figure 37 , rural and urban levels of deprivation are very different and comparing similarly deprived areas may show a different story.
Qualifications
Another way of looking at education is to examine patterns in the qualifications of the adult population. Figure 39 shows data on the highest level of qualification obtained by the employed people in each area type, derived from the APS for 2009. Using the National Qualifications Framework (NQF) qualifications can be grouped, with Level 2 being equivalent to GCSEs graded A* to C, and Level 4 covering higher education qualifications (certificates, diplomas, degrees) and equivalents. Footnote 23 Results are presented twice – once splitting out the urban and rural areas, and again comparing sparse areas with those that are less sparse, based on the Output Area each respondent lives in.
Adult highest qualification levels in England: by area group, 2009
Rural areas have somewhat higher proportions of employed adults with qualifications from Level 2 (GCSEs grade A*–C or equivalent) to Level 4 (a degree or equivalent), and with trade apprenticeships (not shown). Urban areas have higher proportions of employed adults with below Level 2 qualifications (not shown), no qualifications, and the ‘other’ qualifications group.
Sparsity shows a different pattern. Sparse areas, which contain only 2 per cent of the eligible adults covered by the survey, have below average levels of employed adults with no qualifications or ‘other’ qualifications, like rural areas. Unlike rural areas, however, sparse areas have below average levels of the highest levels of qualifications. This highest level varies by area type from 36 per cent of employed adults in Hamlet and Isolated Dwellings – Less Sparse areas, to half that rate (18 per cent) in Urban – Sparse areas.
The reason for these differences is not clear. Differences might reflect employers requiring different levels of qualifications, differences in access to education, or commuters with high qualifications moving to particular areas (earnings flow analysis in Figures 31 and 32 suggest high earners are commuting between area types). Figure 40 shows the same data for Wales.
Adult highest qualification levels in Wales: by area group, 2009
The qualifications of employed adults in Wales show little rural/urban variation although, those in rural areas are more likely than average to be qualified to degree level or equivalent (Level 4) and are less likely than average to have no qualifications. Differences between sparse and less sparse areas are very small, however, with no difference between the two groups in the rates of employed adults with the highest level of qualifications.
One key indicator of health in an area is life expectancy, which is an estimate of the number of years that a person can expect to live, on average, in a given population. An ONS study (Kyte and Wells, 2010) explored variations in life expectancy at birth between rural and urban areas of England during the period 2001 to 2007. The Rural/Urban Definition and the Index of Multiple Deprivation (IMD) 2007 were used to explore differences between area types, taking levels of deprivation into account.
They found that:
people in rural areas lived longer than those in urban areas - an additional 2.1 years for males and 1.4 years for females
there was a difference of 7.8 years for males and 5.4 years for females between the most deprived and least deprived fifth of areas, suggesting that pockets of poor health exist across England
in the least deprived fifth of areas, urban life expectancies were slightly higher than rural life expectancies for both men and women. However, in the other fifths, life expectancy was lower in urban areas than in rural areas
in terms of sparsity, there was little difference in life expectancy between sparse and less sparse areas within the rural and urban area types. However, variations were observed when deprivation was taken into account and greater differences were evident in less sparse areas than in sparse areas
figures for local authorities in England show that life expectancy improved in all areas over the 1991-93 to 2006-08 period, by 4.2 years on average for males and 2.9 years for females. However, although variations in life expectancies between regions in England have reduced, differences between the local authorities with the highest and lowest figures widened over this period
Physical environment
Carbon emissions.
Carbon dioxide emissions (referred to here simply as ‘carbon emissions’) result predominantly from the combustion of fossil fuels. They can result, for example, from transport, use of buildings, production of food or the manufacturing of goods. In 2008 domestic sources accounted for 30 per cent, and transport for just over 25 per cent of all carbon emissions in the UK. The Land Use, Land Use Change, and Forestry (LULUCF) sector shows positive carbon emissions in some areas; in others the sector acts as a ‘sink’ absorbing carbon dioxide and so emissions are counted as being negative. The final group of sources, Industry and Commercial, accounted for more than 40 per cent of the half a billion tonnes of carbon dioxide emitted in the UK. Figures 41 to 44 show carbon emissions for local authority area types for each UK country, using the locations of end users (so homes using electricity rather than power stations generating it). Are carbon emissions higher per person in urban areas?
Carbon emissions per person in England: by area type, 2008
Carbon emissions per person in Wales: by area type, 2008
Carbon emissions per person in Scotland: by area type, 2008
Carbon emissions per person in Northern Ireland: by area type, 2008
Carbon emissions in England ranged from 6.5 tonnes per person in 2008 in Major Urban local authority areas to 11.6 tonnes per person, per year in Rural-50 areas, compared with an England average of 8.0 tonnes. The four local authorities with very high emissions per person include two Rural-50 local authorities, North Lincolnshire and Wansbeck (north of Tyneside), plus City of London (a Major Urban local authority with far more workers than residents) and Redcar and Cleveland (Large Urban).
Carbon emissions per head from domestic fuel were around 5 per cent below the England average in each type of urban area, but higher in each rural type, especially in Rural-80 Footnote 24 where carbon emissions 12 per cent above average might result from older, larger housing stock in poorer condition, or from differences in heating systems. However, Road Transport represents the key rural/urban difference, with carbon emissions ranging from 35 to 47 per cent above the England average in rural areas.
Carbon emissions in Wales averaged 10.8 tonnes per head in 2008, 2 tonnes more than the next highest UK country, Northern Ireland. Industry and Commercial carbon emissions account for the greatest difference between area types in Wales which were as high as 52 tonnes per head in Neath Port Talbot. This resulted in higher total carbon emissions per head in the Other area type Footnote 25 , despite them having average Domestic and Road Transport emissions.
In rural local authority areas Road Transport and Domestic carbon emissions per head were 13 to 14 per cent above average. In Wales, rural domestic fuel consumers do appear to be responsible for somewhat higher carbon emissions than urban ones, a difference which might result from differences in heating systems and the housing stock in each area type.
Carbon emissions in Scotland averaged 7.9 tonnes per person in 2008. In Rural areas carbon emissions for the Domestic sector were almost 10 per cent higher than the average, and a third higher for Road Transport. Rural and Urban differences from Industry and Commercial were small, however it is the LULUCF sector where the largest differences are seen – rural Scotland is effectively absorbing 4 million tonnes of carbon each year because of this sector.
Urban local authorities with notably higher carbon emissions in Scotland in 2008 include Clackmannanshire, East Lothian and Falkirk, each producing between 14 and 20 tonnes per person.
As a nation, Northern Ireland emitted just under 8.9 tonnes of carbon dioxide per person in 2008. There was a clear rural/urban difference: carbon emissions from both Industry and Commercial, and from Road Transport were around 30 per cent above the Northern Ireland average in the less accessible (rural) local authorities, and almost 20 per cent below average in more accessible ones. Domestic carbon emissions, however, were lower in rural areas. Two rural local authorities were responsible for carbon emission levels per person around twice the national average – Fermanagh and Cookstown, while there were four local authorities, all more accessible, with carbon emissions below 7 tonnes per person.
Crime may be seen as a feature of everyday life through media coverage; however, crime is experienced on a personal level much more rarely. Does this vary by area type – is crime an urban phenomenon? Differences in income, population density, transport and housing stock could all potentially result in differences in crime levels between area types.
Local authority Footnote 26 level data are published for England showing notifiable offences recorded by the police, as opposed to British Crime Survey estimates of the number of crimes experienced. These show that when rural/urban differences in estimated population sizes are taken into account, there are more than three offences recorded by the police per resident in urban areas for every two in rural areas (in 2009/10). This equates to one recorded crime per resident, every 13 years in urban areas, compared with every 21 years in rural areas.
For England as a whole there were 66 crimes recorded per 1,000 residents. This varied substantially by area type, from 39 in the most rural areas (Rural-80) to 79 in the most urban areas (Major Urban). While recorded crime per resident is therefore substantially higher in urban areas, it is something that happens everywhere, and is not simply an ‘urban phenomenon’. Figure 45 shows a selection of specific offences which give a range of patterns by area type.
Notifiable offences: by area type, 2009/10
Harassment decreases in similar sized steps, halving from the most urban areas (Major Urban) to the most rural (Rural-80). Theft from a motor vehicle shows similar differences within rural areas, but a much higher level in Major Urban areas than in the other urban area types. However, common assault occurs at a lower rate in Major Urban areas than the other two urban area types. Crime is one subject where it is useful to distinguish different types of urban area, rather than treating them as a homogenous group.
Housing affordability – private sector
House prices, and how they change over time, attract much media attention and debate. Comparing local incomes with house prices gives a more balanced picture of whether people can afford to live somewhere. The number of homes being sold and their price (in this case mean average prices from 2009) can be obtained for local authorities Footnote 27 in England and Wales from the Land Registry via Communities and Local Government (CLG) or ONS, and used in conjunction with gross annual earnings of full-time workers taken from the Annual Survey of Hours and Earnings (ASHE). It is worth noting that this method is similar to that used by CLG, but has been calculated from mean prices and earnings, rather than medians or lower quartiles. It has fewer similarities to the methods used by mortgage lenders, which take account of purchaser household incomes and deposits.
For England the mean price of all homes sold in 2009 was £216,000. These Land Registry house prices exclude some transaction types, and are not adjusted for the mix of dwelling types. In all three rural area types, the variation from this average was between £2,000 and £3,000; in Major Urban areas the mean price was roughly £40,000 above the national average; in the other two urban area types it was roughly £40,000 below. When area types are grouped, both urban and rural areas have house prices very close to the average. Figure 46 shows housing affordability calculated using mean house prices and mean earnings.
Mean house price affordability, England: by area type, 2009
For England as a whole this particular way of calculating affordability shows that the average home sold in 2009 cost 7.2 times the average salary of full-time workers. Although this measure is not comparable with mortgage multipliers, it seems that no area type in England is particularly affordable by this measure. For rural local authorities the price to earnings ratio ranged from 4.0 in Copeland, Cumbria (Rural-80), to 15.9 in Chiltern, Buckinghamshire (Significant Rural). For urban local authorities it ranged from 3.6, for Kingston upon Hull (Large Urban) to 28.4 in Kensington and Chelsea (Major Urban).
Of the area types, Large Urban areas Footnote 28 have the lowest housing affordability indicator, at 6.2 times the average full-time earnings of people working in those areas. Rural-80 areas Footnote 29 , have the highest affordability scores, at 9.5; while Major Urban workers have higher average full-time salaries than workers in rural or the other two urban area types, resulting in affordability close to the national average. Combined, the rural area types have roughly average house prices but lower salaries, and therefore worse affordability (at 8.7). Urban areas combined have average house prices, but great variations by area type, and higher salaries that result in more affordable housing (at 6.6).
Figure 47 compares average earnings with average house price data in the same way for Wales. Compared with the national average of £152,000, homes in the Urban and Rural area types are more expensive (by £10,000 and £14,000 respectively). The Valleys areas have prices that are £42,000 below average, and so the average house price across all urban local authority types is £14,000 below the national average. How does the pattern change when earnings are brought in?
Mean house price affordability, Wales: by area type, 2009
There are substantial differences between affordability ratios for different area types in Wales. Rural local authority areas are the least affordable, with a price to earnings ratio of 6.7; Valleys areas are the most affordable by this method, with a price to earnings ratio of 4.4. Interestingly these differences are similar to the differences in house prices – earnings do not vary dramatically by area type, although Rural areas do show the lowest average earnings as well as the highest average house prices.
In the Rural area type, price to earnings ratios varies from 5.4 in Denbighshire to 8.5 in Monmouthshire. In the urban area types price to earning ratios varied from 3.6 in Blaenau Gwent to 7.0 in the Vale of Glamorgan. This illustrates that there is often as much or more variation in housing affordability within urban or rural areas than there is between them – but that important rural/urban differences still exist.
Affordable public sector housing
Social housing, often seen as a basic ‘safety net’ in society, is provided by local authorities and Registered Social Landlords (RSLs), such as housing associations. In 2000/01 just over 1 million households in England were on a social housing waiting list; by 1 April 2009 the level stood at 1.8 million. Just 56,000 additional affordable homes were provided in 2008/09, or one home per 32 households on the waiting list (not accounting for homes sold). It is therefore likely that the rate at which households leave the social housing sector is the key factor in access to an affordable home. While it is not possible to compare turnover of affordable housing by area type, Figure 48 compares the number of households on waiting lists Footnote 30 with the number of existing dwellings in the social rented sector (not including ‘intermediate housing’ schemes such as key worker housing), as at 1 April 2009.
Households on waiting list per 100 existing social rented homes: by area type, 2009
Based on the Rural/Urban local authority classification, for every 100 existing social rented homes in England there are, on average, 43 households on the waiting list. No area type shows a very low ratio – it ranges from 39 in Significant Rural areas Footnote 31 to 54 in Large Urban ones Footnote 32 . In general, waiting lists suggest that barriers to accessing social housing are high everywhere but do not show a strong rural/urban pattern, with Large Urban local authorities the only area type to stand out.
Tourism and leisure
Tourism is a measure of the attractiveness of urban/rural areas as places to visit. The UK Tourism Survey asks tourists and non-business visitors, normally resident in the UK, about specific trips. Data are presented separately for people saying they visited different area types defined by the respondents themselves. These include: seaside, large city/large town, small town or countryside/village areas. Do we all like to be beside the seaside?
Of the 18 million visits (visits to friends and relatives, as opposed to ‘tourism trips’) in England in 2009, nearly half were to ‘large cities/large towns’ ( Figure 49 ), which is where most people live. Of the 45 million short holiday trips (tourism trips lasting fewer than four days) in England in 2009, around 20 per cent were to the seaside, and 40 per cent to large cities/large towns. For the 22 million holidays lasting four days or longer, this pattern was reversed, with more trips to the seaside. The effect is that nearly as many tourism bed nights are spent at the seaside as in large cities/large towns. The share of tourism trips to both small towns and the countryside was consistent for both long and short-duration trips, and they are somewhat less popular than more urban locations in terms of time spent there.
Different aspects of tourism in England: by destination, 2009
All of the measures in Figure 50 show the popularity of the seaside and countryside/villages as tourist destinations in Wales. Of the £1.4 billion spent on visitor and tourist trips in Wales in 2009, more than 40 per cent was spent during trips to the seaside; a similar proportion of the 33 million tourist nights were spent in these areas. The seaside was popular for short trips, at 38 per cent of all short trips, and even more popular for long holidays, with 50 per cent. Overall, the seaside appears to be the key tourist attraction in Wales; although this might involve stays in both rural and urban areas.
Different aspects of tourism in Wales: by destination, 2009
Large towns and cities were still popular destinations, but only when looking at number of visits, or expenditure on those occasions. However, the number of nights spent visiting friends and relatives in the countryside/villages was notably high, perhaps reflecting the large rural population in Wales.
Figure 51 show that, on all measures, visits to large cities and towns were the most popular choice for tourism trips and visits in Scotland in 2009. Small towns and countryside/village areas had similar proportions of visitor or tourist trips, while the seaside received the fewest visitor or tourist trips.
Different aspects of tourism in Scotland: by destination, 2009
For longer holidays, countryside and village locations were the most popular destinations, covering two-fifths of such trips. Long holidays, however, represent less than a third of the total number of trips in Scotland; so overall tourists appear to be more attracted to urban areas than rural ones.
Of the £2.7 billion spent by tourists in Scotland in 2009, 44 per cent was spent in large cities and towns. The total expenditure represents 13 per cent of the total for the whole UK; Scotland has a slightly lower share than this when looking at tourist trips, or tourist nights.
Population and demography
While material on household structures and composition is not readily available for small areas, it is known that some differences exist. The Living Costs and Food Survey estimates that the average urban household in Great Britain had 2.4 people in 2007 to 2009, compared with 2.3 for those in rural areas. This is not a dramatic difference: should populations therefore be expected to be similar as well?
Population structure
Population pyramids demonstrate the age and gender structure of a population. Figure 52 shows the populations of urban small areas (MSOAs) in England as bars, compared with rural ones, shown as lines.
The English population pyramid for rural areas has a corseted appearance. There are relatively low proportions of people aged 20 to 39 in rural areas, a roughly average proportion aged 40 to 44, and particularly high proportions thereafter, peaking at age 60 to 64.
The higher proportion of people in their late 40s and above-average proportion of children aged 10 to 14 in rural areas may indicate migration to the countryside by parents with school-age children, from either urban areas or abroad. Alternatively, fertility rates may have differed in the past between urban and rural areas and then converged; however migration seems a more plausible driver of this pattern.
In rural areas there are 6 men aged 20 to 24 for every 5 women in that age group. The pattern reverses as age increases so that for 35 to 39-year-olds there are 9 men for every 10 women, but at age 45 to 49 there are approximately equal proportions of men and women in rural areas.
Figure 53 shows the populations of urban small areas in Wales as bars, compared with rural ones, shown as lines.
The Welsh population pyramid for rural areas, like that for England, has a corseted appearance. The rural population is half the size of the urban one but this varies from as little as a third for 20 to 24-year-olds,to two-thirds for 65 to 69-year-olds. Overall, England and Wales show similar patterns with certain age groups being more likely than average to live in rural areas in respect to their population size – 10 to 14-year-olds, and the over-40s, but especially those aged 50 to 74. However, the ‘gender imbalances’ seen in England are not seen in Wales.
Single-year-of-age data allow the median age for different area types to be estimated, as an overall indicator of differences in population structures. In Scotland urban males are the youngest, with a median age of 37.4; urban females are older, at 40.5. Rural males and females are both somewhat older, and there is less of a gender difference, with median ages of 42.7 for males and 43.9 for females. Figure 54 examines population differences in more detail.
As in England and Wales, rural areas have relatively low proportions in the 20 to 34 age bands. Rural areas have a distinctive ‘middle-aged’ population, with the proportion of the population by age group almost doubling when comparing the 30 to 34 and the 40 to 44 age groups.
There are roughly equal proportions of men and women in rural areas. There are exceptions, however, by age band: for 20 to 24-year-olds there are 6 men for every 5 women, but for the 35 to 39 age group there are 9 men for every 10 women. If migration is causing this, women move earlier than men.
Northern Ireland
Figure 55 shows that there are few noticeable differences in the age structure for both males and females between rural and urban areas in Northern Ireland, as defined in the classification of settlements for Output Areas. Both rural and urban areas have young age profiles, with high proportions of residents aged less than 30.
There are some differences. Rural areas have higher proportions of children aged 0 to 14 than urban areas, but lower proportions of adults in their 20s. There are also differences between men and women, with rural areas showing lower proportions of people aged over 45 than urban areas, but for women only.
Population change – migration
Together with natural change (births less deaths), migration is a key element of population change, and a topic that receives a large amount of news coverage and interest. There were 5.4 million internal migrants within Great Britain in the year to mid-2009 (in this instance defined as moves between different local authorities Footnote 33 ); an individual moving multiple times over the course of a year would only be counted once to reflect the change in location between the start and end of the period. Some 549,000 international in-migrants came into Great Britain from abroad, and 374,000 international out-migrants left Great Britain. Unfortunately it is not possible to easily link the area type of the start and end point of an internal migration – so figures here show migration to urban local authority areas, for example, but do not show whether those migrants came from other urban or rural local authority areas (subsequently referred to in this section as urban or rural areas).
Figure 56 compares the proportion of internal and international in- and out-migrants for rural and urban local authorities in England. The pattern of people moving into and out of areas results in population turnover or ‘churn’; although overall population numbers may remain relatively stable, the age structure may change as a result of population turnover.
Migration: by type and area type, mid-2008 to mid-2009
At local authority level, internal migration is generally a larger driver of population change than international migration and this is true for both urban and rural areas (as shown in Figure 56 ). In rural areas there was both net internal and international in-migration (where numbers of internal and international in-migrants exceeded numbers of out-migrants). In rural areas, net internal in-migration (reflecting migration between local authorities in Great Britain) was considerably higher than net international in-migration. A key difference between migration in rural and urban areas is that internal migration results in population gain in rural areas and losses in urban areas, while net international in-migration results in much larger population gains in urban areas than in rural areas, when considered against their respective population sizes.
Net in-migration results in population increases in all area types in Wales. Rural area populations increased a little over the period mid-2008 to mid-2009 as a result of net internal in-migration between local authorities in Great Britain, while population change resulting from international migration was negligible. Urban areas showed growth from migration at almost twice the rural area rate, at 0.22 per cent, with net internal out-migration and net international in-migration from outside Great Britain.
The urban area local authority population in Scotland grew by 0.40 per cent in between mid-2008 and mid-2009 from net migration (ignoring births and deaths), with a small net internal in-migration (of people within Great Britain). Rural area populations saw small levels of both net internal in-migration and net international in-migration. As with other countries there were far more internal migrants than international – but the 2.1 per cent of residents who had moved into an urban area were largely balanced by the 2.1 per cent of residents moving out of these areas.
Residents’ perception of their area
As previously mentioned the statistical analysis of areas does not always describe the look and feel of a neighbourhood. Key considerations when asking questions about places might be: do people like where they live? Does a particular area type foster wellbeing? The most accurate way to measure this is to ask people directly.
Responses to the 2008 Place Survey in England, 2008, show the proportions of people answering positively or very positively to questions about their area and home. Figure 57 shows that differences by area type are small, but that some patterns do exist.
Satisfaction with area in England: by area type, 2008
Based on the Rural/Urban local authority classification, people in rural areas were slightly more likely to feel they belonged to their area, and satisfied with their area and home. Satisfaction was higher in the most rural (Rural-80) areas, and lowest in the most urban (Major Urban). Within urban areas, the Large Urban Footnote 34 area type showed more positive results than the others. In 30 local authorities 90 per cent or more of their residents were estimated to be satisfied with their area. These are a mixture of all three rural area types, and four Urban area local authorities, comprising three London boroughs, City of London, Richmond upon Thames, and Kensington and Chelsea, and one coastal retirement area (Christchurch, in Dorset).
Similar questions are asked in Scotland through the Scottish Household Survey Footnote 35 . Figure 58 shows satisfaction using the ‘six-fold’ version of the small area (Data zone) classification. In total some 94 per cent of adults rated their area as being a ‘very good’ or ‘fairly good’ place to live.
Satisfaction with area in Scotland: by area type, 2009
Satisfaction, or rather rating of the neighbourhood as a good place to live varied little by area type, from 92 per cent in Large Urban to 98 per cent in both types of rural area. No single area type demonstrates widespread dissatisfaction among residents. However, more people in the two types of rural area reported their area to be ‘very good’ than in the four types of urban area.
Four-fifths of the populations of England and Scotland live in urban areas (defined at small area level); roughly two-thirds in Wales and Northern Ireland. Rural/urban classifications also allow differences to be identified between more and less sparse (or remote and accessible) area types. What are the main differences between urban/rural areas and sparse/less sparse areas, and what do they tell us about choice?
In some regards rural areas are clearly different from urban areas:
employment rates are higher and unemployment rates lower in the more rural areas of England, Wales and Scotland. In the most rural area types unemployment was as low as half each country’s national average
comparing the earnings of an area’s workers to those of its residents shows a net flow of money into all types of rural area in England, Wales and Scotland
average house prices are less affordable to local workers in rural areas than in urban areas
levels of home working (or working based from home) and self-employment in rural areas in England and Wales are substantially above the national average
rural areas of England and Wales have higher proportions of local business units in relation to their total population, even when farming business units are excluded; although rural units are likely to employ fewer people than those in urban areas
the industry mix in rural areas includes most of the agricultural units and has relatively low proportions of retail, and finance and insurance local units
levels of internet access in each UK country are higher (sometimes only very slightly) in rural areas than urban ones. This suggests that people in rural areas are no longer reliant on physical access to services that tend to be urban, such as banking
reported crime levels in urban areas equate to one crime per resident every 13 years; much higher than the rural equivalent of 21 years
the populations of rural areas have smaller proportions of young adults and average or above-average levels of middle-aged people, children aged 10 to 14, and, except for females in Scotland and Northern Ireland, people aged 60 and over
Where remoteness or sparsity can be shown, ‘two countrysides’ often emerge: one group of more well-off, better connected areas spread across England and Wales; and one much smaller group of less well-off areas concentrated in a handful of areas in the two countries, and in central Wales in particular.
Areas that are rural but less sparse show the highest levels of household income, and the lowest levels of poverty of any area type. Each kind of sparse area, urban or rural, shows much lower levels of income and higher levels of poverty than its less sparse counterpart
The levels of people qualified to at least degree level or equivalent, or working in higher managerial or professional occupations, are higher than average in rural areas, but average or below average in sparse areas
Some datasets show substantial differences between and within urban area types:
the very small group of Urban - Sparse areas shows the lowest average household income, and the highest level of household poverty
looking at local authority areas, the Major Urban area type often shows some distinct characteristics, with, for example, earnings flowing out of these areas at a higher level than for the other two urban area types
large variations are seen within urban areas, even within the same area type, for example jobs densities show great variation within London
incomes vary dramatically within the heavily populated Urban - Less Sparse areas of England, showing both very high and very low incomes
Some datasets show substantial differences between and within rural area types:
rural areas in England have better pre-school and GSCE results than urban ones; however when areas with similar levels of deprivation are compared, differences in the pre-school results, for example, can almost disappear
a similar pattern occurs with life expectancies: boys born in rural areas are expected to live 2 years longer than their urban counterparts; girls, 1.4 years. Within the most deprived group of areas, people born in urban areas are actually expected to live longer than those in rural areas, although in less deprived areas the opposite is found
A pattern emerges of interdependence between urban and rural areas:
population structures suggest that young adults move out of rural areas to urban ones, and that people in their 40s with older children move in
the residents of rural areas earn more than those who work in those areas, showing that rural incomes are at least partially dependent on the ability to commute, especially for full-time workers and for men. Higher transport expenditure accounts for almost half the higher expenditure by rural households than urban ones in Great Britain
Differences in how people say they feel about their area are not dramatic. Surveys in both England and Scotland asking people about their satisfaction with the area where they live show that differences in levels of dissatisfaction are small, although residents in rural areas express higher levels of satisfaction.
In summary, it is difficult with the available data to assess whether rural-urban differences represent genuine free choices in lifestyles, or traps that make it difficult to live how one would like. Some of the findings suggest that certain groups are exercising choice - people in their 40s and those with the means to work in one area type and live in another. Perhaps the more important differences lie within rural and urban areas - between sparse and less sparse rural areas, or particular kinds of urban areas; whether these represent choice is unclear.
Many possibilities exist for further research. Change over time often allows different stories to emerge Footnote 36 . Combining urban/rural classifications with other geography products can produce illuminating results. For example, mixing the rural/urban definition for England and Wales with the 2001 Census Output Area Classification Footnote 37 gives an ‘urban fringe’ group split across the urban and rural area types (Allen, 2008). Differences can be interpreted in systematic ways, so that different patterns in data can be compared to some extent (Poverty Site, 2009). European comparisons can put issues in a useful context; however with rural/urban analysis this involves either using different classifications or using the Eurostat classification for the comparatively large NUTS 3 areas. When 2011 Census data become available a great many more small area datasets will be publicly available for rural/urban analysis.
The Commission for Rural Communities (CRC) has commissioned qualitative ‘rural insight’ surveys.
For an example of this classification being used, see ONS’s Population Trends 134 , available at: www.statistics.gov.uk/StatBase/Product.asp?vlnk=6303&Pos=1&ColRank=1&Rank=272
More information on the Eurostat ‘urban-rural typology’, which can be used to compare urban and rural regions across different countries, can be found here: http://epp.eurostat.ec.europa.eu/statistics_explained/index.php/Urban-rural_typology
Some 133 ‘Nomenclature of Territorial Units for Statistics level 3’ areas cover the UK, and tend to cover groups of local authorities, resulting in areas such as ‘Lancashire’ in England, and ‘Monmouthshire and Newport’ in Wales.
On 1 April 2009 the reorganisation of some local authorities in England resulted in the creation of nine new unitary authorities, replacing 37 former local authorities (including the Isles of Scilly which is considered as a unitary authority for coding purposes).
The Other Urban area type includes cities (such as Derby), ‘historic’ towns and cities (such as Oxford and Worcester), and towns (such as Hastings and Barrow-in-Furness). For more information see Appendix A or Map 6.
The Urban area type in Wales includes only the most urban local authorities – Cardiff, Swansea and Newport.
These 17 industries are derived from the United Kingdom Standard Industrial Classification of Economic Activities (SIC) 2007. For more information see: www.statistics.gov.uk/statbase/Product.asp?vlnk=14012
The sparse group in both England and Wales is made up of a small proportion of all the rural areas, and an even smaller proportion of all urban areas.
Very remote areas are Data zones mostly located in the Shetland Islands, and in eastern Scotland.
Urban – Sparse areas are a very small group of MSOAs spread across England and Wales, covering settlements such as Berwick-upon-Tweed, Scarborough, Aberystwyth and Carmarthen.
Village, Hamlet and Isolated Dwellings (VHID) areas are the most rural types of LSOA or MSOA for the rural/urban definition for England and Wales – see Classifications section or Appendix A for more details.
Local authority areas after the April 2009 boundary reorganisation are used; the classification for these local authorities uses a slightly different methodology from that used for the pre-2009 boundaries shown in Map 6.
Other areas in Wales includes local authorities in the north such as Wrexham, and local authorities in the south such as Bridgend – see Map 8 for more information.
These are not the same measures as those used to create the ‘remoteness’ aspect of the Scottish Government Urban Rural Classification, which is based on travel time to nearest urban area. Only 5 of the 17 services have travel times above 30 minutes in very remote areas.
Available at: www.dft.gov.uk/pgr/statistics/datatablespublications/ltp/coreaccessindicators2009
For a variety of analyses of access to services for England, see the Commission for Rural Communities’ ‘State of the Countryside 2010’ report: www.defra.gov.uk/crc/documents/state-of-the-countryside-report/
This definition is based on population size of settlements – for both England and Scotland this will define more settlements as urban than the official classifications would. For more information see the ‘technical appendix’ at: http://stakeholders.ofcom.org.uk/market-data-research/media-literacy/medlitpub/medlitpubrss/2010-metrics-bulletin/
See ‘Indicators of Poverty and Social Exclusion in Rural England, 2009’, the Commission for Rural Communities; available from The Poverty Site: www.poverty.org.uk/reports/rural%202009.pdf
The IDACI shows the proportion of children aged 0 to 15 in an LSOA that live in an income deprived household.
For more information see: www.direct.gov.uk/en/EducationAndLearning/QualificationsExplained/DG_10039017
The Rural-80 area type includes many areas in the South West region – see Map 6 for more information.
Other areas in Wales include local authorities in the north such as Wrexham, and Bridgend in the south – see Map 8 for more information.
Local authority areas after the April 2009 boundary reorganisation are used; the classification for these authorities uses a slightly different methodology from that used for the pre-2009 boundaries shown in Map 6.
Large Urban Areas include local authorities such as Sheffield, Bournemouth and Coventry. For more
The Rural-80 area type includes many local authorities in the South West region.
Note that this may underestimate the numbers on waiting lists – RSLs sometimes have their own separate lists.
Significant Rural local authorities include for example Guildford, Lancaster, New Forest, and Bedford.
Large Urban local authorities include for example Sheffield, Bournemouth and Coventry.
The Large Urban area type includes local authorities such as Sheffield, Bournemouth and Coventry.
Results are presented on the Scottish Neighbourhood Statistics Website, and in Rural Scotland Key Facts 2010
For example, the Commission for Rural Communities’ ‘State of the Countryside 2010’ presents change over time for some topics. See: www.defra.gov.uk/crc/documents/state-of-the-countryside-report/
For more information see: www.statistics.gov.uk/about/methodology_by_theme/area_classification/
Allen P (2008) ‘Comparing area classifications’, Regional Trends 40, pp 21-30, available at: www.statistics.gov.uk/cci/article.asp?ID=1975
Kyte L and Wells C (2010) ‘Variations in life expectancy between rural and urban areas of England, 2001–07, ’ Health Statistics Quarterly 46, pp 27-52, available at: www.statistics.gov.uk/cci/article.asp?ID=2425
Poverty Site (2009) Indicators of poverty and social exclusion in rural England 2009: www.poverty.org.uk/reports/rural%202009.pdf
Scott A, Gilbert A and Gelan A (2007), ‘The Urban-Rural Divide: Myth or Reality’, The Macaulay Land Use Research Institute, available at: www.macaulay.ac.uk/ruralsustainability/RS_applications.php
Download references
Author information
Authors and affiliations.
Office for National Statistics,
Tim Pateman
You can also search for this author in PubMed Google Scholar
Appendix A: More information on rural/urban classifications
With all rural/urban classifications care needs to be taken to make sure that where data are rates or proportions these are first multiplied by a ‘denominator’ variable (such as estimated population) before being added up, to compensate for different sizes in different areas (Birmingham local authority has a far larger population than Braintree, for example). This article has only aggregated individual areas based on counts. Where a denominator, such as the number of people is not published alongside a rate an external dataset, typically population estimates, has been matched to the same geography before grouping area types.
The Eurostat ‘urban rural typology’, based on a methodology developed by the Organisation for Economic Co-operation and Development (OECD), although not used in this report, can be used to compare urban and rural regions across different countries. More information can be found here: http://epp.eurostat.ec.europa.eu/statistics_explained/index.php/Urban-rural_typology
The Rural/Urban Definition (England and Wales
Rights and permissions
Reprints and permissions
About this article
Pateman, T. Rural and urban areas: comparing lives using rural/urban classifications. Reg Trends 43 , 11–86 (2011). https://doi.org/10.1057/rt.2011.2
Download citation
Published : 01 June 2011
Issue Date : 01 June 2011
DOI : https://doi.org/10.1057/rt.2011.2
Share this article
Anyone you share the following link with will be able to read this content:
Sorry, a shareable link is not currently available for this article.
Provided by the Springer Nature SharedIt content-sharing initiative
- Find a journal
- Publish with us
- Track your research
- Key Differences
Know the Differences & Comparisons
Difference Between Urban and Rural

Another important difference between the two human settlements is that while urban areas are highly populated, rural areas have comparatively less population than the urban ones. Take a read of this article, in which we’ve compiled the important point to distinguish the two.
Content: Urban Vs Rural
Comparison chart, definition of urban.
The term urban simply refers to the region or area which is densely populated and possess the characteristics of the man-made surroundings. The people residing in such area, are engaged in trade, commerce or services. In this settlement, there is high scale industrialisation that results in better employment opportunities. The Urban settlement is not confined to the cities only, but towns and suburbs (suburban areas) are also included in it.
There are many advantages of life in urban areas like easy access to various amenities, better transportation facilities, entertainment and education options, health facilities. Although it suffers certain drawbacks like pollution, caused due to large scale industrialisation and means of transportation like buses, trains, cars and so on, leading to increasing in health problems in the people living in that area.
Definition of Rural
We define the term ‘rural’ as a region located on the outskirts. It refers to a small settlement, which is outside the boundaries of a city, commercial or industrial area. It may include, countryside areas, villages or hamlets, where there are natural vegetation and open spaces. There is a low density of population in such area. The primary source of income of the residents is agriculture and animal husbandry. Cottage Industries also form a chief source of income here.
In India, a town whose population is below 15000 is considered as rural, as per the planning commission. Gram Panchayat is responsible for looking after such areas. Further, there is no municipal board, in the villages and maximum percentage of the male population are engaged in agriculture and related activities.
Key Differences Between Urban and Rural
The fundamental differences between urban and rural are discussed in the following points:
- A settlement where the population is very high and has the features of a built environment (an environment that provides basic facilities for human activity), is known as urban. Rural is the geographical region located in the outer parts of the cities or towns.
- The life in urban areas is fast and complicated, whereas rural life is simple and relaxed.
- The Urban settlement includes cities and towns. On the other hand, the rural settlement includes villages and hamlets.
- There is greater isolation from nature in urban areas, due to the existence of the built environment. Conversely, rural areas are in direct contact with nature, as natural elements influence them.
- Urban people are engaged in non-agricultural work, i.e. trade, commerce or service industry. In contrast, the primary occupation of rural people is agriculture and animal husbandry.
- Population wise, urban areas are densely populated, which is based on the urbanisation, i.e. the higher the urbanisation, the higher is the population. On the contrary, the rural population is sparse, which has an inverse relationship with agriculturism.
- Urban areas are developed in a planned and systematic way, according to the process of urbanisation and industrialisation. Development in rural areas is seldom, based on the availability of natural vegetation and fauna in the region.
- When it comes to social mobilisation, urban people are highly intensive as they change their occupation or residence frequently in search of better opportunities. However, in rural areas occupational or territorial mobility of the people is relatively less intensive.
- Division of labour and specialisation is always present in the urban settlement at the time of job allotment. As opposed to rural areas, there is no division of labour.
So, with the given discussion, it is easily understood that these two human settlements are very different, regarding the density of human structures and the residents of that area. The standard of living in urban areas is higher in comparison to the rural areas. At present, the maximum part of the total population resides in urban areas, as well as the total land area occupied by the urban region is greater than the rural areas.
You Might Also Like:

Rajendra Koduru says
July 2, 2017 at 7:34 pm
Well compared, employment and income sources are very less in rural areas which is leading to migrate to urban
Anthony Bulus says
October 11, 2023 at 7:08 pm
Very helpful to us student
September 13, 2017 at 9:12 pm
Good brief description of content. Very useful for students.
summer says
December 25, 2017 at 3:02 pm
True …………………………………….
Purity says
May 5, 2021 at 1:44 pm
Alik Sarkar says
January 5, 2018 at 7:54 pm
Good article☺☺☺
srisaul says
January 19, 2018 at 10:06 am
very useful !!!!
ezekiel says
March 4, 2018 at 9:02 pm
very important
Subrata Dutta says
May 23, 2018 at 6:41 pm
Good comparison..
anuragnaidu04 says
May 29, 2018 at 6:43 am
nice !very useful!
Ashish says
June 8, 2018 at 7:07 pm
Very well explained! Keep it up.
DillianTaque says
September 15, 2020 at 5:19 pm
Many thanks well explained
August 19, 2018 at 9:33 am
Your site always shows good differences. Good job, keep doing like this. So, i can do my homework.
January 27, 2019 at 7:09 pm
February 24, 2019 at 4:02 am
Nikhil says
February 26, 2019 at 8:16 pm
Good article with detailed description of all factors
March 6, 2019 at 10:49 pm
thanks to this website i have to do more work in class
DISMAS says
March 14, 2019 at 6:30 pm
I GOTTA THEM THANKS
March 20, 2019 at 1:46 am
Wonderful!! This is very useful and more understandable. Keep up the good work!
Alanis Gomez says
May 9, 2019 at 12:26 am
This is a good website I learned more than what I new and Sub to PewDiePie
June 3, 2019 at 11:58 am
thanks now i wont fail geography i owe u 1
August 28, 2019 at 11:20 pm
Hi thanks for sharing this informative article
Nathi Mthembu says
February 22, 2020 at 3:21 pm
well… thank you for this better understandable information. thumbs up
Zahra Abdullah says
October 7, 2021 at 1:16 am
Thanks, this is a clear difference between urban areas and rural areas
Obawale Alabi says
November 25, 2021 at 7:43 am
Very well explanation thnk you
John Carston says
February 3, 2022 at 6:17 am
Thanks to this helpful article
SURENDER SINGH says
May 7, 2022 at 4:54 pm
I WOULD LIKE TO SAY THANKS FOR THIS HELPFUL WEBSITE..
afifa ali says
May 25, 2022 at 10:30 pm
well explained
Tina Gomez says
October 29, 2022 at 2:17 am
Thanks you help my little sis out on her debate assignment Perfect article 💯💘💖💗💓
Beatrice says
November 3, 2022 at 12:45 am
You really help me out a lot, keep up the good work
priscilla says
April 18, 2023 at 8:37 pm
Well explained , thank you
emma chua says
May 22, 2023 at 8:22 am
You are very helpful thanks! Good luck
Iywonna says
November 9, 2023 at 7:16 pm
Thank you for the helpful comparison.
Winnie Bamala says
November 27, 2023 at 8:15 pm
Well explained 👏
Leave a Reply Cancel reply
Your email address will not be published. Required fields are marked *
Save my name, email, and website in this browser for the next time I comment.
- Skip to main content
- Skip to secondary menu
- Skip to primary sidebar
- Skip to footer
Study Today
Largest Compilation of Structured Essays and Exams
Essay on Urban Life (1226 Words)
February 19, 2018 by Manasi Shewale 2 Comments
Table of Contents
How the cities came into existence?
“Full of opportunities” and “different possibilities” are phrases used to define the cities or the urban areas. The urban areas came into existence when the Industrial Revolution which occurred in the 18 th Century.
Till then most of the people relied on the agriculture and cattle breeding to earn their daily bread.
With the industrial revolution a lot of industries emerged, different inventions were made and the work which was earlier done by hands was now replaced by machines.
This gave rise to a lot of opportunities for employment which were quite different from the traditional jobs like pottery and agriculture.
The work now required physical as well as mental ability to complete the jobs. To use the newly invented machines and learn to depend on them for completing of the work was a major revolution in itself.
This also generated a sense of superiority about those who learnt to work with the machines and hence, attracted the villagers and mainly the youngsters to explore this new and somewhat adventurous work (as the labor work and working with the newly invented machines was very much new to the people at that time).
From that period till today’s date, the craze to explore the city life and live the rush is very much prevalent. Also, now there are new machines invented and this requires more of the mental work than the physical work.
The Urban Lifestyle
In urban areas or cities, there is no such like a calm and tension free life. All we see is people in a hurry to reach their offices and doing their work. The working style in the cities is also very different.
People do not do any physical jobs, they work mostly on their personal computers and have different machines attached to these computers depending upon the field of work.
For example, for science and technology, all the analysis and calculation are done by different instruments. These instruments are attached to the computers which directly shows the result.
This result will be interpreted by the individual having that knowledge.
This type of work is not only seen in the field of science but also in regular day to day activities. For example, there is microwave oven to heat the food before a meal instead of manually heating it.
Then there is the invention of the car for the purpose of travelling. For this purpose, proper roads are built. Big buildings are constructed for the people to live instead of small houses as seen in the villages.
There are no play grounds or big trees seen in the city. All that we see, are big buildings, sky scrapers and concrete jungles.
High class or standard of living is observed where daily life chores are done by using machines.
Good quality transport system, residence, food and clothing is available which itself shows that city people are really living the life of their dreams.
This has also created a sense of isolation as the people are very busy in their jobs and do not get time for their family even if they are staying in the same house.
There is a lot of money earned by the city people, but they do not have time to spend it properly due to lack of personal life.
The other side of the City Life
Every thing or concept has its own advantages and disadvantages. The city has a lot of advantages of living a modern life, accepting the western culture, high standard of living and good quality jobs.
So, are there any disadvantages? As the facts say, yes, definitely there is quite an impressive set of disadvantages of the urban life.
First of all, disadvantages, can be said to be the lack of trees. There is so much increase in population that the trees are sacrificed to make place for the people to live.
The natural resources are now being used up to accommodate the increasing population. But this is more of a technological drawback than the urban drawback.
We say that city people live a modern or westernized life. It is true but it is also true that most of the city people have forgotten their own cultures and traditions and have adapted to the western culture.
This can be termed as a disadvantage as our culture and traditions is what makes us different and unique from the western people and therefore, it should not be forgotten.
Due to the increasing technology and the competition among the companies as well as the different countries there is a lot of burden over the small number of working class people.
We all know thousands of migrants come from rural areas to the cities in search of job opportunities.
This should mean that the burden which is put on the working class will be now divided among the new migrants by giving them the job. But it is not that simple in the city.
Everywhere we go, nowadays, the most important thing is your skill and knowledge regarding the job type. There are rules set up which require a graduation degree and the suitable experience to get a job which the migrant might not have.
Even if he has the graduation degree and proper knowledge, where is he going to get the experience from, when no one is ready to hire a fresh candidate. This is one disadvantage of the city life.
Even if the person is totally eligible, there is so much of competition due to the increasing population that most of the employment opportunities are all used up and there is not proper job left for the migrants.
This is where the decrease in the standard of living begins. In a city, we see big buildings made of glass and besides it, we also see slums made of cement and stones. This is the scenario in most of the urban areas of India.
For example, the major cities of India like Mumbai, Kolkata, Chennai, etc. receive thousands of migrants from all parts of the country in search of job opportunities.
But so many job opportunities are not available here as all the available jobs are occupied and then the cities are also saturated with excess human population.
This is when the migrant population start living in slums and do physical labor in other people’s household to get a job.
Those people who don’t do this job then choose the last option of begging. This is the worst-case scenario of these highly developed cities of our country.
Whatever scenarios discussed above are the harsh reality of today’s urban life.
This is by no chance a good situation as it shows that the citizens are not aware of the requirements of these cities and the people are not knowledgeable enough to get the jobs that are available.
Hence, it can be said that today’s urban society has more disadvantages that the advantages.
It is not like there are no jobs available, there are good jobs available out there but the required skills are not there. With increasing competition and excess availability of the human resources the competition is increasing.

About Manasi Shewale
Manasi Shewale loves to read novels and review them inturn. She is an avid reader of various topics of scientific interest in Chemistry and Biology.
Reader Interactions
February 20, 2018 at 2:14 pm
Very well written, beautifully conceived and executed.
February 20, 2018 at 2:23 pm
Leave a Reply Cancel reply
Your email address will not be published. Required fields are marked *
Top Trending Essays in March 2021
- Essay on Pollution
- Essay on my School
- Summer Season
- My favourite teacher
- World heritage day quotes
- my family speech
- importance of trees essay
- autobiography of a pen
- honesty is the best policy essay
- essay on building a great india
- my favourite book essay
- essay on caa
- my favourite player
- autobiography of a river
- farewell speech for class 10 by class 9
- essay my favourite teacher 200 words
- internet influence on kids essay
- my favourite cartoon character
Brilliantly
Content & links.
Verified by Sur.ly
Essay for Students
- Essay for Class 1 to 5 Students
Scholarships for Students
- Class 1 Students Scholarship
- Class 2 Students Scholarship
- Class 3 Students Scholarship
- Class 4 Students Scholarship
- Class 5 students Scholarship
- Class 6 Students Scholarship
- Class 7 students Scholarship
- Class 8 Students Scholarship
- Class 9 Students Scholarship
- Class 10 Students Scholarship
- Class 11 Students Scholarship
- Class 12 Students Scholarship
STAY CONNECTED
- About Study Today
- Privacy Policy
- Terms & Conditions
Scholarships
- Apj Abdul Kalam Scholarship
- Ashirwad Scholarship
- Bihar Scholarship
- Canara Bank Scholarship
- Colgate Scholarship
- Dr Ambedkar Scholarship
- E District Scholarship
- Epass Karnataka Scholarship
- Fair And Lovely Scholarship
- Floridas John Mckay Scholarship
- Inspire Scholarship
- Jio Scholarship
- Karnataka Minority Scholarship
- Lic Scholarship
- Maulana Azad Scholarship
- Medhavi Scholarship
- Minority Scholarship
- Moma Scholarship
- Mp Scholarship
- Muslim Minority Scholarship
- Nsp Scholarship
- Oasis Scholarship
- Obc Scholarship
- Odisha Scholarship
- Pfms Scholarship
- Post Matric Scholarship
- Pre Matric Scholarship
- Prerana Scholarship
- Prime Minister Scholarship
- Rajasthan Scholarship
- Santoor Scholarship
- Sitaram Jindal Scholarship
- Ssp Scholarship
- Swami Vivekananda Scholarship
- Ts Epass Scholarship
- Up Scholarship
- Vidhyasaarathi Scholarship
- Wbmdfc Scholarship
- West Bengal Minority Scholarship
- Click Here Now!!
Mobile Number
Have you Burn Crackers this Diwali ? Yes No
- Website Inauguration Function.
- Vocational Placement Cell Inauguration
- Media Coverage.
- Certificate & Recommendations
- Privacy Policy
- Science Project Metric
- Social Studies 8 Class
- Computer Fundamentals
- Introduction to C++
- Programming Methodology
- Programming in C++
- Data structures
- Boolean Algebra
- Object Oriented Concepts
- Database Management Systems
- Open Source Software
- Operating System
- PHP Tutorials
- Earth Science
- Physical Science
- Sets & Functions
- Coordinate Geometry
- Mathematical Reasoning
- Statics and Probability
- Accountancy
- Business Studies
- Political Science
- English (Sr. Secondary)
Hindi (Sr. Secondary)
- Punjab (Sr. Secondary)
- Accountancy and Auditing
- Air Conditioning and Refrigeration Technology
- Automobile Technology
- Electrical Technology
- Electronics Technology
- Hotel Management and Catering Technology
- IT Application
- Marketing and Salesmanship
- Office Secretaryship
- Stenography
- Hindi Essays
- English Essays
Letter Writing
- Shorthand Dictation
Essay on “Urban Life Vs Rural Life” Complete Essay for Class 10, Class 12 and Graduation and other classes.
Urban Life Vs Rural Life
It is rightly said that God made the country and man made the town.
In the villages, the people live in an open atmosphere. They get fresh air and sunlight. They inhale pure oxygen which they get form the trees and waving crops which grow in their fields.
As compared to the towns’ people , the people in the villages lead a tension free life. There is not much noise in villages.
In villages, people generally get fresh vegetables and pure milk. They also consume lesser amount of fast food which is very harmful.
There are , however certain advantages which the urban people have over the villages.
There are much better employment avenues in towns. The security system is also better in towns.
In towns, the people often do not feel bored, as they have several means of amusement and entertainment such as visiting different places of importance, a visit to the zoo, some museum of exhibition, etc.
In towns, people get better education as there are so many schools, colleges, universities and libraries.
Better medical facilities are available in towns, as there are so many big hospital and dispensaries there which are not available in villages.
In towns we can have more variety of goods including food and wearing articles. We can get the food of our choice at hotels and restaurants. There are thousands of shops in towns to cater to our needs.,
Thus , in certain ways, villages are better while in other , towns are better
About evirtualguru_ajaygour

commentscomments
Its helpful and easy wording understand easily As a request… Essays me Kuch quotations b add kr diya key please
Leave a Reply Cancel reply
Your email address will not be published. Required fields are marked *
Quick Links

Popular Tags
Visitors question & answer.
- Md shoaib sarker on Short Story ” The Lion and The Mouse” Complete Story for Class 10, Class 12 and other classes.
- Bhavika on Essay on “A Model Village” Complete Essay for Class 10, Class 12 and Graduation and other classes.
- slide on 10 Comprehension Passages Practice examples with Question and Answers for Class 9, 10, 12 and Bachelors Classes
- अभिषेक राय on Hindi Essay on “Yadi mein Shikshak Hota” , ”यदि मैं शिक्षक होता” Complete Hindi Essay for Class 10, Class 12 and Graduation and other classes.
Download Our Educational Android Apps
Latest Desk
- Samkaleen Bhartiya Mahilaye “समकालीन भारतीय महिलाएं” Hindi Essay, Nibandh 1000 Words for Class 10, 12 Students.
- Nijikarn – Gun evm Dosh “निजीकरण: गुण एवं दोष” Hindi Essay, Nibandh 1200 Words for Class 10, 12 Students.
- Bharat mein Mahilaon ke Rajnitik Adhikar “भारत में महिलाओं के राजनीतिक अधिकार” Hindi Essay, Nibandh 700 Words for Class 10, 12 Students.
- Bharat mein Jativad aur Chunavi Rajniti “भारत में जातिवाद और चुनावी राजनीति” Hindi Essay, Nibandh 1000 Words for Class 10, 12 Students.
- Example Letter regarding election victory.
- Example Letter regarding the award of a Ph.D.
- Example Letter regarding the birth of a child.
- Example Letter regarding going abroad.
- Letter regarding the publishing of a Novel.
Vocational Edu.
- English Shorthand Dictation “East and Dwellings” 80 and 100 wpm Legal Matters Dictation 500 Words with Outlines.
- English Shorthand Dictation “Haryana General Sales Tax Act” 80 and 100 wpm Legal Matters Dictation 500 Words with Outlines meaning.
- English Shorthand Dictation “Deal with Export of Goods” 80 and 100 wpm Legal Matters Dictation 500 Words with Outlines meaning.
- English Shorthand Dictation “Interpreting a State Law” 80 and 100 wpm Legal Matters Dictation 500 Words with Outlines meaning.
17 Advantages and Disadvantages of Rural Areas
Rural areas, compared to urban areas, offer a different way of life that is often characterized by spacious living spaces, close-knit communities, and a slower pace of life.
However, along with these advantages, there are also disadvantages that come with living in a rural area.
In this article, we will explore the pros and cons of rural living, highlighting the benefits and drawbacks that individuals may encounter when residing in the countryside.

- Redaction Team
- September 25, 2023
- Personal Development , Spirit
Advantages of Rural Areas
- Peace and Quiet : Rural areas are known for their tranquility and peace. There is less noise pollution, which can lead to a quieter and more relaxed lifestyle.
- Cleaner Environment : Rural areas often have cleaner air and water, contributing to better overall environmental quality and health.
- Lower Cost of Living : The cost of living in rural areas is generally lower than in urban areas. Housing, land, and daily expenses tend to be more affordable.
- Community and Tight-Knit Social Bonds : Rural communities often have strong social bonds and a sense of belonging. People tend to know their neighbors and are more likely to help each other.
- Less Traffic and Congestion : Rural areas have less traffic congestion, making commuting and travel more comfortable and less time-consuming.
- Natural Beauty and Scenic Landscapes : Rural areas often offer stunning natural landscapes, such as mountains, forests, lakes, and open fields, providing opportunities for outdoor activities and recreation.
- Agricultural Opportunities : Rural areas are usually the heart of agriculture, offering opportunities for farming and related businesses.
- Less Crime : Rural areas typically have lower crime rates than urban areas, contributing to a greater sense of safety and security.
Disadvantages of Rural Areas
- Limited Job Opportunities : Rural areas often have fewer job opportunities, particularly in specialized fields or industries, which may require residents to commute to urban centers for work.
- Limited Access to Services : Access to healthcare, education, and other essential services may be limited or require longer travel distances.
- Lack of Entertainment and Cultural Activities : Rural areas may have fewer entertainment options, restaurants, cultural events, and recreational facilities compared to urban areas.
- Limited Public Transportation : Public transportation options are often limited or nonexistent in rural areas, making it necessary to own a car for mobility.
- Educational Challenges : Rural schools may have fewer resources and extracurricular activities, potentially affecting the quality of education for students.
- Healthcare Accessibility : Healthcare facilities and specialists may be scarce in rural areas, leading to longer travel times for medical care.
- Technological Limitations : Rural areas may lack access to high-speed internet and modern technology, which can hinder communication and economic opportunities.
- Social Isolation : Rural living can sometimes lead to social isolation, especially for individuals who are not part of tight-knit communities.
- Distance from Amenities : Residents of rural areas may need to travel long distances to reach shopping centers, entertainment venues, and healthcare facilities.
The Advantages of Rural Life
One of the main advantages of living in a rural area is the abundance of open space. Unlike urban areas where space is limited and living spaces can be cramped, rural areas tend to offer more living space for individuals and families. This can be especially appealing for those who value privacy and enjoy having a large backyard or garden. Moreover, rural residents often have the opportunity to live in homes that are surrounded by natural beauty, such as picturesque landscapes and lush greenery.
Another advantage of rural living is the sense of community that is often fostered in rural areas. With smaller populations compared to big cities, rural towns and villages tend to have close-knit communities where neighbors know each other well and are often willing to lend a helping hand. This sense of community can provide a feeling of belonging and support, which can be particularly important for individuals seeking a strong social connection.
Furthermore, the cost of living in rural areas is often lower compared to urban areas, making it an attractive option for individuals on a tight budget. Housing prices, transportation costs, and even groceries can be more affordable in rural communities, allowing individuals to stretch their income further and enjoy a higher quality of life without breaking the bank.
The Disadvantages of Rural Living
While there are certainly advantages to living in a rural area, it’s important to consider the disadvantages as well. One of the main drawbacks is the lack of amenities and services that are readily available in urban areas. Access to healthcare facilities, educational institutions, and public transportation can be limited in rural areas, requiring individuals to travel longer distances to meet their needs. Moreover, the absence of public transportation options can be a significant inconvenience for those who do not own a private vehicle.
Another disadvantage of rural living is the limited job opportunities that are available compared to urban areas. Big cities are often hubs of economic activity with a wide range of industries and job prospects. In rural areas, however, job options can be more limited, and individuals may need to commute long distances to find suitable employment. This can be a significant factor to consider, especially for individuals who have a specific career path or industry in mind.
Additionally, rural areas also tend to have fewer entertainment and recreational options compared to urban areas. The hustle and bustle of big cities often come with a plethora of cultural events, dining options, and entertainment venues. In contrast, rural areas may have limited access to theaters, shopping centers, and other forms of entertainment. This can pose a challenge for individuals who enjoy a vibrant social life and a wide range of recreational activities.
Pros and Cons of Rural Living
Living in a rural area has its own set of pros and cons. Country living offers tranquility, natural beauty, and a strong sense of community. The slower pace of life can be refreshing for individuals who prefer a more relaxed and peaceful environment. Additionally, the cost of living tends to be lower, which can be particularly appealing for individuals on a budget.
However, there are also disadvantages to consider. The lack of amenities, limited job opportunities, and reduced access to entertainment options can be significant drawbacks for some individuals. Before deciding to move to a rural area, it is important to carefully weigh these pros and cons to ensure that it aligns with your personal preferences and lifestyle goals.
Moving to a Rural Area: Is It Right for You?
Deciding whether to live in a rural area or an urban area ultimately comes down to personal preference. Some individuals thrive in the peacefulness and beauty of rural areas, while others enjoy the bustling energy and opportunities that big cities offer. It is important to consider factors such as job prospects, access to amenities, and your desired lifestyle before making a decision.
If you value spacious living, close-knit communities, and a slower pace of life, then rural living may be the perfect fit for you. On the other hand, if you prioritize access to a wide range of amenities, job opportunities, and a vibrant social scene, then urban living may be more suitable. Ultimately, the decision should be based on what aligns with your personal preferences, goals, and priorities.
You can read more in the advantages and disadvantages of living in the city .
Privacy Overview

- Practice Test
- Useful Tips – Tricks
- Full Writing Review
- General Writing Task
- Writing Task 1
- Writing Task 2
- Writing Exercises
- Writing Sample – Topics
- Writing Vocabulary
- Speaking Vocabulary
- Intro Question
- Speaking Part 1
- Speaking Part 2
- Speaking Part 2 – Audio
- Speaking Part 3
- IELTS Books
- Recent Exams
- IELTS Vocabulary
- Essay from Examiners
- IELTS Ideas
IELTS App - For Mobile
Ready for the IELTS exam with our IELTS app. Over 2 million downloads

Popular Last 24h
Describe a dinner you enjoyed with your friends., ielts speaking part 1: animals, writing task 1: the favourite takeaways of people in canada and the number of indian restaurants in canada, ielts speaking – time management, what would be your perfect holiday or vacation look like, cue card 2020 #36: a leisure activity that you do with your family, writing task 1: coffee and tea buying and drinking habits in five australian cities.
- IELTS Test/Skills FAQs
- IELTS Scoring in Detail
- Forecast Speaking – 2023
- List IELTS Speaking Part 3
- List IELTS Speaking Part 1
- IELTS Writing 2023 – Actual Test
Our Telegram
Join our community for IELTS preparation and share and download materials.
The information on this site is for informational purposes only. IELTS is a registered trademark of the University of Cambridge ESOL, the British Council, and IDP Education Australia. This site and its owners are not affiliated, approved or endorsed by University of Cambridge ESOL, the British Council, or IDP Education Australia.
Latest Articles
Cue card – describe a gift you bought for someone, cue card – describe a place where you like to go shopping, ielts writing task 1 (process wasted glass bottles) – band 9, ielts speaking part 1: rubbish/ plastic garbage, talk about global warming (part 1/3), most popular, describe a film that made you laugh, describe a person whom you met for the first time and made you happy, topic: experience is the best teacher, describe something difficult you would like to succeed in doing, in many countries,today there are many highly qualified graduates without employment..
ieltspracticeonline All Rights Reserved
COMMENTS
Urban Life vs. Rural Life. Living in cities or the countryside gives different experiences. These are changed by things like how people live, buildings and community activities. Life in the city is famous for its quick-moving lifestyle, modern setup and different ways people live together. Living in the countryside is marked by a slow speed ...
In conclusion, urban and rural areas offer distinct lifestyles and experiences. Urban areas boast advanced infrastructure, employment opportunities, and access to services, while rural areas provide a sense of community, lower cost of living, and closeness to nature. Each has its own advantages and challenges, and the choice between the two ...
Comparison of life in urban and rural areas. In general, both the rural and urban areas are similar in status with respect to the relations between people or groups relations but hold opposing views in the issues of choice and multiplicity. Consequently, the life in urban areas has quite a number of optimistic in addition to the pessimistic ...
500+ Words Essay on City Life Vs Village Life. Village life reflects the rural lifestyle and city life shows the urban lifestyle. Life in both rural and urban areas has its own plus points and problems. One is quite different from each other. Traditionally, India is a predominantly rural country as Mahatma Gandhi had said, "The real India ...
The life quality is one of the major factors to consider while comparing rural and urban living. That is why the main task to be made when talking about advantages and disadvantages of urban versus rural life is evaluating such important factors as health and employment possibilities, presents and quality of educational institutions, coast of ...
Among urban dwellers, 53% see an urban-rural divide on values, while 46% say most people in rural areas have values that are similar to their own. About half in urban and rural areas say most people in suburbs share their values, while suburbanites are somewhat more likely to say most people in rural areas have values that are similar to their ...
Rural areas include the areas that is outside the cities and town which have less facilities, fewer development involved and others. Although we can see various shortcomings, there are many advantages implied. Experience life in the countryside is more challenging because of the weaknesses that exist. However, the experience itself will teach ...
This is an IELTS writing task 2 sample answer essay that is only available on my Patreon based on a real question related to urban and rural life from the IELTS exam.. Here is the questions itself: Many believe that living in a city offers greater benefits compared to life in the countryside.
Satisfactory Essays. 750 Words. 3 Pages. Open Document. Urban Life vs Rural Life! People always wonder about the similarities and differences between living in the city and living in the countryside. The majority of people in the world now, prefer to live in cities rather than countrysides. It has been known for a long time that life in the ...
There is a very strong rural/urban difference in Scottish working life. While in Urban Areas the unemployment rate was estimated to be 8.0 per cent, and 24 per cent of people aged 16 to 64 were economically inactive, Rural Areas had corresponding rates of 4.5 per cent and 20 per cent. Figure 28.
Rural is the geographical region located in the outer parts of the cities or towns. The life in urban areas is fast and complicated, whereas rural life is simple and relaxed. The Urban settlement includes cities and towns. On the other hand, the rural settlement includes villages and hamlets. There is greater isolation from nature in urban ...
Essay, Pages 3 (593 words) Views. 8044. Rural living presents a distinct contrast to the hustle and bustle of urban centers, offering a unique lifestyle that may lack some conveniences but comes with its own set of advantages. This essay delves into the various aspects of rural living, exploring its impact on quality of life, mental well-being ...
Rural Community vs. Urban Community Some people prefer the hustle and bustle of the city life while others prefer the relaxed and laid back life of the country. Living in a rural community and living in an urban community are completely different. Most people have their preference of where they would like to live.
Main Body of Urbanism And Rural Lifestyle Essay Difference Between Urban Life And Rural Life. The difference between urbanism and rural living is that urban life usually involves more people, activity, and the opportunity to find more jobs than in a small town. Rural life is different because it tends to be less populated with larger spaces of ...
Essay On Rural And Urban Life. 1488 Words6 Pages. "Pakistani society is divided into two segments. Draw a comparison of rural and urban ways of life.". Introduction: Based on the density of population, development, amenities, employment opportunities, education, etc. human settlement is majorly divided into two categories i.e. Urban and Rural.
As the facts say, yes, definitely there is quite an impressive set of disadvantages of the urban life. First of all, disadvantages, can be said to be the lack of trees. There is so much increase in population that the trees are sacrificed to make place for the people to live. The natural resources are now being used up to accommodate the ...
February 14, 2024 by Prasanna. Essay on Urbanisation: Urbanization is the typical characteristic of human civilization and is the center of social life, economy, and politics. Urbanization is a term derived from a Latin word 'urb' which means city. The primary need for Urbanization is because it helps people under poverty and pushes them ...
struggles for power an urban ideal = the ultimate model of unity, peace and harmony Heading A: There is nothing in the sentence that matches always fail . Heading C: The sentence talks about peace and harmony , which contradicts the idea of conflict in the heading. 05 Ask students to read the full paragraph and to check in
Rural is the geographical region located in the outer parts of the cities or towns. Life in urban areas is fast and complicated, whereas rural life is simple and relaxed. The Urban settlement includes cities and towns. On the other hand, rural settlement includes villages and hamlets. There is greater isolation from nature in urban areas, due ...
Essay on "Urban Life Vs Rural Life" Complete Essay for Class 10, Class 12 and Graduation and other classes. Urban Life Vs Rural Life. It is rightly said that God made the country and man made the town. In the villages, the people live in an open atmosphere. They get fresh air and sunlight. They inhale pure oxygen which they get form the ...
Cleaner Environment: Rural areas often have cleaner air and water, contributing to better overall environmental quality and health. Lower Cost of Living: The cost of living in rural areas is generally lower than in urban areas. Housing, land, and daily expenses tend to be more affordable. Community and Tight-Knit Social Bonds: Rural communities ...
urban area city. health benefits good for you. outweigh stronger than. range of opportunities many chances. chief advantages main benefits. relate to regarding. city-dwelling lends itself living in a city makes you more likely to. more sedentary lifestyle less active living. threat of air pollution risk of poor air quality.
246 Words Short Essay on Urban Life VS Rural Life. It is rightly said that God made the country and man made the town. In the villages, the people live in an open atmosphere. They get fresh air and sunlight. They inhale pure oxygen which they get from the trees and waving crops which grow in their fields. As compared to the towns' people, the ...
The physical and cognitive impairments that come with age can have a negative impact on everyday mobility. Furthermore, the mobility and transport potential of older adults differs between rural, semi-dense and urban areas. Some comparative research has shown that rural older adults with and without impairments are more disadvantaged than their urban counterparts in terms of their everyday ...