- Privacy Policy
Home » Research Report – Example, Writing Guide and Types

Research Report – Example, Writing Guide and Types
Table of Contents

Research Report
Definition:
Research Report is a written document that presents the results of a research project or study, including the research question, methodology, results, and conclusions, in a clear and objective manner.
The purpose of a research report is to communicate the findings of the research to the intended audience, which could be other researchers, stakeholders, or the general public.
Components of Research Report
Components of Research Report are as follows:
Introduction
The introduction sets the stage for the research report and provides a brief overview of the research question or problem being investigated. It should include a clear statement of the purpose of the study and its significance or relevance to the field of research. It may also provide background information or a literature review to help contextualize the research.
Literature Review
The literature review provides a critical analysis and synthesis of the existing research and scholarship relevant to the research question or problem. It should identify the gaps, inconsistencies, and contradictions in the literature and show how the current study addresses these issues. The literature review also establishes the theoretical framework or conceptual model that guides the research.
Methodology
The methodology section describes the research design, methods, and procedures used to collect and analyze data. It should include information on the sample or participants, data collection instruments, data collection procedures, and data analysis techniques. The methodology should be clear and detailed enough to allow other researchers to replicate the study.
The results section presents the findings of the study in a clear and objective manner. It should provide a detailed description of the data and statistics used to answer the research question or test the hypothesis. Tables, graphs, and figures may be included to help visualize the data and illustrate the key findings.
The discussion section interprets the results of the study and explains their significance or relevance to the research question or problem. It should also compare the current findings with those of previous studies and identify the implications for future research or practice. The discussion should be based on the results presented in the previous section and should avoid speculation or unfounded conclusions.
The conclusion summarizes the key findings of the study and restates the main argument or thesis presented in the introduction. It should also provide a brief overview of the contributions of the study to the field of research and the implications for practice or policy.
The references section lists all the sources cited in the research report, following a specific citation style, such as APA or MLA.
The appendices section includes any additional material, such as data tables, figures, or instruments used in the study, that could not be included in the main text due to space limitations.
Types of Research Report
Types of Research Report are as follows:
Thesis is a type of research report. A thesis is a long-form research document that presents the findings and conclusions of an original research study conducted by a student as part of a graduate or postgraduate program. It is typically written by a student pursuing a higher degree, such as a Master’s or Doctoral degree, although it can also be written by researchers or scholars in other fields.
Research Paper
Research paper is a type of research report. A research paper is a document that presents the results of a research study or investigation. Research papers can be written in a variety of fields, including science, social science, humanities, and business. They typically follow a standard format that includes an introduction, literature review, methodology, results, discussion, and conclusion sections.
Technical Report
A technical report is a detailed report that provides information about a specific technical or scientific problem or project. Technical reports are often used in engineering, science, and other technical fields to document research and development work.
Progress Report
A progress report provides an update on the progress of a research project or program over a specific period of time. Progress reports are typically used to communicate the status of a project to stakeholders, funders, or project managers.
Feasibility Report
A feasibility report assesses the feasibility of a proposed project or plan, providing an analysis of the potential risks, benefits, and costs associated with the project. Feasibility reports are often used in business, engineering, and other fields to determine the viability of a project before it is undertaken.
Field Report
A field report documents observations and findings from fieldwork, which is research conducted in the natural environment or setting. Field reports are often used in anthropology, ecology, and other social and natural sciences.
Experimental Report
An experimental report documents the results of a scientific experiment, including the hypothesis, methods, results, and conclusions. Experimental reports are often used in biology, chemistry, and other sciences to communicate the results of laboratory experiments.
Case Study Report
A case study report provides an in-depth analysis of a specific case or situation, often used in psychology, social work, and other fields to document and understand complex cases or phenomena.
Literature Review Report
A literature review report synthesizes and summarizes existing research on a specific topic, providing an overview of the current state of knowledge on the subject. Literature review reports are often used in social sciences, education, and other fields to identify gaps in the literature and guide future research.
Research Report Example
Following is a Research Report Example sample for Students:
Title: The Impact of Social Media on Academic Performance among High School Students
This study aims to investigate the relationship between social media use and academic performance among high school students. The study utilized a quantitative research design, which involved a survey questionnaire administered to a sample of 200 high school students. The findings indicate that there is a negative correlation between social media use and academic performance, suggesting that excessive social media use can lead to poor academic performance among high school students. The results of this study have important implications for educators, parents, and policymakers, as they highlight the need for strategies that can help students balance their social media use and academic responsibilities.
Introduction:
Social media has become an integral part of the lives of high school students. With the widespread use of social media platforms such as Facebook, Twitter, Instagram, and Snapchat, students can connect with friends, share photos and videos, and engage in discussions on a range of topics. While social media offers many benefits, concerns have been raised about its impact on academic performance. Many studies have found a negative correlation between social media use and academic performance among high school students (Kirschner & Karpinski, 2010; Paul, Baker, & Cochran, 2012).
Given the growing importance of social media in the lives of high school students, it is important to investigate its impact on academic performance. This study aims to address this gap by examining the relationship between social media use and academic performance among high school students.
Methodology:
The study utilized a quantitative research design, which involved a survey questionnaire administered to a sample of 200 high school students. The questionnaire was developed based on previous studies and was designed to measure the frequency and duration of social media use, as well as academic performance.
The participants were selected using a convenience sampling technique, and the survey questionnaire was distributed in the classroom during regular school hours. The data collected were analyzed using descriptive statistics and correlation analysis.
The findings indicate that the majority of high school students use social media platforms on a daily basis, with Facebook being the most popular platform. The results also show a negative correlation between social media use and academic performance, suggesting that excessive social media use can lead to poor academic performance among high school students.
Discussion:
The results of this study have important implications for educators, parents, and policymakers. The negative correlation between social media use and academic performance suggests that strategies should be put in place to help students balance their social media use and academic responsibilities. For example, educators could incorporate social media into their teaching strategies to engage students and enhance learning. Parents could limit their children’s social media use and encourage them to prioritize their academic responsibilities. Policymakers could develop guidelines and policies to regulate social media use among high school students.
Conclusion:
In conclusion, this study provides evidence of the negative impact of social media on academic performance among high school students. The findings highlight the need for strategies that can help students balance their social media use and academic responsibilities. Further research is needed to explore the specific mechanisms by which social media use affects academic performance and to develop effective strategies for addressing this issue.
Limitations:
One limitation of this study is the use of convenience sampling, which limits the generalizability of the findings to other populations. Future studies should use random sampling techniques to increase the representativeness of the sample. Another limitation is the use of self-reported measures, which may be subject to social desirability bias. Future studies could use objective measures of social media use and academic performance, such as tracking software and school records.
Implications:
The findings of this study have important implications for educators, parents, and policymakers. Educators could incorporate social media into their teaching strategies to engage students and enhance learning. For example, teachers could use social media platforms to share relevant educational resources and facilitate online discussions. Parents could limit their children’s social media use and encourage them to prioritize their academic responsibilities. They could also engage in open communication with their children to understand their social media use and its impact on their academic performance. Policymakers could develop guidelines and policies to regulate social media use among high school students. For example, schools could implement social media policies that restrict access during class time and encourage responsible use.
References:
- Kirschner, P. A., & Karpinski, A. C. (2010). Facebook® and academic performance. Computers in Human Behavior, 26(6), 1237-1245.
- Paul, J. A., Baker, H. M., & Cochran, J. D. (2012). Effect of online social networking on student academic performance. Journal of the Research Center for Educational Technology, 8(1), 1-19.
- Pantic, I. (2014). Online social networking and mental health. Cyberpsychology, Behavior, and Social Networking, 17(10), 652-657.
- Rosen, L. D., Carrier, L. M., & Cheever, N. A. (2013). Facebook and texting made me do it: Media-induced task-switching while studying. Computers in Human Behavior, 29(3), 948-958.
Note*: Above mention, Example is just a sample for the students’ guide. Do not directly copy and paste as your College or University assignment. Kindly do some research and Write your own.
Applications of Research Report
Research reports have many applications, including:
- Communicating research findings: The primary application of a research report is to communicate the results of a study to other researchers, stakeholders, or the general public. The report serves as a way to share new knowledge, insights, and discoveries with others in the field.
- Informing policy and practice : Research reports can inform policy and practice by providing evidence-based recommendations for decision-makers. For example, a research report on the effectiveness of a new drug could inform regulatory agencies in their decision-making process.
- Supporting further research: Research reports can provide a foundation for further research in a particular area. Other researchers may use the findings and methodology of a report to develop new research questions or to build on existing research.
- Evaluating programs and interventions : Research reports can be used to evaluate the effectiveness of programs and interventions in achieving their intended outcomes. For example, a research report on a new educational program could provide evidence of its impact on student performance.
- Demonstrating impact : Research reports can be used to demonstrate the impact of research funding or to evaluate the success of research projects. By presenting the findings and outcomes of a study, research reports can show the value of research to funders and stakeholders.
- Enhancing professional development : Research reports can be used to enhance professional development by providing a source of information and learning for researchers and practitioners in a particular field. For example, a research report on a new teaching methodology could provide insights and ideas for educators to incorporate into their own practice.
How to write Research Report
Here are some steps you can follow to write a research report:
- Identify the research question: The first step in writing a research report is to identify your research question. This will help you focus your research and organize your findings.
- Conduct research : Once you have identified your research question, you will need to conduct research to gather relevant data and information. This can involve conducting experiments, reviewing literature, or analyzing data.
- Organize your findings: Once you have gathered all of your data, you will need to organize your findings in a way that is clear and understandable. This can involve creating tables, graphs, or charts to illustrate your results.
- Write the report: Once you have organized your findings, you can begin writing the report. Start with an introduction that provides background information and explains the purpose of your research. Next, provide a detailed description of your research methods and findings. Finally, summarize your results and draw conclusions based on your findings.
- Proofread and edit: After you have written your report, be sure to proofread and edit it carefully. Check for grammar and spelling errors, and make sure that your report is well-organized and easy to read.
- Include a reference list: Be sure to include a list of references that you used in your research. This will give credit to your sources and allow readers to further explore the topic if they choose.
- Format your report: Finally, format your report according to the guidelines provided by your instructor or organization. This may include formatting requirements for headings, margins, fonts, and spacing.
Purpose of Research Report
The purpose of a research report is to communicate the results of a research study to a specific audience, such as peers in the same field, stakeholders, or the general public. The report provides a detailed description of the research methods, findings, and conclusions.
Some common purposes of a research report include:
- Sharing knowledge: A research report allows researchers to share their findings and knowledge with others in their field. This helps to advance the field and improve the understanding of a particular topic.
- Identifying trends: A research report can identify trends and patterns in data, which can help guide future research and inform decision-making.
- Addressing problems: A research report can provide insights into problems or issues and suggest solutions or recommendations for addressing them.
- Evaluating programs or interventions : A research report can evaluate the effectiveness of programs or interventions, which can inform decision-making about whether to continue, modify, or discontinue them.
- Meeting regulatory requirements: In some fields, research reports are required to meet regulatory requirements, such as in the case of drug trials or environmental impact studies.
When to Write Research Report
A research report should be written after completing the research study. This includes collecting data, analyzing the results, and drawing conclusions based on the findings. Once the research is complete, the report should be written in a timely manner while the information is still fresh in the researcher’s mind.
In academic settings, research reports are often required as part of coursework or as part of a thesis or dissertation. In this case, the report should be written according to the guidelines provided by the instructor or institution.
In other settings, such as in industry or government, research reports may be required to inform decision-making or to comply with regulatory requirements. In these cases, the report should be written as soon as possible after the research is completed in order to inform decision-making in a timely manner.
Overall, the timing of when to write a research report depends on the purpose of the research, the expectations of the audience, and any regulatory requirements that need to be met. However, it is important to complete the report in a timely manner while the information is still fresh in the researcher’s mind.
Characteristics of Research Report
There are several characteristics of a research report that distinguish it from other types of writing. These characteristics include:
- Objective: A research report should be written in an objective and unbiased manner. It should present the facts and findings of the research study without any personal opinions or biases.
- Systematic: A research report should be written in a systematic manner. It should follow a clear and logical structure, and the information should be presented in a way that is easy to understand and follow.
- Detailed: A research report should be detailed and comprehensive. It should provide a thorough description of the research methods, results, and conclusions.
- Accurate : A research report should be accurate and based on sound research methods. The findings and conclusions should be supported by data and evidence.
- Organized: A research report should be well-organized. It should include headings and subheadings to help the reader navigate the report and understand the main points.
- Clear and concise: A research report should be written in clear and concise language. The information should be presented in a way that is easy to understand, and unnecessary jargon should be avoided.
- Citations and references: A research report should include citations and references to support the findings and conclusions. This helps to give credit to other researchers and to provide readers with the opportunity to further explore the topic.
Advantages of Research Report
Research reports have several advantages, including:
- Communicating research findings: Research reports allow researchers to communicate their findings to a wider audience, including other researchers, stakeholders, and the general public. This helps to disseminate knowledge and advance the understanding of a particular topic.
- Providing evidence for decision-making : Research reports can provide evidence to inform decision-making, such as in the case of policy-making, program planning, or product development. The findings and conclusions can help guide decisions and improve outcomes.
- Supporting further research: Research reports can provide a foundation for further research on a particular topic. Other researchers can build on the findings and conclusions of the report, which can lead to further discoveries and advancements in the field.
- Demonstrating expertise: Research reports can demonstrate the expertise of the researchers and their ability to conduct rigorous and high-quality research. This can be important for securing funding, promotions, and other professional opportunities.
- Meeting regulatory requirements: In some fields, research reports are required to meet regulatory requirements, such as in the case of drug trials or environmental impact studies. Producing a high-quality research report can help ensure compliance with these requirements.
Limitations of Research Report
Despite their advantages, research reports also have some limitations, including:
- Time-consuming: Conducting research and writing a report can be a time-consuming process, particularly for large-scale studies. This can limit the frequency and speed of producing research reports.
- Expensive: Conducting research and producing a report can be expensive, particularly for studies that require specialized equipment, personnel, or data. This can limit the scope and feasibility of some research studies.
- Limited generalizability: Research studies often focus on a specific population or context, which can limit the generalizability of the findings to other populations or contexts.
- Potential bias : Researchers may have biases or conflicts of interest that can influence the findings and conclusions of the research study. Additionally, participants may also have biases or may not be representative of the larger population, which can limit the validity and reliability of the findings.
- Accessibility: Research reports may be written in technical or academic language, which can limit their accessibility to a wider audience. Additionally, some research may be behind paywalls or require specialized access, which can limit the ability of others to read and use the findings.
About the author

Muhammad Hassan
Researcher, Academic Writer, Web developer
You may also like

Data Collection – Methods Types and Examples

Delimitations in Research – Types, Examples and...

Research Process – Steps, Examples and Tips

Research Design – Types, Methods and Examples

Institutional Review Board – Application Sample...

Evaluating Research – Process, Examples and...
Writing up a Research Report
- First Online: 04 January 2024
Cite this chapter

- Stefan Hunziker 3 &
- Michael Blankenagel 3
386 Accesses
A research report is one big argument about how and why you came up with your conclusions. To make it a convincing argument, a typical guiding structure has developed. In the different chapters, there are distinct issues that need to be addressed to explain to the reader why your conclusions are valid. The governing principle for writing the report is full disclosure: to explain everything and ensure replicability by another researcher.
This is a preview of subscription content, log in via an institution to check access.
Access this chapter
- Available as EPUB and PDF
- Read on any device
- Instant download
- Own it forever
- Compact, lightweight edition
- Dispatched in 3 to 5 business days
- Free shipping worldwide - see info
Tax calculation will be finalised at checkout
Purchases are for personal use only
Institutional subscriptions
Barros, L. O. (2016). The only academic phrasebook you’ll ever need . Createspace Independent Publishing Platform.
Google Scholar
Field, A. (2016). An adventure in statistics. The reality enigma . SAGE.
Field, A. (2020). Discovering statistics using IBM SPSS statistics (5th ed.). SAGE.
Früh, M., Keimer, I., & Blankenagel, M. (2019). The impact of Balanced Scorecard excellence on shareholder returns. IFZ Working Paper No. 0003/2019. https://zenodo.org/record/2571603#.YMDUafkzZaQ . Accessed: 9 June 2021.
Pearl, J., & Mackenzie, D. (2018). The book of why: The new science of cause and effect. Basic Books.
Yin, R. K. (2013). Case study research: Design and methods (5th ed.). SAGE.
Download references
Author information
Authors and affiliations.
Wirtschaft/IFZ, Campus Zug-Rotkreuz, Hochschule Luzern, Zug-Rotkreuz, Zug, Switzerland
Stefan Hunziker & Michael Blankenagel
You can also search for this author in PubMed Google Scholar
Corresponding author
Correspondence to Stefan Hunziker .
Rights and permissions
Reprints and permissions
Copyright information
© 2024 Springer Fachmedien Wiesbaden GmbH, part of Springer Nature
About this chapter
Hunziker, S., Blankenagel, M. (2024). Writing up a Research Report. In: Research Design in Business and Management. Springer Gabler, Wiesbaden. https://doi.org/10.1007/978-3-658-42739-9_4
Download citation
DOI : https://doi.org/10.1007/978-3-658-42739-9_4
Published : 04 January 2024
Publisher Name : Springer Gabler, Wiesbaden
Print ISBN : 978-3-658-42738-2
Online ISBN : 978-3-658-42739-9
eBook Packages : Business and Management Business and Management (R0)
Share this chapter
Anyone you share the following link with will be able to read this content:
Sorry, a shareable link is not currently available for this article.
Provided by the Springer Nature SharedIt content-sharing initiative
- Publish with us
Policies and ethics
- Find a journal
- Track your research
Want to create or adapt books like this? Learn more about how Pressbooks supports open publishing practices.
11.2 Writing a Research Report in American Psychological Association (APA) Style
Learning objectives.
- Identify the major sections of an APA-style research report and the basic contents of each section.
- Plan and write an effective APA-style research report.
In this section, we look at how to write an APA-style empirical research report , an article that presents the results of one or more new studies. Recall that the standard sections of an empirical research report provide a kind of outline. Here we consider each of these sections in detail, including what information it contains, how that information is formatted and organized, and tips for writing each section. At the end of this section is a sample APA-style research report that illustrates many of these principles.
Sections of a Research Report
Title page and abstract.
An APA-style research report begins with a title page . The title is centered in the upper half of the page, with each important word capitalized. The title should clearly and concisely (in about 12 words or fewer) communicate the primary variables and research questions. This sometimes requires a main title followed by a subtitle that elaborates on the main title, in which case the main title and subtitle are separated by a colon. Here are some titles from recent issues of professional journals published by the American Psychological Association.
- Sex Differences in Coping Styles and Implications for Depressed Mood
- Effects of Aging and Divided Attention on Memory for Items and Their Contexts
- Computer-Assisted Cognitive Behavioral Therapy for Child Anxiety: Results of a Randomized Clinical Trial
- Virtual Driving and Risk Taking: Do Racing Games Increase Risk-Taking Cognitions, Affect, and Behavior?
Below the title are the authors’ names and, on the next line, their institutional affiliation—the university or other institution where the authors worked when they conducted the research. As we have already seen, the authors are listed in an order that reflects their contribution to the research. When multiple authors have made equal contributions to the research, they often list their names alphabetically or in a randomly determined order.
It’s Soooo Cute!
How Informal Should an Article Title Be?
In some areas of psychology, the titles of many empirical research reports are informal in a way that is perhaps best described as “cute.” They usually take the form of a play on words or a well-known expression that relates to the topic under study. Here are some examples from recent issues of the Journal of Personality and Social Psychology .
- “Let’s Get Serious: Communicating Commitment in Romantic Relationships”
- “Through the Looking Glass Clearly: Accuracy and Assumed Similarity in Well-Adjusted Individuals’ First Impressions”
- “Don’t Hide Your Happiness! Positive Emotion Dissociation, Social Connectedness, and Psychological Functioning”
- “Forbidden Fruit: Inattention to Attractive Alternatives Provokes Implicit Relationship Reactance”
Individual researchers differ quite a bit in their preference for such titles. Some use them regularly, while others never use them. What might be some of the pros and cons of using cute article titles?
For articles that are being submitted for publication, the title page also includes an author note that lists the authors’ full institutional affiliations, any acknowledgments the authors wish to make to agencies that funded the research or to colleagues who commented on it, and contact information for the authors. For student papers that are not being submitted for publication—including theses—author notes are generally not necessary.
The abstract is a summary of the study. It is the second page of the manuscript and is headed with the word Abstract . The first line is not indented. The abstract presents the research question, a summary of the method, the basic results, and the most important conclusions. Because the abstract is usually limited to about 200 words, it can be a challenge to write a good one.
Introduction
The introduction begins on the third page of the manuscript. The heading at the top of this page is the full title of the manuscript, with each important word capitalized as on the title page. The introduction includes three distinct subsections, although these are typically not identified by separate headings. The opening introduces the research question and explains why it is interesting, the literature review discusses relevant previous research, and the closing restates the research question and comments on the method used to answer it.
The Opening
The opening , which is usually a paragraph or two in length, introduces the research question and explains why it is interesting. To capture the reader’s attention, researcher Daryl Bem recommends starting with general observations about the topic under study, expressed in ordinary language (not technical jargon)—observations that are about people and their behavior (not about researchers or their research; Bem, 2003). Concrete examples are often very useful here. According to Bem, this would be a poor way to begin a research report:
Festinger’s theory of cognitive dissonance received a great deal of attention during the latter part of the 20th century (p. 191)
The following would be much better:
The individual who holds two beliefs that are inconsistent with one another may feel uncomfortable. For example, the person who knows that he or she enjoys smoking but believes it to be unhealthy may experience discomfort arising from the inconsistency or disharmony between these two thoughts or cognitions. This feeling of discomfort was called cognitive dissonance by social psychologist Leon Festinger (1957), who suggested that individuals will be motivated to remove this dissonance in whatever way they can (p. 191).
After capturing the reader’s attention, the opening should go on to introduce the research question and explain why it is interesting. Will the answer fill a gap in the literature? Will it provide a test of an important theory? Does it have practical implications? Giving readers a clear sense of what the research is about and why they should care about it will motivate them to continue reading the literature review—and will help them make sense of it.
Breaking the Rules
Researcher Larry Jacoby reported several studies showing that a word that people see or hear repeatedly can seem more familiar even when they do not recall the repetitions—and that this tendency is especially pronounced among older adults. He opened his article with the following humorous anecdote (Jacoby, 1999).
A friend whose mother is suffering symptoms of Alzheimer’s disease (AD) tells the story of taking her mother to visit a nursing home, preliminary to her mother’s moving there. During an orientation meeting at the nursing home, the rules and regulations were explained, one of which regarded the dining room. The dining room was described as similar to a fine restaurant except that tipping was not required. The absence of tipping was a central theme in the orientation lecture, mentioned frequently to emphasize the quality of care along with the advantages of having paid in advance. At the end of the meeting, the friend’s mother was asked whether she had any questions. She replied that she only had one question: “Should I tip?” (p. 3).
Although both humor and personal anecdotes are generally discouraged in APA-style writing, this example is a highly effective way to start because it both engages the reader and provides an excellent real-world example of the topic under study.
The Literature Review
Immediately after the opening comes the literature review , which describes relevant previous research on the topic and can be anywhere from several paragraphs to several pages in length. However, the literature review is not simply a list of past studies. Instead, it constitutes a kind of argument for why the research question is worth addressing. By the end of the literature review, readers should be convinced that the research question makes sense and that the present study is a logical next step in the ongoing research process.
Like any effective argument, the literature review must have some kind of structure. For example, it might begin by describing a phenomenon in a general way along with several studies that demonstrate it, then describing two or more competing theories of the phenomenon, and finally presenting a hypothesis to test one or more of the theories. Or it might describe one phenomenon, then describe another phenomenon that seems inconsistent with the first one, then propose a theory that resolves the inconsistency, and finally present a hypothesis to test that theory. In applied research, it might describe a phenomenon or theory, then describe how that phenomenon or theory applies to some important real-world situation, and finally suggest a way to test whether it does, in fact, apply to that situation.
Looking at the literature review in this way emphasizes a few things. First, it is extremely important to start with an outline of the main points that you want to make, organized in the order that you want to make them. The basic structure of your argument, then, should be apparent from the outline itself. Second, it is important to emphasize the structure of your argument in your writing. One way to do this is to begin the literature review by summarizing your argument even before you begin to make it. “In this article, I will describe two apparently contradictory phenomena, present a new theory that has the potential to resolve the apparent contradiction, and finally present a novel hypothesis to test the theory.” Another way is to open each paragraph with a sentence that summarizes the main point of the paragraph and links it to the preceding points. These opening sentences provide the “transitions” that many beginning researchers have difficulty with. Instead of beginning a paragraph by launching into a description of a previous study, such as “Williams (2004) found that…,” it is better to start by indicating something about why you are describing this particular study. Here are some simple examples:
Another example of this phenomenon comes from the work of Williams (2004).
Williams (2004) offers one explanation of this phenomenon.
An alternative perspective has been provided by Williams (2004).
We used a method based on the one used by Williams (2004).
Finally, remember that your goal is to construct an argument for why your research question is interesting and worth addressing—not necessarily why your favorite answer to it is correct. In other words, your literature review must be balanced. If you want to emphasize the generality of a phenomenon, then of course you should discuss various studies that have demonstrated it. However, if there are other studies that have failed to demonstrate it, you should discuss them too. Or if you are proposing a new theory, then of course you should discuss findings that are consistent with that theory. However, if there are other findings that are inconsistent with it, again, you should discuss them too. It is acceptable to argue that the balance of the research supports the existence of a phenomenon or is consistent with a theory (and that is usually the best that researchers in psychology can hope for), but it is not acceptable to ignore contradictory evidence. Besides, a large part of what makes a research question interesting is uncertainty about its answer.
The Closing
The closing of the introduction—typically the final paragraph or two—usually includes two important elements. The first is a clear statement of the main research question or hypothesis. This statement tends to be more formal and precise than in the opening and is often expressed in terms of operational definitions of the key variables. The second is a brief overview of the method and some comment on its appropriateness. Here, for example, is how Darley and Latané (1968) concluded the introduction to their classic article on the bystander effect:
These considerations lead to the hypothesis that the more bystanders to an emergency, the less likely, or the more slowly, any one bystander will intervene to provide aid. To test this proposition it would be necessary to create a situation in which a realistic “emergency” could plausibly occur. Each subject should also be blocked from communicating with others to prevent his getting information about their behavior during the emergency. Finally, the experimental situation should allow for the assessment of the speed and frequency of the subjects’ reaction to the emergency. The experiment reported below attempted to fulfill these conditions (p. 378).
Thus the introduction leads smoothly into the next major section of the article—the method section.
The method section is where you describe how you conducted your study. An important principle for writing a method section is that it should be clear and detailed enough that other researchers could replicate the study by following your “recipe.” This means that it must describe all the important elements of the study—basic demographic characteristics of the participants, how they were recruited, whether they were randomly assigned, how the variables were manipulated or measured, how counterbalancing was accomplished, and so on. At the same time, it should avoid irrelevant details such as the fact that the study was conducted in Classroom 37B of the Industrial Technology Building or that the questionnaire was double-sided and completed using pencils.
The method section begins immediately after the introduction ends with the heading “Method” (not “Methods”) centered on the page. Immediately after this is the subheading “Participants,” left justified and in italics. The participants subsection indicates how many participants there were, the number of women and men, some indication of their age, other demographics that may be relevant to the study, and how they were recruited, including any incentives given for participation.
Figure 11.1 Three Ways of Organizing an APA-Style Method
After the participants section, the structure can vary a bit. Figure 11.1 “Three Ways of Organizing an APA-Style Method” shows three common approaches. In the first, the participants section is followed by a design and procedure subsection, which describes the rest of the method. This works well for methods that are relatively simple and can be described adequately in a few paragraphs. In the second approach, the participants section is followed by separate design and procedure subsections. This works well when both the design and the procedure are relatively complicated and each requires multiple paragraphs.
What is the difference between design and procedure? The design of a study is its overall structure. What were the independent and dependent variables? Was the independent variable manipulated, and if so, was it manipulated between or within subjects? How were the variables operationally defined? The procedure is how the study was carried out. It often works well to describe the procedure in terms of what the participants did rather than what the researchers did. For example, the participants gave their informed consent, read a set of instructions, completed a block of four practice trials, completed a block of 20 test trials, completed two questionnaires, and were debriefed and excused.
In the third basic way to organize a method section, the participants subsection is followed by a materials subsection before the design and procedure subsections. This works well when there are complicated materials to describe. This might mean multiple questionnaires, written vignettes that participants read and respond to, perceptual stimuli, and so on. The heading of this subsection can be modified to reflect its content. Instead of “Materials,” it can be “Questionnaires,” “Stimuli,” and so on.
The results section is where you present the main results of the study, including the results of the statistical analyses. Although it does not include the raw data—individual participants’ responses or scores—researchers should save their raw data and make them available to other researchers who request them. Some journals now make the raw data available online.
Although there are no standard subsections, it is still important for the results section to be logically organized. Typically it begins with certain preliminary issues. One is whether any participants or responses were excluded from the analyses and why. The rationale for excluding data should be described clearly so that other researchers can decide whether it is appropriate. A second preliminary issue is how multiple responses were combined to produce the primary variables in the analyses. For example, if participants rated the attractiveness of 20 stimulus people, you might have to explain that you began by computing the mean attractiveness rating for each participant. Or if they recalled as many items as they could from study list of 20 words, did you count the number correctly recalled, compute the percentage correctly recalled, or perhaps compute the number correct minus the number incorrect? A third preliminary issue is the reliability of the measures. This is where you would present test-retest correlations, Cronbach’s α, or other statistics to show that the measures are consistent across time and across items. A final preliminary issue is whether the manipulation was successful. This is where you would report the results of any manipulation checks.
The results section should then tackle the primary research questions, one at a time. Again, there should be a clear organization. One approach would be to answer the most general questions and then proceed to answer more specific ones. Another would be to answer the main question first and then to answer secondary ones. Regardless, Bem (2003) suggests the following basic structure for discussing each new result:
- Remind the reader of the research question.
- Give the answer to the research question in words.
- Present the relevant statistics.
- Qualify the answer if necessary.
- Summarize the result.
Notice that only Step 3 necessarily involves numbers. The rest of the steps involve presenting the research question and the answer to it in words. In fact, the basic results should be clear even to a reader who skips over the numbers.
The discussion is the last major section of the research report. Discussions usually consist of some combination of the following elements:
- Summary of the research
- Theoretical implications
- Practical implications
- Limitations
- Suggestions for future research
The discussion typically begins with a summary of the study that provides a clear answer to the research question. In a short report with a single study, this might require no more than a sentence. In a longer report with multiple studies, it might require a paragraph or even two. The summary is often followed by a discussion of the theoretical implications of the research. Do the results provide support for any existing theories? If not, how can they be explained? Although you do not have to provide a definitive explanation or detailed theory for your results, you at least need to outline one or more possible explanations. In applied research—and often in basic research—there is also some discussion of the practical implications of the research. How can the results be used, and by whom, to accomplish some real-world goal?
The theoretical and practical implications are often followed by a discussion of the study’s limitations. Perhaps there are problems with its internal or external validity. Perhaps the manipulation was not very effective or the measures not very reliable. Perhaps there is some evidence that participants did not fully understand their task or that they were suspicious of the intent of the researchers. Now is the time to discuss these issues and how they might have affected the results. But do not overdo it. All studies have limitations, and most readers will understand that a different sample or different measures might have produced different results. Unless there is good reason to think they would have, however, there is no reason to mention these routine issues. Instead, pick two or three limitations that seem like they could have influenced the results, explain how they could have influenced the results, and suggest ways to deal with them.
Most discussions end with some suggestions for future research. If the study did not satisfactorily answer the original research question, what will it take to do so? What new research questions has the study raised? This part of the discussion, however, is not just a list of new questions. It is a discussion of two or three of the most important unresolved issues. This means identifying and clarifying each question, suggesting some alternative answers, and even suggesting ways they could be studied.
Finally, some researchers are quite good at ending their articles with a sweeping or thought-provoking conclusion. Darley and Latané (1968), for example, ended their article on the bystander effect by discussing the idea that whether people help others may depend more on the situation than on their personalities. Their final sentence is, “If people understand the situational forces that can make them hesitate to intervene, they may better overcome them” (p. 383). However, this kind of ending can be difficult to pull off. It can sound overreaching or just banal and end up detracting from the overall impact of the article. It is often better simply to end when you have made your final point (although you should avoid ending on a limitation).
The references section begins on a new page with the heading “References” centered at the top of the page. All references cited in the text are then listed in the format presented earlier. They are listed alphabetically by the last name of the first author. If two sources have the same first author, they are listed alphabetically by the last name of the second author. If all the authors are the same, then they are listed chronologically by the year of publication. Everything in the reference list is double-spaced both within and between references.
Appendixes, Tables, and Figures
Appendixes, tables, and figures come after the references. An appendix is appropriate for supplemental material that would interrupt the flow of the research report if it were presented within any of the major sections. An appendix could be used to present lists of stimulus words, questionnaire items, detailed descriptions of special equipment or unusual statistical analyses, or references to the studies that are included in a meta-analysis. Each appendix begins on a new page. If there is only one, the heading is “Appendix,” centered at the top of the page. If there is more than one, the headings are “Appendix A,” “Appendix B,” and so on, and they appear in the order they were first mentioned in the text of the report.
After any appendixes come tables and then figures. Tables and figures are both used to present results. Figures can also be used to illustrate theories (e.g., in the form of a flowchart), display stimuli, outline procedures, and present many other kinds of information. Each table and figure appears on its own page. Tables are numbered in the order that they are first mentioned in the text (“Table 1,” “Table 2,” and so on). Figures are numbered the same way (“Figure 1,” “Figure 2,” and so on). A brief explanatory title, with the important words capitalized, appears above each table. Each figure is given a brief explanatory caption, where (aside from proper nouns or names) only the first word of each sentence is capitalized. More details on preparing APA-style tables and figures are presented later in the book.
Sample APA-Style Research Report
Figure 11.2 “Title Page and Abstract” , Figure 11.3 “Introduction and Method” , Figure 11.4 “Results and Discussion” , and Figure 11.5 “References and Figure” show some sample pages from an APA-style empirical research report originally written by undergraduate student Tomoe Suyama at California State University, Fresno. The main purpose of these figures is to illustrate the basic organization and formatting of an APA-style empirical research report, although many high-level and low-level style conventions can be seen here too.
Figure 11.2 Title Page and Abstract

This student paper does not include the author note on the title page. The abstract appears on its own page.
Figure 11.3 Introduction and Method

Note that the introduction is headed with the full title, and the method section begins immediately after the introduction ends.
Figure 11.4 Results and Discussion

The discussion begins immediately after the results section ends.
Figure 11.5 References and Figure

If there were appendixes or tables, they would come before the figure.
Key Takeaways
- An APA-style empirical research report consists of several standard sections. The main ones are the abstract, introduction, method, results, discussion, and references.
- The introduction consists of an opening that presents the research question, a literature review that describes previous research on the topic, and a closing that restates the research question and comments on the method. The literature review constitutes an argument for why the current study is worth doing.
- The method section describes the method in enough detail that another researcher could replicate the study. At a minimum, it consists of a participants subsection and a design and procedure subsection.
- The results section describes the results in an organized fashion. Each primary result is presented in terms of statistical results but also explained in words.
- The discussion typically summarizes the study, discusses theoretical and practical implications and limitations of the study, and offers suggestions for further research.
- Practice: Look through an issue of a general interest professional journal (e.g., Psychological Science ). Read the opening of the first five articles and rate the effectiveness of each one from 1 ( very ineffective ) to 5 ( very effective ). Write a sentence or two explaining each rating.
- Practice: Find a recent article in a professional journal and identify where the opening, literature review, and closing of the introduction begin and end.
- Practice: Find a recent article in a professional journal and highlight in a different color each of the following elements in the discussion: summary, theoretical implications, practical implications, limitations, and suggestions for future research.
Bem, D. J. (2003). Writing the empirical journal article. In J. M. Darley, M. P. Zanna, & H. R. Roediger III (Eds.), The compleat academic: A practical guide for the beginning social scientist (2nd ed.). Washington, DC: American Psychological Association.
Darley, J. M., & Latané, B. (1968). Bystander intervention in emergencies: Diffusion of responsibility. Journal of Personality and Social Psychology, 4 , 377–383.
Research Methods in Psychology Copyright © 2016 by University of Minnesota is licensed under a Creative Commons Attribution-NonCommercial-ShareAlike 4.0 International License , except where otherwise noted.
When you choose to publish with PLOS, your research makes an impact. Make your work accessible to all, without restrictions, and accelerate scientific discovery with options like preprints and published peer review that make your work more Open.
- PLOS Biology
- PLOS Climate
- PLOS Complex Systems
- PLOS Computational Biology
- PLOS Digital Health
- PLOS Genetics
- PLOS Global Public Health
- PLOS Medicine
- PLOS Mental Health
- PLOS Neglected Tropical Diseases
- PLOS Pathogens
- PLOS Sustainability and Transformation
- PLOS Collections
- How to Write Your Methods

Ensure understanding, reproducibility and replicability
What should you include in your methods section, and how much detail is appropriate?
Why Methods Matter
The methods section was once the most likely part of a paper to be unfairly abbreviated, overly summarized, or even relegated to hard-to-find sections of a publisher’s website. While some journals may responsibly include more detailed elements of methods in supplementary sections, the movement for increased reproducibility and rigor in science has reinstated the importance of the methods section. Methods are now viewed as a key element in establishing the credibility of the research being reported, alongside the open availability of data and results.
A clear methods section impacts editorial evaluation and readers’ understanding, and is also the backbone of transparency and replicability.
For example, the Reproducibility Project: Cancer Biology project set out in 2013 to replicate experiments from 50 high profile cancer papers, but revised their target to 18 papers once they understood how much methodological detail was not contained in the original papers.
What to include in your methods section
What you include in your methods sections depends on what field you are in and what experiments you are performing. However, the general principle in place at the majority of journals is summarized well by the guidelines at PLOS ONE : “The Materials and Methods section should provide enough detail to allow suitably skilled investigators to fully replicate your study. ” The emphases here are deliberate: the methods should enable readers to understand your paper, and replicate your study. However, there is no need to go into the level of detail that a lay-person would require—the focus is on the reader who is also trained in your field, with the suitable skills and knowledge to attempt a replication.
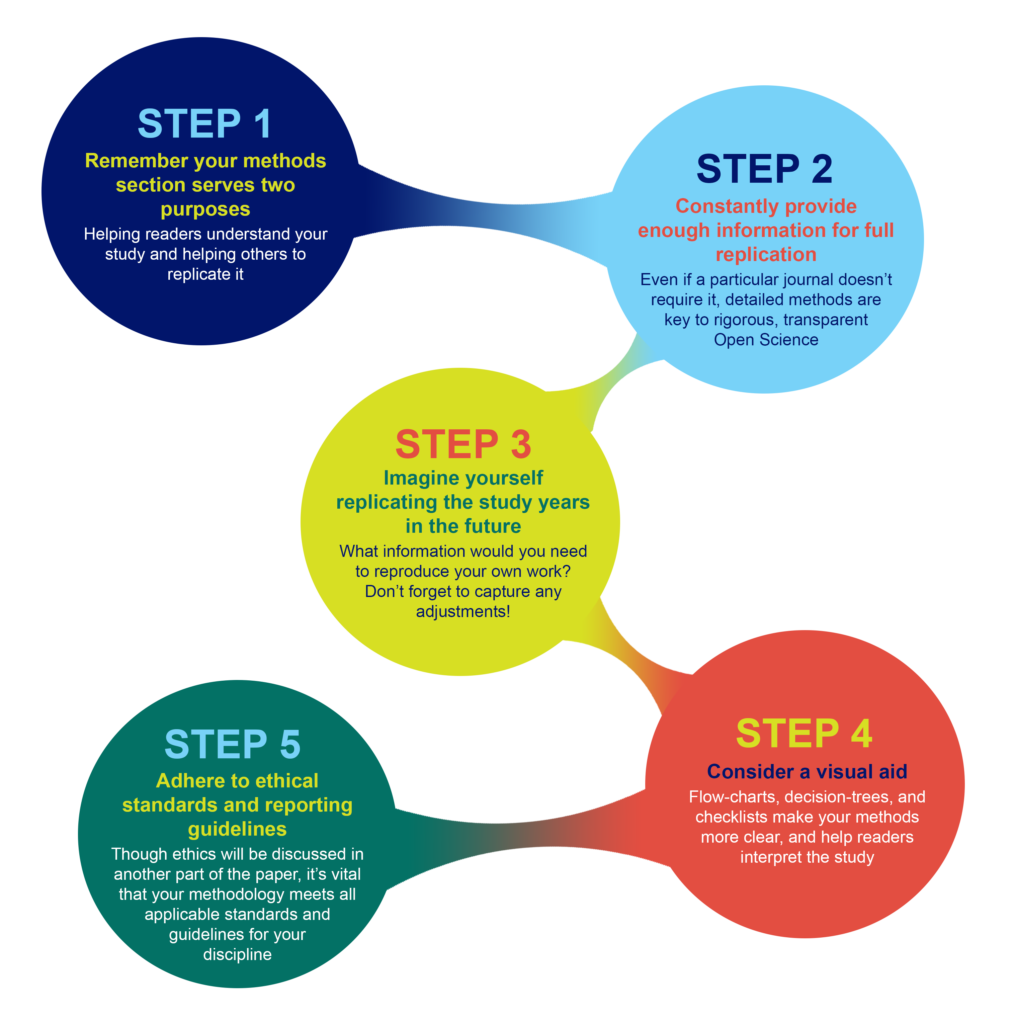
A constant principle of rigorous science
A methods section that enables other researchers to understand and replicate your results is a constant principle of rigorous, transparent, and Open Science. Aim to be thorough, even if a particular journal doesn’t require the same level of detail . Reproducibility is all of our responsibility. You cannot create any problems by exceeding a minimum standard of information. If a journal still has word-limits—either for the overall article or specific sections—and requires some methodological details to be in a supplemental section, that is OK as long as the extra details are searchable and findable .
Imagine replicating your own work, years in the future
As part of PLOS’ presentation on Reproducibility and Open Publishing (part of UCSF’s Reproducibility Series ) we recommend planning the level of detail in your methods section by imagining you are writing for your future self, replicating your own work. When you consider that you might be at a different institution, with different account logins, applications, resources, and access levels—you can help yourself imagine the level of specificity that you yourself would require to redo the exact experiment. Consider:
- Which details would you need to be reminded of?
- Which cell line, or antibody, or software, or reagent did you use, and does it have a Research Resource ID (RRID) that you can cite?
- Which version of a questionnaire did you use in your survey?
- Exactly which visual stimulus did you show participants, and is it publicly available?
- What participants did you decide to exclude?
- What process did you adjust, during your work?
Tip: Be sure to capture any changes to your protocols
You yourself would want to know about any adjustments, if you ever replicate the work, so you can surmise that anyone else would want to as well. Even if a necessary adjustment you made was not ideal, transparency is the key to ensuring this is not regarded as an issue in the future. It is far better to transparently convey any non-optimal methods, or methodological constraints, than to conceal them, which could result in reproducibility or ethical issues downstream.
Visual aids for methods help when reading the whole paper
Consider whether a visual representation of your methods could be appropriate or aid understanding your process. A visual reference readers can easily return to, like a flow-diagram, decision-tree, or checklist, can help readers to better understand the complete article, not just the methods section.
Ethical Considerations
In addition to describing what you did, it is just as important to assure readers that you also followed all relevant ethical guidelines when conducting your research. While ethical standards and reporting guidelines are often presented in a separate section of a paper, ensure that your methods and protocols actually follow these guidelines. Read more about ethics .
Existing standards, checklists, guidelines, partners
While the level of detail contained in a methods section should be guided by the universal principles of rigorous science outlined above, various disciplines, fields, and projects have worked hard to design and develop consistent standards, guidelines, and tools to help with reporting all types of experiment. Below, you’ll find some of the key initiatives. Ensure you read the submission guidelines for the specific journal you are submitting to, in order to discover any further journal- or field-specific policies to follow, or initiatives/tools to utilize.
Tip: Keep your paper moving forward by providing the proper paperwork up front
Be sure to check the journal guidelines and provide the necessary documents with your manuscript submission. Collecting the necessary documentation can greatly slow the first round of peer review, or cause delays when you submit your revision.
Randomized Controlled Trials – CONSORT The Consolidated Standards of Reporting Trials (CONSORT) project covers various initiatives intended to prevent the problems of inadequate reporting of randomized controlled trials. The primary initiative is an evidence-based minimum set of recommendations for reporting randomized trials known as the CONSORT Statement .
Systematic Reviews and Meta-Analyses – PRISMA The Preferred Reporting Items for Systematic Reviews and Meta-Analyses ( PRISMA ) is an evidence-based minimum set of items focusing on the reporting of reviews evaluating randomized trials and other types of research.
Research using Animals – ARRIVE The Animal Research: Reporting of In Vivo Experiments ( ARRIVE ) guidelines encourage maximizing the information reported in research using animals thereby minimizing unnecessary studies. (Original study and proposal , and updated guidelines , in PLOS Biology .)
Laboratory Protocols Protocols.io has developed a platform specifically for the sharing and updating of laboratory protocols , which are assigned their own DOI and can be linked from methods sections of papers to enhance reproducibility. Contextualize your protocol and improve discovery with an accompanying Lab Protocol article in PLOS ONE .
Consistent reporting of Materials, Design, and Analysis – the MDAR checklist A cross-publisher group of editors and experts have developed, tested, and rolled out a checklist to help establish and harmonize reporting standards in the Life Sciences . The checklist , which is available for use by authors to compile their methods, and editors/reviewers to check methods, establishes a minimum set of requirements in transparent reporting and is adaptable to any discipline within the Life Sciences, by covering a breadth of potentially relevant methodological items and considerations. If you are in the Life Sciences and writing up your methods section, try working through the MDAR checklist and see whether it helps you include all relevant details into your methods, and whether it reminded you of anything you might have missed otherwise.
Summary Writing tips
The main challenge you may find when writing your methods is keeping it readable AND covering all the details needed for reproducibility and replicability. While this is difficult, do not compromise on rigorous standards for credibility!

- Keep in mind future replicability, alongside understanding and readability.
- Follow checklists, and field- and journal-specific guidelines.
- Consider a commitment to rigorous and transparent science a personal responsibility, and not just adhering to journal guidelines.
- Establish whether there are persistent identifiers for any research resources you use that can be specifically cited in your methods section.
- Deposit your laboratory protocols in Protocols.io, establishing a permanent link to them. You can update your protocols later if you improve on them, as can future scientists who follow your protocols.
- Consider visual aids like flow-diagrams, lists, to help with reading other sections of the paper.
- Be specific about all decisions made during the experiments that someone reproducing your work would need to know.

Don’t
- Summarize or abbreviate methods without giving full details in a discoverable supplemental section.
- Presume you will always be able to remember how you performed the experiments, or have access to private or institutional notebooks and resources.
- Attempt to hide constraints or non-optimal decisions you had to make–transparency is the key to ensuring the credibility of your research.
- How to Write a Great Title
- How to Write an Abstract
- How to Report Statistics
- How to Write Discussions and Conclusions
- How to Edit Your Work
The contents of the Peer Review Center are also available as a live, interactive training session, complete with slides, talking points, and activities. …
The contents of the Writing Center are also available as a live, interactive training session, complete with slides, talking points, and activities. …
There’s a lot to consider when deciding where to submit your work. Learn how to choose a journal that will help your study reach its audience, while reflecting your values as a researcher…
- RMIT Australia
- RMIT Europe
- RMIT Vietnam
- RMIT Global
- RMIT Online
- Alumni & Giving
- What will I do?
- What will I need?
- Who will help me?
- About the institution
- New to university?
- Studying efficiently
- Time management
- Mind mapping
- Note-taking
- Reading skills
- Argument analysis
- Preparing for assessment
- Critical thinking and argument analysis
- Online learning skills
- Starting my first assignment
- Researching your assignment
- What is referencing?
- Understanding citations
- When referencing isn't needed
- Paraphrasing
- Summarising
- Synthesising
- Integrating ideas with reporting words
- Referencing with Easy Cite
- Getting help with referencing
- Acting with academic integrity
- Artificial intelligence tools
- Understanding your audience
- Writing for coursework
- Literature review
- Academic style
- Writing for the workplace
- Spelling tips
- Writing paragraphs
- Writing sentences
- Academic word lists
- Annotated bibliographies
- Artist statement
- Case studies
- Creating effective poster presentations
- Essays, Reports, Reflective Writing
- Law assessments
- Oral presentations
- Reflective writing
- Art and design
- Critical thinking
- Maths and statistics
- Sustainability
- Educators' guide
- Learning Lab content in context
- Latest updates
- Students Alumni & Giving Staff Library
Learning Lab
Getting started at uni, study skills, referencing.
- When referencing isn't needed
- Integrating ideas
Writing and assessments
- Critical reading
- Poster presentations
- Postgraduate report writing
Subject areas
For educators.
- Educators' guide
- Methodology section in a report
Method/Methodology
The method section of a report details how the research was conducted, the research methods used and the reasons for choosing those methods. It should outline:
- the participants and research methods used, e.g. surveys/questionnaire, interviews
- refer to other relevant studies.
The methodology is a step-by-step explanation of the research process. It should be factual and is mainly written in the past tense.
Sample Methodology
The research used a quantitative methodology based on the approach advocated by Williams (2009). This study was conducted by questionnaire and investigated university teaching staff attitudes to the use of mobile phones in tutorials (see Appendix 1). The questionnaire used Likert scales to assess social attitudes (Jones 2007) to student mobile phone use and provided open-ended responses for additional comments. The survey was voluntary and anonymous. A total of 412 questionnaires were distributed online to randomly selected staff from each of the three colleges within the university. The completed questionnaires were returned by email.
- 'Describe' is short for: describing how the research was done.
- 'Refers' is short for: refers to relevant reading/literature.
[Describe: The research used a quantitative methodology based on the approach advocated by Williams (2009).] [Refer: This study was conducted by questionnaire and investigated university teaching staff attitudes to the use of mobile phones in tutorials (see Appendix 1). The questionnaire used Likert scales to assess social attitudes (Jones 2007) to student mobile phone use and provided open-ended responses for additional comments.] [Describes: The survey was voluntary and anonymous. A total of 412 questionnaires were distributed online to randomly selected staff from each of the three colleges within the university. The completed questionnaires were returned by email.]
- Overall structure of a report
- Example of a report
- Report checklist
- Writing a business research report
Still can't find what you need?
The RMIT University Library provides study support , one-on-one consultations and peer mentoring to RMIT students.
- Facebook (opens in a new window)
- Twitter (opens in a new window)
- Instagram (opens in a new window)
- Linkedin (opens in a new window)
- YouTube (opens in a new window)
- Weibo (opens in a new window)
- Copyright © 2024 RMIT University |
- Accessibility |
- Learning Lab feedback |
- Complaints |
- ABN 49 781 030 034 |
- CRICOS provider number: 00122A |
- RTO Code: 3046 |
- Open Universities Australia
Research report guide: Definition, types, and tips
Last updated
5 March 2024
Reviewed by
From successful product launches or software releases to planning major business decisions, research reports serve many vital functions. They can summarize evidence and deliver insights and recommendations to save companies time and resources. They can reveal the most value-adding actions a company should take.
However, poorly constructed reports can have the opposite effect! Taking the time to learn established research-reporting rules and approaches will equip you with in-demand skills. You’ll be able to capture and communicate information applicable to numerous situations and industries, adding another string to your resume bow.
- What are research reports?
A research report is a collection of contextual data, gathered through organized research, that provides new insights into a particular challenge (which, for this article, is business-related). Research reports are a time-tested method for distilling large amounts of data into a narrow band of focus.
Their effectiveness often hinges on whether the report provides:
Strong, well-researched evidence
Comprehensive analysis
Well-considered conclusions and recommendations
Though the topic possibilities are endless, an effective research report keeps a laser-like focus on the specific questions or objectives the researcher believes are key to achieving success. Many research reports begin as research proposals, which usually include the need for a report to capture the findings of the study and recommend a course of action.
A description of the research method used, e.g., qualitative, quantitative, or other
Statistical analysis
Causal (or explanatory) research (i.e., research identifying relationships between two variables)
Inductive research, also known as ‘theory-building’
Deductive research, such as that used to test theories
Action research, where the research is actively used to drive change
- Importance of a research report
Research reports can unify and direct a company's focus toward the most appropriate strategic action. Of course, spending resources on a report takes up some of the company's human and financial resources. Choosing when a report is called for is a matter of judgment and experience.
Some development models used heavily in the engineering world, such as Waterfall development, are notorious for over-relying on research reports. With Waterfall development, there is a linear progression through each step of a project, and each stage is precisely documented and reported on before moving to the next.
The pace of the business world is faster than the speed at which your authors can produce and disseminate reports. So how do companies strike the right balance between creating and acting on research reports?
The answer lies, again, in the report's defined objectives. By paring down your most pressing interests and those of your stakeholders, your research and reporting skills will be the lenses that keep your company's priorities in constant focus.
Honing your company's primary objectives can save significant amounts of time and align research and reporting efforts with ever-greater precision.
Some examples of well-designed research objectives are:
Proving whether or not a product or service meets customer expectations
Demonstrating the value of a service, product, or business process to your stakeholders and investors
Improving business decision-making when faced with a lack of time or other constraints
Clarifying the relationship between a critical cause and effect for problematic business processes
Prioritizing the development of a backlog of products or product features
Comparing business or production strategies
Evaluating past decisions and predicting future outcomes
- Features of a research report
Research reports generally require a research design phase, where the report author(s) determine the most important elements the report must contain.
Just as there are various kinds of research, there are many types of reports.
Here are the standard elements of almost any research-reporting format:
Report summary. A broad but comprehensive overview of what readers will learn in the full report. Summaries are usually no more than one or two paragraphs and address all key elements of the report. Think of the key takeaways your primary stakeholders will want to know if they don’t have time to read the full document.
Introduction. Include a brief background of the topic, the type of research, and the research sample. Consider the primary goal of the report, who is most affected, and how far along the company is in meeting its objectives.
Methods. A description of how the researcher carried out data collection, analysis, and final interpretations of the data. Include the reasons for choosing a particular method. The methods section should strike a balance between clearly presenting the approach taken to gather data and discussing how it is designed to achieve the report's objectives.
Data analysis. This section contains interpretations that lead readers through the results relevant to the report's thesis. If there were unexpected results, include here a discussion on why that might be. Charts, calculations, statistics, and other supporting information also belong here (or, if lengthy, as an appendix). This should be the most detailed section of the research report, with references for further study. Present the information in a logical order, whether chronologically or in order of importance to the report's objectives.
Conclusion. This should be written with sound reasoning, often containing useful recommendations. The conclusion must be backed by a continuous thread of logic throughout the report.
- How to write a research paper
With a clear outline and robust pool of research, a research paper can start to write itself, but what's a good way to start a research report?
Research report examples are often the quickest way to gain inspiration for your report. Look for the types of research reports most relevant to your industry and consider which makes the most sense for your data and goals.
The research report outline will help you organize the elements of your report. One of the most time-tested report outlines is the IMRaD structure:
Introduction
...and Discussion
Pay close attention to the most well-established research reporting format in your industry, and consider your tone and language from your audience's perspective. Learn the key terms inside and out; incorrect jargon could easily harm the perceived authority of your research paper.
Along with a foundation in high-quality research and razor-sharp analysis, the most effective research reports will also demonstrate well-developed:
Internal logic
Narrative flow
Conclusions and recommendations
Readability, striking a balance between simple phrasing and technical insight
How to gather research data for your report
The validity of research data is critical. Because the research phase usually occurs well before the writing phase, you normally have plenty of time to vet your data.
However, research reports could involve ongoing research, where report authors (sometimes the researchers themselves) write portions of the report alongside ongoing research.
One such research-report example would be an R&D department that knows its primary stakeholders are eager to learn about a lengthy work in progress and any potentially important outcomes.
However you choose to manage the research and reporting, your data must meet robust quality standards before you can rely on it. Vet any research with the following questions in mind:
Does it use statistically valid analysis methods?
Do the researchers clearly explain their research, analysis, and sampling methods?
Did the researchers provide any caveats or advice on how to interpret their data?
Have you gathered the data yourself or were you in close contact with those who did?
Is the source biased?
Usually, flawed research methods become more apparent the further you get through a research report.
It's perfectly natural for good research to raise new questions, but the reader should have no uncertainty about what the data represents. There should be no doubt about matters such as:
Whether the sampling or analysis methods were based on sound and consistent logic
What the research samples are and where they came from
The accuracy of any statistical functions or equations
Validation of testing and measuring processes
When does a report require design validation?
A robust design validation process is often a gold standard in highly technical research reports. Design validation ensures the objects of a study are measured accurately, which lends more weight to your report and makes it valuable to more specialized industries.
Product development and engineering projects are the most common research-report examples that typically involve a design validation process. Depending on the scope and complexity of your research, you might face additional steps to validate your data and research procedures.
If you’re including design validation in the report (or report proposal), explain and justify your data-collection processes. Good design validation builds greater trust in a research report and lends more weight to its conclusions.
Choosing the right analysis method
Just as the quality of your report depends on properly validated research, a useful conclusion requires the most contextually relevant analysis method. This means comparing different statistical methods and choosing the one that makes the most sense for your research.
Most broadly, research analysis comes down to quantitative or qualitative methods (respectively: measurable by a number vs subjectively qualified values). There are also mixed research methods, which bridge the need for merging hard data with qualified assessments and still reach a cohesive set of conclusions.
Some of the most common analysis methods in research reports include:
Significance testing (aka hypothesis analysis), which compares test and control groups to determine how likely the data was the result of random chance.
Regression analysis , to establish relationships between variables, control for extraneous variables , and support correlation analysis.
Correlation analysis (aka bivariate testing), a method to identify and determine the strength of linear relationships between variables. It’s effective for detecting patterns from complex data, but care must be exercised to not confuse correlation with causation.
With any analysis method, it's important to justify which method you chose in the report. You should also provide estimates of the statistical accuracy (e.g., the p-value or confidence level of quantifiable data) of any data analysis.
This requires a commitment to the report's primary aim. For instance, this may be achieving a certain level of customer satisfaction by analyzing the cause and effect of changes to how service is delivered. Even better, use statistical analysis to calculate which change is most positively correlated with improved levels of customer satisfaction.
- Tips for writing research reports
There's endless good advice for writing effective research reports, and it almost all depends on the subjective aims of the people behind the report. Due to the wide variety of research reports, the best tips will be unique to each author's purpose.
Consider the following research report tips in any order, and take note of the ones most relevant to you:
No matter how in depth or detailed your report might be, provide a well-considered, succinct summary. At the very least, give your readers a quick and effective way to get up to speed.
Pare down your target audience (e.g., other researchers, employees, laypersons, etc.), and adjust your voice for their background knowledge and interest levels
For all but the most open-ended research, clarify your objectives, both for yourself and within the report.
Leverage your team members’ talents to fill in any knowledge gaps you might have. Your team is only as good as the sum of its parts.
Justify why your research proposal’s topic will endure long enough to derive value from the finished report.
Consolidate all research and analysis functions onto a single user-friendly platform. There's no reason to settle for less than developer-grade tools suitable for non-developers.
What's the format of a research report?
The research-reporting format is how the report is structured—a framework the authors use to organize their data, conclusions, arguments, and recommendations. The format heavily determines how the report's outline develops, because the format dictates the overall structure and order of information (based on the report's goals and research objectives).
What's the purpose of a research-report outline?
A good report outline gives form and substance to the report's objectives, presenting the results in a readable, engaging way. For any research-report format, the outline should create momentum along a chain of logic that builds up to a conclusion or interpretation.
What's the difference between a research essay and a research report?
There are several key differences between research reports and essays:
Research report:
Ordered into separate sections
More commercial in nature
Often includes infographics
Heavily descriptive
More self-referential
Usually provides recommendations
Research essay
Does not rely on research report formatting
More academically minded
Normally text-only
Less detailed
Omits discussion of methods
Usually non-prescriptive
Should you be using a customer insights hub?
Do you want to discover previous research faster?
Do you share your research findings with others?
Do you analyze research data?
Start for free today, add your research, and get to key insights faster
Editor’s picks
Last updated: 11 January 2024
Last updated: 15 January 2024
Last updated: 17 January 2024
Last updated: 12 May 2023
Last updated: 30 April 2024
Last updated: 18 May 2023
Last updated: 25 November 2023
Last updated: 13 May 2024
Latest articles
Related topics, .css-je19u9{-webkit-align-items:flex-end;-webkit-box-align:flex-end;-ms-flex-align:flex-end;align-items:flex-end;display:-webkit-box;display:-webkit-flex;display:-ms-flexbox;display:flex;-webkit-flex-direction:row;-ms-flex-direction:row;flex-direction:row;-webkit-box-flex-wrap:wrap;-webkit-flex-wrap:wrap;-ms-flex-wrap:wrap;flex-wrap:wrap;-webkit-box-pack:center;-ms-flex-pack:center;-webkit-justify-content:center;justify-content:center;row-gap:0;text-align:center;max-width:671px;}@media (max-width: 1079px){.css-je19u9{max-width:400px;}.css-je19u9>span{white-space:pre;}}@media (max-width: 799px){.css-je19u9{max-width:400px;}.css-je19u9>span{white-space:pre;}} decide what to .css-1kiodld{max-height:56px;display:-webkit-box;display:-webkit-flex;display:-ms-flexbox;display:flex;-webkit-align-items:center;-webkit-box-align:center;-ms-flex-align:center;align-items:center;}@media (max-width: 1079px){.css-1kiodld{display:none;}} build next, decide what to build next.

Users report unexpectedly high data usage, especially during streaming sessions.

Users find it hard to navigate from the home page to relevant playlists in the app.

It would be great to have a sleep timer feature, especially for bedtime listening.

I need better filters to find the songs or artists I’m looking for.
Log in or sign up
Get started for free
- Academic Skills
- Reading, writing and referencing
Research reports
This resource will help you identify the common elements and basic format of a research report.
Research reports generally follow a similar structure and have common elements, each with a particular purpose. Learn more about each of these elements below.
Common elements of reports
Your title should be brief, topic-specific, and informative, clearly indicating the purpose and scope of your study. Include key words in your title so that search engines can easily access your work. For example: Measurement of water around Station Pier.
An abstract is a concise summary that helps readers to quickly assess the content and direction of your paper. It should be brief, written in a single paragraph and cover: the scope and purpose of your report; an overview of methodology; a summary of the main findings or results; principal conclusions or significance of the findings; and recommendations made.
The information in the abstract must be presented in the same order as it is in your report. The abstract is usually written last when you have developed your arguments and synthesised the results.
The introduction creates the context for your research. It should provide sufficient background to allow the reader to understand and evaluate your study without needing to refer to previous publications. After reading the introduction your reader should understand exactly what your research is about, what you plan to do, why you are undertaking this research and which methods you have used. Introductions generally include:
- The rationale for the present study. Why are you interested in this topic? Why is this topic worth investigating?
- Key terms and definitions.
- An outline of the research questions and hypotheses; the assumptions or propositions that your research will test.
Not all research reports have a separate literature review section. In shorter research reports, the review is usually part of the Introduction.
A literature review is a critical survey of recent relevant research in a particular field. The review should be a selection of carefully organised, focused and relevant literature that develops a narrative ‘story’ about your topic. Your review should answer key questions about the literature:
- What is the current state of knowledge on the topic?
- What differences in approaches / methodologies are there?
- Where are the strengths and weaknesses of the research?
- What further research is needed? The review may identify a gap in the literature which provides a rationale for your study and supports your research questions and methodology.
The review is not just a summary of all you have read. Rather, it must develop an argument or a point of view that supports your chosen methodology and research questions.
The purpose of this section is to detail how you conducted your research so that others can understand and replicate your approach.
You need to briefly describe the subjects (if appropriate), any equipment or materials used and the approach taken. If the research method or method of data analysis is commonly used within your field of study, then simply reference the procedure. If, however, your methods are new or controversial then you need to describe them in more detail and provide a rationale for your approach. The methodology is written in the past tense and should be as concise as possible.
This section is a concise, factual summary of your findings, listed under headings appropriate to your research questions. It’s common to use tables and graphics. Raw data or details about the method of statistical analysis used should be included in the Appendices.
Present your results in a consistent manner. For example, if you present the first group of results as percentages, it will be confusing for the reader and difficult to make comparisons of data if later results are presented as fractions or as decimal values.
In general, you won’t discuss your results here. Any analysis of your results usually occurs in the Discussion section.
Notes on visual data representation:
- Graphs and tables may be used to reveal trends in your data, but they must be explained and referred to in adjacent accompanying text.
- Figures and tables do not simply repeat information given in the text: they summarise, amplify or complement it.
- Graphs are always referred to as ‘Figures’, and both axes must be clearly labelled.
- Tables must be numbered, and they must be able to stand-alone or make sense without your reader needing to read all of the accompanying text.
The Discussion responds to the hypothesis or research question. This section is where you interpret your results, account for your findings and explain their significance within the context of other research. Consider the adequacy of your sampling techniques, the scope and long-term implications of your study, any problems with data collection or analysis and any assumptions on which your study was based. This is also the place to discuss any disappointing results and address limitations.
Checklist for the discussion
- To what extent was each hypothesis supported?
- To what extent are your findings validated or supported by other research?
- Were there unexpected variables that affected your results?
- On reflection, was your research method appropriate?
- Can you account for any differences between your results and other studies?
Conclusions in research reports are generally fairly short and should follow on naturally from points raised in the Discussion. In this section you should discuss the significance of your findings. To what extent and in what ways are your findings useful or conclusive? Is further research required? If so, based on your research experience, what suggestions could you make about improvements to the scope or methodology of future studies?
Also, consider the practical implications of your results and any recommendations you could make. For example, if your research is on reading strategies in the primary school classroom, what are the implications of your results for the classroom teacher? What recommendations could you make for teachers?
A Reference List contains all the resources you have cited in your work, while a Bibliography is a wider list containing all the resources you have consulted (but not necessarily cited) in the preparation of your work. It is important to check which of these is required, and the preferred format, style of references and presentation requirements of your own department.
Appendices (singular ‘Appendix’) provide supporting material to your project. Examples of such materials include:
- Relevant letters to participants and organisations (e.g. regarding the ethics or conduct of the project).
- Background reports.
- Detailed calculations.
Different types of data are presented in separate appendices. Each appendix must be titled, labelled with a number or letter, and referred to in the body of the report.
Appendices are placed at the end of a report, and the contents are generally not included in the word count.
Fi nal ti p
While there are many common elements to research reports, it’s always best to double check the exact requirements for your task. You may find that you don’t need some sections, can combine others or have specific requirements about referencing, formatting or word limits.

Looking for one-on-one advice?
Get tailored advice from an Academic Skills Adviser by booking an Individual appointment, or get quick feedback from one of our Academic Writing Mentors via email through our Writing advice service.
Go to Student appointments

An official website of the United States government
The .gov means it’s official. Federal government websites often end in .gov or .mil. Before sharing sensitive information, make sure you’re on a federal government site.
The site is secure. The https:// ensures that you are connecting to the official website and that any information you provide is encrypted and transmitted securely.
- Publications
- Account settings
Preview improvements coming to the PMC website in October 2024. Learn More or Try it out now .
- Advanced Search
- Journal List
- J Korean Med Sci
- v.37(16); 2022 Apr 25
A Practical Guide to Writing Quantitative and Qualitative Research Questions and Hypotheses in Scholarly Articles
Edward barroga.
1 Department of General Education, Graduate School of Nursing Science, St. Luke’s International University, Tokyo, Japan.
Glafera Janet Matanguihan
2 Department of Biological Sciences, Messiah University, Mechanicsburg, PA, USA.
The development of research questions and the subsequent hypotheses are prerequisites to defining the main research purpose and specific objectives of a study. Consequently, these objectives determine the study design and research outcome. The development of research questions is a process based on knowledge of current trends, cutting-edge studies, and technological advances in the research field. Excellent research questions are focused and require a comprehensive literature search and in-depth understanding of the problem being investigated. Initially, research questions may be written as descriptive questions which could be developed into inferential questions. These questions must be specific and concise to provide a clear foundation for developing hypotheses. Hypotheses are more formal predictions about the research outcomes. These specify the possible results that may or may not be expected regarding the relationship between groups. Thus, research questions and hypotheses clarify the main purpose and specific objectives of the study, which in turn dictate the design of the study, its direction, and outcome. Studies developed from good research questions and hypotheses will have trustworthy outcomes with wide-ranging social and health implications.
INTRODUCTION
Scientific research is usually initiated by posing evidenced-based research questions which are then explicitly restated as hypotheses. 1 , 2 The hypotheses provide directions to guide the study, solutions, explanations, and expected results. 3 , 4 Both research questions and hypotheses are essentially formulated based on conventional theories and real-world processes, which allow the inception of novel studies and the ethical testing of ideas. 5 , 6
It is crucial to have knowledge of both quantitative and qualitative research 2 as both types of research involve writing research questions and hypotheses. 7 However, these crucial elements of research are sometimes overlooked; if not overlooked, then framed without the forethought and meticulous attention it needs. Planning and careful consideration are needed when developing quantitative or qualitative research, particularly when conceptualizing research questions and hypotheses. 4
There is a continuing need to support researchers in the creation of innovative research questions and hypotheses, as well as for journal articles that carefully review these elements. 1 When research questions and hypotheses are not carefully thought of, unethical studies and poor outcomes usually ensue. Carefully formulated research questions and hypotheses define well-founded objectives, which in turn determine the appropriate design, course, and outcome of the study. This article then aims to discuss in detail the various aspects of crafting research questions and hypotheses, with the goal of guiding researchers as they develop their own. Examples from the authors and peer-reviewed scientific articles in the healthcare field are provided to illustrate key points.
DEFINITIONS AND RELATIONSHIP OF RESEARCH QUESTIONS AND HYPOTHESES
A research question is what a study aims to answer after data analysis and interpretation. The answer is written in length in the discussion section of the paper. Thus, the research question gives a preview of the different parts and variables of the study meant to address the problem posed in the research question. 1 An excellent research question clarifies the research writing while facilitating understanding of the research topic, objective, scope, and limitations of the study. 5
On the other hand, a research hypothesis is an educated statement of an expected outcome. This statement is based on background research and current knowledge. 8 , 9 The research hypothesis makes a specific prediction about a new phenomenon 10 or a formal statement on the expected relationship between an independent variable and a dependent variable. 3 , 11 It provides a tentative answer to the research question to be tested or explored. 4
Hypotheses employ reasoning to predict a theory-based outcome. 10 These can also be developed from theories by focusing on components of theories that have not yet been observed. 10 The validity of hypotheses is often based on the testability of the prediction made in a reproducible experiment. 8
Conversely, hypotheses can also be rephrased as research questions. Several hypotheses based on existing theories and knowledge may be needed to answer a research question. Developing ethical research questions and hypotheses creates a research design that has logical relationships among variables. These relationships serve as a solid foundation for the conduct of the study. 4 , 11 Haphazardly constructed research questions can result in poorly formulated hypotheses and improper study designs, leading to unreliable results. Thus, the formulations of relevant research questions and verifiable hypotheses are crucial when beginning research. 12
CHARACTERISTICS OF GOOD RESEARCH QUESTIONS AND HYPOTHESES
Excellent research questions are specific and focused. These integrate collective data and observations to confirm or refute the subsequent hypotheses. Well-constructed hypotheses are based on previous reports and verify the research context. These are realistic, in-depth, sufficiently complex, and reproducible. More importantly, these hypotheses can be addressed and tested. 13
There are several characteristics of well-developed hypotheses. Good hypotheses are 1) empirically testable 7 , 10 , 11 , 13 ; 2) backed by preliminary evidence 9 ; 3) testable by ethical research 7 , 9 ; 4) based on original ideas 9 ; 5) have evidenced-based logical reasoning 10 ; and 6) can be predicted. 11 Good hypotheses can infer ethical and positive implications, indicating the presence of a relationship or effect relevant to the research theme. 7 , 11 These are initially developed from a general theory and branch into specific hypotheses by deductive reasoning. In the absence of a theory to base the hypotheses, inductive reasoning based on specific observations or findings form more general hypotheses. 10
TYPES OF RESEARCH QUESTIONS AND HYPOTHESES
Research questions and hypotheses are developed according to the type of research, which can be broadly classified into quantitative and qualitative research. We provide a summary of the types of research questions and hypotheses under quantitative and qualitative research categories in Table 1 .
Research questions in quantitative research
In quantitative research, research questions inquire about the relationships among variables being investigated and are usually framed at the start of the study. These are precise and typically linked to the subject population, dependent and independent variables, and research design. 1 Research questions may also attempt to describe the behavior of a population in relation to one or more variables, or describe the characteristics of variables to be measured ( descriptive research questions ). 1 , 5 , 14 These questions may also aim to discover differences between groups within the context of an outcome variable ( comparative research questions ), 1 , 5 , 14 or elucidate trends and interactions among variables ( relationship research questions ). 1 , 5 We provide examples of descriptive, comparative, and relationship research questions in quantitative research in Table 2 .
Hypotheses in quantitative research
In quantitative research, hypotheses predict the expected relationships among variables. 15 Relationships among variables that can be predicted include 1) between a single dependent variable and a single independent variable ( simple hypothesis ) or 2) between two or more independent and dependent variables ( complex hypothesis ). 4 , 11 Hypotheses may also specify the expected direction to be followed and imply an intellectual commitment to a particular outcome ( directional hypothesis ) 4 . On the other hand, hypotheses may not predict the exact direction and are used in the absence of a theory, or when findings contradict previous studies ( non-directional hypothesis ). 4 In addition, hypotheses can 1) define interdependency between variables ( associative hypothesis ), 4 2) propose an effect on the dependent variable from manipulation of the independent variable ( causal hypothesis ), 4 3) state a negative relationship between two variables ( null hypothesis ), 4 , 11 , 15 4) replace the working hypothesis if rejected ( alternative hypothesis ), 15 explain the relationship of phenomena to possibly generate a theory ( working hypothesis ), 11 5) involve quantifiable variables that can be tested statistically ( statistical hypothesis ), 11 6) or express a relationship whose interlinks can be verified logically ( logical hypothesis ). 11 We provide examples of simple, complex, directional, non-directional, associative, causal, null, alternative, working, statistical, and logical hypotheses in quantitative research, as well as the definition of quantitative hypothesis-testing research in Table 3 .
Research questions in qualitative research
Unlike research questions in quantitative research, research questions in qualitative research are usually continuously reviewed and reformulated. The central question and associated subquestions are stated more than the hypotheses. 15 The central question broadly explores a complex set of factors surrounding the central phenomenon, aiming to present the varied perspectives of participants. 15
There are varied goals for which qualitative research questions are developed. These questions can function in several ways, such as to 1) identify and describe existing conditions ( contextual research question s); 2) describe a phenomenon ( descriptive research questions ); 3) assess the effectiveness of existing methods, protocols, theories, or procedures ( evaluation research questions ); 4) examine a phenomenon or analyze the reasons or relationships between subjects or phenomena ( explanatory research questions ); or 5) focus on unknown aspects of a particular topic ( exploratory research questions ). 5 In addition, some qualitative research questions provide new ideas for the development of theories and actions ( generative research questions ) or advance specific ideologies of a position ( ideological research questions ). 1 Other qualitative research questions may build on a body of existing literature and become working guidelines ( ethnographic research questions ). Research questions may also be broadly stated without specific reference to the existing literature or a typology of questions ( phenomenological research questions ), may be directed towards generating a theory of some process ( grounded theory questions ), or may address a description of the case and the emerging themes ( qualitative case study questions ). 15 We provide examples of contextual, descriptive, evaluation, explanatory, exploratory, generative, ideological, ethnographic, phenomenological, grounded theory, and qualitative case study research questions in qualitative research in Table 4 , and the definition of qualitative hypothesis-generating research in Table 5 .
Qualitative studies usually pose at least one central research question and several subquestions starting with How or What . These research questions use exploratory verbs such as explore or describe . These also focus on one central phenomenon of interest, and may mention the participants and research site. 15
Hypotheses in qualitative research
Hypotheses in qualitative research are stated in the form of a clear statement concerning the problem to be investigated. Unlike in quantitative research where hypotheses are usually developed to be tested, qualitative research can lead to both hypothesis-testing and hypothesis-generating outcomes. 2 When studies require both quantitative and qualitative research questions, this suggests an integrative process between both research methods wherein a single mixed-methods research question can be developed. 1
FRAMEWORKS FOR DEVELOPING RESEARCH QUESTIONS AND HYPOTHESES
Research questions followed by hypotheses should be developed before the start of the study. 1 , 12 , 14 It is crucial to develop feasible research questions on a topic that is interesting to both the researcher and the scientific community. This can be achieved by a meticulous review of previous and current studies to establish a novel topic. Specific areas are subsequently focused on to generate ethical research questions. The relevance of the research questions is evaluated in terms of clarity of the resulting data, specificity of the methodology, objectivity of the outcome, depth of the research, and impact of the study. 1 , 5 These aspects constitute the FINER criteria (i.e., Feasible, Interesting, Novel, Ethical, and Relevant). 1 Clarity and effectiveness are achieved if research questions meet the FINER criteria. In addition to the FINER criteria, Ratan et al. described focus, complexity, novelty, feasibility, and measurability for evaluating the effectiveness of research questions. 14
The PICOT and PEO frameworks are also used when developing research questions. 1 The following elements are addressed in these frameworks, PICOT: P-population/patients/problem, I-intervention or indicator being studied, C-comparison group, O-outcome of interest, and T-timeframe of the study; PEO: P-population being studied, E-exposure to preexisting conditions, and O-outcome of interest. 1 Research questions are also considered good if these meet the “FINERMAPS” framework: Feasible, Interesting, Novel, Ethical, Relevant, Manageable, Appropriate, Potential value/publishable, and Systematic. 14
As we indicated earlier, research questions and hypotheses that are not carefully formulated result in unethical studies or poor outcomes. To illustrate this, we provide some examples of ambiguous research question and hypotheses that result in unclear and weak research objectives in quantitative research ( Table 6 ) 16 and qualitative research ( Table 7 ) 17 , and how to transform these ambiguous research question(s) and hypothesis(es) into clear and good statements.
a These statements were composed for comparison and illustrative purposes only.
b These statements are direct quotes from Higashihara and Horiuchi. 16
a This statement is a direct quote from Shimoda et al. 17
The other statements were composed for comparison and illustrative purposes only.
CONSTRUCTING RESEARCH QUESTIONS AND HYPOTHESES
To construct effective research questions and hypotheses, it is very important to 1) clarify the background and 2) identify the research problem at the outset of the research, within a specific timeframe. 9 Then, 3) review or conduct preliminary research to collect all available knowledge about the possible research questions by studying theories and previous studies. 18 Afterwards, 4) construct research questions to investigate the research problem. Identify variables to be accessed from the research questions 4 and make operational definitions of constructs from the research problem and questions. Thereafter, 5) construct specific deductive or inductive predictions in the form of hypotheses. 4 Finally, 6) state the study aims . This general flow for constructing effective research questions and hypotheses prior to conducting research is shown in Fig. 1 .

Research questions are used more frequently in qualitative research than objectives or hypotheses. 3 These questions seek to discover, understand, explore or describe experiences by asking “What” or “How.” The questions are open-ended to elicit a description rather than to relate variables or compare groups. The questions are continually reviewed, reformulated, and changed during the qualitative study. 3 Research questions are also used more frequently in survey projects than hypotheses in experiments in quantitative research to compare variables and their relationships.
Hypotheses are constructed based on the variables identified and as an if-then statement, following the template, ‘If a specific action is taken, then a certain outcome is expected.’ At this stage, some ideas regarding expectations from the research to be conducted must be drawn. 18 Then, the variables to be manipulated (independent) and influenced (dependent) are defined. 4 Thereafter, the hypothesis is stated and refined, and reproducible data tailored to the hypothesis are identified, collected, and analyzed. 4 The hypotheses must be testable and specific, 18 and should describe the variables and their relationships, the specific group being studied, and the predicted research outcome. 18 Hypotheses construction involves a testable proposition to be deduced from theory, and independent and dependent variables to be separated and measured separately. 3 Therefore, good hypotheses must be based on good research questions constructed at the start of a study or trial. 12
In summary, research questions are constructed after establishing the background of the study. Hypotheses are then developed based on the research questions. Thus, it is crucial to have excellent research questions to generate superior hypotheses. In turn, these would determine the research objectives and the design of the study, and ultimately, the outcome of the research. 12 Algorithms for building research questions and hypotheses are shown in Fig. 2 for quantitative research and in Fig. 3 for qualitative research.

EXAMPLES OF RESEARCH QUESTIONS FROM PUBLISHED ARTICLES
- EXAMPLE 1. Descriptive research question (quantitative research)
- - Presents research variables to be assessed (distinct phenotypes and subphenotypes)
- “BACKGROUND: Since COVID-19 was identified, its clinical and biological heterogeneity has been recognized. Identifying COVID-19 phenotypes might help guide basic, clinical, and translational research efforts.
- RESEARCH QUESTION: Does the clinical spectrum of patients with COVID-19 contain distinct phenotypes and subphenotypes? ” 19
- EXAMPLE 2. Relationship research question (quantitative research)
- - Shows interactions between dependent variable (static postural control) and independent variable (peripheral visual field loss)
- “Background: Integration of visual, vestibular, and proprioceptive sensations contributes to postural control. People with peripheral visual field loss have serious postural instability. However, the directional specificity of postural stability and sensory reweighting caused by gradual peripheral visual field loss remain unclear.
- Research question: What are the effects of peripheral visual field loss on static postural control ?” 20
- EXAMPLE 3. Comparative research question (quantitative research)
- - Clarifies the difference among groups with an outcome variable (patients enrolled in COMPERA with moderate PH or severe PH in COPD) and another group without the outcome variable (patients with idiopathic pulmonary arterial hypertension (IPAH))
- “BACKGROUND: Pulmonary hypertension (PH) in COPD is a poorly investigated clinical condition.
- RESEARCH QUESTION: Which factors determine the outcome of PH in COPD?
- STUDY DESIGN AND METHODS: We analyzed the characteristics and outcome of patients enrolled in the Comparative, Prospective Registry of Newly Initiated Therapies for Pulmonary Hypertension (COMPERA) with moderate or severe PH in COPD as defined during the 6th PH World Symposium who received medical therapy for PH and compared them with patients with idiopathic pulmonary arterial hypertension (IPAH) .” 21
- EXAMPLE 4. Exploratory research question (qualitative research)
- - Explores areas that have not been fully investigated (perspectives of families and children who receive care in clinic-based child obesity treatment) to have a deeper understanding of the research problem
- “Problem: Interventions for children with obesity lead to only modest improvements in BMI and long-term outcomes, and data are limited on the perspectives of families of children with obesity in clinic-based treatment. This scoping review seeks to answer the question: What is known about the perspectives of families and children who receive care in clinic-based child obesity treatment? This review aims to explore the scope of perspectives reported by families of children with obesity who have received individualized outpatient clinic-based obesity treatment.” 22
- EXAMPLE 5. Relationship research question (quantitative research)
- - Defines interactions between dependent variable (use of ankle strategies) and independent variable (changes in muscle tone)
- “Background: To maintain an upright standing posture against external disturbances, the human body mainly employs two types of postural control strategies: “ankle strategy” and “hip strategy.” While it has been reported that the magnitude of the disturbance alters the use of postural control strategies, it has not been elucidated how the level of muscle tone, one of the crucial parameters of bodily function, determines the use of each strategy. We have previously confirmed using forward dynamics simulations of human musculoskeletal models that an increased muscle tone promotes the use of ankle strategies. The objective of the present study was to experimentally evaluate a hypothesis: an increased muscle tone promotes the use of ankle strategies. Research question: Do changes in the muscle tone affect the use of ankle strategies ?” 23
EXAMPLES OF HYPOTHESES IN PUBLISHED ARTICLES
- EXAMPLE 1. Working hypothesis (quantitative research)
- - A hypothesis that is initially accepted for further research to produce a feasible theory
- “As fever may have benefit in shortening the duration of viral illness, it is plausible to hypothesize that the antipyretic efficacy of ibuprofen may be hindering the benefits of a fever response when taken during the early stages of COVID-19 illness .” 24
- “In conclusion, it is plausible to hypothesize that the antipyretic efficacy of ibuprofen may be hindering the benefits of a fever response . The difference in perceived safety of these agents in COVID-19 illness could be related to the more potent efficacy to reduce fever with ibuprofen compared to acetaminophen. Compelling data on the benefit of fever warrant further research and review to determine when to treat or withhold ibuprofen for early stage fever for COVID-19 and other related viral illnesses .” 24
- EXAMPLE 2. Exploratory hypothesis (qualitative research)
- - Explores particular areas deeper to clarify subjective experience and develop a formal hypothesis potentially testable in a future quantitative approach
- “We hypothesized that when thinking about a past experience of help-seeking, a self distancing prompt would cause increased help-seeking intentions and more favorable help-seeking outcome expectations .” 25
- “Conclusion
- Although a priori hypotheses were not supported, further research is warranted as results indicate the potential for using self-distancing approaches to increasing help-seeking among some people with depressive symptomatology.” 25
- EXAMPLE 3. Hypothesis-generating research to establish a framework for hypothesis testing (qualitative research)
- “We hypothesize that compassionate care is beneficial for patients (better outcomes), healthcare systems and payers (lower costs), and healthcare providers (lower burnout). ” 26
- Compassionomics is the branch of knowledge and scientific study of the effects of compassionate healthcare. Our main hypotheses are that compassionate healthcare is beneficial for (1) patients, by improving clinical outcomes, (2) healthcare systems and payers, by supporting financial sustainability, and (3) HCPs, by lowering burnout and promoting resilience and well-being. The purpose of this paper is to establish a scientific framework for testing the hypotheses above . If these hypotheses are confirmed through rigorous research, compassionomics will belong in the science of evidence-based medicine, with major implications for all healthcare domains.” 26
- EXAMPLE 4. Statistical hypothesis (quantitative research)
- - An assumption is made about the relationship among several population characteristics ( gender differences in sociodemographic and clinical characteristics of adults with ADHD ). Validity is tested by statistical experiment or analysis ( chi-square test, Students t-test, and logistic regression analysis)
- “Our research investigated gender differences in sociodemographic and clinical characteristics of adults with ADHD in a Japanese clinical sample. Due to unique Japanese cultural ideals and expectations of women's behavior that are in opposition to ADHD symptoms, we hypothesized that women with ADHD experience more difficulties and present more dysfunctions than men . We tested the following hypotheses: first, women with ADHD have more comorbidities than men with ADHD; second, women with ADHD experience more social hardships than men, such as having less full-time employment and being more likely to be divorced.” 27
- “Statistical Analysis
- ( text omitted ) Between-gender comparisons were made using the chi-squared test for categorical variables and Students t-test for continuous variables…( text omitted ). A logistic regression analysis was performed for employment status, marital status, and comorbidity to evaluate the independent effects of gender on these dependent variables.” 27
EXAMPLES OF HYPOTHESIS AS WRITTEN IN PUBLISHED ARTICLES IN RELATION TO OTHER PARTS
- EXAMPLE 1. Background, hypotheses, and aims are provided
- “Pregnant women need skilled care during pregnancy and childbirth, but that skilled care is often delayed in some countries …( text omitted ). The focused antenatal care (FANC) model of WHO recommends that nurses provide information or counseling to all pregnant women …( text omitted ). Job aids are visual support materials that provide the right kind of information using graphics and words in a simple and yet effective manner. When nurses are not highly trained or have many work details to attend to, these job aids can serve as a content reminder for the nurses and can be used for educating their patients (Jennings, Yebadokpo, Affo, & Agbogbe, 2010) ( text omitted ). Importantly, additional evidence is needed to confirm how job aids can further improve the quality of ANC counseling by health workers in maternal care …( text omitted )” 28
- “ This has led us to hypothesize that the quality of ANC counseling would be better if supported by job aids. Consequently, a better quality of ANC counseling is expected to produce higher levels of awareness concerning the danger signs of pregnancy and a more favorable impression of the caring behavior of nurses .” 28
- “This study aimed to examine the differences in the responses of pregnant women to a job aid-supported intervention during ANC visit in terms of 1) their understanding of the danger signs of pregnancy and 2) their impression of the caring behaviors of nurses to pregnant women in rural Tanzania.” 28
- EXAMPLE 2. Background, hypotheses, and aims are provided
- “We conducted a two-arm randomized controlled trial (RCT) to evaluate and compare changes in salivary cortisol and oxytocin levels of first-time pregnant women between experimental and control groups. The women in the experimental group touched and held an infant for 30 min (experimental intervention protocol), whereas those in the control group watched a DVD movie of an infant (control intervention protocol). The primary outcome was salivary cortisol level and the secondary outcome was salivary oxytocin level.” 29
- “ We hypothesize that at 30 min after touching and holding an infant, the salivary cortisol level will significantly decrease and the salivary oxytocin level will increase in the experimental group compared with the control group .” 29
- EXAMPLE 3. Background, aim, and hypothesis are provided
- “In countries where the maternal mortality ratio remains high, antenatal education to increase Birth Preparedness and Complication Readiness (BPCR) is considered one of the top priorities [1]. BPCR includes birth plans during the antenatal period, such as the birthplace, birth attendant, transportation, health facility for complications, expenses, and birth materials, as well as family coordination to achieve such birth plans. In Tanzania, although increasing, only about half of all pregnant women attend an antenatal clinic more than four times [4]. Moreover, the information provided during antenatal care (ANC) is insufficient. In the resource-poor settings, antenatal group education is a potential approach because of the limited time for individual counseling at antenatal clinics.” 30
- “This study aimed to evaluate an antenatal group education program among pregnant women and their families with respect to birth-preparedness and maternal and infant outcomes in rural villages of Tanzania.” 30
- “ The study hypothesis was if Tanzanian pregnant women and their families received a family-oriented antenatal group education, they would (1) have a higher level of BPCR, (2) attend antenatal clinic four or more times, (3) give birth in a health facility, (4) have less complications of women at birth, and (5) have less complications and deaths of infants than those who did not receive the education .” 30
Research questions and hypotheses are crucial components to any type of research, whether quantitative or qualitative. These questions should be developed at the very beginning of the study. Excellent research questions lead to superior hypotheses, which, like a compass, set the direction of research, and can often determine the successful conduct of the study. Many research studies have floundered because the development of research questions and subsequent hypotheses was not given the thought and meticulous attention needed. The development of research questions and hypotheses is an iterative process based on extensive knowledge of the literature and insightful grasp of the knowledge gap. Focused, concise, and specific research questions provide a strong foundation for constructing hypotheses which serve as formal predictions about the research outcomes. Research questions and hypotheses are crucial elements of research that should not be overlooked. They should be carefully thought of and constructed when planning research. This avoids unethical studies and poor outcomes by defining well-founded objectives that determine the design, course, and outcome of the study.
Disclosure: The authors have no potential conflicts of interest to disclose.
Author Contributions:
- Conceptualization: Barroga E, Matanguihan GJ.
- Methodology: Barroga E, Matanguihan GJ.
- Writing - original draft: Barroga E, Matanguihan GJ.
- Writing - review & editing: Barroga E, Matanguihan GJ.
- Research Report: Definition, Types + [Writing Guide]

One of the reasons for carrying out research is to add to the existing body of knowledge. Therefore, when conducting research, you need to document your processes and findings in a research report.
With a research report, it is easy to outline the findings of your systematic investigation and any gaps needing further inquiry. Knowing how to create a detailed research report will prove useful when you need to conduct research.
What is a Research Report?
A research report is a well-crafted document that outlines the processes, data, and findings of a systematic investigation. It is an important document that serves as a first-hand account of the research process, and it is typically considered an objective and accurate source of information.
In many ways, a research report can be considered as a summary of the research process that clearly highlights findings, recommendations, and other important details. Reading a well-written research report should provide you with all the information you need about the core areas of the research process.
Features of a Research Report
So how do you recognize a research report when you see one? Here are some of the basic features that define a research report.
- It is a detailed presentation of research processes and findings, and it usually includes tables and graphs.
- It is written in a formal language.
- A research report is usually written in the third person.
- It is informative and based on first-hand verifiable information.
- It is formally structured with headings, sections, and bullet points.
- It always includes recommendations for future actions.
Types of Research Report
The research report is classified based on two things; nature of research and target audience.
Nature of Research
- Qualitative Research Report
This is the type of report written for qualitative research . It outlines the methods, processes, and findings of a qualitative method of systematic investigation. In educational research, a qualitative research report provides an opportunity for one to apply his or her knowledge and develop skills in planning and executing qualitative research projects.
A qualitative research report is usually descriptive in nature. Hence, in addition to presenting details of the research process, you must also create a descriptive narrative of the information.
- Quantitative Research Report
A quantitative research report is a type of research report that is written for quantitative research. Quantitative research is a type of systematic investigation that pays attention to numerical or statistical values in a bid to find answers to research questions.
In this type of research report, the researcher presents quantitative data to support the research process and findings. Unlike a qualitative research report that is mainly descriptive, a quantitative research report works with numbers; that is, it is numerical in nature.
Target Audience
Also, a research report can be said to be technical or popular based on the target audience. If you’re dealing with a general audience, you would need to present a popular research report, and if you’re dealing with a specialized audience, you would submit a technical report.
- Technical Research Report
A technical research report is a detailed document that you present after carrying out industry-based research. This report is highly specialized because it provides information for a technical audience; that is, individuals with above-average knowledge in the field of study.
In a technical research report, the researcher is expected to provide specific information about the research process, including statistical analyses and sampling methods. Also, the use of language is highly specialized and filled with jargon.
Examples of technical research reports include legal and medical research reports.
- Popular Research Report
A popular research report is one for a general audience; that is, for individuals who do not necessarily have any knowledge in the field of study. A popular research report aims to make information accessible to everyone.
It is written in very simple language, which makes it easy to understand the findings and recommendations. Examples of popular research reports are the information contained in newspapers and magazines.
Importance of a Research Report
- Knowledge Transfer: As already stated above, one of the reasons for carrying out research is to contribute to the existing body of knowledge, and this is made possible with a research report. A research report serves as a means to effectively communicate the findings of a systematic investigation to all and sundry.
- Identification of Knowledge Gaps: With a research report, you’d be able to identify knowledge gaps for further inquiry. A research report shows what has been done while hinting at other areas needing systematic investigation.
- In market research, a research report would help you understand the market needs and peculiarities at a glance.
- A research report allows you to present information in a precise and concise manner.
- It is time-efficient and practical because, in a research report, you do not have to spend time detailing the findings of your research work in person. You can easily send out the report via email and have stakeholders look at it.
Guide to Writing a Research Report
A lot of detail goes into writing a research report, and getting familiar with the different requirements would help you create the ideal research report. A research report is usually broken down into multiple sections, which allows for a concise presentation of information.
Structure and Example of a Research Report
This is the title of your systematic investigation. Your title should be concise and point to the aims, objectives, and findings of a research report.
- Table of Contents
This is like a compass that makes it easier for readers to navigate the research report.
An abstract is an overview that highlights all important aspects of the research including the research method, data collection process, and research findings. Think of an abstract as a summary of your research report that presents pertinent information in a concise manner.
An abstract is always brief; typically 100-150 words and goes straight to the point. The focus of your research abstract should be the 5Ws and 1H format – What, Where, Why, When, Who and How.
- Introduction
Here, the researcher highlights the aims and objectives of the systematic investigation as well as the problem which the systematic investigation sets out to solve. When writing the report introduction, it is also essential to indicate whether the purposes of the research were achieved or would require more work.
In the introduction section, the researcher specifies the research problem and also outlines the significance of the systematic investigation. Also, the researcher is expected to outline any jargons and terminologies that are contained in the research.
- Literature Review
A literature review is a written survey of existing knowledge in the field of study. In other words, it is the section where you provide an overview and analysis of different research works that are relevant to your systematic investigation.
It highlights existing research knowledge and areas needing further investigation, which your research has sought to fill. At this stage, you can also hint at your research hypothesis and its possible implications for the existing body of knowledge in your field of study.
- An Account of Investigation
This is a detailed account of the research process, including the methodology, sample, and research subjects. Here, you are expected to provide in-depth information on the research process including the data collection and analysis procedures.
In a quantitative research report, you’d need to provide information surveys, questionnaires and other quantitative data collection methods used in your research. In a qualitative research report, you are expected to describe the qualitative data collection methods used in your research including interviews and focus groups.
In this section, you are expected to present the results of the systematic investigation.
This section further explains the findings of the research, earlier outlined. Here, you are expected to present a justification for each outcome and show whether the results are in line with your hypotheses or if other research studies have come up with similar results.
- Conclusions
This is a summary of all the information in the report. It also outlines the significance of the entire study.
- References and Appendices
This section contains a list of all the primary and secondary research sources.
Tips for Writing a Research Report
- Define the Context for the Report
As is obtainable when writing an essay, defining the context for your research report would help you create a detailed yet concise document. This is why you need to create an outline before writing so that you do not miss out on anything.
- Define your Audience
Writing with your audience in mind is essential as it determines the tone of the report. If you’re writing for a general audience, you would want to present the information in a simple and relatable manner. For a specialized audience, you would need to make use of technical and field-specific terms.
- Include Significant Findings
The idea of a research report is to present some sort of abridged version of your systematic investigation. In your report, you should exclude irrelevant information while highlighting only important data and findings.
- Include Illustrations
Your research report should include illustrations and other visual representations of your data. Graphs, pie charts, and relevant images lend additional credibility to your systematic investigation.
- Choose the Right Title
A good research report title is brief, precise, and contains keywords from your research. It should provide a clear idea of your systematic investigation so that readers can grasp the entire focus of your research from the title.
- Proofread the Report
Before publishing the document, ensure that you give it a second look to authenticate the information. If you can, get someone else to go through the report, too, and you can also run it through proofreading and editing software.
How to Gather Research Data for Your Report
- Understand the Problem
Every research aims at solving a specific problem or set of problems, and this should be at the back of your mind when writing your research report. Understanding the problem would help you to filter the information you have and include only important data in your report.
- Know what your report seeks to achieve
This is somewhat similar to the point above because, in some way, the aim of your research report is intertwined with the objectives of your systematic investigation. Identifying the primary purpose of writing a research report would help you to identify and present the required information accordingly.
- Identify your audience
Knowing your target audience plays a crucial role in data collection for a research report. If your research report is specifically for an organization, you would want to present industry-specific information or show how the research findings are relevant to the work that the company does.
- Create Surveys/Questionnaires
A survey is a research method that is used to gather data from a specific group of people through a set of questions. It can be either quantitative or qualitative.
A survey is usually made up of structured questions, and it can be administered online or offline. However, an online survey is a more effective method of research data collection because it helps you save time and gather data with ease.
You can seamlessly create an online questionnaire for your research on Formplus . With the multiple sharing options available in the builder, you would be able to administer your survey to respondents in little or no time.
Formplus also has a report summary too l that you can use to create custom visual reports for your research.
Step-by-step guide on how to create an online questionnaire using Formplus
- Sign into Formplus
In the Formplus builder, you can easily create different online questionnaires for your research by dragging and dropping preferred fields into your form. To access the Formplus builder, you will need to create an account on Formplus.
Once you do this, sign in to your account and click on Create new form to begin.
- Edit Form Title : Click on the field provided to input your form title, for example, “Research Questionnaire.”
- Edit Form : Click on the edit icon to edit the form.
- Add Fields : Drag and drop preferred form fields into your form in the Formplus builder inputs column. There are several field input options for questionnaires in the Formplus builder.
- Edit fields
- Click on “Save”
- Form Customization: With the form customization options in the form builder, you can easily change the outlook of your form and make it more unique and personalized. Formplus allows you to change your form theme, add background images, and even change the font according to your needs.
- Multiple Sharing Options: Formplus offers various form-sharing options, which enables you to share your questionnaire with respondents easily. You can use the direct social media sharing buttons to share your form link to your organization’s social media pages. You can also send out your survey form as email invitations to your research subjects too. If you wish, you can share your form’s QR code or embed it on your organization’s website for easy access.
Conclusion
Always remember that a research report is just as important as the actual systematic investigation because it plays a vital role in communicating research findings to everyone else. This is why you must take care to create a concise document summarizing the process of conducting any research.
In this article, we’ve outlined essential tips to help you create a research report. When writing your report, you should always have the audience at the back of your mind, as this would set the tone for the document.
Connect to Formplus, Get Started Now - It's Free!
- ethnographic research survey
- research report
- research report survey
- busayo.longe
You may also like:
How to Write a Problem Statement for your Research
Learn how to write problem statements before commencing any research effort. Learn about its structure and explore examples
Assessment Tools: Types, Examples & Importance
In this article, you’ll learn about different assessment tools to help you evaluate performance in various contexts
21 Chrome Extensions for Academic Researchers in 2022
In this article, we will discuss a number of chrome extensions you can use to make your research process even seamless
Ethnographic Research: Types, Methods + [Question Examples]
Simple guide on ethnographic research, it types, methods, examples and advantages. Also highlights how to conduct an ethnographic...
Formplus - For Seamless Data Collection
Collect data the right way with a versatile data collection tool. try formplus and transform your work productivity today..
- Skip to main content
- Skip to primary sidebar
- Skip to footer
- QuestionPro

- Solutions Industries Gaming Automotive Sports and events Education Government Travel & Hospitality Financial Services Healthcare Cannabis Technology Use Case NPS+ Communities Audience Contactless surveys Mobile LivePolls Member Experience GDPR Positive People Science 360 Feedback Surveys
- Resources Blog eBooks Survey Templates Case Studies Training Help center
Home Market Research
Research Reports: Definition and How to Write Them

Reports are usually spread across a vast horizon of topics but are focused on communicating information about a particular topic and a niche target market. The primary motive of research reports is to convey integral details about a study for marketers to consider while designing new strategies.
Certain events, facts, and other information based on incidents need to be relayed to the people in charge, and creating research reports is the most effective communication tool. Ideal research reports are extremely accurate in the offered information with a clear objective and conclusion. These reports should have a clean and structured format to relay information effectively.
What are Research Reports?
Research reports are recorded data prepared by researchers or statisticians after analyzing the information gathered by conducting organized research, typically in the form of surveys or qualitative methods .
A research report is a reliable source to recount details about a conducted research. It is most often considered to be a true testimony of all the work done to garner specificities of research.
The various sections of a research report are:
- Background/Introduction
- Implemented Methods
- Results based on Analysis
- Deliberation
Learn more: Quantitative Research
Components of Research Reports
Research is imperative for launching a new product/service or a new feature. The markets today are extremely volatile and competitive due to new entrants every day who may or may not provide effective products. An organization needs to make the right decisions at the right time to be relevant in such a market with updated products that suffice customer demands.
The details of a research report may change with the purpose of research but the main components of a report will remain constant. The research approach of the market researcher also influences the style of writing reports. Here are seven main components of a productive research report:
- Research Report Summary: The entire objective along with the overview of research are to be included in a summary which is a couple of paragraphs in length. All the multiple components of the research are explained in brief under the report summary. It should be interesting enough to capture all the key elements of the report.
- Research Introduction: There always is a primary goal that the researcher is trying to achieve through a report. In the introduction section, he/she can cover answers related to this goal and establish a thesis which will be included to strive and answer it in detail. This section should answer an integral question: “What is the current situation of the goal?”. After the research design was conducted, did the organization conclude the goal successfully or they are still a work in progress – provide such details in the introduction part of the research report.
- Research Methodology: This is the most important section of the report where all the important information lies. The readers can gain data for the topic along with analyzing the quality of provided content and the research can also be approved by other market researchers . Thus, this section needs to be highly informative with each aspect of research discussed in detail. Information needs to be expressed in chronological order according to its priority and importance. Researchers should include references in case they gained information from existing techniques.
- Research Results: A short description of the results along with calculations conducted to achieve the goal will form this section of results. Usually, the exposition after data analysis is carried out in the discussion part of the report.
Learn more: Quantitative Data
- Research Discussion: The results are discussed in extreme detail in this section along with a comparative analysis of reports that could probably exist in the same domain. Any abnormality uncovered during research will be deliberated in the discussion section. While writing research reports, the researcher will have to connect the dots on how the results will be applicable in the real world.
- Research References and Conclusion: Conclude all the research findings along with mentioning each and every author, article or any content piece from where references were taken.
Learn more: Qualitative Observation
15 Tips for Writing Research Reports
Writing research reports in the manner can lead to all the efforts going down the drain. Here are 15 tips for writing impactful research reports:
- Prepare the context before starting to write and start from the basics: This was always taught to us in school – be well-prepared before taking a plunge into new topics. The order of survey questions might not be the ideal or most effective order for writing research reports. The idea is to start with a broader topic and work towards a more specific one and focus on a conclusion or support, which a research should support with the facts. The most difficult thing to do in reporting, without a doubt is to start. Start with the title, the introduction, then document the first discoveries and continue from that. Once the marketers have the information well documented, they can write a general conclusion.
- Keep the target audience in mind while selecting a format that is clear, logical and obvious to them: Will the research reports be presented to decision makers or other researchers? What are the general perceptions around that topic? This requires more care and diligence. A researcher will need a significant amount of information to start writing the research report. Be consistent with the wording, the numbering of the annexes and so on. Follow the approved format of the company for the delivery of research reports and demonstrate the integrity of the project with the objectives of the company.
- Have a clear research objective: A researcher should read the entire proposal again, and make sure that the data they provide contributes to the objectives that were raised from the beginning. Remember that speculations are for conversations, not for research reports, if a researcher speculates, they directly question their own research.
- Establish a working model: Each study must have an internal logic, which will have to be established in the report and in the evidence. The researchers’ worst nightmare is to be required to write research reports and realize that key questions were not included.
Learn more: Quantitative Observation
- Gather all the information about the research topic. Who are the competitors of our customers? Talk to other researchers who have studied the subject of research, know the language of the industry. Misuse of the terms can discourage the readers of research reports from reading further.
- Read aloud while writing. While reading the report, if the researcher hears something inappropriate, for example, if they stumble over the words when reading them, surely the reader will too. If the researcher can’t put an idea in a single sentence, then it is very long and they must change it so that the idea is clear to everyone.
- Check grammar and spelling. Without a doubt, good practices help to understand the report. Use verbs in the present tense. Consider using the present tense, which makes the results sound more immediate. Find new words and other ways of saying things. Have fun with the language whenever possible.
- Discuss only the discoveries that are significant. If some data are not really significant, do not mention them. Remember that not everything is truly important or essential within research reports.
Learn more: Qualitative Data
- Try and stick to the survey questions. For example, do not say that the people surveyed “were worried” about an research issue , when there are different degrees of concern.
- The graphs must be clear enough so that they understand themselves. Do not let graphs lead the reader to make mistakes: give them a title, include the indications, the size of the sample, and the correct wording of the question.
- Be clear with messages. A researcher should always write every section of the report with an accuracy of details and language.
- Be creative with titles – Particularly in segmentation studies choose names “that give life to research”. Such names can survive for a long time after the initial investigation.
- Create an effective conclusion: The conclusion in the research reports is the most difficult to write, but it is an incredible opportunity to excel. Make a precise summary. Sometimes it helps to start the conclusion with something specific, then it describes the most important part of the study, and finally, it provides the implications of the conclusions.
- Get a couple more pair of eyes to read the report. Writers have trouble detecting their own mistakes. But they are responsible for what is presented. Ensure it has been approved by colleagues or friends before sending the find draft out.
Learn more: Market Research and Analysis
MORE LIKE THIS

Data Information vs Insight: Essential differences
May 14, 2024

Pricing Analytics Software: Optimize Your Pricing Strategy
May 13, 2024

Relationship Marketing: What It Is, Examples & Top 7 Benefits
May 8, 2024

The Best Email Survey Tool to Boost Your Feedback Game
May 7, 2024
Methods for the National Diabetes Statistics Report
- Learn about the methods used in the National Diabetes Statistics Report.
Data collection
The estimates (unless otherwise noted) were derived from various data systems of the Centers for Disease Control and Prevention (CDC), Indian Health Service (IHS), Agency for Healthcare Research and Quality (AHRQ), and U.S. Census Bureau and from published research studies. Estimated percentages and total number of people with diabetes and prediabetes were derived from the National Health and Nutrition Examination Survey (NHANES), National Health Interview Survey (NHIS), IHS National Data Warehouse (NDW), Behavioral Risk Factor Surveillance System (BRFSS), United States Diabetes Surveillance System (USDSS), and U.S. resident population estimates.
Diagnosed diabetes status was determined from self-reported information provided by survey respondents. Undiagnosed diabetes was determined by measured fasting plasma glucose or A1C levels among people without self-reported diagnosed diabetes. Numbers and rates for acute and long-term complications of diabetes were derived from the National Inpatient Sample (NIS) and National Emergency Department Sample (NEDS), as well as NHIS.
For some measures, estimates were not available for certain racial and ethnic subgroups due to small sample sizes.
Diabetes estimates
An alpha level of 0.05 was used when determining statistically significant differences between groups. Age-adjusted estimates were calculated among adults aged 18 years or older by the direct method to the 2000 U.S. Census standard population, using age groups 18–44, 45–64, and 65 years or older. Most estimates of diabetes in this report do not differentiate between type 1 and type 2 diabetes. However, as type 2 diabetes accounts for 90% to 95% of all diabetes cases, the data presented here are more likely to be characteristic of type 2 diabetes, except as noted.
More information about the data sources, methods, and references is available in Appendix B: Detailed Methods and Data Sources .
Diabetes is a chronic disease that affects how your body turns food into energy. About 1 in 10 Americans has diabetes.
For Everyone
Health care providers, public health.

An official website of the United States government
Here’s how you know
Official websites use .gov A .gov website belongs to an official government organization in the United States.
Secure .gov websites use HTTPS A lock ( Lock A locked padlock ) or https:// means you’ve safely connected to the .gov website. Share sensitive information only on official, secure websites.
JavaScript appears to be disabled on this computer. Please click here to see any active alerts .
Application of Weight-of-Evidence Methods for Transparent and Defensible Numeric Nutrient Criteria Report
Access the report, related links.

Water quality standards are essential for protecting and restoring the condition of the United States' lakes, rivers, estuaries, and other water bodies. Since nutrient pollution continues to be a widespread problem in aquatic systems, developing numeric nutrient criteria (NNC) as part of water quality standards is a priority to enhance prospects for managing excess nutrients and their effects. In this report, we complement existing NNC guidance and support to states by discussing weight-of-evidence (WoE) methods that enable rigorous and transparent development and integration of multiple lines of evidence. This report can be helpful to those who are developing or reviewing processes for deriving NNC or NNC conclusions, such as teams of planners, decision-makers, technical advisors (for Tribes, states, and regions), and scientific researchers.
The NNC development phases (Planning, Problem Formulation, Analysis, and Derivation) align with the Basic WoE Framework steps (Assemble Evidence, Weight Evidence, and Weigh the Body of Evidence). The process is conducted within the WoE core principles of transparency, documentation, and communication. The following are take-home messages for WoE's role in strengthening each phase of NNC development.
- Planning Phase - Activities undertaken during planning provide a transparent foundation for developing NNC; transparency is a core principle of WoE. Grouping water bodies during planning is a process in which WoE can be applied when diverse evidence needs to be combined.
- Problem Formulation Phase - Selecting endpoints during Problem Formulation is also a process in which WoE can be applied when diverse evidence needs to be combined. Conceptual models developed during Problem Formulation can inform what evidence should be assembled in the Analysis Phase.
- Analysis Phase - This phase includes assembling evidence and weighting evidence. Unbiased assembly of evidence is best practice and can ensure NNC are based on transparent data and information of sufficient amount and quality. Weighting evidence by establishing, objectively evaluating, and documenting qualities of that evidence shows how much influence individual evidence will have on overall NNC conclusions.
- Criteria Derivation Phase - This phase includes weighing the body of evidence by integrating and interpreting evidence, as well as communicating conclusions. Methods for integrating evidence to derive criteria can range from simple to sophisticated; selected methods should be logical, informed by evidence availability and stakeholder needs, and communicated clearly.
This work is primarily based on Weight-of-Evidence in Ecological Assessment (U.S. EPA 2016), which focuses on decision theory and a robust body of work and experience in land and water-based condition, causal, and risk assessments. The methods, contexts, and examples selected and described in the present publication relate to nutrient criteria development in freshwater ecosystems.
History of Application of Weight-of-Evidence Methods for Transparent and Defensible Numeric Nutrient Criteria
Download the Report: Application of Weight-of-Evidence Methods for Transparent and Defensible Numeric Nutrient Criteria (pdf) (8.9 MB, May 2024, 600/R-24/057)
- EcoDIVER: Ecological Database and Interactive Visualizations of Evidence Records
- Ecological Risk Assessment
- Nutrients Research
- Nutrient Scientific Technical Exchange Partnership & Support (N-STEPS) Online
- Water Research Home
- Watersheds Research
- Nutrients and Harmful Algal Blooms Research
- Water Treatment and Infrastructure Research
- Water Research Grants
- Research Outputs
- Training, Outreach, and Engagement
Numbers, Facts and Trends Shaping Your World
Read our research on:
Full Topic List
Regions & Countries
- Publications
- Our Methods
- Short Reads
- Tools & Resources
Read Our Research On:
Broad Public Support for Legal Abortion Persists 2 Years After Dobbs
Methodology, table of contents.
- Other abortion attitudes
- Overall attitudes about abortion
- Americans’ views on medication abortion in their states
- How statements about abortion resonate with Americans
- Acknowledgments
- The American Trends Panel survey methodology
The American Trends Panel (ATP), created by Pew Research Center, is a nationally representative panel of randomly selected U.S. adults. Panelists participate via self-administered web surveys. Panelists who do not have internet access at home are provided with a tablet and wireless internet connection. Interviews are conducted in both English and Spanish. The panel is being managed by Ipsos.
Data in this report is drawn from ATP Wave 146, conducted from April 8 to 14, 2024. It includes oversamples of non-Hispanic Asian adults, non-Hispanic Black adults, Hispanic adults and adults ages 18 to 29 in order to provide more precise estimates of the opinions and experiences of these smaller demographic subgroups. It also included an oversample of validated 2016 and 2020 “vote switchers” who voted for Donald Trump in 2020 but not in 2016 or who voted for Joe Biden in 2020 but not for Hillary Clinton in 2016. These oversampled groups are weighted back to reflect their correct proportions in the population. A total of 8,709 panelists responded out of 9,527 who were sampled, for a response rate of 91%. The cumulative response rate accounting for nonresponse to the recruitment surveys and attrition is 3%. The break-off rate among panelists who logged on to the survey and completed at least one item is less than 1%. The margin of sampling error for the full sample of 8,709 respondents is plus or minus 1.5 percentage points.
Panel recruitment
The ATP was created in 2014, with the first cohort of panelists invited to join the panel at the end of a large, national, landline and cellphone random-digit-dial survey that was conducted in both English and Spanish. Two additional recruitments were conducted using the same method in 2015 and 2017, respectively. Across these three surveys, a total of 19,718 adults were invited to join the ATP, of whom 9,942 (50%) agreed to participate.

In August 2018, the ATP switched from telephone to address-based sampling (ABS) recruitment. A study cover letter and a pre-incentive are mailed to a stratified, random sample of households selected from the U.S. Postal Service’s Delivery Sequence File. This Postal Service file has been estimated to cover as much as 98% of the population, although some studies suggest that the coverage could be in the low 90% range. 1 Within each sampled household, the adult with the next birthday is asked to participate. Other details of the ABS recruitment protocol have changed over time but are available upon request. 2
We have recruited a national sample of U.S. adults to the ATP approximately once per year since 2014. In some years, the recruitment has included additional efforts (known as an “oversample”) to boost sample size with underrepresented groups. For example, Hispanic, Black and Asian adults were oversampled in 2019, 2022 and 2023, respectively.
Across the six address-based recruitments, a total of 23,862 adults were invited to join the ATP, of whom 20,917 agreed to join the panel and completed an initial profile survey. Of the 30,859 individuals who have ever joined the ATP, 11,902 remained active panelists and continued to receive survey invitations at the time this survey was conducted.
The American Trends Panel never uses breakout routers or chains that direct respondents to additional surveys.
Sample design
The overall target population for this survey was noninstitutionalized persons ages 18 and older living in the U.S., including Alaska and Hawaii. It featured a stratified random sample from the ATP in which the following groups were selected with certainty: non-Hispanic Asian adults; non-Hispanic Black adults; Hispanic adults; adults ages 18 to 29; validated 2016 and 2020 voters who voted for Donald Trump in 2020 but voted for a different candidate in 2016; and validated 2016 and 2020 voters who voted for Joe Biden in 2020 but did not vote for Hillary Clinton in 2016. 3
The remaining panelists were sampled at rates designed to ensure that the share of respondents in each stratum is proportional to its share of the U.S. adult population to the greatest extent possible. Respondent weights are adjusted to account for differential probabilities of selection as described in the Weighting section below.
Questionnaire development and testing
The questionnaire was developed by Pew Research Center in consultation with Ipsos. The web program was rigorously tested on both PC and mobile devices by the Ipsos project management team and Center researchers. The Ipsos project management team also populated test data that was analyzed in SPSS to ensure the logic and randomizations were working as intended before launching the survey.
All respondents were offered a post-paid incentive for their participation. Respondents could choose to receive the post-paid incentive in the form of a check or a gift code to Amazon.com or could choose to decline the incentive. Incentive amounts ranged from $5 to $20 depending on whether the respondent belongs to a part of the population that is harder or easier to reach. Differential incentive amounts were designed to increase panel survey participation among groups that traditionally have low survey response propensities.
Data collection protocol
The data collection field period for this survey was April 8 to 14, 2024. Postcard notifications were mailed to a subset of ATP panelists with a known residential address on April 8. 4
Invitations were sent out in two separate launches: soft launch and full launch. Sixty panelists were included in the soft launch, which began with an initial invitation sent on April 8. The ATP panelists chosen for the initial soft launch were known responders who had completed previous ATP surveys within one day of receiving their invitation. All remaining English- and Spanish-speaking sampled panelists were included in the full launch and were sent an invitation on April 9.
All panelists with an email address received an email invitation and up to two email reminders if they did not respond to the survey. All ATP panelists who consented to SMS messages received an SMS invitation and up to two SMS reminders.

Data quality checks
To ensure high-quality data, the Center’s researchers performed data quality checks to identify any respondents showing clear patterns of satisficing. This includes checking for whether respondents left questions blank at very high rates or always selected the first or last answer presented. As a result of this checking, three ATP respondents were removed from the survey dataset prior to weighting and analysis.

The ATP data is weighted in a multistep process that accounts for multiple stages of sampling and nonresponse that occur at different points in the survey process. First, each panelist begins with a base weight that reflects their probability of selection for their initial recruitment survey. These weights are then rescaled and adjusted to account for changes in the design of ATP recruitment surveys from year to year. Finally, the weights are calibrated to align with the population benchmarks in the accompanying table to correct for nonresponse to recruitment surveys and panel attrition. If only a subsample of panelists was invited to participate in the wave, this weight is adjusted to account for any differential probabilities of selection.
Among the panelists who completed the survey, this weight is then calibrated again to align with the population benchmarks identified in the accompanying table and trimmed at the 2nd and 98th percentiles to reduce the loss in precision stemming from variance in the weights. This trimming is performed separately among non-Hispanic Black, non-Hispanic Asian, Hispanic and all other respondents. Sampling errors and tests of statistical significance take into account the effect of weighting.
The following table shows the unweighted sample sizes and the error attributable to sampling that would be expected at the 95% level of confidence for different groups in the survey.

Sample sizes and sampling errors for other subgroups are available upon request. In addition to sampling error, one should bear in mind that question wording and practical difficulties in conducting surveys can introduce error or bias into the findings of opinion polls.
Dispositions and response rates

- AAPOR Task Force on Address-based Sampling. 2016. “AAPOR Report: Address-based Sampling.” ↩
- Email [email protected] . ↩
- A validated voter is a citizen who told us that they voted in an election and have a record for voting in that election in a commercial voter file. A voter file is a list of adults that includes information such as which elections they have voted in. Federal law requires states to maintain voter files, and businesses assemble these files to create a nationwide list of adults along with their voter information. ↩
- Postcard notifications are sent to 1) panelists who have been provided with a tablet to take ATP surveys, 2) panelists who were recruited within the last two years, and 3) panelists recruited prior to the last two years who opt to continue receiving postcard notifications. ↩
Sign up for our weekly newsletter
Fresh data delivery Saturday mornings
Sign up for The Briefing
Weekly updates on the world of news & information
- Partisanship & Issues
Support for legal abortion is widespread in many places, especially in Europe
Public opinion on abortion, americans overwhelmingly say access to ivf is a good thing, what the data says about abortion in the u.s., nearly a year after roe’s demise, americans’ views of abortion access increasingly vary by where they live, most popular, report materials.
1615 L St. NW, Suite 800 Washington, DC 20036 USA (+1) 202-419-4300 | Main (+1) 202-857-8562 | Fax (+1) 202-419-4372 | Media Inquiries
Research Topics
- Age & Generations
- Coronavirus (COVID-19)
- Economy & Work
- Family & Relationships
- Gender & LGBTQ
- Immigration & Migration
- International Affairs
- Internet & Technology
- Methodological Research
- News Habits & Media
- Non-U.S. Governments
- Other Topics
- Politics & Policy
- Race & Ethnicity
- Email Newsletters
ABOUT PEW RESEARCH CENTER Pew Research Center is a nonpartisan fact tank that informs the public about the issues, attitudes and trends shaping the world. It conducts public opinion polling, demographic research, media content analysis and other empirical social science research. Pew Research Center does not take policy positions. It is a subsidiary of The Pew Charitable Trusts .
Copyright 2024 Pew Research Center
IMAGES
VIDEO
COMMENTS
Research Report is a written document that presents the results of a research project or study, including the research question, methodology, results, and conclusions, in a clear and objective manner. ... For example, a research report on a new teaching methodology could provide insights and ideas for educators to incorporate into their own ...
Research methods are specific procedures for collecting and analyzing data. Developing your research methods is an integral part of your research design. When planning your methods, there are two key decisions you will make. First, decide how you will collect data. Your methods depend on what type of data you need to answer your research question:
Step 1: Explain your methodological approach. Step 2: Describe your data collection methods. Step 3: Describe your analysis method. Step 4: Evaluate and justify the methodological choices you made. Tips for writing a strong methodology chapter. Other interesting articles.
Nature of Research Qualitative Research Report This is the type of report is written for qualitative research. It outlines the methods, processes, and findings of a qualitative method of ...
Write up a state-of-the-art research report. Understand how to use scientific language in research reports. Develop a structure for your research report that comprises all relevant sections. Assess the consistency of your research design. Avoid dumbfounding your reader with surprising information.
An APA-style research report begins with a title page. The title is centered in the upper half of the page, with each important word capitalized. The title should clearly and concisely (in about 12 words or fewer) communicate the primary variables and research questions. ... The abstract presents the research question, a summary of the method ...
Your Methods Section contextualizes the results of your study, giving editors, reviewers and readers alike the information they need to understand and interpret your work. Your methods are key to establishing the credibility of your study, along with your data and the results themselves. A complete methods section should provide enough detail ...
The method section of a report details how the research was conducted, the research methods used and the reasons for choosing those methods. It should outline: the participants and research methods used, e.g. surveys/questionnaire, interviews. refer to other relevant studies. The methodology is a step-by-step explanation of the research process.
Abstract. This guide for writers of research reports consists of practical suggestions for writing a report that is clear, concise, readable, and understandable. It includes suggestions for terminology and notation and for writing each section of the report—introduction, method, results, and discussion. Much of the guide consists of ...
Write a thesis statement that clarifies the overall purpose of your report. Jot down anything you already know about the topic in the relevant sections. 3. STEP 3 Do the Research. Steps 1 and 2 will guide your research for this report. You may need to report on other research on a particular topic or do some research of your own.
Provide the rationality behind your chosen approach. Based on logic and reason, let your readers know why you have chosen said research methodologies. Additionally, you have to build strong arguments supporting why your chosen research method is the best way to achieve the desired outcome. 3. Explain your mechanism.
IMRaD Method Section. Method Sections in Scientific Research Reports (IMRaD) The purpose of the method section in an IMRaD* report is to provide a step-by-step description of how you conducted your empirical research to make it transparent and replicable. The idea is to provide enough relevant information so that other scholars could understand ...
A research report is a collection of contextual data, gathered through organized research, that provides new insights into a particular challenge (which, for this article, is business-related). Research reports are a time-tested method for distilling large amounts of data into a narrow band of focus.
An outline of the research questions and hypotheses; the assumptions or propositions that your research will test. Literature Review. Not all research reports have a separate literature review section. In shorter research reports, the review is usually part of the Introduction. A literature review is a critical survey of recent relevant ...
1. Qualitative research methodology. Qualitative research methodology is aimed at understanding concepts, thoughts, or experiences. This approach is descriptive and is often utilized to gather in-depth insights into people's attitudes, behaviors, or cultures. Qualitative research methodology involves methods like interviews, focus groups, and ...
This review is divided into sections for easy reference. There are five MAJOR parts of a Research Report: 1. Introduction 2. Review of Literature 3. Methods 4. Results 5. Discussion. As a general guide, the Introduction, Review of Literature, and Methods should be about 1/3 of your paper, Discussion 1/3, then Results 1/3.
INTRODUCTION. Scientific research is usually initiated by posing evidenced-based research questions which are then explicitly restated as hypotheses.1,2 The hypotheses provide directions to guide the study, solutions, explanations, and expected results.3,4 Both research questions and hypotheses are essentially formulated based on conventional theories and real-world processes, which allow the ...
A research report is a well-crafted document that outlines the processes, data, and findings of a systematic investigation. It is an important document that serves as a first-hand account of the research process, and it is typically considered an objective and accurate source of information.
Writing a Research Report: Presentation. Tables, Diagrams, Photos, and Maps. - Use when relevant and refer to them in the text. - Redraw diagrams rather than copying them directly. - Place at appropriate points in the text. - Select the most appropriate device. - List in contents at beginning of the report.
Research reports are recorded data prepared by researchers or statisticians after analyzing the information gathered by conducting organized research, typically in the form of surveys or qualitative methods. A research report is a reliable source to recount details about a conducted research. It is most often considered to be a true testimony ...
This book provides introductory materials on research methods and report writing that aim at guiding students and researchers towards effective research and reporting of their findings. Unlike the many volumes on research that are mostly theoretical, this book originated in the classroom and grew out of the students' own needs to design and conduct satisfactory research in order to meet ...
Qualitative research involves collecting and analyzing non-numerical data (e.g., text, video, or audio) to understand concepts, opinions, or experiences. It can be used to gather in-depth insights into a problem or generate new ideas for research. Qualitative research is the opposite of quantitative research, which involves collecting and ...
As a field of study, bibliometrics has received increasing interest from scholars worldwide (Wang et al., 2020).To analyze published works, bibliometric research employs a quantitative approach based on statistical measures of text and information (Ahmi & Mohd Nasir, 2019).To conduct a bibliometric analysis, which is defined as "the process of extracting measurable data through statistical ...
Age-adjusted estimates were calculated among adults aged 18 years or older by the direct method to the 2000 U.S. Census standard population, using age groups 18-44, 45-64, and 65 years or older. Most estimates of diabetes in this report do not differentiate between type 1 and type 2 diabetes. However, as type 2 diabetes accounts for 90% to ...
To solve the challenges of long-term and reliable storage of 3D brain organoids for basic research and clinical applications, we developed a new cryopreservation method including the precise control of the frozen medium components and freezing and thawing processes (Figure 1A). We first selected candidate supplemental ingredients for the CM ...
Access the Report. Download the Report: Application of Weight-of-Evidence Methods for Transparent and Defensible Numeric Nutrient Criteria (pdf) (8.9 MB, May 2024, 600/R-24/057) Related Links. EcoDIVER: Ecological Database and Interactive Visualizations of Evidence Records; Ecological Risk Assessment; Nutrients Research
Various methods have been used to improve the drilling ratio, by improving the trajectory control. These methods, shown in Table 2, include: geological guidance technology of adjacent well data ...
AAPOR Task Force on Address-based Sampling. 2016. "AAPOR Report: Address-based Sampling." ↩ Email [email protected]. ↩; A validated voter is a citizen who told us that they voted in an election and have a record for voting in that election in a commercial voter file. A voter file is a list of adults that includes information such as which elections they have voted in. Federal ...
Background: This study aimed to systematically review case reports documenting rare adverse events in patients with small cell lung cancer (SCLC) following the administration of immune checkpoint inhibitors (ICIs). Methods: A systematic literature review was conducted to identify case reports detailing previously unreported adverse drug reactions to ICIs in patients with SCLC.