- Privacy Policy
Home » Sampling Methods – Types, Techniques and Examples

Sampling Methods – Types, Techniques and Examples
Table of Contents

Sampling refers to the process of selecting a subset of data from a larger population or dataset in order to analyze or make inferences about the whole population.
In other words, sampling involves taking a representative sample of data from a larger group or dataset in order to gain insights or draw conclusions about the entire group.
Sampling Methods
Sampling methods refer to the techniques used to select a subset of individuals or units from a larger population for the purpose of conducting statistical analysis or research.
Sampling is an essential part of the Research because it allows researchers to draw conclusions about a population without having to collect data from every member of that population, which can be time-consuming, expensive, or even impossible.
Types of Sampling Methods
Sampling can be broadly categorized into two main categories:
Probability Sampling
This type of sampling is based on the principles of random selection, and it involves selecting samples in a way that every member of the population has an equal chance of being included in the sample.. Probability sampling is commonly used in scientific research and statistical analysis, as it provides a representative sample that can be generalized to the larger population.
Type of Probability Sampling :
- Simple Random Sampling: In this method, every member of the population has an equal chance of being selected for the sample. This can be done using a random number generator or by drawing names out of a hat, for example.
- Systematic Sampling: In this method, the population is first divided into a list or sequence, and then every nth member is selected for the sample. For example, if every 10th person is selected from a list of 100 people, the sample would include 10 people.
- Stratified Sampling: In this method, the population is divided into subgroups or strata based on certain characteristics, and then a random sample is taken from each stratum. This is often used to ensure that the sample is representative of the population as a whole.
- Cluster Sampling: In this method, the population is divided into clusters or groups, and then a random sample of clusters is selected. Then, all members of the selected clusters are included in the sample.
- Multi-Stage Sampling : This method combines two or more sampling techniques. For example, a researcher may use stratified sampling to select clusters, and then use simple random sampling to select members within each cluster.
Non-probability Sampling
This type of sampling does not rely on random selection, and it involves selecting samples in a way that does not give every member of the population an equal chance of being included in the sample. Non-probability sampling is often used in qualitative research, where the aim is not to generalize findings to a larger population, but to gain an in-depth understanding of a particular phenomenon or group. Non-probability sampling methods can be quicker and more cost-effective than probability sampling methods, but they may also be subject to bias and may not be representative of the larger population.
Types of Non-probability Sampling :
- Convenience Sampling: In this method, participants are chosen based on their availability or willingness to participate. This method is easy and convenient but may not be representative of the population.
- Purposive Sampling: In this method, participants are selected based on specific criteria, such as their expertise or knowledge on a particular topic. This method is often used in qualitative research, but may not be representative of the population.
- Snowball Sampling: In this method, participants are recruited through referrals from other participants. This method is often used when the population is hard to reach, but may not be representative of the population.
- Quota Sampling: In this method, a predetermined number of participants are selected based on specific criteria, such as age or gender. This method is often used in market research, but may not be representative of the population.
- Volunteer Sampling: In this method, participants volunteer to participate in the study. This method is often used in research where participants are motivated by personal interest or altruism, but may not be representative of the population.
Applications of Sampling Methods
Applications of Sampling Methods from different fields:
- Psychology : Sampling methods are used in psychology research to study various aspects of human behavior and mental processes. For example, researchers may use stratified sampling to select a sample of participants that is representative of the population based on factors such as age, gender, and ethnicity. Random sampling may also be used to select participants for experimental studies.
- Sociology : Sampling methods are commonly used in sociological research to study social phenomena and relationships between individuals and groups. For example, researchers may use cluster sampling to select a sample of neighborhoods to study the effects of economic inequality on health outcomes. Stratified sampling may also be used to select a sample of participants that is representative of the population based on factors such as income, education, and occupation.
- Social sciences: Sampling methods are commonly used in social sciences to study human behavior and attitudes. For example, researchers may use stratified sampling to select a sample of participants that is representative of the population based on factors such as age, gender, and income.
- Marketing : Sampling methods are used in marketing research to collect data on consumer preferences, behavior, and attitudes. For example, researchers may use random sampling to select a sample of consumers to participate in a survey about a new product.
- Healthcare : Sampling methods are used in healthcare research to study the prevalence of diseases and risk factors, and to evaluate interventions. For example, researchers may use cluster sampling to select a sample of health clinics to participate in a study of the effectiveness of a new treatment.
- Environmental science: Sampling methods are used in environmental science to collect data on environmental variables such as water quality, air pollution, and soil composition. For example, researchers may use systematic sampling to collect soil samples at regular intervals across a field.
- Education : Sampling methods are used in education research to study student learning and achievement. For example, researchers may use stratified sampling to select a sample of schools that is representative of the population based on factors such as demographics and academic performance.
Examples of Sampling Methods
Probability Sampling Methods Examples:
- Simple random sampling Example : A researcher randomly selects participants from the population using a random number generator or drawing names from a hat.
- Stratified random sampling Example : A researcher divides the population into subgroups (strata) based on a characteristic of interest (e.g. age or income) and then randomly selects participants from each subgroup.
- Systematic sampling Example : A researcher selects participants at regular intervals from a list of the population.
Non-probability Sampling Methods Examples:
- Convenience sampling Example: A researcher selects participants who are conveniently available, such as students in a particular class or visitors to a shopping mall.
- Purposive sampling Example : A researcher selects participants who meet specific criteria, such as individuals who have been diagnosed with a particular medical condition.
- Snowball sampling Example : A researcher selects participants who are referred to them by other participants, such as friends or acquaintances.
How to Conduct Sampling Methods
some general steps to conduct sampling methods:
- Define the population: Identify the population of interest and clearly define its boundaries.
- Choose the sampling method: Select an appropriate sampling method based on the research question, characteristics of the population, and available resources.
- Determine the sample size: Determine the desired sample size based on statistical considerations such as margin of error, confidence level, or power analysis.
- Create a sampling frame: Develop a list of all individuals or elements in the population from which the sample will be drawn. The sampling frame should be comprehensive, accurate, and up-to-date.
- Select the sample: Use the chosen sampling method to select the sample from the sampling frame. The sample should be selected randomly, or if using a non-random method, every effort should be made to minimize bias and ensure that the sample is representative of the population.
- Collect data: Once the sample has been selected, collect data from each member of the sample using appropriate research methods (e.g., surveys, interviews, observations).
- Analyze the data: Analyze the data collected from the sample to draw conclusions about the population of interest.
When to use Sampling Methods
Sampling methods are used in research when it is not feasible or practical to study the entire population of interest. Sampling allows researchers to study a smaller group of individuals, known as a sample, and use the findings from the sample to make inferences about the larger population.
Sampling methods are particularly useful when:
- The population of interest is too large to study in its entirety.
- The cost and time required to study the entire population are prohibitive.
- The population is geographically dispersed or difficult to access.
- The research question requires specialized or hard-to-find individuals.
- The data collected is quantitative and statistical analyses are used to draw conclusions.
Purpose of Sampling Methods
The main purpose of sampling methods in research is to obtain a representative sample of individuals or elements from a larger population of interest, in order to make inferences about the population as a whole. By studying a smaller group of individuals, known as a sample, researchers can gather information about the population that would be difficult or impossible to obtain from studying the entire population.
Sampling methods allow researchers to:
- Study a smaller, more manageable group of individuals, which is typically less time-consuming and less expensive than studying the entire population.
- Reduce the potential for data collection errors and improve the accuracy of the results by minimizing sampling bias.
- Make inferences about the larger population with a certain degree of confidence, using statistical analyses of the data collected from the sample.
- Improve the generalizability and external validity of the findings by ensuring that the sample is representative of the population of interest.
Characteristics of Sampling Methods
Here are some characteristics of sampling methods:
- Randomness : Probability sampling methods are based on random selection, meaning that every member of the population has an equal chance of being selected. This helps to minimize bias and ensure that the sample is representative of the population.
- Representativeness : The goal of sampling is to obtain a sample that is representative of the larger population of interest. This means that the sample should reflect the characteristics of the population in terms of key demographic, behavioral, or other relevant variables.
- Size : The size of the sample should be large enough to provide sufficient statistical power for the research question at hand. The sample size should also be appropriate for the chosen sampling method and the level of precision desired.
- Efficiency : Sampling methods should be efficient in terms of time, cost, and resources required. The method chosen should be feasible given the available resources and time constraints.
- Bias : Sampling methods should aim to minimize bias and ensure that the sample is representative of the population of interest. Bias can be introduced through non-random selection or non-response, and can affect the validity and generalizability of the findings.
- Precision : Sampling methods should be precise in terms of providing estimates of the population parameters of interest. Precision is influenced by sample size, sampling method, and level of variability in the population.
- Validity : The validity of the sampling method is important for ensuring that the results obtained from the sample are accurate and can be generalized to the population of interest. Validity can be affected by sampling method, sample size, and the representativeness of the sample.
Advantages of Sampling Methods
Sampling methods have several advantages, including:
- Cost-Effective : Sampling methods are often much cheaper and less time-consuming than studying an entire population. By studying only a small subset of the population, researchers can gather valuable data without incurring the costs associated with studying the entire population.
- Convenience : Sampling methods are often more convenient than studying an entire population. For example, if a researcher wants to study the eating habits of people in a city, it would be very difficult and time-consuming to study every single person in the city. By using sampling methods, the researcher can obtain data from a smaller subset of people, making the study more feasible.
- Accuracy: When done correctly, sampling methods can be very accurate. By using appropriate sampling techniques, researchers can obtain a sample that is representative of the entire population. This allows them to make accurate generalizations about the population as a whole based on the data collected from the sample.
- Time-Saving: Sampling methods can save a lot of time compared to studying the entire population. By studying a smaller sample, researchers can collect data much more quickly than they could if they studied every single person in the population.
- Less Bias : Sampling methods can reduce bias in a study. If a researcher were to study the entire population, it would be very difficult to eliminate all sources of bias. However, by using appropriate sampling techniques, researchers can reduce bias and obtain a sample that is more representative of the entire population.
Limitations of Sampling Methods
- Sampling Error : Sampling error is the difference between the sample statistic and the population parameter. It is the result of selecting a sample rather than the entire population. The larger the sample, the lower the sampling error. However, no matter how large the sample size, there will always be some degree of sampling error.
- Selection Bias: Selection bias occurs when the sample is not representative of the population. This can happen if the sample is not selected randomly or if some groups are underrepresented in the sample. Selection bias can lead to inaccurate conclusions about the population.
- Non-response Bias : Non-response bias occurs when some members of the sample do not respond to the survey or study. This can result in a biased sample if the non-respondents differ from the respondents in important ways.
- Time and Cost : While sampling can be cost-effective, it can still be expensive and time-consuming to select a sample that is representative of the population. Depending on the sampling method used, it may take a long time to obtain a sample that is large enough and representative enough to be useful.
- Limited Information : Sampling can only provide information about the variables that are measured. It may not provide information about other variables that are relevant to the research question but were not measured.
- Generalization : The extent to which the findings from a sample can be generalized to the population depends on the representativeness of the sample. If the sample is not representative of the population, it may not be possible to generalize the findings to the population as a whole.
About the author

Muhammad Hassan
Researcher, Academic Writer, Web developer
You may also like

Probability Sampling – Methods, Types and...

Quota Sampling – Types, Methods and Examples

Simple Random Sampling – Types, Method and...

Convenience Sampling – Method, Types and Examples

Purposive Sampling – Methods, Types and Examples

Systematic Sampling – Types, Method and Examples
Search Markets

- Report Store
- Airport Systems Research
- Aviation Research
- CNS Systems Research
- Components Research
- Defence Platforms & Systems Research
- Defense Platforms & Systems Research
- Electronic Warfare Research
- Homeland Security Research
- Maintenance, Repair, and Overhaul (MRO) Research
- Marine/Others Research
- Security Research
- Simulation & Training Research
- Space Research
- Unmanned Systems Research
- Agricultural Biologicals Research
- Agrochemicals & Fertilizers Research
- Animal Feed & Feed Additives Research
- Farm Equipment & Irrigations Research
- Feed & Animal Nutrition Research
- Life Sciences Research
- Precision Agriculture Research
- Seeds & Others Research
- Testing & Services Research
- Automotive Components Research
- Automotive Logistics Research
- Automotive Technology & Services Research
- Autonomous Vehicles Research
- Bikes And Motorcycles Research
- ICE, Electric, Hybrid, Autonomous Vehicles Research
- Off Road Vehicles, LCV, HCV Research
- Power Generation, Transmission & Distribution Research
- Railway Research
- Sensor And Control Research
- Telematics & Infotainment Research
- Testing, Inspection & Certification Research
- Tires & Wheels Research
- Banking Research
- FinTech Research
- Insurance Research
- Payments Research
- Accounting Services Research
- Architectural and Engineering Services Research
- Commercial Cleaning Services Research
- Corporate Training & Development Research
- Environmental Services Research
- Health and Safety Services Research
- Human Resources Services Research
- Information Technology Services Research
- Management Consulting Research
- Overhead, Consumables and Accessories Research
- Professional Services Research
- Real Estate Services Research
- Security Services Research
- Supply Chain Management Services Research
- Adhesives & Sealants Research
- Advanced Materials Research
- Basic Chemicals Research
- Disinfectants & Preservatives Research
- Inorganic Chemicals Research
- Metals & Alloys Research
- Nano Technology Research
- Organic Chemicals Research
- Packaging Research
- Petrochemicals Research
- Pharmaceutical Research
- Plastics, Polymers & Resins Research
- Polymers & Plastics Research
- Renewable Chemicals Research
- Specialty Chemicals Research
- Water Treatment Chemicals Research
- `Building Construction Research
- Construction Equipment & Machinery Research
- Construction Materials Research
- Engineering Services Research
- Green Construction Research
- Infrastructure Construction Research
- Machinery & Equipment Research
- Safety & Security Equipment Research
- Smart Infrastructure Research
- Specialty Construction Research
- Beauty & Personal Care Research
- Clothing, Footwear & Accessories Research
- Consumer Electronic Devices Research
- Consumer F&B Research
- Electronic & Electrical Research
- Electronics & Appliances Research
- Food & Beverage Research
- Food Packaging Research
- Homecare & Decor Research
- Luxury & Designer Research
- Sports & Leisure Research
- Sustainable Consumer Goods Research
- E-Learning & Online Education Research
- Higher Education Research
- K-12 Education Research
- Augmented/Virtual Reality Research
- Battery & Wireless Charging Research
- Camera, Display & Lighting Research
- Chipset And Processors Research
- Communication & Connectivity Technology Research
- Data Center & Networking Research
- Display Technology Research
- Drones & Robotics Research
- Electronics System & Components Research
- Energy Storage Research
- Industrial Automation Research
- Information System & Analytics Research
- Internet of Things & M2M Research
- Materials & Components Research
- Nanotechnology Research
- Next Generation Technologies Research
- Power & Energy Research
- Security, Access Control And Robotics Research
- Semiconductor Materials & Components Research
- Silicon, Wafer & Fabrication Research
- Wearable Technology Research
- Batteries Research
- Drilling, Intervention & Completion Research
- Industrial Motors, Pumps & Control Devices Research
- Offshore Oil & Gas Research
- Renewable Energy Research
- Smart Grid Research
- Alternative Food Sources Research
- Cold Chain Logistics Research
- Flavors, Colors & Fragrances Research
- Food Additives & Ingredients Research
- Food & Beverage Additives Research
- Food & Beverage Ingredients Research
- Food & Beverage Logistics Research
- Food & Beverage Logistics, Cold Chain & Packaging Research
- Food & Beverage Processing and Technology Research
- Food Processing Equipment & Technology Research
- Food Safety & Processing Research
- Food Safety & Standards Research
- Nutraceuticals & Dietary Supplements Research
- Nutraceuticals & Functional Foods Research
- Plant Based Alternatives/Ingredients Research
- Processed & Frozen Foods Research
- Proteins, Vitamins and Minerals Research
- Software & Services Research
- Analytics Research
- Application Software Research
- Artificial Intelligence (AI) Research
- Cloud Computing Research
- Communication Services Research
- Cyber Security Research
- Digital Media Research
- Digitalization & IoT Research
- E-commerce Research
- Endpoint Security Research
- Healthcare IT Research
- Healthcare Services Research
- Maintenance and Repair Services Research
- Materials Research
- Medical Devices Research
- Mobility & Telecom Research
- Network Security Research
- Public Safety Research
- Building Construction Research
- Chemicals & Pharmaceuticals Research
- Consumer Goods Research
- Electronics & Semiconductor Research
- Environmental Management Research
- Environmental & Safety Research
- Heavy Industry Research
- Recycling Research
- Recycling & Waste Management Research
- Safety Equipment Research
- Textiles & Apparel Research
- Valves & Actuators Research
- Metallic Minerals Research
- Metals Research Analysis
- Mining Equipment & Technology Research
- Mining Services Research
- Non-Metallic Minerals Research
- Biotechnology Research
- Cell Biology Research
- Medical Device Research
- Apparel & Footwear Research
- Brick And Mortar Research
- E-Commerce Research
- Home & Furniture Research
- Specialty Retail Research
Seeding the Insights Harvest: Understanding Sampling Techniques in Market Research

In the expansive landscape of market research, sampling techniques serve as the compass, guiding researchers through the complex task of understanding diverse populations. The choice of a sampling method is pivotal, as it directly influences the representativeness and reliability of research findings.
This exploration delves into the significance of sampling techniques in market research , examining various methodologies, their strengths, limitations, and the strategic considerations that shape the selection process.
Significance of Sampling Techniques in Market Research
- Representation of Diversity: Sampling techniques are fundamental to achieving a representative sample. A well-designed sample mirrors the diversity of the target population, ensuring that research findings can be generalized confidently.
- Resource Optimization: Effective sampling allows for the optimization of resources. Rather than attempting to survey an entire population, which can be impractical and costly, researchers can strategically select a subset that encapsulates the characteristics of the larger group.
- Statistical Inference: Sampling techniques underpin statistical inference. By concluding a carefully selected sample, researchers can make informed inferences about the broader population, providing valuable insights for decision-making.
- Efficient Data Collection: Sampling facilitates efficient data collection. Researchers can gather insights from a population subset, streamlining the research process and enabling focused analysis without the overwhelming challenge of studying the entire population.
Common Sampling Techniques in Market Research
- Random Sampling: Methodology: Every member of the population has an equal chance of being selected. Application: Random sampling is ideal when the population is homogeneous, and each member is equally likely to represent the entire group. Strengths: Ensures representativeness and minimizes bias. Limitations: This may be impractical for large or dispersed populations.
- Stratified Sampling: Methodology: Divide the population into subgroups (strata) based on certain characteristics, then randomly sample from each stratum. Application: Useful when the population is heterogeneous, researchers want to ensure representation from different subgroups. Strengths: Guarantees representation from all strata, leading to more accurate insights. Limitations: Requires knowledge of the population’s characteristics to create meaningful strata.
- Systematic Sampling: Methodology: Select every kth element from a list after randomly choosing a starting point. Application: Useful when the population is ordered, and researchers want a systematic representation. Strengths: Simplicity and efficiency in selecting a representative sample. Limitations: Susceptible to periodic patterns that may exist in the population list.
- Cluster Sampling: Methodology: Divides the population into clusters, randomly selects clusters, and then includes all members within the chosen clusters. Application: Suitable when the population is naturally grouped, and it is impractical to sample individuals independently. Strengths: Cost-effective and logistically efficient. Limitations: It may introduce intra-cluster homogeneity and inter-cluster heterogeneity.
- Convenience Sampling: Methodology: Involves selecting participants based on ease of access or availability Application: Common in exploratory research or when resources are limited. Strengths: Quick and cost-effective. Limitations: Prone to selection bias, as the sample may not represent the broader population.
Advantages of Effective Sampling Techniques in Market Research
- Increased Generalizability: Effective sampling techniques enhance the generalizability of research findings. Researchers can confidently extrapolate insights to the broader population by selecting a representative sample.
- Resource Optimization: Well-chosen sampling methods optimize resource utilization. Researchers can achieve meaningful results with a manageable sample size, avoiding the impracticality of studying an entire population.
- Minimized Bias: Rigorous sampling techniques minimize bias. Through randomization or careful stratification, researchers reduce the risk of selecting a sample that does not accurately reflect the population.
- Statistical Rigor: Statistical analyses rely on the foundations laid by effective sampling techniques. Researchers can confidently apply statistical tests and inferential methods when the sample is representative and well-designed.
- Efficient Data Collection: Well-structured sampling leads to efficient data collection. Researchers can focus on a population subset, streamlining the research process and making the most available resources.
Potential Pitfalls and Challenges in Sampling Techniques
- Sampling Bias: Sampling bias occurs when the chosen sample is not representative of the population. This can lead to inaccurate conclusions and compromise the external validity of the study.
- Undercoverage: Undercoverage happens when certain population segments are systematically excluded from the sampling process. It can result in a skewed representation and limit the generalizability of findings.
- Nonresponse Bias: Nonresponse bias occurs when individuals selected for the sample do not participate in the study. If nonrespondents differ systematically from respondents, the sample may not accurately reflect the population.
- Sampling Frame Issues: A sampling frame is the list from which the sample is drawn, and issues with the frame can impact the validity of the sample. Inaccurate or outdated sampling frames may introduce biases.
- Logistical Challenges: Certain sampling methods, such as random or stratified sampling, can pose logistical challenges, especially with large or dispersed populations. These challenges may affect the feasibility and cost-effectiveness of the study.
Best Practices for Effective Sampling in Market Research
- Clearly Defined Objectives: Define the research objectives before selecting a sampling method. The choice of sampling technique should align with the study’s goals, ensuring relevance and accuracy.
- Understand Population Characteristics: Gain a thorough understanding of the population characteristics. This knowledge is essential for choosing appropriate sampling methods, especially in stratified sampling or when creating clusters.
- Randomization: Embrace randomization to minimize bias. Random sampling or random assignment within strata enhances the representativeness of the sample.
- Consider Logistics and Resources: Consider logistical constraints and available resources. The chosen sampling method should be practical and feasible within the limitations of time, budget, and access.
- Pilot Testing: Conduct pilot testing to assess the effectiveness of the sampling method. Piloting helps identify potential issues, refine procedures, and ensure the reliability of the selected sampling technique.
Strategic Considerations in Sampling Techniques
- Population Homogeneity vs. Heterogeneity: The level of heterogeneity within the population influences the choice of sampling method. Homogeneous populations may benefit from simpler methods, while heterogeneous populations may require more sophisticated techniques like stratified sampling.
- Research Objectives and Study Design: The objectives of the research and the overall study design play a crucial role in selecting the appropriate sampling method. Exploratory studies may tolerate convenience sampling, while rigorous scientific investigations may demand more stringent methods.
- Resource Allocation: The allocation of resources, both in terms of time and budget, affects the choice of sampling method. Cluster sampling might be more cost-effective in certain situations, while random sampling may be justifiable when resources allow.
- Logistical Feasibility: The logistical feasibility of implementing a sampling method is a practical consideration. Alternative techniques should be explored if certain methods are impractical due to geographical constraints or resource limitations.
- Ethical Considerations: Ethical considerations, such as ensuring informed consent and respecting participant autonomy, should guide the choice of sampling methods. Ethical practices contribute to the credibility and integrity of the research.
Sampling techniques are the cornerstone of market research, providing the scaffolding for insightful conclusions. Carefully selecting a sampling method is not merely a technical exercise but a strategic decision that shapes the entire research endeavor.
By understanding the nuances of different sampling techniques, acknowledging their strengths and limitations, and aligning choices with research objectives, businesses can navigate the intricacies of diverse populations, ensuring that the insights gained are meaningful and representative of the dynamic landscapes they seek to understand.
About Verified Market Research
Verified Market Research is a global market research and consulting firm that has been delivering exhaustive market research studies and business intelligence for its clients since its establishment.
We focus on pushing our clients to achieve their business goals – with the fuel of in-depth business insights, including the latest market trends, customer behavior, and competitive analysis. Our transparent approach and high-rated market research reports have offered us a credible position in the eyes of most Fortune 500 companies.
Since our inception, we have formed fruitful and long-lasting relationships with each one of the clients whom we have serviced so far. It explains our performance when it comes to market research. We use client requirements and desired outcomes as our quality assurance measures to offer a precise and concise report on each market aspect.
Related Articles
Decoding the consumer mind: understanding consumer insights and behavior, navigating the research labyrinth: best practices for unlocking actionable insights, gauging the customer pulse: unveiling the power of market research through surveys, crafting the compass: effective survey design in market research, market assessment: unveiling opportunities and challenges through research, deciphering the desire: market demand in market research, shaping a better future: market research as the compass for public policy, navigating the future: the essence of market forecast in market research, looking into insights on customer satisfaction through market research, navigating the competitive seas: a comprehensive guide to understanding the competitive landscape.
View More Articles
Live revision! Join us for our free exam revision livestreams Watch now →
Reference Library
Collections
- See what's new
- All Resources
- Student Resources
- Assessment Resources
- Teaching Resources
- CPD Courses
- Livestreams
Study notes, videos, interactive activities and more!
Business news, insights and enrichment
Currated collections of free resources
Browse resources by topic
- All Business Resources
Resource Selections
Currated lists of resources
Study Notes
Marketing Research - Sampling
Last updated 22 Mar 2021
- Share on Facebook
- Share on Twitter
- Share by Email
What is sampling? In market research, sampling means getting opinions from a number of people, chosen from a specific group, in order to find out about the whole group. Let's look at sampling in more detail and discuss the most popular types of sampling used in market research.
It would be expensive and time-consuming to collect data from the whole population of a market. Therefore, market researchers make extensive of sampling from which, through careful design and analysis, marketers can draw information about their chosen market.
Sample Design
Sample design covers:
- Method of selection
- Sample structure
- Plans for analysing and interpreting the results.
Sample designs can vary from simple to complex. They depend on the type of information required and the way the sample is selected.
Sample design affects the size of the sample and the way in which analysis is carried out; in simple terms the more precision the market researcher requires, the more complex the design and larger the sample size will be.
The sample design may make use of the characteristics of the overall market population, but it does not have to be proportionally representative . It may be necessary to draw a larger sample than would be expected from some parts of the population: for example, to select more from a minority grouping to ensure that sufficient data is obtained for analysis on such groups.
Many sample designs are built around the concept of random selection . This permits justifiable inference from the sample to the population, at quantified levels of precision. Random selection also helps guard against sample bias in a way that selecting by judgement or convenience cannot.
Defining the Population
The first step in good sample design is to ensure that the specification of the target population is as clear and complete as possible. This is to ensure that all elements within the population are represented.
The target population is sampled using a sampling frame .
Often, the units in the population can be identified by existing information such as pay-rolls, company lists, government registers etc.
A sampling frame could also be geographical. For example, postcodes have become a well-used means of selecting a sample.
Sample Size
For any sample design, deciding upon the appropriate sample size will depend on several key factors:
- No estimate taken from a sample is expected to be exact: assumptions about the overall population based on the results of a sample will have an attached margin of error
- To lower the margin of error usually requires a larger sample size: the amount of variability in the population, ie the range of values or opinions, will also affect accuracy and therefore size of the sample
- The confidence level is the likelihood that the results obtained from the sample lie within a required precision: the higher the confidence level, the more certain you wish to be that the results are not atypical. Statisticians often use a 95% confidence level to provide strong conclusions
- Population size does not normally affect sample size: in fact the larger the population size, the lower the proportion of that population needs to be sampled to be representative. It's only when the proposed sample size is more than 5% of the population that the population size becomes part of the formulae to calculate the sample size
Types of Sampling
There are many different types of sampling methods, here's a summary of the most common:
Cluster sampling
Units in the population can often be found in certain geographic groups or "clusters" for example, primary school children in Derbyshire.
A random sample of clusters is taken, then all units within the cluster are examined.
- Quick and easy
- Doesn't need complete population information
- Good for face-to-face surveys
Disadvantages
- Expensive if the clusters are large
- Greater risk of sampling error
Convenience sampling
Uses those who are willing to volunteer and easiest to involve in the study.
- Subjects are readily available
- Large amounts of information can be gathered quickly
- The sample is not representative of the entire population, so results can't speak for them - inferences are limited. future data
- Prone to volunteer bias
Judgement sampling
A deliberate choice of a sample - the opposite of random
- Good for providing illustrative examples or case studies
- Very prone to bias
- Samples often small
- Cannot extrapolate from sample
Quota sampling
The aim is to obtain a sample that is "representative" of the overall population.
The population is divided ("stratified") by the most important variables such as income, age and location. The required quota sample is then drawn from each stratum.
- Quick and easy way of obtaining a sample
- Not random, so some risk of bias
- Need to understand the population to be able to identify the basis of stratification
Simply random sampling
This makes sure that every member of the population has an equal chance of selection.
- Simple to design and interpret
- Can calculate both estimate of the population and sampling error
- Need a complete and accurate population listing
- May not be practical if the sample requires lots of small visits over the country
Systematic sampling
After randomly selecting a starting point from the population between 1 and * n , every nth unit is selected.
* n equals the population size divided by the sample size.
- Easier to extract the sample than via simple random
- Ensures sample is spread across the population
- Can be costly and time-consuming if the sample is not conveniently located
- Secondary research
- Quantitative research
- Qualitative research
- Marketing research
You might also like

Leadership: Tough Decisions to Turn Starbucks Around
29th January 2012
What happened to McDonalds?
5th March 2015
Marketing Planning (Overview)
Are you the next lord sugar.
9th November 2015
Hotels and Market Research case study.
27th January 2016

The Importance of Relational Capitalism
The prisoner’s solution – podcast and question sheet.
22nd January 2017
Guerrilla marketing by Burger King
2nd February 2019
Our subjects
- › Criminology
- › Economics
- › Geography
- › Health & Social Care
- › Psychology
- › Sociology
- › Teaching & learning resources
- › Student revision workshops
- › Online student courses
- › CPD for teachers
- › Livestreams
- › Teaching jobs
Boston House, 214 High Street, Boston Spa, West Yorkshire, LS23 6AD Tel: 01937 848885
- › Contact us
- › Terms of use
- › Privacy & cookies
© 2002-2024 Tutor2u Limited. Company Reg no: 04489574. VAT reg no 816865400.
- Sign Up Now
- -- Navigate To -- CR Dashboard Connect for Researchers Connect for Participants
- Log In Log Out Log In
- Recent Press
- Papers Citing Connect
- Connect for Participants
- Connect for Researchers
- Connect AI Training
- Managed Research
- Prime Panels
- MTurk Toolkit
- Health & Medicine
- Conferences
- Knowledge Base
- The Online Researcher’s Guide To Sampling
How to Build a Sampling Process for Marketing Research

Quick Navigation:
When is it necessary to use sampling for market research, defining your target population, questions to ask when building a sampling strategy, how easy is it to reach your target audience, how much money do you have available for your project, how quickly do you need the data, what kind of information are you seeking from participants, calculating and justifying required sample size, selecting a method for sourcing participants.
By Cheskie Rosenzweig, MS, Aaron Moss, PhD, & Leib Litman, PhD
Online Researcher’s Sampling Guide, Part 3: How to Build a Sampling Process for Marketing Research
Most businesses can’t survive without conducting some research. What is our market share? Are our customers happy? Who is likely to buy this product? Questions like these are what lead businesses around the world to spend tens of billions of dollars per year on market research.
Regardless of whether you have a significant market research budget or one with very limited resources, it is of paramount importance for your business that your funds are spent efficiently and effectively. How do you do that? The first step might be recognizing when you do and do not need to gather your own data.
Not all market research requires a team of people to go out and gather data. Sometimes, your business has internal data, or you can use data other people have collected (known as secondary data) to answer your research questions. Internal data can help companies understand consumer behavior, and secondary data might help a company understand the market or its competitors.
But there are some questions no amount of internal or secondary data can answer. How do customers feel about our brand compared to others? How can we improve our product or service? Finding answers to questions like these requires talking to your customers or potential customers, and that means sampling people for the purpose of primary research.
As an example, imagine we lead the research team at a young company based in Minneapolis, Minnesota. Our company, aptly named SunVac, developed a new vacuum that runs on solar energy and never needs to be plugged in. As you might guess, we are excited that our hard work has come to fruition. We did it! We created an environmentally friendly vacuum with no more pesky wires to get tangled!
The problem we have now is that we aren’t sure how much our vacuum is worth on the open market. Although we have some secondary data on how much people will pay for wireless vacuums, we decide our product is sufficiently different from other models that we need to gather data to determine pricing sensitivity and the best way to market our product. The first step is determining who we need to sample.
Before embarking on any research project, it’s important to spend time clearly defining your objectives. Defining what you want to learn will guide your decisions about which source of data is best, how you should sample, and who you should sample.
Consider our company, SunVac. Our research team knows that we should conduct some studies investigating how much people will pay for our product and what kind of messages will convince people to buy it. From here, we need to define a target population for our studies, and while doing so, it is a good time to think about potential sources of sampling bias.
Is it important that our study represent certain demographic groups or people from various regions of the country? Should we make sure men and women are equally represented in the study? Does how much money people make influence whether they will buy our vacuum? Thinking about potential sources of bias can help us clarify who to sample.
Based on intuition and some secondary data, the research team at SunVac has a sense of who may have an interest in our product, who buy the product at different price points, and who respond to different marketing campaigns.
We decide we should sample people who may be in the market for a vacuum cleaner. We also decide it is important to collect data from people in various regions of the country to account for regional differences in environmental attitudes. If we limited our sampling to people in Minneapolis, we might end up with biased results, because Minneapolis is a city ranked cleanest in the U.S. and 6 th -most eco-friendly in the world , meaning people in Minneapolis may value our product more than potential customers elsewhere. Finally, we consider data we have seen that married people vacuum more than single adults. We decide we should sample more married people than singles. So, our target sample is adults from various regions of the US who may be interested in buying a vacuum. Let us next consider where we could collect our sample.
Once you identify a target population, you need to form a plan to reach them and to gather your data. There are several related issues to consider.
Some people are harder to find as research participants than others. CEOs and managers are less plentiful than entry-level employees. There are fewer older adults online than younger adults. When forming a sampling plan, it is important to consider how hard it is to reach your target audience.
The amount of money budgeted for your project will affect your decisions about how to reach your target audience. For example, gathering a nationally representative sample based on probability sampling is often quite expensive. If it isn’t essential that your project be based on probability sampling, many researchers find it more affordable to collect a controlled sample that uses quotas to match to the U.S. census.
The amount of money you have budgeted for your project can also affect other considerations, such as where to find participants. Some online platforms allow researchers to do more of the work in data collection, which lowers overall costs. Other online platforms manage data collection for researchers, which adds to overall costs. How much money you have will influence the decisions you make.
How quickly you need your data will affect not only the total cost of your study, but also your decisions of how to sample. If you need the data quickly, then it doesn’t make sense to adopt a slow strategy like voluntary sampling or face-to-face interviewing.
When researchers need data quickly, they often turn to online sampling sources. The internet makes it possible to run faster and more affordable studies than many other methods of data collection.
The information you’re asking participants to provide may influence how and where you decide to gather data. Specifically, if you are looking for participants to engage in an hour-long task, during which they rate several products and provide detailed responses about each one, then you will probably get the best results from a crowdsourcing platform like Mechanical Turk. Crowdsourcing platforms allow you to control participant compensation, and by paying participants adequately for their time, it is possible to get data from crowdsourcing sites that participants from most online panels would never take the time to provide.
On the other hand, if you are gathering simple survey responses from participants, then there are many platforms that are suited to the type of data you seek to collect.
How might the questions above affect the research decisions we make at SunVac?
First, we know it’s relatively easy to reach our target audience. Any sizeable online panel should have access to adults from around the U.S. and allow us to target married couples.
Second, as a small company, we don’t have a massive budget for research. Because a random sample isn’t necessary for our research questions, we will gather a non-random sample and aim to control for potential sources of bias. For example, we will use quotas in our data collection to ensure we gather data from people of various ethnic and age groups.
Third, we want the data quickly. We know our competitors are close to developing a similar product, and we want to make sure our product hits the market first. As a result, we want to conduct our project within the next two weeks, meaning we should choose a sampling method and source that yield quick data.
Finally, our study asks participants to answer some questions about our product and to tell us which features of different marketing messages are most persuasive. Because our study isn’t too long or too demanding, we can consider a wide range of online panels with which to run our study.
To summarize, we know that most online panels will allow us to sample the people we are interested in, but we need our data quickly and we have a tight budget to stick to. The ideal platform for our project may be something like CloudResearch’s Prime Panels, or if we want to do some of the work ourselves, we might run the study on Mechanical Turk using CloudResearch’s MTurk Toolkit.
Now that we’ve built a sampling plan, we have to decide how many people to sample.
How many people you recruit into your study depends on your goals, the type of study you’re conducting, and how you plan to use your data.
If you’re conducting a survey, as our company, SunVac, is, then you need to consider a few factors when determining sample size. First, how large is the population you’re studying? As the size of the population you seek to understand grows, so does the number of people you need to sample. Our population for the SunVac project is quite large, encompassing nearly all adults in the U.S.
Second, how much inaccuracy are you willing to accept in the results? While your initial reaction may be “none,” it’s important to keep in mind that all sampling entails some margin of error. The question you have to answer is how important it is for your project to minimize the margin of error while balancing the increased costs of gathering a larger sample.
At SunVac, someone on our team has a background in statistical methods. She informs us it would be wise to run a conjoint analysis project asking people to rate the attractiveness of a series of descriptions of vacuum cleaners at different price points and with different features. She explains to us that it will take some time to design the survey itself, but she estimates that for appropriate statistical power to analyze the results among the different market segments we are interested in (region, relationship status, age groups), we will need data from 2,000 potential customers.
Now, you’re ready to find participants. The problem is that there is an overwhelming number of online options to choose from.
Depending on who you want to sample and what you want them to do within your study, online panels and crowdsourcing platforms both offer options for obtaining the sample you are interested in.
Online panels offer access to tens of millions of participants worldwide. When using online panels, researchers can easily target participants based on demographic characteristics, geographic location, psychographics and more. At SunVac, we could easily run our study using an online panel.
In addition to online panels, crowdsourcing platforms like Amazon’s Mechanical Turk are increasingly popular among market researchers. Crowdsourcing platforms give researchers more control over how their study is setup, how communication with participants takes place, and how much participants are compensated. Each of these features can be used to elicit more participant engagement than is typical in online panels.
If we decide at SunVac to conduct our study with an online panel, we will need the ability to collect high-quality data from a diverse sample of 2,000 adults, with a quota for a particular number of men and women who come from different age groups and regions of the country, and are either married or single. This means we will need a platform that allows us to selectively recruit 2,000 vacuum cleaner users for a 15—20 minute survey, and we want to make sure we collect good data from participants who are paying attention.
Ideally, what might happen next for SunVac, and hopefully to you, our reader, is that, in the process of researching how to find the best sample for your needs, you come to this website, read this page, and realize that CloudResearch has what you need. At CloudResearch, we have the ability to connect researchers with samples for nearly any project. In addition, we can provide advice for your data collection or gather the sample for you . Our solutions are tailored to your needs.
Why wait? Reach out today and see how we can help you achieve your research goals. Collect participants via Prime Panels or our MTurk Toolkit by signing up for a CloudResearch account , or ask for our assistance in designing your survey or sampling approach or for help with data collection or analysis today.
Continue Reading: The Online Researcher’s Guide to Sampling

Part 4: Pros and Cons of Different Sampling Methods

Part 1: What Is the Purpose of Sampling in Research?

Part 2: How to Reduce Sampling Bias in Research
Related articles, what is data quality and why is it important.
If you were a researcher studying human behavior 30 years ago, your options for identifying participants for your studies were limited. If you worked at a university, you might be...
How to Identify and Handle Invalid Responses to Online Surveys
As a researcher, you are aware that planning studies, designing materials and collecting data each take a lot of work. So when you get your hands on a new dataset,...
SUBSCRIBE TO RECEIVE UPDATES
2024 grant application form, personal and institutional information.
- Full Name * First Last
- Position/Title *
- Affiliated Academic Institution or Research Organization *
Detailed Research Proposal Questions
- Project Title *
- Research Category * - Antisemitism Islamophobia Both
- Objectives *
- Methodology (including who the targeted participants are) *
- Expected Outcomes *
- Significance of the Study *
Budget and Grant Tier Request
- Requested Grant Tier * - $200 $500 $1000 Applicants requesting larger grants may still be eligible for smaller awards if the full amount requested is not granted.
- Budget Justification *
Research Timeline
- Projected Start Date * MM slash DD slash YYYY Preference will be given to projects that can commence soon, preferably before September 2024.
- Estimated Completion Date * MM slash DD slash YYYY Preference will be given to projects that aim to complete within a year.
- Project Timeline *
- Email This field is for validation purposes and should be left unchanged.
- Name * First Name Last Name
- I would like to request a demo of the Sentry platform
- Name * First name Last name
- Comments This field is for validation purposes and should be left unchanged.
- Name * First Last
- Phone This field is for validation purposes and should be left unchanged.
- Name * First and Last
- Please select the best time to discuss your project goals/details to claim your free Sentry pilot for the next 60 days or to receive 10% off your first Managed Research study with Sentry.
- Name This field is for validation purposes and should be left unchanged.
- Email * Enter Email Confirm Email
- Organization
- Job Title *
Educational resources and simple solutions for your research journey

What are Sampling Methods? Techniques, Types, and Examples
Every type of research includes samples from which inferences are drawn. The sample could be biological specimens or a subset of a specific group or population selected for analysis. The goal is often to conclude the entire population based on the characteristics observed in the sample. Now, the question comes to mind: how does one collect the samples? Answer: Using sampling methods. Various sampling strategies are available to researchers to define and collect samples that will form the basis of their research study.
In a study focusing on individuals experiencing anxiety, gathering data from the entire population is practically impossible due to the widespread prevalence of anxiety. Consequently, a sample is carefully selected—a subset of individuals meant to represent (or not in some cases accurately) the demographics of those experiencing anxiety. The study’s outcomes hinge significantly on the chosen sample, emphasizing the critical importance of a thoughtful and precise selection process. The conclusions drawn about the broader population rely heavily on the selected sample’s characteristics and diversity.
Table of Contents
What is sampling?
Sampling involves the strategic selection of individuals or a subset from a population, aiming to derive statistical inferences and predict the characteristics of the entire population. It offers a pragmatic and practical approach to examining the features of the whole population, which would otherwise be difficult to achieve because studying the total population is expensive, time-consuming, and often impossible. Market researchers use various sampling methods to collect samples from a large population to acquire relevant insights. The best sampling strategy for research is determined by criteria such as the purpose of the study, available resources (time and money), and research hypothesis.
For example, if a pet food manufacturer wants to investigate the positive impact of a new cat food on feline growth, studying all the cats in the country is impractical. In such cases, employing an appropriate sampling technique from the extensive dataset allows the researcher to focus on a manageable subset. This enables the researcher to study the growth-promoting effects of the new pet food. This article will delve into the standard sampling methods and explore the situations in which each is most appropriately applied.

What are sampling methods or sampling techniques?
Sampling methods or sampling techniques in research are statistical methods for selecting a sample representative of the whole population to study the population’s characteristics. Sampling methods serve as invaluable tools for researchers, enabling the collection of meaningful data and facilitating analysis to identify distinctive features of the people. Different sampling strategies can be used based on the characteristics of the population, the study purpose, and the available resources. Now that we understand why sampling methods are essential in research, we review the various sample methods in the following sections.
Types of sampling methods
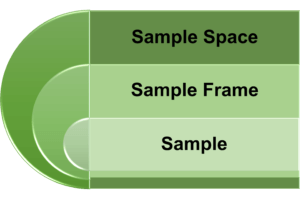
Before we go into the specifics of each sampling method, it’s vital to understand terms like sample, sample frame, and sample space. In probability theory, the sample space comprises all possible outcomes of a random experiment, while the sample frame is the list or source guiding sample selection in statistical research. The sample represents the group of individuals participating in the study, forming the basis for the research findings. Selecting the correct sample is critical to ensuring the validity and reliability of any research; the sample should be representative of the population.
There are two most common sampling methods:
- Probability sampling: A sampling method in which each unit or element in the population has an equal chance of being selected in the final sample. This is called random sampling, emphasizing the random and non-zero probability nature of selecting samples. Such a sampling technique ensures a more representative and unbiased sample, enabling robust inferences about the entire population.
- Non-probability sampling: Another sampling method is non-probability sampling, which involves collecting data conveniently through a non-random selection based on predefined criteria. This offers a straightforward way to gather data, although the resulting sample may or may not accurately represent the entire population.
Irrespective of the research method you opt for, it is essential to explicitly state the chosen sampling technique in the methodology section of your research article. Now, we will explore the different characteristics of both sampling methods, along with various subtypes falling under these categories.
What is probability sampling?
The probability sampling method is based on the probability theory, which means that the sample selection criteria involve some random selection. The probability sampling method provides an equal opportunity for all elements or units within the entire sample space to be chosen. While it can be labor-intensive and expensive, the advantage lies in its ability to offer a more accurate representation of the population, thereby enhancing confidence in the inferences drawn in the research.
Types of probability sampling
Various probability sampling methods exist, such as simple random sampling, systematic sampling, stratified sampling, and clustered sampling. Here, we provide detailed discussions and illustrative examples for each of these sampling methods:

- Simple random sampling: In simple random sampling, each individual has an equal probability of being chosen, and each selection is independent of the others. Because the choice is entirely based on chance, this is also known as the method of chance selection. In the simple random sampling method, the sample frame comprises the entire population.
For example, A fitness sports brand is launching a new protein drink and aims to select 20 individuals from a 200-person fitness center to try it. Employing a simple random sampling approach, each of the 200 people is assigned a unique identifier. Of these, 20 individuals are then chosen by generating random numbers between 1 and 200, either manually or through a computer program. Matching these numbers with the individuals creates a randomly selected group of 20 people. This method minimizes sampling bias and ensures a representative subset of the entire population under study.

- Systematic sampling: The systematic sampling approach involves selecting units or elements at regular intervals from an ordered list of the population. Because the starting point of this sampling method is chosen at random, it is more convenient than essential random sampling. For a better understanding, consider the following example.
For example, considering the previous model, individuals at the fitness facility are arranged alphabetically. The manufacturer then initiates the process by randomly selecting a starting point from the first ten positions, let’s say 8. Starting from the 8th position, every tenth person on the list is then chosen (e.g., 8, 18, 28, 38, and so forth) until a sample of 20 individuals is obtained.

- Stratified sampling: Stratified sampling divides the population into subgroups (strata), and random samples are drawn from each stratum in proportion to its size in the population. Stratified sampling provides improved representation because each subgroup that differs in significant ways is included in the final sample.
For example, Expanding on the previous simple random sampling example, suppose the manufacturer aims for a more comprehensive representation of genders in a sample of 200 people, consisting of 90 males, 80 females, and 30 others. The manufacturer categorizes the population into three gender strata (Male, Female, and Others). Within each group, random sampling is employed to select nine males, eight females, and three individuals from the others category, resulting in a well-rounded and representative sample of 200 individuals.
- Clustered sampling: In this sampling method, the population is divided into clusters, and then a random sample of clusters is included in the final sample. Clustered sampling, distinct from stratified sampling, involves subgroups (clusters) that exhibit characteristics similar to the whole sample. In the case of small clusters, all members can be included in the final sample, whereas for larger clusters, individuals within each cluster may be sampled using the sampling above methods. This approach is referred to as multistage sampling. This sampling method is well-suited for large and widely distributed populations; however, there is a potential risk of sample error because ensuring that the sampled clusters truly represent the entire population can be challenging.

For example, Researchers conducting a nationwide health study can select specific geographic clusters, like cities or regions, instead of trying to survey the entire population individually. Within each chosen cluster, they sample individuals, providing a representative subset without the logistical challenges of attempting a nationwide survey.
Use s of probability sampling
Probability sampling methods find widespread use across diverse research disciplines because of their ability to yield representative and unbiased samples. The advantages of employing probability sampling include the following:
- Representativeness
Probability sampling assures that every element in the population has a non-zero chance of being included in the sample, ensuring representativeness of the entire population and decreasing research bias to minimal to non-existent levels. The researcher can acquire higher-quality data via probability sampling, increasing confidence in the conclusions.
- Statistical inference
Statistical methods, like confidence intervals and hypothesis testing, depend on probability sampling to generalize findings from a sample to the broader population. Probability sampling methods ensure unbiased representation, allowing inferences about the population based on the characteristics of the sample.
- Precision and reliability
The use of probability sampling improves the precision and reliability of study results. Because the probability of selecting any single element/individual is known, the chance variations that may occur in non-probability sampling methods are reduced, resulting in more dependable and precise estimations.
- Generalizability
Probability sampling enables the researcher to generalize study findings to the entire population from which they were derived. The results produced through probability sampling methods are more likely to be applicable to the larger population, laying the foundation for making broad predictions or recommendations.
- Minimization of Selection Bias
By ensuring that each member of the population has an equal chance of being selected in the sample, probability sampling lowers the possibility of selection bias. This reduces the impact of systematic errors that may occur in non-probability sampling methods, where data may be skewed toward a specific demographic due to inadequate representation of each segment of the population.
What is non-probability sampling?
Non-probability sampling methods involve selecting individuals based on non-random criteria, often relying on the researcher’s judgment or predefined criteria. While it is easier and more economical, it tends to introduce sampling bias, resulting in weaker inferences compared to probability sampling techniques in research.
Types of Non-probability Sampling
Non-probability sampling methods are further classified as convenience sampling, consecutive sampling, quota sampling, purposive or judgmental sampling, and snowball sampling. Let’s explore these types of sampling methods in detail.
- Convenience sampling: In convenience sampling, individuals are recruited directly from the population based on the accessibility and proximity to the researcher. It is a simple, inexpensive, and practical method of sample selection, yet convenience sampling suffers from both sampling and selection bias due to a lack of appropriate population representation.

For example, imagine you’re a researcher investigating smartphone usage patterns in your city. The most convenient way to select participants is by approaching people in a shopping mall on a weekday afternoon. However, this convenience sampling method may not be an accurate representation of the city’s overall smartphone usage patterns as the sample is limited to individuals present at the mall during weekdays, excluding those who visit on other days or never visit the mall.
- Consecutive sampling: Participants in consecutive sampling (or sequential sampling) are chosen based on their availability and desire to participate in the study as they become available. This strategy entails sequentially recruiting individuals who fulfill the researcher’s requirements.
For example, In researching the prevalence of stroke in a hospital, instead of randomly selecting patients from the entire population, the researcher can opt to include all eligible patients admitted over three months. Participants are then consecutively recruited upon admission during that timeframe, forming the study sample.
- Quota sampling: The selection of individuals in quota sampling is based on non-random selection criteria in which only participants with certain traits or proportions that are representative of the population are included. Quota sampling involves setting predetermined quotas for specific subgroups based on key demographics or other relevant characteristics. This sampling method employs dividing the population into mutually exclusive subgroups and then selecting sample units until the set quota is reached.

For example, In a survey on a college campus to assess student interest in a new policy, the researcher should establish quotas aligned with the distribution of student majors, ensuring representation from various academic disciplines. If the campus has 20% biology majors, 30% engineering majors, 20% business majors, and 30% liberal arts majors, participants should be recruited to mirror these proportions.
- Purposive or judgmental sampling: In purposive sampling, the researcher leverages expertise to select a sample relevant to the study’s specific questions. This sampling method is commonly applied in qualitative research, mainly when aiming to understand a particular phenomenon, and is suitable for smaller population sizes.

For example, imagine a researcher who wants to study public policy issues for a focus group. The researcher might purposely select participants with expertise in economics, law, and public administration to take advantage of their knowledge and ensure a depth of understanding.
- Snowball sampling: This sampling method is used when accessing the population is challenging. It involves collecting the sample through a chain-referral process, where each recruited candidate aids in finding others. These candidates share common traits, representing the targeted population. This method is often used in qualitative research, particularly when studying phenomena related to stigmatized or hidden populations.

For example, In a study focusing on understanding the experiences and challenges of individuals in hidden or stigmatized communities (e.g., LGBTQ+ individuals in specific cultural contexts), the snowball sampling technique can be employed. The researcher initiates contact with one community member, who then assists in identifying additional candidates until the desired sample size is achieved.
Uses of non-probability sampling
Non-probability sampling approaches are employed in qualitative or exploratory research where the goal is to investigate underlying population traits rather than generalizability. Non-probability sampling methods are also helpful for the following purposes:
- Generating a hypothesis
In the initial stages of exploratory research, non-probability methods such as purposive or convenience allow researchers to quickly gather information and generate hypothesis that helps build a future research plan.
- Qualitative research
Qualitative research is usually focused on understanding the depth and complexity of human experiences, behaviors, and perspectives. Non-probability methods like purposive or snowball sampling are commonly used to select participants with specific traits that are relevant to the research question.
- Convenience and pragmatism
Non-probability sampling methods are valuable when resource and time are limited or when preliminary data is required to test the pilot study. For example, conducting a survey at a local shopping mall to gather opinions on a consumer product due to the ease of access to potential participants.
Probability vs Non-probability Sampling Methods
Frequently asked questions .
- What is multistage sampling ? Multistage sampling is a form of probability sampling approach that involves the progressive selection of samples in stages, going from larger clusters to a small number of participants, making it suited for large-scale research with enormous population lists.
- What are the methods of probability sampling? Probability sampling methods are simple random sampling, stratified random sampling, systematic sampling, cluster sampling, and multistage sampling.
- How to decide which type of sampling method to use? Choose a sampling method based on the goals, population, and resources. Probability for statistics and non-probability for efficiency or qualitative insights can be considered . Also, consider the population characteristics, size, and alignment with study objectives.
- What are the methods of non-probability sampling? Non-probability sampling methods are convenience sampling, consecutive sampling, purposive sampling, snowball sampling, and quota sampling.
- Why are sampling methods used in research? Sampling methods in research are employed to efficiently gather representative data from a subset of a larger population, enabling valid conclusions and generalizations while minimizing costs and time.
R Discovery is a literature search and research reading platform that accelerates your research discovery journey by keeping you updated on the latest, most relevant scholarly content. With 250M+ research articles sourced from trusted aggregators like CrossRef, Unpaywall, PubMed, PubMed Central, Open Alex and top publishing houses like Springer Nature, JAMA, IOP, Taylor & Francis, NEJM, BMJ, Karger, SAGE, Emerald Publishing and more, R Discovery puts a world of research at your fingertips.
Try R Discovery Prime FREE for 1 week or upgrade at just US$72 a year to access premium features that let you listen to research on the go, read in your language, collaborate with peers, auto sync with reference managers, and much more. Choose a simpler, smarter way to find and read research – Download the app and start your free 7-day trial today !
Related Posts

What is Confidence Interval and How to Calculate it (with Examples)

What is Stratified Sampling? Definition, Types, and Examples
An overview of sampling methods
Last updated
27 February 2023
Reviewed by
Cathy Heath
When researching perceptions or attributes of a product, service, or people, you have two options:
Survey every person in your chosen group (the target market, or population), collate your responses, and reach your conclusions.
Select a smaller group from within your target market and use their answers to represent everyone. This option is sampling .
Sampling saves you time and money. When you use the sampling method, the whole population being studied is called the sampling frame .
The sample you choose should represent your target market, or the sampling frame, well enough to do one of the following:
Generalize your findings across the sampling frame and use them as though you had surveyed everyone
Use the findings to decide on your next step, which might involve more in-depth sampling
Make research less tedious
Dovetail streamlines research to help you uncover and share actionable insights
How was sampling developed?
Valery Glivenko and Francesco Cantelli, two mathematicians studying probability theory in the early 1900s, devised the sampling method. Their research showed that a properly chosen sample of people would reflect the larger group’s status, opinions, decisions, and decision-making steps.
They proved you don't need to survey the entire target market, thereby saving the rest of us a lot of time and money.
- Why is sampling important?
We’ve already touched on the fact that sampling saves you time and money. When you get reliable results quickly, you can act on them sooner. And the money you save can pay for something else.
It’s often easier to survey a sample than a whole population. Sample inferences can be more reliable than those you get from a very large group because you can choose your samples carefully and scientifically.
Sampling is also useful because it is often impossible to survey the entire population. You probably have no choice but to collect only a sample in the first place.
Because you’re working with fewer people, you can collect richer data, which makes your research more accurate. You can:
Ask more questions
Go into more detail
Seek opinions instead of just collecting facts
Observe user behaviors
Double-check your findings if you need to
In short, sampling works! Let's take a look at the most common sampling methods.
- Types of sampling methods
There are two main sampling methods: probability sampling and non-probability sampling. These can be further refined, which we'll cover shortly. You can then decide which approach best suits your research project.
Probability sampling method
Probability sampling is used in quantitative research , so it provides data on the survey topic in terms of numbers. Probability relates to mathematics, hence the name ‘quantitative research’. Subjects are asked questions like:
How many boxes of candy do you buy at one time?
How often do you shop for candy?
How much would you pay for a box of candy?
This method is also called random sampling because everyone in the target market has an equal chance of being chosen for the survey. It is designed to reduce sampling error for the most important variables. You should, therefore, get results that fairly reflect the larger population.
Non-probability sampling method
In this method, not everyone has an equal chance of being part of the sample. It's usually easier (and cheaper) to select people for the sample group. You choose people who are more likely to be involved in or know more about the topic you’re researching.
Non-probability sampling is used for qualitative research. Qualitative data is generated by questions like:
Where do you usually shop for candy (supermarket, gas station, etc.?)
Which candy brand do you usually buy?
Why do you like that brand?
- Probability sampling methods
Here are five ways of doing probability sampling:
Simple random sampling (basic probability sampling)
Systematic sampling
Stratified sampling.
Cluster sampling
Multi-stage sampling
Simple random sampling.
There are three basic steps to simple random sampling:
Choose your sampling frame.
Decide on your sample size. Make sure it is large enough to give you reliable data.
Randomly choose your sample participants.
You could put all their names in a hat, shake the hat to mix the names, and pull out however many names you want in your sample (without looking!)
You could be more scientific by giving each participant a number and then using a random number generator program to choose the numbers.
Instead of choosing names or numbers, you decide beforehand on a selection method. For example, collect all the names in your sampling frame and start at, for example, the fifth person on the list, then choose every fourth name or every tenth name. Alternatively, you could choose everyone whose last name begins with randomly-selected initials, such as A, G, or W.
Choose your system of selecting names, and away you go.
This is a more sophisticated way to choose your sample. You break the sampling frame down into important subgroups or strata . Then, decide how many you want in your sample, and choose an equal number (or a proportionate number) from each subgroup.
For example, you want to survey how many people in a geographic area buy candy, so you compile a list of everyone in that area. You then break that list down into, for example, males and females, then into pre-teens, teenagers, young adults, senior citizens, etc. who are male or female.
So, if there are 1,000 young male adults and 2,000 young female adults in the whole sampling frame, you may want to choose 100 males and 200 females to keep the proportions balanced. You then choose the individual survey participants through the systematic sampling method.
Clustered sampling
This method is used when you want to subdivide a sample into smaller groups or clusters that are geographically or organizationally related.
Let’s say you’re doing quantitative research into candy sales. You could choose your sample participants from urban, suburban, or rural populations. This would give you three geographic clusters from which to select your participants.
This is a more refined way of doing cluster sampling. Let’s say you have your urban cluster, which is your primary sampling unit. You can subdivide this into a secondary sampling unit, say, participants who typically buy their candy in supermarkets. You could then further subdivide this group into your ultimate sampling unit. Finally, you select the actual survey participants from this unit.
- Uses of probability sampling
Probability sampling has three main advantages:
It helps minimizes the likelihood of sampling bias. How you choose your sample determines the quality of your results. Probability sampling gives you an unbiased, randomly selected sample of your target market.
It allows you to create representative samples and subgroups within a sample out of a large or diverse target market.
It lets you use sophisticated statistical methods to select as close to perfect samples as possible.
- Non-probability sampling methods
To recap, with non-probability sampling, you choose people for your sample in a non-random way, so not everyone in your sampling frame has an equal chance of being chosen. Your research findings, therefore, may not be as representative overall as probability sampling, but you may not want them to be.
Sampling bias is not a concern if all potential survey participants share similar traits. For example, you may want to specifically focus on young male adults who spend more than others on candy. In addition, it is usually a cheaper and quicker method because you don't have to work out a complex selection system that represents the entire population in that community.
Researchers do need to be mindful of carefully considering the strengths and limitations of each method before selecting a sampling technique.
Non-probability sampling is best for exploratory research , such as at the beginning of a research project.
There are five main types of non-probability sampling methods:
Convenience sampling
Purposive sampling, voluntary response sampling, snowball sampling, quota sampling.
The strategy of convenience sampling is to choose your sample quickly and efficiently, using the least effort, usually to save money.
Let's say you want to survey the opinions of 100 millennials about a particular topic. You could send out a questionnaire over the social media platforms millennials use. Ask respondents to confirm their birth year at the top of their response sheet and, when you have your 100 responses, begin your analysis. Or you could visit restaurants and bars where millennials spend their evenings and sign people up.
A drawback of convenience sampling is that it may not yield results that apply to a broader population.
This method relies on your judgment to choose the most likely sample to deliver the most useful results. You must know enough about the survey goals and the sampling frame to choose the most appropriate sample respondents.
Your knowledge and experience save you time because you know your ideal sample candidates, so you should get high-quality results.
This method is similar to convenience sampling, but it is based on potential sample members volunteering rather than you looking for people.
You make it known you want to do a survey on a particular topic for a particular reason and wait until enough people volunteer. Then you give them the questionnaire or arrange interviews to ask your questions directly.
Snowball sampling involves asking selected participants to refer others who may qualify for the survey. This method is best used when there is no sampling frame available. It is also useful when the researcher doesn’t know much about the target population.
Let's say you want to research a niche topic that involves people who may be difficult to locate. For our candy example, this could be young males who buy a lot of candy, go rock climbing during the day, and watch adventure movies at night. You ask each participant to name others they know who do the same things, so you can contact them. As you make contact with more people, your sample 'snowballs' until you have all the names you need.
This sampling method involves collecting the specific number of units (quotas) from your predetermined subpopulations. Quota sampling is a way of ensuring that your sample accurately represents the sampling frame.
- Uses of non-probability sampling
You can use non-probability sampling when you:
Want to do a quick test to see if a more detailed and sophisticated survey may be worthwhile
Want to explore an idea to see if it 'has legs'
Launch a pilot study
Do some initial qualitative research
Have little time or money available (half a loaf is better than no bread at all)
Want to see if the initial results will help you justify a longer, more detailed, and more expensive research project
- The main types of sampling bias, and how to avoid them
Sampling bias can fog or limit your research results. This will have an impact when you generalize your results across the whole target market. The two main causes of sampling bias are faulty research design and poor data collection or recording. They can affect probability and non-probability sampling.
Faulty research
If a surveyor chooses participants inappropriately, the results will not reflect the population as a whole.
A famous example is the 1948 presidential race. A telephone survey was conducted to see which candidate had more support. The problem with the research design was that, in 1948, most people with telephones were wealthy, and their opinions were very different from voters as a whole. The research implied Dewey would win, but it was Truman who became president.
Poor data collection or recording
This problem speaks for itself. The survey may be well structured, the sample groups appropriate, the questions clear and easy to understand, and the cluster sizes appropriate. But if surveyors check the wrong boxes when they get an answer or if the entire subgroup results are lost, the survey results will be biased.
How do you minimize bias in sampling?
To get results you can rely on, you must:
Know enough about your target market
Choose one or more sample surveys to cover the whole target market properly
Choose enough people in each sample so your results mirror your target market
Have content validity . This means the content of your questions must be direct and efficiently worded. If it isn’t, the viability of your survey could be questioned. That would also be a waste of time and money, so make the wording of your questions your top focus.
If using probability sampling, make sure your sampling frame includes everyone it should and that your random sampling selection process includes the right proportion of the subgroups
If using non-probability sampling, focus on fairness, equality, and completeness in identifying your samples and subgroups. Then balance those criteria against simple convenience or other relevant factors.
What are the five types of sampling bias?
Self-selection bias. If you mass-mail questionnaires to everyone in the sample, you’re more likely to get results from people with extrovert or activist personalities and not from introverts or pragmatists. So if your convenience sampling focuses on getting your quota responses quickly, it may be skewed.
Non-response bias. Unhappy customers, stressed-out employees, or other sub-groups may not want to cooperate or they may pull out early.
Undercoverage bias. If your survey is done, say, via email or social media platforms, it will miss people without internet access, such as those living in rural areas, the elderly, or lower-income groups.
Survivorship bias. Unsuccessful people are less likely to take part. Another example may be a researcher excluding results that don’t support the overall goal. If the CEO wants to tell the shareholders about a successful product or project at the AGM, some less positive survey results may go “missing” (to take an extreme example.) The result is that your data will reflect an overly optimistic representation of the truth.
Pre-screening bias. If the researcher, whose experience and knowledge are being used to pre-select respondents in a judgmental sampling, focuses more on convenience than judgment, the results may be compromised.
How do you minimize sampling bias?
Focus on the bullet points in the next section and:
Make survey questionnaires as direct, easy, short, and available as possible, so participants are more likely to complete them accurately and send them back
Follow up with the people who have been selected but have not returned their responses
Ignore any pressure that may produce bias
- How do you decide on the type of sampling to use?
Use the ideas you've gleaned from this article to give yourself a platform, then choose the best method to meet your goals while staying within your time and cost limits.
If it isn't obvious which method you should choose, use this strategy:
Clarify your research goals
Clarify how accurate your research results must be to reach your goals
Evaluate your goals against time and budget
List the two or three most obvious sampling methods that will work for you
Confirm the availability of your resources (researchers, computer time, etc.)
Compare each of the possible methods with your goals, accuracy, precision, resource, time, and cost constraints
Make your decision
- The takeaway
Effective market research is the basis of successful marketing, advertising, and future productivity. By selecting the most appropriate sampling methods, you will collect the most useful market data and make the most effective decisions.
Should you be using a customer insights hub?
Do you want to discover previous research faster?
Do you share your research findings with others?
Do you analyze research data?
Start for free today, add your research, and get to key insights faster
Editor’s picks
Last updated: 13 April 2023
Last updated: 14 February 2024
Last updated: 27 January 2024
Last updated: 18 April 2023
Last updated: 8 February 2023
Last updated: 23 January 2024
Last updated: 30 January 2024
Last updated: 7 February 2023
Last updated: 18 May 2023
Last updated: 31 January 2024
Last updated: 13 May 2024
Latest articles
Related topics, .css-je19u9{-webkit-align-items:flex-end;-webkit-box-align:flex-end;-ms-flex-align:flex-end;align-items:flex-end;display:-webkit-box;display:-webkit-flex;display:-ms-flexbox;display:flex;-webkit-flex-direction:row;-ms-flex-direction:row;flex-direction:row;-webkit-box-flex-wrap:wrap;-webkit-flex-wrap:wrap;-ms-flex-wrap:wrap;flex-wrap:wrap;-webkit-box-pack:center;-ms-flex-pack:center;-webkit-justify-content:center;justify-content:center;row-gap:0;text-align:center;max-width:671px;}@media (max-width: 1079px){.css-je19u9{max-width:400px;}.css-je19u9>span{white-space:pre;}}@media (max-width: 799px){.css-je19u9{max-width:400px;}.css-je19u9>span{white-space:pre;}} decide what to .css-1kiodld{max-height:56px;display:-webkit-box;display:-webkit-flex;display:-ms-flexbox;display:flex;-webkit-align-items:center;-webkit-box-align:center;-ms-flex-align:center;align-items:center;}@media (max-width: 1079px){.css-1kiodld{display:none;}} build next, decide what to build next.

Users report unexpectedly high data usage, especially during streaming sessions.

Users find it hard to navigate from the home page to relevant playlists in the app.

It would be great to have a sleep timer feature, especially for bedtime listening.

I need better filters to find the songs or artists I’m looking for.
Log in or sign up
Get started for free
Have a language expert improve your writing
Run a free plagiarism check in 10 minutes, automatically generate references for free.
- Knowledge Base
- Methodology
- Sampling Methods | Types, Techniques, & Examples
Sampling Methods | Types, Techniques, & Examples
Published on 3 May 2022 by Shona McCombes . Revised on 10 October 2022.
When you conduct research about a group of people, it’s rarely possible to collect data from every person in that group. Instead, you select a sample. The sample is the group of individuals who will actually participate in the research.
To draw valid conclusions from your results, you have to carefully decide how you will select a sample that is representative of the group as a whole. There are two types of sampling methods:
- Probability sampling involves random selection, allowing you to make strong statistical inferences about the whole group. It minimises the risk of selection bias .
- Non-probability sampling involves non-random selection based on convenience or other criteria, allowing you to easily collect data.
You should clearly explain how you selected your sample in the methodology section of your paper or thesis.
Table of contents
Population vs sample, probability sampling methods, non-probability sampling methods, frequently asked questions about sampling.
First, you need to understand the difference between a population and a sample , and identify the target population of your research.
- The population is the entire group that you want to draw conclusions about.
- The sample is the specific group of individuals that you will collect data from.
The population can be defined in terms of geographical location, age, income, and many other characteristics.

It is important to carefully define your target population according to the purpose and practicalities of your project.
If the population is very large, demographically mixed, and geographically dispersed, it might be difficult to gain access to a representative sample.
Sampling frame
The sampling frame is the actual list of individuals that the sample will be drawn from. Ideally, it should include the entire target population (and nobody who is not part of that population).
You are doing research on working conditions at Company X. Your population is all 1,000 employees of the company. Your sampling frame is the company’s HR database, which lists the names and contact details of every employee.
Sample size
The number of individuals you should include in your sample depends on various factors, including the size and variability of the population and your research design. There are different sample size calculators and formulas depending on what you want to achieve with statistical analysis .
Prevent plagiarism, run a free check.
Probability sampling means that every member of the population has a chance of being selected. It is mainly used in quantitative research . If you want to produce results that are representative of the whole population, probability sampling techniques are the most valid choice.
There are four main types of probability sample.

1. Simple random sampling
In a simple random sample , every member of the population has an equal chance of being selected. Your sampling frame should include the whole population.
To conduct this type of sampling, you can use tools like random number generators or other techniques that are based entirely on chance.
You want to select a simple random sample of 100 employees of Company X. You assign a number to every employee in the company database from 1 to 1000, and use a random number generator to select 100 numbers.
2. Systematic sampling
Systematic sampling is similar to simple random sampling, but it is usually slightly easier to conduct. Every member of the population is listed with a number, but instead of randomly generating numbers, individuals are chosen at regular intervals.
All employees of the company are listed in alphabetical order. From the first 10 numbers, you randomly select a starting point: number 6. From number 6 onwards, every 10th person on the list is selected (6, 16, 26, 36, and so on), and you end up with a sample of 100 people.
If you use this technique, it is important to make sure that there is no hidden pattern in the list that might skew the sample. For example, if the HR database groups employees by team, and team members are listed in order of seniority, there is a risk that your interval might skip over people in junior roles, resulting in a sample that is skewed towards senior employees.
3. Stratified sampling
Stratified sampling involves dividing the population into subpopulations that may differ in important ways. It allows you draw more precise conclusions by ensuring that every subgroup is properly represented in the sample.
To use this sampling method, you divide the population into subgroups (called strata) based on the relevant characteristic (e.g., gender, age range, income bracket, job role).
Based on the overall proportions of the population, you calculate how many people should be sampled from each subgroup. Then you use random or systematic sampling to select a sample from each subgroup.
The company has 800 female employees and 200 male employees. You want to ensure that the sample reflects the gender balance of the company, so you sort the population into two strata based on gender. Then you use random sampling on each group, selecting 80 women and 20 men, which gives you a representative sample of 100 people.
4. Cluster sampling
Cluster sampling also involves dividing the population into subgroups, but each subgroup should have similar characteristics to the whole sample. Instead of sampling individuals from each subgroup, you randomly select entire subgroups.
If it is practically possible, you might include every individual from each sampled cluster. If the clusters themselves are large, you can also sample individuals from within each cluster using one of the techniques above. This is called multistage sampling .
This method is good for dealing with large and dispersed populations, but there is more risk of error in the sample, as there could be substantial differences between clusters. It’s difficult to guarantee that the sampled clusters are really representative of the whole population.
The company has offices in 10 cities across the country (all with roughly the same number of employees in similar roles). You don’t have the capacity to travel to every office to collect your data, so you use random sampling to select 3 offices – these are your clusters.
In a non-probability sample , individuals are selected based on non-random criteria, and not every individual has a chance of being included.
This type of sample is easier and cheaper to access, but it has a higher risk of sampling bias . That means the inferences you can make about the population are weaker than with probability samples, and your conclusions may be more limited. If you use a non-probability sample, you should still aim to make it as representative of the population as possible.
Non-probability sampling techniques are often used in exploratory and qualitative research . In these types of research, the aim is not to test a hypothesis about a broad population, but to develop an initial understanding of a small or under-researched population.

1. Convenience sampling
A convenience sample simply includes the individuals who happen to be most accessible to the researcher.
This is an easy and inexpensive way to gather initial data, but there is no way to tell if the sample is representative of the population, so it can’t produce generalisable results.
You are researching opinions about student support services in your university, so after each of your classes, you ask your fellow students to complete a survey on the topic. This is a convenient way to gather data, but as you only surveyed students taking the same classes as you at the same level, the sample is not representative of all the students at your university.
2. Voluntary response sampling
Similar to a convenience sample, a voluntary response sample is mainly based on ease of access. Instead of the researcher choosing participants and directly contacting them, people volunteer themselves (e.g., by responding to a public online survey).
Voluntary response samples are always at least somewhat biased, as some people will inherently be more likely to volunteer than others.
You send out the survey to all students at your university and many students decide to complete it. This can certainly give you some insight into the topic, but the people who responded are more likely to be those who have strong opinions about the student support services, so you can’t be sure that their opinions are representative of all students.
3. Purposive sampling
Purposive sampling , also known as judgement sampling, involves the researcher using their expertise to select a sample that is most useful to the purposes of the research.
It is often used in qualitative research , where the researcher wants to gain detailed knowledge about a specific phenomenon rather than make statistical inferences, or where the population is very small and specific. An effective purposive sample must have clear criteria and rationale for inclusion.
You want to know more about the opinions and experiences of students with a disability at your university, so you purposely select a number of students with different support needs in order to gather a varied range of data on their experiences with student services.
4. Snowball sampling
If the population is hard to access, snowball sampling can be used to recruit participants via other participants. The number of people you have access to ‘snowballs’ as you get in contact with more people.
You are researching experiences of homelessness in your city. Since there is no list of all homeless people in the city, probability sampling isn’t possible. You meet one person who agrees to participate in the research, and she puts you in contact with other homeless people she knows in the area.
A sample is a subset of individuals from a larger population. Sampling means selecting the group that you will actually collect data from in your research.
For example, if you are researching the opinions of students in your university, you could survey a sample of 100 students.
Statistical sampling allows you to test a hypothesis about the characteristics of a population. There are various sampling methods you can use to ensure that your sample is representative of the population as a whole.
Samples are used to make inferences about populations . Samples are easier to collect data from because they are practical, cost-effective, convenient, and manageable.
Probability sampling means that every member of the target population has a known chance of being included in the sample.
Probability sampling methods include simple random sampling , systematic sampling , stratified sampling , and cluster sampling .
In non-probability sampling , the sample is selected based on non-random criteria, and not every member of the population has a chance of being included.
Common non-probability sampling methods include convenience sampling , voluntary response sampling, purposive sampling , snowball sampling , and quota sampling .
Sampling bias occurs when some members of a population are systematically more likely to be selected in a sample than others.
Cite this Scribbr article
If you want to cite this source, you can copy and paste the citation or click the ‘Cite this Scribbr article’ button to automatically add the citation to our free Reference Generator.
McCombes, S. (2022, October 10). Sampling Methods | Types, Techniques, & Examples. Scribbr. Retrieved 31 May 2024, from https://www.scribbr.co.uk/research-methods/sampling/
Is this article helpful?

Shona McCombes
Other students also liked, what is quantitative research | definition & methods, a quick guide to experimental design | 5 steps & examples, controlled experiments | methods & examples of control.
- Skip to main content
- Skip to primary sidebar
- Skip to footer
- QuestionPro

- Solutions Industries Gaming Automotive Sports and events Education Government Travel & Hospitality Financial Services Healthcare Cannabis Technology Use Case NPS+ Communities Audience Contactless surveys Mobile LivePolls Member Experience GDPR Positive People Science 360 Feedback Surveys
- Resources Blog eBooks Survey Templates Case Studies Training Help center
Home Market Research
Market Research: What it Is, Methods, Types & Examples

Would you like to know why, how, and when to apply market research? Do you want to discover why your consumers are not buying your products? Are you interested in launching a new product, service, or even a new marketing campaign, but you’re not sure what your consumers want?
LEARN ABOUT: Market research vs marketing research
To answer the questions above, you’ll need help from your consumers. But how will you collect that data? In this case and in many other situations in your business, market research is the way to get all the answers you need.
In this ultimate guide about market research, you’ll find the definition, advantages, types of market research, and some examples that will help you understand this type of research. Don’t forget to download the free ebook available at the end of this guide!
LEARN ABOUT: Perceived Value
Content Index
Three key objectives of market research
Why is market research important.
- Types of Market Research: Methods and Examples
Steps for conducting Market Research
Benefits of an efficient market research, 5 market research tips for businesses, why does every business need market research, free market research ebook, what is market research.
Market research is a technique that is used to collect data on any aspect that you want to know to be later able to interpret it and, in the end, make use of it for correct decision-making.
Another more specific definition could be the following:
Market research is the process by which companies seek to collect data systematically to make better decisions. Still, its true value lies in the way in which all the data obtained is used to achieve a better knowledge of the market consumer.
The process of market research can be done through deploying surveys , interacting with a group of people, also known as a sample , conducting interviews, and other similar processes.
The primary purpose of conducting market research is to understand or examine the market associated with a particular product or service to decide how the audience will react to a product or service. The information obtained from conducting market research can be used to tailor marketing/ advertising activities or determine consumers’ feature priorities/service requirement (if any).
LEARN ABOUT: Consumer Surveys
Conducting research is one of the best ways of achieving customer satisfaction , reducing customer churn and elevating business. Here are the reasons why market research is important and should be considered in any business:
- Valuable information: It provides information and opportunities about the value of existing and new products, thus, helping businesses plan and strategize accordingly.
- Customer-centric: It helps to determine what the customers need and want. Marketing is customer-centric and understanding the customers and their needs will help businesses design products or services that best suit them. Remember that tracing your customer journey is a great way to gain valuable insights into your customers’ sentiments toward your brand.
- Forecasts: By understanding the needs of customers, businesses can also forecast their production and sales. Market research also helps in determining optimum inventory stock.
- Competitive advantage: To stay ahead of competitors market research is a vital tool to carry out comparative studies. Businesses can devise business strategies that can help them stay ahead of their competitors.
LEARN ABOUT: Data Analytics Projects
Types of Market Research: Market Research Methods and Examples
Whether an organization or business wishes to know the purchase behavior of consumers or the likelihood of consumers paying a certain cost for a product segmentation , market research helps in drawing meaningful conclusions.
LEARN ABOUT: Behavioral Targeting
Depending on the methods and tools required, the following are the types:
1. Primary Market Research (A combination of both Qualitative and Quantitative Research):
Primary market research is a process where organizations or businesses get in touch with the end consumers or employ a third party to carry out relevant studies to collect data. The data collected can be qualitative data (non-numerical data) or quantitative data (numerical or statistical data).
While conducting primary market research, one can gather two types of information: Exploratory and Specific. Exploratory research is open-ended, where a problem is explored by asking open ended questions in a detailed interview format usually with a small group of people, also known as a sample. Here the sample size is restricted to 6-10 members. Specific research, on the other hand, is more pinpointed and is used to solve the problems that are identified by exploratory research.
LEARN ABOUT: Marketing Insight
As mentioned earlier, primary market research is a combination of qualitative market research and quantitative market research. Qualitative market research study involves semi-structured or unstructured data collected through some of the commonly used qualitative research methods like:

Focus groups :
Focus group is one of the commonly used qualitative research methods. Focus group is a small group of people (6-10) who typically respond to online surveys sent to them. The best part about a focus group is the information can be collected remotely, can be done without personally interacting with the group members. However, this is a more expensive method as it is used to collect complex information.
One-to-one interview:
As the name suggests, this method involves personal interaction in the form of an interview, where the researcher asks a series of questions to collect information or data from the respondents. The questions are mostly open-ended questions and are asked to facilitate responses. This method heavily depends on the interviewer’s ability and experience to ask questions that evoke responses.
Ethnographic research :
This type of in-depth research is conducted in the natural settings of the respondents. This method requires the interviewer to adapt himself/herself to the natural environment of the respondents which could be a city or a remote village. Geographical constraints can be a hindering market research factor in conducting this kind of research. Ethnographic research can last from a few days to a few years.
Organizations use qualitative research methods to conduct structured market research by using online surveys , questionnaires , and polls to gain statistical insights to make informed decisions.
LEARN ABOUT: Qualitative Interview
This method was once conducted using pen and paper. This has now evolved to sending structured online surveys to the respondents to gain actionable insights. Researchers use modern and technology-oriented survey platforms to structure and design their survey to evoke maximum responses from respondents.
Through a well-structured mechanism, data is easily collected and reported, and necessary action can be taken with all the information made available firsthand.
Learn more: How to conduct quantitative research
2. Secondary Market Research:
Secondary research uses information that is organized by outside sources like government agencies, media, chambers of commerce etc. This information is published in newspapers, magazines, books, company websites, free government and nongovernment agencies and so on. The secondary source makes use of the following:
- Public sources: Public sources like library are an awesome way of gathering free information. Government libraries usually offer services free of cost and a researcher can document available information.
- Commercial sources: Commercial source although reliable are expensive. Local newspapers, magazines, journal, television media are great commercial sources to collect information.
- Educational Institutions: Although not a very popular source of collecting information, most universities and educational institutions are a rich source of information as many research projects are carried out there than any business sector.
Learn more: Market Research Example with Types and Methods
A market research project may usually have 3 different types of objectives.
- Administrative : Help a company or business development, through proper planning, organization, and both human and material resources control, and thus satisfy all specific needs within the market, at the right time.
- Social : Satisfy customers’ specific needs through a required product or service. The product or service should comply with a customer’s requirements and preferences when consumed.
- Economical : Determine the economical degree of success or failure a company can have while being new to the market, or otherwise introducing new products or services, thus providing certainty to all actions to be implemented.
LEARN ABOUT: Test Market Demand
Knowing what to do in various situations that arise during the investigation will save the researcher time and reduce research problems . Today’s successful enterprises use powerful market research survey software that helps them conduct comprehensive research under a unified platform, providing actionable insights much faster with fewer problems.
LEARN ABOUT: Market research industry
Following are the steps to conduct effective market research.
Step #1: Define the Problem
Having a well-defined subject of research will help researchers when they ask questions. These questions should be directed to solve problems and must be adapted to the project. Make sure the questions are written clearly and that the respondents understand them. Researchers can conduct a marketing test with a small group to know if the questions are going to know whether the asked questions are understandable and if they will be enough to gain insightful results.
Research objectives should be written in a precise way and should include a brief description of the information that is needed and the way in which it will obtain it. They should have an answer to this question “why are we doing the research?”
Learn more: Interview Questions
Step #2: Define the Sample
To carry out market research, researchers need a representative sample that can be collected using one of the many sampling techniques . A representative sample is a small number of people that reflect, as accurately as possible, a larger group.
- An organization cannot waste their resources in collecting information from the wrong population. It is important that the population represents characteristics that matter to the researchers and that they need to investigate, are in the chosen sample.
- Take into account that marketers will always be prone to fall into a bias in the sample because there will always be people who do not answer the survey because they are busy, or answer it incompletely, so researchers may not obtain the required data.
- Regarding the size of the sample, the larger it is, the more likely it is to be representative of the population. A larger representative sample gives the researcher greater certainty that the people included are the ones they need, and they can possibly reduce bias. Therefore, if they want to avoid inaccuracy in our surveys, they should have representative and balanced samples.
- Practically all the surveys that are considered in a serious way, are based on a scientific sampling, based on statistical and probability theories.
There are two ways to obtain a representative sample:
- Probability sampling : In probability sampling , the choice of the sample will be made at random, which guarantees that each member of the population will have the same probability of selection bias and inclusion in the sample group. Researchers should ensure that they have updated information on the population from which they will draw the sample and survey the majority to establish representativeness.
- Non-probability sampling : In a non-probability sampling , different types of people are seeking to obtain a more balanced representative sample. Knowing the demographic characteristics of our group will undoubtedly help to limit the profile of the desired sample and define the variables that interest the researchers, such as gender, age, place of residence, etc. By knowing these criteria, before obtaining the information, researchers can have the control to create a representative sample that is efficient for us.
When a sample is not representative, there can be a margin of error . If researchers want to have a representative sample of 100 employees, they should choose a similar number of men and women.
The sample size is very important, but it does not guarantee accuracy. More than size, representativeness is related to the sampling frame , that is, to the list from which people are selected, for example, part of a survey.
LEARN ABOUT: Behavioral Research If researchers want to continue expanding their knowledge on how to determine the size of the sample consult our guide on sampling here.
Step #3: Carry out data collection
First, a data collection instrument should be developed. The fact that they do not answer a survey, or answer it incompletely will cause errors in research. The correct collection of data will prevent this.
Step #4: Analyze the results
Each of the points of the market research process is linked to one another. If all the above is executed well, but there is no accurate analysis of the results, then the decisions made consequently will not be appropriate. In-depth analysis conducted without leaving loose ends will be effective in gaining solutions. Data analysis will be captured in a report, which should also be written clearly so that effective decisions can be made on that basis.
Analyzing and interpreting the results is to look for a wider meaning to the obtained data. All the previous phases have been developed to arrive at this moment. How can researchers measure the obtained results? The only quantitative data that will be obtained is age, sex, profession, and number of interviewees because the rest are emotions and experiences that have been transmitted to us by the interlocutors. For this, there is a tool called empathy map that forces us to put ourselves in the place of our clientele with the aim of being able to identify, really, the characteristics that will allow us to make a better adjustment between our products or services and their needs or interests. When the research has been carefully planned, the hypotheses have been adequately defined and the indicated collection method has been used, the interpretation is usually carried out easily and successfully. What follows after conducting market research?
Learn more: Types of Interviews
Step #5: Make the Research Report
When presenting the results, researchers should focus on: what do they want to achieve using this research report and while answering this question they should not assume that the structure of the survey is the best way to do the analysis. One of the big mistakes that many researchers make is that they present the reports in the same order of their questions and do not see the potential of storytelling.

To make good reports, the best analysts give the following advice: follow the inverted pyramid style to present the results, answering at the beginning the essential questions of the business that caused the investigation. Start with the conclusions and give them fundamentals, instead of accumulating evidence. After this researchers can provide details to the readers who have the time and interest.
Step #6: Make Decisions
An organization or a researcher should never ask “why do market research”, they should just do it! Market research helps researchers to know a wide range of information, for example, consumer purchase intentions, or gives feedback about the growth of the target market. They can also discover valuable information that will help in estimating the prices of their product or service and find a point of balance that will benefit them and the consumers.
Take decisions! Act and implement.
Learn more: Quantitative Research
- Make well-informed decisions: The growth of an organization is dependent on the way decisions are made by the management. Using market research techniques, the management can make business decisions based on obtained results that back their knowledge and experience. Market research helps to know market trends, hence to carry it out frequently to get to know the customers thoroughly.
LEARN ABOUT: Research Process Steps
- Gain accurate information: Market research provides real and accurate information that will prepare the organization for any mishaps that may happen in the future. By properly investigating the market, a business will undoubtedly be taking a step forward, and therefore it will be taking advantage of its existing competitors.
- Determine the market size: A researcher can evaluate the size of the market that must be covered in case of selling a product or service in order to make profits.
- Choose an appropriate sales system: Select a precise sales system according to what the market is asking for, and according to this, the product/service can be positioned in the market.
- Learn about customer preferences: It helps to know how the preferences (and tastes) of the clients change so that the company can satisfy preferences, purchasing habits, and income levels. Researchers can determine the type of product that must be manufactured or sold based on the specific needs of consumers.
- Gather details about customer perception of the brand: In addition to generating information, market research helps a researcher in understanding how the customers perceive the organization or brand.
- Analyze customer communication methods: Market research serves as a guide for communication with current and potential clients.
- Productive business investment: It is a great investment for any business because thanks to it they get invaluable information, it shows researchers the way to follow to take the right path and achieve the sales that are required.
LEARN ABOUT: Total Quality Management
The following tips will help businesses with creating a better market research strategy.
Tip #1: Define the objective of your research.
Before starting your research quest, think about what you’re trying to achieve next with your business. Are you looking to increase traffic to your location? Or increase sales? Or convert customers from one-time purchasers to regulars? Figuring out your objective will help you tailor the rest of your research and your future marketing materials. Having an objective for your research will flesh out what kind of data you need to collect.
Tip #2: Learn About Your Target Customers.
The most important thing to remember is that your business serves a specific kind of customer. Defining your specific customer has many advantages like allowing you to understand what kind of language to use when crafting your marketing materials, and how to approach building relationships with your customer. When you take time to define your target customer you can also find the best products and services to sell to them.
You want to know as much as you can about your target customer. You can gather this information through observation and by researching the kind of customers who frequent your type of business. For starters, helpful things to know are their age and income. What do they do for a living? What’s their marital status and education level?
Learn more: Customer Satisfaction
Tip #3: Recognize that knowing who you serve helps you define who you do not.
Let’s take a classic example from copywriting genius Dan Kennedy. He says that if you’re opening up a fine dining steakhouse focused on decadent food, you know right off the bat that you’re not looking to attract vegetarians or dieters. Armed with this information, you can create better marketing messages that speak to your target customers.
It’s okay to decide who is not a part of your target customer base. In fact, for small businesses knowing who you don’t cater to can be essential in helping you grow. Why? Simple, if you’re small your advantage is that you can connect deeply with a specific segment of the market. You want to focus your efforts on the right customer who already is compelled to spend money on your offer.
If you’re spreading yourself thin by trying to be all things to everyone, you will only dilute your core message. Instead, keep your focus on your target customer. Define them, go deep, and you’ll be able to figure out how you can best serve them with your products and services.
Tip #4: Learn from your competition.
This works for brick-and-mortar businesses as well as internet businesses because it allows you to step into the shoes of your customer and open up to a new perspective of your business. Take a look around the internet and around your town. If you can, visit your competitor’s shops. For example, if you own a restaurant specializing in Italian cuisine, dine at the other Italian place in your neighborhood or in the next township.
As you experience the business from the customer’s perspective, look for what’s being done right and wrong.
Can you see areas that need attention or improvement? How are you running things in comparison? What’s the quality of their product and customer service ? Are the customers here pleased? Also, take a close look at their market segment. Who else is patronizing their business? Are they the same kinds of people who spend money with you? By asking these questions and doing in-person research, you can dig up a lot of information to help you define your unique selling position and create even better offers for your customers.
Tip #5: Get your target customers to open up and tell you everything.
A good customer survey is one of the most valuable market research tools because it gives you the opportunity to get inside your customer’s head. However, remember that some feedback may be harsh, so take criticism as a learning tool to point you in the right direction.
Creating a survey is simple. Ask questions about what your customer thinks you’re doing right and what can be improved. You can also prompt them to tell you what kinds of products and services they’d like to see you add, giving you fantastic insight into how to monetize your business more. Many customers will be delighted to offer feedback. You can even give customers who fill out surveys a gift like a special coupon for their next purchase.
Bonus Tip: Use an insight & research repository
An insight & research repository is a consolidated research management platform to derive insights about past and ongoing market research. With the use of such a tool, you can leverage past research to get to insights faster, build on previously done market research and draw trendlines, utilize research techniques that have worked in the past, and more.
Market research is one of the most effective ways to gain insight into your customer base , competitors , and the overall market. The goal of conducting market research is to equip your company with the information you need to make informed decisions.
It is especially important when small businesses are trying to determine whether a new business idea is viable, looking to move into a new market, or are launching a new product or service. Read below for a more in-depth look at how market research can help small businesses.
- COMPETITION According to a study conducted by Business Insider, 72% of small businesses focus on increasing revenue. Conducting research helps businesses gain insight into competitor behavior. By learning about your competitor’s strengths and weaknesses, you can learn how to position your product or offering. In order to be successful, small businesses need to have an understanding of what products and services competitors are offering, and their price point.
Learn more: Trend Analysis
- CUSTOMERS Many small businesses feel they need to understand their customers, only to conduct market research and learn they had the wrong assumptions. By researching, you can create a profile of your average customer and gain insight into their buying habits, how much they’re willing to spend, and which features resonate with them. Additionally, and perhaps more importantly, you can learn what will make someone use your product or service over a competitor.
Learn more: Customer Satisfaction Survey
- OPPORTUNITIES Potential opportunities, whether they are products or services, can be identified by conducting market research. By learning more about your customers, you can gather insights into complementary products and services. Consumer needs change over time, influenced by new technology and different conditions, and you may find new needs that are not being met, which can create new opportunities for your business.
Learn more: SWOT Analysis
- FORECAST A small business is affected by the performance of the local and national economy, as are its’ customers. If consumers are worried, then they will be more restrained when spending money, which affects the business. By conducting research with consumers, businesses can get an idea of whether they are optimistic or apprehensive about the direction of the economy, and make adjustments as necessary. For example, a small business owner may decide to postpone a new product launch if it appears the economic environment is turning negative.
Learn more: 300+ Market Research Survey Questionnaires
Market research and market intelligence may be as complex as the needs that each business or project has. The steps are usually the same. We hope this ultimate guide helps you have a better understanding of how to make your own market research project to gather insightful data and make better decisions.
LEARN ABOUT: Projective Techniques
We appreciate you taking the time to read this ultimate guide. We hope it was helpful!
You can now download our free ebook that will guide you through a market research project, from the planning stage to the presentation of the outcomes and their analysis.
Sign up now, and download our free ebook: The Hacker’s Guide to Advanced Research Methodologies
DOWNLOAD NOW
MORE LIKE THIS

Raked Weighting: A Key Tool for Accurate Survey Results
May 31, 2024

Top 8 Data Trends to Understand the Future of Data
May 30, 2024

Top 12 Interactive Presentation Software to Engage Your User
May 29, 2024

Trend Report: Guide for Market Dynamics & Strategic Analysis
Other categories.
- Academic Research
- Artificial Intelligence
- Assessments
- Brand Awareness
- Case Studies
- Communities
- Consumer Insights
- Customer effort score
- Customer Engagement
- Customer Experience
- Customer Loyalty
- Customer Research
- Customer Satisfaction
- Employee Benefits
- Employee Engagement
- Employee Retention
- Friday Five
- General Data Protection Regulation
- Insights Hub
- Life@QuestionPro
- Market Research
- Mobile diaries
- Mobile Surveys
- New Features
- Online Communities
- Question Types
- Questionnaire
- QuestionPro Products
- Release Notes
- Research Tools and Apps
- Revenue at Risk
- Survey Templates
- Training Tips
- Uncategorized
- Video Learning Series
- What’s Coming Up
- Workforce Intelligence
Product Overview
SurveyMonkey is built to handle every use case and need. Explore our product to learn how SurveyMonkey can work for you.
SurveyMonkey
Get data-driven insights from a global leader in online surveys.
Integrations
Integrate with 100+ apps and plug-ins to get more done.
SurveyMonkey Forms
Build and customize online forms to collect info and payments.
SurveyMonkey Genius
Create better surveys and spot insights quickly with built-in AI.
Market Research Solutions
Purpose-built solutions for all of your market research needs.
Financial Services
See more industries, customer experience, human resources, see more roles.
Online Polls
Registration Forms
Employee feedback, event feedback, customer satisfaction, see more use cases.
Contact Sales
Net Promoter Score
Measure customer satisfaction and loyalty for your business.
Learn what makes customers happy and turn them into advocates.
Website Feedback
Get actionable insights to improve the user experience.
Contact Information
Collect contact information from prospects, invitees, and more.
Event Registration
Easily collect and track RSVPs for your next event.
Find out what attendees want so that you can improve your next event.
Employee Engagement
Uncover insights to boost engagement and drive better results.
Meeting Feedback
Get feedback from your attendees so you can run better meetings.
360-degree employee evaluation
Use peer feedback to help improve employee performance.
Course Evaluation
Create better courses and improve teaching methods.
University Instructor Evaluation
Learn how students rate the course material and its presentation.
Product Testing
Find out what your customers think about your new product ideas.
See all templates
Resource center.
Best practices for using surveys and survey data
Curiosity at Work Blog
Our blog about surveys, tips for business, and more.
Help Center
Tutorials and how to guides for using SurveyMonkey.
How top brands drive growth with SurveyMonkey.
- English (US)
- English (UK)
Global survey panel
More Resources
Audience targeting
Data quality
Budgeting options
Guides & case studies
Types of sampling design and which to choose
A successful survey requires an effective sampling design. SurveyMonkey can help.
While you’d certainly like to have information from every person in your target market when you’re conducting research, it just isn’t possible—but that doesn’t mean you can’t complete your research objectives. When you need to gather data from your target market, you can select a representative sample to participate in the research. This sample is the foundation of your research, so you’ll need to select the best sampling design to obtain your sample.
Let’s take a closer look at sampling and sampling design, plus how they fit in with your market research needs.
What is sampling, and why use it in your research?
In the context of market research, a sample is a subset of a larger group of people you want to draw conclusions about (a population). Sampling is the process of choosing the group that you ultimately use to obtain your research data. These definitions are informative, but they don’t provide details.
Let’s say you want to conduct market research, and your target population is women in the US over the age of 35. You know that, unfortunately, you can’t possibly obtain responses from ALL women in the US over 35, but you need feedback that represents this market. To resolve your problem, you use a subset of the larger population you’re targeting. This subset is considered representative of the population as a whole and makes gathering data much more manageable.
The selected subset must be truly representative of the population, or your study may suffer from sampling bias and affect the accuracy and usefulness of your results. But how large should your sample be to obtain the best results? Sample size may be calculated using population size, the margin of error, and confidence level.
Begin with your population size. This is the total number of individuals in the group you want to study. Then, determine your margin of error —how much you expect your sample results to reflect the opinions of your population. 5% is the most commonly used margin of error.
Lastly, you need to determine the confidence level. This percentage reflects how confident you are that the population would select an answer within a set range.
This is the formula for determining sample size:
N = population size
e = margin of error (percentage in decimal form)
z = z-score (number of standard deviations a given proportion is away from the mean- use the chart below)
To make things a little easier for you, SurveyMonkey has provided a sample size calculator that will do the math for you. Just enter your variables, and our tool will do the rest.
What is sampling design?
Sampling design is the method you use to choose your sample. There are several types of sampling designs, and they all serve as roadmaps for the selection of your survey sample. The objective of sampling design is to ensure that your selected sample allows you to generalize your findings to the entire population you’re targeting.
Keep in mind the following points when developing your survey design:
- Define the universe of your study: This is the set of objects you are studying. This could be the population of a city, the number of workers in a warehouse, or fans of a particular television show.
- Consider your sampling unit: Will it be geographical, social, or individual?
- Gather your sampling frame: This is the list of names from which your sample will be drawn.
- Determine sample size: Use the equation above or our helpful sample size calculator .
- Factor in budgetary limitations: This will impact both the size and type of sample and may even lead you to use a non-probability sample.
What are the types of sampling design?
Sampling design can be divided into two main categories, probability, and non-probability sampling. In probability sampling, every person in the target population (either random or representative) has an equal chance of being selected for the sample. In non-probability sampling, some individuals in the group will be more likely to be selected than others.
Take a close look at your research goals (including the level of accuracy desired and your budget) to determine which type of sampling will best help you achieve those goals.
Probability sampling
Probability sampling ensures that every member of your sample has an equal probability of being selected for your research. There are four main types of probability sampling: simple random, cluster, systematic, and stratified.
Simple random sampling
As the name suggests, simple random sampling is both simple and random. With this method, you may choose your sample with a random number generator or by drawing from a hat, for example, to provide you with a completely random subset of your group. This allows you to draw generalized conclusions about the whole population based on the data provided from the subset (sample).
As an example, let’s say that your population is the employees of your company. You take each of your 1,500 employees and randomly assign numbers to each one. Then, using a random number generator, you select 150 numbers. Those 150 are your sample.
Cluster sampling
In cluster sampling, your population is divided into subgroups that have similar characteristics to the whole population. Instead of selecting individuals, you randomly select an entire subgroup for your sample.
There is a higher probability of error with this method because there could be differences between the clusters. You cannot guarantee that the sample you use is truly representative of the entire population you’re studying.
Let’s look at your company again. The 1,500 employees are spread across 25 offices with close to the same number of employees in each office. You use cluster sampling to choose the employees of four offices to use as your sample.
Systematic sampling
Similar to simple random sampling, systematic sampling is even easier to conduct. In this method, each individual in the desired population is assigned a number. Instead of randomly generating numbers, participants are chosen at regular intervals. It’s important that there is no hidden pattern in the list that may skew the sample.
For example, if your research population is comprised of the employees at your company and you generate a list of all their names from HR, it’s important to ensure that the list is not in any kind of order. If the list is by department or team and/or seniority, you risk skipping individuals from certain departments or seniority levels.
Once your list is randomized, you choose a starting number, #8, for example, and from that point forward, you select every tenth employee—18, 28, 38, etc.
Stratified sampling
In stratified random sampling , you divide a population into smaller subgroups called strata. The strata are based on the shared attributes of the individuals, such as income, age range, or education level. This method is used when you believe that these similarities indicate additional similarities that will resonate with your broader population.
Back at your company, you have 900 male employees and 600 females. You want your sample to represent the gender balance in your company, so you sort into two strata based on gender. Using random sampling in each group, you select 90 men and 60 women for a sample of 150 people.
Non-probability sampling
In non-probability samples, the criteria for selection are not random, and the chances of being included in the sample are not equal. While it’s easier and less expensive to perform non-probability sampling, there is a higher risk of sampling bias, and inferences about the full population are weaker.
Non-probability sampling is most often used in exploratory or qualitative research, where the goal is to develop an understanding of a small or underrepresented population.
There are five main types of non-probability sampling: convenience, judgemental, voluntary, snowball, and quota.
Convenience sampling
In convenience sampling, the sample consists of individuals who are most accessible to the researcher. It may be easy to collect initial information, but it cannot be generalized to your target population.
Back at your company, you’re in a rush to get some preliminary data about your idea. You turn to your colleagues in the marketing department as your sample and collect information from them. This sample gives you initial data but is not representative of the views of all employees in the company.
Judgemental or purposive sampling
In this type of non-probability sampling, the researcher uses their expertise to choose a sample that they believe will be most useful in reaching their research objectives. Judgemental sampling is frequently used in qualitative research, where statistical inferences are unnecessary, or the population is quite small. To be effective, the sample must have clear inclusion and exclusion criteria.
For example, the latest research you’re performing for your company explores the experiences of employees with disabilities. You purposively choose employees with support needs as your sample to assess their experiences and needs in your organization.
Voluntary response sampling
Based on ease of access like convenience sampling, voluntary response sampling is when people volunteer to participate in your research. Because some people are more likely to volunteer than others, there will likely be some bias involved.
Consider your company again. You send a survey out to all employees to gather information about employee satisfaction. The survey is voluntary, and the employees who respond have strong opinions. There’s no way to be certain that these responses are indicative of the opinions of all employees.
Snowball sampling
The snowball sampling method is used when your population is difficult to access. You reach out to the members of the population that you can and then count on these participants to recruit others for your study. The number of participants “snowballs” as the number increases.
Your company produces an app designed to help people with mental illnesses. Due to HIPAA laws, there is no efficient legal or ethical way to collect a list of individuals who might participate in your research. You reach out to people you know who suffer from depression and ask them to refer others who may be interested in trying your app for research purposes and providing you with information about their experiences.
Quota sampling
With quota sampling, your population is divided into categories determined by the researcher. Depending on the research, you may need a particular number of males or females, or you may need your sample to represent a certain income level or age range. Bias may occur simply based on the categories chosen by the researchers.
An example of quota sampling would be if you decided your research would be easiest if you reach out to C-level executives for their input on the new management app you’ve designed. By choosing only the highest-level managers, you may be omitting input from other management levels that could be valuable. However, if C-suite managers are the target audience for your app, this is a fast way to gain insights.
What are the key steps in sampling design?
When you’re ready to begin, the process is fairly straightforward. There are five key steps in sampling design.
- Define target population
What population do you want to study? Determine who will provide you with the most useful information for your research and help you meet your objectives.
- Choose a sample frame
A sample frame is the group of people from which you’ll pull your sample.
- Select a sampling method
Choose a sampling method based on your research needs. Take your time and find the best method for your specific study.
- Determine sample size
Use our sample size calculator to determine the necessary sample size for your study.
- Execute the sample
Implement your research plan according to your chosen methodology.
Which sampling design should you use?
Review the various sampling designs we’ve discussed in this article to find the one that’s most compatible with your research. Select your method carefully, considering the benefits and limitations of each sampling method and whether it will provide you with the information you need to meet your goals and objectives.
The easiest way to find the right sample for your research is to use SurveyMonkey Audience . Choose your sample size and characteristics, and we’ll send out your survey. Collect real-time results from the respondents you’ve chosen and employ our analysis tools for your data. We welcome you to check out all of our market research solutions and find out how simple market research can be with the right tools!
Get started with your market research
Research services, expert solutions.
To read more market research resources, visit our Sitemap .
App Directory
Vision and Mission
SurveyMonkey Together
Diversity, Equity & Inclusion
Health Plan Transparency in Coverage
Office Locations
Terms of Use
Privacy Notice
California Privacy Notice
Acceptable Uses Policy
Security Statement
GDPR Compliance
Email Opt-In
Accessibility
Cookies Notice
Facebook Surveys
Survey Template
Scheduling Polls
Google Forms vs. SurveyMonkey
Employee Satisfaction Surveys
Free Survey Templates
Mobile Surveys
How to Improve Customer Service
AB Test Significance Calculator
NPS Calculator
Questionnaire Templates
Event Survey
Sample Size Calculator
Writing Good Surveys
Likert Scale
Survey Analysis
360 Degree Feedback
Education Surveys
Survey Questions
NPS Calculation
Customer Satisfaction Survey Questions
Agree Disagree Questions
Create a Survey
Online Quizzes
Qualitative vs Quantitative Research
Customer Survey
Market Research Surveys
Survey Design Best Practices
Margin of Error Calculator
Questionnaire
Demographic Questions
Training Survey
Offline Survey
360 Review Template
Root out friction in every digital experience, super-charge conversion rates, and optimise digital self-service
Uncover insights from any interaction, deliver AI-powered agent coaching, and reduce cost to serve
Increase revenue and loyalty with real-time insights and recommendations delivered straight to teams on the ground
Know exactly how your people feel and empower managers to improve employee engagement, productivity, and retention
Take action in the moments that matter most along the employee journey and drive bottom line growth
Whatever they’re are saying, wherever they’re saying it, know exactly what’s going on with your people
Get faster, richer insights with qual and quant tools that make powerful market research available to everyone
Run concept tests, pricing studies, prototyping + more with fast, powerful studies designed by UX research experts
Track your brand performance 24/7 and act quickly to respond to opportunities and challenges in your market
Meet the operating system for experience management
- Free Account
- For Digital
- For Customer Care
- For Human Resources
- For Researchers
- Financial Services
- All Industries
Popular Use Cases
- Customer Experience
- Employee Experience
- Employee Exit Interviews
- Net Promoter Score
- Voice of Customer
- Customer Success Hub
- Product Documentation
- Training & Certification
- XM Institute
- Popular Resources
- Customer Stories
- Artificial Intelligence
- Market Research
- Partnerships
- Marketplace
The annual gathering of the experience leaders at the world’s iconic brands building breakthrough business results.
- English/AU & NZ
- Español/Europa
- Español/América Latina
- Português Brasileiro
- REQUEST DEMO
- Experience Management
- Sampling Methods
Try Qualtrics for free
Sampling methods, types & techniques.
15 min read Your comprehensive guide to the different sampling methods available to researchers – and how to know which is right for your research.
What is sampling?
In survey research, sampling is the process of using a subset of a population to represent the whole population. To help illustrate this further, let’s look at data sampling methods with examples below.
Let’s say you wanted to do some research on everyone in North America. To ask every person would be almost impossible. Even if everyone said “yes”, carrying out a survey across different states, in different languages and timezones, and then collecting and processing all the results , would take a long time and be very costly.
Sampling allows large-scale research to be carried out with a more realistic cost and time-frame because it uses a smaller number of individuals in the population with representative characteristics to stand in for the whole.
However, when you decide to sample, you take on a new task. You have to decide who is part of your sample list and how to choose the people who will best represent the whole population. How you go about that is what the practice of sampling is all about.

Sampling definitions
- Population: The total number of people or things you are interested in
- Sample: A smaller number within your population that will represent the whole
- Sampling: The process and method of selecting your sample
Free eBook: 2024 Market Research Trends
Why is sampling important?
Although the idea of sampling is easiest to understand when you think about a very large population, it makes sense to use sampling methods in research studies of all types and sizes. After all, if you can reduce the effort and cost of doing a study, why wouldn’t you? And because sampling allows you to research larger target populations using the same resources as you would smaller ones, it dramatically opens up the possibilities for research.
Sampling is a little like having gears on a car or bicycle. Instead of always turning a set of wheels of a specific size and being constrained by their physical properties, it allows you to translate your effort to the wheels via the different gears, so you’re effectively choosing bigger or smaller wheels depending on the terrain you’re on and how much work you’re able to do.
Sampling allows you to “gear” your research so you’re less limited by the constraints of cost, time, and complexity that come with different population sizes.
It allows us to do things like carrying out exit polls during elections, map the spread and effects rates of epidemics across geographical areas, and carry out nationwide census research that provides a snapshot of society and culture.
Types of sampling
Sampling strategies in research vary widely across different disciplines and research areas, and from study to study.
There are two major types of sampling methods: probability and non-probability sampling.
- Probability sampling , also known as random sampling , is a kind of sample selection where randomisation is used instead of deliberate choice. Each member of the population has a known, non-zero chance of being selected.
- Non-probability sampling techniques are where the researcher deliberately picks items or individuals for the sample based on non-random factors such as convenience, geographic availability, or costs.
As we delve into these categories, it’s essential to understand the nuances and applications of each method to ensure that the chosen sampling strategy aligns with the research goals.
Probability sampling methods
There’s a wide range of probability sampling methods to explore and consider. Here are some of the best-known options.
1. Simple random sampling
With simple random sampling , every element in the population has an equal chance of being selected as part of the sample. It’s something like picking a name out of a hat. Simple random sampling can be done by anonymising the population – e.g. by assigning each item or person in the population a number and then picking numbers at random.
Pros: Simple random sampling is easy to do and cheap. Designed to ensure that every member of the population has an equal chance of being selected, it reduces the risk of bias compared to non-random sampling.
Cons: It offers no control for the researcher and may lead to unrepresentative groupings being picked by chance.

2. Systematic sampling
With systematic sampling the random selection only applies to the first item chosen. A rule then applies so that every nth item or person after that is picked.
Best practice is to sort your list in a random way to ensure that selections won’t be accidentally clustered together. This is commonly achieved using a random number generator. If that’s not available you might order your list alphabetically by first name and then pick every fifth name to eliminate bias, for example.
Next, you need to decide your sampling interval – for example, if your sample will be 10% of your full list, your sampling interval is one in 10 – and pick a random start between one and 10 – for example three. This means you would start with person number three on your list and pick every tenth person.
Pros: Systematic sampling is efficient and straightforward, especially when dealing with populations that have a clear order. It ensures a uniform selection across the population.
Cons: There’s a potential risk of introducing bias if there’s an unrecognised pattern in the population that aligns with the sampling interval.
3. Stratified sampling
Stratified sampling involves random selection within predefined groups. It’s a useful method for researchers wanting to determine what aspects of a sample are highly correlated with what’s being measured. They can then decide how to subdivide (stratify) it in a way that makes sense for the research.
For example, you want to measure the height of students at a college where 80% of students are female and 20% are male. We know that gender is highly correlated with height, and if we took a simple random sample of 200 students (out of the 2,000 who attend the college), we could by chance get 200 females and not one male. This would bias our results and we would underestimate the height of students overall. Instead, we could stratify by gender and make sure that 20% of our sample (40 students) are male and 80% (160 students) are female.
Pros: Stratified sampling enhances the representation of all identified subgroups within a population, leading to more accurate results in heterogeneous populations.
Cons: This method requires accurate knowledge about the population’s stratification, and its design and execution can be more intricate than other methods.

4. Cluster sampling
With cluster sampling, groups rather than individual units of the target population are selected at random for the sample. These might be pre-existing groups, such as people in certain zip codes or students belonging to an academic year.
Cluster sampling can be done by selecting the entire cluster, or in the case of two-stage cluster sampling, by randomly selecting the cluster itself, then selecting at random again within the cluster.
Pros: Cluster sampling is economically beneficial and logistically easier when dealing with vast and geographically dispersed populations.
Cons: Due to potential similarities within clusters, this method can introduce a greater sampling error compared to other methods.
Non-probability sampling methods
The non-probability sampling methodology doesn’t offer the same bias-removal benefits as probability sampling, but there are times when these types of sampling are chosen for expediency or simplicity. Here are some forms of non-probability sampling and how they work.
1. Convenience sampling
People or elements in a sample are selected on the basis of their accessibility and availability. If you are doing a research survey and you work at a university, for example, a convenience sample might consist of students or co-workers who happen to be on campus with open schedules who are willing to take your questionnaire .
This kind of sample can have value, especially if it’s done as an early or preliminary step, but significant bias will be introduced.
Pros: Convenience sampling is the most straightforward method, requiring minimal planning, making it quick to implement.
Cons: Due to its non-random nature, the method is highly susceptible to biases, and the results are often lacking in their application to the real world.

2. Quota sampling
Like the probability-based stratified sampling method, this approach aims to achieve a spread across the target population by specifying who should be recruited for a survey according to certain groups or criteria.
For example, your quota might include a certain number of males and a certain number of females. Alternatively, you might want your samples to be at a specific income level or in certain age brackets or ethnic groups.
Pros: Quota sampling ensures certain subgroups are adequately represented, making it great for when random sampling isn’t feasible but representation is necessary.
Cons: The selection within each quota is non-random and researchers’ discretion can influence the representation, which both strongly increase the risk of bias.
3. Purposive sampling
Participants for the sample are chosen consciously by researchers based on their knowledge and understanding of the research question at hand or their goals.
Also known as judgment sampling, this technique is unlikely to result in a representative sample , but it is a quick and fairly easy way to get a range of results or responses.
Pros: Purposive sampling targets specific criteria or characteristics, making it ideal for studies that require specialised participants or specific conditions.
Cons: It’s highly subjective and based on researchers’ judgment, which can introduce biases and limit the study’s real-world application.
4. Snowball or referral sampling
With this approach, people recruited to be part of a sample are asked to invite those they know to take part, who are then asked to invite their friends and family and so on. The participation radiates through a community of connected individuals like a snowball rolling downhill.
Pros: Especially useful for hard-to-reach or secretive populations, snowball sampling is effective for certain niche studies.
Cons: The method can introduce bias due to the reliance on participant referrals, and the choice of initial seeds can significantly influence the final sample.

What type of sampling should I use?
Choosing the right sampling method is a pivotal aspect of any research process, but it can be a stumbling block for many.
Here’s a structured approach to guide your decision.
1) Define your research goals
If you aim to get a general sense of a larger group, simple random or stratified sampling could be your best bet. For focused insights or studying unique communities, snowball or purposive sampling might be more suitable.
2) Assess the nature of your population
The nature of the group you’re studying can guide your method. For a diverse group with different categories, stratified sampling can ensure all segments are covered. If they’re widely spread geographically , cluster sampling becomes useful. If they’re arranged in a certain sequence or order, systematic sampling might be effective.
3) Consider your constraints
Your available time, budget and ease of accessing participants matter. Convenience or quota sampling can be practical for quicker studies, but they come with some trade-offs. If reaching everyone in your desired group is challenging, snowball or purposive sampling can be more feasible.
4) Determine the reach of your findings
Decide if you want your findings to represent a much broader group. For a wider representation, methods that include everyone fairly (like probability sampling ) are a good option. For specialised insights into specific groups, non-probability sampling methods can be more suitable.
5) Get feedback
Before fully committing, discuss your chosen method with others in your field and consider a test run.
Avoid or reduce sampling errors and bias
Using a sample is a kind of short-cut. If you could ask every single person in a population to take part in your study and have each of them reply, you’d have a highly accurate (and very labor-intensive) project on your hands.
But since that’s not realistic, sampling offers a “good-enough” solution that sacrifices some accuracy for the sake of practicality and ease. How much accuracy you lose out on depends on how well you control for sampling error, non-sampling error, and bias in your survey design . Our blog post helps you to steer clear of some of these issues.
How to choose the correct sample size
Finding the best sample size for your target population is something you’ll need to do again and again, as it’s different for every study.
To make life easier, we’ve provided a sample size calculator . To use it, you need to know your:
- Population size
- Confidence level
- Margin of error (confidence interval)
If any of those terms are unfamiliar, have a look at our blog post on determining sample size for details of what they mean and how to find them.
Unlock the insights of yesterday to shape tomorrow
In the ever-evolving business landscape, relying on the most recent market research is paramount. Reflecting on 2022, brands and businesses can harness crucial insights to outmaneuver challenges and seize opportunities.
Equip yourself with this knowledge by exploring Qualtrics’ ‘2022 Market Research Global Trends’ report.
Delve into this comprehensive study to unearth:
- How businesses made sense of tricky situations in 2022
- Tips that really helped improve research results
- Steps to take your findings and put them into action
Find out how Qualtrics XM can help you conduct world-class research
Related resources
Sampling and non-sampling errors 10 min read, how to determine sample size 16 min read, convenience sampling 15 min read, non-probability sampling 17 min read, probability sampling 8 min read, stratified random sampling 13 min read, simple random sampling 10 min read, request demo.
Ready to learn more about Qualtrics?
Sampling in Market Research
- December 13, 2016
Article Summary: There are various sampling techniques in market research. The two most common methodologies are probability and non-probability sampling. Additionally, researchers can employ techniques including simple random sampling, systematic sampling, cluster sampling, and stratified sampling.
Market research wouldn’t be possible without sampling, as it’s impossible to access every customer, whether current or future. Market researchers rely on various sampling techniques and methods to try and capture as wide range as possible the various types of customers a client is hoping to glean feedback from. Now, you may be thinking that all sampling is bunk, especially given the predictions and outcomes of both the Brexit vote and the recent U.S. Presidential election. Keep in mind that polling is different than sampling, and when market research is being carried out, more than simple questions are being asked of its sample population.
InterQ works closely with its clients to understand their objectives and then create sampling groups appropriate to the objective. We find that the best, most beneficial feedback is gleaned through a combination of qualitative AND quantitative research. Sampling methods are crucial to the quality of research, which is one of the reasons why this is better left to neutral, professional organizations, rather than done “in-house.” Choosing the right sampling technique is important so that data isn’t skewed or biased. Let’s explore sampling in more detail.
Sampling methodologies can be boiled down into two groups: probability and non-probability.
Probability (random) sampling methods allow all members of a target population to be included in the sample and isn’t encumbered by previous events in the selection process. Put another way, the selection of individuals for a sample group doesn’t affect the chance of anyone else in the targeted population to be selected. So how does a market research company go about selecting people to be included in a study? There are a number of random sampling techniques that market researches can employ, but four types of commonly used techniques include: Simple Random Sampling, Systematic Sampling, Cluster Sampling and Stratified Sampling.
Simple Random Sampling —The most commonly used sampling technique, and truly random, this method randomly selects individuals from a list of the population, with every individual having an equal chance at being selected.
Systematic Sampling —Rather than randomly selecting individuals from a population, this method is based on a system of selecting participants. For example, a market researcher may select from a list of the population every 20 th person. While this allows for a controlled way to select from a target population, it may be skewed depending on how the original list is structured or organized.
Cluster Sampling —Cluster sampling is a variation on Simple Random Sampling and is often used with larger populations and across a broader geographic region. Typically, a population is segregated into clusters and then participants are randomly selected from these groups.
Stratified Sampling —This method is a conflation of Simple Random and Systematic Sampling and is often used when there are a multitude of unique subgroups that require full, randomized representation across the sampling population.
Non-probability sampling methods are less desirable and often contain sampling biases. So why would anyone choose this methodology? Budget and lack of access to a full population list are often the reason. If a researcher must go with a non-probability sampling method, he/she must be very careful when drawing conclusions, as the population is not randomized and biases inherent.
Most organizations hoping to learn more about their target populations understand that hiring third-party market research companies that are well-versed in understanding and selecting sampling populations based on the methodologies outlined above is money well spent. Market research, when done properly, is often the difference between good and great outcomes.
If you’re interested in learning more about market research, check out our qualitative research training programs from InterQ Learning Labs.
Interested in learning more? Request a proposal today >
- Request Proposal
- Participate in Studies
- Our Leadership Team
- Our Approach
- Mission, Vision and Core Values
- Qualitative Research
- Quantitative Research
- Research Insights Workshops
- Customer Journey Mapping
- Millennial & Gen Z Market Research
- Market Research Services
- Our Clients
- InterQ Blog
Targeted Sampling Guide with Examples
Dive into the world of targeted sampling, as we explore its diverse types, techniques, and practical examples, enhancing your data collection skills for insightful, focused research outcomes.
Table of contents
What is a Targeted Sampling?
Types of targeted sampling with examples.
- Benefits of Using Targeted Sampling
How is Targeted Sampling Used in Data Analyses?
Tips on using targeted sampling.
In the intricate world of market research , the quest for accurate, reliable, and insightful data is of paramount importance. One methodology that has proven immensely beneficial in this pursuit is targeted sampling. This method allows researchers to zero in on specific segments within a population that are of particular interest to their study, thereby yielding more relevant and valuable data. However, like any research tool, it comes with its own set of nuances that can influence its effectiveness.
In this comprehensive guide, we will explore the diverse types of targeted sampling, delve into the techniques used in implementing them, and illuminate these concepts with practical examples.
Targeted Sampling, also known as purposive or judgmental sampling, is a type of non-probability sampling technique where the researcher specifically selects individuals from the population who possess particular characteristics or knowledge that can provide insight on the research question. The uniqueness of this sampling technique lies in its objective: to focus on certain characteristics of a population that are of interest, which will best enable answers to the research question.
The importance of targeted sampling cannot be overstated in the world of research, where obtaining accurate, insightful data is paramount. In studies where specific subsets of a population are of interest, or when particular groups are hard-to-reach, targeted sampling proves invaluable. It allows for a depth of understanding that is often unachievable with broader, more general sampling techniques.
https://www.youtube.com/watch?v=fQ1sxaQGdVA
Convenience Sampling
Probability sampling, cluster sampling, non-selection sampling, systematic sampling, sampling of patches, sampling of subpopulations, sampling by boundary, stratified sampling, benefits of targeted sampling, suitability for specialized research subjects.
One of the key strengths of targeted sampling is its suitability for specialized research subjects. Research studies often aim to investigate very specific questions, requiring data from highly specific groups within the population. In such instances, targeted sampling can prove invaluable in that it enables the researcher to specifically select the individuals that will best answer the research question. For example, a study looking into the experiences of war veterans would ideally need to gather data from individuals who have served in the military during wartime. With targeted sampling, the researcher can intentionally select such individuals for the study, thus obtaining data that is highly relevant and insightful for the research question.
Efficiency in Resources
Another advantage of targeted sampling is its efficiency in terms of both time and resources. In targeted sampling, the researcher focuses on a specific subset of the population. This reduces the time and resources needed for data collection as the researcher does not have to cover the entire population. Additionally, in targeted sampling, the researcher may already have an idea of where and how to find the target sample, further enhancing the efficiency of the process. For instance, a researcher looking to study the impact of an intervention program on drug addiction might specifically target rehabilitation centers, thus making the data collection process more streamlined and efficient.
In-depth Data Collection
With targeted sampling, researchers can gain an in-depth understanding of a specific group or phenomenon. Because the sampling method is concentrated and focused, it allows for a deeper exploration of the issues at hand. For instance, a researcher investigating the impacts of a particular industrial pollutant on local wildlife would benefit from targeted sampling by focusing specifically on the affected species within the polluted area. By zeroing in on this particular group, the researcher can obtain detailed data that helps to comprehensively understand the pollutant’s impacts.
Useful for Preliminary Research
Targeted sampling can also be an excellent tool in preliminary research, where the objective is to understand a problem better before carrying out a more extensive study. By focusing on a specific subset of the population, researchers can gain initial insights and feedback that can guide the development of larger, more detailed studies.
Access to Hard-to-Reach Populations
Certain populations are challenging to study due to their characteristics or circumstances. These may include marginalized communities, people with rare conditions, high-ranking officials, or people living in remote locations. Targeted sampling can be a practical approach in such cases, where the focus is on a specific group that is otherwise hard to reach or study.
High Level of Control
Another major benefit of targeted sampling is the high level of control it gives the researcher over the sample selection. This can be particularly useful when studying sensitive topics or when access to potential participants is restricted. The researcher can use their discretion and understanding of the research topic to choose the most suitable participants.
Targeted sampling is often used in data analysis when researchers want to focus on specific segments of a population or when dealing with unique research scenarios that make traditional probabilistic sampling techniques less feasible or practical. In targeted sampling, researchers specifically choose groups or individuals to be part of their study based on certain characteristics or criteria, which allows them to delve deeper into these particular segments. The data collected from this subset is then analyzed to draw conclusions that are specific to these groups, rather than attempting to generalize these findings to the entire population.
This technique is especially common in qualitative data research and analysis, where the goal is often to gain a detailed understanding of a specific phenomenon rather than make generalizations about a broader population. Because the data obtained from targeted samples can be particularly rich and comprehensive, it allows for detailed analysis of themes, patterns, and nuances that might be overlooked in a broader survey. By focusing on a select group, researchers can often gain a more detailed and nuanced understanding of their behaviors, attitudes, and experiences.
At the same time, targeted sampling can be used in quantitative research to examine specific hypotheses about particular subgroups within a population. For instance, a researcher might use targeted sampling to select a group of individuals with a specific medical condition, then analyze data from this group to examine patterns and outcomes related to the condition.
- Clearly Define Your Research Question – The success of targeted sampling begins with a clearly defined research question. The technique is most effective when the researcher has a specific population segment they want to study. Thus, the first step in using targeted sampling is to identify your research question and clearly specify the population segment you wish to investigate.
- Understand Your Target Population – Understanding the demographic and psychographic characteristics of your target population is crucial in targeted sampling. Researchers must have a thorough understanding of the population’s characteristics, behaviors, attitudes, and lifestyle patterns. This understanding will inform the sampling process and help ensure that the right individuals are included in the sample.
- Consider Access and Reachability – Targeted sampling can often involve hard-to-reach or specific segments of the population. Therefore, it is crucial to consider how accessible your target population is and devise a plan for reaching these individuals. This might involve collaborating with local community groups, utilizing online platforms, or leveraging professional networks.
- Ensure Ethical Considerations – As with any research, ethical considerations are paramount in targeted sampling. Researchers must ensure that participants are chosen freely, that they are fully informed about the study’s purpose and methodology, and that their data is handled confidentially and securely. Obtaining informed consent is a must, and researchers should consider potential ethical issues that may arise specific to their target population.
- Create a Robust Data Collection Plan – In targeted sampling, the data collection plan needs to be robust and tailored to the unique characteristics of the target population. Researchers should consider the most appropriate methods of data collection, whether it be surveys, interviews, observations, or a combination of these, and adapt these methods to suit the needs and preferences of the target population.
- Be Prepared for Challenges – Targeted sampling may come with a unique set of challenges, particularly when dealing with specific or hard-to-reach populations. Researchers should anticipate these challenges and be prepared to adapt their methods as necessary. This could involve being flexible with data collection times and locations, considering language and cultural barriers, and being sensitive to any personal or social issues that may affect participation.
- Ensure Sample Size Adequacy – While targeted sampling may not yield a sample that is representative of the broader population, it is still essential to ensure that the sample size is adequate for the study’s objectives. Researchers should consider the statistical power of their study and select a sample size that will allow them to detect the effects or associations they are interested in.
- Consider the Use of Mixed Methods – In some cases, targeted sampling can be effectively combined with other sampling methods in a mixed-methods approach. This can provide a more nuanced understanding of the research question and allow researchers to triangulate their findings.
In conclusion, targeted sampling stands as a unique and valuable tool in the research toolbox. By focusing on specific subsets of a population, it enables researchers to gain detailed insights into the experiences and characteristics of these groups. This method is particularly beneficial when studying hard-to-reach populations or specialized subjects, where more generalized sampling methods may fall short.
The various types of targeted sampling, including convenience, probability, cluster, systematic, stratified, non-selection, patches, subpopulation, boundary, and convenience sampling, each offer unique benefits, and cater to different research needs and contexts. The examples highlighted in this article demonstrate the versatility of these techniques across a range of research disciplines.
However, it’s crucial to remember the limitations of targeted sampling. While it provides an in-depth focus, the findings may not be generalizable to the broader population due to the non-random nature of the sampling. It’s also susceptible to researcher bias in the selection process, and ethical considerations must be taken into account, especially when dealing with sensitive or marginalized groups.
Ultimately, the use of targeted sampling should be guided by the research question, the nature of the population, and the resources available. With careful planning and execution, targeted sampling can provide rich, nuanced data that adds depth and specificity to our understanding of the world around us.
FAQ on Targeted Sampling
What are the advantages of targeted sampling.
The advantages of targeted sampling include the ability to focus on specific segments of the population, which can provide more detailed and nuanced insights for the research question at hand. Targeted sampling is also often more efficient in terms of resources, as the sample size can be smaller and still provide valuable insights. Additionally, targeted sampling can be an effective way to reach and study groups that may be difficult to access with other sampling methods.
When should targeted sampling be used?
Targeted sampling should be used when the research question is about a specific, identifiable subset of a population. It's especially useful when these groups are hard-to-reach or when their characteristics are of particular interest for the study. For example, researchers might use targeted sampling when studying rare medical conditions, specific professional groups, or behaviors of a particular demographic segment.
How does targeted sampling differ from random sampling?
In targeted sampling, the researcher intentionally selects certain individuals or groups based on specific characteristics, whereas in random sampling, every individual in the population has an equal chance of being selected. This makes targeted sampling more useful for focused studies on specific subsets of the population, while random sampling is better for studies aiming for broad generalizations about the entire population.
Related pages
Target audience.
Uncover key strategies to identify and engage with your target audience, boosting brand loyalty and driving business growth.
Random Device Engagement
Explore the future of Random Device Engagement: from AI analytics to global adoption, delve into RDE's evolving landscape.
Survey Panel
Delve into Survey Panels: a key market research tool. Discover their meaning, advantages, and real-world examples in this guide.
Sampling Techniques in Research
Discover sampling techniques in research, sampling methods & best practices for effective data collection by reading this comprehensive guide.
Sample Size
In this blog post, we will look at defining sample size, determining the optimal sample, formulas, and examples.
Dynamic Sampling
This guide provides an overview of dynamic sampling, including its benefits, drawbacks, types, and tips for selecting an appropriate approach.
Incidence Rate
Discover the significance of incidence rate in market research. Explore its definition and calculation methods for informed decision-making.
- Privacy Overview
- Strictly Necessary Cookies
- Additional Cookies
This website uses cookies to provide you with the best user experience possible. Cookies are small text files that are cached when you visit a website to make the user experience more efficient. We are allowed to store cookies on your device if they are absolutely necessary for the operation of the site. For all other cookies we need your consent.
You can at any time change or withdraw your consent from the Cookie Declaration on our website. Find the link to your settings in our footer.
Find out more in our privacy policy about our use of cookies and how we process personal data.
Necessary cookies help make a website usable by enabling basic functions like page navigation and access to secure areas of the website. The website cannot properly without these cookies.
If you disable this cookie, we will not be able to save your preferences. This means that every time you visit this website you will need to enable or disable cookies again.
Any cookies that may not be particularly necessary for the website to function and is used specifically to collect user personal data via analytics, ads, other embedded contents are termed as additional cookies.
Please enable Strictly Necessary Cookies first so that we can save your preferences!

Market research
Sampling Methods: Examples and Uses

TRY OUT NOW
Researchers often use different ones in market research Sampling methods , so they don't have to survey the entire population to gain actionable insights.
Today we will look at the characteristics of each of these methods so that you can decide which one you need to carry out to make your research project a success.
- 1 Definition of samples
- 2 Sampling methods
- 3.1 Simple random sampling
- 3.2 Cluster sampling
- 3.3 Systematic sampling methods
- 3.4 Stratified samples
- 4.1 Convenience sampling
- 4.2 Purposive, Judgmental or Critical Sampling
- 4.3 Ponzi scheme
- 4.4 Quota sampling
- 5 Uses of non-probability sampling
- 6 How do you decide which sampling methods to use?
- 7 1:1 Live Online Presentation: QUESTIONPRO MARKET RESEARCH SOFTWARE
- 8 Try software for market research and experience management now for 10 days free of charge!
Definition of samples
Sampling is a technique for selecting individual members or a subset of the population to draw statistical conclusions and estimate the characteristics of the entire population.
It is also a time and cost efficient method and therefore forms the basis of any research design. Sampling techniques can be used in a research survey software program to derive optimal results.
For example, if a drug manufacturer wants to study the adverse side effects of a drug in a country's population, it is almost impossible to conduct a research study in which all people participate. In this case, the researcher selects a sample of people from each demographic group, which he then studies to give them indicative feedback on the drug's behavior.
Sampling methods
There are two sampling methods: probability sampling and non-probability sampling:
Probability sampling : Probability sampling is a sampling technique in which a researcher makes a selection based on some criteria and randomly selects members of a population. With this selection parameter, all members have an equal chance of being part of the sample.
Non-probability sampling: In non-probability sampling, the researcher randomly selects the members of the research population. This sampling method is not a fixed or predefined selection process. This makes it difficult for all elements of a population to have an equal chance of being included in a sample.
Examples of sampling methods
Below we will learn about different types of samples that can be used in any market research study.
Probability sampling is a sampling technique in which researchers select samples from a larger population using a method based on probability theory. This is one of the sampling methods in which all members of the population are taken into account and the samples are formed based on a specified process.
For example, in a population of 1000 members, each member has a 1/1000 chance of being included in a sample. Probability sampling eliminates bias in the population and gives all members a fair chance of being included in the sample.
There are four types of sampling methods:
Simple random sampling
One of the best probability sampling methods that helps save time and resources is the simple sampling method. It is a reliable method of obtaining information in which each member of a population is randomly selected. Every person has an equal chance of being included in the sample.
For example, in a company with 500 employees, if the HR department decides to implement team-building activities, it is very likely that they would prefer to draw tokens from a bowl. In this case, each of the 500 employees has an equal chance of being selected.
Cluster sampling
In this method, also known as cluster sampling, researchers divide the entire population into sections or clusters that represent a population. The clusters are identified and sampled based on demographic parameters such as age, gender, location, etc. This makes it very easy for the survey creator to draw effective conclusions from the feedback.
For example, if the US government wants to determine the number of immigrants living in the United States, it can divide them into groups based on states such as California, Texas, Florida, Massachusetts, Colorado, Hawaii, etc. This type of survey is more effective because the results are organized by state and provide objective immigration data.
Systematic sampling methods
Researchers use the systematic sampling method to draw samples from a population at regular intervals.
To do this, a starting point for the sample and a sample size must be determined, which can be repeated at regular intervals. These types of sampling methods have a predefined scope and are therefore the least time consuming.
For example, a researcher intends to collect a systematic sample of 500 people from a population of 5000 people. He/she numbers each element of the population from 1 to 5000 and selects every tenth person for the sample (population/sample size = 5000/500 = 10).
Stratified samples
In stratified random sampling, the researcher divides the population into smaller groups that do not overlap but represent the entire population. During sampling, these groups can be organized and a separate sample can then be drawn from each group.
For example, a researcher who wants to analyse the characteristics of people belonging to different annual income groups would create strata (groups) according to annual household income.
For example, less than $20.000, $21.000 to $30.000, $31.000 to $40.000, $41.000 to $50.000 and so on.
From this, the researcher draws conclusions about the characteristics of people belonging to different income groups. The marketers can analyse which income groups they should target and which they should exclude to achieve the desired results.
Uses of Probability Sampling
Probability sampling can be used in a variety of ways:
- Reducing sample bias : When using probability sampling techniques, the bias of the sample derived from the population is negligible or non-existent, allowing higher quality data to be collected as the sample adequately represents the population.
- Diverse population : When the population is large and diverse, it is important to have adequate representation so that the data is not biased towards a single demographic group.
- Creating an accurate sample: Probability sampling helps researchers plan and create an accurate sample. This helps in obtaining well-defined data.
Types of non-probability sampling and examples
Non-probability sampling is one of the sampling methods in which information is collected based on a researcher or statistician's ability to select samples rather than on the basis of a fixed selection procedure.
In most cases, the result of a survey conducted with a non-probability sample will produce biased results that may not represent the desired target population. However, there are situations, e.g. B. in advance of research or when conducting research for cost reasons, in which non-probability sampling is much more useful than the other types.
These four types of sampling methods best explain the purpose of these sampling methods:
Convenience sampling
This method is based on easy access to the subjects, such as: B. a survey of customers in a shopping center or of passers-by on a busy street.
It is often referred to as random sampling because it is easy for the researcher to conduct it and contact the subjects. Researchers have virtually no power to select sample elements, and selection is based solely on proximity rather than representativeness.
This type of sampling method is used when there are time and cost constraints in collecting information. In situations where resource constraints exist, such as: B. in the initial phase of research, random samples are used.
For example, startups and non-governmental organizations often conduct random sampling in a mall to distribute flyers for upcoming events or a specific cause by standing at the mall entrance and randomly handing out flyers.
Purposive, Judgmental or Critical Sampling
Judgmental samples are formed at the discretion of the researcher. Researchers only consider the purpose of the study and understanding of the target audience.
For example, when researchers want to understand the thought process of people interested in pursuing a master's degree. The selection criteria will then be: “Are you interested in doing your Masters in…?”, and those who answer “No” will be excluded from the sample.
Ponzi scheme
The pyramid scheme is one of the sampling methods that researchers use when the subjects are difficult to identify.
For example, it will be extremely difficult to interview unhoused people or illegal immigrants. In such cases, researchers can use snowballing to identify a few categories that they can survey to obtain results.
Researchers also use this sampling method in situations where the topic is very sensitive and not openly discussed, such as: B. in surveys to collect information about HIV and AIDS. Not many victims will answer the questions willingly. However, researchers can reach out to people they may know or volunteers connected to the subject to find victims and gather information.
Quota sampling
The selection of members in this sampling technique is done based on a predetermined rule. Since the sample in this case is formed based on certain characteristics, the sample has the same properties as the population. It is a quick sampling method.
Uses of non-probability sampling
Non-probability sampling is used for the following purposes:
- Creation of a hypothesis: Researchers use non-probability sampling to create a hypothesis when there is little or no prior information. This method helps in immediate return of data and provides a foundation for future research.
- Exploratory research : This sampling technique is commonly used by researchers when conducting qualitative research, pilot studies, or exploratory research.
- Budget and time constraints: Used when budget and time constraints exist and some preliminary data needs to be collected. Since the survey design is not rigid, it is easier to randomly select respondents and have them complete the survey or questionnaire.
How do you decide which sampling methods to use?
For any research paper, it is important to choose a sampling method that is precisely tailored to the objectives of your study. The effectiveness of your sampling depends on several factors.
Below are some steps that experienced researchers follow to decide on the best sampling method.
- Write down the objectives of the research. Generally, this should be a combination of cost, precision, or accuracy.
- Identify effective sampling techniques that can potentially achieve the research objectives.
- Test each of these methods and see if they help achieve the goal.
- Choose the method that is most suitable for the examination.
Now that you know the sampling methods and their subtypes, we invite you to our Survey software Get to know, the ideal tool for you to collect your sample information.
Get to know all the benefits of our platform by requesting a demo and exploring all its features.
1:1 live online presentation: QUESTIONPRO MARKET RESEARCH SOFTWARE
Arrange an individual appointment and discover our market research software.
Try software for market research and experience management now for 10 days free of charge!
Do you have any questions about the content of this blog? Simply contact us via contact form . We look forward to a dialogue with you! You too can test QuestionPro for 10 days free of charge and without risk in depth!
Test the agile market research and experience management platform for qualitative and quantitative data collection and data analysis from QuestionPro for 10 days free of charge
FURTHER KEYWORDS
Types of research | Empirical research | Document research
SHARE THIS ARTICLE
KEYWORDS OF THIS BLOG POST
Sampling methods | sample | Method
FURTHER INFORMATION
- Applied Research: Definition, Types and Examples
- Experimental research: what it is, what types there are and how to carry it out
- Types of research and their features
- What is exploratory research?
- Mixed methods research: what it is and what types there are
- Data filtering: what it is, benefits and examples
- Data collection tools: which are the best?
- Big Data and Artificial Intelligence: How do they work together?
PRESS RELEASES
About The Author
Silvia Valcheva
Silvia Valcheva is a digital marketer with over a decade of experience creating content for the tech industry. She has a strong passion for writing about emerging software and technologies such as big data, AI (Artificial Intelligence), IoT (Internet of Things), process automation, etc.

thank you.. helped me a lot..
Glad to help!

Thankyou so much for this info. It helped me a lot
Leave a Reply Cancel Reply
This site uses Akismet to reduce spam. Learn how your comment data is processed .
- Pollfish School
- Market Research
- Survey Guides
- Get started
River Sampling Versus RDE Sampling: Which is Superior for Market Research

River sampling versus RDE (Random Device Engagement) sampling: it’s a showdown for the ages. As two of the foremost players in survey sampling methods , these two always appear to compete head-to-head for the attention and execution of market researchers.
As prominent players in the survey research sector, both the RDE and river sampling methods are considered superior to using survey panels for market research.
As the two dominant means of obtaining a survey sample, which forms the core of any market research campaign, it is crucial to be diligent when deliberating over which method to use for your survey sampling.
This article posits river sampling and RDE sampling in a showdown, so that market researchers and general researchers comprehend which is more fitting for their market research needs.
Defining River Sampling
River sampling is an online survey sampling method — the earliest and simplest of its kind. This non-probability sampling method obtains survey respondents by requesting online visitors to take a survey via clicking on a link that routes them to the survey .
The link is placed somewhere in a webpage, email or another area in the digital space. Typically, respondents are scouted through web elements such as banners, ads, promotions and offers .
When site or app users click on the link used in river sampling, they are first routed to the screener portion of the survey and if they fit the requirements set in the screener, they are then routed to the questionnaire portion.
River sampling derives its name from the metaphorical idea that researchers net their study subjects by catching them in the river that is the internet, specifically the flow of traffic in a website.
Also called intercept sampling and real‐time sampling, this method extracts respondents by engaging them while they take part in some other digital activity .
The Two Types of River Sampling
River sampling exists in two forms. While they may appear to be vaguely interchangeable, each form includes a unique method for procuring respondents. In the showdown of river sampling versus RDE sampling, it’s important to understand the workings of each.

Stratified River Sampling
This kind of river sampling involves drawing samples in real-time from online promotions, those that are disseminated through banners, ads, pop-ups and hyperlinks. Market researchers would choose the websites for survey deployment based on statistics on such websites’ traffic.
Convenience River Sampling
This submethod of river sampling involves the placement of promotions and hyperlinks across websites without previously analyzing the websites’ traffic numbers and types of visitors. As such, market researchers deploy surveys in a completely blind manner. The point of this form of sampling is to derive maximum data at a minimum cost.
The Pros and Cons of River Sampling
A commonly used method of sampling respondents, river sampling has several advantages and disadvantages. Understanding them is important for researchers, should they consider using this method, or learning how it differs from other sampling methods, such as RDE sampling.
The Advantages
- Serves as a powerful replacement for survey panels by providing new respondents, those that have not been influenced or conditioned to take part in a survey.
- Engages users in their natural digital environments .
- Its survey callouts/ links exist in easily noticeable digital properties.
- Creates a faster alternative to the focus group , which involves a group discussion where dominant participants can take charge and make it difficult for more demure participants.
- Ensures complete anonymity of respondents.
- Exists as a simple method of data gathering, since all researchers need to do is wait for the data to be aggregated.
- An inexpensive source of sampling.
- A flexible method that collects respondents in the moment, rather than being profiled prior to the survey and recruited manually.
The Disadvantages
- The devices used by potential and opted-in respondents are completely unknown .
- There is no access to an advertisement’s ID.
- Fraudsters can therefore take the same survey twice or more to increase their incentives or the chance to win a prize.
- No degree of demographic, geographic or individual targeting is possible .
- Banner ads generally have insufficient response rates.
- Banners are pushed through ad networks, diminishing the user experience.
- As such, users are picked due to a higher likelihood of responding, from unobserved variables (to the researcher) correlated with how they will respond. At any rate, none of the data is shared, so it is impossible to correct.
- It is difficult to reach an acceptable level of representation, as respondents are not tracked.
- Surveyors have no inkling of who will participate in the surveys due to the lack of tracking and profiling.
- This method is prone to receive straight-lining from the respondents.
Defining RDE Sampling
RDE sampling, also known as Random Device Engagement is an advanced method of non-probability sampling, one that falls in diametrical opposition with survey panels. It is completely random and organic, with no pre-recruitment and no website monitoring.
RDE sampling refers to the sampling practice of engaging online users on all the devices they are already using, be it within advertising networks, mobile apps and other portals on various devices.
This involves the careful placement of surveys in gaming interfaces and virtual reality, allowing market researchers to offer non-monetary incentives to respondents. These include coins or points in a game, or the ability to win a major virtual in-game prize.
RDE sampling can be disseminated through digital elements similar to the ones used in river sampling , such as banners, ads and other positions on a webpages, such as buttons. These survey callouts e.t. al., must be placed strategically, so that respondents can easily spot them. They must also be created in a way that sparks the curiosity or interest of the webpage’s visitors to click on them in the first place.

RDE engages potential respondents in their natural digital environments and respondents enter the survey voluntarily. This method also ensures complete randomization, as no pre-recruiting efforts are involved.
Respondents are also completely anonymous, in terms of their identities, thus, there is no pressure to answer questions in a particular way, such as one that adheres to societal norms and expectations.
The Key Differences Between River Sampling and RDE Sampling
Many of the traits in RDE sampling render this method to seemingly mimic river sampling, with no apparent distinguishing features. But this is false — there are several ways in which RDE sampling diverges from the river sampling method.
Unlike river sampling, RDE sampling offers a monitoring functionality, which tracks the unique identifier of respondents’ devices . The survey software that carries out RDE sampling works natively with the device when it is optimized correctly. For example, a strong example of this would be a mobile-first survey platform.
Furthermore, unlike river sampling , in which respondents are not tracked or identified by demographics, etc., RDE tracks respondents through a unique ID, one that notifies the researchers when the same respondents are changing devices .
RDE also relies on artificial intelligence to weed out poor quality responses, such as gibberish answers and users who are on a VPN.
The Pros and Cons of RDE Sampling
Random Device Engagement sampling carries various benefits and drawbacks that all market researchers should be aware of, even if they do not choose this sampling method. That is because it is critical to weigh these advantages and disadvantages against those of river sampling for a true comparison.
The Advantages
- A higher quality of data due to AI functionality and automatic quality checks.
- Respondents are not conditioned through pre recruiting tactics or pressured to answer questions in a certain way due to being in their natural digital environments.
- Offers various telemetry data prone to bias correction, involving location history and application usage.
- Has a high coverage due to the heavy usage of mobile phones; phones carry a high penetration of about 70% and decent response rates.
- Avoids fraud from SUMAs (single users on multiple accounts); respondents can only answer once and therefore VPN respondents are disqualified.
- Tracks different devices that respondents use, important given the uncertainty of the future use of phones.
- RDE is fast and cost-effective.
- For example, those who partake in surveys are rather different than those who don’t. As such, it is necessary to get roughly 30 more demographic, attitudinal, and lifestyle questions to understand social trust and how survey respondents are unusual.
The Disadvantages
- Given that this method involves tracking location and application usage, it is not as anonymous.
- In reference to Point 1, the researchers will have to add the necessary disclaimers to their surveys.
- Surveys on RDE networks may not exist in as diverse a set as they do in river sampling.
- Is still prone to several kinds of survey bias .
- Does not offer perfect coverage or known probabilities for every respondent.
- Respondents may be subject to survey fatigue if the survey is too long and not built with best practices.
The Verdict of the River Sampling Vs. RDE Sampling Showdown
In conclusion, who comes up victorious in the showdown between river sampling and Random Device Engagement sampling? In the spirit of remaining unbiased, the true victor is up to the market researcher, the business owner, or the marketing department of a business.
This is because each business and operation will envision their market research campaigns differently and thus will have different requirements and standards for their campaigns. This includes how they will execute survey sampling.
Both methods secure the privacy of respondents, as respondents are never matched with their identities. However, the major point of difference between these two methods is that river sampling does not capture the devices and app usage of the respondents, while RDE does, given that it tracks respondents through unique IDs.
Thus, when using either of these sampling methods, they will have to be dealt with differently.
In regards to this, market researchers can make the judgment of which sampling method is best. We believe that based on the better data quality and representativeness of the sample, RDE is the superior survey sampling method .
With river sampling, researchers must assess the stability, span and relevance of the promotions used in tandem with the surveys. Additionally, market researchers will need to check security and quota controls during the sampling process. SIngle users participating multiple times must be thwarted with specialized software.
With RDE sampling, the online survey platform must cooperate with the publishers and their networks, so that market researchers can design a native experience with surveys on their platforms. (In river sampling, banner ads are pushed through the ad network instead). Thus, RDE sampling is objectively the stronger sampling method, given that it seamlessly prevents fraud and poor data from its capabilities of tracking down device usage and fending off VPNs, users take part more than once and other nefarious behaviors that mar the data and sample collection process.
Frequently asked questions
What is river sampling.
River sampling is an online survey sampling method that obtains survey respondents by requesting online visitors to take a survey via clicking on a link that routes them to the survey. It is entirely random and organic, with no website monitoring. RDE sampling, on the other hand, refers to the sampling practice of engaging online users on all the devices they are already using, be it within advertising networks, mobile apps, and other portals on various devices.
What is RDE sampling?
Objectively speaking, RDE sampling is better as it provides a more robust sampling method given that it integrates well with AI to prevent instances of fraud and insufficient data. It also tracks device usage and can notify researchers and marketers if a respondent changed the device, unlike river sampling, where there is no such device tracking.
What are the two types of River Sampling?
The two types of river sampling are stratified and convenience river sampling. Stratified river sampling means drawing samples in real-time from online promotions, such as website banners, ads, pop-ups, and hyperlinks. In contrast, convenience river sampling involves placing advertisements and hyperlinks across websites without analyzing the websites' traffic. This enables marketers to gain maximum data at minimum cost.
What are some pros and cons of river sampling?
The most significant advantage of river sampling is that it makes the surveys accessible to everyone, even respondents who were not conditioned to take part in a survey. It also ensures the complete anonymity of respondents and is a relatively inexpensive way of conducting surveys. However, since these surveys ensure anonymity and there is no link to a respondent's ID, people can take the same survey repeatedly and distort any chance of accurate results.
What are some pros and cons of RDE sampling?
RDE sampling can detect different devices that respondents use, decreasing the chance of any fraud. It also provides high-quality data due to AI functionality and automated checks. However, the drawback is that RDE surveys may not exist in as diverse a set as they do in river sampling.
Do you want to distribute your survey? Pollfish offers you access to millions of targeted consumers to get survey responses from $0.95 per complete. Launch your survey today.
Privacy Preference Center
Privacy preferences.
Market research Sampling (Random and Quota)
It is important to establish consumers' needs before launching a new product. A business conducts market research to help identify gaps in the market and business opportunities.
Part of Business management Marketing
Sampling (Random and Quota)
Sampling is the process of creating a small unbiased population to be used in a test or experiment. The sample removes the impractical idea of surveying everyone in a market or a population.
Random sampling
Random sampling is when a sample is created by chance. It is the luck of the draw.
Random sampling does not target any specific market segment close market segment A group of people who share similar characteristics and buying habits. . The people to be included in the sample are generated at random. This could be done by using a computer program or taking names from a list or telephone book.
Quota sampling
Quota sampling is a sample that has been created to mimic the characteristics of a market. The researcher will choose the characteristics they wish the respondents close respondent A person who takes part in a method of market research. to have. For example, only sampling males who are over 50 years old.
Example comparison of random and quota sampling
- Random sampling does not target any specific market segment close market segment A group of people who share similar characteristics and buying habits. . Quota sampling chooses a group of people with certain characteristics.
- Random sampling is often more expensive than quota sampling as it requires a large group of people to be sampled. Quota sampling requires less respondents close respondent A person who takes part in a method of market research. .
More guides on this topic
- Marketing mix
- Physical evidence
- Technology in marketing
- Classroom Videos
You are using an outdated browser. Please upgrade your browser to improve your experience.
Environmental Monitoring Market Size, Share & Trends by Product Type (Sensors, Indoor Monitors, Outdoor Monitors), Sampling Method (Continuous, Active, Passive, Intermittent), Component, Application, End-User, and Region - Global Forecast to 2029
- Table of Contents
- Description
- Search Inside Report
- Related Reports
Environmental Monitoring Market Size, Share & Trends by Product Type (Sensors, Indoor Monitors, Outdoor Monitors), Sampling Method (Continuous, Active, Passive, Intermittent), Component, Application, End-User, and Region - Global Forecast to 2029
1 Introduction 1.1 Study Objectives 1.2 Market Definition 1.2.1 Inclusions And Exclusions 1.3 Study Scope 1.3.1 Markets Covered 1.3.2 Regions Covered 1.3.3 Years Considered 1.4 Currency Considered 1.5 Key Market Stakeholders 1.6 Summary Of Changes 1.6.1 Recession Impact 2 Research Methodology 2.1 Research Data Figure 1 Research Design 2.1.1 Secondary Data 2.1.1.1 Indicative List Of Secondary Sources 2.1.2 Primary Data Figure 2 Breakdown Of Primary Interviews: By Company Type, Designation, And Region 2.2 Market Estimation Methodology Figure 3 Research Methodology: Hypothesis Building 2.2.1 Revenue Mapping-based Market Estimation Figure 4 Market Size Estimation: Revenue Share Analysis (2023) 2.3 Market Size Estimation 2.3.1 Approach 1: Product-based Market Estimation 2.3.2 Approach 2: End User-based Market Estimation Figure 5 Market Size Estimation Methodology 2.3.3 Primary Research Validation 2.4 Recession Impact Analysis 2.5 Impact Of Recession On Environmental Monitoring Market 2.6 Data Triangulation Figure 6 Data Triangulation Methodology 2.7 Research Assumptions 2.7.1 Study Assumptions 2.8 Research Limitations 2.9 Risk Assessment Table 1 Environmental Monitoring Market: Risk Assessment Analysis 3 Executive Summary Figure 7 Environmental Monitoring Market, By Product, 2024 Vs. 2029 (Usd Million) Figure 8 Environmental Monitoring Market, By Sampling Method, 2024 Vs. 2029 (Usd Million) Figure 9 Environmental Monitoring Market, By Component, 2024 Vs. 2029 Figure 10 Environmental Monitoring Market, By Application, 2024 Vs. 2029 Figure 11 Environmental Monitoring Market, By End User, 2024 Vs. 2029 Figure 12 North America Accounted For Largest Market Share In 2023 4 Premium Insights 4.1 Attractive Opportunities For Players In Environmental Monitoring Market Figure 13 Increased Government Funding To Prevent And Control Environmental Pollution To Drive Market 4.2 Environmental Monitoring Market, By Product, 2024 Vs. 2029 (Usd Million) Figure 14 Monitors Segment To Dominate Market During Forecast Period 4.3 Environmental Monitoring Market For Particulate Detection, By Type, 2024 Vs. 2029 (Usd Million) Figure 15 Pm2.5 Detection Segment To Lead Market During Forecast Period 4.4 Environmental Monitoring Market For Chemical Detection, By Type, 2024 Vs. 2029 (Usd Million) Figure 16 Gas Detection Segment To Dominate Market During Forecast Period 4.5 Environmental Monitoring Market, By Region And End User (2023) Figure 17 North America Accounted For Largest Market Share In 2023 4.6 Environmental Monitoring Market, By Country/Region Opportunities Figure 18 South Korea To Register Highest Growth In Environmental Monitoring Market From 2024 To 2029 5 Market Overview 5.1 Introductions 5.2 Market Dynamics Figure 19 Environmental Monitoring Market: Drivers, Restraints, Opportunities, And Challenges 5.2.1 Drivers 5.2.1.1 Growing Need For Efficient Natural Resource Management 5.2.1.2 Development Of Environment-friendly Industries 5.2.1.3 Development Of Wireless Cellular And Non-cellular Communication Technologies 5.2.1.4 Increased Health Concerns Due To Rising Pollution Levels 5.2.2 Restraints 5.2.2.1 High Cost Of Environmental Monitoring Products 5.2.3 Opportunities 5.2.3.1 Increased Government Funding To Prevent And Control Environmental Pollution 5.2.3.2 Supportive Government Rules And Regulations To Reduce Environmental Pollution Table 2 Major Us Pollution Control Laws 5.2.3.3 Growing Oil & Gas Industry 5.2.3.4 Development Of High-end Environmental Monitoring Systems Based On Nanotechnology 5.2.4 Challenges 5.2.4.1 Slow Adoption Of Pollution Control Policies 5.3 Regulatory Landscape 5.3.1 Regulatory Bodies, Government Agencies, And Other Organizations Table 3 North America: Regulatory Authorities Governing Environmental Monitoring Market Table 4 Europe: Regulatory Authorities Governing Environmental Monitoring Market Table 5 Asia Pacific: Regulatory Authorities Governing Environmental Monitoring Market Table 6 Latin America: Regulatory Authorities Governing Environmental Monitoring Market Table 7 Middle East And Africa: Regulatory Authorities Governing The Environmental Monitoring Market 5.3.2 Regulatory Trends 5.3.2.1 North America 5.3.2.1.1 Us 5.3.2.1.2 Canada 5.3.2.2 Europe 5.3.2.3 Asia Pacific 5.3.2.3.1 India 5.3.2.3.2 China 5.4 Reimbursement Scenario 5.5 Value Chain Analysis 5.5.1 Research & Development 5.5.2 Procurement And Product Development 5.5.3 Marketing, Sales, And Distribution Figure 20 Environmental Monitoring Market: Value Chain Analysis 5.6 Supply Chain Analysis 5.6.1 Prominent Companies 5.6.2 Small & Medium-sized Enterprises 5.6.3 End Users Figure 21 Environmental Monitoring Market: Supply Chain Analysis 5.7 Ecosystem Analysis/Market Map Figure 22 Environmental Monitoring Market: Ecosystem Analysis Figure 23 Market Map: Key Players In Environmental Monitoring Market Ecosystem Table 8 Environmental Monitoring Market: Role In Ecosystem 5.8 Porter’s Five Forces Analysis Table 9 Environmental Monitoring Market: Porter’s Five Forces Analysis 5.8.1 Intensity Of Competitive Rivalry 5.8.2 Bargaining Power Of Buyers 5.8.3 Bargaining Power Of Suppliers 5.8.4 Threat Of New Entrants 5.8.5 Threat Of Substitutes 5.9 Trade Analysis Table 10 Import Data For Particulate Monitors (Hs Code 902710), By Country, 2019–2023 (Usd) Table 11 Export Data For Particulate Monitors (Hs Code 902710), By Country, 2019–2023 (Usd) 5.10 Patent Analysis Figure 24 Patent Analysis 5.11 Pricing Analysis Figure 25 Environmental Monitoring Analytical Devices Pricing Analysis, By Type, 2023 (Usd) Figure 26 Environmental Monitoring Analytical Devices Pricing Analysis, By Region, 2023 (Usd) Table 12 Average Selling Price Of Environmental Monitoring Analytical Devices, By Region, 2021–2023 5.12 Technology Analysis 5.12.1 Key Technologies 5.12.1.1 Lab Analysis Techniques 5.12.1.2 Remote Sensing And Satellite Technology 5.12.1.3 Wireless Sensor Networks 5.12.2 Adjacent Technologies 5.12.2.1 Geographic Information System (Gis) 5.12.3 Complementary Technologies 5.12.3.1 Cloud Computing 5.12.3.2 Robotic Sampling Systems 5.13 Key Conferences And Events Table 13 Environmental Monitoring Market: List Of Major Conferences And Events, 2024 5.14 Key Stakeholders And Buying Criteria 5.14.1 Key Stakeholders In Buying Process Figure 27 Influence Of Stakeholders On Buying Process For Top Products (%) Table 14 Influence Of Stakeholders On Buying Process For Top Products (%) 5.14.2 Buying Criteria Figure 28 Key Buying Criteria For Top Products Table 15 Key Buying Criteria For Top Products 5.15 Trends/Disruptions Impacting Customer Business Figure 29 Trends/Disruptions In Environmental Monitoring Market 5.16 Investment Scenario Figure 30 Number Of Investor Deals In Environmental Monitoring Market, By Key Player, 2018–2022 Figure 31 Value Of Investor Deals In Environmental Monitoring Market, By Key Player, 2018–2022 (Usd Million) 5.17 Unmet Needs And Key Pain Points Table 16 Environmental Monitoring Market: Current Unmet Needs 6 Environmental Monitoring Market, By Product 6.1 Introduction Table 17 Environmental Monitoring Market, By Product, 2022–2029 (Usd Million) 6.2 Monitors Table 18 Monitors Market, By Type, 2022–2029 (Usd Million) Table 19 Monitors Market, By Sampling Method, 2022–2029 (Usd Million) Table 20 Monitors Market, By Component, 2022–2029 (Usd Million) Table 21 Monitors Market, By Application, 2022–2029 (Usd Million) Table 22 Monitors Market, By End User, 2022–2029 (Usd Million) Table 23 Monitors Market, By Region, 2022–2029 (Usd Million) 6.2.1 Indoor Monitors 6.2.1.1 Increasing Public Awareness About Health Implications Of Indoor Environmental Pollution To Propel Market Table 24 Indoor Monitors Market, By Region, 2022–2029 (Usd Million) 6.2.2 Outdoor Monitors 6.2.2.1 Increasing Adoption Of Pollution Monitoring Strategies Across Industries To Drive Market Table 25 Outdoor Monitors Market, By Region, 2022–2029 (Usd Million) 6.2.3 Portable Monitors 6.2.3.1 Operational Advantages Over Fixed Monitors To Drive Adoption Of Portable Outdoor Monitors Table 26 Portable Monitors Market, By Region, 2022–2029 (Usd Million) 6.3 Software 6.3.1 Development Of Real-time Pollution Monitoring Software To Drive Market Table 27 Software Market, By Sampling Method, 2022–2029 (Usd Million) Table 28 Software Market, By Component, 2022–2029 (Usd Million) Table 29 Software Market, By Application, 2022–2029 (Usd Million) Table 30 Software Market, By End User, 2022–2029 (Usd Million) Table 31 Software Market, By Region, 2022–2029 (Usd Million) 7 Environmental Monitoring Market, By Sampling Method 7.1 Introduction Table 32 Environmental Monitoring Market, By Sampling Method, 2022–2029 (Usd Million) 7.2 Continuous Monitoring 7.2.1 Growing Demand For Real-time Pollution Monitoring To Drive Market Table 33 Continuous Monitoring Market, By Region, 2022–2029 (Usd Million) 7.3 Active Monitoring 7.3.1 Low Cost Of Operation To Drive Demand For Active Monitoring Methods Table 34 Active Monitoring Market, By Region, 2022–2029 (Usd Million) 7.4 Passive Monitoring 7.4.1 Industrialization Across Emerging Economies To Drive Demand For Passive Monitoring Table 35 Passive Monitoring Market, By Region, 2022–2029 (Usd Million) 7.5 Intermittent Monitoring 7.5.1 Increasing Government Emphasis On Compliance With Pollution Monitoring Standards To Drive Market Table 36 Intermittent Monitoring Market, By Region, 2022–2029 (Usd Million) 8 Environmental Monitoring Market, By Component 8.1 Introduction Table 37 Environmental Monitoring Market, By Component, 2022–2029 (Usd Million) 8.2 Particulate Detection Table 38 Particulate Detection Market, By Type, 2022–2029 (Usd Million) Table 39 Particulate Detection Market, By Region, 2022–2029 (Usd Million) 8.2.1 Pm2.5 Detection 8.2.1.1 Rising Levels Of Pm2.5 In Air To Drive Market Table 40 Pm2.5 Detection Market, By Region, 2022–2029 (Usd Million) 8.2.2 Pm10 Detection 8.2.2.1 Increasing Prevalence Of Respiratory And Cardiovascular Diseases To Drive Adoption Of Pm10 Air Quality Monitors Table 41 Pm10 Detection Market, By Region, 2022–2029 (Usd Million) 8.2.3 Other Particulate Detection Table 42 Other Particulate Detection Market, By Region, 2022–2029 (Usd Million) 8.3 Chemical Detection Table 43 Chemical Detection Market, By Type, 2022–2029 (Usd Million) Table 44 Chemical Detection Market, By Region, 2022–2029 (Usd Million) 8.3.1 Gas Detection 8.3.1.1 Rising Levels Of Chemical Air Pollutants Globally To Drive Market Table 45 Gas Detection Market, By Region, 2022–2029 (Usd Million) 8.3.2 Volatile Organic Compound (Voc) Detection 8.3.2.1 Voc Monitors Hold Modest Market Share Due To Low Preference In Developed Economies Table 46 Volatile Organic Compound Detection Market, By Region, 2022–2029 (Usd Million) 8.3.3 Pesticide Detection 8.3.3.1 Stringent Regulatory Norms On Use Of Pesticides To Drive Market Table 47 Pesticide Detection Market, By Region, 2022–2029 (Usd Million) 8.3.4 Other Chemical Detection Table 48 Other Chemical Detection Market, By Region, 2022–2029 (Usd Million) 8.4 Biological Detection 8.4.1 Growing Public Awareness About Biohazards Caused By Rising Pollution Levels To Drive Market Table 49 Biological Detection Market, By Region, 2022–2029 (Usd Million) 8.5 Temperature Sensing 8.5.1 Reluctance Among End Users To Utilize Innovative Temperature-sensing Products To Restrain Market Growth Table 50 Temperature Sensing Market, By Region, 2022–2029 (Usd Million) 8.6 Moisture Detection 8.6.1 Integration Of Moisture Sensing Technologies In Smart City Development To Drive Market Table 51 Moisture Detection Market, By Region, 2022–2029 (Usd Million) 8.7 Noise Measurement 8.7.1 Increasing Noise Pollution Levels And Rising Adoption Of Portable And Smartphone-based Noise Detection Products To Drive Market Table 52 Noise Measurement Market, By Region, 2022–2029 (Usd Million) 9 Environmental Monitoring Market, By Application 9.1 Introduction Table 53 Environmental Monitoring Market, By Application, 2022–2029 (Usd Million) 9.2 Air Pollution Monitoring 9.2.1 Rising Levels Of Air Pollution Worldwide To Drive Market Table 54 Air Pollution Monitoring Market, By Region, 2022–2029 (Usd Million) 9.3 Water Pollution Monitoring Table 55 Water Pollution Monitoring Market, By Type, 2022–2029 (Usd Million) Table 56 Water Pollution Monitoring Market, By Region, 2022–2029 (Usd Million) 9.3.1 Wastewater Monitoring 9.3.1.1 Stringent Government Regulations And Norms To Drive Market Table 57 Wastewater Monitoring Market, By Region, 2022–2029 (Usd Million) 9.3.2 Surface & Groundwater Monitoring 9.3.2.1 Rapid Industrialization And Urbanization To Drive Market Table 58 Surface & Groundwater Monitoring Market, By Region, 2022–2029 (Usd Million) 9.4 Soil Pollution Monitoring 9.4.1 Ongoing Development Of Innovative Products For Effective Soil Pollution Control To Support Market Growth Table 59 Soil Pollution Monitoring Market, By Region, 2022–2029 (Usd Million) 9.5 Noise Pollution Monitoring 9.5.1 Ineffective Implementation Of Noise Pollution Control Regulations To Restrain Market Growth Table 60 Noise Pollution Monitoring Market, By Region, 2022–2029 (Usd Million) 10 Environmental Monitoring Market, By End User 10.1 Introduction Table 61 Environmental Monitoring Market, By End User, 2022–2029 (Usd Million) 10.2 Government Agencies & Smart City Authorities 10.2.1 Development Of Low-cost Environmental Sensors To Drive Market Table 62 Government Agencies & Smart City Authorities Market, By Region, 2022–2029 (Usd Million) 10.3 Enterprises 10.3.1 Ability To Prevent Unrecoverable Data Loss To Drive Demand Table 63 Enterprises Market, By Region, 2022–2029 (Usd Million) 10.4 Commercial Users 10.4.1 Ability To Control Energy Consumption To Drive Demand Table 64 Commercial Users Market, By Region, 2022–2029 (Usd Million) 10.5 Residential Users 10.5.1 Cost-effectiveness And Reliability To Drive Adoption Among Residential Users Table 65 Residential Users Market, By Region, 2022–2029 (Usd Million) 10.6 Healthcare & Pharmaceutical Industries 10.6.1 Sterility Assurance Of Sterile Drugs To Drive Demand Table 66 Healthcare & Pharmaceutical Industries Market, By Region, 2022–2029 (Usd Million) 10.7 Industrial Users 10.7.1 Growing Population With Increasing Disposable Income To Drive Market Table 67 Industrial Users Market, By Region, 2022–2029 (Usd Million) 10.8 Other End Users Table 68 Other End Users Market, By Region, 2022–2029 (Usd Million) 11 Environmental Monitoring Market, By Region 11.1 Introduction Table 69 Environmental Monitoring Market, By Region, 2022–2029 (Usd Million) 11.2 North America Figure 32 North America: Environmental Monitoring Market Snapshot Table 70 North America: Environmental Monitoring Market, By Country, 2022–2029 (Usd Million) Table 71 North America: Environmental Monitoring Market, By Product, 2022–2029 (Usd Million) Table 72 North America: Environmental Monitors Market, By Type, 2022–2029 (Usd Million) Table 73 North America: Environmental Monitoring Market, By Sampling Method, 2022–2029 (Usd Million) Table 74 North America: Environmental Monitoring Market, By Component, 2022–2029 (Usd Million) Table 75 North America: Environmental Monitoring Market For Particulate Detection, By Type, 2022–2029 (Usd Million) Table 76 North America: Environmental Monitoring Market For Chemical Detection, By Type, 2022–2029 (Usd Million) Table 77 North America: Environmental Monitoring Market, By Application, 2022–2029 (Usd Million) Table 78 North America: Water Pollution Monitoring Market, By Type, 2022–2029 (Usd Million) Table 79 North America: Environmental Monitoring Market, By End User, 2022–2029 (Usd Million) 11.2.1 Recession Impact 11.2.2 Us 11.2.2.1 Stringent Pollution Monitoring And Control Regulations To Drive Market Table 80 Us: Environmental Monitoring Market, By Product, 2022–2029 (Usd Million) Table 81 Us: Environmental Monitors Market, By Type, 2022–2029 (Usd Million) 11.2.3 Canada 11.2.3.1 Increasing Demand For Effective Pollution Control Regulations To Drive Market Table 82 Canada: Environmental Monitoring Market, By Product, 2022–2029 (Usd Million) Table 83 Canada: Environmental Monitors Market, By Type, 2022–2029 (Usd Million) 11.3 Europe Table 84 Europe: Environmental Monitoring Market, By Country, 2022–2029 (Usd Million) Table 85 Europe: Environmental Monitoring Market, By Product, 2022–2029 (Usd Million) Table 86 Europe: Environmental Monitors Market, By Type, 2022–2029 (Usd Million) Table 87 Europe: Environmental Monitoring Market, By Sampling Method, 2022–2029 (Usd Million) Table 88 Europe: Environmental Monitoring Market, By Component, 2022–2029 (Usd Million) Table 89 Europe: Environmental Monitoring Market For Particulate Detection, By Type, 2022–2029 (Usd Million) Table 90 Europe: Environmental Monitoring Market For Chemical Detection, By Type, 2022–2029 (Usd Million) Table 91 Europe: Environmental Monitoring Market, By Application, 2022–2029 (Usd Million) Table 92 Europe: Water Pollution Monitoring Market, By Type, 2022–2029 (Usd Million) Table 93 Europe: Environmental Monitoring Market, By End User, 2022–2029 (Usd Million) 11.3.1 Recession Impact 11.3.2 Germany 11.3.2.1 Availability Of Significant Research Funding To Develop Pollution Monitoring Products To Drive Market Table 94 Germany: Environmental Monitoring Market, By Product, 2022–2029 (Usd Million) Table 95 Germany: Environmental Monitors Market, By Type, 2022–2029 (Usd Million) 11.3.3 Uk 11.3.3.1 Implementation Of Stringent Government Regulations To Drive Market Table 96 Uk: Environmental Monitoring Market, By Product, 2022–2029 (Usd Million) Table 97 Uk: Environmental Monitors Market, By Type, 2022–2029 (Usd Million) 11.3.4 France 11.3.4.1 Growing Pollution Levels And Implementation Of Stringent Regulations To Drive Market Table 98 France: Environmental Monitoring Market, By Product, 2022–2029 (Usd Million) Table 99 France: Environmental Monitors Market, By Type, 2022–2029 (Usd Million) 11.3.5 Italy 11.3.5.1 Stringent Environmental Regulations To Drive Market Table 100 Italy: Environmental Monitoring Market, By Product, 2022–2029 (Usd Million) Table 101 Italy: Environmental Monitors Market, By Type, 2022–2029 (Usd Million) 11.3.6 Spain 11.3.6.1 Stringency Of Environmental Laws To Drive Market Table 102 Spain: Environmental Monitoring Market, By Product, 2022–2029 (Usd Million) Table 103 Spain: Environmental Monitors Market, By Type, 2022–2029 (Usd Million) 11.3.7 Rest Of Europe Table 104 Rest Of Europe: Environmental Monitoring Market, By Product, 2022–2029 (Usd Million) Table 105 Rest Of Europe: Environmental Monitors Market, By Type, 2022–2029 (Usd Million) 11.4 Asia Pacific Figure 33 Asia Pacific: Environmental Monitoring Market Snapshot Table 106 Asia Pacific: Environmental Monitoring Market, By Country, 2022–2029 (Usd Million) Table 107 Asia Pacific: Environmental Monitoring Market, By Product, 2022–2029 (Usd Million) Table 108 Asia Pacific: Environmental Monitors Market, By Type, 2022–2029 (Usd Million) Table 109 Asia Pacific: Environmental Monitoring Market, By Sampling Method, 2022–2029 (Usd Million) Table 110 Asia Pacific: Environmental Monitoring Market, By Component, 2022–2029 (Usd Million) Table 111 Asia Pacific: Environmental Monitoring Market For Particulate Detection, By Type, 2022–2029 (Usd Million) Table 112 Asia Pacific: Environmental Monitoring Market For Chemical Detection, By Type, 2022–2029 (Usd Million) Table 113 Asia Pacific: Environmental Monitoring Market, By Application, 2022–2029 (Usd Million) Table 114 Asia Pacific: Water Pollution Monitoring Market, By Type, 2022–2029 (Usd Million) Table 115 Asia Pacific: Environmental Monitoring Market, By End User, 2022–2029 (Usd Million) 11.4.1 Recession Impact 11.4.2 Japan 11.4.2.1 High Adoption Rate For Advanced Technologies By Key Stakeholders To Drive Market Table 116 Japan: Environmental Monitoring Market, By Product, 2022–2029 (Usd Million) Table 117 Japan: Environmental Monitors Market, By Type, 2022–2029 (Usd Million) 11.4.3 China 11.4.3.1 Rising Demand For Air & Water Quality Monitoring And Favorable Regulatory Scenario To Drive Market Table 118 China: Environmental Monitoring Market, By Product, 2022–2029 (Usd Million) Table 119 China: Environmental Monitors Market, By Type, 2022–2029 (Usd Million) 11.4.4 India 11.4.4.1 Rising Levels Of Air, Water, Soil, And Noise Pollution To Drive Market Table 120 India: Environmental Monitoring Market, By Product, 2022–2029 (Usd Million) Table 121 India: Environmental Monitors Market, By Type, 2022–2029 (Usd Million) 11.4.5 Australia 11.4.5.1 Rising Investment In Low-emission Technologies To Drive Market Table 122 Australia: Environmental Monitoring Market, By Product, 2022–2029 (Usd Million) Table 123 Australia: Environmental Monitors Market, By Type, 2022–2029 (Usd Million) 11.4.6 South Korea 11.4.6.1 Rising Levels Of Air Pollution And Extensive Public Focus On Water Quality Monitoring To Drive Market Table 124 South Korea: Environmental Monitoring Market, By Product, 2022–2029 (Usd Million) Table 125 South Korea: Environmental Monitors Market, By Type, 2022–2029 (Usd Million) 11.4.7 Rest Of Asia Pacific Table 126 Rest Of Asia Pacific: Environmental Monitoring Market, By Product, 2022–2029 (Usd Million) Table 127 Rest Of Asia Pacific: Environmental Monitors Market, By Type, 2022–2029 (Usd Million) 11.5 Latin America Table 128 Latin America: Environmental Monitoring Market, By Country, 2022–2029 (Usd Million) Table 129 Latin America: Environmental Monitoring Market, By Product, 2022–2029 (Usd Million) Table 130 Latin America: Environmental Monitors Market, By Type, 2022–2029 (Usd Million) Table 131 Latin America: Environmental Monitoring Market, By Sampling Method, 2022–2029 (Usd Million) Table 132 Latin America: Environmental Monitoring Market, By Component, 2022–2029 (Usd Million) Table 133 Latin America: Environmental Monitoring Market For Particulate Detection, By Type, 2022–2029 (Usd Million) Table 134 Latin America: Environmental Monitoring Market For Chemical Detection, By Type, 2022–2029 (Usd Million) Table 135 Latin America: Environmental Monitoring Market, By Application, 2022–2029 (Usd Million) Table 136 Latin America: Water Pollution Monitoring Market, By Type, 2022–2029 (Usd Million) Table 137 Latin America: Environmental Monitoring Market, By End User, 2022–2029 (Usd Million) 11.5.1 Recession Impact 11.5.2 Brazil 11.5.2.1 Rising Demand For Water And Soil Pollution Monitoring Solutions To Drive Market Table 138 Brazil: Environmental Monitoring Market, By Product, 2022–2029 (Usd Million) Table 139 Brazil: Environmental Monitors Market, By Type, 2022–2029 (Usd Million) 11.5.3 Mexico 11.5.3.1 Rapid Industrialization And Urbanization To Drive Market Table 140 Mexico: Environmental Monitoring Market, By Product, 2022–2029 (Usd Million) Table 141 Mexico: Environmental Monitors Market, By Type, 2022–2029 (Usd Million) 11.5.4 Rest Of Latin America Table 142 Rest Of Latin America: Environmental Monitoring Market, By Product, 2022–2029 (Usd Million) Table 143 Rest Of Latin America: Environmental Monitors Market, By Type, 2022–2029 (Usd Million) 11.6 Middle East & Africa Table 144 Middle East & Africa: Environmental Monitoring Market, By Country, 2022–2029 (Usd Million) Table 145 Middle East & Africa: Environmental Monitoring Market, By Product, 2022–2029 (Usd Million) Table 146 Middle East & Africa: Environmental Monitors Market, By Type, 2022–2029 (Usd Million) Table 147 Middle East & Africa: Environmental Monitoring Market, By Sampling Method, 2022–2029 (Usd Million) Table 148 Middle East & Africa: Environmental Monitoring Market, By Component, 2022–2029 (Usd Million) Table 149 Middle East & Africa: Environmental Monitoring Market For Particulate Detection, By Type, 2022–2029 (Usd Million) Table 150 Middle East & Africa: Environmental Monitoring Market For Chemical Detection, By Type, 2022–2029 (Usd Million) Table 151 Middle East & Africa: Environmental Monitoring Market, By Application, 2022–2029 (Usd Million) Table 152 Middle East & Africa: Water Pollution Monitoring Market, By Type, 2022–2029 (Usd Million) Table 153 Middle East & Africa: Environmental Monitoring Market, By End User, 2022–2029 (Usd Million) 11.6.1 Recession Impact 11.6.2 Gcc Countries 11.6.2.1 Developments In Healthcare Infrastructure To Drive Market Table 154 Gcc Countries: Environmental Monitoring Market, By Product, 2022–2029 (Usd Million) Table 155 Gcc Countries: Environmental Monitors Market, By Type, 2022–2029 (Usd Million) 11.6.3 Rest Of Middle East & Africa Table 156 Rest Of Middle East & Africa: Environmental Monitoring Market, By Product, 2022–2029 (Usd Million) Table 157 Rest Of Middle East & Africa: Environmental Monitors Market, By Type, 2022–2029 (Usd Million) 12 Competitive Landscape 12.1 Introduction 12.2 Key Player Strategies/Right To Wins Figure 34 Key Developments By Major Players In Environmental Monitoring Market, 2019–2024
Environmental Monitoring Market by Type (Active Monitoring, Continuous Monitoring, Intermittent Monitoring), Product Type (Indoor Monitors, Outdoor Monitors, Sensors), Component, End-User, Application - Global Forecast 2024-2030
Environmental monitoring market by product type (sensors, indoor monitors, outdoor monitors), sampling method, component, application, end-user, and region (north america, europe, apac, latin america, mea) - global forecast to 2026, air quality monitoring market report by product type (indoor monitors, outdoor monitors, wearable monitors), pollutant (chemical pollutant, physical pollutant, biological pollutant), sampling method (active/continuous monitoring, passive monitoring, intermittent monitoring, stack monitoring), end-user (government agencies and academic institutes, commercial and residential users, petrochemical industry, power generation plants, pharmaceutical industry, and others), and region 2024-2032, air quality monitoring system market by sampling method (active or continuous monitoring, intermittent monitoring, manual monitoring), pollutant (biological pollutant, chemical pollutant, physical pollutant), product, end user - global forecast 2024-2030, global environmental monitoring market size study, by product type (sensors, monitors) by sampling method (continuous monitoring, active monitoring, passive monitoring, intermittent monitoring), by component (particulate detection, chemical detection, gas detection, biological detection, voc detection, others) by application (air pollution monitoring, water pollution monitoring, wastewater monitoring, soil pollution monitoring, noise pollution monitoring, surface & groundwater monitoring) by end-user (government agencies & smart city authorities, enterprise, commercial users, residential users, healthcare & pharmaceutical, industrial users, others) and regional forecasts 2022-2028., silicon photonics market by product (cable, sensor, switch), component (active components, passive components), applications - global forecast 2024-2030, research assistance.

Learn how to effectively navigate the market research process to help guide your organization on the journey to success.
Other tasks
- Printer format
- Order by fax
- Currency converter
Request a Free Sample
Samples provide examples of tables, charts, and topics included in this report. Your sample will be emailed to the address provided.
MarketResearch.com, Inc. is committed to protecting and respecting your privacy, and we’ll only use your personal information to administer your account and to provide the products and services you requested from us. From time to time, we would like to contact you about our products and services, as well as other content that may be of interest to you. If you consent to us contacting you for this purpose, please tick below to say how you would like us to contact you:
You can unsubscribe from these communications at any time. For more information on how to unsubscribe, our privacy practices, and how we are committed to protecting and respecting your privacy, please review our Privacy Policy.
By clicking submit below, you consent to allow MarketResearch.com, Inc. to store and process the personal information submitted above to provide you the content requested.
Research on a Monte Carlo global variance reduction method based on an automatic importance sampling method
- Published: 31 May 2024
- Volume 35 , article number 86 , ( 2024 )
Cite this article

- Yi-Sheng Hao ORCID: orcid.org/0000-0002-9179-1340 1 , 2 ,
- Zhen Wu 1 , 2 , 3 ,
- Shen-Shen Gao 1 , 2 ,
- Rui Qiu ORCID: orcid.org/0000-0002-3511-6164 1 , 2 ,
- Hui Zhang 1 , 2 &
- Jun-Li Li ORCID: orcid.org/0000-0002-3888-5735 1 , 2
Global variance reduction is a bottleneck in Monte Carlo shielding calculations. The global variance reduction problem requires that the statistical error of the entire space is uniform. This study proposed a grid-AIS method for the global variance reduction problem based on the AIS method, which was implemented in the Monte Carlo program MCShield. The proposed method was validated using the VENUS-III international benchmark problem and a self-shielding calculation example. The results from the VENUS-III benchmark problem showed that the grid-AIS method achieved a significant reduction in the variance of the statistical errors of the MESH grids, decreasing from 1.08 × 10 –2 to 3.84 × 10 –3 , representing a 64.00% reduction. This demonstrates that the grid-AIS method is effective in addressing global issues. The results of the self-shielding calculation demonstrate that the grid-AIS method produced accurate computational results. Moreover, the grid-AIS method exhibited a computational efficiency approximately one order of magnitude higher than that of the AIS method and approximately two orders of magnitude higher than that of the conventional Monte Carlo method.
This is a preview of subscription content, log in via an institution to check access.
Access this article
Price excludes VAT (USA) Tax calculation will be finalised during checkout.
Instant access to the full article PDF.
Rent this article via DeepDyve
Institutional subscriptions
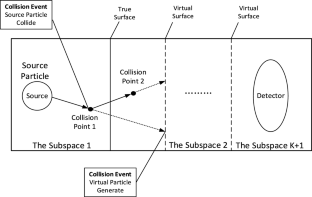
Data Availability
The data that support the findings of this study are openly available in Science Data Bank at https://cstr.cn/31253.11.sciencedb.j00186.00389 and https://doi.org/10.57760/sciencedb.j00186.00389 .
X.C. Nie, J. Li, S.L. Liu et al., Global variance reduction method for global Monte Carlo particle transport simulations of CFETR. Nucl. Sci. Tech. 28 , 115 (2017). https://doi.org/10.1007/s41365-017-0270-3
Article Google Scholar
P. Yang, Y. Dai, Y. Zou et al., Application of global variance reduction method to calculate a high-resolution fast neutron flux distribution for TMSR-SF1. Nucl. Sci. Tech. 30 , 125 (2019). https://doi.org/10.1007/s41365-019-0650-y
C. B. Kiedrowski, A. Ibrahim et al., Evaluating the efficiency of estimating numerous Monte Carlo tallies. 2011 ANS Annual Meeting (2011).
M.A. Cooper, E.W. Larsen, Automated weight windows for global Monte Carlo particle transport calculations. Nucl. Sci. Eng. 137 , 1–13 (2001). https://doi.org/10.13182/NSE00-34
Article ADS Google Scholar
J.C. Wagner, D.E. Peplow, S.W. Mosher, FW-CADIS method for global and regional variance reduction of Monte Carlo radiation transport calculations. Nucl. Sci. Eng. 176 , 37–57 (2014). https://doi.org/10.13182/NSE12-33
A.J. van Wijk, G. Van den Eynde, J.E. Hoogenboom, An easy to implement global variance reduction procedure for MCNP. Ann. Nucl. Energy 38 , 2496–2503 (2011). https://doi.org/10.1016/j.anucene.2011.07.037
Y. Hu, S. Yan, Y.F. Qiu et al., Implementation and benchmarking of an automatic global variance reduction method on OpenMC. Fusion Eng. Des. 173 , 112829 (2021). https://doi.org/10.1016/j.fusengdes.2021.112829
Q.Q. Pan, N. An, T.F. Zhang et al., Single-step Monte Carlo criticality algorithm. Comput. Phys. Commun. 279 , 108439 (2022). https://doi.org/10.1016/j.cpc.2022.108439
Article MathSciNet Google Scholar
Q.Q. Pan, Q.F. Zhao, L.J. Wang et al., Rapid diagnosis method for transplutonium isotopes production in high flux reactor. Nucl. Sci. Tech. 34 , 44 (2023). https://doi.org/10.57760/sciencedb.j00186.00039
Q.Q. Pan, L.J. Wang, Y. Cai et al., Density-extrapolation global Variance Reduction (DeGVR) method for large-scale radiation field calculation. Comput. Math. Appl. 143 , 10–22 (2023). https://doi.org/10.1016/j.camwa.2023.04.024
Q.Q. Pan, H.W. Lv, S.Q. Tang et al., Pointing probability driven semi-analytic Monte Carlo Method (PDMC)—Part I: global Variance Reduction for large-scale radiation transport analysis. Comput. Phys. Commun. 291 , 108850 (2023). https://doi.org/10.1016/j.cpc.2023.108850
Q.Q. Pan, J.J. Rao, S.F. Huang et al., Improved adaptive variance reduction algorithm based on RMC code for deep penetration problems. Ann. Nucl. Energy 137 , 107113 (2020). https://doi.org/10.1016/j.anucene.2019.107113
Q.Q. Pan, T.F. Zhang, X.J. Liu et al., SP3-coupled global variance reduction method based on RMC code. Nucl. Sci. Tech. 32 , 122 (2021). https://doi.org/10.1007/s41365-021-00973-0
A.C. Olivieri, G.M. Escandar, Analytical figures of merit. Introduction to Multivariate Calibration: A Practical Approach, Springer, pp159–177 (2018). doi: https://doi.org/10.1016/b978-0-12-410408-2.00006-5
J.J. Fan, Research on Monte Carlo method for solving problems with small probability and big contribution (Tsinghua University, Tsinghua, 2004). ( in Chinese )
Google Scholar
C.Y. Li, Research on Monte Carlo method for solving point detector flux and deep penetration problem (Tsinghua University, Tsinghua, 2008). ( in Chinese )
X. Wang, Research on key methods and program development of Monte Carlo calculation for high-efficiency radiation shielding (Tsinghua University, Tsinghua, 2016). ( in Chinese )
S.S. Gao, Research on Variance Reduction method for Monte Carlo simulation of reactor Shielding (Tsinghua University, Tsinghua, 2019). ( in Chinese )
X. Wang, J.L. Li, Z. Wu et al., Improved algorithms and coupled neutron-photon transport for auto-importance sampling method. Chin. Phys. C 41 , 014103 (2017). https://doi.org/10.1088/1674-1137/41/1/014103
Y.S. Hao, R. Qiu, Z. Wu et al., Research on the source-detector variance reduction method based on the AIS adjoint Monte Carlo method. Ann. Nucl. Energy 191 , 109916 (2023). https://doi.org/10.1016/j.anucene.2023.109916
S.S. Gao, Z. Wu, X. Wang et al., Development of a radiation shielding Monte Carlo Code: RShieldMC. Presented at International Conference on Mathematics and Computational Methods Applied to Nuclear Science and Engineering 2017, Jeju, Korea, April 16–20 (2017).
R. Rulko, Computing radiation dose to reactor pressure vessel and internals. Italy: the ENEA-Bologna Nuclear Data Centre, 1997.
Download references
Author information
Authors and affiliations.
Department of Engineering Physics, Tsinghua University, Beijing, 100084, China
Yi-Sheng Hao, Zhen Wu, Shen-Shen Gao, Rui Qiu, Hui Zhang & Jun-Li Li
Key Laboratory of Particle and Radiation Imaging of Ministry of Education, Beijing, 100084, China
Nuctech Company Limited, Beijing, 100084, China
You can also search for this author in PubMed Google Scholar
Contributions
All authors contributed to the study conception and design. Data processing and collection were performed by Yi-Sheng Hao, Zhen Wu and Shen-Shen Gao. Data analysis was performed by Rui Qiu and Hui Zhang. The draft of the manuscript was written by Yi-Sheng Hao and Jun-Li Li. All authors commented on previous versions of the manuscript. All authors read and approved the final manuscript.
Corresponding author
Correspondence to Rui Qiu .
Ethics declarations
Conflict of interest.
The authors declare that they have no competing interests.
Additional information
This work was supported by the Platform Development Foundation of the China Institute for Radiation Protection (No. YP21030101), the National Natural Science Foundation of China (General Program) (Nos. 12175114, U2167209), the National Key R&D Program of China (No. 2021YFF0603600), and the Tsinghua University Initiative Scientific Research Program (No. 20211080081).
Rights and permissions
Springer Nature or its licensor (e.g. a society or other partner) holds exclusive rights to this article under a publishing agreement with the author(s) or other rightsholder(s); author self-archiving of the accepted manuscript version of this article is solely governed by the terms of such publishing agreement and applicable law.
Reprints and permissions
About this article
Hao, YS., Wu, Z., Gao, SS. et al. Research on a Monte Carlo global variance reduction method based on an automatic importance sampling method. NUCL SCI TECH 35 , 86 (2024). https://doi.org/10.1007/s41365-024-01404-6
Download citation
Received : 01 June 2023
Revised : 27 July 2023
Accepted : 07 August 2023
Published : 31 May 2024
DOI : https://doi.org/10.1007/s41365-024-01404-6
Share this article
Anyone you share the following link with will be able to read this content:
Sorry, a shareable link is not currently available for this article.
Provided by the Springer Nature SharedIt content-sharing initiative
- Monte Carlo
- Global variance reduction
- Reactor shielding
- Automatic importance sampling
- Find a journal
- Publish with us
- Track your research
IMAGES
VIDEO
COMMENTS
Marketing: Sampling methods are used in marketing research to collect data on consumer preferences, behavior, and attitudes. For example, researchers may use random sampling to select a sample of consumers to participate in a survey about a new product. ... The main purpose of sampling methods in research is to obtain a representative sample of ...
Sampling methods are crucial for conducting reliable research. In this article, you will learn about the types, techniques and examples of sampling methods, and how to choose the best one for your study. Scribbr also offers free tools and guides for other aspects of academic writing, such as citation, bibliography, and fallacy.
The various types of sampling methods will generally fall into one of two categories. The first category is random sampling while the second category is representative sampling. A random sample, as the name suggests, is a sample of randomly selected individuals, designed to represent the population as a whole.
The choice of a sampling method is pivotal, as it directly influences the representativeness and reliability of research findings. This exploration delves into the significance of sampling techniques in market research , examining various methodologies, their strengths, limitations, and the strategic considerations that shape the selection process.
In market research, sampling means getting opinions from a number of people, chosen from a specific group, in order to find out about the whole group. Let's look at sampling in more detail and discuss the most popular types of sampling used in market research. ... Method of selection; Sample structure ; Plans for analysing and interpreting the ...
Collect participants via Prime Panels or our MTurk Toolkit by signing up for a CloudResearch account, or ask for our assistance in designing your survey or sampling approach or for help with data collection or analysis today. Part 3 of our guide to sampling deals with the nuts and bolts of designing a process to plan and source an appropriate ...
Sampling: The process and method of selecting your sample; Free eBook: 2024 Market Research Trends. Why is sampling important? Although the idea of sampling is easiest to understand when you think about a very large population, it makes sense to use sampling methods in research studies of all types and sizes.
Understand sampling methods in research, from simple random sampling to stratified, systematic, and cluster sampling. ... Market researchers use various sampling methods to collect samples from a large population to acquire relevant insights. The best sampling strategy for research is determined by criteria such as the purpose of the study ...
Sampling bias can fog or limit your research results. This will have an impact when you generalize your results across the whole target market. The two main causes of sampling bias are faulty research design and poor data collection or recording. They can affect probability and non-probability sampling. Faulty research
1. Simple random sampling. In a simple random sample, every member of the population has an equal chance of being selected. Your sampling frame should include the whole population. To conduct this type of sampling, you can use tools like random number generators or other techniques that are based entirely on chance.
Types of Market Research: Market Research Methods and Examples. ... To carry out market research, researchers need a representative sample that can be collected using one of the many sampling techniques. A representative sample is a small number of people that reflect, as accurately as possible, a larger group. ...
Non-probability sampling is most often used in exploratory or qualitative research, where the goal is to develop an understanding of a small or underrepresented population. There are five main types of non-probability sampling: convenience, judgemental, voluntary, snowball, and quota.
The simple random sampling method is less susceptible to bias or influence when selecting the participants, providing researchers with an objective conclusion. For example, if a company employs 800 individuals and wishes to perform a survey to determine employee satisfaction, the research team can select a sample group of 80 employees to ...
Abstract. Knowledge of sampling methods is essential to design quality research. Critical questions are provided to help researchers choose a sampling method. This article reviews probability and non-probability sampling methods, lists and defines specific sampling techniques, and provides pros and cons for consideration.
There's a wide range of probability sampling methods to explore and consider. Here are some of the best-known options. 1. Simple random sampling. With simple random sampling, every element in the population has an equal chance of being selected as part of the sample. It's something like picking a name out of a hat.
December 13, 2016. Article Summary: There are various sampling techniques in market research. The two most common methodologies are probability and non-probability sampling. Additionally, researchers can employ techniques including simple random sampling, systematic sampling, cluster sampling, and stratified sampling.
In the intricate world of market research, the quest for accurate, reliable, and insightful data is of paramount importance.One methodology that has proven immensely beneficial in this pursuit is targeted sampling. This method allows researchers to zero in on specific segments within a population that are of particular interest to their study, thereby yielding more relevant and valuable data.
Researchers often use different ones in market research Sampling methods, ... Non-probability sampling: In non-probability sampling, the researcher randomly selects the members of the research population. This sampling method is not a fixed or predefined selection process. This makes it difficult for all elements of a population to have an ...
The main goal of any marketing or statistical research is to provide quality results that are a reliable basis for decision-making. That is why the different types of sampling methods and techniques have a crucial role in research methodology and statistics. Your sample is one of the key factors that determine if your findings are accurate.
Sampling points are selected on the basis of numbers drawn at random that equate to the numbered columns and rows of the grid. If the area is large, it can be subdivided into sub-areas and a grid overlayed on these. Figure 7.4 depicts the procedures involved. As in figure 7.3 the columns and rows are given numbers.
River sampling versus RDE (Random Device Engagement) sampling: it's a showdown for the ages. As two of the foremost players in survey sampling methods, these two always appear to compete head-to-head for the attention and execution of market researchers.. As prominent players in the survey research sector, both the RDE and river sampling methods are considered superior to using survey panels ...
Market research Sampling ... The researcher will choose the characteristics they wish the respondents close respondent A person who takes part in a method of market research. to have. For example ...
7 Environmental Monitoring Market, By Sampling Method 7.1 Introduction Table 32 Environmental Monitoring Market, By Sampling Method, 2022-2029 (Usd Million) 7.2 Continuous Monitoring 7.2.1 Growing Demand For Real-time Pollution Monitoring To Drive Market Table 33 Continuous Monitoring Market, By Region, 2022-2029 (Usd Million) 7.3 Active ...
To solve the deep-penetration problem, Jiajin proposed the AIS method [].This method is based on importance sampling and statistical estimation; it introduces a virtual surface, divides the space into multilayer subspaces, generates virtual particles on the virtual surface to be transported to the next layer of the subspace, and performs automatic particle weight adjustment and quantity control.
To help overcome these limitations, the research team applied a mix of quantum and classical computing methods. This framework could allow quantum algorithms to address the areas that are challenging for state-of-the-art classical computing, including protein size, intrinsic disorder, mutations and the physics involved in proteins folding.
Time-domain numerical simulation is generally considered an accurate method to predict the mooring system performance, but it is also time and resource-consuming. This paper attempts to completely replace the time-domain numerical simulation with machine learning approaches, using a catenary anchor leg mooring (CALM) system design as an example. An adaptive sampling method is proposed to ...