

What is Basic Research?

Introduction
What is the meaning of basic research, examples of basic research, how do i perform basic research.
Basic science research is an essential pillar of scientific knowledge, because it extends understanding, provides new insights, and contributes to the advancement of science and fundamental knowledge across disciplines. In contrast, applied research aims for the discovery of practical solutions, which can involve using a technology or innovation that stems from existing knowledge. Basic science research potentially allows for generating ideas on which applied science can build novel inquiry and useful applications.
The process for conducting basic research is essentially the same as in an applied research orientation, but a better understanding of the distinction may prove increasingly important when crafting your research inquiry. In this article, we'll detail the characteristics and importance of basic research.

One of the key distinctions in science is the divide between basic and applied research . Applied research is directly associated with practical applications such as:
- career development
- program evaluation
- policy reform
- community action
In inquiries regarding each of these applications, researchers identify a specific problem to be solved and design a study intentionally aimed at developing solutions to that problem. Basic research is less concerned about specific problems and more focused on the nature of understanding.

Characteristics of basic research
Research that advances understanding of knowledge has distinguishing characteristics and important considerations.
- Focus on theoretical development . Rather than focus on practical applications, scholars in basic science research are more interested in ordering data and understanding in a scientific manner. This means expanding the consensus understanding of theory and the proposal of new theoretical frameworks that ultimately further research.
- Exploratory research questions . Basic research tends to look at areas where there is insufficient theoretical coherence to empirically understand phenomena. In other words, basic research often employs research questions that seek greater definition of knowledge.
- Funding for basic science . The nature of the support available for research depends on whether the science is basic or applied . Government agencies, national institutes, and private organizations all have different objectives, making some more appropriate for basic research than others.
- Writing for research dissemination . Academic journals exist on a continuum between theoretical and practical orientations. Journals that are more interested in theoretical and methodological discussions are more appropriate for basic research than are journals that look for more practical implications arising from research.
The brief survey of these characteristics should guide researchers about how they should approach research design in terms of feasibility, methods, and execution. This discussion shouldn't preclude you from pursuing basic research if it is more appropriate to your research inquiry. Instead, it should inform you of the opportunities, advantages, and challenges of basic research.

Importance of basic research
Fundamental research may seem aimless and unfocused if it doesn't yield any direct practical implications. However, its contribution to scholarly discussion cannot be overstated as it guides the development of theories and facilitates critical discussion about what applied studies to pursue next.
Basic science has guided fields such as microbiology, engineering, and chemistry. Scientists ultimately use its findings to develop new methods in treating disease and innovating on new technology.
Its contribution to the social sciences through observation and longitudinal study is also immeasurable. While basic research is often a precursor to more applied science, the theories it generates spur further study that ultimately leads to professional development programs and policy reform in social institutions.

Shape your data, shape your research with ATLAS.ti
Dive into a transformative analysis experience with a free trial of our powerful data analysis software.
Different fields rely on both applied and basic science for generating new knowledge. While applied research looks to yield direct benefits through real-world applications, fundamental research provides the necessary theoretical foundation for practical research in various fields.
Basic research example in education
Basic research in schooling contexts focuses on understanding the nature of teaching and learning or the processes within educational environments before any focused investigation can be designed, let alone conducted. Basic research is necessary in this case because of the various situated differences across learners who come from different cultures and backgrounds.
Basic research in education looks at various inquiries such as how teachers and students interact with each other and how alternative assessments can create positive learning outcomes. Ultimately, this may lead to applied research that can facilitate the creation of teacher education and professional development programs.
Basic research example in psychology
Psychology is a field that is under constant development. Basic research is essential to developing theories related to human behavior and mental processes. The subfield of cognition is a significant benefactor of basic research as it relies on novel theoretical frameworks relating to memory and learning.

Basic research example in health
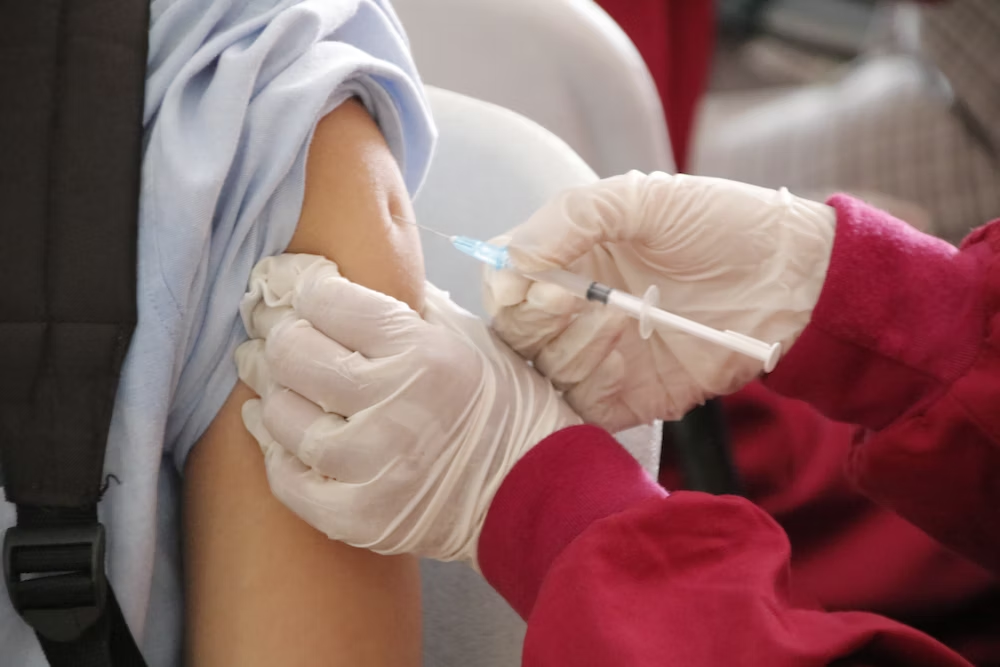
A great deal of health research that reaches public consciousness is undoubtedly applied research. The development of vaccines and other medicine to combat the COVID-19 pandemic was one such line of inquiry that addressed a practical need.
That said, scientists will undoubtedly credit basic research as a precursor to medical breakthroughs in applied science research. The knowledge gained through basic research laid the foundation for genomic sequencing of the COVID-19 virus, while experiments on living systems created knowledge about how to safely vaccinate the human body.
The National Institute of Health sponsors such basic research and research in other areas such as human DNA, while the National Science Foundation funds basic research on topics such as gender stereotypes and stress levels.
At its core, all scientific inquiry seeks to identify causal factors, relationships, and distinguishing characteristics among concepts and phenomena. As a result, the process is essentially the same for basic or applied science. Nonetheless, it is worth reviewing the process.
- Research design . Identify gaps in existing research that novel inquiry can address. A rigorous literature review can help identify theoretical or methodological gaps that a new study with an exploratory research question can address.
- Data collection . Exploratory research questions tend to prioritize data collection methods such as interviews , focus groups , and observations . Basic research, as a result, casts a wide net for any and all potential data that can facilitate generation of theoretical developments.
- Data analysis . At this stage, the goal is to organize and view your data in such a way that facilitates the identification of key insights. Analysis in basic research serves the dual purpose of filtering data through existing theoretical frameworks and generating new theory.
- Research dissemination . Once you determine your findings, you will want to present your insights in an empirical and rigorous manner. Visualizing data in your papers and presentations is useful for pointing out the most relevant data and analysis in your study.
Whatever your research, make it happen with ATLAS.ti
Turn data into knowledge and innovation with our powerful analysis tools. Download a free trial today.


- Contribution to sustainable development
- Closing ceremony
- Opening ceremony
How do basic sciences contribute to sustainable development?
Basic research is driven by curiosity. Also known as discovery research, owing to its emphasis on the quest for knowledge rather than commercial applications, basic research has led to breakthroughs that have spawned not only new technologies but even entirely new fields of science like genomics. Some of these discoveries were even accidental!
On this page, you will find examples of the many ways in which basic research is paving the way to sustainable development – even if the time lag between a discovery and concrete applications of this new knowledge can be more or less long. Take a look at the photo exhibition and videos on this page too.
One of the most prominent examples of the ties between basic research and societal change is the transistor. When the first transistor radio came on the market in the early 1950s, it was the fruit of almost 50 years of basic research in public laboratories. The computer chip followed, the first integrated cir-cuit. Since then, the miniaturization of integrated circuits has made it possible to manufacture ever-smaller mechanical, electronic and optical devices: today’s smartphones use millions of miniscule transistors to perform complex processes.

Having a capacity in basic sciences is in the interests of both developed and developing countries, given the potential for applications to foster sustainable development and raise standards of living. For example, a growing number of people around the world suffer from diabetes. Thanks to laboratory studies of the ways in which genes can be manipulated to make specific protein molecules, scientists are able to engineer genetically a common bacterium, Escherichia coli , to produce synthetic human insulin.
Invented in 1983 by American biochemist Kary Banks Mullis, the polymerase chain reaction (PCR) is a technique used to copy tiny segments of DNA. PCR acts like a magnifying glass, making it easier to analyse these DNA segments. PCR has a wide range of applications. It can be used to detect the presence of bacteria and viruses, such as in food, water or patients. Over the past two years, PCR has been used countless times to test individuals for infection with Covid-19. PCR can also be used to detect a genetic disorder or to further our understanding of evolutionary relationships between different organisms. In forensics, PCR can be used to identify a criminal on the basis of a sample left behind at a crime scene, such as a hair follicle. Kary Banks Mullis was awarded the Nobel Prize for Chemistry in 1993 for his revolutionary discovery.
UNESCO’s toolkit Mathematics for Action: Supporting Science-Based Decision-Making ( 2021) recalls that mathematical methods have been used during the Covid-19 pandemic to design vaccines more efficiently and to model vaccine hesitancy as a social phenomenon.
Green chemistry
In chemistry, basic research is laying the foundations for ‘green’ applications such as innocuous alter-natives to toxic chemicals and solvents, more energy-efficient chemical processes, biodegradable chemicals and waste and so on. One example of a new material to have emerged from basic science research is graphene; it has countless potential applications in industry. Isolated in 2004, graphene is ultra-light and much stronger than steel, yet extremely flexible. Graphene could be incorporated in rubber soles, for instance, to make shoes more durable.
Did you know that the flat screen on your television or cell phone is the fruit of basic research? The discovery of liquid crystals in 1888 would make it possible, more than a century later, to flatten the screens of televisions, computers and cell phones, once it was realized that liquid crystals could be used in display devices. Liquid crystals were first used in the 1960s in optical imaging devices. The liquid crystal does not produce light itself but rather draws on an external source – such as the back light on a television – to form images, making for low-energy consumption. As so often happens in basic research, liquid crystals were discovered by accident.
One key challenge today is to transition to clean forms of energy. Hydrogen is already being used on an industrial scale but hydrogen energy is almost entirely supplied from coal and gas 1 . Converting water into hydrogen using artificial photosynthesis – by splitting water (H20) into hydrogen and oxygen molecules – could offer a ‘green’ method of producing hydrogen energy.
A growing number of households are turning away from oil or gas heating towards solar, geothermal and wood pellet options. Biomass produced using the floating mangrove technology could provide an alternative to cutting down existing mangrove trees illegally to make wood pellets for charcoal production. UNESCO has developed a system of floating mangroves, in cooperation with Mourjan Marinas and Lusail City in Qatar. The system has been tested since 2012. The mangrove seeds have germinated, produced roots, stems, pneumatophores, leaves, bark, flower buds, flowers and even new seeds, in a floating system. The value of this new type of biomass is that it can be produced in coastal systems without the need for agricultural land.
Moreover, no freshwater is required for irrigation, since mangroves are salt-tolerant. The market for wood pellets was worth an estimated US$10 billion in 2020, with pellets costing about US$250 per ton, depending on the wood quality. Mangrove wood pellets would, thus, have great market potential.
1 See: International Energy Agency (2019) International action can scale up hydrogen to make it a key part of a clean and secure energy future, according to new IEA report . Web news, 14 June
Nature is a library from which we can learn
There is so much we can learn from observing nature. By studying the ways in which animals and plants have adapted to their environment, we can learn how to mimic these coping mechanisms in in-dustry. For instance, the structure of lotus leaves is designed to keep the surface of the leaf clean and dry in damp conditions. Unable to penetrate the leaf, rainwater simply runs off the surface, taking any dirt with it. These properties have inspired coatings for aircraft cabins which reduce the amount of cleaning fluid required to wash away fingerprints and spillages left by hundreds of passengers.
Have you ever wondered how migrating birds are able to fly hundreds or even thousands of kilome-tres without ever touching land? These birds exploit warm, rising air currents – or ‘thermals’ – to fly and gain height without needing to flap their wings, thereby conserving energy. Since the landscape of these currents is complex and continuously changing, we do not yet have a good understanding of exactly how birds find and navigate thermals. Scientists at UNESCO’s Abdus Salam International Cen-tre for Theoretical Physics have used machine learning to identify navigation strategies that could cope with, and even exploit, turbulent fluctuations, using a learning strategy based on trial and error which combined numerical simulations of atmospheric flow with reinforcement learning methods. This type of basic research could aid in the development of energy-efficient long-distance autonomous gliders.
You cannot tackle a crisis if you don’t understand it
As Mathematics for Action recalls, mathematical models can also help to tackle the interrelated crises of climate change, biodiversity loss and water insecurity. They can quantify the value of ecosystem services and biodiversity of large estuaries, for example, and enable us to explore multiple “what-if” scenarios to inform the decision-making process. Scientists use climate models in combination with storylines to produce scenarios of plausible alternative futures. This approach is used, for example, in the reports produced by the Intergovernmental Panel on Climate Change to inform policy-makers of the science behind climate change and their options through plausible scenarii for the future.
Atmospheric sciences can make a vital contribution to sustainable development. Scientists in UNESCO’s Intergovernmental Hydrological Programme have worked with the University of California, Irvine, in the USA, to develop an algorithm that can estimate real-time precipitation worldwide. This algorithm has enabled them to extract local and regional cloud features, such as coldness and texture, from an international constellation of satellites, in order to inform hydrological services on the ground about the risk of flooding, drought or storms and, thereby, improve emergency planning and manage-ment. This system is now available as the iRain application for mobile phones.
The University of Ghent in Belgium has an antenna in the Yangambi Biosphere Reserve in the Democratic Republic of Congo, which is part of UNESCO’s World Network of 738 Biosphere Reserves. In March 2020, the university installed the Congoflux Tower, the first of its kind in the Congo Basin . Some 55 m tall, the Congoflux Tower rises 15 m above the forest canopy as it collects data over a 1 km2 radius on exchanges of water vapour and greenhouse gases such as carbon dioxide, nitrous oxide and methane between the atmosphere and the forest. These data will fill yawning gaps in our knowledge of the role that the forest plays in carbon sequestration and, thereby, in limiting climate change.
Watch these videos
Michel Mayor, Nobel Prize Laureate
Donna Strickland, Nobel Prize laureate
Produced by CERN
Yaxiang Yuan, Mathematician
Sir Mike Stratton (UK)
Vidushi Nergheen-Bhujun, Associate Professor at Biopharmaceutical Unit, University of Mauritius
Niyazi Serdar Sariciftci, Linz Institute for Organic Solar Cells, Johannes Kepler University, Linz.
Andrea Ghez, Nobel Laureate for Physics , University of California, Los Angeles
Thank you for visiting nature.com. You are using a browser version with limited support for CSS. To obtain the best experience, we recommend you use a more up to date browser (or turn off compatibility mode in Internet Explorer). In the meantime, to ensure continued support, we are displaying the site without styles and JavaScript.
- View all journals
- Explore content
- About the journal
- Publish with us
- Sign up for alerts
- Published: 16 January 2024
Basic science is not just a foundation
- Ruth Lehmann ORCID: orcid.org/0000-0002-8454-5651 1
Nature Cell Biology volume 26 , pages 8–10 ( 2024 ) Cite this article
13k Accesses
698 Altmetric
Metrics details
- Cell biology
- Developmental biology
Intellectual freedom for scientists, unconstrained by commercial interests and direct application, fuels unexpected discoveries. Curiosity-driven, basic science has yielded a deeper understanding of how life forms develop and function in their environment and has had wide implications for health and our planet. Investing in this is vital for scientific progress and is worth protecting in a democracy.
This is a preview of subscription content, access via your institution
Access options
Access Nature and 54 other Nature Portfolio journals
Get Nature+, our best-value online-access subscription
24,99 € / 30 days
cancel any time
Subscribe to this journal
Receive 12 print issues and online access
195,33 € per year
only 16,28 € per issue
Buy this article
- Purchase on Springer Link
- Instant access to full article PDF
Prices may be subject to local taxes which are calculated during checkout
Van Doren, M., Broihier, H. T., Moore, L. A. & Lehmann, R. Nature 396 , 466–469 (1998).
Article PubMed Google Scholar
Nüsslein-Volhard, C., Frohnhöfer, H. G. & Lehmann, R. Science 238 , 1675–1681 (1987).
Ephrussi, A. & Lehmann, R. Nature 358 , 387–392 (1992).
Article CAS PubMed Google Scholar
Banisch, T. U. et al. Dev. Cell 56 , 1742–1755.e4 (2021).
Article CAS PubMed PubMed Central Google Scholar
Schor, N. F. Neurology 80 , 2070–2075 (2013).
Article PubMed PubMed Central Google Scholar
Rosenberg, B., Van Clamp, L. & Krigas, T. Nature 205 , 698–699 (1965).
Pardi, N., Hogan, M. J., Porter, F. W. & Weissman, D. Nat. Rev. Drug Discov. 17 , 261–279 (2018).
Bennett, C. F., Krainer, A. R. & Cleveland, D. W. Annu. Rev. Neurosci. 42 , 385–406 (2019).
Bassat, E. & Tanaka, E. M. Curr. Opin. Cell Biol. 73 , 117–123 (2021).
Reddien, P. W. The Cellular and Molecular Basis for Planarian Regeneration. Cell 175 , 327–345 (2018).
Poeschla, M. & Valenzano, D. R. J. Exp. Biol. 223 , jeb209296 (2020).
Oka, K., Yamakawa, M., Kawamura, Y., Kutsukake, N. & Miura, K. Annu. Rev. Anim. Biosci. 11 , 207–226 (2023).
Goldstein, B. Curr. Top. Dev. Biol. 147 , 173–198 (2022).
Gasulla, F., Del Campo, E. M., Casano, L. M. & Guéra, A. Plants 10 , 807 (2021).
Nüsslein-Volhard, C. & Wieschaus, E. Nature 287 , 795–801 (1980).
Download references
Acknowledgements
I am grateful for many discussions with friends and colleagues in conceptualizing the opinions expressed here, but most importantly to my collaborator on this essay, L. Girard, Director of Strategic Communication, Whitehead Institute. Much of the opinions expressed here were shaped by my experience as a trainee and investigator at the Max Planck Institute for Developmental Biology in Tübingen Germany, the Medical Research Council in Cambridge UK, the Skirball Institute at New York University Langone Medical Center, the Whitehead Institute, the Massachusetts Institute of Technology and the Howard Hughes Medical Institute.
Author information
Authors and affiliations.
Whitehead Institute and Department of Biology, MIT, Cambridge, MA, USA
Ruth Lehmann
You can also search for this author in PubMed Google Scholar
Corresponding author
Correspondence to Ruth Lehmann .
Ethics declarations
Competing interests.
The author declares no competing interests.
Rights and permissions
Reprints and permissions
About this article
Cite this article.
Lehmann, R. Basic science is not just a foundation. Nat Cell Biol 26 , 8–10 (2024). https://doi.org/10.1038/s41556-023-01308-4
Download citation
Published : 16 January 2024
Issue Date : January 2024
DOI : https://doi.org/10.1038/s41556-023-01308-4
Share this article
Anyone you share the following link with will be able to read this content:
Sorry, a shareable link is not currently available for this article.
Provided by the Springer Nature SharedIt content-sharing initiative
Quick links
- Explore articles by subject
- Guide to authors
- Editorial policies
Sign up for the Nature Briefing newsletter — what matters in science, free to your inbox daily.


An official website of the United States government
The .gov means it’s official. Federal government websites often end in .gov or .mil. Before sharing sensitive information, make sure you’re on a federal government site.
The site is secure. The https:// ensures that you are connecting to the official website and that any information you provide is encrypted and transmitted securely.
- Publications
- Account settings
Preview improvements coming to the PMC website in October 2024. Learn More or Try it out now .
- Advanced Search
- Journal List
- J Pharmacol Pharmacother
- v.4(2); Apr-Jun 2013
The critical steps for successful research: The research proposal and scientific writing: (A report on the pre-conference workshop held in conjunction with the 64 th annual conference of the Indian Pharmaceutical Congress-2012)
Pitchai balakumar.
Pharmacology Unit, Faculty of Pharmacy, AIMST University, Semeling, 08100 Bedong. Kedah Darul Aman, Malaysia
Mohammed Naseeruddin Inamdar
1 Department of Pharmacology, Al-Ameen College of Pharmacy, Bengaluru, Karnataka, India
Gowraganahalli Jagadeesh
2 Division of Cardiovascular and Renal Products, Center for Drug Evaluation and Research, US Food and Drug Administration, Silver Spring, USA
An interactive workshop on ‘The Critical Steps for Successful Research: The Research Proposal and Scientific Writing’ was conducted in conjunction with the 64 th Annual Conference of the Indian Pharmaceutical Congress-2012 at Chennai, India. In essence, research is performed to enlighten our understanding of a contemporary issue relevant to the needs of society. To accomplish this, a researcher begins search for a novel topic based on purpose, creativity, critical thinking, and logic. This leads to the fundamental pieces of the research endeavor: Question, objective, hypothesis, experimental tools to test the hypothesis, methodology, and data analysis. When correctly performed, research should produce new knowledge. The four cornerstones of good research are the well-formulated protocol or proposal that is well executed, analyzed, discussed and concluded. This recent workshop educated researchers in the critical steps involved in the development of a scientific idea to its successful execution and eventual publication.
INTRODUCTION
Creativity and critical thinking are of particular importance in scientific research. Basically, research is original investigation undertaken to gain knowledge and understand concepts in major subject areas of specialization, and includes the generation of ideas and information leading to new or substantially improved scientific insights with relevance to the needs of society. Hence, the primary objective of research is to produce new knowledge. Research is both theoretical and empirical. It is theoretical because the starting point of scientific research is the conceptualization of a research topic and development of a research question and hypothesis. Research is empirical (practical) because all of the planned studies involve a series of observations, measurements, and analyses of data that are all based on proper experimental design.[ 1 – 9 ]
The subject of this report is to inform readers of the proceedings from a recent workshop organized by the 64 th Annual conference of the ‘ Indian Pharmaceutical Congress ’ at SRM University, Chennai, India, from 05 to 06 December 2012. The objectives of the workshop titled ‘The Critical Steps for Successful Research: The Research Proposal and Scientific Writing,’ were to assist participants in developing a strong fundamental understanding of how best to develop a research or study protocol, and communicate those research findings in a conference setting or scientific journal. Completing any research project requires meticulous planning, experimental design and execution, and compilation and publication of findings in the form of a research paper. All of these are often unfamiliar to naïve researchers; thus, the purpose of this workshop was to teach participants to master the critical steps involved in the development of an idea to its execution and eventual publication of the results (See the last section for a list of learning objectives).
THE STRUCTURE OF THE WORKSHOP
The two-day workshop was formatted to include key lectures and interactive breakout sessions that focused on protocol development in six subject areas of the pharmaceutical sciences. This was followed by sessions on scientific writing. DAY 1 taught the basic concepts of scientific research, including: (1) how to formulate a topic for research and to describe the what, why , and how of the protocol, (2) biomedical literature search and review, (3) study designs, statistical concepts, and result analyses, and (4) publication ethics. DAY 2 educated the attendees on the basic elements and logistics of writing a scientific paper and thesis, and preparation of poster as well as oral presentations.
The final phase of the workshop was the ‘Panel Discussion,’ including ‘Feedback/Comments’ by participants. There were thirteen distinguished speakers from India and abroad. Approximately 120 post-graduate and pre-doctoral students, young faculty members, and scientists representing industries attended the workshop from different parts of the country. All participants received a printed copy of the workshop manual and supporting materials on statistical analyses of data.
THE BASIC CONCEPTS OF RESEARCH: THE KEY TO GETTING STARTED IN RESEARCH
A research project generally comprises four key components: (1) writing a protocol, (2) performing experiments, (3) tabulating and analyzing data, and (4) writing a thesis or manuscript for publication.
Fundamentals in the research process
A protocol, whether experimental or clinical, serves as a navigator that evolves from a basic outline of the study plan to become a qualified research or grant proposal. It provides the structural support for the research. Dr. G. Jagadeesh (US FDA), the first speaker of the session, spoke on ‘ Fundamentals in research process and cornerstones of a research project .’ He discussed at length the developmental and structural processes in preparing a research protocol. A systematic and step-by-step approach is necessary in planning a study. Without a well-designed protocol, there would be a little chance for successful completion of a research project or an experiment.
Research topic
The first and the foremost difficult task in research is to identify a topic for investigation. The research topic is the keystone of the entire scientific enterprise. It begins the project, drives the entire study, and is crucial for moving the project forward. It dictates the remaining elements of the study [ Table 1 ] and thus, it should not be too narrow or too broad or unfocused. Because of these potential pitfalls, it is essential that a good or novel scientific idea be based on a sound concept. Creativity, critical thinking, and logic are required to generate new concepts and ideas in solving a research problem. Creativity involves critical thinking and is associated with generating many ideas. Critical thinking is analytical, judgmental, and involves evaluating choices before making a decision.[ 4 ] Thus, critical thinking is convergent type thinking that narrows and refines those divergent ideas and finally settles to one idea for an in-depth study. The idea on which a research project is built should be novel, appropriate to achieve within the existing conditions, and useful to the society at large. Therefore, creativity and critical thinking assist biomedical scientists in research that results in funding support, novel discovery, and publication.[ 1 , 4 ]
Elements of a study protocol

Research question
The next most crucial aspect of a study protocol is identifying a research question. It should be a thought-provoking question. The question sets the framework. It emerges from the title, findings/results, and problems observed in previous studies. Thus, mastering the literature, attendance at conferences, and discussion in journal clubs/seminars are sources for developing research questions. Consider the following example in developing related research questions from the research topic.
Hepatoprotective activity of Terminalia arjuna and Apium graveolens on paracetamol-induced liver damage in albino rats.
How is paracetamol metabolized in the body? Does it involve P450 enzymes? How does paracetamol cause liver injury? What are the mechanisms by which drugs can alleviate liver damage? What biochemical parameters are indicative of liver injury? What major endogenous inflammatory molecules are involved in paracetamol-induced liver damage?
A research question is broken down into more precise objectives. The objectives lead to more precise methods and definition of key terms. The objectives should be SMART-Specific, Measurable, Achievable, Realistic, Time-framed,[ 10 ] and should cover the entire breadth of the project. The objectives are sometimes organized into hierarchies: Primary, secondary, and exploratory; or simply general and specific. Study the following example:
To evaluate the safety and tolerability of single oral doses of compound X in normal volunteers.
To assess the pharmacokinetic profile of compound X following single oral doses.
To evaluate the incidence of peripheral edema reported as an adverse event.
The objectives and research questions are then formulated into a workable or testable hypothesis. The latter forces us to think carefully about what comparisons will be needed to answer the research question, and establishes the format for applying statistical tests to interpret the results. The hypothesis should link a process to an existing or postulated biologic pathway. A hypothesis is written in a form that can yield measurable results. Studies that utilize statistics to compare groups of data should have a hypothesis. Consider the following example:
- The hepatoprotective activity of Terminalia arjuna is superior to that of Apium graveolens against paracetamol-induced liver damage in albino rats.
All biological research, including discovery science, is hypothesis-driven. However, not all studies need be conducted with a hypothesis. For example, descriptive studies (e.g., describing characteristics of a plant, or a chemical compound) do not need a hypothesis.[ 1 ]
Relevance of the study
Another important section to be included in the protocol is ‘significance of the study.’ Its purpose is to justify the need for the research that is being proposed (e.g., development of a vaccine for a disease). In summary, the proposed study should demonstrate that it represents an advancement in understanding and that the eventual results will be meaningful, contribute to the field, and possibly even impact society.
Biomedical literature
A literature search may be defined as the process of examining published sources of information on a research or review topic, thesis, grant application, chemical, drug, disease, or clinical trial, etc. The quantity of information available in print or electronically (e.g., the internet) is immense and growing with time. A researcher should be familiar with the right kinds of databases and search engines to extract the needed information.[ 3 , 6 ]
Dr. P. Balakumar (Institute of Pharmacy, Rajendra Institute of Technology and Sciences, Sirsa, Haryana; currently, Faculty of Pharmacy, AIMST University, Malaysia) spoke on ‘ Biomedical literature: Searching, reviewing and referencing .’ He schematically explained the basis of scientific literature, designing a literature review, and searching literature. After an introduction to the genesis and diverse sources of scientific literature searches, the use of PubMed, one of the premier databases used for biomedical literature searches world-wide, was illustrated with examples and screenshots. Several companion databases and search engines are also used for finding information related to health sciences, and they include Embase, Web of Science, SciFinder, The Cochrane Library, International Pharmaceutical Abstracts, Scopus, and Google Scholar.[ 3 ] Literature searches using alternative interfaces for PubMed such as GoPubMed, Quertle, PubFocus, Pubget, and BibliMed were discussed. The participants were additionally informed of databases on chemistry, drugs and drug targets, clinical trials, toxicology, and laboratory animals (reviewed in ref[ 3 ]).
Referencing and bibliography are essential in scientific writing and publication.[ 7 ] Referencing systems are broadly classified into two major types, such as Parenthetical and Notation systems. Parenthetical referencing is also known as Harvard style of referencing, while Vancouver referencing style and ‘Footnote’ or ‘Endnote’ are placed under Notation referencing systems. The participants were educated on each referencing system with examples.
Bibliography management
Dr. Raj Rajasekaran (University of California at San Diego, CA, USA) enlightened the audience on ‘ bibliography management ’ using reference management software programs such as Reference Manager ® , Endnote ® , and Zotero ® for creating and formatting bibliographies while writing a manuscript for publication. The discussion focused on the use of bibliography management software in avoiding common mistakes such as incomplete references. Important steps in bibliography management, such as creating reference libraries/databases, searching for references using PubMed/Google scholar, selecting and transferring selected references into a library, inserting citations into a research article and formatting bibliographies, were presented. A demonstration of Zotero®, a freely available reference management program, included the salient features of the software, adding references from PubMed using PubMed ID, inserting citations and formatting using different styles.
Writing experimental protocols
The workshop systematically instructed the participants in writing ‘ experimental protocols ’ in six disciplines of Pharmaceutical Sciences.: (1) Pharmaceutical Chemistry (presented by Dr. P. V. Bharatam, NIPER, Mohali, Punjab); (2) Pharmacology (presented by Dr. G. Jagadeesh and Dr. P. Balakumar); (3) Pharmaceutics (presented by Dr. Jayant Khandare, Piramal Life Sciences, Mumbai); (4) Pharmacy Practice (presented by Dr. Shobha Hiremath, Al-Ameen College of Pharmacy, Bengaluru); (5) Pharmacognosy and Phytochemistry (presented by Dr. Salma Khanam, Al-Ameen College of Pharmacy, Bengaluru); and (6) Pharmaceutical Analysis (presented by Dr. Saranjit Singh, NIPER, Mohali, Punjab). The purpose of the research plan is to describe the what (Specific Aims/Objectives), why (Background and Significance), and how (Design and Methods) of the proposal.
The research plan should answer the following questions: (a) what do you intend to do; (b) what has already been done in general, and what have other researchers done in the field; (c) why is this worth doing; (d) how is it innovative; (e) what will this new work add to existing knowledge; and (f) how will the research be accomplished?
In general, the format used by the faculty in all subjects is shown in Table 2 .
Elements of a research protocol

Biostatistics
Biostatistics is a key component of biomedical research. Highly reputed journals like The Lancet, BMJ, Journal of the American Medical Association, and many other biomedical journals include biostatisticians on their editorial board or reviewers list. This indicates that a great importance is given for learning and correctly employing appropriate statistical methods in biomedical research. The post-lunch session on day 1 of the workshop was largely committed to discussion on ‘ Basic biostatistics .’ Dr. R. Raveendran (JIPMER, Puducherry) and Dr. Avijit Hazra (PGIMER, Kolkata) reviewed, in parallel sessions, descriptive statistics, probability concepts, sample size calculation, choosing a statistical test, confidence intervals, hypothesis testing and ‘ P ’ values, parametric and non-parametric statistical tests, including analysis of variance (ANOVA), t tests, Chi-square test, type I and type II errors, correlation and regression, and summary statistics. This was followed by a practice and demonstration session. Statistics CD, compiled by Dr. Raveendran, was distributed to the participants before the session began and was demonstrated live. Both speakers worked on a variety of problems that involved both clinical and experimental data. They discussed through examples the experimental designs encountered in a variety of studies and statistical analyses performed for different types of data. For the benefit of readers, we have summarized statistical tests applied frequently for different experimental designs and post-hoc tests [ Figure 1 ].

Conceptual framework for statistical analyses of data. Of the two kinds of variables, qualitative (categorical) and quantitative (numerical), qualitative variables (nominal or ordinal) are not normally distributed. Numerical data that come from normal distributions are analyzed using parametric tests, if not; the data are analyzed using non-parametric tests. The most popularly used Student's t -test compares the means of two populations, data for this test could be paired or unpaired. One-way analysis of variance (ANOVA) is used to compare the means of three or more independent populations that are normally distributed. Applying t test repeatedly in pair (multiple comparison), to compare the means of more than two populations, will increase the probability of type I error (false positive). In this case, for proper interpretation, we need to adjust the P values. Repeated measures ANOVA is used to compare the population means if more than two observations coming from same subject over time. The null hypothesis is rejected with a ‘ P ’ value of less than 0.05, and the difference in population means is considered to be statistically significant. Subsequently, appropriate post-hoc tests are used for pairwise comparisons of population means. Two-way or three-way ANOVA are considered if two (diet, dose) or three (diet, dose, strain) independent factors, respectively, are analyzed in an experiment (not described in the Figure). Categorical nominal unmatched variables (counts or frequencies) are analyzed by Chi-square test (not shown in the Figure)
Research and publication ethics
The legitimate pursuit of scientific creativity is unfortunately being marred by a simultaneous increase in scientific misconduct. A disproportionate share of allegations involves scientists of many countries, and even from respected laboratories. Misconduct destroys faith in science and scientists and creates a hierarchy of fraudsters. Investigating misconduct also steals valuable time and resources. In spite of these facts, most researchers are not aware of publication ethics.
Day 1 of the workshop ended with a presentation on ‘ research and publication ethics ’ by Dr. M. K. Unnikrishnan (College of Pharmaceutical Sciences, Manipal University, Manipal). He spoke on the essentials of publication ethics that included plagiarism (attempting to take credit of the work of others), self-plagiarism (multiple publications by an author on the same content of work with slightly different wordings), falsification (manipulation of research data and processes and omitting critical data or results), gift authorship (guest authorship), ghostwriting (someone other than the named author (s) makes a major contribution), salami publishing (publishing many papers, with minor differences, from the same study), and sabotage (distracting the research works of others to halt their research completion). Additionally, Dr. Unnikrishnan pointed out the ‘ Ingelfinger rule ’ of stipulating that a scientist must not submit the same original research in two different journals. He also advised the audience that authorship is not just credit for the work but also responsibility for scientific contents of a paper. Although some Indian Universities are instituting preventive measures (e.g., use of plagiarism detecting software, Shodhganga digital archiving of doctoral theses), Dr. Unnikrishnan argued for a great need to sensitize young researchers on the nature and implications of scientific misconduct. Finally, he discussed methods on how editors and peer reviewers should ethically conduct themselves while managing a manuscript for publication.
SCIENTIFIC COMMUNICATION: THE KEY TO SUCCESSFUL SELLING OF FINDINGS
Research outcomes are measured through quality publications. Scientists must not only ‘do’ science but must ‘write’ science. The story of the project must be told in a clear, simple language weaving in previous work done in the field, answering the research question, and addressing the hypothesis set forth at the beginning of the study. Scientific publication is an organic process of planning, researching, drafting, revising, and updating the current knowledge for future perspectives. Writing a research paper is no easier than the research itself. The lectures of Day 2 of the workshop dealt with the basic elements and logistics of writing a scientific paper.
An overview of paper structure and thesis writing
Dr. Amitabh Prakash (Adis, Auckland, New Zealand) spoke on ‘ Learning how to write a good scientific paper .’ His presentation described the essential components of an original research paper and thesis (e.g., introduction, methods, results, and discussion [IMRaD]) and provided guidance on the correct order, in which data should appear within these sections. The characteristics of a good abstract and title and the creation of appropriate key words were discussed. Dr. Prakash suggested that the ‘title of a paper’ might perhaps have a chance to make a good impression, and the title might be either indicative (title that gives the purpose of the study) or declarative (title that gives the study conclusion). He also suggested that an abstract is a succinct summary of a research paper, and it should be specific, clear, and concise, and should have IMRaD structure in brief, followed by key words. Selection of appropriate papers to be cited in the reference list was also discussed. Various unethical authorships were enumerated, and ‘The International Committee of Medical Journal Editors (ICMJE) criteria for authorship’ was explained ( http://www.icmje.org/ethical_1author.html ; also see Table 1 in reference #9). The session highlighted the need for transparency in medical publication and provided a clear description of items that needed to be included in the ‘Disclosures’ section (e.g., sources of funding for the study and potential conflicts of interest of all authors, etc.) and ‘Acknowledgements’ section (e.g., writing assistance and input from all individuals who did not meet the authorship criteria). The final part of the presentation was devoted to thesis writing, and Dr. Prakash provided the audience with a list of common mistakes that are frequently encountered when writing a manuscript.
The backbone of a study is description of results through Text, Tables, and Figures. Dr. S. B. Deshpande (Institute of Medical Sciences, Banaras Hindu University, Varanasi, India) spoke on ‘ Effective Presentation of Results .’ The Results section deals with the observations made by the authors and thus, is not hypothetical. This section is subdivided into three segments, that is, descriptive form of the Text, providing numerical data in Tables, and visualizing the observations in Graphs or Figures. All these are arranged in a sequential order to address the question hypothesized in the Introduction. The description in Text provides clear content of the findings highlighting the observations. It should not be the repetition of facts in tables or graphs. Tables are used to summarize or emphasize descriptive content in the text or to present the numerical data that are unrelated. Illustrations should be used when the evidence bearing on the conclusions of a paper cannot be adequately presented in a written description or in a Table. Tables or Figures should relate to each other logically in sequence and should be clear by themselves. Furthermore, the discussion is based entirely on these observations. Additionally, how the results are applied to further research in the field to advance our understanding of research questions was discussed.
Dr. Peush Sahni (All-India Institute of Medical Sciences, New Delhi) spoke on effectively ‘ structuring the Discussion ’ for a research paper. The Discussion section deals with a systematic interpretation of study results within the available knowledge. He said the section should begin with the most important point relating to the subject studied, focusing on key issues, providing link sentences between paragraphs, and ensuring the flow of text. Points were made to avoid history, not repeat all the results, and provide limitations of the study. The strengths and novel findings of the study should be provided in the discussion, and it should open avenues for future research and new questions. The Discussion section should end with a conclusion stating the summary of key findings. Dr. Sahni gave an example from a published paper for writing a Discussion. In another presentation titled ‘ Writing an effective title and the abstract ,’ Dr. Sahni described the important components of a good title, such as, it should be simple, concise, informative, interesting and eye-catching, accurate and specific about the paper's content, and should state the subject in full indicating study design and animal species. Dr. Sahni explained structured (IMRaD) and unstructured abstracts and discussed a few selected examples with the audience.
Language and style in publication
The next lecture of Dr. Amitabh Prakash on ‘ Language and style in scientific writing: Importance of terseness, shortness and clarity in writing ’ focused on the actual sentence construction, language, grammar and punctuation in scientific manuscripts. His presentation emphasized the importance of brevity and clarity in the writing of manuscripts describing biomedical research. Starting with a guide to the appropriate construction of sentences and paragraphs, attendees were given a brief overview of the correct use of punctuation with interactive examples. Dr. Prakash discussed common errors in grammar and proactively sought audience participation in correcting some examples. Additional discussion was centered on discouraging the use of redundant and expendable words, jargon, and the use of adjectives with incomparable words. The session ended with a discussion of words and phrases that are commonly misused (e.g., data vs . datum, affect vs . effect, among vs . between, dose vs . dosage, and efficacy/efficacious vs . effective/effectiveness) in biomedical research manuscripts.
Working with journals
The appropriateness in selecting the journal for submission and acceptance of the manuscript should be determined by the experience of an author. The corresponding author must have a rationale in choosing the appropriate journal, and this depends upon the scope of the study and the quality of work performed. Dr. Amitabh Prakash spoke on ‘ Working with journals: Selecting a journal, cover letter, peer review process and impact factor ’ by instructing the audience in assessing the true value of a journal, understanding principles involved in the peer review processes, providing tips on making an initial approach to the editorial office, and drafting an appropriate cover letter to accompany the submission. His presentation defined the metrics that are most commonly used to measure journal quality (e.g., impact factor™, Eigenfactor™ score, Article Influence™ score, SCOPUS 2-year citation data, SCImago Journal Rank, h-Index, etc.) and guided attendees on the relative advantages and disadvantages of using each metric. Factors to consider when assessing journal quality were discussed, and the audience was educated on the ‘green’ and ‘gold’ open access publication models. Various peer review models (e.g., double-blind, single-blind, non-blind) were described together with the role of the journal editor in assessing manuscripts and selecting suitable reviewers. A typical checklist sent to referees was shared with the attendees, and clear guidance was provided on the best way to address referee feedback. The session concluded with a discussion of the potential drawbacks of the current peer review system.
Poster and oral presentations at conferences
Posters have become an increasingly popular mode of presentation at conferences, as it can accommodate more papers per meeting, has no time constraint, provides a better presenter-audience interaction, and allows one to select and attend papers of interest. In Figure 2 , we provide instructions, design, and layout in preparing a scientific poster. In the final presentation, Dr. Sahni provided the audience with step-by-step instructions on how to write and format posters for layout, content, font size, color, and graphics. Attendees were given specific guidance on the format of text on slides, the use of color, font type and size, and the use of illustrations and multimedia effects. Moreover, the importance of practical tips while delivering oral or poster presentation was provided to the audience, such as speak slowly and clearly, be informative, maintain eye contact, and listen to the questions from judges/audience carefully before coming up with an answer.

Guidelines and design to scientific poster presentation. The objective of scientific posters is to present laboratory work in scientific meetings. A poster is an excellent means of communicating scientific work, because it is a graphic representation of data. Posters should have focus points, and the intended message should be clearly conveyed through simple sections: Text, Tables, and Graphs. Posters should be clear, succinct, striking, and eye-catching. Colors should be used only where necessary. Use one font (Arial or Times New Roman) throughout. Fancy fonts should be avoided. All headings should have font size of 44, and be in bold capital letters. Size of Title may be a bit larger; subheading: Font size of 36, bold and caps. References and Acknowledgments, if any, should have font size of 24. Text should have font size between 24 and 30, in order to be legible from a distance of 3 to 6 feet. Do not use lengthy notes
PANEL DISCUSSION: FEEDBACK AND COMMENTS BY PARTICIPANTS
After all the presentations were made, Dr. Jagadeesh began a panel discussion that included all speakers. The discussion was aimed at what we do currently and could do in the future with respect to ‘developing a research question and then writing an effective thesis proposal/protocol followed by publication.’ Dr. Jagadeesh asked the following questions to the panelists, while receiving questions/suggestions from the participants and panelists.
- Does a Post-Graduate or Ph.D. student receive adequate training, either through an institutional course, a workshop of the present nature, or from the guide?
- Are these Post-Graduates self-taught (like most of us who learnt the hard way)?
- How are these guides trained? How do we train them to become more efficient mentors?
- Does a Post-Graduate or Ph.D. student struggle to find a method (s) to carry out studies? To what extent do seniors/guides help a post graduate overcome technical difficulties? How difficult is it for a student to find chemicals, reagents, instruments, and technical help in conducting studies?
- Analyses of data and interpretation: Most students struggle without adequate guidance.
- Thesis and publications frequently feature inadequate/incorrect statistical analyses and representation of data in tables/graphs. The student, their guide, and the reviewers all share equal responsibility.
- Who initiates and drafts the research paper? The Post-Graduate or their guide?
- What kind of assistance does a Post-Graduate get from the guide in finalizing a paper for publication?
- Does the guide insist that each Post-Graduate thesis yield at least one paper, and each Ph.D. thesis more than two papers, plus a review article?
The panelists and audience expressed a variety of views, but were unable to arrive at a decisive conclusion.
WHAT HAVE THE PARTICIPANTS LEARNED?
At the end of this fast-moving two-day workshop, the participants had opportunities in learning the following topics:
- Sequential steps in developing a study protocol, from choosing a research topic to developing research questions and a hypothesis.
- Study protocols on different topics in their subject of specialization
- Searching and reviewing the literature
- Appropriate statistical analyses in biomedical research
- Scientific ethics in publication
- Writing and understanding the components of a research paper (IMRaD)
- Recognizing the value of good title, running title, abstract, key words, etc
- Importance of Tables and Figures in the Results section, and their importance in describing findings
- Evidence-based Discussion in a research paper
- Language and style in writing a paper and expert tips on getting it published
- Presentation of research findings at a conference (oral and poster).
Overall, the workshop was deemed very helpful to participants. The participants rated the quality of workshop from “ satisfied ” to “ very satisfied .” A significant number of participants were of the opinion that the time allotted for each presentation was short and thus, be extended from the present two days to four days with adequate time to ask questions. In addition, a ‘hands-on’ session should be introduced for writing a proposal and manuscript. A large number of attendees expressed their desire to attend a similar workshop, if conducted, in the near future.
ACKNOWLEDGMENT
We gratefully express our gratitude to the Organizing Committee, especially Professors K. Chinnasamy, B. G. Shivananda, N. Udupa, Jerad Suresh, Padma Parekh, A. P. Basavarajappa, Mr. S. V. Veerramani, Mr. J. Jayaseelan, and all volunteers of the SRM University. We thank Dr. Thomas Papoian (US FDA) for helpful comments on the manuscript.
The opinions expressed herein are those of Gowraganahalli Jagadeesh and do not necessarily reflect those of the US Food and Drug Administration
Source of Support: Nil
Conflict of Interest: None declared.
- Basic Science
All scientific research conducted at medical schools and teaching hospitals ultimately aims to improve health and ability. Basic science research —often called fundamental or bench research—provides the foundation of knowledge for the applied science that follows. This type of research encompasses familiar scientific disciplines such as biochemistry, microbiology, physiology, and pharmacology, and their interplay, and involves laboratory studies with cell cultures, animal studies or physiological experiments. Basic science also increasingly extends to behavioral and social sciences as well, which have no less profound relevance for medicine and health.
Basic research can address clinical issues from a reductionist approach, including the discovery and analysis of single genes or genetic markers of diseases, or sequencing and manipulating genes. Typically, basic science research focuses on determining the causal mechanisms behind the functioning of the human body in health and illness, and utilizes hypothesis-driven experimental designs that can be specifically tested and revised. More recently, “systems biology” has focused on understanding how complex systems arise from elemental processes. Once these fundamental principles of the biologic processes are understood, these discoveries can be applied or translated into direct application to patient care.
In the absence of information and insights generated from basic research, it is difficult to envision how future advancement in treatment of disease and disability will occur; physicians would increasingly be in the position of mechanics who do not know how engines work, or programmers who do not understand how computers store and compile information. Basic research is also a source for new tools, models, and techniques (e.g., knockout mice, functional magnetic resonance imaging, etc.) that revolutionize research and development beyond the disciplines that give rise to them.
Federal Support for Medical Research and AAMC’s Role
The AAMC advocates for basic research, as part of the continuum from laboratory-based science to clinical and translational investigation to studies in and with communities and whole populations. The Association strongly supports the work of the U.S. National Institutes of Health (NIH), the American people’s leading organization in support of basic as well as general health research, reflected in the NIH mission statement:
To seek fundamental knowledge about the nature and behavior of living systems and the application of that knowledge to enhance health, lengthen life, and reduce illness and disability.
We also support the Agency for Healthcare Research and Quality, the Centers for Disease Control and Prevention, the Department of Veterans Affairs, and other agencies and organizations that sponsor or conduct medical research.
In addition to advocacy , the AAMC also provides analysis and advice on development of policies and regulations that guide basic and other research. The peer review (or merit review) is one example of a critically important system necessary for supporting the research enterprise. AAMC also examines federal and institutional policies promoting team science (increasingly important to research across the continuum) and the advancement and promotion of individual scientists working collaboratively within teams. We also support professional development programs for senior leaders of research programs at medical schools and teaching hospitals, and for those who guide training and career development of new scientists.
- Research & Technology
- Advocacy, Policy, & Legislation
- Funding/Finance
Scientific discovery is an ongoing process that takes time, observation, data collection and analysis, patience and more. At the NPRCs, our recent COVID-19 research is an example of the ongoing basic science process — how current research builds on previous discoveries and how discoveries help improve human health. This article from the National Institutes of Health (NIH) explains why basic science, such as the NPRCs conduct, is important and how taking time, as long as it takes, is a necessary part of scientific discovery.
Discoveries in Basic Science: A Perfectly Imperfect Process
Have you ever wondered why science takes so long? Maybe you haven’t thought about it much. But waiting around to hear more about COVID-19 may have you frustrated with the process.
Science can be slow and unpredictable. Each research advance builds on past discoveries, often in unexpected ways. It can take many years to build up enough basic knowledge to apply what scientists learn to improve human health.
“You really can’t understand how a disease occurs if you don’t understand how the basic biological processes work in the first place,” says Dr. Jon Lorsch, director of NIH’s National Institute of General Medical Sciences. “And of course, if you don’t understand how the underlying processes work, you don’t have any hope of actually fixing them and curing those diseases.”
Basic research asks fundamental questions about how life works. Scientists study cells, genes, proteins, and other building blocks of life. What they find can lead to better ways to predict, prevent, diagnose, and treat disease.
How Basic Research Works
When scientists are interested in a topic, they first read previous studies to find out what’s known. This lets them figure out what questions still need to be asked.
Using what they learn, scientists design new experiments to answer important unresolved questions. They collect and analyze data, and evaluate what the findings might mean.
The type of experiment depends on the question and the field of science. A lot of what we know about basic biology so far has come from studying organisms other than people.
“If one wants to delve into the intricate details of how cells work or how the molecules inside the cells work together to make processes happen, it can be very difficult to study them in humans,” Lorsch explains. “But you can study them in a less complicated life form.”
These are called research organisms. The basic biology of these organisms can be similar to ours, and much is already known about their genetic makeup. They can include yeast, fruit flies, worms, zebrafish, and mice.
Computers can also help answer basic science questions. “You can use computers to look for patterns and to try to understand how the different data you’ve collected can fit together,” Lorsch says.
But computer models have limits. They often rely on what’s already known about a process or disease. So it’s important that the models include the most up-to-date information. Scientists usually have more confidence in predictions when different computer models come up with similar answers.
This is true for other types of studies, too. One study usually only uncovers a piece of a much larger puzzle. It takes a lot of data from many different scientists to start piecing the puzzle together.
Building Together
Science is a collective effort. Researchers often work together and communicate with each other regularly. They chat with other scientists about their work, both in their lab and beyond. They present their findings at national and international conferences. Networking with their peers lets them get feedback from other experts while doing their research.
Once they’ve collected enough evidence to support their idea, researchers go through a more formal peer-review process. They write a paper summarizing their study and try to get it published in a scientific journal. After they submit their study to a journal, editors review it and decide whether to send it to other scientists for peer review.
“Peer review keeps us all informed of each other’s work, makes sure we’re staying on the cutting-edge with our techniques, and maintains a level of integrity and honesty in science,” says Dr. Windy Boyd, a senior science editor who oversees the peer-review process at NIH’s scientific journal of environmental health research and news.
Different experts evaluate the quality of the research. They look at the methods and how the results were gathered.
“Peer reviewers can all be looking at slightly different parts of the work,” Boyd explains. “One reviewer might be an expert in one specific method, where another reviewer might be more of an expert in the type of study design, and someone else might be more focused on the disease itself.”
Peer reviewers may see problems with the experiments or think different experiments are needed. They might offer new ways to interpret the data. They can also reject the paper because of poor quality, a lack of new information, or other reasons. But if the research passes this peer review process, the study is published.
Just because a study is published doesn’t mean its interpretation of the data is “right.” Other studies may support a different hypothesis.
Scientists work to develop different explanations, or models, for the various findings. They usually favor the model that can explain the most data that’s available.
“At some point, the weight of the evidence from different research groups points strongly to an answer being the most likely,” Lorsch explains. “You should be able to use that model to make predictions that are testable, which further strengthens the likelihood that that answer is the correct one.”
An Ever-Changing Process
Science is always a work in progress. It takes many studies to figure out the “most accurate” model—which doesn’t mean the “right” model.
It’s a self-correcting process. Sometimes experiments can give different results when they’re repeated. Other times, when the results are combined with later studies, the current model no longer can explain all the data and needs to be updated.
“Science is constantly evolving; new tools are being discovered,” Boyd says. “So our understanding can also change over time as we use these different tools.”
Science looks at a question from many different angles with many different techniques. Stories you may see or read about a new study may not explain how it fits into the bigger picture.
“It can seem like, at times, studies contradict each other,” Boyd explains. “But the studies could have different designs and often ask different questions.”
The details of how studies are different aren’t always explained in stories in the media. Only over time does enough evidence accumulate to point toward an explanation of all the different findings on a topic.
“The storybook version of science is that the scientist is doing something, and there’s this eureka moment where everything is revealed,” Lorsch says. “But that’s really not how it happens. Everything is done one increment at a time.”
You are leaving the NPRC.org website
- About NPRCs
Education During Coronavirus
A Smithsonian magazine special report
Science | June 15, 2020
Seventy-Five Scientific Research Projects You Can Contribute to Online
From astrophysicists to entomologists, many researchers need the help of citizen scientists to sift through immense data collections
:focal(300x157:301x158)/https://tf-cmsv2-smithsonianmag-media.s3.amazonaws.com/filer/e2/ca/e2ca665f-77b7-4ba2-8cd2-46f38cbf2b60/citizen_science_mobile.png "basic science research project")
Rachael Lallensack
Former Assistant Editor, Science and Innovation
If you find yourself tired of streaming services, reading the news or video-chatting with friends, maybe you should consider becoming a citizen scientist. Though it’s true that many field research projects are paused , hundreds of scientists need your help sifting through wildlife camera footage and images of galaxies far, far away, or reading through diaries and field notes from the past.
Plenty of these tools are free and easy enough for children to use. You can look around for projects yourself on Smithsonian Institution’s citizen science volunteer page , National Geographic ’s list of projects and CitizenScience.gov ’s catalog of options. Zooniverse is a platform for online-exclusive projects , and Scistarter allows you to restrict your search with parameters, including projects you can do “on a walk,” “at night” or “on a lunch break.”
To save you some time, Smithsonian magazine has compiled a collection of dozens of projects you can take part in from home.

American Wildlife
If being home has given you more time to look at wildlife in your own backyard, whether you live in the city or the country, consider expanding your view, by helping scientists identify creatures photographed by camera traps. Improved battery life, motion sensors, high-resolution and small lenses have made camera traps indispensable tools for conservation.These cameras capture thousands of images that provide researchers with more data about ecosystems than ever before.
Smithsonian Conservation Biology Institute’s eMammal platform , for example, asks users to identify animals for conservation projects around the country. Currently, eMammal is being used by the Woodland Park Zoo ’s Seattle Urban Carnivore Project, which studies how coyotes, foxes, raccoons, bobcats and other animals coexist with people, and the Washington Wolverine Project, an effort to monitor wolverines in the face of climate change. Identify urban wildlife for the Chicago Wildlife Watch , or contribute to wilderness projects documenting North American biodiversity with The Wilds' Wildlife Watch in Ohio , Cedar Creek: Eyes on the Wild in Minnesota , Michigan ZoomIN , Western Montana Wildlife and Snapshot Wisconsin .
"Spend your time at home virtually exploring the Minnesota backwoods,” writes the lead researcher of the Cedar Creek: Eyes on the Wild project. “Help us understand deer dynamics, possum populations, bear behavior, and keep your eyes peeled for elusive wolves!"

If being cooped up at home has you daydreaming about traveling, Snapshot Safari has six active animal identification projects. Try eyeing lions, leopards, cheetahs, wild dogs, elephants, giraffes, baobab trees and over 400 bird species from camera trap photos taken in South African nature reserves, including De Hoop Nature Reserve and Madikwe Game Reserve .
With South Sudan DiversityCam , researchers are using camera traps to study biodiversity in the dense tropical forests of southwestern South Sudan. Part of the Serenegeti Lion Project, Snapshot Serengeti needs the help of citizen scientists to classify millions of camera trap images of species traveling with the wildebeest migration.
Classify all kinds of monkeys with Chimp&See . Count, identify and track giraffes in northern Kenya . Watering holes host all kinds of wildlife, but that makes the locales hotspots for parasite transmission; Parasite Safari needs volunteers to help figure out which animals come in contact with each other and during what time of year.
Mount Taranaki in New Zealand is a volcanic peak rich in native vegetation, but native wildlife, like the North Island brown kiwi, whio/blue duck and seabirds, are now rare—driven out by introduced predators like wild goats, weasels, stoats, possums and rats. Estimate predator species compared to native wildlife with Taranaki Mounga by spotting species on camera trap images.
The Zoological Society of London’s (ZSL) Instant Wild app has a dozen projects showcasing live images and videos of wildlife around the world. Look for bears, wolves and lynx in Croatia ; wildcats in Costa Rica’s Osa Peninsula ; otters in Hampshire, England ; and both black and white rhinos in the Lewa-Borana landscape in Kenya.

Under the Sea
Researchers use a variety of technologies to learn about marine life and inform conservation efforts. Take, for example, Beluga Bits , a research project focused on determining the sex, age and pod size of beluga whales visiting the Churchill River in northern Manitoba, Canada. With a bit of training, volunteers can learn how to differentiate between a calf, a subadult (grey) or an adult (white)—and even identify individuals using scars or unique pigmentation—in underwater videos and images. Beluga Bits uses a “ beluga boat ,” which travels around the Churchill River estuary with a camera underneath it, to capture the footage and collect GPS data about the whales’ locations.
Many of these online projects are visual, but Manatee Chat needs citizen scientists who can train their ear to decipher manatee vocalizations. Researchers are hoping to learn what calls the marine mammals make and when—with enough practice you might even be able to recognize the distinct calls of individual animals.
Several groups are using drone footage to monitor seal populations. Seals spend most of their time in the water, but come ashore to breed. One group, Seal Watch , is analyzing time-lapse photography and drone images of seals in the British territory of South Georgia in the South Atlantic. A team in Antarctica captured images of Weddell seals every ten minutes while the seals were on land in spring to have their pups. The Weddell Seal Count project aims to find out what threats—like fishing and climate change—the seals face by monitoring changes in their population size. Likewise, the Año Nuevo Island - Animal Count asks volunteers to count elephant seals, sea lions, cormorants and more species on a remote research island off the coast of California.
With Floating Forests , you’ll sift through 40 years of satellite images of the ocean surface identifying kelp forests, which are foundational for marine ecosystems, providing shelter for shrimp, fish and sea urchins. A project based in southwest England, Seagrass Explorer , is investigating the decline of seagrass beds. Researchers are using baited cameras to spot commercial fish in these habitats as well as looking out for algae to study the health of these threatened ecosystems. Search for large sponges, starfish and cold-water corals on the deep seafloor in Sweden’s first marine park with the Koster seafloor observatory project.
The Smithsonian Environmental Research Center needs your help spotting invasive species with Invader ID . Train your eye to spot groups of organisms, known as fouling communities, that live under docks and ship hulls, in an effort to clean up marine ecosystems.
If art history is more your speed, two Dutch art museums need volunteers to start “ fishing in the past ” by analyzing a collection of paintings dating from 1500 to 1700. Each painting features at least one fish, and an interdisciplinary research team of biologists and art historians wants you to identify the species of fish to make a clearer picture of the “role of ichthyology in the past.”

Interesting Insects
Notes from Nature is a digitization effort to make the vast resources in museums’ archives of plants and insects more accessible. Similarly, page through the University of California Berkeley’s butterfly collection on CalBug to help researchers classify these beautiful critters. The University of Michigan Museum of Zoology has already digitized about 300,000 records, but their collection exceeds 4 million bugs. You can hop in now and transcribe their grasshopper archives from the last century . Parasitic arthropods, like mosquitos and ticks, are known disease vectors; to better locate these critters, the Terrestrial Parasite Tracker project is working with 22 collections and institutions to digitize over 1.2 million specimens—and they’re 95 percent done . If you can tolerate mosquito buzzing for a prolonged period of time, the HumBug project needs volunteers to train its algorithm and develop real-time mosquito detection using acoustic monitoring devices. It’s for the greater good!

For the Birders
Birdwatching is one of the most common forms of citizen science . Seeing birds in the wilderness is certainly awe-inspiring, but you can birdwatch from your backyard or while walking down the sidewalk in big cities, too. With Cornell University’s eBird app , you can contribute to bird science at any time, anywhere. (Just be sure to remain a safe distance from wildlife—and other humans, while we social distance ). If you have safe access to outdoor space—a backyard, perhaps—Cornell also has a NestWatch program for people to report observations of bird nests. Smithsonian’s Migratory Bird Center has a similar Neighborhood Nest Watch program as well.
Birdwatching is easy enough to do from any window, if you’re sheltering at home, but in case you lack a clear view, consider these online-only projects. Nest Quest currently has a robin database that needs volunteer transcribers to digitize their nest record cards.
You can also pitch in on a variety of efforts to categorize wildlife camera images of burrowing owls , pelicans , penguins (new data coming soon!), and sea birds . Watch nest cam footage of the northern bald ibis or greylag geese on NestCams to help researchers learn about breeding behavior.
Or record the coloration of gorgeous feathers across bird species for researchers at London’s Natural History Museum with Project Plumage .

Pretty Plants
If you’re out on a walk wondering what kind of plants are around you, consider downloading Leafsnap , an electronic field guide app developed by Columbia University, the University of Maryland and the Smithsonian Institution. The app has several functions. First, it can be used to identify plants with its visual recognition software. Secondly, scientists can learn about the “ the ebb and flow of flora ” from geotagged images taken by app users.
What is older than the dinosaurs, survived three mass extinctions and still has a living relative today? Ginko trees! Researchers at Smithsonian’s National Museum of Natural History are studying ginko trees and fossils to understand millions of years of plant evolution and climate change with the Fossil Atmospheres project . Using Zooniverse, volunteers will be trained to identify and count stomata, which are holes on a leaf’s surface where carbon dioxide passes through. By counting these holes, or quantifying the stomatal index, scientists can learn how the plants adapted to changing levels of carbon dioxide. These results will inform a field experiment conducted on living trees in which a scientist is adjusting the level of carbon dioxide for different groups.
Help digitize and categorize millions of botanical specimens from natural history museums, research institutions and herbaria across the country with the Notes from Nature Project . Did you know North America is home to a variety of beautiful orchid species? Lend botanists a handby typing handwritten labels on pressed specimens or recording their geographic and historic origins for the New York Botanical Garden’s archives. Likewise, the Southeastern U.S. Biodiversity project needs assistance labeling pressed poppies, sedums, valerians, violets and more. Groups in California , Arkansas , Florida , Texas and Oklahoma all invite citizen scientists to partake in similar tasks.

Historic Women in Astronomy
Become a transcriber for Project PHaEDRA and help researchers at the Harvard-Smithsonian Center for Astrophysics preserve the work of Harvard’s women “computers” who revolutionized astronomy in the 20th century. These women contributed more than 130 years of work documenting the night sky, cataloging stars, interpreting stellar spectra, counting galaxies, and measuring distances in space, according to the project description .
More than 2,500 notebooks need transcription on Project PhaEDRA - Star Notes . You could start with Annie Jump Cannon , for example. In 1901, Cannon designed a stellar classification system that astronomers still use today. Cecilia Payne discovered that stars are made primarily of hydrogen and helium and can be categorized by temperature. Two notebooks from Henrietta Swan Leavitt are currently in need of transcription. Leavitt, who was deaf, discovered the link between period and luminosity in Cepheid variables, or pulsating stars, which “led directly to the discovery that the Universe is expanding,” according to her bio on Star Notes .
Volunteers are also needed to transcribe some of these women computers’ notebooks that contain references to photographic glass plates . These plates were used to study space from the 1880s to the 1990s. For example, in 1890, Williamina Flemming discovered the Horsehead Nebula on one of these plates . With Star Notes, you can help bridge the gap between “modern scientific literature and 100 years of astronomical observations,” according to the project description . Star Notes also features the work of Cannon, Leavitt and Dorrit Hoffleit , who authored the fifth edition of the Bright Star Catalog, which features 9,110 of the brightest stars in the sky.

Microscopic Musings
Electron microscopes have super-high resolution and magnification powers—and now, many can process images automatically, allowing teams to collect an immense amount of data. Francis Crick Institute’s Etch A Cell - Powerhouse Hunt project trains volunteers to spot and trace each cell’s mitochondria, a process called manual segmentation. Manual segmentation is a major bottleneck to completing biological research because using computer systems to complete the work is still fraught with errors and, without enough volunteers, doing this work takes a really long time.
For the Monkey Health Explorer project, researchers studying the social behavior of rhesus monkeys on the tiny island Cayo Santiago off the southeastern coast of Puerto Rico need volunteers to analyze the monkeys’ blood samples. Doing so will help the team understand which monkeys are sick and which are healthy, and how the animals’ health influences behavioral changes.
Using the Zooniverse’s app on a phone or tablet, you can become a “ Science Scribbler ” and assist researchers studying how Huntington disease may change a cell’s organelles. The team at the United Kingdom's national synchrotron , which is essentially a giant microscope that harnesses the power of electrons, has taken highly detailed X-ray images of the cells of Huntington’s patients and needs help identifying organelles, in an effort to see how the disease changes their structure.
Oxford University’s Comprehensive Resistance Prediction for Tuberculosis: an International Consortium—or CRyPTIC Project , for short, is seeking the aid of citizen scientists to study over 20,000 TB infection samples from around the world. CRyPTIC’s citizen science platform is called Bash the Bug . On the platform, volunteers will be trained to evaluate the effectiveness of antibiotics on a given sample. Each evaluation will be checked by a scientist for accuracy and then used to train a computer program, which may one day make this process much faster and less labor intensive.

Out of This World
If you’re interested in contributing to astronomy research from the comfort and safety of your sidewalk or backyard, check out Globe at Night . The project monitors light pollution by asking users to try spotting constellations in the night sky at designated times of the year . (For example, Northern Hemisphere dwellers should look for the Bootes and Hercules constellations from June 13 through June 22 and record the visibility in Globe at Night’s app or desktop report page .)
For the amateur astrophysicists out there, the opportunities to contribute to science are vast. NASA's Wide-field Infrared Survey Explorer (WISE) mission is asking for volunteers to search for new objects at the edges of our solar system with the Backyard Worlds: Planet 9 project .
Galaxy Zoo on Zooniverse and its mobile app has operated online citizen science projects for the past decade. According to the project description, there are roughly one hundred billion galaxies in the observable universe. Surprisingly, identifying different types of galaxies by their shape is rather easy. “If you're quick, you may even be the first person to see the galaxies you're asked to classify,” the team writes.
With Radio Galaxy Zoo: LOFAR , volunteers can help identify supermassive blackholes and star-forming galaxies. Galaxy Zoo: Clump Scout asks users to look for young, “clumpy” looking galaxies, which help astronomers understand galaxy evolution.
If current events on Earth have you looking to Mars, perhaps you’d be interested in checking out Planet Four and Planet Four: Terrains —both of which task users with searching and categorizing landscape formations on Mars’ southern hemisphere. You’ll scroll through images of the Martian surface looking for terrain types informally called “spiders,” “baby spiders,” “channel networks” and “swiss cheese.”
Gravitational waves are telltale ripples in spacetime, but they are notoriously difficult to measure. With Gravity Spy , citizen scientists sift through data from Laser Interferometer Gravitational-Wave Observatory, or LIGO , detectors. When lasers beamed down 2.5-mile-long “arms” at these facilities in Livingston, Louisiana and Hanford, Washington are interrupted, a gravitational wave is detected. But the detectors are sensitive to “glitches” that, in models, look similar to the astrophysical signals scientists are looking for. Gravity Spy teaches citizen scientists how to identify fakes so researchers can get a better view of the real deal. This work will, in turn, train computer algorithms to do the same.
Similarly, the project Supernova Hunters needs volunteers to clear out the “bogus detections of supernovae,” allowing researchers to track the progression of actual supernovae. In Hubble Space Telescope images, you can search for asteroid tails with Hubble Asteroid Hunter . And with Planet Hunters TESS , which teaches users to identify planetary formations, you just “might be the first person to discover a planet around a nearby star in the Milky Way,” according to the project description.
Help astronomers refine prediction models for solar storms, which kick up dust that impacts spacecraft orbiting the sun, with Solar Stormwatch II. Thanks to the first iteration of the project, astronomers were able to publish seven papers with their findings.
With Mapping Historic Skies , identify constellations on gorgeous celestial maps of the sky covering a span of 600 years from the Adler Planetarium collection in Chicago. Similarly, help fill in the gaps of historic astronomy with Astronomy Rewind , a project that aims to “make a holistic map of images of the sky.”
Get the latest Science stories in your inbox.
/https://tf-cmsv2-smithsonianmag-media.s3.amazonaws.com/accounts/headshot/rachael.png "basic science research project")
Rachael Lallensack | READ MORE
Rachael Lallensack is the former assistant web editor for science and innovation at Smithsonian .
- Grades 6-12
- School Leaders
Enter Today's Teacher Appreciation Giveaway!
72 Easy Science Experiments Using Materials You Already Have On Hand
Because science doesn’t have to be complicated.

If there is one thing that is guaranteed to get your students excited, it’s a good science experiment! While some experiments require expensive lab equipment or dangerous chemicals, there are plenty of cool projects you can do with regular household items. We’ve rounded up a big collection of easy science experiments that anybody can try, and kids are going to love them!
Easy Chemistry Science Experiments
Easy physics science experiments, easy biology and environmental science experiments, easy engineering experiments and stem challenges.

1. Taste the Rainbow
Teach your students about diffusion while creating a beautiful and tasty rainbow! Tip: Have extra Skittles on hand so your class can eat a few!
Learn more: Skittles Diffusion

2. Crystallize sweet treats
Crystal science experiments teach kids about supersaturated solutions. This one is easy to do at home, and the results are absolutely delicious!
Learn more: Candy Crystals
3. Make a volcano erupt
This classic experiment demonstrates a chemical reaction between baking soda (sodium bicarbonate) and vinegar (acetic acid), which produces carbon dioxide gas, water, and sodium acetate.
Learn more: Best Volcano Experiments
4. Make elephant toothpaste
This fun project uses yeast and a hydrogen peroxide solution to create overflowing “elephant toothpaste.” Tip: Add an extra fun layer by having kids create toothpaste wrappers for plastic bottles.

5. Blow the biggest bubbles you can
Add a few simple ingredients to dish soap solution to create the largest bubbles you’ve ever seen! Kids learn about surface tension as they engineer these bubble-blowing wands.
Learn more: Giant Soap Bubbles

6. Demonstrate the “magic” leakproof bag
All you need is a zip-top plastic bag, sharp pencils, and water to blow your kids’ minds. Once they’re suitably impressed, teach them how the “trick” works by explaining the chemistry of polymers.
Learn more: Leakproof Bag

7. Use apple slices to learn about oxidation
Have students make predictions about what will happen to apple slices when immersed in different liquids, then put those predictions to the test. Have them record their observations.
Learn more: Apple Oxidation
8. Float a marker man
Their eyes will pop out of their heads when you “levitate” a stick figure right off the table! This experiment works due to the insolubility of dry-erase marker ink in water, combined with the lighter density of the ink.
Learn more: Floating Marker Man

9. Discover density with hot and cold water
There are a lot of easy science experiments you can do with density. This one is extremely simple, involving only hot and cold water and food coloring, but the visuals make it appealing and fun.
Learn more: Layered Water

10. Layer more liquids
This density demo is a little more complicated, but the effects are spectacular. Slowly layer liquids like honey, dish soap, water, and rubbing alcohol in a glass. Kids will be amazed when the liquids float one on top of the other like magic (except it is really science).
Learn more: Layered Liquids

11. Grow a carbon sugar snake
Easy science experiments can still have impressive results! This eye-popping chemical reaction demonstration only requires simple supplies like sugar, baking soda, and sand.
Learn more: Carbon Sugar Snake
12. Mix up some slime
Tell kids you’re going to make slime at home, and watch their eyes light up! There are a variety of ways to make slime, so try a few different recipes to find the one you like best.

13. Make homemade bouncy balls
These homemade bouncy balls are easy to make since all you need is glue, food coloring, borax powder, cornstarch, and warm water. You’ll want to store them inside a container like a plastic egg because they will flatten out over time.
Learn more: Make Your Own Bouncy Balls

14. Create eggshell chalk
Eggshells contain calcium, the same material that makes chalk. Grind them up and mix them with flour, water, and food coloring to make your very own sidewalk chalk.
Learn more: Eggshell Chalk

15. Make naked eggs
This is so cool! Use vinegar to dissolve the calcium carbonate in an eggshell to discover the membrane underneath that holds the egg together. Then, use the “naked” egg for another easy science experiment that demonstrates osmosis .
Learn more: Naked Egg Experiment
16. Turn milk into plastic
This sounds a lot more complicated than it is, but don’t be afraid to give it a try. Use simple kitchen supplies to create plastic polymers from plain old milk. Sculpt them into cool shapes when you’re done!

17. Test pH using cabbage
Teach kids about acids and bases without needing pH test strips! Simply boil some red cabbage and use the resulting water to test various substances—acids turn red and bases turn green.
Learn more: Cabbage pH

18. Clean some old coins
Use common household items to make old oxidized coins clean and shiny again in this simple chemistry experiment. Ask kids to predict (hypothesize) which will work best, then expand the learning by doing some research to explain the results.
Learn more: Cleaning Coins

19. Pull an egg into a bottle
This classic easy science experiment never fails to delight. Use the power of air pressure to suck a hard-boiled egg into a jar, no hands required.
Learn more: Egg in a Bottle
20. Blow up a balloon (without blowing)
Chances are good you probably did easy science experiments like this when you were in school. The baking soda and vinegar balloon experiment demonstrates the reactions between acids and bases when you fill a bottle with vinegar and a balloon with baking soda.
21 Assemble a DIY lava lamp
This 1970s trend is back—as an easy science experiment! This activity combines acid-base reactions with density for a totally groovy result.

22. Explore how sugary drinks affect teeth
The calcium content of eggshells makes them a great stand-in for teeth. Use eggs to explore how soda and juice can stain teeth and wear down the enamel. Expand your learning by trying different toothpaste-and-toothbrush combinations to see how effective they are.
Learn more: Sugar and Teeth Experiment
23. Mummify a hot dog
If your kids are fascinated by the Egyptians, they’ll love learning to mummify a hot dog! No need for canopic jars , just grab some baking soda and get started.
24. Extinguish flames with carbon dioxide
This is a fiery twist on acid-base experiments. Light a candle and talk about what fire needs in order to survive. Then, create an acid-base reaction and “pour” the carbon dioxide to extinguish the flame. The CO2 gas acts like a liquid, suffocating the fire.

25. Send secret messages with invisible ink
Turn your kids into secret agents! Write messages with a paintbrush dipped in lemon juice, then hold the paper over a heat source and watch the invisible become visible as oxidation goes to work.
Learn more: Invisible Ink
26. Create dancing popcorn
This is a fun version of the classic baking soda and vinegar experiment, perfect for the younger crowd. The bubbly mixture causes popcorn to dance around in the water.

27. Shoot a soda geyser sky-high
You’ve always wondered if this really works, so it’s time to find out for yourself! Kids will marvel at the chemical reaction that sends diet soda shooting high in the air when Mentos are added.
Learn more: Soda Explosion

28. Send a teabag flying
Hot air rises, and this experiment can prove it! You’ll want to supervise kids with fire, of course. For more safety, try this one outside.
Learn more: Flying Tea Bags

29. Create magic milk
This fun and easy science experiment demonstrates principles related to surface tension, molecular interactions, and fluid dynamics.
Learn more: Magic Milk Experiment

30. Watch the water rise
Learn about Charles’s Law with this simple experiment. As the candle burns, using up oxygen and heating the air in the glass, the water rises as if by magic.
Learn more: Rising Water

31. Learn about capillary action
Kids will be amazed as they watch the colored water move from glass to glass, and you’ll love the easy and inexpensive setup. Gather some water, paper towels, and food coloring to teach the scientific magic of capillary action.
Learn more: Capillary Action

32. Give a balloon a beard
Equally educational and fun, this experiment will teach kids about static electricity using everyday materials. Kids will undoubtedly get a kick out of creating beards on their balloon person!
Learn more: Static Electricity

33. Find your way with a DIY compass
Here’s an old classic that never fails to impress. Magnetize a needle, float it on the water’s surface, and it will always point north.
Learn more: DIY Compass
34. Crush a can using air pressure
Sure, it’s easy to crush a soda can with your bare hands, but what if you could do it without touching it at all? That’s the power of air pressure!

35. Tell time using the sun
While people use clocks or even phones to tell time today, there was a time when a sundial was the best means to do that. Kids will certainly get a kick out of creating their own sundials using everyday materials like cardboard and pencils.
Learn more: Make Your Own Sundial
36. Launch a balloon rocket
Grab balloons, string, straws, and tape, and launch rockets to learn about the laws of motion.

37. Make sparks with steel wool
All you need is steel wool and a 9-volt battery to perform this science demo that’s bound to make their eyes light up! Kids learn about chain reactions, chemical changes, and more.
Learn more: Steel Wool Electricity
38. Levitate a Ping-Pong ball
Kids will get a kick out of this experiment, which is really all about Bernoulli’s principle. You only need plastic bottles, bendy straws, and Ping-Pong balls to make the science magic happen.

39. Whip up a tornado in a bottle
There are plenty of versions of this classic experiment out there, but we love this one because it sparkles! Kids learn about a vortex and what it takes to create one.
Learn more: Tornado in a Bottle

40. Monitor air pressure with a DIY barometer
This simple but effective DIY science project teaches kids about air pressure and meteorology. They’ll have fun tracking and predicting the weather with their very own barometer.
Learn more: DIY Barometer

41. Peer through an ice magnifying glass
Students will certainly get a thrill out of seeing how an everyday object like a piece of ice can be used as a magnifying glass. Be sure to use purified or distilled water since tap water will have impurities in it that will cause distortion.
Learn more: Ice Magnifying Glass

42. String up some sticky ice
Can you lift an ice cube using just a piece of string? This quick experiment teaches you how. Use a little salt to melt the ice and then refreeze the ice with the string attached.
Learn more: Sticky Ice

43. “Flip” a drawing with water
Light refraction causes some really cool effects, and there are multiple easy science experiments you can do with it. This one uses refraction to “flip” a drawing; you can also try the famous “disappearing penny” trick .
Learn more: Light Refraction With Water
44. Color some flowers
We love how simple this project is to re-create since all you’ll need are some white carnations, food coloring, glasses, and water. The end result is just so beautiful!

45. Use glitter to fight germs
Everyone knows that glitter is just like germs—it gets everywhere and is so hard to get rid of! Use that to your advantage and show kids how soap fights glitter and germs.
Learn more: Glitter Germs

46. Re-create the water cycle in a bag
You can do so many easy science experiments with a simple zip-top bag. Fill one partway with water and set it on a sunny windowsill to see how the water evaporates up and eventually “rains” down.
Learn more: Water Cycle

47. Learn about plant transpiration
Your backyard is a terrific place for easy science experiments. Grab a plastic bag and rubber band to learn how plants get rid of excess water they don’t need, a process known as transpiration.
Learn more: Plant Transpiration

48. Clean up an oil spill
Before conducting this experiment, teach your students about engineers who solve environmental problems like oil spills. Then, have your students use provided materials to clean the oil spill from their oceans.
Learn more: Oil Spill

49. Construct a pair of model lungs
Kids get a better understanding of the respiratory system when they build model lungs using a plastic water bottle and some balloons. You can modify the experiment to demonstrate the effects of smoking too.
Learn more: Model Lungs

50. Experiment with limestone rocks
Kids love to collect rocks, and there are plenty of easy science experiments you can do with them. In this one, pour vinegar over a rock to see if it bubbles. If it does, you’ve found limestone!
Learn more: Limestone Experiments

51. Turn a bottle into a rain gauge
All you need is a plastic bottle, a ruler, and a permanent marker to make your own rain gauge. Monitor your measurements and see how they stack up against meteorology reports in your area.
Learn more: DIY Rain Gauge

52. Build up towel mountains
This clever demonstration helps kids understand how some landforms are created. Use layers of towels to represent rock layers and boxes for continents. Then pu-u-u-sh and see what happens!
Learn more: Towel Mountains

53. Take a play dough core sample
Learn about the layers of the earth by building them out of Play-Doh, then take a core sample with a straw. ( Love Play-Doh? Get more learning ideas here. )
Learn more: Play Dough Core Sampling

54. Project the stars on your ceiling
Use the video lesson in the link below to learn why stars are only visible at night. Then create a DIY star projector to explore the concept hands-on.
Learn more: DIY Star Projector

55. Make it rain
Use shaving cream and food coloring to simulate clouds and rain. This is an easy science experiment little ones will beg to do over and over.
Learn more: Shaving Cream Rain
56. Blow up your fingerprint
This is such a cool (and easy!) way to look at fingerprint patterns. Inflate a balloon a bit, use some ink to put a fingerprint on it, then blow it up big to see your fingerprint in detail.

57. Snack on a DNA model
Twizzlers, gumdrops, and a few toothpicks are all you need to make this super-fun (and yummy!) DNA model.
Learn more: Edible DNA Model
58. Dissect a flower
Take a nature walk and find a flower or two. Then bring them home and take them apart to discover all the different parts of flowers.

59. Craft smartphone speakers
No Bluetooth speaker? No problem! Put together your own from paper cups and toilet paper tubes.
Learn more: Smartphone Speakers

60. Race a balloon-powered car
Kids will be amazed when they learn they can put together this awesome racer using cardboard and bottle-cap wheels. The balloon-powered “engine” is so much fun too.
Learn more: Balloon-Powered Car

61. Build a Ferris wheel
You’ve probably ridden on a Ferris wheel, but can you build one? Stock up on wood craft sticks and find out! Play around with different designs to see which one works best.
Learn more: Craft Stick Ferris Wheel
62. Design a phone stand
There are lots of ways to craft a DIY phone stand, which makes this a perfect creative-thinking STEM challenge.
63. Conduct an egg drop
Put all their engineering skills to the test with an egg drop! Challenge kids to build a container from stuff they find around the house that will protect an egg from a long fall (this is especially fun to do from upper-story windows).
Learn more: Egg Drop Challenge Ideas

64. Engineer a drinking-straw roller coaster
STEM challenges are always a hit with kids. We love this one, which only requires basic supplies like drinking straws.
Learn more: Straw Roller Coaster

65. Build a solar oven
Explore the power of the sun when you build your own solar ovens and use them to cook some yummy treats. This experiment takes a little more time and effort, but the results are always impressive. The link below has complete instructions.
Learn more: Solar Oven

66. Build a Da Vinci bridge
There are plenty of bridge-building experiments out there, but this one is unique. It’s inspired by Leonardo da Vinci’s 500-year-old self-supporting wooden bridge. Learn how to build it at the link, and expand your learning by exploring more about Da Vinci himself.
Learn more: Da Vinci Bridge
67. Step through an index card
This is one easy science experiment that never fails to astonish. With carefully placed scissor cuts on an index card, you can make a loop large enough to fit a (small) human body through! Kids will be wowed as they learn about surface area.

68. Stand on a pile of paper cups
Combine physics and engineering and challenge kids to create a paper cup structure that can support their weight. This is a cool project for aspiring architects.
Learn more: Paper Cup Stack

69. Test out parachutes
Gather a variety of materials (try tissues, handkerchiefs, plastic bags, etc.) and see which ones make the best parachutes. You can also find out how they’re affected by windy days or find out which ones work in the rain.
Learn more: Parachute Drop

70. Recycle newspapers into an engineering challenge
It’s amazing how a stack of newspapers can spark such creative engineering. Challenge kids to build a tower, support a book, or even build a chair using only newspaper and tape!
Learn more: Newspaper STEM Challenge

71. Use rubber bands to sound out acoustics
Explore the ways that sound waves are affected by what’s around them using a simple rubber band “guitar.” (Kids absolutely love playing with these!)
Learn more: Rubber Band Guitar

72. Assemble a better umbrella
Challenge students to engineer the best possible umbrella from various household supplies. Encourage them to plan, draw blueprints, and test their creations using the scientific method.
Learn more: Umbrella STEM Challenge
Plus, sign up for our newsletters to get all the latest learning ideas straight to your inbox.

You Might Also Like

Magic Milk Experiment: How-To Plus Free Worksheet
This classic experiment teaches kids about basic chemistry and physics. Continue Reading
Copyright © 2024. All rights reserved. 5335 Gate Parkway, Jacksonville, FL 32256
- Privacy Policy
Home » Basic Research – Types, Methods and Examples
Basic Research – Types, Methods and Examples
Table of Contents

Basic Research
Definition:
Basic Research, also known as Fundamental or Pure Research , is scientific research that aims to increase knowledge and understanding about the natural world without necessarily having any practical or immediate applications. It is driven by curiosity and the desire to explore new frontiers of knowledge rather than by the need to solve a specific problem or to develop a new product.
Types of Basic Research
Types of Basic Research are as follows:
Experimental Research
This type of research involves manipulating one or more variables to observe their effect on a particular phenomenon. It aims to test hypotheses and establish cause-and-effect relationships.
Observational Research
This type of research involves observing and documenting natural phenomena without manipulating any variables. It aims to describe and understand the behavior of the observed system.
Theoretical Research
This type of research involves developing and testing theories and models to explain natural phenomena. It aims to provide a framework for understanding and predicting observations and experiments.
Descriptive Research
This type of research involves describing and cataloging natural phenomena without attempting to explain or understand them. It aims to provide a comprehensive and accurate picture of the observed system.
Comparative Research
This type of research involves comparing different systems or phenomena to identify similarities and differences. It aims to understand the underlying principles that govern different natural phenomena.
Historical Research
This type of research involves studying past events, developments, and discoveries to understand how science has evolved over time. It aims to provide insights into the factors that have influenced scientific progress and the role of basic research in shaping our understanding of the world.
Data Collection Methods
Some common data collection methods used in basic research include:
- Observation : This involves watching and recording natural phenomena in a systematic and structured way. Observations can be made in a laboratory setting or in the field and can be qualitative or quantitative.
- Surveys and questionnaires: These are tools for collecting data from a large number of individuals about their attitudes, beliefs, behaviors, and experiences. Surveys and questionnaires can be administered in person, by mail, or online.
- Interviews : Interviews involve asking questions to a person or a group of people to gather information about their experiences, opinions, and perspectives. Interviews can be structured, semi-structured, or unstructured.
- Experiments : Experiments involve manipulating one or more variables and observing their effect on a particular phenomenon. Experiments can be conducted in a laboratory or in the field and can be controlled or naturalistic.
- Case studies : Case studies involve in-depth analysis of a particular individual, group, or phenomenon. Case studies can provide rich and detailed information about complex phenomena.
- Archival research : Archival research involves analyzing existing data, documents, and records to answer research questions. Archival research can be used to study historical events, trends, and developments.
- Simulation : Simulation involves creating a computer model of a particular phenomenon to study its behavior and predict its future outcomes. Simulation can be used to study complex systems that are difficult to study in the real world.
Data Analysis Methods
Some common data analysis methods used in basic research include:
- Descriptive statistics: This involves summarizing and describing data using measures such as mean, median, mode, and standard deviation. Descriptive statistics provide a simple and easy way to understand the basic properties of the data.
- Inferential statistics : This involves making inferences about a population based on data collected from a sample. Inferential statistics can be used to test hypotheses, estimate parameters, and quantify uncertainty.
- Qualitative analysis : This involves analyzing data that are not numerical in nature, such as text, images, or audio recordings. Qualitative analysis can involve coding, categorizing, and interpreting data to identify themes, patterns, and relationships.
- Content analysis: This involves analyzing the content of text, images, or audio recordings to identify specific words, phrases, or themes. Content analysis can be used to study communication, media, and discourse.
- Multivariate analysis: This involves analyzing data that have multiple variables or factors. Multivariate analysis can be used to identify patterns and relationships among variables, cluster similar observations, and reduce the dimensionality of the data.
- Network analysis: This involves analyzing the structure and dynamics of networks, such as social networks, communication networks, or ecological networks. Network analysis can be used to study the relationships and interactions among individuals, groups, or entities.
- Machine learning : This involves using algorithms and models to analyze and make predictions based on data. Machine learning can be used to identify patterns, classify observations, and make predictions based on complex data sets.
Basic Research Methodology
Basic research methodology refers to the approach, techniques, and procedures used to conduct basic research. The following are some common steps involved in basic research methodology:
- Formulating research questions or hypotheses : This involves identifying the research problem and formulating specific questions or hypotheses that can guide the research.
- Reviewing the literature: This involves reviewing and synthesizing existing research on the topic of interest to identify gaps, controversies, and areas for further investigation.
- Designing the study: This involves designing a study that is appropriate for the research question or hypothesis. The study design can involve experiments, observations, surveys, case studies, or other methods.
- Collecting data: This involves collecting data using appropriate methods and instruments, such as observation, surveys, experiments, or interviews.
- Analyzing data: This involves analyzing the collected data using appropriate methods, such as descriptive or inferential statistics, qualitative analysis, or content analysis.
- Interpreting results : This involves interpreting the results of the data analysis in light of the research question or hypothesis and the existing literature.
- Drawing conclusions: This involves drawing conclusions based on the interpretation of the results and assessing their implications for the research question or hypothesis.
- Communicating findings : This involves communicating the research findings in the form of research reports, journal articles, conference presentations, or other forms of dissemination.
Applications of Basic Research
Some applications of basic research include:
- Medical breakthroughs : Basic research in fields such as biology, chemistry, and physics has led to important medical breakthroughs, including the discovery of antibiotics, vaccines, and new drugs.
- Technology advancements: Basic research in fields such as computer science, physics, and engineering has led to advancements in technology, such as the development of the internet, smartphones, and other electronic devices.
- Environmental solutions: Basic research in fields such as ecology, geology, and meteorology has led to the development of solutions to environmental problems, such as climate change, air pollution, and water contamination.
- Economic growth: Basic research can stimulate economic growth by creating new industries and markets based on scientific discoveries and technological advancements.
- National security: Basic research in fields such as physics, chemistry, and biology has led to the development of new technologies for national security, including encryption, radar, and stealth technology.
Examples of Basic Research
Here are some examples of basic research:
- Astronomy : Astronomers conduct basic research to understand the fundamental principles that govern the universe, such as the laws of gravity, the behavior of stars and galaxies, and the origins of the universe.
- Genetics : Geneticists conduct basic research to understand the genetic basis of various traits, diseases, and disorders. This research can lead to the development of new treatments and therapies for genetic diseases.
- Physics : Physicists conduct basic research to understand the fundamental principles of matter and energy, such as quantum mechanics, particle physics, and cosmology. This research can lead to new technologies and advancements in fields such as medicine and engineering.
- Neuroscience: Neuroscientists conduct basic research to understand the structure and function of the brain, including how it processes information and controls behavior. This research can lead to new treatments and therapies for neurological disorders and brain injuries.
- Mathematics : Mathematicians conduct basic research to develop and explore new mathematical theories, such as number theory, topology, and geometry. This research can lead to new applications in fields such as computer science, physics, and engineering.
- Chemistry : Chemists conduct basic research to understand the fundamental properties of matter and how it interacts with other substances. This research can lead to the development of new materials, drugs, and technologies.
Purpose of Basic Research
The purpose of basic research, also known as fundamental or pure research, is to expand knowledge in a particular field or discipline without any specific practical application in mind. The primary goal of basic research is to advance our understanding of the natural world and to uncover fundamental principles and relationships that underlie complex phenomena.
Basic research is often exploratory in nature, with researchers seeking to answer fundamental questions about how the world works. The research may involve conducting experiments, collecting and analyzing data, or developing new theories and hypotheses. Basic research often requires a high degree of creativity, innovation, and intellectual curiosity, as well as a willingness to take risks and pursue unconventional lines of inquiry.
Although basic research is not conducted with a specific practical outcome in mind, it can lead to significant practical applications in various fields. Many of the major scientific discoveries and technological advancements of the past century have been rooted in basic research, from the discovery of antibiotics to the development of the internet.
In summary, the purpose of basic research is to expand knowledge and understanding in a particular field or discipline, with the goal of uncovering fundamental principles and relationships that can help us better understand the natural world. While the practical applications of basic research may not always be immediately apparent, it has led to significant scientific and technological advancements that have benefited society in numerous ways.
When to use Basic Research
Basic research is generally conducted when scientists and researchers are seeking to expand knowledge and understanding in a particular field or discipline. It is particularly useful when there are gaps in our understanding of fundamental principles and relationships that underlie complex phenomena. Here are some situations where basic research might be particularly useful:
- Exploring new fields: Basic research can be particularly valuable when researchers are exploring new fields or areas of inquiry where little is known. By conducting basic research, scientists can establish a foundation of knowledge that can be built upon in future studies.
- Testing new theories: Basic research can be useful when researchers are testing new theories or hypotheses that have not been tested before. This can help scientists to gain a better understanding of how the world works and to identify areas where further research is needed.
- Developing new technologies : Basic research can be important for developing new technologies and innovations. By conducting basic research, scientists can uncover new materials, properties, and relationships that can be used to develop new products or technologies.
- Investigating complex phenomena : Basic research can be particularly valuable when investigating complex phenomena that are not yet well understood. By conducting basic research, scientists can gain a better understanding of the underlying principles and relationships that govern complex systems.
- Advancing scientific knowledge: Basic research is important for advancing scientific knowledge in general. By conducting basic research, scientists can uncover new principles and relationships that can be applied across multiple fields of study.
Characteristics of Basic Research
Here are some of the main characteristics of basic research:
- Focus on fundamental knowledge : Basic research is focused on expanding our understanding of the natural world and uncovering fundamental principles and relationships that underlie complex phenomena. The primary goal of basic research is to advance knowledge without any specific practical application in mind.
- Exploratory in nature: Basic research is often exploratory in nature, with researchers seeking to answer fundamental questions about how the world works. The research may involve conducting experiments, collecting and analyzing data, or developing new theories and hypotheses.
- Long-term focus: Basic research is often focused on long-term outcomes rather than immediate practical applications. The insights and discoveries generated by basic research may take years or even decades to translate into practical applications.
- High degree of creativity and innovation : Basic research often requires a high degree of creativity, innovation, and intellectual curiosity. Researchers must be willing to take risks and pursue unconventional lines of inquiry.
- Emphasis on scientific rigor: Basic research is conducted using the scientific method, which emphasizes the importance of rigorous experimental design, data collection and analysis, and peer review.
- Interdisciplinary: Basic research is often interdisciplinary, drawing on multiple fields of study to address complex research questions. Basic research can be conducted in fields ranging from physics and chemistry to biology and psychology.
- Open-ended : Basic research is open-ended, meaning that it does not have a specific end goal in mind. Researchers may follow unexpected paths or uncover new lines of inquiry that they had not anticipated.
Advantages of Basic Research
Here are some of the main advantages of basic research:
- Advancing scientific knowledge: Basic research is essential for expanding our understanding of the natural world and uncovering fundamental principles and relationships that underlie complex phenomena. This knowledge can be applied across multiple fields of study and can lead to significant scientific and technological advancements.
- Fostering innovation: Basic research often requires a high degree of creativity, innovation, and intellectual curiosity. By encouraging scientists to pursue unconventional lines of inquiry and take risks, basic research can lead to breakthrough discoveries and innovations.
- Stimulating economic growth : Basic research can lead to the development of new technologies and products that can stimulate economic growth and create new industries. Many of the major scientific and technological advancements of the past century have been rooted in basic research.
- Improving health and well-being: Basic research can lead to the development of new drugs, therapies, and medical treatments that can improve health and well-being. For example, many of the major advances in medical science, such as the development of antibiotics and vaccines, were rooted in basic research.
- Training the next generation of scientists : Basic research is essential for training the next generation of scientists and researchers. By providing opportunities for young scientists to engage in research and gain hands-on experience, basic research helps to develop the skills and expertise needed to advance scientific knowledge in the future.
- Encouraging interdisciplinary collaboration : Basic research often requires collaboration between scientists from different fields of study. By fostering interdisciplinary collaboration, basic research can lead to new insights and discoveries that would not be possible through single-discipline research alone.
Limitations of Basic Research
Here are some of the main limitations of basic research:
- Lack of immediate practical applications : Basic research is often focused on long-term outcomes rather than immediate practical applications. The insights and discoveries generated by basic research may take years or even decades to translate into practical applications.
- High cost and time requirements: Basic research can be expensive and time-consuming, as it often requires sophisticated equipment, specialized facilities, and large research teams. Funding for basic research can be limited, making it difficult to sustain long-term projects.
- Ethical concerns : Basic research may involve working with animal models or human subjects, raising ethical concerns around the use of animals or the safety and well-being of human participants.
- Uncertainty around outcomes: Basic research is often open-ended, meaning that it does not have a specific end goal in mind. This uncertainty can make it difficult to justify funding for basic research, as it is difficult to predict what outcomes the research will produce.
- Difficulty in communicating results : Basic research can produce complex and technical findings that may be difficult to communicate to the general public or policymakers. This can make it challenging to generate public support for basic research or to translate basic research findings into policy or practical applications.
About the author

Muhammad Hassan
Researcher, Academic Writer, Web developer
You may also like

Questionnaire – Definition, Types, and Examples

Case Study – Methods, Examples and Guide

Observational Research – Methods and Guide

Quantitative Research – Methods, Types and...

Explanatory Research – Types, Methods, Guide

Survey Research – Types, Methods, Examples
S. N. Bose National Centre for Basic Sciences
Under department of science and technology, govt. of india.
- New Web Mail
- Old Web Mail
Theoretical, observational and experimental research on Astrophysics, Cosmology, High Energy Physics, and Quantum Information.
Bio-molecular and active matter, mass aggregation, frustrated magnets, topological phases, entanglement, superposition principle, nonlocality, mesoscopic system.
Kinetics, structure and dynamics of biologically important molecules and properties of artificial macromolecules.
Behaviour of materials at various lengthscales as a function of various parameters.
Collaborations
- Find out more about the collaborations at SNBNCBS
The S. N. Bose National Centre for Basic Sciences is an autonomous research institute engaged in research in basic sciences. The institute was founded under Department of Science and Technology, Government of India in 1986 as a Registered Society. The Centre was established to honour the life and work of Professor S. N. Bose who was a colossal in theoretical physics and has made some of the most fundamental conceptual contributions in the development of Quantum Mechanics and Quantum Statistics. The Centre has emerged as a major institution for research and development in Basic Sciences.
At a glance
Lectures, seminars & colloquia, upcoming events.

Recent Past Events

[08-11 January, 2024]

News & Achievements
- Mr. Sourav Sarkar, Senior Research Fellow from the group of Prof. Kalyan Mandal has received the 'Best Oral Presentation' award in "ICN 2024: International Conference on Nano Structured Materials and Nanocomposites", organized by Mahatma Gandhi University, Kerala, during May 10-12, 2024.
- Dr. Saquib Shamim, Assistant Professor of the Centre has been inducted into the Early Career Researcher Advisory Board of the Physical Review B journal. Congratulations to Dr. Shamim.
- Mr. Sourav Sarkar, Senior Research Fellow, from the group of Prof. Kalyan Mandal has received an award 'Wiley sponsored Best Presentation in Interdisciplinary Field' in the International Conference on Sustainable Nanomaterials Integration & Organization for Energy and Environment (iSNIOE2) hosted by Shiv Nadar Institution of Eminence, Delhi-NCR, India".
- Mr. Dibyendu Maity, Senior Research Fellow from the group of Dr. Suman Chakrabarty, has won the Best Poster Award in the international conference, MD@60 hosted at Jawaharlal Nehru Centre for Advanced Scientific Research (JNCASR), Bangalore during 26th-29th February, jointly organized by CECAM and JNCACR. Congratulations to Mr. Maity .
- Prof. Samir Kumar Pal, Senior Professor of the Centre has been elected as a Fellow of the West Bengal Academy of Science & Technology (WAST). Congratulations to Prof. Pal.
- Dr. Shubhasis Haldar, Associate Professor of the Centre has become a member of the International Union of Pure & Applied Biophysics (IUPAB). Congratulations! to Dr. Haldar
- Dr. Ritamay Bhunia, Research Associate from the group of Dr. Avijit Chowdhury, has been awarded a poster presentation prize for the work entitled 'Nanoparticles Based Ferroelectric Polarization Triggered Piezo-Iondynamic Gated Artificial Tactile Sensory Synaptic Device for Long-Term Perception' at the International Conference on Optoelectronic and Bio Inspired Nanomaterials (ICOBIN 2023), held at Indian Institute of Technology Roorkee during 4-6 December, 2023.
- Ms. Saheli Samanta, Research Fellow from the group of Prof. Kalyan Mandal, has received "MRSI Young Scientist" award for oral presentation on the work "Exploring Low-Cost Material Design for Solid-State Cooling with Significant Reversible Magnetoresponsive Properties across First-Order Phase Transition" at "Young Scientist Colloquium 2023" of Material Research Society of India (MRSI), held at Jadavpur University on 1st December 2023.
- Prof. Kalyan Mandal, Senior Professor of the Centre has won the "Magnetism as Art Showcase-2023" award in Intermag-2023 held during May 15-19, 2023 in Sendai, Japan organised by IEEE Magnetic Society.
- Ms. Swarnali Hait, Research Fellow from the group of Prof. Kalyan Mandal has received a silver award with an honorarium of 250 USD as a gesture of appreciation for serving as a project mentor for the MagnetiSiM 2023 Hall sensors competition organised by the Students in Magnetism Group by the IEEE Magnetics Society.
- Mr. Sourav Sarkar, Research Fellow from the group of Prof. Kalyan Mandal has received the Best Poster Award in the international conference "ICMAGMA 2023", held at Ramoji Film City, Hyderabad, during December 4–6, 2023.
- Mr. Shubham Purwar from the group of Dr. Thirupathaiah Setti has been awarded the "Best Poster Presentation" Prize on his work “Investigation of the Anomalous and Topological Hall effect in the Layered Monoclinic Ferromagnet Cr2.76Te4” at the Annual Conference on Quantum Condensed Matter (QMAT-2023) held in NISER Bhubaneswar during 27-30 November, 2023.
- Prof. Ranjit Biswas, Senior Professor of the Centre has been elected as a Fellow of the National Academy of Sciences, India (NASI).Congratulations to Prof. Biswas
- Dr. Shubhasis Haldar, Associate Professor of the Centre has been elected as INSA ASSOCIATE FELLOWS 2023.Congratulations to Dr. Haldar for his work in understanding chaperone biology using single molecule tools. Using covalent magnetic tweezers Dr Haldar’s group has examined how chaperones mechanically influence the cellular energetics and respond to mechanical force.
- Dr. Tapas Baug, Assistant Professor in Department of Astrophysics and High Energy Physics of S. N. Bose National Centre for Basic Sciences has been recognized for his 'Outstanding contribution as a Reviewer for Journal of Astrophysics and Astronomy, Indian Academy of Sciences, in the year 2022'.
- Mr. Ardhendu Pal, a PhD student from the group of Professor Manik Pradhan has received the "Best Oral Presentation Award" for his work Cavity Ring-down Spectroscopy in the P. C. Ray Memorial International Conference on “Contemporary Ideas, Innovations & Initiatives in Chemical Sciences” held at Presidency University, Kolkata during 23-24 August, 2023.
- Dr. Barnali Ghosh (Saha), Scientist F of the Centre has received "International Distinguished Scientist Award" for the Research & Academic excellence in " Condensed Matter Physics and Material Science" by ASIA RESEARCH AWARDS at the Asia's Science Technology Awards Congress (ASTRA) 2023 on 1st July, 2023.
- Professor Anjan Barman, Senior Professor of the Department of Condensed Matter and Materials Physics of the S. N. Bose National Centre for Basic Sciences has been awarded the prestigious 'Royal Society Wolfson Visiting Fellowship' by The Royal Society, UK. Many congratulations to Professor Barman for this major achievement.
- Prof. Tanusri Saha-Dasgupta, Director of the Centre has joined the Executive Editorial Board of JPhys Materials, IOP Science. Heartiest Congratulation to the Director Madam.
- Dr. Barnali Ghosh (Saha), Scientist-F of the Centre has received the Best Paper award for the invited lecture presentation in the 'International Conference on Recent Trends in Materials Science & Devices 2023 (ICRTMD-2023)'.
- A pattern-recognition based method has been developed from the group of Prof. Manik Pradhan in the Centre for non-invasive diagnosis and classification of various gastric conditions. The new method exploits cluster analysis of breathomics dataset generated from the patented "Pyro-Breath" technology developed in the group.
- Mr. Ardhendu Pal, a PhD student from the group of Prof. Manik Pradhan has received the "Best Poster Award" for his work Cavity Ring-down Spectroscopy in the Indo-UK workshop: Photonics in Healthcare, Atmosphere, Safety and Education (PHASE-2023) held at IIT Gandhinagar on 30th March, 2023.
Announcements
A discussion meeting involving the young scientists (DST Inspire, Ramanujan Fellowship, Ramalingaswami Re-entry Fellowship etc.), both theoretical and experimental of the Centre. The purpose of the meeting is active networking of the younger scientists with experienced faculty members towards development of active collaboration.
Result of the interview : Admission to Academic Programmes - 2023-24
- Result of the interview : Mid-term Admission Programme 2023-24
Result of the interview : SNBNCBS-IISER (K) Joint PhD Programme - 2023-24
- List of candidates selected for admission for SNBNCBS-IISER (K) Joint PhD Programm :2023-24
- Waiting list for PhD. admission (AY 2023-24) will be uploaded, if required, with effect from 7/7/2023
- Amendment: Those who did their MSc in 2020 will be eligible to apply for the PhD programme ONLY IF they have qualified for CSIR/UGC-NET (JRF).
- Interview call letter is available. Login to download.
Upcoming Conference
- Exploring Quantum and Thermal fluctuations in Frustrated Magnets at Low Temperature
- Two-days Discussion Meeting: Stochastic and Nonlinear Dynamics in Chemistry and Biology(SNDCB-2024) : Registration is extended up to 20th Dec'2023
- 2dMAT : A Discussion Meeting on 2D Materials | YouTube Link
- BoseStat@100: Centenary of Bose Statistics
- Time-dependent phenomena in soft and active matter (TPSAM2024)
- Admission Programme 2024-25
Summer Research Programme - 2024
- List of selected candidates
List of shortlisted candidates
- List of shortlisted candidates for appearing in the Skill cum Aptitude Test for the position of ‘Driver’
COVID Awareness
- COVIDAwareness
No active tender found.
- List of Shortlisted Candidates for Attendant (EWS Category) for appearing in the Skill cum Aptitude Test
- List of selected candidate for the position of Driver
No openings.
- [Jul 03] Project Officer
- [Jul 03] Project Scientist - D
- [Jul 03] Project Scientist - C
- [Jul 03] Project Assistant
- [Jul 03] Project Student(s)
Read Our Recent Publications
- Solvation Plays a Key Role in Antioxidant-Mediated Attenuation of Elevated Creatinine Level: An In Vitro Spectroscopic Investigation J. Phys. Chem. B 2023, 127, 40, 8576–8585
- A new alloy developed can act as alternative magnetic refrigerant for minimizing greenhouse gas emissions Phys. Rev. Materials 7, 084406
- Dithiophenedione-Based Covalent Organic Frameworks for Supercapacitive Energy Storage ACS Appl. Energy Mater. 2023, 6, 18, 9256–9263
- A Thiazole-linked Covalent Organic Framework for Lithium-Sulphur Batteries
- Thermal and magnetic properties of Cu4O (SeO3) 3 composed by ferrimagnetic O2Cu6 units of edge-sharing OCu4 tetrahedra Journal of Alloys and Compounds,956, 170346 Journal of Alloys and Compounds,956, 170346
- Measurement incompatibility and quantum advantage in communication Physical Review A, 107 (6), 062210
- A disparity in solvatochromism of CO and SO vibrational probe: A study of structurally similar acetone and dimethyl sulfoxide Journal of Molecular Liquids, 382, 122005
- Distilling nonlocality in quantum correlations Physical Review Letters , 130 (22), 220201
Research Highlights by DST Media Cell

The molecular mechanism behind the effectiveness of N-Acetyl-L-cysteine (NAC) and vitamin C, a medical combination used by doctors to treat kidney ailments, has been cracked in research conducted by a team of scientists. This study will help clinically treat chronic kidney ailments more effectively and help pharmaceutical research to develop better medicines.

Researchers have found a new alloy that can act as an effective magnetic refrigerant that can be an alternative cooling agent for minimizing greenhouse gas emissions and meet the global demand for higher energy efficiency for tackling global warming.

Scientists have synthesized a class of porous and crystalline organic materials called covalent organic frameworks (COFs) incorporated with quinone groups and sulphur-containing thiophene groups that can act as efficient and versatile electrodes for pseudocapacitors because of their low density, high stability, and well-defined atomic arrangements.

An inorganic material called Hafnium oxide (HfO2), so far used in optical coatings, may soon find use as efficient memory devices in computers, sensors and sonars as an effective alternative to silicon dioxide (SiO2).

A newly synthesized crystalline, chemically stable material, belonging to the class of crystalline porous organic polymers with permanent porosity and highly ordered structures, could enhance energy density of found to be ideal as a cathode for Li-S batteries and make them more efficient.

A research team under the leadership of Prof. Tanusri Saha Dasgupta at the S.N. Bose National Centre for Basic Sciences, an autonomous institution of the Department of Science and Technology (DST) focused their computational research on 2-D quantum materials, which are materials with confined geometry in one of the directions. 2-D materials are important as they are easier to assimilate in devices.

Scientists have explored novel quantum effects on the radiation emitted from a black hole due to atoms freely falling into it. This investigation of atoms falling into a black hole could throw new light on the efforts of scientists towards unification of quantum mechanics which plays out at the smallest scales of matter and the general theory of relatively propounded by Einstein which is applicable at the largest cosmological scales.The two most successful scientific theories of the past century are the general theory of relativity and quantum theory. Quantum theory describes the microscopic behaviour of fundamental particles whereas the general theory of relativity accurately describes the motion of objects or particles around a massive object which is the exact mathematical description of the theory of gravitation at the classical level.

A newly developed non-invasive method of recognising breath patterns can help rapid, one-step diagnosis and classification of various gastric disorders like dyspepsia, gastritis, and gastroesophageal reflux disease (GERD). Currently, peptic ulcer disease is an important medical-social problem that has received special attention all over the world. Helicobacter pylori bacterial infection is considered to be the most significant risk factor for the development of this disease. Patients with peptic ulcer encircling both duodenal and gastric ulcer may remain asymptomatic or symptomatic, and due to undefined risk factors along with lack of specific symptoms at the early stages, the diagnosis is often delayed, leading to poor prognosis and high rates of recurrence of the diseases.

Scientists have found the theoretical rationale of the mathematical structure of composite quantum systems consisting of more than one subsystem. Quantum Mechanics, the theory that describes physical phenomena in microscopic world, was developed in the early 20th century to explain experimental observations like Black-body radiation curve, Photoelectric effect when German physicist Max Planck demonstrated through physical experiments that energy, in certain situations, can exhibit characteristics of physical matter. Later scientists like Albert Einstein, Niels Bohr, Louis de Broglie, Erwin Schrodinger, and Paul M. Dirac advanced Plank’s theory to quantum mechanics–the most accurate mathematical theory of the microscopic world
Series of talks on Illustrious Indian Scientists in Pre-independence Era
Documentary (Trailer Video) film on Illustrious Indian Scientists in Pre-independence Era
Important Links
- Research publications
- Research publication status
- Research highlights
- Annual reports
- Magazine - Sutra
- Prof. S. N. Bose Archive
- Outreach Program
- Swachhata Pakhwada
- SNBNCBS: A JOURNEY TOWARDS EXCELLENCE
- Screen Reader Access
An official website of the United States government
Here's how you know
Official websites use .gov A .gov website belongs to an official government organization in the United States.
Secure .gov websites use HTTPS. A lock ( Lock Locked padlock ) or https:// means you've safely connected to the .gov website. Share sensitive information only on official, secure websites.
Alert: Due to extended maintenance, NSF.gov will be unavailable from 11:00 PM on 5/31 to 2:00 AM on 6/1. Most other NSF systems, including Research.gov, will be unavailable from 11:00 PM on 5/31 to 1:00 PM on 6/1. We apologize for any inconvenience.
Funding at NSF
- Getting Started
- Search for Funding
- Search Funded Projects (Awards)
- For Early-Career Researchers
- For Postdoctoral Researchers
- For Graduate Students
- For Undergraduates
- For Entrepreneurs
- For Industry
- NSF Initiatives
- Proposal Budget
- Senior/Key Personnel Documents
- Data Management and Sharing Plan
- Research Involving Live Vertebrate Animals
- Research Involving Human Subjects
- Submitting Your Proposal
- How We Make Funding Decisions
- Search Award Abstracts
- NSF by the Numbers
- Honorary Awards
- FAQ Related to PAPPG
- NSF Policy Office
- Safe and Inclusive Work Environments
- Research Security
- Research.gov
The U.S. National Science Foundation offers hundreds of funding opportunities — including grants, cooperative agreements and fellowships — that support research and education across science and engineering.
Learn how to apply for NSF funding by visiting the links below.
Finding the right funding opportunity
Learn about NSF's funding priorities and how to find a funding opportunity that's right for you.
Preparing your proposal
Learn about the pieces that make up a proposal and how to prepare a proposal for NSF.
Submitting your proposal
Learn how to submit a proposal to NSF using one of our online systems.
How we make funding decisions
Learn about NSF's merit review process, which ensures the proposals NSF receives are reviewed in a fair, competitive, transparent and in-depth manner.
NSF 101 answers common questions asked by those interested in applying for NSF funding.
Research approaches we encourage
Learn about interdisciplinary research, convergence research and transdisciplinary research.
Newest funding opportunities
Hispanic serving institutions: equitable transformation in stem education, national stem teacher corps pilot program, planning proposals for large-scale projects in computer and information science and engineering (cise) in eligible epscor jurisdictions, announcement of topic for the fiscal year 2025 and 2026 epscor research improvement infrastructure-focused epscor collaborations (rii-fec) program.
Research Projects
Reu site: beyond basic science – connecting climate to communities.
This 10-week research experience for undergraduates (REU) with 6 students and 2 educators will introduce participants to transdisciplinary science being done at the Earth Institute (EI). Participants will work through the scientific process to better understand the latest climate change research, gather and analyze data, and communicate findings for relevant stakeholders. Undergraduate students and teachers will work alongside professional scientists in a rigorous research setting supplemented by professional development opportunities. Our theme of participatory action and practice oriented climate change research will be emphasized across all projects. Participants will work with mentors to apply basic science methods to inform social, economic, and environmental decisions and policies around how to adapt to or mitigate the impact of changing climate on these systems from local to global scales. All projects will reflect the strategies, practices, and tools that scientists across the EI employ and how they leverage their science to co-create and translate climate research into accessible knowledge and solutions for stakeholders through a community-based approach. Ultimately, the experience will encourage participants to better understand the context, connections, and perspectives of climate change in a way that directly connects the science and the field to people and communities. INTELLECTUAL MERIT: Faculty-mentored undergraduate research experiences are foundational to encourage the participation of students, particularly those from underrepresented groups (i.e. Latino or Hispanic, African-Americans, American Indians, and Alaskan Natives), in Science, Technology, Engineering, and Mathematics (STEM) fields. The Beyond Basic Science REU will provide participants with transdisciplinary research experiences alongside mentors focused on leading-edge climate science and policy, with an emphasis on participatory action research. The overall project is grounded in high impact educational practices that will generate knowledge and practices that promote enculturation into research and create meaningful experiences for undergraduate students and educators, which will increase their engagement with research as well as their persistence to learning and working in this area. BROADER IMPACTS: The Beyond Basic Science REU site will provide opportunities for undergraduate students and educators in transdisciplinary research rooted in climate science and participatory action. The activities proposed in this project are strategically aligned with NSF’s goals of broader impacts and supports a diverse group of participants in immersive research experiences. The project framework supports participants to engage in team learning around a meaningful project, participate in professional development activities beyond direct research, and build learning and professional relationships through layered mentoring in a world-renowned research environment. The pool of students targeted by this program (i.e. community colleges and state schools) are substantially more likely to be first generation college students and to identify as underrepresented minorities in STEM. The project will likewise produce a cohort of scientists and educators trained in participatory research approaches to science that integrate basic research methods with meaningful stakeholder participation. Our REU site has an opportunity to demonstrate that research programs grounded in evidence-based practices that provide strong educational and professional infrastructures for learners have an important role to play in bringing diversity into our research communities and promoting inclusive excellence.
FUNDED AMOUNT:
Related projects, keyword: underrepresentation.
Undergraduate Research Program to Promote Diversity in EHS
NASA Open Science Funding Opportunities
NASA offers a number of opportunities in the Research Opportunities for Space and Earth Science (ROSES) for support of Open Science projects. Explore the list below of those that are currently open and ones that have been previously offered. Proposers should always consult NSPIRES for the most accurate and up-to-date information on NASA proposals. Questions about Open Science funding opportunities can be directed to [email protected].
F.14 High Priority Open-Source Science (HPOSS)
HPOSS supports new work to advance and streamline the open sharing of scientific information.
- Proposals for the development of new technology to increase the accessibility, inclusivity, or reproducibility of SMD research. This includes open source tools, software, frameworks, data formats, or libraries that will have a significant impact to the SMD science community.
- Proposals for the development of capacity building materials to support the adoption of open science practices. This includes curricula, tutorials, or other training materials that will be appropriate for one or more science disciplines supported by SMD.
- Awards of ~$100k support work for one year.
- Submit proposals for ROSES-24 at any point during the year, and they will be reviewed on a rolling basis.
- The ROSES-24 solicitation will be available through March 28, 2025, at which point the ROSES-25 solicitation will become available.
- Summaries of previously selected proposals are available under "Selections" on the HPOSS NSPIRES pages for ROSES-22 and ROSES-23 .
- Watch recording of HPOSS informational webinar and access the presentation slides .
F.8 Supplements for Open-Source Science (SOSS)
SOSS supports the addition of an open science component to an existing "parent" ROSES award.
- This could include making the results of the parent award more accessible, inclusive, and usable, or contributing back to relevant open science communities. This could also include cloud credits (through Amazon Web Services - AWS) to support activities from the parent award.
- ~$10K for cloud credits
- ~$50k otherwise
- Proposer must have an existing research proposal selected for funding by SMD with at least 15 months remaining in its period of performance at the time of the submission to SOSS.
- Submit proposals for ROSES-23 at any point during the year, and they will be reviewed on a rolling basis.
- The ROSES-23 solicitation will be available through March 29, 2024, at which point the ROSES-24 solicitation will become available.
Topical Workshops, Symposia, and Conferences (TWSC)
TWSC supports events including hackathons, un-conferences, and challenges that build open science skills.
- Rolling deadline.
- Events focused on Science Mission Directorate data, software, or open science practices
- Hackathons, un-conferences, and challenges that build open science skills
- Focused training in open science practices and principles
- Events MUST be openly available and allow for inclusive participation
- Potential proposers must confirm relevancy and availability of funds with a SMD program officer before preparing or submitting a proposal. TWSC has no dedicated funding, so proposers are directed to first contact a NASA division, office, or program that may have funding before preparing a proposal. See section 4.2.1 of the NOFO for information to include in an inquiry email and section 7.0 for contact information for Open Science TWSC inquiries.
F.7 Support for Open Source Tools, Frameworks, and Libraries (OSTFL)
Supports the improvement and sustainment of existing high-value, open-source tools, frameworks, and libraries that have significantly impacted the SMD science community.
- Foundational awards: cooperative agreements for up to five years for open-source tools, frameworks, and libraries that have a significant impact on two or more divisions of the SMD and
- Sustainment awards: grants or cooperative agreements of up to three years in duration for open-source tools, frameworks, and libraries that have significant impact in one or more divisions of the SMD.
- Notices of intent are requested by May 3, 2024, and proposals are due June 7, 2024.
- For previous examples of awards, see the 8 awards initially selected from the ROSES20 solicitation.
- A town hall on the ROSES24 F.7 OSTFL solicitation was held on April 2. Please review the slides and video recording .
F.14 Transform to Open Science Training (TOPS-T)
TOPS-T supports the development of discipline-specific open science curriculum and capacity building efforts for open science training.
- Not solicited in ROSES-24.
- $6.5M awarded over 3 years based on ROSES-22 solicitation. Read the news release and summaries of selected proposals .
F.19 Multidomain Reusable Artificial Intelligence Tools (MRAIT)
Solicits proposals that would enable critically needed machine learning tools to advance both Heliophysics and Earth Science research.
- Read summaries of selected proposals from the ROSES-22 solicitation
9 Undergraduate Research Projects That Wowed Us This Year
The telegraph. The polio vaccine. The bar code. Light beer. Throughout its history, NYU has been known for innovation, with faculty and alumni in every generation contributing to some of the most notable inventions and scientific breakthroughs of their time. But you don’t wind up in the history books—or peer-reviewed journals—by accident; academic research, like any specialized discipline, takes hard work and lots of practice.
And at NYU, for students who are interested, that training can start early—including during an undergraduate's first years on campus. Whether through assistantships in faculty labs, summer internships, senior capstones, or independent projects inspired by coursework, undergrad students have many opportunities to take what they’re learning in the classroom and apply it to create original scholarship throughout their time at NYU. Many present their work at research conferences, and some even co-author work with faculty and graduate students that leads to publication.
As 2023-2024 drew to a close, the NYU News team coordinated with the Office of the Provost to pull together a snapshot of the research efforts that students undertook during this school year. The nine featured here represent just a small fraction of the impressive work we encountered in fields ranging from biology, chemistry, and engineering to the social sciences, humanities, and the arts.
These projects were presented at NYU research conferences for undergrads, including Migration and Im/Mobility , Pathways for Discovery: Undergraduate Research and Writing Symposium , Social Impact: NYU’s Applied Undergraduate Research Conference , Arts-Based Undergraduate Research Conference , Gallatin Student Research Conference , Dreammaker’s Summit , Tandon’s Research Excellence Exhibit , and Global Engagement Symposium . Learn more about these undergrad research opportunities and others.
Jordan Janowski (CAS '24)
Sade Chaffatt (NYU Abu Dhabi '24)
Elsa Nyongesa (GPH, CAS ’24 )
Anthony Offiah (Gallatin ’26)
Kimberly Sinchi (Tandon ’24) and Sarah Moughal (Tandon ’25)
Rohan Bajaj (Stern '24)
Lizette Saucedo (Liberal Studies ’24)
Eva Fuentes (CAS '24)
Andrea Durham (Tandon ’26)
Jordan Janowski (CAS ’24) Major: Biochemistry Thesis title: “Engineering Chirality for Functionality in Crystalline DNA”
Jordan Janowski (CAS '24). Photo by Tracey Friedman
I work in the Structural DNA Nanotechnology Lab, which was founded by the late NYU professor Ned Seeman, who is known as the father of the field. My current projects are manipulating DNA sequences to self-assemble into high order structures.
Essentially, we’re using DNA as a building material, instead of just analyzing it for its biological functions. It constantly amazes me that this is possible.
I came in as a pre-med student, but when I started working in the lab I realized that I was really interested in continuing my research there. I co-wrote a paper with postdoc Dr. Simon Vecchioni who has been a mentor to me and helped me navigate applying to grad school. I’m headed to Scripps Research in the fall. This research experience has led me to explore some of the molecules that make up life and how they could be engineered into truly unnatural curiosities and technologies.
My PI, Prof. Yoel Ohayon , has been super supportive of my place on the NYU women’s basketball team, which I’m a member of. He’s been coming to my games since sophomore year, and he’ll text me with the score and “great game!”— it’s been so nice to have that support for my interests beyond the lab.
Anthony Offiah (Gallatin ’26) Concentration: Fashion design and business administration MLK Scholars research project title: “project: DREAMER”
Anthony Offiah (Gallatin '26). Photo by Tracey Friedman
In “project: DREAMER,” I explored how much a person’s sense of fashion is a result of their environment or societal pressures based on their identity. Certain groups are pressured or engineered to present a certain way, and I wanted to see how much of the opposing force—their character, their personality—affected their sense of style.
This was a summer research project through the MLK Scholars Program . I did ethnographic interviews with a few people, and asked them to co-design their ideal garments with me. They told me who they are, how they identify, and what they like in fashion, and we synthesized that into their dream garments. And then we had a photo shoot where they were empowered to make artistic choices.
Some people told me they had a hard time conveying their sense of style because they were apprehensive about being the center of attention or of being dissimilar to the people around them. So they chose to conform to protect themselves. And then others spoke about wanting to safeguard the artistic or vulnerable—or one person used the word “feminine”—side of them so they consciously didn’t dress how they ideally would.
We ended the interviews by stating an objective about how this co-designing process didn’t end with them just getting new clothes—it was about approaching fashion differently than how they started and unlearning how society might put them in a certain box without their approval.
My concentration in Gallatin is fashion design and business administration. In the industry some clothing is critiqued and some clothing is praised—and navigating that is challenging, because what you like might not be well received. So doing bespoke fashion for just one person is freeing in a sense because you don’t have to worry about all that extra stuff. It’s just the art. And I like being an artist first and thinking about the business second.
Lizette Saucedo (Global Liberal Studies ’24) Major: Politics, rights, and development Thesis title: “Acknowledging and Remembering Deceased Migrants Crossing the U.S.-Mexican Border”
Lizette Saucedo (Global Liberal Studies '24). Photo by Tracey Friedman
My thesis project is on commemorating migrants who are dying on their journey north to cross the U.S.–Mexican border. I look at it through different theoretical lenses, and one of the terms is necropolitics—how politics shapes the way the State governs life and especially death. And then of the main issues aside from the deaths is that a lot of people in the U.S. don’t know about them, due to the government trying to eschew responsibility for migrant suffering. In the final portion of the thesis, I argue for presenting what some researchers call “migrant artifacts”—the personal belongings left behind by people trying to cross over—to the public, so that people can become aware and have more of a human understanding of what’s going on.
This is my senior thesis for Liberal Studies, but the idea for it started in an International Human Rights course I took with professor Joyce Apsel . We read a book by Jason De León called The Land of the Open Graves , which I kept in the back of my mind. And then when I studied abroad in Germany during my junior year, I noticed all the different memorials and museums, and wondered why we didn’t have the equivalent in the U.S. My family comes from Mexico—my parents migrated—and ultimately all of these interests came together.
I came into NYU through the Liberal Studies program and I loved it. It’s transdisciplinary, which shaped how I view my studies. My major is politics, rights, and development and my minor is social work, but I’ve also studied museum studies, and I’ve always loved the arts. The experience of getting to work one-on-one on this thesis has really fortified my belief that I can combine all those things.
Sade Chaffatt (Abu Dhabi ’24) Major: Biology Thesis title: “The Polycomb repressive component, EED in mouse hepatocytes regulates liver homeostasis and survival following partial hepatectomy.”
Sade Chaffatt (NYU Abu Dhabi '24). Photo courtesy of NYUAD
Imagine your liver as a room. Within the liver there are epigenetic mechanisms that control gene expression. Imagine these epigenetic mechanisms as a dimmer switch, so that you could adjust the light in the room. If we remove a protein that is involved in regulating these mechanisms, there might be dysregulation—as though the light is too bright or too dim. One such protein, EED, plays a crucial role in regulating gene expression. And so my project focuses on investigating whether EED is required in mouse hepatocytes to regulate liver homeostasis and to regulate survival following surgical resection.
Stepping into the field of research is very intimidating when you’re an undergraduate student and know nothing. But my capstone mentor, Dr. Kirsten Sadler , encourages students to present their data at lab meetings and to speak with scientists. Even though this is nerve-wracking, it helps to promote your confidence in communicating science to others in the field.
If you’d asked 16-year-old me, I never would’ve imagined that I’d be doing research at this point. Representation matters a lot, and you often don't see women—especially not Black women—in research. Being at NYUAD has really allowed me to see more women in these spaces. Having had some experience in the medical field through internships, I can now say I’m more interested in research and hope to pursue a PhD in the future.
Kimberly Sinchi (Tandon ’24) Major: Computer Science Sarah Moughal (Tandon ’25) Major: Computer Science Project: Robotic Design Team's TITAN
Sarah Moughal (Tandon '25, left) and Kimberly Sinchi (Tandon '24). Photo by Tracey Friedman
Kimberly: The Robotic Design Team has been active at NYU for at least five years. We’re 60-plus undergrad and grad students majoring in electrical engineering, mechanical engineering, computer science, and integrated design. We’ve named our current project TITAN because of how huge it is. TITAN stands for “Tandon’s innovation in terraforming and autonomous navigation.”
Sarah: We compete in NASA’s lunatics competition every year, which means we build a robot from scratch to be able to compete in lunar excavation and construction. We make pretty much everything in house in the Tandon MakerSpace, and everyone gets a little experience with machining, even if you're not mechanical. A lot of it is about learning how to work with other people—communicating across majors and disciplines and learning how to explain our needs to someone who may not be as well versed in particular technologies as we are.
Kimberly: With NYU’s Vertically Integrated Project I’ve been able to take what I was interested in and actually have a real world impact with it. NASA takes notes on every Rover that enters this competition. What worked and what didn’t actually influences their designs for rovers they send to the moon and to Mars.
Eva Fuentes (CAS ’24) Major: Anthropology Thesis title: “Examining the relationship between pelvic shape and numbers of lumbar vertebrae in primates”
Eva Fuentes (CAS '24). Photo by Tracey Friedman
I came into NYU thinking I wanted to be an art history major with maybe an archeology minor. To do the archeology minor, you have to take the core classes in anthropology, and so I had to take an intro to human evolution course. I was like, this is the coolest thing I’ve learned—ever. So I emailed people in the department to see if I could get involved.
Since my sophomore year, I’ve been working in the Evolutionary Morphology Lab with Scott Williams, who is primarily interested in the vertebral column of primates in the fossil record because of how it can inform the evolution of posture and locomotion in humans.
For my senior thesis, I’m looking at the number of lumbar vertebrae—the vertebrae that are in the lower back specifically—and aspects of pelvic shape to see if it is possible to make inferences about the number of lumbar vertebrae a fossil may have had. The bones of the lower back are important because they tell us about posture and locomotion.
I committed to a PhD program at Washington University in St. Louis a few weeks ago to study biological anthropology. I never anticipated being super immersed in the academic world. I don’t come from an academic family. I had no idea what I was doing when I started, but Scott Williams, and everyone in the lab, is extremely welcoming and easy to talk to. It wasn't intimidating to come into this lab at all.
Elsa Nyongesa (GPH, CAS ’24 ) Major: Global Public Health and Biology Project: “Diversity in Breast Oncological Studies: Impacts on Black Women’s Health Outcomes”
Elsa Nyongesa (GPH, CAS '24). Photo by Tracey Friedman
I interned at Weill Cornell Medicine through their Travelers Summer Research Fellowship Program where I worked with my mentor, Dr. Lisa Newman, who is the head of the International Center for the Study of Breast Cancer Subtypes. I analyzed data on the frequency of different types of breast cancer across racial and ethnic groups in New York. At the same time, I was also working with Dr. Rachel Kowolsky to study minority underrepresentation in clinical research.
In an experiential learning course taught by Professor Joyce Moon Howard in the GPH department, I created a research question based on my internship experience. I thought about how I could combine my experiences from the program which led to my exploration of the correlation between minority underrepresentation in breast oncological studies, and how it affects the health outcomes of Black women with breast cancer.
In my major, we learn about the large scope of health disparities across different groups. This opportunity allowed me to learn more about these disparities in the context of breast cancer research. As a premedical student, this experience broadened my perspective on health. I learned more about the social, economic, and environmental factors influencing health outcomes. It also encouraged me to examine literature more critically to find gaps in knowledge and to think about potential solutions to health problems. Overall, this experience deepened my philosophy of service, emphasizing the importance of health equity and advocacy at the research and clinical level.
Rohan Bajaj (Stern ’24) Major: Finance and statistics Thesis title: “Measuring Socioeconomic Changes and Investor Attitude in Chicago’s Post-Covid Economic Recovery”
Rohan Bajaj (Stern '24). Photo by Tracey Friedman
My thesis is focused on understanding the effects of community-proposed infrastructure on both the socioeconomic demographics of cities and on fiscal health. I’m originally from Chicago, so it made a lot of sense to pay tribute back to the place that raised me. I’m compiling a list of characteristics of infrastructure that has been developed since 2021 as a part of the Chicago Recovery Plan and then assessing how neighborhoods have changed geographically and economically.
I’m looking at municipal bond yields in Chicago as a way of evaluating the fiscal health of the city. Turns out a lot of community-proposed infrastructure is focused in lower income areas within Chicago rather than higher income areas. So that makes the research question interesting, to see if there’s a correlation between the proposed and developed infrastructure projects, and if these neighborhoods are being gentrified alongside development.
I kind of stumbled into the impact investing industry accidentally from an internship I had during my time at NYU. I started working at a renewable energies brokerage in midtown, where my main job was collecting a lot of market research trends and delivering insights on how these different energy markets would come into play. I then worked with the New York State Insurance Fund, where I helped construct and execute their sustainable investment strategy from the ground up.
I also took a class called “Design with Climate Change” with Peter Anker in Gallatin during my junior year, and a lot of that class was focused on how to have climate resilient and publicly developed infrastructure, and understanding the effects it has on society. It made me start thinking about the vital role that physical surroundings play in steering communities.
In the short term I want to continue diving into impact-focused investing and help identify urban planners and city government to develop their communities responsibly and effectively.
Andrea Durham (Tandon, ’26) Major: Biomolecular science Research essay title: “The Rise and Fall of Aduhelm”
Andrea Durham (Tandon '26). Photo by Tracey Friedman
This is an essay I wrote last year in an advanced college essay writing class with Professor Lorraine Doran on the approval of a drug for Alzheimer’s disease called Aduhelm—a monoclonal antibody therapy developed by Biogen in 2021, which was described as being momentous and groundbreaking. But there were irregularities ranging from the design of its clinical trials to government involvement that led to the resignation of three scientists on an advisory panel, because not everybody in the scientific community agreed that it should be approved.
When I was six years old, my grandmother was diagnosed. Seeing the impact that it had over the years broke my heart and ignited a passion in me to pursue research.
When I started at NYU, I wasn’t really sure what I was going to do in the future, or what opportunities I would go after. This writing class really gave me an opportunity to reflect on the things that were important to me in my life. The September after I wrote this paper, I started volunteering in a lab at Mount Sinai for Alzheimer's disease research, and that’s what I’m doing now—working as a volunteer at the Center for Molecular Integrative Neuroresilience under Dr. Giulio Pasinetti. I have this opportunity to be at the forefront, and because of the work I did in my writing class I feel prepared going into these settings with an understanding of the importance of conducting ethical research and working with integrity.

- · Basic Research in Science & Engineering
- · Humanities & Social Sciences
- · National Strategic R&D Programs
- · Academic Research
- · International Cooperation
- · Research Achievements
- · Latest News Releases
- · Message from the President
- · Mission & Vision
- · Organization
- · Facts & Figures
- · Funding Process
- · International Partners
- · Visit the NRF
- Programs · Basic Research in Science & Engineering · Humanities & Social Sciences · National Strategic R&D Programs · Academic Research · International Cooperation
- News & Notices · News · Notices
- Achievements · Research Achievements · Latest News Releases · Awards
- About the NRF · Message from the President · History · Mission & Vision · Organization · Budget · Facts & Figures · Funding Process · International Partners · Visit the NRF
- Q&A/FAQ · Q&A · FAQ

Welcome to the NRF
NRF strives to create new value and pave the way for a bright and prosperous future.
are creating new values and opening a bright and prosperous future.
- Basic Research in Science & Engineering The Directorate for Basic Research in Science & Engineering is committed to supporting the efforts of S&E researchers who, through their creativity, seek to uncover the fundamental knowledge and original technologies which can contribute to the betterment of society and promote progress for all of humankind. LEARN MORE » LEARN MORE
- Humanities & Social Sciences The Directorate for the Humanities & Social Sciences is committed to supporting researchers in these fields with their mission to explore the intricacies of human nature and social phenomena, and offer discourse and theories to answer the questions they pose. LEARN MORE » LEARN MORE
- National Strategic R&D Programs The Directorate for National Strategic R&D Programs is committed to supporting the development of original technology to solve national and social problems and strategic research efforts for big science. LEARN MORE » LEARN MORE
- Academic Research The Directorate for Academic Research & University Funding is committed to facilitating educational and academic activities, both at universities and within the research community, as well as enhancing the educational capabilities of our nation’s universities through cooperative industry-university initiatives and fostering human capital. LEARN MORE » LEARN MORE
- International Cooperation The Directorate for International Affairs is actively committed to solving problems faced by the international community and supporting the activities of researchers in order to further global cooperation. LEARN MORE » LEARN MORE
- [Call for Proposal] Korea-China Key Joint Research Program 2023 [Call for Proposal] Korea-China Key Joint Research Program 2023 The National Research Foundation of Korea(NRF), upon the agreement withNational Natural Science Foundation of China(NSFC), announces the call for the “Key Joint Research Program 2023”. July 19th, 2023 LEE Kwang Bok President National Research Foundation of Korea ※ This is an english translation for foreign researchers affiliated to Korean universities/institute. ※ The Korean version can be found at the URL below. https://www.nrf.re.kr/biz/info/notice/view?menu_no=378&page=&nts_no=201479&biz_no=213&target=&biz_not_gubn=guide&search_type=NTS_TITLE&search_keyword1= ※ Attached: ① Call for Proposal ② form LEARN MORE »
- [Call for Proposal] 2023 Korea-Brazil Joint Research Project call f... MSIT Call No.2023-0672 2023 Korea-Brazil Joint Research Project call for proposal The Ministry of Science and ICT will contest the following new project for the 2023 Korea-Brazil Joint Research Project to strengthen science and technology competitiveness through international cooperation between Korea and Brazil, so please apply. June 29, 2023 Minister of Science and ICT National Research Foundation of Korea Brazil side Call : https://www.gov.br/cnpq/pt-br/assuntos/noticias/cnpq-em-acao/cooperacao-brasil-e-coreia-abre-oportunidade-de-apoio-a-projetos-e-bolsas LEARN MORE »
- International Partners go to the page
- NRF Budget go to the page
- Visit the NRF go to the page
201 GAJEONG-RO, YUSEONG-GU, DAEJEON 34113 KOREA / TEL.82-42-869-6114 / FAX.82-42-869-6777
25 HEOLLEUNG-RO, SEOCHO-GU, SEOUL 06792 KOREA / TEL.82-2-3460-5500 / FAX.82-2-3460-5759
Copyright (c) 2019 NRF. All rights reserved.


- Human Genome Project Information
- Genomic Science Program
Human Genome Project Information Archive 1990–2003
Archive Site Provided for Historical Purposes
Human Genome Project
C ompleted in 2003, the Human Genome Project (HGP) was a 13-year project coordinated by the U.S. Department of Energy (DOE) and the National Institutes of Health. During the early years of the HGP, the Wellcome Trust (U.K.) became a major partner; additional contributions came from Japan, France, Germany, China, and others. Project goals were to
- identify all the approximately 20,500 genes in human DNA,
- determine the sequences of the 3 billion chemical base pairs that make up human DNA,
- store this information in databases,
- improve tools for data analysis,
- transfer related technologies to the private sector, and
- address the ethical, legal, and social issues (ELSI) that may arise from the project.
Though the HGP is finished, analyses of the data will continue for many years.

Explore the Project's History
Starting points include
- Human Genome News : This 13-year publication facilitated HGP communication, helped prevent duplication of research effort, and informed persons interested in genome research.
- Timeline : This research tool chronicles major events in the HGP and related follow-on projects.
- Publications archive : Library of HGP program reports, research abstracts, research goals, and other historical documents.
- Research archive : Archive of HGP research by topic including goals, abstracts, and reports.

Impacts of the HGP
" If we want to make the best products, we also have to invest in the best ideas. Every dollar we invested to map the human genome returned $140 to the economy—every dollar ." —President Barack Obama, 2013 State of the Union address.
- Spin-Off projects enabled by the success of the Human Genome Project

How DOE is building on the legacy of the HGP
Since 2001, the DOE Genomic Science Program has been using microbial and plant genomic data, high-throughput analytical technologies, and modeling and simulation to develop a predictive understanding of biological systems behavior relevant to solutions for energy and environmental challenges including bioenergy production, environmental remediation, and climate stabilization.
About This Site
During the Human Genome Project, this website served as the primary electronic information source for HGP researchers and the public. It is now a unique archive—a repository for historical documents detailing the history of the HGP from the project's beginnings in 1989 until it was completed in 2003.
Human Genome Project 1990–2003
The Human Genome Project (HGP) was an international 13-year effort, 1990 to 2003. Primary goals were to discover the complete set of human genes and make them accessible for further biological study, and determine the complete sequence of DNA bases in the human genome. See Timeline for more HGP history.

Human Genome News
Published from 1989 until 2002, this newsletter facilitated HGP communication, helped prevent duplication of research effort, and informed persons interested in genome research.
Citation and Credit
Unless otherwise noted, publications and webpages on this site were created for the U.S. Department of Energy program and are in the public domain. Permission to use these documents is not needed, but credit the U.S. Department of Energy and provide the URL http://www.ornl.gov/hgmis when using them. Materials provided by third parties are identified as such and not available for free use.
Contact the Webmaster About this Site Disclaimer Last modified: Tuesday, April 23, 2019
Archive Site Provided for Historical Purposes Only
U.S. Department of Energy Office of Science , Office of Biological and Environmental Research
Search the Site
Loading metrics
Open Access
Peer-reviewed
Meta-Research Article
Meta-Research Articles feature data-driven examinations of the methods, reporting, verification, and evaluation of scientific research.
See Journal Information »
Assessing the evolution of research topics in a biological field using plant science as an example
Roles Conceptualization, Data curation, Formal analysis, Funding acquisition, Investigation, Methodology, Project administration, Resources, Software, Supervision, Validation, Visualization, Writing – original draft, Writing – review & editing
* E-mail: [email protected]
Affiliations Department of Plant Biology, Michigan State University, East Lansing, Michigan, United States of America, Department of Computational Mathematics, Science, and Engineering, Michigan State University, East Lansing, Michigan, United States of America, DOE-Great Lake Bioenergy Research Center, Michigan State University, East Lansing, Michigan, United States of America
Roles Conceptualization, Investigation, Project administration, Supervision, Writing – review & editing
Affiliation Department of Plant Biology, Michigan State University, East Lansing, Michigan, United States of America
- Shin-Han Shiu,
- Melissa D. Lehti-Shiu
- Published: May 23, 2024
- https://doi.org/10.1371/journal.pbio.3002612
- Peer Review
- Reader Comments
Scientific advances due to conceptual or technological innovations can be revealed by examining how research topics have evolved. But such topical evolution is difficult to uncover and quantify because of the large body of literature and the need for expert knowledge in a wide range of areas in a field. Using plant biology as an example, we used machine learning and language models to classify plant science citations into topics representing interconnected, evolving subfields. The changes in prevalence of topical records over the last 50 years reflect shifts in major research trends and recent radiation of new topics, as well as turnover of model species and vastly different plant science research trajectories among countries. Our approaches readily summarize the topical diversity and evolution of a scientific field with hundreds of thousands of relevant papers, and they can be applied broadly to other fields.
Citation: Shiu S-H, Lehti-Shiu MD (2024) Assessing the evolution of research topics in a biological field using plant science as an example. PLoS Biol 22(5): e3002612. https://doi.org/10.1371/journal.pbio.3002612
Academic Editor: Ulrich Dirnagl, Charite Universitatsmedizin Berlin, GERMANY
Received: October 16, 2023; Accepted: April 4, 2024; Published: May 23, 2024
Copyright: © 2024 Shiu, Lehti-Shiu. This is an open access article distributed under the terms of the Creative Commons Attribution License , which permits unrestricted use, distribution, and reproduction in any medium, provided the original author and source are credited.
Data Availability: The plant science corpus data are available through Zenodo ( https://zenodo.org/records/10022686 ). The codes for the entire project are available through GitHub ( https://github.com/ShiuLab/plant_sci_hist ) and Zenodo ( https://doi.org/10.5281/zenodo.10894387 ).
Funding: This work was supported by the National Science Foundation (IOS-2107215 and MCB-2210431 to MDL and SHS; DGE-1828149 and IOS-2218206 to SHS), Department of Energy grant Great Lakes Bioenergy Research Center (DE-SC0018409 to SHS). The funders had no role in study design, data collection and analysis, decision to publish, or preparation of the manuscript.
Competing interests: The authors have declared that no competing interests exist.
Abbreviations: BERT, Bidirectional Encoder Representations from Transformers; br, brassinosteroid; ccTLD, country code Top Level Domain; c-Tf-Idf, class-based Tf-Idf; ChatGPT, Chat Generative Pretrained Transformer; ga, gibberellic acid; LOWESS, locally weighted scatterplot smoothing; MeSH, Medical Subject Heading; SHAP, SHapley Additive exPlanations; SJR, SCImago Journal Rank; Tf-Idf, Term frequency-Inverse document frequency; UMAP, Uniform Manifold Approximation and Projection
Introduction
The explosive growth of scientific data in recent years has been accompanied by a rapidly increasing volume of literature. These records represent a major component of our scientific knowledge and embody the history of conceptual and technological advances in various fields over time. Our ability to wade through these records is important for identifying relevant literature for specific topics, a crucial practice of any scientific pursuit [ 1 ]. Classifying the large body of literature into topics can provide a useful means to identify relevant literature. In addition, these topics offer an opportunity to assess how scientific fields have evolved and when major shifts in took place. However, such classification is challenging because the relevant articles in any topic or domain can number in the tens or hundreds of thousands, and the literature is in the form of natural language, which takes substantial effort and expertise to process [ 2 , 3 ]. In addition, even if one could digest all literature in a field, it would still be difficult to quantify such knowledge.
In the last several years, there has been a quantum leap in natural language processing approaches due to the feasibility of building complex deep learning models with highly flexible architectures [ 4 , 5 ]. The development of large language models such as Bidirectional Encoder Representations from Transformers (BERT; [ 6 ]) and Chat Generative Pretrained Transformer (ChatGPT; [ 7 ]) has enabled the analysis, generation, and modeling of natural language texts in a wide range of applications. The success of these applications is, in large part, due to the feasibility of considering how the same words are used in different contexts when modeling natural language [ 6 ]. One such application is topic modeling, the practice of establishing statistical models of semantic structures underlying a document collection. Topic modeling has been proposed for identifying scientific hot topics over time [ 1 ], for example, in synthetic biology [ 8 ], and it has also been applied to, for example, automatically identify topical scenes in images [ 9 ] and social network topics [ 10 ], discover gene programs highly correlated with cancer prognosis [ 11 ], capture “chromatin topics” that define cell-type differences [ 12 ], and investigate relationships between genetic variants and disease risk [ 13 ]. Here, we use topic modeling to ask how research topics in a scientific field have evolved and what major changes in the research trends have taken place, using plant science as an example.
Plant science corpora allow classification of major research topics
Plant science, broadly defined, is the study of photosynthetic species, their interactions with biotic/abiotic environments, and their applications. For modeling plant science topical evolution, we first identified a collection of plant science documents (i.e., corpus) using a text classification approach. To this end, we first collected over 30 million PubMed records and narrowed down candidate plant science records by searching for those with plant-related terms and taxon names (see Materials and methods ). Because there remained a substantial number of false positives (i.e., biomedical records mentioning plants in passing), a set of positive plant science examples from the 17 plant science journals with the highest numbers of plant science publications covering a wide range of subfields and a set of negative examples from journals with few candidate plant science records were used to train 4 types of text classification models (see Materials and methods ). The best text classification model performed well (F1 = 0.96, F1 of a naïve model = 0.5, perfect model = 1) where the positive and negative examples were clearly separated from each other based on prediction probability of the hold-out testing dataset (false negative rate = 2.6%, false positive rate = 5.2%, S1A and S1B Fig ). The false prediction rate for documents from the 17 plant science journals annotated with the Medical Subject Heading (MeSH) term “Plants” in NCBI was 11.7% (see Materials and methods ). The prediction probability distribution of positive instances with the MeSH term has an expected left-skew to lower values ( S1C Fig ) compared with the distributions of all positive instances ( S1A Fig ). Thus, this subset with the MeSH term is a skewed representation of articles from these 17 major plant science journals. To further benchmark the validity of the plant science records, we also conducted manual annotation of 100 records where the false positive and false negative rates were 14.6% and 10.6%, respectively (see Materials and methods ). Using 12 other plant science journals not included as positive examples as benchmarks, the false negative rate was 9.9% (see Materials and methods ). Considering the range of false prediction rate estimates with different benchmarks, we should emphasize that the model built with the top 17 plant science journals represents a substantial fraction of plant science publications but with biases. Applying the model to the candidate plant science record led to 421,658 positive predictions, hereafter referred to as “plant science records” ( S1D Fig and S1 Data ).
To better understand how the models classified plant science articles, we identified important terms from a more easily interpretable model (Term frequency-Inverse document frequency (Tf-Idf) model; F1 = 0.934) using Shapley Additive Explanations [ 14 ]; 136 terms contributed to predicting plant science records (e.g., Arabidopsis, xylem, seedling) and 138 terms contributed to non-plant science record predictions (e.g., patients, clinical, mice; Tf-Idf feature sheet, S1 Data ). Plant science records as well as PubMed articles grew exponentially from 1950 to 2020 ( Fig 1A ), highlighting the challenges of digesting the rapidly expanding literature. We used the plant science records to perform topic modeling, which consisted of 4 steps: representing each record as a BERT embedding, reducing dimensionality, clustering, and identifying the top terms by calculating class (i.e., topic)-based Tf-Idf (c-Tf-Idf; [ 15 ]). The c-Tf-Idf represents the frequency of a term in the context of how rare the term is to reduce the influence of common words. SciBERT [ 16 ] was the best model among those tested ( S2 Data ) and was used for building the final topic model, which classified 372,430 (88.3%) records into 90 topics defined by distinct combinations of terms ( S3 Data ). The topics contained 620 to 16,183 records and were named after the top 4 to 5 terms defining the topical areas ( Fig 1B and S3 Data ). For example, the top 5 terms representing the largest topic, topic 61 (16,183 records), are “qtl,” “resistance,” “wheat,” “markers,” and “traits,” which represent crop improvement studies using quantitative genetics.
- PPT PowerPoint slide
- PNG larger image
- TIFF original image
(A) Numbers of PubMed (magenta) and plant science (green) records between 1950 and 2020. (a, b, c) Coefficients of the exponential function, y = ae b . Data for the plot are in S1 Data . (B) Numbers of documents for the top 30 plant science topics. Each topic is designated by an index number (left) and the top 4–6 terms with the highest cTf-Idf values (right). Data for the plot are in S3 Data . (C) Two-dimensional representation of the relationships between plant science records generated by Uniform Manifold Approximation and Projection (UMAP, [ 17 ]) using SciBERT embeddings of plant science records. All topics panel: Different topics are assigned different colors. Outlier panel: UMAP representation of all records (gray) with outlier records in red. Blue dotted circles: areas with relatively high densities indicating topics that are below the threshold for inclusion in a topic. In the 8 UMAP representations on the right, records for example topics are in red and the remaining records in gray. Blue dotted circles indicate the relative position of topic 48.
https://doi.org/10.1371/journal.pbio.3002612.g001
Records with assigned topics clustered into distinct areas in a two-dimensional (2D) space ( Fig 1C , for all topics, see S4 Data ). The remaining 49,228 outlier records not assigned to any topic (11.7%, middle panel, Fig 1C ) have 3 potential sources. First, some outliers likely belong to unique topics but have fewer records than the threshold (>500, blue dotted circles, Fig 1C ). Second, some of the many outliers dispersed within the 2D space ( Fig 1C ) were not assigned to any single topic because they had relatively high prediction scores for multiple topics ( S2 Fig ). These likely represent studies across subdisciplines in plant science. Third, some outliers are likely interdisciplinary studies between plant science and other domains, such as chemistry, mathematics, and physics. Such connections can only be revealed if records from other domains are included in the analyses.
Topical clusters reveal closely related topics but with distinct key term usage
Related topics tend to be located close together in the 2D representation (e.g., topics 48 and 49, Fig 1C ). We further assessed intertopical relationships by determining the cosine similarities between topics using cTf-Idfs ( Figs 2A and S3 ). In this topic network, some topics are closely related and form topic clusters. For example, topics 25, 26, and 27 collectively represent a more general topic related to the field of plant development (cluster a , lower left in Fig 2A ). Other topic clusters represent studies of stress, ion transport, and heavy metals ( b ); photosynthesis, water, and UV-B ( c ); population and community biology (d); genomics, genetic mapping, and phylogenetics ( e , upper right); and enzyme biochemistry ( f , upper left in Fig 2A ).
(A) Graph depicting the degrees of similarity (edges) between topics (nodes). Between each topic pair, a cosine similarity value was calculated using the cTf-Idf values of all terms. A threshold similarity of 0.6 was applied to illustrate the most related topics. For the full matrix presented as a heatmap, see S4 Fig . The nodes are labeled with topic index numbers and the top 4–6 terms. The colors and width of the edges are defined based on cosine similarity. Example topic clusters are highlighted in yellow and labeled a through f (blue boxes). (B, C) Relationships between the cTf-Idf values (see S3 Data ) of the top terms for topics 26 and 27 (B) and for topics 25 and 27 (C) . Only terms with cTf-Idf ≥ 0.6 are labeled. Terms with cTf-Idf values beyond the x and y axis limit are indicated by pink arrows and cTf-Idf values. (D) The 2D representation in Fig 1C is partitioned into graphs for different years, and example plots for every 5-year period since 1975 are shown. Example topics discussed in the text are indicated. Blue arrows connect the areas occupied by records of example topics across time periods to indicate changes in document frequencies.
https://doi.org/10.1371/journal.pbio.3002612.g002
Topics differed in how well they were connected to each other, reflecting how general the research interests or needs are (see Materials and methods ). For example, topic 24 (stress mechanisms) is the most well connected with median cosine similarity = 0.36, potentially because researchers in many subfields consider aspects of plant stress even though it is not the focus. The least connected topics include topic 21 (clock biology, 0.12), which is surprising because of the importance of clocks in essentially all aspects of plant biology [ 18 ]. This may be attributed, in part, to the relatively recent attention in this area.
Examining topical relationships and the cTf-Idf values of terms also revealed how related topics differ. For example, topic 26 is closely related to topics 27 and 25 (cluster a on the lower left of Fig 2A ). Topics 26 and 27 both contain records of developmental process studies mainly in Arabidopsis ( Fig 2B ); however, topic 26 is focused on the impact of light, photoreceptors, and hormones such as gibberellic acids (ga) and brassinosteroids (br), whereas topic 27 is focused on flowering and floral development. Topic 25 is also focused on plant development but differs from topic 27 because it contains records of studies mainly focusing on signaling and auxin with less emphasis on Arabidopsis ( Fig 2C ). These examples also highlight the importance of using multiple top terms to represent the topics. The similarities in cTf-Idfs between topics were also useful for measuring the editorial scope (i.e., diverse, or narrow) of journals publishing plant science papers using a relative topic diversity measure (see Materials and methods ). For example, Proceedings of the National Academy of Sciences , USA has the highest diversity, while Theoretical and Applied Genetics has the lowest ( S4 Fig ). One surprise is the relatively low diversity of American Journal of Botany , which focuses on plant ecology, systematics, development, and genetics. The low diversity is likely due to the relatively larger number of cellular and molecular science records in PubMed, consistent with the identification of relatively few topical areas relevant to studies at the organismal, population, community, and ecosystem levels.
Investigation of the relative prevalence of topics over time reveals topical succession
We next asked whether relationships between topics reflect chronological progression of certain subfields. To address this, we assessed how prevalent topics were over time using dynamic topic modeling [ 19 ]. As shown in Fig 2D , there is substantial fluctuation in where the records are in the 2D space over time. For example, topic 44 (light, leaves, co, synthesis, photosynthesis) is among the topics that existed in 1975 but has diminished gradually since. In 1985, topic 39 (Agrobacterium-based transformation) became dense enough to be visualized. Additional examples include topics 79 (soil heavy metals), 42 (differential expression), and 82 (bacterial community metagenomics), which became prominent in approximately 2005, 2010, and 2020, respectively ( Fig 2D ). In addition, animating the document occupancy in the 2D space over time revealed a broad change in patterns over time: Some initially dense areas became sparse over time and a large number of topics in areas previously only loosely occupied at the turn of the century increased over time ( S5 Data ).
While the 2D representations reveal substantial details on the evolution of topics, comparison over time is challenging because the number of plant science records has grown exponentially ( Fig 1A ). To address this, the records were divided into 50 chronological bins each with approximately 8,400 records to make cross-bin comparisons feasible ( S6 Data ). We should emphasize that, because of the way the chronological bins were split, the number of records for each topic in each bin should be treated as a normalized value relative to all other topics during the same period. Examining this relative prevalence of topics across bins revealed a clear pattern of topic succession over time (one topic evolved into another) and the presence of 5 topical categories ( Fig 3 ). The topics were categorized based on their locally weighted scatterplot smoothing (LOWESS) fits and ordered according to timing of peak frequency ( S7 and S8 Data , see Materials and methods ). In Fig 3 , the relative decrease in document frequency does not mean that research output in a topic is dwindling. Because each row in the heatmap is normalized based on the minimum and maximum values within each topic, there still can be substantial research output in terms of numbers of publications even when the relative frequency is near zero. Thus, a reduced relative frequency of a topic reflects only a below-average growth rate compared with other topical areas.
(A-E) A heat map of relative topic frequency over time reveals 5 topical categories: (A) stable, (B) early, (C) transitional, (D) sigmoidal, and (E) rising. The x axis denotes different time bins with each bin containing a similar number of documents to account for the exponential growth of plant science records over time. The sizes of all bins except the first are drawn to scale based on the beginning and end dates. The y axis lists different topics denoted by the label and top 4 to 5 terms. In each cell, the prevalence of a topic in a time bin is colored according to the min-max normalized cTf-Idf values for that topic. Light blue dotted lines delineate different decades. The arrows left of a subset of topic labels indicate example relationships between topics in topic clusters. Blue boxes with labels a–f indicate topic clusters, which are the same as those in Fig 2 . Connecting lines indicate successional trends. Yellow circles/lines 1 – 3: 3 major transition patterns. The original data are in S5 Data .
https://doi.org/10.1371/journal.pbio.3002612.g003
The first topical category is a stable category with 7 topics mostly established before the 1980s that have since remained stable in terms of prevalence in the plant science records (top of Fig 3A ). These topics represent long-standing plant science research foci, including studies of plant physiology (topics 4, 58, and 81), genetics (topic 61), and medicinal plants (topic 53). The second category contains 8 topics established before the 1980s that have mostly decreased in prevalence since (the early category, Fig 3B ). Two examples are physiological and morphological studies of hormone action (topic 45, the second in the early category) and the characterization of protein, DNA, and RNA (topic 18, the second to last). Unlike other early topics, topic 78 (paleobotany and plant evolution studies, the last topic in Fig 3B ) experienced a resurgence in the early 2000s due to the development of new approaches and databases and changes in research foci [ 20 ].
The 33 topics in the third, transitional category became prominent in the 1980s, 1990s, or even 2000s but have clearly decreased in prevalence ( Fig 3C ). In some cases, the early and the transitional topics became less prevalent because of topical succession—refocusing of earlier topics led to newer ones that either show no clear sign of decrease (the sigmoidal category, Fig 3D ) or continue to increase in prevalence (the rising category, Fig 3E ). Consistent with the notion of topical succession, topics within each topic cluster ( Fig 2 ) were found across topic categories and/or were prominent at different time periods (indicated by colored lines linking topics, Fig 3 ). One example is topics in topic cluster b (connected with light green lines and arrows, compare Figs 2 and 3 ); the study of cation transport (topic 47, the third in the transitional category), prominent in the 1980s and early 1990s, is connected to 5 other topics, namely, another transitional topic 29 (cation channels and their expression) peaking in the 2000s and early 2010s, sigmoidal topics 24 and 28 (stress response, tolerance mechanisms) and 30 (heavy metal transport), which rose to prominence in mid-2000s, and the rising topic 42 (stress transcriptomic studies), which increased in prevalence in the mid-2010s.
The rise and fall of topics can be due to a combination of technological or conceptual breakthroughs, maturity of the field, funding constraints, or publicity. The study of transposable elements (topic 62) illustrates the effect of publicity; the rise in this field coincided with Barbara McClintock’s 1983 Nobel Prize but not with the publication of her studies in the 1950s [ 21 ]. The reduced prevalence in early 2000 likely occurred in part because analysis of transposons became a central component of genome sequencing and annotation studies, rather than dedicated studies. In addition, this example indicates that our approaches, while capable of capturing topical trends, cannot be used to directly infer major papers leading to the growth of a topic.
Three major topical transition patterns signify shifts in research trends
Beyond the succession of specific topics, 3 major transitions in the dynamic topic graph should be emphasized: (1) the relative decreasing trend of early topics in the late 1970s and early 1980s; (2) the rise of transitional topics in late 1980s; and (3) the relative decreasing trend of transitional topics in the late 1990s and early 2000s, which coincided with a radiation of sigmoidal and rising topics (yellow circles, Fig 3 ). The large numbers of topics involved in these transitions suggest major shifts in plant science research. In transition 1, early topics decreased in relative prevalence in the late 1970s to early 1980s, which coincided with the rise of transitional topics over the following decades (circle 1, Fig 3 ). For example, there was a shift from the study of purified proteins such as enzymes (early topic 48, S5A Fig ) to molecular genetic dissection of genes, proteins, and RNA (transitional topic 35, S5B Fig ) enabled by the wider adoption of recombinant DNA and molecular cloning technologies in late 1970s [ 22 ]. Transition 2 (circle 2, Fig 3 ) can be explained by the following breakthroughs in the late 1980s: better approaches to create transgenic plants and insertional mutants [ 23 ], more efficient creation of mutant plant libraries through chemical mutagenesis (e.g., [ 24 ]), and availability of gene reporter systems such as β-glucuronidase [ 25 ]. Because of these breakthroughs, molecular genetics studies shifted away from understanding the basic machinery to understanding the molecular underpinnings of specific processes, such as molecular mechanisms of flower and meristem development and the action of hormones such as auxin (topic 27, S5C Fig ); this type of research was discussed as a future trend in 1988 [ 26 ] and remains prevalent to this date. Another example is gene silencing (topic 12), which became a focal area of study along with the widespread use of transgenic plants [ 27 ].
Transition 3 is the most drastic: A large number of transitional, sigmoidal, and rising topics became prevalent nearly simultaneously at the turn of the century (circle 3, Fig 3 ). This period also coincides with a rapid increase in plant science citations ( Fig 1A ). The most notable breakthroughs included the availability of the first plant genome in 2000 [ 28 ], increasing ease and reduced cost of high-throughput sequencing [ 29 ], development of new mass spectrometry–based platforms for analyzing proteins [ 30 ], and advancements in microscopic and optical imaging approaches [ 31 ]. Advances in genomics and omics technology also led to an increase in stress transcriptomics studies (42, S5D Fig ) as well as studies in many other topics such as epigenetics (topic 11), noncoding RNA analysis (13), genomics and phylogenetics (80), breeding (41), genome sequencing and assembly (60), gene family analysis (23), and metagenomics (82 and 55).
In addition to the 3 major transitions across all topics, there were also transitions within topics revealed by examining the top terms for different time bins (heatmaps, S5 Fig ). Taken together, these observations demonstrate that knowledge about topical evolution can be readily revealed through topic modeling. Such knowledge is typically only available to experts in specific areas and is difficult to summarize manually, as no researcher has a command of the entire plant science literature.
Analysis of taxa studied reveals changes in research trends
Changes in research trends can also be illustrated by examining changes in the taxa being studied over time ( S9 Data ). There is a strong bias in the taxa studied, with the record dominated by research models and economically important taxa ( S6 Fig ). Flowering plants (Magnoliopsida) are found in 93% of records ( S6A Fig ), and the mustard family Brassicaceae dominates at the family level ( S6B Fig ) because the genus Arabidopsis contributes to 13% of plant science records ( Fig 4A ). When examining the prevalence of taxa being studied over time, clear patterns of turnover emerged similar to topical succession ( Figs 4B , S6C, and S6D ; Materials and methods ). Given that Arabidopsis is mentioned in more publications than other species we analyzed, we further examined the trends for Arabidopsis publications. The increase in the normalized number (i.e., relative to the entire plant science corpus) of Arabidopsis records coincided with advocacy of its use as a model system in the late 1980s [ 32 ]. While it remains a major plant model, there has been a decrease in overall Arabidopsis publications relative to all other plant science publications since 2011 (blue line, normalized total, Fig 4C ). Because the same chronological bins, each with same numbers of records, from the topic-over-time analysis ( Fig 3 ) were used, the decrease here does not mean that there were fewer Arabidopsis publications—in fact, the number of Arabidopsis papers has remained steady since 2011. This decrease means that Arabidopsis-related publications represent a relatively smaller proportion of plant science records. Interestingly, this decrease took place much earlier (approximately 2005) and was steeper in the United States (red line, Fig 4C ) than in all countries combined (blue line, Fig 4C ).
(A) Percentage of records mentioning specific genera. (B) Change in the prevalence of genera in plant science records over time. (C) Changes in the normalized numbers of all records (blue) and records from the US (red) mentioning Arabidopsis over time. The lines are LOWESS fits with fraction parameter = 0.2. (D) Topical over (red) and under (blue) representation among 5 genera with the most plant science records. LLR: log 2 likelihood ratios of each topic in each genus. Gray: topic-species combination not significantly enriched at the 5% level based on enrichment p -values adjusted for multiple testing with the Benjamini–Hochberg method [ 33 ]. The data used for plotting are in S9 Data . The statistics for all topics are in S10 Data .
https://doi.org/10.1371/journal.pbio.3002612.g004
Assuming that the normalized number of publications reflects the relative intensity of research activities, one hypothesis for the relative decrease in focus on Arabidopsis is that advances in, for example, plant transformation, genetic manipulation, and genome research have allowed the adoption of more previously nonmodel taxa. Consistent with this, there was a precipitous increase in the number of genera being published in the mid-90s to early 2000s during which approaches for plant transgenics became established [ 34 ], but the number has remained steady since then ( S7A Fig ). The decrease in the proportion of Arabidopsis papers is also negatively correlated with the timing of an increase in the number of draft genomes ( S7B Fig and S9 Data ). It is plausible that genome availability for other species may have contributed to a shift away from Arabidopsis. Strikingly, when we analyzed US National Science Foundation records, we found that the numbers of funded grants mentioning Arabidopsis ( S7C Fig ) have risen and fallen in near perfect synchrony with the normalized number of Arabidopsis publication records (red line, Fig 4C ). This finding likely illustrates the impact of funding on Arabidopsis research.
By considering both taxa information and research topics, we can identify clear differences in the topical areas preferred by researchers using different plant taxa ( Fig 4D and S10 Data ). For example, studies of auxin/light signaling, the circadian clock, and flowering tend to be carried out in Arabidopsis, while quantitative genetic studies of disease resistance tend to be done in wheat and rice, glyphosate research in soybean, and RNA virus research in tobacco. Taken together, joint analyses of topics and species revealed additional details about changes in preferred models over time, and the preferred topical areas for different taxa.
Countries differ in their contributions to plant science and topical preference
We next investigated whether there were geographical differences in topical preference among countries by inferring country information from 330,187 records (see Materials and methods ). The 10 countries with the most records account for 73% of the total, with China and the US contributing to approximately 18% each ( Fig 5A ). The exponential growth in plant science records (green line, Fig 1A ) was in large part due to the rapid rise in annual record numbers in China and India ( Fig 5B ). When we examined the publication growth rates using the top 17 plant science journals, the general patterns remained the same ( S7D Fig ). On the other hand, the US, Japan, Germany, France, and Great Britain had slower rates of growth compared with all non-top 10 countries. The rapid increase in records from China and India was accompanied by a rapid increase in metrics measuring journal impact ( Figs 5C and S8 and S9 Data ). For example, using citation score ( Fig 5C , see Materials and methods ), we found that during a 22-year period China (dark green) and India (light green) rapidly approached the global average (y = 0, yellow), whereas some of the other top 10 countries, particularly the US (red) and Japan (yellow green), showed signs of decrease ( Fig 5C ). It remains to be determined whether these geographical trends reflect changes in priority, investment, and/or interest in plant science research.
(A) Numbers of plant science records for countries with the 10 highest numbers. (B) Percentage of all records from each of the top 10 countries from 1980 to 2020. (C) Difference in citation scores from 1999 to 2020 for the top 10 countries. (D) Shown for each country is the relationship between the citation scores averaged from 1999 to 2020 and the slope of linear fit with year as the predictive variable and citation score as the response variable. The countries with >400 records and with <10% missing impact values are included. Data used for plots (A–D) are in S11 Data . (E) Correlation in topic enrichment scores between the top 10 countries. PCC, Pearson’s correlation coefficient, positive in red, negative in blue. Yellow rectangle: countries with more similar topical preferences. (F) Enrichment scores (LLR, log likelihood ratio) of selected topics among the top 10 countries. Red: overrepresentation, blue: underrepresentation. Gray: topic-country combination that is not significantly enriched at the 5% level based on enrichment p -values adjusted for multiple testing with the Benjamini–Hochberg method (for all topics and plotting data, see S12 Data ).
https://doi.org/10.1371/journal.pbio.3002612.g005
Interestingly, the relative growth/decline in citation scores over time (measured as the slope of linear fit of year versus citation score) was significantly and negatively correlated with average citation score ( Fig 5D ); i.e., countries with lower overall metrics tended to experience the strongest increase in citation scores over time. Thus, countries that did not originally have a strong influence on plant sciences now have increased impact. These patterns were also observed when using H-index or journal rank as metrics ( S8 Fig and S11 Data ) and were not due to increased publication volume, as the metrics were normalized against numbers of records from each country (see Materials and methods ). In addition, the fact that different metrics with different caveats and assumptions yielded consistent conclusions indicates the robustness of our observations. We hypothesize that this may be a consequence of the ease in scientific communication among geographically isolated research groups. It could also be because of the prevalence of online journals that are open access, which makes scientific information more readily accessible. Or it can be due to the increasing international collaboration. In any case, the causes for such regression toward the mean are not immediately clear and should be addressed in future studies.
We also assessed how the plant research foci of countries differ by comparing topical preference (i.e., the degree of enrichment of plant science records in different topics) between countries. For example, Italy and Spain cluster together (yellow rectangle, Fig 5E ) partly because of similar research focusing on allergens (topic 0) and mycotoxins (topic 54) and less emphasis on gene family (topic 23) and stress tolerance (topic 28) studies ( Fig 5F , for the fold enrichment and corrected p -values of all topics, see S12 Data ). There are substantial differences in topical focus between countries ( S9 Fig ). For example, research on new plant compounds associated with herbal medicine (topic 69) is a focus in China but not in the US, but the opposite is true for population genetics and evolution (topic 86) ( Fig 5F ). In addition to revealing how plant science research has evolved over time, topic modeling provides additional insights into differences in research foci among different countries, which are informative for science policy considerations.
In this study, topic modeling revealed clear transitions among research topics, which represent shifts in research trends in plant sciences. One limitation of our study is the bias in the PubMed-based corpus. The cellular, molecular, and physiological aspects of plant sciences are well represented, but there are many fewer records related to evolution, ecology, and systematics. Our use of titles/abstracts from the top 17 plant science journals as positive examples allowed us to identify papers we typically see in these journals, but this may have led to us missing “outlier” articles, which may be the most exciting. Another limitation is the need to assign only one topic to a record when a study is interdisciplinary and straddles multiple topics. Furthermore, a limited number of large, inherently heterogeneous topics were summarized to provide a more concise interpretation, which undoubtedly underrepresents the diversity of plant science research. Despite these limitations, dynamic topic modeling revealed changes in plant science research trends that coincide with major shifts in biological science. While we were interested in identifying conceptual advances, our approach can identify the trend but the underlying causes for such trends, particularly key records leading to the growth in certain topics, still need to be identified. It also remains to be determined which changes in research trends lead to paradigm shifts as defined by Kuhn [ 35 ].
The key terms defining the topics frequently describe various technologies (e.g., topic 38/39: transformation, 40: genome editing, 59: genetic markers, 65: mass spectrometry, 69: nuclear magnetic resonance) or are indicative of studies enabled through molecular genetics and omics technologies (e.g., topic 8/60: genome, 11: epigenetic modifications, 18: molecular biological studies of macromolecules, 13: small RNAs, 61: quantitative genetics, 82/84: metagenomics). Thus, this analysis highlights how technological innovation, particularly in the realm of omics, has contributed to a substantial number of research topics in the plant sciences, a finding that likely holds for other scientific disciplines. We also found that the pattern of topic evolution is similar to that of succession, where older topics have mostly decreased in relative prevalence but appear to have been superseded by newer ones. One example is the rise of transcriptome-related topics and the correlated, reduced focus on regulation at levels other than transcription. This raises the question of whether research driven by technology negatively impacts other areas of research where high-throughput studies remain challenging.
One observation on the overall trends in plant science research is the approximately 10-year cycle in major shifts. One hypothesis is related to not only scientific advances but also to the fashion-driven aspect of science. Nonetheless, given that there were only 3 major shifts and the sample size is small, it is difficult to speculate as to why they happened. By analyzing the country of origin, we found that China and India have been the 2 major contributors to the growth in the plant science records in the last 20 years. Our findings also show an equalizing trend in global plant science where countries without a strong plant science publication presence have had an increased impact over the last 20 years. In addition, we identified significant differences in research topics between countries reflecting potential differences in investment and priorities. Such information is important for discerning differences in research trends across countries and can be considered when making policy decisions about research directions.
Materials and methods
Collection and preprocessing of a candidate plant science corpus.
For reproducibility purposes, a random state value of 20220609 was used throughout the study. The PubMed baseline files containing citation information ( ftp://ftp.ncbi.nlm.nih.gov/pubmed/baseline/ ) were downloaded on November 11, 2021. To narrow down the records to plant science-related citations, a candidate citation was identified as having, within the titles and/or abstracts, at least one of the following words: “plant,” “plants,” “botany,” “botanical,” “planta,” and “plantarum” (and their corresponding upper case and plural forms), or plant taxon identifiers from NCBI Taxonomy ( https://www.ncbi.nlm.nih.gov/taxonomy ) or USDA PLANTS Database ( https://plants.sc.egov.usda.gov/home ). Note the search terms used here have nothing to do with the values of the keyword field in PubMed records. The taxon identifiers include all taxon names including and at taxonomic levels below “Viridiplantae” till the genus level (species names not used). This led to 51,395 search terms. After looking for the search terms, qualified entries were removed if they were duplicated, lacked titles and/or abstracts, or were corrections, errata, or withdrawn articles. This left 1,385,417 citations, which were considered the candidate plant science corpus (i.e., a collection of texts). For further analysis, the title and abstract for each citation were combined into a single entry. Text was preprocessed by lowercasing, removing stop-words (i.e., common words), removing non-alphanumeric and non-white space characters (except Greek letters, dashes, and commas), and applying lemmatization (i.e., grouping inflected forms of a word as a single word) for comparison. Because lemmatization led to truncated scientific terms, it was not included in the final preprocessing pipeline.
Definition of positive/negative examples
Upon closer examination, a large number of false positives were identified in the candidate plant science records. To further narrow down citations with a plant science focus, text classification was used to distinguish plant science and non-plant science articles (see next section). For the classification task, a negative set (i.e., non-plant science citations) was defined as entries from 7,360 journals that appeared <20 times in the filtered data (total = 43,329, journal candidate count, S1 Data ). For the positive examples (i.e., true plant science citations), 43,329 plant science citations (positive examples) were sampled from 17 established plant science journals each with >2,000 entries in the filtered dataset: “Plant physiology,” “Frontiers in plant science,” “Planta,” “The Plant journal: for cell and molecular biology,” “Journal of experimental botany,” “Plant molecular biology,” “The New phytologist,” “The Plant cell,” “Phytochemistry,” “Plant & cell physiology,” “American journal of botany,” “Annals of botany,” “BMC plant biology,” “Tree physiology,” “Molecular plant-microbe interactions: MPMI,” “Plant biology,” and “Plant biotechnology journal” (journal candidate count, S1 Data ). Plant biotechnology journal was included, but only 1,894 records remained after removal of duplicates, articles with missing info, and/or withdrawn articles. The positive and negative sets were randomly split into training and testing subsets (4:1) while maintaining a 1:1 positive-to-negative ratio.
Text classification based on Tf and Tf-Idf
Instead of using the preprocessed text as features for building classification models directly, text embeddings (i.e., representations of texts in vectors) were used as features. These embeddings were generated using 4 approaches (model summary, S1 Data ): Term-frequency (Tf), Tf-Idf [ 36 ], Word2Vec [ 37 ], and BERT [ 6 ]. The Tf- and Tf-Idf-based features were generated with CountVectorizer and TfidfVectorizer, respectively, from Scikit-Learn [ 38 ]. Different maximum features (1e4 to 1e5) and n-gram ranges (uni-, bi-, and tri-grams) were tested. The features were selected based on the p- value of chi-squared tests testing whether a feature had a higher-than-expected value among the positive or negative classes. Four different p- value thresholds were tested for feature selection. The selected features were then used to retrain vectorizers with the preprocessed training texts to generate feature values for classification. The classification model used was XGBoost [ 39 ] with 5 combinations of the following hyperparameters tested during 5-fold stratified cross-validation: min_child_weight = (1, 5, 10), gamma = (0.5, 1, 1.5, 2.5), subsample = (0.6, 0.8, 1.0), colsample_bytree = (0.6, 0.8, 1.0), and max_depth = (3, 4, 5). The rest of the hyperparameters were held constant: learning_rate = 0.2, n_estimators = 600, objective = binary:logistic. RandomizedSearchCV from Scikit-Learn was used for hyperparameter tuning and cross-validation with scoring = F1-score.
Because the Tf-Idf model had a relatively high model performance and was relatively easy to interpret (terms are frequency-based, instead of embedding-based like those generated by Word2Vec and BERT), the Tf-Idf model was selected as input to SHapley Additive exPlanations (SHAP; [ 14 ]) to assess the importance of terms. Because the Tf-Idf model was based on XGBoost, a tree-based algorithm, the TreeExplainer module in SHAP was used to determine a SHAP value for each entry in the training dataset for each Tf-Idf feature. The SHAP value indicates the degree to which a feature positively or negatively affects the underlying prediction. The importance of a Tf-Idf feature was calculated as the average SHAP value of that feature among all instances. Because a Tf-Idf feature is generated based on a specific term, the importance of the Tf-Idf feature indicates the importance of the associated term.
Text classification based on Word2Vec
The preprocessed texts were first split into train, validation, and test subsets (8:1:1). The texts in each subset were converted to 3 n-gram lists: a unigram list obtained by splitting tokens based on the space character, or bi- and tri-gram lists built with Gensim [ 40 ]. Each n-gram list of the training subset was next used to fit a Skip-gram Word2Vec model with vector_size = 300, window = 8, min_count = (5, 10, or 20), sg = 1, and epochs = 30. The Word2Vec model was used to generate word embeddings for train, validate, and test subsets. In the meantime, a tokenizer was trained with train subset unigrams using Tensorflow [ 41 ] and used to tokenize texts in each subset and turn each token into indices to use as features for training text classification models. To ensure all citations had the same number of features (500), longer texts were truncated, and shorter ones were zero-padded. A deep learning model was used to train a text classifier with an input layer the same size as the feature number, an attention layer incorporating embedding information for each feature, 2 bidirectional Long-Short-Term-Memory layers (15 units each), a dense layer (64 units), and a final, output layer with 2 units. During training, adam, accuracy, and sparse_categorical_crossentropy were used as the optimizer, evaluation metric, and loss function, respectively. The training process lasted 30 epochs with early stopping if validation loss did not improve in 5 epochs. An F1 score was calculated for each n-gram list and min_count parameter combination to select the best model (model summary, S1 Data ).
Text classification based on BERT models
Two pretrained models were used for BERT-based classification: DistilBERT (Hugging face repository [ 42 ] model name and version: distilbert-base-uncased [ 43 ]) and SciBERT (allenai/scibert-scivocab-uncased [ 16 ]). In both cases, tokenizers were retrained with the training data. BERT-based models had the following architecture: the token indices (512 values for each token) and associated masked values as input layers, pretrained BERT layer (512 × 768) excluding outputs, a 1D pooling layer (768 units), a dense layer (64 units), and an output layer (2 units). The rest of the training parameters were the same as those for Word2Vec-based models, except training lasted for 20 epochs. Cross-validation F1-scores for all models were compared and used to select the best model for each feature extraction method, hyperparameter combination, and modeling algorithm or architecture (model summary, S1 Data ). The best model was the Word2Vec-based model (min_count = 20, window = 8, ngram = 3), which was applied to the candidate plant science corpus to identify a set of plant science citations for further analysis. The candidate plant science records predicted as being in the positive class (421,658) by the model were collectively referred to as the “plant science corpus.”
Plant science record classification
In PubMed, 1,384,718 citations containing “plant” or any plant taxon names (from the phylum to genus level) were considered candidate plant science citations. To further distinguish plant science citations from those in other fields, text classification models were trained using titles and abstracts of positive examples consisting of citations from 17 plant science journals, each with >2,000 entries in PubMed, and negative examples consisting of records from journals with fewer than 20 entries in the candidate set. Among 4 models tested the best model (built with Word2Vec embeddings) had a cross validation F1 of 0.964 (random guess F1 = 0.5, perfect model F1 = 1, S1 Data ). When testing the model using 17,330 testing set citations independent from the training set, the F1 remained high at 0.961.
We also conducted another analysis attempting to use the MeSH term “Plants” as a benchmark. Records with the MeSH term “Plants” also include pharmaceutical studies of plants and plant metabolites or immunological studies of plants as allergens in journals that are not generally considered plant science journals (e.g., Acta astronautica , International journal for parasitology , Journal of chromatography ) or journals from local scientific societies (e.g., Acta pharmaceutica Hungarica , Huan jing ke xue , Izvestiia Akademii nauk . Seriia biologicheskaia ). Because we explicitly labeled papers from such journals as negative examples, we focused on 4,004 records with the “Plants” MeSH term published in the 17 plant science journals that were used as positive instances and found that 88.3% were predicted as the positive class. Thus, based on the MeSH term, there is an 11.7% false prediction rate.
We also enlisted 5 plant science colleagues (3 advanced graduate students in plant biology and genetic/genome science graduate programs, 1 postdoctoral breeder/quantitative biologist, and 1 postdoctoral biochemist/geneticist) to annotate 100 randomly selected abstracts as a reviewer suggested. Each record was annotated by 2 colleagues. Among 85 entries where the annotations are consistent between annotators, 48 were annotated as negative but with 7 predicted as positive (false positive rate = 14.6%) and 37 were annotated as positive but with 4 predicted as negative (false negative rate = 10.8%). To further benchmark the performance of the text classification model, we identified another 12 journals that focus on plant science studies to use as benchmarks: Current opinion in plant biology (number of articles: 1,806), Trends in plant science (1,723), Functional plant biology (1,717), Molecular plant pathology (1,573), Molecular plant (1,141), Journal of integrative plant biology (1,092), Journal of plant research (1,032), Physiology and molecular biology of plants (830), Nature plants (538), The plant pathology journal (443). Annual review of plant biology (417), and The plant genome (321). Among the 12,611 candidate plant science records, 11,386 were predicted as positive. Thus, there is a 9.9% false negative rate.
Global topic modeling
BERTopic [ 15 ] was used for preliminary topic modeling with n-grams = (1,2) and with an embedding initially generated by DistilBERT, SciBERT, or BioBERT (dmis-lab/biobert-base-cased-v1.2; [ 44 ]). The embedding models converted preprocessed texts to embeddings. The topics generated based on the 3 embeddings were similar ( S2 Data ). However, SciBERT-, BioBERT-, and distilBERT-based embedding models had different numbers of outlier records (268,848, 293,790, and 323,876, respectively) with topic index = −1. In addition to generating the fewest outliers, the SciBERT-based model led to the highest number of topics. Therefore, SciBERT was chosen as the embedding model for the final round of topic modeling. Modeling consisted of 3 steps. First, document embeddings were generated with SentenceTransformer [ 45 ]. Second, a clustering model to aggregate documents into clusters using hdbscan [ 46 ] was initialized with min_cluster_size = 500, metric = euclidean, cluster_selection_method = eom, min_samples = 5. Third, the embedding and the initialized hdbscan model were used in BERTopic to model topics with neighbors = 10, nr_topics = 500, ngram_range = (1,2). Using these parameters, 90 topics were identified. The initial topic assignments were conservative, and 241,567 records were considered outliers (i.e., documents not assigned to any of the 90 topics). After assessing the prediction scores of all records generated from the fitted topic models, the 95-percentile score was 0.0155. This score was used as the threshold for assigning outliers to topics: If the maximum prediction score was above the threshold and this maximum score was for topic t , then the outlier was assigned to t . After the reassignment, 49,228 records remained outliers. To assess if some of the outliers were not assigned because they could be assigned to multiple topics, the prediction scores of the records were used to put records into 100 clusters using k- means. Each cluster was then assessed to determine if the outlier records in a cluster tended to have higher prediction scores across multiple topics ( S2 Fig ).
Topics that are most and least well connected to other topics
The most well-connected topics in the network include topic 24 (stress mechanisms, median cosine similarity = 0.36), topic 42 (genes, stress, and transcriptomes, 0.34), and topic 35 (molecular genetics, 0.32, all t test p -values < 1 × 10 −22 ). The least connected topics include topic 0 (allergen research, median cosine similarity = 0.12), topic 21 (clock biology, 0.12), topic 1 (tissue culture, 0.15), and topic 69 (identification of compounds with spectroscopic methods, 0.15; all t test p- values < 1 × 10 −24 ). Topics 0, 1, and 69 are specialized topics; it is surprising that topic 21 is not as well connected as explained in the main text.
Analysis of documents based on the topic model
Topical diversity among top journals with the most plant science records
Using a relative topic diversity measure (ranging from 0 to 10), we found that there was a wide range of topical diversity among 20 journals with the largest numbers of plant science records ( S3 Fig ). The 4 journals with the highest relative topical diversities are Proceedings of the National Academy of Sciences , USA (9.6), Scientific Reports (7.1), Plant Physiology (6.7), and PLOS ONE (6.4). The high diversities are consistent with the broad, editorial scopes of these journals. The 4 journals with the lowest diversities are American Journal of Botany (1.6), Oecologia (0.7), Plant Disease (0.7), and Theoretical and Applied Genetics (0.3), which reflects their discipline-specific focus and audience of classical botanists, ecologists, plant pathologists, and specific groups of geneticists.
Dynamic topic modeling
The codes for dynamic modeling were based on _topic_over_time.py in BERTopics and modified to allow additional outputs for debugging and graphing purposes. The plant science citations were binned into 50 subsets chronologically (for timestamps of bins, see S5 Data ). Because the numbers of documents increased exponentially over time, instead of dividing them based on equal-sized time intervals, which would result in fewer records at earlier time points and introduce bias, we divided them into time bins of similar size (approximately 8,400 documents). Thus, the earlier time subsets had larger time spans compared with later time subsets. If equal-size time intervals were used, the numbers of documents between the intervals would differ greatly; the earlier time points would have many fewer records, which may introduce bias. Prior to binning the subsets, the publication dates were converted to UNIX time (timestamp) in seconds; the plant science records start in 1917-11-1 (timestamp = −1646247600.0) and end in 2021-1-1 (timestamp = 1609477201). The starting dates and corresponding timestamps for the 50 subsets including the end date are in S6 Data . The input data included the preprocessed texts, topic assignments of records from global topic modeling, and the binned timestamps of records. Three additional parameters were set for topics_over_time, namely, nr_bin = 50 (number of bins), evolution_tuning = True, and global_tuning = False. The evolution_tuning parameter specified that averaged c-Tf-Idf values for a topic be calculated in neighboring time bins to reduce fluctuation in c-Tf-Idf values. The global_tuning parameter was set to False because of the possibility that some nonexisting terms could have a high c-Tf-Idf for a time bin simply because there was a high global c-Tf-Idf value for that term.
The binning strategy based on similar document numbers per bin allowed us to increase signal particularly for publications prior to the 90s. This strategy, however, may introduce more noise for bins with smaller time durations (i.e., more recent bins) because of publication frequencies (there can be seasonal differences in the number of papers published, biased toward, e.g., the beginning of the year or the beginning of a quarter). To address this, we examined the relative frequencies of each topic over time ( S7 Data ), but we found that recent time bins had similar variances in relative frequencies as other time bins. We also moderated the impact of variation using LOWESS (10% to 30% of the data points were used for fitting the trend lines) to determine topical trends for Fig 3 . Thus, the influence of the noise introduced via our binning strategy is expected to be minimal.
Topic categories and ordering
The topics were classified into 5 categories with contrasting trends: stable, early, transitional, sigmoidal, and rising. To define which category a topic belongs to, the frequency of documents over time bins for each topic was analyzed using 3 regression methods. We first tried 2 forecasting methods: recursive autoregressor (the ForecasterAutoreg class in the skforecast package) and autoregressive integrated moving average (ARIMA implemented in the pmdarima package). In both cases, the forecasting results did not clearly follow the expected trend lines, likely due to the low numbers of data points (relative frequency values), which resulted in the need to extensively impute missing data. Thus, as a third approach, we sought to fit the trendlines with the data points using LOWESS (implemented in the statsmodels package) and applied additional criteria for assigning topics to categories. When fitting with LOWESS, 3 fraction parameters (frac, the fraction of the data used when estimating each y-value) were evaluated (0.1, 0.2, 0.3). While frac = 0.3 had the smallest errors for most topics, in situations where there were outliers, frac = 0.2 or 0.1 was chosen to minimize mean squared errors ( S7 Data ).
The topics were classified into 5 categories based on the slopes of the fitted line over time: (1) stable: topics with near 0 slopes over time; (2) early: topics with negative (<−0.5) slopes throughout (with the exception of topic 78, which declined early on but bounced back by the late 1990s); (3) transitional: early positive (>0.5) slopes followed by negative slopes at later time points; (4) sigmoidal: early positive slopes followed by zero slopes at later time points; and (5) rising: continuously positive slopes. For each topic, the LOWESS fits were also used to determine when the relative document frequency reached its peak, first reaching a threshold of 0.6 (chosen after trial and error for a range of 0.3 to 0.9), and the overall trend. The topics were then ordered based on (1) whether they belonged to the stable category or not; (2) whether the trends were decreasing, stable, or increasing; (3) the time the relative document frequency first reached 0.6; and (4) the time that the overall peak was reached ( S8 Data ).
Taxa information
To identify a taxon or taxa in all plant science records, NCBI Taxonomy taxdump datasets were downloaded from the NCBI FTP site ( https://ftp.ncbi.nlm.nih.gov/pub/taxonomy/new_taxdump/ ) on September 20, 2022. The highest-level taxon was Viridiplantae, and all its child taxa were parsed and used as queries in searches against the plant science corpus. In addition, a species-over-time analysis was conducted using the same time bins as used for dynamic topic models. The number of records in different time bins for top taxa are in the genus, family, order, and additional species level sheet in S9 Data . The degree of over-/underrepresentation of a taxon X in a research topic T was assessed using the p -value of a Fisher’s exact test for a 2 × 2 table consisting of the numbers of records in both X and T, in X but not T, in T but not X, and in neither ( S10 Data ).
For analysis of plant taxa with genome information, genome data of taxa in Viridiplantae were obtained from the NCBI Genome data-hub ( https://www.ncbi.nlm.nih.gov/data-hub/genome ) on October 28, 2022. There were 2,384 plant genome assemblies belonging to 1,231 species in 559 genera (genome assembly sheet, S9 Data ). The date of the assembly was used as a proxy for the time when a genome was sequenced. However, some species have updated assemblies and have more recent data than when the genome first became available.
Taxa being studied in the plant science records
Flowering plants (Magnoliopsida) are found in 93% of records, while most other lineages are discussed in <1% of records, with conifers and related species being exceptions (Acrogynomsopermae, 3.5%, S6A Fig ). At the family level, the mustard (Brassicaceae), grass (Poaceae), pea (Fabaceae), and nightshade (Solanaceae) families are in 51% of records ( S6B Fig ). The prominence of the mustard family in plant science research is due to the Brassica and Arabidopsis genera ( Fig 4A ). When examining the prevalence of taxa being studied over time, clear patterns of turnovers emerged ( Figs 4B , S6C, and S6D ). While the study of monocot species (Liliopsida) has remained steady, there was a significant uptick in the prevalence of eudicot (eudicotyledon) records in the late 90s ( S6C Fig ), which can be attributed to the increased number of studies in the mustard, myrtle (Myrtaceae), and mint (Lamiaceae) families among others ( S6D Fig ). At the genus level, records mentioning Gossypium (cotton), Phaseolus (bean), Hordeum (wheat), and Zea (corn), similar to the topics in the early category, were prevalent till the 1980s or 1990s but have mostly decreased in number since ( Fig 4B ). In contrast, Capsicum , Arabidopsis , Oryza , Vitus , and Solanum research has become more prevalent over the last 20 years.
Geographical information for the plant science corpus
The geographical information (country) of authors in the plant science corpus was obtained from the address (AD) fields of first authors in Medline XML records accessible through the NCBI EUtility API ( https://www.ncbi.nlm.nih.gov/books/NBK25501/ ). Because only first author affiliations are available for records published before December 2014, only the first author’s location was considered to ensure consistency between records before and after that date. Among the 421,658 records in the plant science corpus, 421,585 had Medline records and 421,276 had unique PMIDs. Among the records with unique PMIDs, 401,807 contained address fields. For each of the remaining records, the AD field content was split into tokens with a “,” delimiter, and the token likely containing geographical info (referred to as location tokens) was selected as either the last token or the second to last token if the last token contained “@” indicating the presence of an email address. Because of the inconsistency in how geographical information was described in the location tokens (e.g., country, state, city, zip code, name of institution, and different combinations of the above), the following 4 approaches were used to convert location tokens into countries.
The first approach was a brute force search where full names and alpha-3 codes of current countries (ISO 3166–1), current country subregions (ISO 3166–2), and historical country (i.e., country that no longer exists, ISO 3166–3) were used to search the address fields. To reduce false positives using alpha-3 codes, a space prior to each code was required for the match. The first approach allowed the identification of 361,242, 16,573, and 279,839 records with current country, historical country, and subregion information, respectively. The second method was the use of a heuristic based on common address field structures to identify “location strings” toward the end of address fields that likely represent countries, then the use of the Python pycountry module to confirm the presence of country information. This approach led to 329,025 records with country information. The third approach was to parse first author email addresses (90,799 records), recover top-level domain information, and use country code Top Level Domain (ccTLD) data from the ISO 3166 Wikipedia page to define countries (72,640 records). Only a subset of email addresses contains country information because some are from companies (.com), nonprofit organizations (.org), and others. Because a large number of records with address fields still did not have country information after taking the above 3 approaches, another approach was implemented to query address fields against a locally installed Nominatim server (v.4.2.3, https://github.com/mediagis/nominatim-docker ) using OpenStreetMap data from GEOFABRIK ( https://www.geofabrik.de/ ) to find locations. Initial testing indicated that the use of full address strings led to false positives, and the computing resource requirement for running the server was high. Thus, only location strings from the second approach that did not lead to country information were used as queries. Because multiple potential matches were returned for each query, the results were sorted based on their location importance values. The above steps led to an additional 72,401 records with country information.
Examining the overlap in country information between approaches revealed that brute force current country and pycountry searches were consistent 97.1% of the time. In addition, both approaches had high consistency with the email-based approach (92.4% and 93.9%). However, brute force subregion and Nominatim-based predictions had the lowest consistencies with the above 3 approaches (39.8% to 47.9%) and each other. Thus, a record’s country information was finalized if the information was consistent between any 2 approaches, except between the brute force subregion and Nominatim searches. This led to 330,328 records with country information.
Topical and country impact metrics
To determine annual country impact, impact scores were determined in the same way as that for annual topical impact, except that values for different countries were calculated instead of topics ( S8 Data ).
Topical preferences by country
To determine topical preference for a country C , a 2 × 2 table was established with the number of records in topic T from C , the number of records in T but not from C , the number of non- T records from C , and the number of non- T records not from C . A Fisher’s exact test was performed for each T and C combination, and the resulting p -values were corrected for multiple testing with the Bejamini–Hochberg method (see S12 Data ). The preference of T in C was defined as the degree of enrichment calculated as log likelihood ratio of values in the 2 × 2 table. Topic 5 was excluded because >50% of the countries did not have records for this topic.
The top 10 countries could be classified into a China–India cluster, an Italy–Spain cluster, and remaining countries (yellow rectangles, Fig 5E ). The clustering of Italy and Spain is partly due to similar research focusing on allergens (topic 0) and mycotoxins (topic 54) and less emphasis on gene family (topic 23) and stress tolerance (topic 28) studies ( Figs 5F and S9 ). There are also substantial differences in topical focus between countries. For example, plant science records from China tend to be enriched in hyperspectral imaging and modeling (topic 9), gene family studies (topic 23), stress biology (topic 28), and research on new plant compounds associated with herbal medicine (topic 69), but less emphasis on population genetics and evolution (topic 86, Fig 5F ). In the US, there is a strong focus on insect pest resistance (topic 75), climate, community, and diversity (topic 83), and population genetics and evolution but less focus on new plant compounds. In summary, in addition to revealing how plant science research has evolved over time, topic modeling provides additional insights into differences in research foci among different countries.
Supporting information
S1 fig. plant science record classification model performance..
(A–C) Distributions of prediction probabilities (y_prob) of (A) positive instances (plant science records), (B) negative instances (non-plant science records), and (C) positive instances with the Medical Subject Heading “Plants” (ID = D010944). The data are color coded in blue and orange if they are correctly and incorrectly predicted, respectively. The lower subfigures contain log10-transformed x axes for the same distributions as the top subfigure for better visualization of incorrect predictions. (D) Prediction probability distribution for candidate plant science records. Prediction probabilities plotted here are available in S13 Data .
https://doi.org/10.1371/journal.pbio.3002612.s001
S2 Fig. Relationships between outlier clusters and the 90 topics.
(A) Heatmap demonstrating that some outlier clusters tend to have high prediction scores for multiple topics. Each cell shows the average prediction score of a topic for records in an outlier cluster. (B) Size of outlier clusters.
https://doi.org/10.1371/journal.pbio.3002612.s002
S3 Fig. Cosine similarities between topics.
(A) Heatmap showing cosine similarities between topic pairs. Top-left: hierarchical clustering of the cosine similarity matrix using the Ward algorithm. The branches are colored to indicate groups of related topics. (B) Topic labels and names. The topic ordering was based on hierarchical clustering of topics. Colored rectangles: neighboring topics with >0.5 cosine similarities.
https://doi.org/10.1371/journal.pbio.3002612.s003
S4 Fig. Relative topical diversity for 20 journals.
The 20 journals with the most plant science records are shown. The journal names were taken from the journal list in PubMed ( https://www.nlm.nih.gov/bsd/serfile_addedinfo.html ).
https://doi.org/10.1371/journal.pbio.3002612.s004
S5 Fig. Topical frequency and top terms during different time periods.
(A-D) Different patterns of topical frequency distributions for example topics (A) 48, (B) 35, (C) 27, and (D) 42. For each topic, the top graph shows the frequency of topical records in each time bin, which are the same as those in Fig 3 (green line), and the end date for each bin is indicated. The heatmap below each line plot depicts whether a term is among the top terms in a time bin (yellow) or not (blue). Blue dotted lines delineate different decades (see S5 Data for the original frequencies, S6 Data for the LOWESS fitted frequencies and the top terms for different topics/time bins).
https://doi.org/10.1371/journal.pbio.3002612.s005
S6 Fig. Prevalence of records mentioning different taxonomic groups in Viridiplantae.
(A, B) Percentage of records mentioning specific taxa at the ( A) major lineage and (B) family levels. (C, D) The prevalence of taxon mentions over time at the (C) major lineage and (E) family levels. The data used for plotting are available in S9 Data .
https://doi.org/10.1371/journal.pbio.3002612.s006
S7 Fig. Changes over time.
(A) Number of genera being mentioned in plant science records during different time bins (the date indicates the end date of that bin, exclusive). (B) Numbers of genera (blue) and organisms (salmon) with draft genomes available from National Center of Biotechnology Information in different years. (C) Percentage of US National Science Foundation (NSF) grants mentioning the genus Arabidopsis over time with peak percentage and year indicated. The data for (A–C) are in S9 Data . (D) Number of plant science records in the top 17 plant science journals from the USA (red), Great Britain (GBR) (orange), India (IND) (light green), and China (CHN) (dark green) normalized against the total numbers of publications of each country over time in these 17 journals. The data used for plotting can be found in S11 Data .
https://doi.org/10.1371/journal.pbio.3002612.s007
S8 Fig. Change in country impact on plant science over time.
(A, B) Difference in 2 impact metrics from 1999 to 2020 for the 10 countries with the highest number of plant science records. (A) H-index. (B) SCImago Journal Rank (SJR). (C, D) Plots show the relationships between the impact metrics (H-index in (C) , SJR in (D) ) averaged from 1999 to 2020 and the slopes of linear fits with years as the predictive variable and impact metric as the response variable for different countries (A3 country codes shown). The countries with >400 records and with <10% missing impact values are included. The data used for plotting can be found in S11 Data .
https://doi.org/10.1371/journal.pbio.3002612.s008
S9 Fig. Country topical preference.
Enrichment scores (LLR, log likelihood ratio) of topics for each of the top 10 countries. Red: overrepresentation, blue: underrepresentation. The data for plotting can be found in S12 Data .
https://doi.org/10.1371/journal.pbio.3002612.s009
S1 Data. Summary of source journals for plant science records, prediction models, and top Tf-Idf features.
Sheet–Candidate plant sci record j counts: Number of records from each journal in the candidate plant science corpus (before classification). Sheet—Plant sci record j count: Number of records from each journal in the plant science corpus (after classification). Sheet–Model summary: Model type, text used (txt_flag), and model parameters used. Sheet—Model performance: Performance of different model and parameter combinations on the validation data set. Sheet–Tf-Idf features: The average SHAP values of Tf-Idf (Term frequency-Inverse document frequency) features associated with different terms. Sheet–PubMed number per year: The data for PubMed records in Fig 1A . Sheet–Plant sci record num per yr: The data for the plant science records in Fig 1A .
https://doi.org/10.1371/journal.pbio.3002612.s010
S2 Data. Numbers of records in topics identified from preliminary topic models.
Sheet–Topics generated with a model based on BioBERT embeddings. Sheet–Topics generated with a model based on distilBERT embeddings. Sheet–Topics generated with a model based on SciBERT embeddings.
https://doi.org/10.1371/journal.pbio.3002612.s011
S3 Data. Final topic model labels and top terms for topics.
Sheet–Topic label: The topic index and top 10 terms with the highest cTf-Idf values. Sheets– 0 to 89: The top 50 terms and their c-Tf-Idf values for topics 0 to 89.
https://doi.org/10.1371/journal.pbio.3002612.s012
S4 Data. UMAP representations of different topics.
For a topic T , records in the UMAP graph are colored red and records not in T are colored gray.
https://doi.org/10.1371/journal.pbio.3002612.s013
S5 Data. Temporal relationships between published documents projected onto 2D space.
The 2D embedding generated with UMAP was used to plot document relationships for each year. The plots from 1975 to 2020 were compiled into an animation.
https://doi.org/10.1371/journal.pbio.3002612.s014
S6 Data. Timestamps and dates for dynamic topic modeling.
Sheet–bin_timestamp: Columns are: (1) order index; (2) bin_idx–relative positions of bin labels; (3) bin_timestamp–UNIX time in seconds; and (4) bin_date–month/day/year. Sheet–Topic frequency per timestamp: The number of documents in each time bin for each topic. Sheets–LOWESS fit 0.1/0.2/0.3: Topic frequency per timestamp fitted with the fraction parameter of 0.1, 0.2, or 0.3. Sheet—Topic top terms: The top 5 terms for each topic in each time bin.
https://doi.org/10.1371/journal.pbio.3002612.s015
S7 Data. Locally weighted scatterplot smoothing (LOWESS) of topical document frequencies over time.
There are 90 scatter plots, one for each topic, where the x axis is time, and the y axis is the document frequency (blue dots). The LOWESS fit is shown as orange points connected with a green line. The category a topic belongs to and its order in Fig 3 are labeled on the top left corner. The data used for plotting are in S6 Data .
https://doi.org/10.1371/journal.pbio.3002612.s016
S8 Data. The 4 criteria used for sorting topics.
Peak: the time when the LOWESS fit of the frequencies of a topic reaches maximum. 1st_reach_thr: the time when the LOWESS fit first reaches a threshold of 60% maximal frequency (peak value). Trend: upward (1), no change (0), or downward (−1). Stable: whether a topic belongs to the stable category (1) or not (0).
https://doi.org/10.1371/journal.pbio.3002612.s017
S9 Data. Change in taxon record numbers and genome assemblies available over time.
Sheet–Genus: Number of records mentioning a genus during different time periods (in Unix timestamp) for the top 100 genera. Sheet–Genus: Number of records mentioning a family during different time periods (in Unix timestamp) for the top 100 families. Sheet–Genus: Number of records mentioning an order during different time periods (in Unix timestamp) for the top 20 orders. Sheet–Species levels: Number of records mentioning 12 selected taxonomic levels higher than the order level during different time periods (in Unix timestamp). Sheet–Genome assembly: Plant genome assemblies available from NCBI as of October 28, 2022. Sheet–Arabidopsis NSF: Absolute and normalized numbers of US National Science Foundation funded proposals mentioning Arabidopsis in proposal titles and/or abstracts.
https://doi.org/10.1371/journal.pbio.3002612.s018
S10 Data. Taxon topical preference.
Sheet– 5 genera LLR: The log likelihood ratio of each topic in each of the top 5 genera with the highest numbers of plant science records. Sheets– 5 genera: For each genus, the columns are: (1) topic; (2) the Fisher’s exact test p -value (Pvalue); (3–6) numbers of records in topic T and in genus X (n_inT_inX), in T but not in X (n_inT_niX), not in T but in X (n_niT_inX), and not in T and X (n_niT_niX) that were used to construct 2 × 2 tables for the tests; and (7) the log likelihood ratio generated with the 2 × 2 tables. Sheet–corrected p -value: The 4 values for generating LLRs were used to conduct Fisher’s exact test. The p -values obtained for each country were corrected for multiple testing.
https://doi.org/10.1371/journal.pbio.3002612.s019
S11 Data. Impact metrics of countries in different years.
Sheet–country_top25_year_count: number of total publications and publications per year from the top 25 countries with the most plant science records. Sheet—country_top25_year_top17j: number of total publications and publications per year from the top 25 countries with the highest numbers of plant science records in the 17 plant science journals used as positive examples. Sheet–prank: Journal percentile rank scores for countries (3-letter country codes following https://www.iban.com/country-codes ) in different years from 1999 to 2020. Sheet–sjr: Scimago Journal rank scores. Sheet–hidx: H-Index scores. Sheet–cite: Citation scores.
https://doi.org/10.1371/journal.pbio.3002612.s020
S12 Data. Topical enrichment for the top 10 countries with the highest numbers of plant science publications.
Sheet—Log likelihood ratio: For each country C and topic T, it is defined as log((a/b)/(c/d)) where a is the number of papers from C in T, b is the number from C but not in T, c is the number not from C but in T, d is the number not from C and not in T. Sheet: corrected p -value: The 4 values, a, b, c, and d, were used to conduct Fisher’s exact test. The p -values obtained for each country were corrected for multiple testing.
https://doi.org/10.1371/journal.pbio.3002612.s021
S13 Data. Text classification prediction probabilities.
This compressed file contains the PubMed ID (PMID) and the prediction probabilities (y_pred) of testing data with both positive and negative examples (pred_prob_testing), plant science candidate records with the MeSH term “Plants” (pred_prob_candidates_with_mesh), and all plant science candidate records (pred_prob_candidates_all). The prediction probability was generated using the Word2Vec text classification models for distinguishing positive (plant science) and negative (non-plant science) records.
https://doi.org/10.1371/journal.pbio.3002612.s022
Acknowledgments
We thank Maarten Grootendorst for discussions on topic modeling. We also thank Stacey Harmer, Eva Farre, Ning Jiang, and Robert Last for discussion on their respective research fields and input on how to improve this study and Rudiger Simon for the suggestion to examine differences between countries. We also thank Mae Milton, Christina King, Edmond Anderson, Jingyao Tang, Brianna Brown, Kenia Segura Abá, Eleanor Siler, Thilanka Ranaweera, Huan Chen, Rajneesh Singhal, Paulo Izquierdo, Jyothi Kumar, Daniel Shiu, Elliott Shiu, and Wiggler Catt for their good ideas, personal and professional support, collegiality, fun at parties, as well as the trouble they have caused, which helped us improve as researchers, teachers, mentors, and parents.
- View Article
- PubMed/NCBI
- Google Scholar
- 2. Blei DM, Lafferty JD. Topic Models. In: Srivastava A, Sahami M, editors. Text Mining. Cambridge: Chapman and Hall/CRC; 2009. pp. 71–93.
- 7. ChatGPT. [cited 2023 Aug 25]. Available from: https://chat.openai.com
- 9. Fei-Fei L, Perona P. A Bayesian hierarchical model for learning natural scene categories. 2005 IEEE Computer Society Conference on Computer Vision and Pattern Recognition (CVPR’05); 2005. pp. 524–531 vol. 2. https://doi.org/10.1109/CVPR.2005.16
- 19. Blei DM, Lafferty JD. Dynamic topic models. Proceedings of the 23rd International Conference on Machine learning. New York, NY, USA: Association for Computing Machinery; 2006. pp. 113–120. https://doi.org/10.1145/1143844.1143859
- 35. Kuhn T. The Structure of Scientific Revolution. Chicago: University of Chicago Press; 1962.
- 36. CiteSeer | Proceedings of the second international conference on Autonomous agents. [cited 2023 Aug 23]. Available from: https://dl.acm.org/doi/10.1145/280765.280786
- 39. Chen T, Guestrin C. XGBoost: A Scalable Tree Boosting System. Proceedings of the 22nd ACM SIGKDD International Conference on Knowledge Discovery and Data Mining. New York, NY, USA: ACM; 2016. pp. 785–794. https://doi.org/10.1145/2939672.2939785
- 40. Řehůřek R, Sojka P. Software Framework for Topic Modelling with Large Corpora. Proceedings of the LREC 2010 Workshop on New Challenges for NLP Frameworks. Valletta, Malta: ELRA; 2010. pp. 45–50.
- 42. Hugging Face–The AI community building the future. 2023 Aug 19 [cited 2023 Aug 25]. Available from: https://huggingface.co/
IMAGES
VIDEO
COMMENTS
Basic research is essential to developing theories related to human behavior and mental processes. The subfield of cognition is a significant benefactor of basic research as it relies on novel theoretical frameworks relating to memory and learning. With limited established knowledge of the mind, psychology is an ideal field for basic research.
Health. Having a capacity in basic sciences is in the interests of both developed and developing countries, given the potential for applications to foster sustainable development and raise standards of living. For example, a growing number of people around the world suffer from diabetes. Thanks to laboratory studies of the ways in which genes ...
Discovery in science does not follow a straightforward path. Scientific research is conducted using models that are still being developed, in the context of dozens of unanswered questions, and using techniques and approaches no one else in the world has used before. According to the Association of American Medical Colleges (AAMC), basic science "provides the foundation of knowledge for the ...
Funding Opportunities. The Basic Energy Sciences (BES) program supports basic scientific research to lay the foundations for new energy technologies and to advance DOE missions in energy, environment, and national security. BES research emphasizes discovery, design, and understanding of new materials and new chemical, biochemical, and ...
Basic science research has been instrumental in shaping our understanding of cell and developmental biology, both as standalone fields and as sources of potential insights into human health and ...
This article takes you through the first steps of the research process, helping you narrow down your ideas and build up a strong foundation for your research project. Table of contents. Step 1: Choose your topic. Step 2: Identify a problem. Step 3: Formulate research questions. Step 4: Create a research design. Step 5: Write a research proposal.
Research outcomes are measured through quality publications. Scientists must not only 'do' science but must 'write' science. The story of the project must be told in a clear, simple language weaving in previous work done in the field, answering the research question, and addressing the hypothesis set forth at the beginning of the study.
Basic Science. All scientific research conducted at medical schools and teaching hospitals ultimately aims to improve health and ability. Basic science research —often called fundamental or bench research—provides the foundation of knowledge for the applied science that follows. This type of research encompasses familiar scientific ...
A science fair is an opportunity for students to do an independent science project following either the scientific method or the engineering design process. Students conduct their research then present their results at a science fair. Science fairs occur at different levels including classroom, school-wide, regional, state, and international.
Basic research, also called pure research, fundamental research, basic science, or pure science, is a type of scientific research with the aim of improving scientific theories for better understanding and prediction of natural or other phenomena. In contrast, applied research uses scientific theories to develop technology or techniques, which can be used to intervene and alter natural or other ...
Browse Science Projects. Over 1,200 free science projects for K-12. Browse by subject, grade level, or try our Topic Selection Wizard to find your winning science project. With science projects in 32 different areas of science from astronomy to zoology, we've got something for everyone! Let us help you find a science project that fits your ...
Scientific discovery is an ongoing process that takes time, observation, data collection and analysis, patience and more. At the NPRCs, our recent COVID-19 research is an example of the ongoing basic science process — how current research builds on previous discoveries and how discoveries help improve human health. This article from the National Institutes of ...
With Floating Forests, you'll sift through 40 years of satellite images of the ocean surface identifying kelp forests, which are foundational for marine ecosystems, providing shelter for shrimp ...
43. "Flip" a drawing with water. Light refraction causes some really cool effects, and there are multiple easy science experiments you can do with it. This one uses refraction to "flip" a drawing; you can also try the famous "disappearing penny" trick. Learn more: Light Refraction With Water.
Basic Research. Definition: Basic Research, also known as Fundamental or Pure Research, is scientific research that aims to increase knowledge and understanding about the natural world without necessarily having any practical or immediate applications.It is driven by curiosity and the desire to explore new frontiers of knowledge rather than by the need to solve a specific problem or to develop ...
The 'Ultimate' Science Fair Project: Frisbee Aerodynamics. Aerodynamics & Hydrodynamics. The Paper Plate Hovercraft. Aerodynamics & Hydrodynamics. The Swimming Secrets of Duck Feet. Aerodynamics & Hydrodynamics. The True Cost of a Bike Rack: Aerodynamics and Fuel Economy. Aerodynamics & Hydrodynamics.
In (ostensible) opposition to basic research is applied research, which is centered around filling a need established prior to the start of the project (Figure 1). As a biologist, a research project in my field that is rooted in basic science might strive to unravel the fundamentals of life, such as all of the components that comprises the ...
S. N. Bose National Centre for Basic Sciences. The S. N. Bose National Centre for Basic Sciences is an autonomous research institute engaged in research in basic sciences. The institute was founded under Department of Science and Technology, Government of India in 1986 as a Registered Society. The Centre was established to honour the life and ...
The U.S. National Science Foundation offers hundreds of funding opportunities — including grants, cooperative agreements and fellowships — that support research and education across science and engineering. Learn how to apply for NSF funding by visiting the links below.
Basic Science Research Projects. 1. Heterotopic Ossification: Further Defining Cells of Origin. The goal of the project is to better understand the signaling pathways involved in heterotopic ossification formation and how stem cells contribute to this abnormal bone formation. 2.
In 1996, the number of publications authored by mainland Chinese scientists and indexed by SCI was only 5% of that of U.S. scientists and 19% of that of British scientists. China is internationally competitive in only about 5% of basic science fields and enjoys a relatively high level of performance in only about 20% of these fields.
The Beyond Basic Science REU will provide participants with transdisciplinary research experiences alongside mentors focused on leading-edge climate science and policy, with an emphasis on participatory action research. The overall project is grounded in high impact educational practices that will generate knowledge and practices that promote ...
NASA offers a number of opportunities in the Research Opportunities for Space and Earth Science (ROSES) for support of Open Science projects. Explore the list below of those that are currently open and ones that have been previously offered. Proposers should always consult NSPIRES for the most accurate and up-to-date information on NASA proposals.
Campus and Community. Research Research School of Global Public Health Tandon School of Engineering College of Arts and Science Arts and Science Liberal Studies Gallatin School of Individualized Study Leonard N. Stern School of Business NYU Abu Dhabi. The telegraph. The polio vaccine. The bar code. Light beer.
Basic Research in Science & Engineering. ... for proposal The Ministry of Science and ICT will contest the following new project for the 2023 Korea-Brazil Joint Research Project to strengthen science and technology competitiveness through international cooperation between Korea and Brazil, so please apply. June 29, 2023 Minister of Science and ...
DOE Joint Genome Institute. DOE JGI in Walnut Creek, California, provides state-of-the-science capabilities for genome sequencing and analysis. With more than 1100 worldwide collaborators on active projects, JGI is the preeminent facility for sequencing plants, microbes, and microbial communities that are foundational to energy and environmental research.
Our ability to understand the progress of science through the evolution of research topics is limited by the need for specialist knowledge and the exponential growth of the literature. This study uses artificial intelligence and machine learning approaches to demonstrate how a biological field (plant science) has evolved, how the model systems have changed, and how countries differ in terms of ...