Improving the New York City Subway System
Submitted to the nyc council committee on transportation.

Thank you for the opportunity to speak today. The Citizens Budget Commission (CBC) is a nonpartisan, nonprofit organization devoted to influencing constructive change in the finances of New York City and New York State government, including state authorities like the Metropolitan Transportation Authority (MTA).
In May, subway on-time performance fell below 62 percent, and the 12-month rolling average for subway car reliability has fallen to lows not seen since at least 2009. The forces that shaped the decline in subway reliability and high profile failures, such as the derailment of an A train in July, have been in operation for years. Unfortunately, the current debate on what is needed to stabilize the system and who should pay for it risks perpetuating these same forces.
My testimony today will highlight the ways the MTA has long underinvested in its infrastructure and prioritized system expansions and enhancements over capital improvements that would bring the subway system to a state of good repair. I will also discuss how the MTA should rethink its funding framework to raise necessary revenues from the three categories of beneficiaries of the region’s mass transit system: riders, taxpayers, and drivers. As part of this discussion, I will emphasize that the current public debate over whether the State or the City should provide more funding for the MTA overlooks the fact that taxpayer revenue will be used to foot the bill regardless of which level of government imposes the tax. And that the majority of the MTA’s funds are now provided by New York City residents and businesses.

Misplaced Priorities in the MTA’s 2015-2019 Capital Program
Although the MTA has been making substantial investments in the subway system for more than 30 years, parts of the system are not in a state of good repair. A long period of neglect prior to 1982 and constant wear and tear since then mean additional investments for repairs or replacement are needed.
In planning for the 2015-2019 capital program, the MTA staff released the latest 20-year needs assessment in October 2013. This document focuses on the capital investments needed to rebuild and replace the thousands of assets that comprise the MTA network’s vast infrastructure—including the New York City subway—and to ensure that the existing systems continue to deliver transportation services safely and reliably. The document guides the agency’s five-year capital plan by highlighting the continuing investments needed in subway cars, signals, track, stations, equipment, and other assets over the five-year period.
Though the 20-year needs assessment laid out the size of investments needed to bring the system to state of good repair, it did not anticipate funding or fulfilling all the needs. MTA staff developed the list of projects to be undertaken while keeping in mind the agency’s capacity to execute capital projects and the public’s willingness to endure service disruptions necessary to carry them out. Thus, the needs assessment likely understated MTA infrastructure needs, particularly in the subway system, which operates around the clock.
Despite the development of the needs assessment, the MTA’s originally approved 2015-2019 capital program did not invest enough in bringing the subway system to a state of good repair. (See Table.) The 20-year needs assessment listed $16.1 billion in continuing needs for the subway, but the originally approved plan included only $12.7 billion in state of good repair and normal replacement investments. The originally approved plan did not meet investment targets for 7 of 10 categories of subway system assets including shortfalls of 39 percent for the signals and communications systems, and 57 percent for line equipment such as ventilators, pumps, and tunnel lighting.

Despite these levels of underinvestment, the 2015-2019 capital plan included more than $4.8 billion in system expansions. Work on East Side Access, started as part of the 2005-2009 capital program, continues in the 2015-2019 program, and was joined by two new expansions: Phase Two of the Second Avenue Subway and Penn Station Access, a project to build new Metro-North Stations in the Bronx and bring the system into Penn Station. These expansions accounted for more than 16 percent of the originally approved plan.
If the 20-year needs assessment set a low bar for progress toward achieving a state of good repair in the subway system and the originally approved 2015-2019 capital program plan did not meet even that low bar, then the amended capital plan, passed by the MTA board in May, represents a move further in the wrong direction.
The comprehensive amendment to the 2015-2019 capital plan presented in May 2017 increased the size of the plan more than 10 percent; however, despite this increase, the agency still intends to invest less than is required to keep the system in state of good repair and to enable current capacity to be used effectively. The amendment decreases sums dedicated to subway signals and communications systems, subway cars, and subway equipment such as vents, pumps, and tunnel lighting. Most of the net increase came from increased commitments to network expansions, the addition of nearly $2 billion for the Long Island Rail Road Expansion Project and $700 million for Phase II of the Second Avenue Subway.
Pursuing these expansions and enhancements allocates substantial sums, and implicitly commits even larger sums in the future, to expanding the transit network, without adequately addressing the causes of service deterioration. Instead of an all-hands-on-deck effort to improve transit service and reliability, more than one-fifth of the current capital plan supports highly visible and popular expansions. Ideally the MTA could both bring its system to a state of good repair and expand the system. However, the system’s recent performance and constrained ability of the agency to execute the capital plan forces the MTA to make difficult choices about where to allocate funds.
Funding the System Over the Long Term
Remedying this short fall in investments in the subway system’s state of good repair in the short term does not require additional capital funding. As of March of this year, more than $80 billion has been authorized for capital plans spanning the 2000 to 2014 period. Of this sum, more than $18 billion remains unspent and $9.2 billion remains uncommitted to construction projects. These uncommitted funds, and funds in the current 2015-2019 capital program can and should be re-tasked to work that can accelerate the process of bringing the subway to a state of good repair.
Over the longer term, the MTA, and policymakers, should pursue a different funding framework for the transit agency, one that recognizes three types of revenue to support mass transit: fares, paid by riders; tax subsidies, paid by taxpayers in general; and motorist cross-subsidies, paid by drivers through bridge and tunnel tolls, fuel taxes, and license and registration fees.
CBC has advocated that between 45 and 50 percent of mass transit expenses should be funded by fares; linking fares to expenses maintains pressure on management and labor to keep expenses down, and it makes clear to riders the link between collective bargaining and fares. The remaining share of expenses should be paid with tax subsidies (25 to 30 percent) and a cross-subsidy from motor vehicle users (20 to 25 percent) via tolls, other user fees, or both. Though the current mix of revenues meets the guidelines for fares, it does not rely enough on cross-subsidies from motorists, who contribute only 12 percent of MTA’s mass transit funds.
The implication of this framework for the current situation means the MTA should seek additional motor vehicle use charges to cross-subsidize transit. This can be done by increasing current user charges such as tolls, motor fuel taxes, and license and registration fees. Other approaches would create new sources of funding, such as tolling the City’s East River Bridges or the adoption of a more-comprehensive congestion pricing system. Altering the tax and fee structure for taxicabs and for-hire vehicles in the MTA region could generate revenue through a new tax or fee or by earmarking the revenues from existing taxes or fees for the MTA.
CBC has urged adoption of a mileage-based user fee , also known as a vehicle-miles traveled (VMT) tax, which would better reflect the actual use of roads and bridges than motor fuel taxes, particularly as vehicles become more fuel efficient. With the use of GPS technology, a VMT fee can be used to more accurately price a road’s use according to its congestion.
Funding Stabilization and Ongoing Operations
The stabilization plan presented by the MTA Chairman last month is sensible and ambitious. The plan includes $380 million in new capital investments, a one-time cost that can be funded from the current capital plan, and $456 million in recurring operating costs, the bulk of which will support the hiring of 2,700 permanent new workers.
The Chairman suggested these costs be split evenly between two entities: the State and the City. This is a false choice. Neither the City nor the State is a person with a checking account. The MTA is asking taxpayers—most of them New York City residents—to foot the bill.
In 2016 the City contributed approximately $835 million in operating subsidies for the MTA, $229 million in capital contributions, and $142 million in debt service on bonds issued by a City-sponsored authority to pay for the extension of the 7 train to Hudson Yards. Residents and businesses that pay local taxes to support this direct contribution also pay a large share of the regional and statewide taxes the State allocates to the MTA. A conservative estimate is that New York City residents and firms pay approximately three-fourths of regional taxes—$3.4 billion of $4.6 billion in 2016—and approximately 45 percent of statewide taxes—$538 million of $1.1 billion in 2016. These “City” contributions total $4.7 billion, in contrast to the $2.1 billion paid by taxpayers outside the city.
Instead, fair division of the responsibility for these additional, ongoing operating expenses should rest on the region’s motor vehicle users and the MTA and its workforce.
I have already explained CBC’s argument for an increase in motor vehicle cross-subsidies so I will forgo additional discussion at this time. In addition, the MTA and its workforce should more aggressively pursue efficiencies at the agency to make the stabilization plan self-sustaining. A cooperative arrangement between MTA management and the Transport Workers Union, the representative for most of New York City Transit’s workforce, could provide significant productivity savings to help cover the cost of the added workers. Examples of potential savings include altering night shift differentials, which would reduce the cost of maintenance in the expanded Fasttrack program, and use of “split shifts” for operators and conductors to reduce subway operating costs.
The Mayor’s recent proposal is not consistent with CBC’s funding framework for mass transit services. Taxpayers, particularly New York City taxpayers, already subsidize the MTA more than they should. Approximately 40 percent of the mass transit budget is funded by taxpayer subsidies; of this, nearly three-fourths comes from individuals and firms in New York City.
The discussion around this proposal is constructive in that it invites serious consideration of the MTA’s long-term needs. However, the funding stream or streams to support these long-term needs ought to come from motorists, either from congestion pricing or other charges for motor vehicle use.
To the extent that the Mayor is now endorsing half-price MetroCards for low income individuals—a policy that CBC has previously endorsed—such a program does not require a new tax, and should be funded with existing City resources.
Thank you. I welcome the opportunity to answer any questions.
Download Testimony
Like what you're reading? Subscribe to our e-alerts to stay up-to-date on new publications and the latest insights from CBC!
Thank you for visiting nature.com. You are using a browser version with limited support for CSS. To obtain the best experience, we recommend you use a more up to date browser (or turn off compatibility mode in Internet Explorer). In the meantime, to ensure continued support, we are displaying the site without styles and JavaScript.
- View all journals
- My Account Login
- Explore content
- About the journal
- Publish with us
- Sign up for alerts
- Open access
- Published: 17 June 2021
Neighborhood-level disparities and subway utilization during the COVID-19 pandemic in New York City
- Daniel Carrión ORCID: orcid.org/0000-0001-6284-1508 1 ,
- Elena Colicino ORCID: orcid.org/0000-0002-1875-8448 1 ,
- Nicolo Foppa Pedretti 1 ,
- Kodi B. Arfer 1 ,
- Johnathan Rush ORCID: orcid.org/0000-0002-6853-8494 1 ,
- Nicholas DeFelice 1 , 2 &
- Allan C. Just ORCID: orcid.org/0000-0003-4312-5957 1 , 2
Nature Communications volume 12 , Article number: 3692 ( 2021 ) Cite this article
7844 Accesses
35 Citations
92 Altmetric
Metrics details
- Risk factors
- Social sciences
The COVID-19 pandemic has yielded disproportionate impacts on communities of color in New York City (NYC). Researchers have noted that social disadvantage may result in limited capacity to socially distance, and consequent disparities. We investigate the association between neighborhood social disadvantage and the ability to socially distance, infections, and mortality in Spring 2020. We combine Census Bureau and NYC open data with SARS-CoV-2 testing data using supervised dimensionality-reduction with Bayesian Weighted Quantile Sums regression. The result is a ZIP code-level index with weighted social factors associated with infection risk. We find a positive association between neighborhood social disadvantage and infections, adjusting for the number of tests administered. Neighborhood disadvantage is also associated with a proxy of the capacity to socially isolate, NYC subway usage data. Finally, our index is associated with COVID-19-related mortality.
Neighborhood characteristics associated with COVID-19 burden—the modifying effect of age

Impacts of social distancing policies on mobility and COVID-19 case growth in the US

Socio-spatial inequality and the effects of density on COVID-19 transmission in US cities
Introduction.
The 2019 novel coronavirus (SARS-CoV-2) was first detected in Wuhan, China, and has since become a worldwide pandemic. In the United States, given the nature of this novel infectious disease, anyone exposed to the pathogen was believed susceptible to infection. By the Spring of 2020, there were no proven pharmacologic treatments, and limited testing capacity contributed to a poor understanding of viral transmission. Pre-existing conditions are known risk factors of disease severity, and mortality increases sharply with age 1 . Consequently, the United States federal, state and local governments have principally relied on non-pharmaceutical interventions such as social distancing and mask-wearing. New York State (NYS) on PAUSE is one such effort, whereby essential workers, i.e., healthcare workers, food purveyors, bank tellers, etc., were the only employees that should be reporting to work. We examine the association between social factors, such as employment and commuting patterns, population density, food access, socioeconomic status and access to healthcare, and area-level infection rates.
It has been widely noted in popular media and emerging scientific evidence that COVID-19 is taking a disproportionate toll on communities of color 2 , 3 , 4 , 5 . For example, in Chicago, as the outbreak first unfolded, Black people comprised 70% of early COVID-related deaths, but only 30% of the population 5 . In New York City (NYC), Hispanics and LatinX people, and Black people were disproportionately impacted, with mortality rates of 264 and 249 per 100,000 respectively, compared to 124 for white people 5 . While differences in disease severity are likely attributed to higher levels of preexisting conditions, i.e., health disparities 6 , this does not explain differences in disease incidence. A survey of laboratory-confirmed hospitalized cases across 14 states in March 2020 found that where race or ethnicity was reported, that 33.1% of hospitalized patients were non-Hispanic Black people 7 . In NYC, as of 13 May 2020, the cumulative incidence of non-hospitalized positive cases were 798.2, 684.8, and 616.0 per 100,000 for Black/African American, Hispanic and LatinX, and white people respectively 8 .
A body of literature on the social determinants of health suggests that there are numerous inequities that provide the scaffolding for increased COVID-19 infection rates in communities of color. Racism operates on both the interpersonal and structural levels, the latter explaining the societal mechanisms that reinforce inequality, including through housing, employment, earnings, benefits, health care, criminal justice, etc. 9 . Those structural forms of social disadvantage are responsible for many of the health disparities we observe in communities of color 10 .
Researchers have outlined the ways in which residential segregation and structural disadvantages lay the groundwork for racial disparities in infectious diseases 11 . More recently, others have noted that social distancing is more difficult for communities of color 5 . Taken together, this literature highlights the social mechanisms that may facilitate viral spread in communities of color. The underlying structural disadvantages relevant to the current coronavirus pandemic might include that people of color (POC) are more represented amongst low-wage jobs 12 , many of which are now deemed essential 13 . When they get home from work, they are more likely to return to densely populated homes and neighborhoods 14 . Further, due to structural or cultural factors, multigenerational homes are more common in communities of color 15 , which makes social distancing between least susceptible (healthy children) and most susceptible (older adults with chronic conditions) difficult. POC often live further from supermarkets and sources of nutritious foods, necessitating further travel for groceries 16 . These factors, among others, underscore the many ways that the capacity to social distance may be contextual and based on structural factors.
In this population-level study, we use socioeconomic data on neighborhood characteristics to understand differences in infection incidence between neighborhoods, as we quantify the relative contribution of these measures of social disadvantage and if a proxy of social isolation, NYC subway utilization, helps us to understand these differences. We create a ZIP code level COVID-19 inequity index for NYC, a composite measure of neighborhood-level disadvantage trained on infection rates, and show how this index explains racial/ethnic disparities in cases, thus reflecting structural forms of disadvantage. Finally, we examine the relationship between the inequity index and neighborhood-level COVID-19 mortality. Ultimately, we create a tool that identifies social factors that are associated with viral spread, and therefore, may be useful throughout the US to pinpoint potential areas for targeted public health intervention. The inequity index was designed to understand the relationship between social inequality and neighborhood infection rates during the first wave of the COVID-19 pandemic in New York City. All results are associational and based on population-level, rather than individual-level, data. It is a retrospective tool, and, in its current form, may be used in scientific research for studies with contemporaneous and co-located data. The inequity index cannot, and was not intended to, predict dynamic infection rates or spatial clusters. We caution users of the index to avoid applications that stigmatize neighborhoods or their residents.
Cross-sectional COVID-19 inequity index
We wanted to identify an association between a neighborhood social disadvantage composite index and cumulative COVID-19 viral swab-confirmed infection incidence. There were 174,614 positive tests across 177 NYC modified ZIP Code Tabulation Areas (ZCTAs) as of May 7, 2020. Kendall’s tau correlations between social disadvantage variables ranged from −0.15 to 0.61 (Supplementary Fig. 1). Kendall’s tau correlation tests were also conducted between each variable and the infection incidence (Supplementary Table 1 ). Our a priori hypothesis was that increased disadvantage is associated with higher infections, so we transformed variables that had univariate negative associations with the outcome to aid in interpretation. Median income was transformed using its reciprocal, and for proportion-based variables, we used 1—the value.
The BWQS regression analysis identified evidence of an association between our composite variable of ZCTA-level neighborhood social disadvantage (on a ten-unit scale) and the number of infections per 100,000 (Fig. 1 ) when adjusted for a smooth function of ZCTA-level testing (Supplementary Fig. 2). We found that each unit increase in disadvantage is associated with an 8% increase in infections per capita (risk ratio: 1.08; 95% credible interval: 1.06, 1.09), and the BWQS regression had an overall Bayesian R 2 of 0.93 (95% credible interval: 0.92, 0.95) 17 with no significant difference of the observed residuals from the expected distribution (Supplementary Fig. 3). All ten included variables contributed to the composite COVID-19 inequity index, but they did not all contribute equally (Fig. 2 and Supplementary Table 2 ). We interpreted the point estimates of the weight assigned to the social variables, noting that the credible intervals of the variable weights overlap with one another. We found that the proportion of uninsured people in a ZCTA is the single largest contributor to the impact of social disadvantage on infections, followed by the average number of people in a household and the proportion of the population who are essential workers using personal vehicles to commute. The proportion of uninsured people and the average household size had the highest weights in 39 and 25% of model iterations respectively (Supplementary Table 3 ). The population density and the median income are also relatively informative compared to the other variables. Since the BWQS has never been applied to social or infectious disease epidemiology, we compared it to two other approaches: (1) a model with only the proportion of essential workers and the median income, and (2) a principal component regression of all ten social variables. The BWQS yielded a smaller root mean squared error and a higher Kendall’s tau rank correlation of ZCTAs expected versus observed infections per capita, though the BWQS is a more complex approach (Supplementary Table 4 ). We also assessed the sensitivity of our results to the selection of alternative priors for our overdispersion parameter and found negligible differences in the coefficients and widely applicable information criterions (WAICs) using half-Cauchy or inverse gamma distributions.

The unit of analysis is ZCTA ( n = 177). The fitted line and gray ribbon represent the BWQS negative binomial regression line and its 95% credible interval, holding the testing ratio constant at the median. Marginal histograms represent the distribution of the variable on each axis. Source data are provided as a Source Data file.

The unit of analysis is ZCTA ( n = 177). The BWQS weights the explanatory variables by their relative contribution to the composite index, between 0 and 1. The mean weights sum to 1 and are organized into conceptual domains and ordered by mean weight. Points represent the mean weights and lines represent 95% credible intervals. Source data are provided as a Source Data file.
ZCTAs are often not ideal for health-based research, as they may combine heterogeneous neighborhoods with large variation in social phenomena 18 . Infection and mortality data is only publicly available at the ZCTA level, but it is possible that sub-ZCTA geographies more adequately capture the relationship between social disadvantage and infection rates. Given that the mean of each social variable across the entire ZCTA may mask underlying disparities and the social conditions of the more disadvantaged neighborhoods, we repeated our analyses after estimating the median and third quartile of the social variables under study for each ZCTA population using the American community survey (ACS) data from underlying census tracts ( n = 2167 within NYC). Results showed consistency in the effect estimates and small but notable improvements in the WAIC, Bayesian R 2 , and RMSE (Supplementary Table 5 ). We proceeded with the ZCTA-level analysis for ease of interpretation, using ZCTA-level data for the exposure and outcome data.
The spatial distribution of the COVID-19 inequity index largely mirrors that of infections in NYC (Fig. 3 ). We examined the population demographics of neighborhoods according to their COVID-19 inequity index (Fig. 4 ). The data shows that Black people have the highest population-weighted mean index and white people have the lowest. Examining these distributions by quantile of the COVID-19 inequity index shows that white populations are overrepresented in ZCTAs in the lower quartile of the COVID-19 inequity index (<25th percentile) and underrepresented in the upper quartile of inequity index (>75th percentile) ZCTAs (Supplementary Fig. 4). While white people comprise approximately 32% of NYC’s population, they only make up 10% of high inequity index ZCTAs. Conversely, Black people and Hispanic, LatinX people are 22 and 29% of NYC’s population and 30 and 43% of high index areas respectively.

The unit of analysis is ZCTA ( n = 177). a Shows the constructed COVID-19 inequity index based on weighted social determinants trained on ( b ) reported cases of SARS-Cov-2 infections as of May 7, 2020. c Shows the ZCTA-level mortality per 100,000 as of May 23, 2020. Base map and data from OpenStreetMap and OpenStreetMap Foundation. Source data are provided as a Source Data file.

The COVID-19 inequity index varied by race/ethnic categories according to the 2018 ACS. Density plots are population-weighted to demonstrate the relative abundance of representation according to ZCTAs and their corresponding COVID-19 inequity index and ordered by the population-weighted mean index. Source data are provided as a Source Data file.
Capacity to social distance
We used area-level subway ridership as a proxy for the capacity to socially distance, and to examine differences in ridership by our COVID-19 inequity index, thus representing a possible mechanism between neighborhood disadvantage and infections. Given that neighborhood disadvantage is spatially heterogeneous, associated ridership differences may indicate places where individuals were less able to socially distance themselves due to being an essential worker, not having access to a car, etc. We found that capacity to social distance appears lower in higher COVID-19 inequity index areas, as indicated by the most important variables in our BWQS regression analysis. To assess whether or not this was true using longitudinal data, we decided to model differences in subway utilization by united hospital fund areas (UHFs) in NYC. We only included the 36 UHFs with the most consistent data quality and that had subways present (Supplementary Fig. 5). In order to identify the proper functional form of our nonlinear model, we fit it on the mean sigmoidal decay of subway utilization across all of NYC (Supplementary Fig. 6). We then compared this model to two models, split by UHF-level population-weighted COVID-19 inequity index (Fig. 5 ). A partial F -test demonstrated that the models split by COVID-19 inequity index categories (above versus below the median) were a significantly better fit than one combined model ( p < 0.0001).

The nonlinear model was fitted using a generalized Weibull equation with two curves: high (above median) and low (below median) COVID-19 inequity index at the UHF neighborhood level ( n = 36). Daily subway ridership is relative to 2015–2019. The dashed line represents the start of NYS on PAUSE social distancing policies. Ridership is shown between 16 February 2020 and 30 April 2020. Source data are provided as a Source Data file.
The separate models indicate that there is little difference between slopes for the high (−5.6% per day; 95% CI: −6.0, −5.3%) versus low (−6.2% per day; 95% CI: −6.5, −5.8%) COVID-19 inequity index areas (Table 1 ). However, the lower asymptote of subway utilization under social distancing policies is higher for high inequity index (16%; 95% CI: 15.3, 16.7%) areas compared to low-risk inequity index areas (9.5%; 95% CI: 8.9, 10.1%). This implies that high risk and low index areas had similar relative rates of decreased subway utilization upon news of the pandemic, e.g., school closures, etc. However, high COVID-19 inequity index neighborhoods had higher relative use of the subway system after official social distancing policies (NYS on PAUSE) went into effect. These trends were consistent when we modeled 3 risk groups at the UHF (Supplementary Fig. 7) and ZCTA levels (Supplementary Fig. 8). Overall subway utilization followed similar trends to other measures of transportation, including Google’s transit data (see Supplementary Fig. 9).
Mortality related to the COVID-19 inequity index
There were 16,289 COVID-related deaths across 177 ZCTAs by May 23, 2020. NYC DOHMH surveillance data show that race/ethnic disparities are greater for COVID-19 mortality than for SARS-Cov-2 infections. Therefore, we wanted to assess whether our index that captures neighborhood disadvantage in relation to infection was also related to ZCTA-level mortality. Results from the negative binomial model show a strong association between the ZCTA COVID-19 inequity index and cumulative COVID mortality incidence (Table 2 ). This regression model employed a spatial filtering approach to account for potential spatial autocorrelation at the ZCTA level. We found that each unit increase in the COVID-19 inequity index is associated with a 20% increased risk of COVID-related mortality (relative risk: 1.2; 95% CI: 1.16, 1.23) when accounting for spatial dependence. Spatial autocorrelation of residuals was small in magnitude (Moran’s I: 0.05) and non-significant ( p value: 0.08). See Supplementary Fig. 10 for a map of the residuals.
We conducted an ecological study using publicly available data to identify associations between neighborhood social disadvantage on cumulative COVID-19 infections and COVID-19-related mortality in NYC over 9 weeks after the first COVID-19 case was identified in spring 2020. The COVID-19 inequity index was also used to understand differences in social distancing, as measured by subway ridership. In creating our COVID-19 inequity index, we found that a combination of social variables, indicative of social disadvantage, is associated with cumulative infections and mortality. Black communities and Hispanic, LatinX communities are overrepresented in high COVID-19 inequity index neighborhoods, and white people are overrepresented in low COVID-19 inequity index neighborhoods, which may represent structural forms of racism. When examining differences in the capacity to socially isolate, we found that high index neighborhoods had higher subway ridership during NYS-mandated social distancing. Finally, our COVID-19 inequity index is also associated with cumulative COVID-19 mortality at the ZCTA level. This implies that the same social factors that inform increased disease risk are also associated with severe outcomes, either directly or through intermediates.
A growing body of literature is examining the greater impact of COVID-19 based on measures of neighborhood structural disadvantage. As some have noted, COVID-19 is not creating new health disparities, but exacerbating those that already exist 2 . A recent investigation found that county and ZCTA area-based socioeconomic measures, specifically using crowding, percent POC, and a measure of racialized economic segregation, were useful in identifying higher COVID-19 infections and mortality in Illinois and New York 19 . Work on COVID-19 mortality in Massachusetts has found excess death rates for areas of higher poverty, crowding, proportion POC, and racialized economic segregation 19 . There has been some concern that neighborhood disadvantage and case positivity associations could be confounded by access to testing, with advantaged communities having more access than lower 20 ; however, Schmitt-Grohe et al. found no evidence of testing inequalities by income, and a small negative association when also including the proportion of Black people 21 . An analysis examining spatial patterns of infections found that ZCTAs with high proportions of Black residents and residents with chronic obstructive pulmonary diseases (COPD) were the most likely to experience the highest COVID-19 infection rates 22 . We know of three other studies that have tied neighborhood-level disadvantage to mobility (via cellphone data) 20 and subway utilization 23 , and mobility data with COVID-19 infections 20 , 23 , 24 . Researchers have begun to identify counties that are particularly susceptible to severe COVID-19 outcomes using a combination of biological, demographic, and socioeconomic variables 19 . They identified counties with high population density, low rates of health insurance, and high poverty as particularly at risk. However, a stated limitation of this work is that many of these variables are interrelated.
Our study has many strengths. First, we acknowledge and address the strong interrelation of social variables by using a data-driven method for modeling mixtures of exposures: BWQS, while flexibly adjusting for the intensity of testing. By using this method, we create a composite index that captures the combined effect of the constituent variables after a quantile transformation that makes our model more robust to extreme values. This process is also supervised, meaning that the variables are not weighted equally in the composite index, but instead, the approach empirically learns their individual contributions to explaining the outcome. The appeal of an index is both summative and contextual. The composite index can be used to direct outreach and testing (such as mobile testing units) regardless of the components most driving the index value in each geographic unit. Also, index weights can be used to inform the types of interventions targeted to specific neighborhoods. In NYC, COVID-19 positive residents could stay in hotels for two weeks until they were no longer contagious, but it is unclear if this was a targeted intervention. Our index helps contextualize the unique combination of social conditions per ZCTA that relate to ZCTA-level infections for targeting interventions (e.g., in ZCTAs with the higher average number of people per household, then rapid testing could be paired with outreach for hotel isolation). The second strength of our study is that our approach largely relies on ACS data, which is available across the USA, and may allow for the identification of other communities nationwide that are particularly vulnerable to future outbreaks or even other novel respiratory pathogens. Third, we explicitly excluded race and ethnicity from the creation of the index because we were more interested in identifying social processes associated with infection rates, rather than those that may imply biological or behavioral explanations to health disparities 25 . The theory underlying these relationships is that structural racism increases the proportion of POC in areas of high disadvantage, and those structural forms of disadvantage facilitate pathogen spread. To demonstrate this, we employed the index to understand neighborhood differences in the capacity to social distance. This finding provides additional evidence that low-income communities and communities of color may be less able to socially distance 5 . Fourth, our spatial analysis of COVID-19-mortality shows that the COVID-19 inequity index may not only be useful in identifying infection risk, but also a risk of severe outcomes. Finally, our data sources and analysis code are publicly available, which we believe is one of few among comparable COVID-19 disparities analyses 24 . This means that others can (1) reproduce these analyses, (2) expand on the work by assessing different modeling strategies, and (3) assess the utility in other parts of the country.
This study also has notable limitations. First, we were unable to identify a measure of multigenerational housing at the ZCTA level, which may represent a pathway for infection, and potentially severe disease. Second, by not including race in our models, we may be missing an opportunity to tune these models to the impacts of interpersonal and structural forms of racism 26 . Third, infection data are based on viral swab-confirmed cases, and early testing protocols in NYC were largely limited to hospitalized individuals, therefore those with more severe disease 8 . Consequently, ZCTA infection data may be confounded by the distribution of factors that drive disease severity. We addressed this by adjusting our BWQS regression for the amount of overall testing per ZCTA. Relatedly, for our spatial analysis of COVID-mortality, we were unable to access a ZCTA-level measure of chronic diseases. Since communities of color have higher rates of chronic disease at younger ages 27 , and chronic diseases increase the likelihood of severe COVID-19 outcomes, this is an important challenge. However, because social disparities are a major contributor to differences in the chronic conditions that increase the likelihood of severe disease, we did not want to adjust for an effect modifier. Instead, we adjust for spatial autocorrelation to account for residual risk factors that are more similar in nearby neighborhoods. Fourth, we use pre-pandemic social variables derived from the 2018 ACS and thus do not directly account for variation in residential mobility during NYS on PAUSE, i.e., those who fled to their second homes 28 . However, this should be captured, in part, by median income and other measures of affluence in our COVID-19 inequity index. Fifth, our analysis of public transit only utilized data from subway turnstiles, but not bus ridership. Although buses are an important form of transit in NYC, especially in the outer parts of the boroughs, the MTA does not provide time-varying ridership data. Further, buses were made free during the pandemic, so accurate ridership data are likely unavailable to the NYC government as well 29 . Sixth, the BWQS method has never been applied to social/infectious disease epidemiology, although it has been successfully used in environmental epidemiology, which has similar issues of correlated multi-dimensional exposures 30 , 31 . Seventh, this study uses ZCTAs as our administrative unit of analysis. There is likely greater demographic heterogeneity in some ZCTAs compared to others, and few health-related decisions are made on this level. However, the NYC and NYS DOH has only released data at this scale, thus limiting our ability to examine relationships at varying spatial scales. We assessed the sensitivity of our results to using tract-level data to estimate our ZCTA-level exposure metrics and found consistent results. Finally, an unfortunate potential consequence of creating a COVID-19 inequity index is the possibility of stigmatization of neighborhoods with high index values 25 . This is not our intention, and hopefully not the effect, as our goal is to identify social factors associated with viral spread and demonstrate that uniform mandates on social distancing to avoid exposure are not equally observable by all populations within NYC.
Our work focused on the social conditions that are associated with uneven exposure to SARS-CoV-2, and higher infections, for disadvantaged communities in the spring of 2020. Since then, this situation has been compounded by national interventions that do not appear to be yielding equitable outcomes. For example, the federal Paycheck Protection Program is largely not accessible to minority-owned businesses 32 and bias has been found in the disbursement of Coronavirus aid, relief, and economic security act funding, with hospitals in predominantly Black communities receiving fewer dollars on average 33 . These examples underscore an important reality; addressing health inequities requires explicit identification of disparities, their derivation, and creating interventions designed for equitable outcomes. This is essentially the strategy behind the National Academies of Sciences, Engineering, and Medicine’s Consensus Report on the allocation of COVID-19 vaccinations, which proposes targeted distribution based on measures of social vulnerability 34 . Consequently, we believe that tailored health and social equity initiatives represent an important path forward for COVID-19 pandemic response and planning.
In this study, we created a neighborhood measure of social disadvantage that is specifically tuned to the impacts of COVID-19 infections and mortality in NYC and we show that this measure is associated with the capacity to socially distance, which may represent an important pathway for COVID-related health disparities. This is an important area of investigation given the large toll that COVID-19 has had, and will likely continue to have unless action is taken, on disadvantaged communities of color in NYC and elsewhere. Future work should assess the generalizability of these results in other parts of the country, new waves of the pandemic, or if our approach can be adapted to different contexts, potentially yielding regionally tuned sets of social variables that are associated with increased COVID-19 inequities.
Data sources and cleaning
SARS-CoV-2 testing and COVID-19 mortality data. The NYC Department of Health and Mental Hygiene (NYC DOHMH) has been publicly releasing daily testing data (positive and total tests) at the patient’s home ZIP Code Tabulation Area (ZCTA) level since April 1, 2020, and COVID-19 related mortality data since mid-May, both available on GitHub 35 . The NYC DOHMH utilizes modified ZCTA geographies, designed to still be mergeable to the Census Bureau ZCTA designations. Our analyses relied on pre-pandemic demographic data to describe variation in neighborhood-level disease burden after much of the community had the potential for exposure. Since spatiotemporal infection patterns were highly variable at the beginning of the pandemic in relation to many independent viral introductions within NYC 36 , we estimated cumulative infections on 7 May 2020, 4 weeks after NYC’s peak infection period. We estimated the time from symptom onset to death as 16 days 35 . Therefore we chose 23 May 2020, for our cumulative COVID-19 mortality analysis. This analysis is not human subjects research as it did not include any intervention or interaction with individuals or any identifiable private information.
Census data. We downloaded the Census Bureau’s 2018 ACS data via the tidycensus R package 36 . Data were collected for the 214 ZCTAs in NYC and summarized to the 177 modified ZCTAs that NYC DOHMH reported. Variables included: the total population, number of households, median income, median rent, health insurance status, unemployment, individuals at or below 150% of the federal poverty level, race and ethnicity, industry of employment, and mode of transportation to work. A full list of variables is provided in Supplementary Table 6 . We created a proxy for the proportion of individuals in essential worker positions using industry of employment variables. This estimate of essential workers was a sum of those who reported employment in the agricultural, construction, wholesale trade, transportation and utilities, and education/healthcare industries, divided by the total working-age population. To account for teachers mostly working from home, and healthcare workers being essential, we included only half of the education/healthcare industry respondents. From these data, we also estimated the average housing burden by dividing the average rent by median income and the household size by dividing the total population by the number of households. We utilize race and ethnicity according to the following categories: Non-Hispanic Asian, Non-Hispanic Black, Non-Hispanic white, Hispanic/Latino of any race, and aggregate all other races into Other people.
Residential buildings and food access data. We calculated the volume of residential space by merging the NYC building footprints dataset and the primary land use tax lot output dataset. We divided residential volume by total population to calculate mean residents per residential volume, a metric of residential population density. Food access was used as a measure for the likelihood that individuals need to leave their neighborhoods for basic necessities. We estimated food access using data from New York State’s Open Data portal for retail food stores. Businesses were restricted to J, A, and C establishment code designations in order to identify those most likely to provide fresh foods and produce, and then manually removed any business names that indicated being a corner store or pharmacy, or primarily selling alcohol/tobacco. The remaining stores had 1034 unique addresses, and we were able to geocode 997 of these to point locations. We spatially joined the point locations to our ZCTA shapefile and divided them by the total Census population to calculate a “grocers per 1000 people” variable as a proxy for food access.
Mobility and transit data. The metropolitan transit authority (MTA) of NYC releases subway utilization data on a weekly basis. These data include the number of entrances and exits per station. For each day and geographic area, we summed all system entrances and exits. To account for typical usage of the subway each month and day of the week, we divided the total turnstile count for each day and area by the median daily count on the same day of the week within the same month throughout the period 2015–2019.
Quantitative analyses
Cross-sectional COVID-19 inequity Index. Socioeconomic variables are known to be closely correlated with one another, which is a challenge to model fitting and interpretation of the underlying latent relationship. Researchers have often addressed the multicollinearity of social determinants with the use of dimensionality reduction techniques such as principal components analysis (PCA) in the case of the neighborhood deprivation index 37 . However, traditional PCA only considers correlations between SES variables, whereas a supervised method captures features most relevant for the outcome. To address these shortcomings, we developed a weighted combination of socioeconomic variables to explain the cumulative number of COVID-19 cases per ZCTA using Bayesian weighted quantile sums regression (BWQS) 30 (see Supplementary Methods for model notation and description). Candidate demographic variables for the COVID-19 inequity index from the ACS included average household size, income, rent, households using supplemental nutrition assistance program (SNAP) benefits, poverty, health insurance, unemployment, and industries of employment. Derived variables from ACS data included average rent burden and household size. Non-ACS variables included the population density (persons per square foot of the ZCTA) and residential population density (persons per cubic foot of ZCTA residential volume). Our choice of variables is largely influenced by the theoretical framework from Acevedo-Garcia 11 and our understanding of the employment sectors deemed essential workers, and therefore less able to stay home during a time of social distancing. Our measures of population density attempt to capture (in)ability to physically distance within the home and otherwise dense housing conditions such as apartment buildings versus single-family homes, and therefore higher risk of contact with infected individuals. Finally, SNAP benefits and measures of food access are included to indicate further travel from home for basic necessities and/or less opportunity to amass food reserves to reduce the overall frequency of shopping. We restricted candidate variables to those that would be realistically publicly available or accessible in other parts of the United States. A directed acyclic graph of the proposed relationship between variables is depicted in Supplementary Fig. 11.
The BWQS distinguishes two groups of predictors. In one group, which comprises our socioeconomic variables, the predictors are transformed into quantiles using the empirical cumulative distribution function to limit the influence of outliers and multiplied by ten to allow the COVID-19 inequity index to range from [0, 10). The variable weights are forced to lie in [0, 1] and sum to 1 with a uniform Dirichlet prior. We included a large candidate list of socioeconomic variables in the BWQS, and all posterior probability distributions were estimated leveraging a Hamiltonian–Monte Carlo algorithm, which is an efficient algorithm for reducing correlation between sample states and improving the stability of the variable weight estimates. Model diagnostics were monitored to evaluate chain convergence and appropriateness of fit for each parameter. Quantile residuals were constructed using posterior draws for diagnostics and visualization 38 . Our final list of variables was based on an iterative process according to: (1) maximizing model fit and penalizing complexity, measured by the WAIC, (2) removing one variable when bivariate correlations were high (|τ| ≥ 0.9), and (3) our understanding of underlying social processes in relation to infectious disease. The other group of variables in a BWQS regression is the covariates, which in our case consist solely of a natural spline smoother (3 degrees of freedom) for the testing ratio (the total number of reported tests divided by the population per ZCTA). We included this to account for variation in disease surveillance. The predictor is untransformed and the coefficients are less constrained, using a normal prior with mean 0 and SD 100. A negative-binomial distribution is used for the dependent variable: the cumulative number of positive SARS-CoV-2 tests per 100,000 people. The resulting weighted index was our COVID-19 inequity index. We compared the results of the BWQS model to two other approaches. First, we conducted a negative binomial regression with median income and percent uninsured, adjusting for the testing ratio using a natural spline. Second, we conducted a PCA of the same ten social variables in the BWQS. We took the first component (explaining 41.6% of the variance) and included it in a negative binomial regression, adjusting for the testing ratio using a natural spline. The model predictions were compared to the BWQS results using the mean absolute error and Kendall’s tau metrics. Kendall’s tau was specifically used to assess the rankings of infections per capita between ZCTAs, as that would likely be more important to public health practitioners needing to prioritize interventions.
We visualized the distribution of the COVID-19 inequity index values by self-reported race/ethnicity as per the ACS categories and total population. We also separate the inequity index values into three categories: below the 25th percentile, between the 25th and 75th percentiles, and above the 75th percentile. Populations were aggregated by race/ethnicity and then divided by the total population of the associated ZCTAs.
Robustness of ZCTA-level measures. ZCTAs vary in size (populations from 3028 to 112,425 from the 2018 ACS) and may combine heterogeneous neighborhoods with large variations in social variables. To evaluate whether the ZCTA-level summary (mean) of social variables we used in constructing our COVID-19 inequity index adequately captures the population distribution, or whether infection rates for a ZCTA population is more closely related to the social variables of those who are more disadvantaged within that ZCTA, we also estimated the median and third quartile of the social variables understudy for each ZCTA population using ACS data from census tracts ( n = 2167 within NYC). Given the many-to-many relationship of non-aligned ZCTAs and census tracts, we estimated weighted quantiles of each of our social variables using the June 2020 HUD crosswalk tables 39 that attribute the proportion of residential households in each ZCTA living within each overlapping census tract reweighted by the average household size.
Model description for BWQS regression. Here we provide a description of BWQS regression when the outcome variable \(Y\) has a negative binomial density distribution. The formulation of the negative binomial density distribution is:
where \(\mu \in {R}^{+}\) , \(\phi \in {R}^{+}\) and \(y\in N\) .
The mean and variance of a random variable \(Y\sim {NB}\left({y|}\mu ,\phi \right)\) are:
We included the negative binomial distribution with \(\eta ={\log }\left(\mu \right)\) where \(\eta \in R\) in the BWQS regression framework, so that the BWQS regression model has the following form:
where \({\beta }_{0}\) is the intercept; \({\beta }_{1}\) is the coefficient mapped to the COVID-19 inequity index of \({N}_{C}\) mixture components previously transformed into quantiles and multiplied by ten \((q)\) ; \({BWQS}\) index is \({\sum }_{j=1}^{{N}_{C}}{w}_{j}{q}_{{ij}}\) with weight \({w}_{j}\) for the \(j\) -th mixture component; and \(\underline{\delta }\) is a vector of coefficients mapped to the \({N}_{k}\) covariates \({\boldsymbol{X}}\) which in our model is a natural spline basis transformation of the testing ratio.
The choice of the prior of the model is based on prior literature, the prior definition of the BWQS regression, and their properties of being conjugate:
The Dirichlet distribution \({Dir}\left({\boldsymbol{\alpha }}\right)\) is a multivariate generalization of the Beta density distribution and it belongs to a family of continuous multivariate probability distributions parameterized by a vector \({\boldsymbol{\alpha }}\) .
The \({\boldsymbol{\alpha }}\) vector has the characteristics of the multinomial parameter, i.e., the components of the \(\alpha \) vector ( \({\alpha }_{i}\) for all \(i\) -th component) are positive reals and the sum of all components is equal to 1 ( \({\sum }_{i=1}^{I}{\alpha }_{i}\) =1). This second characteristic implies that the estimates of all parameters are not independent, similarly to what we have with the multinomial distribution. For these characteristics, the Dirichlet distribution is commonly used as the prior for the multinomial distribution.
The Dirichlet distribution is also widely used as prior distribution because of its property of being conjugate, which means that the posterior distribution will be a Dirichlet with parameters α different from initial values. For this reason, this distribution has an easy computation and facilitates quantification of how much the prior beliefs have changed after including data in the model. In our case the Dirichlet is parametrized by a parameter vector \({\boldsymbol{\alpha }}=\left({\mathrm{1,1}},\ldots ,1\right)\) , which assumes a uniform density distribution across the domain, implying a non-informative prior for all weights. Changes in the \({\boldsymbol{\alpha }}\) parameter vector suggest stronger assumptions about the importance of each variable, which we do not have a priori. In other words, the \(\alpha \) parameter vector rules the shapes of the distribution; \({\alpha }_{i}=1\) assumes uniform distribution across the domain of the \(i\) th mixture component, implying no prior information about its contribution to the overall mixture. The full BWQS package is available on GitHub: https://github.com/ElenaColicino/bwqs .
Alternative priors for the overdispersion parameter \(\phi \) include a half-Cauchy distribution or an Inverse-Gaussian distribution. While we chose minimally informative priors, we also conducted a sensitivity analysis in which we used a half-Cauchy (0, 3) distribution for the overdispersion parameter instead of the Inverse-Gamma (0.01, 0.01) in our main model, ultimately comparing the resulting coefficients and WAICs.
Capacity to social distance. Our BWQS model uses cross-sectional data to create a COVID-19 inequity index, but we wanted to assess the degree to which those differences in infections were explained longitudinally by the inability to socially isolate/distance. We could not assess this directly, so we chose to look at subway ridership in relation to the COVID-19 inequity index. We utilized MTA transit data as a proxy for social distancing since public transit utilization during this time period may reflect conditions that contribute to greater exposure risks, including essential work and less ability to socially distance. Subway stations are in a fraction of NYC ZCTAs, and individuals often traverse ZCTAs to get to a station, so we aggregated subway utilization to 42 UHF neighborhoods. UHF neighborhoods are composed of adjacent ZCTAs approximating community districts. Aberrantly low utilization observations (<10%) in February and early March 2020 were removed when explained by planned weekend service changes—specifically those in low subway density areas. We computed a population-weighted COVID-19 inequity index per UHF.
We modeled change in relative subway usage leading up to, and during, the NYS on PAUSE period. Relative subway utilization is a proportion, therefore the transition from business-as-usual to social distancing roughly followed a sigmoidal decay. A mean nonlinear response can be modeled by nonlinear least-squares when a functional form is specified, as implemented by the drc R package 40 . We utilized a generalized Weibull formula, which took the following functional form:
where c is the lower asymptote, d is the upper asymptote, b is the slope, time index is the transformation of the date as an integer, e is the inflection point of the function, and relative use is the proportion of subway ridership. We fit two models, one for neighborhoods with a COVID-19 inequity index at or below the median and one for those above the median. We estimated parameters with the maximum-likelihood method. We compared the slopes ( b ) and the lower asymptotes ( c ) of the two models to investigate differences in the ability to socially isolate. To assess the consistency of our results based on administrative units and BWQS cut points, we repeated the analysis using three COVID-19 inequity index groups at the UHF level, and then again at the ZCTA level.
COVID-19 inequity index and mortality. Given high COVID-related mortality in disadvantaged communities, we wanted to assess if our COVID-19 inequity index was also associated with cumulative COVID mortality by the total population. To do so, we employed a negative binomial model, regressing ZCTA-level COVID mortality on the COVID-19 inequity index. In order to adjust for spatial autocorrelation, and thus unmeasured spatial confounding, we employed a spatial filtering approach whereby we identify the eigenvector associated with spatial autocorrelation (as measured by Moran’s I), and explicitly adjusted for those values in the negative binomial regression 41 , 42 . The goal, then, was to “filter out” spatial autocorrelation from the residuals. Negative binomial models were implemented with the MASS package, supplemented with spatial functions from the spdep and spatialreg packages 43 , 44 .
Mapping and coding
Geoprocessing and visualization of spatial data were conducted with the sf package in R 45 . All analyses were conducted in R version 4.0.2 46 .
Reporting summary
Further information on research design is available in the Nature Research Reporting Summary linked to this article.
Data availability
Census data were drawn from https://api.census.gov/data/ using the tidycensus package in R. NYC buildings data were drawn from https://www1.nyc.gov/assets/planning/download/zip/data-maps/open-data/nyc_pluto_20v3_csv.zip and https://data.cityofnewyork.us/api/geospatial/nqwf-w8eh?method=export&format=Shapefile . Zip code neighborhood definitions were accessed from https://web.archive.org/web/20210221151212/https://www.health.ny.gov/statistics/cancer/registry/appendix/neighborhoods.htm . NYC COVID-19 testing and mortality data: https://raw.githubusercontent.com/nychealth/coronavirus-data/6d7c4a94d6472a9ffc061166d099a4e5d89cd3e3/tests-by-zcta.csv . United Hospital Fund shapefile: https://www1.nyc.gov/assets/doh/downloads/zip/uhf42_dohmh_2009.zip . NYC Boroughs shapefile: https://data.cityofnewyork.us/api/geospatial/tqmj-j8zm?method=export&format=Shapefile . Modified ZCTA shapefile: https://data.cityofnewyork.us/api/geospatial/pri4-ifjk?method=export&format=Shapefile . Food retailers in New York State: https://data.ny.gov/api/views/9a8c-vfzj/rows.csv . Crosswalk table of ZCTAs to modified ZCTAs: https://raw.githubusercontent.com/nychealth/coronavirus-data/master/Geography-resources/ZCTA-to-MODZCTA.csv . Crosswalk table of ZCTA to Census Tracts: https://www.huduser.gov/portal/datasets/usps/ZIP_TRACT_062020.xlsx . Geocoding tool for New York State: https://gisservices.its.ny.gov/arcgis/rest/services/Locators/Street_and_Address_Composite/GeocodeServer/findAddressCandidates?f=json&maxLocations=1&SingleLine= . Source data are provided with this paper.
Code availability
All analytic code, including download procedures, are available to the public 47 . A compiled literate programming html report of all code with all generated output is available at https://justlab.github.io/COVID_19_admin_disparities .
Onder, G., Rezza, G. & Brusaferro, S. Case-fatality rate and characteristics of patients dying in relation to COVID-19 in Italy. JAMA 323 , 1775–1776 (2020).
CAS PubMed Google Scholar
Dorn, A., van, Cooney, R. E. & Sabin, M. L. COVID-19 exacerbating inequalities in the US. Lancet 395 , 1243–1244 (2020).
Article CAS PubMed PubMed Central Google Scholar
Gold, J. A. W. Characteristics and clinical outcomes of adult patients hospitalized with COVID-19—Georgia, March 2020. MMWR Morb. Mortal. Wkly. Rep . 69 , (2020).
Webb Hooper, M., Nápoles, A. M. & Pérez-Stable, E. J. COVID-19 and Racial/Ethnic Disparities. JAMA (2020) https://doi.org/10.1001/jama.2020.8598 .
Yancy, C. W. COVID-19 and African Americans. JAMA https://doi.org/10.1001/jama.2020.6548 (2020).
Article PubMed PubMed Central Google Scholar
Centers for Disease Control & Prevention. CDC Health Disparities and Inequalities Report—United States , 2013. https://www.cdc.gov/mmwr/pdf/other/su6203.pdf (2013).
Garg, S. Hospitalization rates and characteristics of patients hospitalized with laboratory-confirmed coronavirus disease 2019—COVID-NET, 14 States, March 1–30, 2020. MMWR Morb. Mortal. Wkly. Rep . 69 , (2020).
NYC DOHMH. Age-adjusted rates of lab-confirmed COVID-19. Age-adjusted Rates of Lab-confirmed COVID-19 https://www1.nyc.gov/assets/doh/downloads/pdf/imm/covid-19-deaths-race-ethnicity-05142020-1.pdf (2020).
Krieger, N. Discrimination and health inequities. Int. J. Health Serv. 44 , 643–710 (2014).
Article PubMed Google Scholar
Bailey, Z. D. et al. Structural racism and health inequities in the USA: evidence and interventions. Lancet 389 , 1453–1463 (2017).
Acevedo-Garcia, D. Residential segregation and the epidemiology of infectious diseases. Soc. Sci. Med. 51 , 1143–1161 (2000).
Article CAS PubMed Google Scholar
Acs, G. & Loprest, P. J. Job Differences by Race and Ethnicity in the Low-skill Job Market . 6 https://www.urban.org/sites/default/files/publication/30146/411841-Job-Differences-by-Race-and-Ethnicity-in-the-Low-Skill-Job-Market.PDF (2009).
Berchick, E. R., Barnett, J. C. & Upton, R. D. Health Insurance Coverage in the United States: 2018 . 44 https://www.census.gov/content/dam/Census/library/publications/2019/demo/p60-267.pdf (2019).
Murray, C. J. L. et al. Eight Americas: investigating mortality disparities across races, counties, and race-counties in the United States. PLoS Med 3 , e260 (2006).
Guzman, S. Multigenerational Housing on the Rise, Fueled by Economic and Social Changes . https://www.aarp.org/ppi/info-2019/multigenerational-housing.html (2019) https://doi.org/10.26419/ppi.00071.001 .
Walker, G. Beyond distribution and proximity: exploring the multiple spatialities of environmental justice. Antipode 41 , 614–636 (2009).
Article Google Scholar
Gelman, A., Goodrich, B., Gabry, J. & Vehtari, A. R-squared for Bayesian regression models. Am. Stat. 73 , 307–309 (2019).
Article MathSciNet Google Scholar
Krieger, N. et al. Zip code caveat: bias due to spatiotemporal mismatches between zip codes and us census–defined geographic areas—the public health disparities geocoding project. Am. J. Public Health 92 , 1100–1102 (2002).
Chen, J.T. & Krieger, N. Revealing the unequal burden of COVID-19 by income, race/ethnicity, and household crowding: US county vs. ZIP code analyses. (2020). Harvard Center for Population and Development Studies Working Paper Series, Volume 19, https://tinyurl.com/y7v72446 .
Lamb, M. R., Kandula, S. & Shaman, J. Differential COVID-19 case positivity in New York City neighborhoods: socioeconomic factors and mobility. medRxiv 2020.07.01.20144188 (2020). https://doi.org/10.1101/2020.07.01.20144188 .
Schmitt-Grohé, S., Teoh, K. & Uribe, M. Covid-19: Testing Inequality in New York City . NBER Working Paper Series (2020). https://doi.org/10.3386/w27019 .
DiMaggio, C., Klein, M., Berry, C. & Frangos, S. Black/African American communities are at highest risk of COVID-19: spatial modeling of New York City ZIP Code–level testing results. Ann. Epidemiol. 51 , 7–13 (2020).
Sy, K. T. L., Martinez, M. E., Rader, B. & White, L. F. Socioeconomic disparities in subway use and COVID-19 outcomes in New York City. medRxiv 2020.05.28.20115949 (2020) https://doi.org/10.1101/2020.05.28.20115949 .
Kissler, S. M. et al. Reductions in commuting mobility predict geographic differences in SARS-CoV-2 prevalence in New York City. Nat. Commun. 11 , 4674, https://doi.org/10.1038/s41467-020-18271-5 (2020).
Article ADS CAS PubMed PubMed Central Google Scholar
Chowkwanyun, M. & Reed, A. L. Racial health disparities and Covid-19—caution and context. N. Engl. J. Med 383 , 201–203 (2020).
Geronimus, A. T., Hicken, M., Keene, D. & Bound, J. “Weathering” and age patterns of allostatic load scores among blacks and whites in the United States. Am. J. Public Health 96 , 826–833 (2006).
Gee, G. C., Hing, A., Mohammed, S., Tabor, D. C. & Williams, D. R. Racism and the life course: taking time seriously. Am. J. Public Health 109 , S43–S47 (2019).
Quealy, K. The richest neighborhoods emptied out most as Coronavirus hit New York City. The New York Times (2020).
Guse, C. NYC local buses a free ride for all during coronavirus outbreak. nydailynews . com https://www.nydailynews.com/coronavirus/ny-coronavirus-mta-nyc-buses-free-outbreak-20200320-a24jq7ksrzcpvgq7e2dyzq2uqy-story.html (2020).
Colicino, E., Pedretti, N. F., Busgang, S. A. & Gennings, C. Per- and poly-fluoroalkyl substances and bone mineral density: results from the Bayesian weighted quantile sum regression. Environ. Epidemiol. 4 , e092 (2020).
Colicino, E. et al. Association between prenatal immune phenotyping and cord blood leukocyte telomere length in the PRISM pregnancy cohort. Environ. Res. 191 , 110113 (2020).
Thompson, B. Getting help for minority-owned businesses shut out of PPP loan relief. Forbes https://www.forbes.com/sites/brianthompson1/2020/05/12/getting-help-for-minority-owned-businesses-shut-out-of-ppp-loan-relief/ .
Kakani, P., Chandra, A., Mullainathan, S. & Obermeyer, Z. Allocation of COVID-19 relief funding to disproportionately black counties. JAMA https://doi.org/10.1001/jama.2020.14978 (2020).
National Academies of Sciences, E., and Medicine. Framework for Equitable Allocation of COVID-19 Vaccine . (The National Academies Press, 2020). https://doi.org/10.17226/25917 .
CDC. Coronavirus Disease 2019 (COVID-19). Centers for Disease Control and Prevention https://www.cdc.gov/coronavirus/2019-ncov/hcp/planning-scenarios.html (2020).
Walker, K. tidycensus: Load US Census Boundary and Attribute Data as ‘tidyverse’ and’sf’-Ready Data Frames . (2020).
Messer, L. C. et al. The development of a standardized neighborhood deprivation index. J. Urban Health 83 , 1041–1062 (2006).
Hartig, F. DHARMa: residual diagnostics for hierarchical (multi-level/mixed) regression models. R Package Version 0330 (2020).
Wilson, R. & Din, A. Understanding and enhancing the U.S. department of housing and urban development’s ZIP code crosswalk files. Cityscape 20 , 277–294 (2018).
Google Scholar
Ritz, C., Baty, F., Streibig, J. C. & Gerhard, D. Dose-response analysis using R. PLoS ONE 10 , e0146021 (2015).
Griffith, D. A. Some robustness assessments of Moran eigenvector spatial filtering. Spat. Stat. 22 , 155–179 (2017).
Griffith, D. A. & Peres-Neto, P. R. Spatial modeling in ecology: the flexibility of eigenfunction spatial analyses. Ecology 87 , 2603–2613 (2006).
Bivand, R. S. & Piras, G. Comparing implementations of estimation methods for spatial econometrics. J. Stat. Softw. 63 , 1–36 (2015).
Bivand, R. S., Pebesma, E. & Gomez-Rubio, V. Applied spatial data analysis with R . (Springer, 2013).
Pebesma, E. Simple features for R: standardized support for spatial vector data. R. J. 10 , 439–446 (2018).
R Core Team. R: A Language and Environment for Statistical Computing . (R Foundation for Statistical Computing, 2020).
Carrión, D. et al . justlab/COVID_19_admin_disparities: For publication . (2021).
Download references
Acknowledgements
This work was supported by NIH grants UL1TR001433 and P30ES023515. DC was funded by NIH T32HD049311. Thanks to Sebastian Rowland for his thoughtful comments on a draft. We gratefully acknowledge the OpenStreetMap contributors, who provided the data for the water mask used in Fig. 3 and supplemental Figs. 5 and 10. OpenStreetMap data is available under the Open Database License. For more information, see www.openstreetmap.org/copyright and opendatacommons.org.
Author information
Authors and affiliations.
Department of Environmental Medicine and Public Health, Icahn School of Medicine at Mount Sinai, New York, NY, USA
Daniel Carrión, Elena Colicino, Nicolo Foppa Pedretti, Kodi B. Arfer, Johnathan Rush, Nicholas DeFelice & Allan C. Just
Institute for Exposomic Research, Icahn School of Medicine at Mount Sinai, New York, NY, USA
Nicholas DeFelice & Allan C. Just
You can also search for this author in PubMed Google Scholar
Contributions
D.C. and A.C.J. conceptualized the study and D.C. drafted the manuscript. D.C. conducted all analyses with statistical support from E.C. and N.F.P. A.C.J., E.C., and N.D. provided feedback on design and analysis. The Bayesian Weighted Quantile Sum regression was designed and implemented by E.C. and N.F.P., with the log link function implemented by NFP. KBA developed the procedures and indices for relative subway utilization. J.R. ingested DOHMH data, geocoded food retailers, conducted tract level sensitivity analyses, compiled the literate programming html report, and improved analysis reproducibility. All authors reviewed and approved the manuscript.
Corresponding authors
Correspondence to Daniel Carrión or Allan C. Just .
Ethics declarations
Competing interests.
The authors declare no competing interests.
Additional information
Peer review information Nature Communications thanks Matthew Quick, Justin Feldman, Nishant Kishore and the other, anonymous, reviewers for their contribution to the peer review of this work. Peer reviewer reports are available.
Publisher’s note Springer Nature remains neutral with regard to jurisdictional claims in published maps and institutional affiliations.
Supplementary information
Supplementary information, peer review file, reporting summary, source data, source data, rights and permissions.
Open Access This article is licensed under a Creative Commons Attribution 4.0 International License, which permits use, sharing, adaptation, distribution and reproduction in any medium or format, as long as you give appropriate credit to the original author(s) and the source, provide a link to the Creative Commons license, and indicate if changes were made. The images or other third party material in this article are included in the article’s Creative Commons license, unless indicated otherwise in a credit line to the material. If material is not included in the article’s Creative Commons license and your intended use is not permitted by statutory regulation or exceeds the permitted use, you will need to obtain permission directly from the copyright holder. To view a copy of this license, visit http://creativecommons.org/licenses/by/4.0/ .
Reprints and permissions
About this article
Cite this article.
Carrión, D., Colicino, E., Pedretti, N.F. et al. Neighborhood-level disparities and subway utilization during the COVID-19 pandemic in New York City. Nat Commun 12 , 3692 (2021). https://doi.org/10.1038/s41467-021-24088-7
Download citation
Received : 11 June 2020
Accepted : 25 May 2021
Published : 17 June 2021
DOI : https://doi.org/10.1038/s41467-021-24088-7
Share this article
Anyone you share the following link with will be able to read this content:
Sorry, a shareable link is not currently available for this article.
Provided by the Springer Nature SharedIt content-sharing initiative
This article is cited by
State variation in neighborhood covid-19 burden across the united states.
- Grace A. Noppert
- Philippa Clarke
- Sonia T. Hegde
Communications Medicine (2024)
Impact of COVID-19 on pediatric asthma-related healthcare utilization in New York City: a community-based study
- Erin Thanik
- Kaoru Harada
- Nicholas B. DeFelice
BMC Pediatrics (2023)
An applied environmental justice framework for exposure science
- Yoshira Ornelas Van Horne
- Cecilia S. Alcala
- Paloma I. Beamer
Journal of Exposure Science & Environmental Epidemiology (2023)
Differential Effects of Race/Ethnicity and Social Vulnerability on COVID-19 Positivity, Hospitalization, and Death in the San Francisco Bay Area
- Wendy K. Tam Cho
- David G. Hwang
Journal of Racial and Ethnic Health Disparities (2023)
Multidisciplinary recommendations for the management of CAR-T recipients in the post-COVID-19 pandemic era
- Tingting Zhang
- Weiwei Tian
Experimental Hematology & Oncology (2023)
By submitting a comment you agree to abide by our Terms and Community Guidelines . If you find something abusive or that does not comply with our terms or guidelines please flag it as inappropriate.
Quick links
- Explore articles by subject
- Guide to authors
- Editorial policies
Sign up for the Nature Briefing newsletter — what matters in science, free to your inbox daily.

Researchers Produce First Map of New York City Subway System Microbes
- Share to Facebook
- Share to Twitter
- Share to LinkedIn
- Share on Email

Most Identifiable Bacteria are Harmless, but a Few are Linked to Disease or are Treatment-Resistant
Paints a molecular portrait of new york city's balanced microbial ecosystem.
Monday, Aug. 3, 2015 — The authors of this study have posted updated information based on new analysis. Please see the amended study here: Geospatial Resolution of Human and Bacterial Diversity with City-Scale Metagenomics
NEW YORK (February 5, 2015) — The microbes that call the New York City subway system home are mostly harmless, but include samples of disease-causing bacteria that are resistant to drugs — and even DNA fragments associated with anthrax and Bubonic plague — according to a citywide microbiome map published today by Weill Cornell Medical College investigators.

Infographic showing the relative amount of DNA found in the New York subway system form bacteria associated with the human body. Click to enlarge.
The study , published in Cell Systems, demonstrates that it is possible and useful to develop a "pathogen map" — dubbed a "PathoMap" — of a city, with the heavily traveled subway a proxy for New York's population. It is a baseline assessment, and repeated sampling could be used for long-term, accurate disease surveillance, bioterrorism threat mitigation, and large scale health management for New York, says the study's senior investigator, Dr. Christopher E. Mason , an assistant professor in Weill Cornell's Department of Physiology and Biophysics and in the HRH Prince Alwaleed Bin Talal Bin Abdulaziz Al-Saud Institute for Computational Biomedicine (ICB) .
The PathoMap findings are generally reassuring, indicating no need to avoid the subway system or use protective gloves, Dr. Mason says. The majority of the 637 known bacterial, viral, fungal and animal species he and his co-authors detected were non-pathogenic and represent normal bacteria present on human skin and human body. Culture experiments revealed that all subway sites tested possess live bacteria.
Strikingly, about half of the sequences of DNA they collected could not be identified — they did not match any organism known to the National Center for Biotechnology Information or the Centers for Disease Control and Prevention. These represent organisms that New Yorkers touch every day, but were uncharacterized and undiscovered until this study. The findings underscore the vast potential for scientific exploration that is still largely untapped and yet right under scientists' fingertips.
"Our data show evidence that most bacteria in these densely populated, highly trafficked transit areas are neutral to human health, and much of it is commonly found on the skin or in the gastrointestinal tract," Dr. Mason says. "These bacteria may even be helpful, since they can out-compete any dangerous bacteria."
.")
Heatmap of the Pseudomonas genus, the most abundant genus found across the city. Hotspots are found in areas of high station density and traffic (i.e. lower Manhattan and parts of Brooklyn). Photo Credit: Ebrahim Afshinnekoo
But the researchers also say that 12 percent of the bacteria species they sampled showed some association with disease. For example, live, antibiotic-resistant bacteria were present in 27 percent of the samples they collected. And they detected two samples with DNA fragments of Bacillus anthracis (anthrax), and three samples with a plasmid associated with Yersinia pestis (Bubonic plague) — both at very low levels. Notably, the presence of these DNA fragments do not indicate that they are alive, and culture experiments showed no evidence of them being alive.
Yet these apparently virulent organisms are not linked to widespread sickness or disease, Dr. Mason says. "They are instead likely just the co-habitants of any shared urban infrastructure and city, but wider testing is needed to confirm this."
For example, there has not been a single reported case of the plague in New York City since the PathoMap project began in June 2013.
"Despite finding traces of pathogenic microbes, their presence isn't substantial enough to pose a threat to human health," Dr. Mason says. "The presence of these microbes and the lack of reported medical cases is truly a testament to our body's immune system, and our innate ability to continuously adapt to our environment.
"PathoMap also establishes the first baseline data for an entire city, revealing that low-levels of pathogens are typical of this environment," he adds. "While this is expected in rural environments, we've never seen these levels before in cities. We can now monitor for changes and potential threats to this balanced microbial ecosystem."
"Jumping into the Unknown"
Scientists now believe that the diversity of microorganisms that are present in, on and around humans comprise a significant component of overall health. In the average human, there are 10 times as many microbes as human cells, and products processed by these microbes comprise more than one-third of the active, small molecules in the bloodstream. This collective microbiome is seen to impact health by exacerbating or resisting infectious diseases, controlling obesity risk, and regulating metabolic rates. Yet there is very little known about the native microbial communities that surround people in streets, buildings or public transit areas.
In the study, the research team — which includes investigators from five other New York City medical centers and others from around the country and internationally — sought to define the microbiome in New York City's subway system, which in 2013 was used by an average of 5.5 million people per day, according to the city's Metropolitan Transportation Authority. Over the past 17 months, the team — many of them student volunteers, medical students and graduate students — used nylon swabs to collect, in triplicate, DNA from turnstiles, wooden and metal benches, stairway hand railings, trashcans, and kiosks in all open subway stations in 24 subway lines in five boroughs. The team also collected samples from the inside of trains, including seats, doors, poles and handrails. Investigators are currently analyzing additional samples collected during all four seasons to study the temporal dynamics of the microbiome.
The sample collectors were equipped with a mobile app built by the researchers, which allowed them to time stamp each of the samples, tag it using a global positioning system and log the data in real time. DNA from the microbes was sequenced using the most advanced research technology at the Weill Cornell Epigenomics Facility and the HudsonAlpha Institute for Biotechnology. They sequenced 1,457 samples out of more than 4,200 collected, and the results were analyzed in the ICB.
"We had our hypothesis about what's on the surfaces of the subway, which reflects a massive, diverse, busy metropolis, but we really had no idea what we would find," says co-lead author Ebrahim Afshinnekoo, a senior at Macaulay Honors College -Queens who starting working on the project as a Tri-Institutional Computational Biology and Medicine Summer Student in 2013.

Staphylococcus aureus is frequently found in the human respiratory tract and on skin. It is an opportunistic bacteria that is always associated with disease, though some strains are found to cause skin infections, respiratory disease and food poisoning. Treating antibiotic resistant strains of S. aureus (methicillin resistant staphylococcus aureus or MRSA) is a worldwide problem in clinical medicine. Photo Credit: Janice Haney Carr/CDC
The majority of the DNA from all the samples, 48.3 percent, did not match any known organism, "which underscores the vast wealth of unknown species that are ubiquitous in urban areas," Afshinnekoo says.
The most commonly found organism (46.9 percent) was bacteria. Despite some riders' fears of catching cold or flu from fellow straphangers, viruses were rare — they made up .032 percent of the samples. However, some seasonal viruses are RNA viruses, not DNA viruses, and they would not be identified with the collection methods used in the study.
Of the known bacteria, the majority (57 percent) found on the surfaces of the subway have never been associated with human disease, whereas about 31 percent represented opportunistic bacteria that might pose health risks for immune-compromised, injured or disease-susceptible populations, researchers report. The remaining 12 percent have some evidence of pathogenicity.
They found that dozens of microbial species were unique to each area of the train, and that there is a significant range of microbial diversity across different subway lines. The Bronx was found to be the most diverse with the most number of species found, followed by Brooklyn, Manhattan and Queens. Staten Island was the least diverse.
"We built maps that detail what organisms are present in each area of the city, creating a molecular portrait of the metropolis," says co-lead author Dr. Cem Meydan, a postdoctoral associate at Weill Cornell Medical College.
Despite sampling surfaces of areas of high human traffic and contact, the researchers found that only an average of 0.2 percent of reads uniquely mapped to the human genome. Using tools like AncestryMapper and ADMIXTURE, the investigators took human alleles and recreated census data of a particular subway station or neighborhood. Their results showed that the trace levels of human DNA left of the surface of the subway can recapitulate the U.S. Census data. For example, a Hispanic area near Chinatown in Manhattan appeared to hold a strong mixture of Asian and Hispanic human genes. An area of North Harlem showed African and Hispanic genes, and an area of Brooklyn with a predominantly white population was predicted to be Finnish, British and Tuscan.
"This provides a forensic ability to learn about the ancestry of the people who transit a station," Dr. Mason says, "and it means the DNA people leave behind can reveal a clue as to the area's demographics."
The researchers also compared their microbial data with U.S. census data, as well as average ridership data from the MTA. They found a slightly positive correlation between these two variables and the population density of microbes on the subway, suggesting that the more people in an area, the more diverse the types of bacteria.
Efforts like PathoMap in New York can readily be applied to other cities to provide a new tool for disease and threat surveillance, Dr. Mason says. "With the further development of sequencing technologies, I believe having a live model tracking the levels of potential pathogens could be possible," he says. "I envision PathoMap to be the first step in that model."
Projects are already underway that build upon PathoMap's initial data and further the researchers' goal of investigating the microbiome of large, complex cities. Collaborators across the country have collected samples from airports, subways, transit hubs, taxis and public parks located in 14 states — including New Jersey, Massachusetts, Maryland, Florida, Illinois, Texas and California. By sequencing the DNA of these samples, Dr. Mason hopes to create the first ever comparison of major cities in the nation that contextualizes urban and rural, high density and low density environments.
The Impact of Superstorm Sandy
The researchers also worked with the MTA to gain access to the South Ferry station that was completed submerged by Superstorm Sandy in 2012, and which was still closed during sampling. (The station reopened in April 2013.) Dr. Mason's team sampled the walls and floors of the station, and found 10 species of bacteria present that were found nowhere else in the system. Notably, all of the species are normally found in marine or aquatic environments.

The study was supported by the National Institutes of Health (F31GM111053), the Weill Cornell Clinical and Translational Science Center, the Pinkerton Foundation, the Vallee Foundation, the WorldQuant Foundation, the Epigenomics Core Facility at Weill Cornell, the HudsonAlpha Institute for Biotechnology, Illumina, Qiagen, and Indiegogo (for crowdfunding and crowdsourcing support).
Study co-authors include, from Weill Cornell Medical College, Shanin Chowdhury, Cem Meydan, Dyala Jaroudi, Collin Boyer, Nick Bernstein, Darryl Reeves, Jorge Gandara, Sagar Chhangawala, Sofia Ahsanuddin, Nell Kirchberger, Isaac Garcia, David Gandara, Amber Simmons, Yogesh Saletore, Noah Alexander, Priyanka Vijay, Elizabeth M. Hénaff, Paul Zumbo; Timothy Nessel, Bharathi Sundaresh, and Elizabeth Pereira from Cornell University; Sergios-Orestis Kolokotronis from Fordham University; Sean Dhanraj, Tanzina Nawrin, Theodore Muth, Elizabeth Alter and Gregory O'Mullan from City University of New York; Ellen Jorgensen from Genspace Community Laboratory; Julia Maritz, Katie Schneider, and Jane Carlton from New York University; Michael Walsh from the State University of New York, Downstate; Scott Tighe from the University of Vermont; Joel T. Dudley and Eric E. Schadt from the Icahn School of Medicine at Mount Sinai; Anya Dunaif and Jeanne Garbarino from Rockefeller University; Sean Ennis, Eoghan Ohalloran and Tiago R Magalhaes from the University of Ireland; Braden Boone, Angela L. Jones, and Shawn Levy from HudsonAlpha Institute for Biotechnology; and Robert J. Prill from the IBM Almaden Research Center.
Weill Cornell Medical College
Weill Cornell Medical College, Cornell University's medical school located in New York City, is committed to excellence in research, teaching, patient care and the advancement of the art and science of medicine, locally, nationally and globally. Physicians and scientists of Weill Cornell Medical College are engaged in cutting-edge research from bench to bedside aimed at unlocking mysteries of the human body in health and sickness and toward developing new treatments and prevention strategies. In its commitment to global health and education, Weill Cornell has a strong presence in places such as Qatar, Tanzania, Haiti, Brazil, Austria and Turkey. Through the historic Weill Cornell Medical College in Qatar, Cornell University is the first in the U.S. to offer a M.D. degree overseas. Weill Cornell is the birthplace of many medical advances — including the development of the Pap test for cervical cancer, the synthesis of penicillin, the first successful embryo-biopsy pregnancy and birth in the U.S., the first clinical trial of gene therapy for Parkinson's disease, and most recently, the world's first successful use of deep brain stimulation to treat a minimally conscious brain-injured patient. Weill Cornell Medical College is affiliated with NewYork-Presbyterian Hospital, where its faculty provides comprehensive patient care at NewYork-Presbyterian Hospital/Weill Cornell Medical Center. The Medical College is also affiliated with Houston Methodist. For more information, visit weill.cornell.edu .
Related News
- Awards & Honors: May
- Prenatal Testing Offers a Window for Finding a Mother’s Cancer Risk
- Astrocytes Induce Sex-Specific Effects on Memory
Back to News
Weill Cornell Medicine Office of External Affairs New York, NY --> Phone: (646) 962-9476
We've detected unusual activity from your computer network
To continue, please click the box below to let us know you're not a robot.
Why did this happen?
Please make sure your browser supports JavaScript and cookies and that you are not blocking them from loading. For more information you can review our Terms of Service and Cookie Policy .
For inquiries related to this message please contact our support team and provide the reference ID below.
- U.S. Department of Health & Human Services
- Virtual Tour
- Staff Directory
- En Español
You are here
Nih research matters.
February 23, 2015
Mapping the Microbes in New York City’s Subway System
At a glance.
- Researchers created a detailed map of bacterial diversity throughout New York City.
- The findings serve as a baseline that could aid surveillance of disease, bioterrorism threats, and health management in city environments.

The human body is host to trillions of microbes that include bacteria, fungi, and viruses. They influence our health and disease and are, in turn, influenced by the environment. At the same time, the environment itself—everything that surrounds us—hosts an extensive assortment of bacteria, which we’re exposed to every day.
To learn more about environmental microbes and the DNA that surrounds us, a team of researchers led by Dr. Christopher E. Mason at Weill Cornell Medical College tracked and characterized the genetic material of microorganisms in New York City, particularly in its subway system. Used by 1.7 billion people a year, it’s the largest mass-transit system in the world.
The scientists used sterile swabs to collect 1,457 samples across 468 subway stations, covering 24 lines in 5 boroughs. The team sampled turnstiles, wooden and metal benches, stairway handrails, trashcans, emergency exits, and card kiosks. On trains, they sampled doors, poles, handrails, and seats. They also sampled railway stations and public parks in the city. They developed a mobile app to map the exact location and time of each sample.
The team extracted DNA from each sample, sequenced it, then classified and characterized it, using several existing databases. The study was funded in part by NIH’s National Institute of General Medical Sciences (NIGMS). Results appeared online on February 5, 2015, in Cell Systems.
The researchers found that almost half of the DNA analyzed (48%) did not match any known organism, hinting at how many species remain to be identified. They determined that 47% of the DNA came from bacteria, 0.03% came from viruses, and the rest from fungi and other organisms.
Bacterial signatures could reveal a station’s history. Marine-associated bacteria were found in the closed station that was flooded during Hurricane Sandy. The Bronx stations showed the greatest bacterial diversity, while Staten Island had the lowest diversity. By comparing their data with data from the 2010 U.S. Census, the researchers found that the predicted ancestry of human DNA left on subway surfaces echoed the U.S. Census demographic data. The team also found shifts in microbes during the course of the day after collecting samples from Penn Station every hour during a weekday.
The group detected some DNA fragments associated with known pathogens, including bubonic plague and anthrax, but didn’t find strong evidence that those organisms were present. The researchers also detected bacteria that are resistant to standard antibiotics.
“Our data show evidence that most bacteria in these densely populated, highly trafficked transit areas are neutral to human health, and much of it is commonly found on the skin or in the gastrointestinal tract,” Mason says. “These bacteria may even be helpful, since they can out-compete any dangerous bacteria.”
The team has created “PathoMap,” an interactive heatmap of their data. “We can now monitor for changes and potential threats to this balanced microbial ecosystem,” Mason says.
—by Carol Torgan, Ph.D.
References: Geospatial Resolution of Human and Bacterial Diversity with City-Scale Metagenomics Cell Systems , 2015 DOI: 10.1016/j.cels.2015.01.001 . Erratum DOI: http://dx.doi.org/10.1016/j.cels.2015.07.006
Funding: NIH’s National Institute of General Medical Sciences (NIGMS) and National Center for Advancing Translational Sciences (NCATS); Pinkerton Foundation; Vallee Foundation; New York University; and Indiegogo for crowdfunding and crowdsourcing support.
Connect with Us
- More Social Media from NIH
2020 Theses Master's
Evaluate The Impact Of Disruptions On New York City Subway System
Jia, Zhengzhe
This research aims to evaluate the impact of disruptions on the New York City subway system to passengers in terms of time and financial loss. A network model will be built to represent the New York City subway system, and the passenger flow will be simulated using the shortest-path algorithm. This paper uses the network and the algorithm to check the delay caused by the removal of one or two subway stations, which represents the disruptions on the subway system. Specially, the disruption events that happen simultaneously are checked to determine whether and to what extent is greater than it when separate events happen. Delays will be calculated for each scenario, and an economic analysis will be performed to evaluate the financial loss caused to the community and the whole society. The research can be useful for evaluating the loss caused by the disruptions that happen in New York City, and contributing to the schedule change decision-making processes.
Geographic Areas
- New York (State)--New York
- City planning--Transportation
- Local transit--Evaluation

More About This Work
- DOI Copy DOI to clipboard
The Subways Seeded the Massive Coronavirus Epidemic in New York City
New York City’s multipronged subway system was a major disseminator – if not the principal transmission vehicle – of coronavirus infection during the initial takeoff of the massive epidemic that became evident throughout the city during March 2020. The near shutoff of subway ridership in Manhattan – down by over 90 percent at the end of March – correlates strongly with the substantial increase in the doubling time of new cases in this borough. Subway lines with the largest drop in ridership during the second and third weeks of March had the lowest subsequent rates of infection in the zip codes traversed by their routes. Maps of subway station turnstile entries, superimposed upon zip code-level maps of reported coronavirus incidence, are strongly consistent with subway-facilitated disease propagation. Reciprocal seeding of infection appears to be the best explanation for the emergence of a single hotspot in Midtown West in Manhattan.
The comments of the following individuals are greatly appreciated: Robin Bell, Jay Bhattacharya, Marlin Boarnet, Ken Boynton, Gil Brodsky, Peggy Cardone, Lee Cohen-Gould, Philip Cooley, Mike Cragg, Peter Diamond, Denise Everett, Richard Florida, Michael Fulgitini, Mariana Gerstenblüth, Daniel Geselowitz, Ray Girouard, Beatriz González López-Valcarcel, Michael Grovak, Joseph Guernsey, Robert Hanlon, Ali Harris, Barry Harris, Dena Harris, Jarrett Harris, Neil Harrison, Bill James, Paul Joskow, Thomas Kalb, Stuart Katz, Karl P. Keller, Ronald Klempner, Moritz Kraemer, Ronald Laporte, Kathryn Blackmond Laskey, Ken Laskey, Zoe Lazarre, John Lowell, Marylee Maendler, Mark Mandell, Melissa Oppenheim Margolis, Andrea Lubeck Moskowitz, Sean X. Luo, Heide O’Connell, David Posnett, Andrew Racine, Thomas Reichert, June Blender Rogers, Ron Rogers, George Rutherford, Brina Sedar, Todd W. Schneider, Susan Goldberg Simon, Tim Sullivan, Kieran Smith, Rivana Cohen Stadtlander, Peter Temin, Pat Tracy, Patricia Triunfo, Shuang Troy, Mark Weinstein, William Welch, William Wheaton, and Delbert Yoder. The opinions expressed here are solely those of the author and do not represent the views of the Massachusetts Institute of Technology, Eisner Health, the National Bureau of Economic Research, or any other individual or organization. The author has received no direct or indirect remuneration for this article, and has no conflicts of interest to declare.
MARC RIS BibTeΧ
Download Citation Data
- April 17, 2020
Published Versions
Harries, Jeffrey E. " Critical Role of the Subways in the Initial Spread of SARS-CoV-2 in New York City, " Frontiers in Public Health, vol 9, December 2021
Mentioned in the News
More from nber.
In addition to working papers , the NBER disseminates affiliates’ latest findings through a range of free periodicals — the NBER Reporter , the NBER Digest , the Bulletin on Retirement and Disability , the Bulletin on Health , and the Bulletin on Entrepreneurship — as well as online conference reports , video lectures , and interviews .

Subway stations near river tunnels have worst air quality
Subway riders waiting in stations near tunnels that run below the city's rivers are exposed to higher levels of hazardous pollutants than are found in other stations. The "river-tunnel effect," as researchers call it, may help explain extremely poor air quality in the nation's largest underground transit system and have particular implications for stations close to rivers in general.
In a previous investigation of New York's subways, researchers at NYU Grossman School of Medicine found considerable variation in air quality among city subway stations. While some had pollutant levels a few times higher than that of outdoor air, the air quality in others was comparable to sooty air contaminated by forest fires or building demolitions.
To better understand why, the NYU Grossman research team measured air quality samples in 54 NYC stations during morning rush hour. They found that stations neighboring river tunnels had 80% to 130% higher concentrations of potentially dangerous particles in the air compared with stations only two or three stops further away from rivers. The new study published online Dec. 30 in the journal Transportation Research Part D: Transport and Environment.
"Our findings help explain why some underground subway stations are more polluted than others," says study lead author David Luglio, MS; a doctoral student at NYU Grossman School of Medicine. "Those subway stations closest to rivers clearly must be prioritized during cleaning efforts."
To explain the "river-tunnel effect," Luglio notes that while many tunnels in the city's underground subway system have some degree of air exchange with the surface, those traveling beneath water have more limited ventilation. As a result, harmful debris gets trapped and builds up over time. Trains passing through may then throw these iron and carbon particles back into the air and push them into the closest stations -- those at either end of the tunnel.
The investigation, which Luglio says is the largest exploration to date of how river tunnels influence air quality in underground subway stations, also revealed that proximity to a river tunnel was the strongest factor in predicting a station's pollution levels, followed by its age. Other potential contributors, such as station size and depth, did not appear to play a major role in air quality differences.
The Metropolitan Transit Authority reported that 5.5 million people rode New York City's subways every day in 2019, before the COVID-19 pandemic began. According to past research, passengers were exposed to air with high levels of particles, which experts have linked to lung and heart disease as well as overall higher risk of death.
For the investigation, researchers collected over 100 air samples in stations between February and March 2022. Among the results, the study showed that on average, pollutant levels in all measured stations exceeded the daily exposure limit advised by the Environmental Protection Agency, which assesses potential health hazards in the environment.
For comparison, and to confirm the river-tunnel effect, the study team measured particle buildup on the B-line, a train route that crosses the East River via a bridge instead of passing beneath the water. Notably, pollutant levels in the two stations closest to the river on this train route were lower than that of stations farther away -- as expected, the reverse of the river-tunnel phenomenon.
"Now that our results have identified key contributors to poor air quality in New York City's underground subway stations, we have a better idea of where to improve conditions in the most contaminated areas of the transit system," says study senior author Terry Gordon, PhD. "Increasing ventilation and scrubbing the tunnel walls and floors to remove continually recycling debris may make stations safer for riders and transit workers," adds Gordon, a professor in the Department of Medicine at NYU Langone Health.
Gordon, also a member of NYU Langone's Center for the Investigation of Environmental Hazards, cautions that since the investigation only explored subways in New York City, it remains unclear whether the river-tunnel effect occurs in other cities as well.
He adds that the study team next plans to examine the effects of subway contaminants on human cells to better pinpoint the level of exposure needed to pose a risk to human health.
Funding for the study was provided by National Institutes of Health grants ES000260 and ES007324. Further funding was provided by the NY/NJ Occupational Safety and Health Center ERC Pilot Project Award grant T42 OH008422.
In addition to Luglio and Gordon, other NYU Langone study investigators involved in the study were Tri Huynh, BS; and Antonio Saporito, BS.
- Spintronics
- Transportation Science
- Construction
- Air Quality
- Air Pollution
- Environmental Science
- Water pollution
- The Long Tail
- Power station
- Lake effect snow
- Filling station
Story Source:
Materials provided by NYU Langone Health / NYU Grossman School of Medicine . Note: Content may be edited for style and length.
Journal Reference :
- David G. Luglio, Tri Huynh, Antonio Saporito, Terry Gordon. Investigation of a river-tunnel effect on PM2.5 concentrations in New York City subway stations . Transportation Research Part D: Transport and Environment , 2023; 115: 103579 DOI: 10.1016/j.trd.2022.103579
Cite This Page :
Explore More
- How Statin Therapy May Prevent Cancer
- Origins of 'Welsh Dragons' Exposed
- Resting Brain: Neurons Rehearse for Future
- Observing Single Molecules
- A Greener, More Effective Way to Kill Termites
- One Bright Spot Among Melting Glaciers
- Martian Meteorites Inform Red Planet's Structure
- Volcanic Events On Jupiter's Moon Io: High Res
- What Negative Adjectives Mean to Your Brain
- 'Living Bioelectronics' Can Sense and Heal Skin
Trending Topics
Strange & offbeat.

Analysis of the New York Subway System using an Adaptive Network Model
- Zachary Carino W.T. Clarke High School
Through the use of a Physarum Polycephalum organism and a scaled-down model of the New York Subway System, this study created and analyzed a system of "maximum efficiency". By taking advantage of the capabilities of a Physarum organism, a system reminiscent of the existing subway system was created, with deviations analyzed to find differences in both track usage and overall costs. Previous research regarding Physarum Polycephalum and infrastructure development were relatively separate. This study holds similarities to research done by Atsushi Tero of Kyoto University, but while his team sought perfect replication, this study sought to use the growth patterns of Physarum to create a more efficient system. Using a geographically accurate mapping of the New York Subway System, a scaled-down model of the Subway System was created, with major subway stations represented as oat nodes atop an agar solution in a sterile petri dish. The Physarum was placed within and allowed to grow for roughly 6 days. Following the full connection of all oat nodes, an analysis of the Physarum system was conducted using a ModaCam system. This analyzed system was then scaled up to that of the existing Subway System, and a comparison of the two was conducted. This study concluded that the Physarum system was significantly more efficient than the existing system, using fewer subway tracks and consequentially a lower maintenance cost.
References or Bibliography
King, David. “Developing Densely: Estimating the Effect of Subway Growth on New York City Land Uses.” Journal of Transport and Land Use, vol. 4, no. 2, 2011, pp. 19–32. JSTOR, http://www.jstor.org/stable/26201668 . Accessed 22 Apr. 2023.
Reid, Chris R., et al. “Slime Mold Uses an Externalized Spatial ‘Memory’ to Navigate in Complex Environments.” Proceedings of the National Academy of Sciences of the United States of America, vol. 109, no. 43, 2012, pp. 17490–94. JSTOR, http://www.jstor.org/stable/41829697 . Accessed 22 Apr. 2023.
González-Rivera, Christian. DESTINATION NEW YORK: Spurred by 30 Million More Tourists over the Past Two Decades, Tourism Is Now Driving NYC’s Economic Future. Edited by Eli Dvorkin and Jonathan Bowles, Center for an Urban Future, 2018. JSTOR, http://www.jstor.org/stable/resrep21708 . Accessed 22 Apr. 2023.
Cohen, James K. “Structural versus Functional Determinants of New York’s Fiscal Policies Towards Metropolitan Transportation, 1904-1990.” Social Science History, vol. 15, no. 2, 1991, pp. 177–98. JSTOR, https://doi.org/10.2307/1171413 . Accessed 22 Apr. 2023.
Chi-Hong (Patrick) Tsai, et al. “Measuring the Cost Efficiency of Urban Rail Systems: An International Comparison Using DEA and Tobit Models.” Journal of Transport Economics and Policy, vol. 49, no. 1, 2015, pp. 17–34. JSTOR, https://www.jstor.org/stable/jtranseconpoli.49.1.0017 . Accessed 22 Apr. 2023.
Larkin, Brian. “The Politics and Poetics of Infrastructure.” Annual Review of Anthropology, vol. 42, 2013, pp. 327–43. JSTOR, http://www.jstor.org/stable/43049305 . Accessed 22 Apr. 2023.
Crain, W. Mark, and Lisa K. Oakley. “The Politics of Infrastructure.” The Journal of Law & Economics, vol. 38, no. 1, 1995, pp. 1–17. JSTOR, http://www.jstor.org/stable/725815 . Accessed 22 Apr. 2023.
Westphal, Joseph W. “The Politics of Infrastructure.” Social Research, vol. 75, no. 3, 2008, pp. 793–804. JSTOR, http://www.jstor.org/stable/40972090 . Accessed 22 Apr. 2023.
Harris, C. (2020). Five Cheap Ways to Improve Nyc Subway Operations. Manhattan Institute, Issue Brief.
Tero, A., Takagi, S., & Ito, K. (2010). Rules for biologically inspired adaptive network design - researchgate. researchgate.net. Retrieved April 27, 2023, from https://www.researchgate.net/publication/41111573_Rules_for_Biologically_Inspired_Adaptive_Network_Design
MTA. (2020). Division of the budget. Metropolitan Transportation Authority | Agency Appropriations | FY 2021 Executive Budget. Retrieved April 27, 2023, from https://www.budget.ny.gov/pubs/archive/fy21/exec/agencies/appropdata/MetropolitanTransportationAuthority
How to Cite
- Endnote/Zotero/Mendeley (RIS)
Copyright (c) 2023 Zachary Carino

This work is licensed under a Creative Commons Attribution-NonCommercial-ShareAlike 4.0 International License .
Copyright holder(s) granted JSR a perpetual, non-exclusive license to distriute & display this article.
Subway Station Closures and Robbery Hot Spots in New York City—Understanding Mobility Factors and Crime Reduction
- Published: 03 February 2021
- Volume 27 , pages 415–432, ( 2021 )
Cite this article

- Christopher R. Herrmann ORCID: orcid.org/0000-0001-5634-269X 1 ,
- Andrew R. Maroko 2 &
- Travis A. Taniguchi 3
1362 Accesses
8 Citations
1 Altmetric
Explore all metrics
This paper takes advantage of a natural experiment involving subway station closures to examine how subway ridership is associated with the impact of robbery victimization within spatial network buffers immediately surrounding subway stations in Bronx (County), New York. The New York City subway system is the busiest in the USA, with an annual ridership estimated at 1.8 billion people. Key findings of this research include noteworthy relationships between robbery hot spots and subway stations, as well as substantial reductions in robbery frequency during temporary subway station closures, with larger reductions occurring in closer proximities to the subway stations. There was also a significant robbery pattern “normalization process” that occurred after the closed subway stations were reopened where robbery frequency returned to historically “normal” pre-closure levels. These notable decreases of crime in and around subway stations during the station closure time periods, as well as the prominent increases in robbery when subway stations reopened, should be taken into consideration when planning transit maintenance, conducting crime prevention initiatives, and scheduling crime control strategies.
This is a preview of subscription content, log in via an institution to check access.
Access this article
Price includes VAT (Russian Federation)
Instant access to the full article PDF.
Rent this article via DeepDyve
Institutional subscriptions

Street robbery around the Golden Line in Mexico City: a quasi-natural experiment between metro stations and bus stops

Crime in and around Metro Transit Stations: Exploring the Utility of Opportunity Theories of Crime

Traffic, Air Quality, and Environmental Justice in the South Coast Air Basin During California’s COVID-19 Shutdown
Adams, W., Herrmann, C., and Felson, M. (2014). Crime, transportation and malignant mixes, in Safety and security in transit environments, pp 181–195, December, 2014.
American Public Transportation Association (2010). Public transportation fact book, April 2010. Available at: https://www.apta.com/resources/statistics/Documents/FactBook/APTA_2010_Fact_Book.pdf
American Public Transportation Association. (2017). Retrieved from https://www.apta.com/wp-content/uploads/2017-APTA-Fact-Book.pdf
Block, R. L., & Block, C. R. (1995). Space, place, and crime: hot spot areas and hot places of liquor-related crime. In J. E. Eck & D. Weisburd (Eds.), Crime and place (Vol. 4, pp. 145–183). Monsey, NY: Criminal Justice Press.
Google Scholar
Block, R., & Block, C. (2000). The Bronx and Chicago: street robbery in the environs of rapid transit stations. In J. Mollenkopf (Ed.), Analyzing crime patterns: frontiers in practice . London: Sage.
Boggs, S. L. (1965). Urban crime patterns. American Sociological Review, 30 , 899–908.
Article Google Scholar
Branas, C., South, E., Kondo, M. C., Hohl, B. C., Bourgois, P., Wiebe, D. J., & MacDonald, J. M. (2018). Citywide cluster randomized trial to restore blighted vacant land and its effects on violence, crime, and fear. Proceedings of the National Academy of Sciences Mar 2018, 115 (12), 2946–2951.
Brantingham, P., & Brantingham, P. (1984). Patterns in crime . New York: Macmillan.
Brantingham, P. L., & Brantingham, P. J. (1995). Location quotients and crime hot spots in the city. In C. Block, M. Dabdoub, & S. Fregly (Eds.), Crime analysis through computer mapping (pp. 129–150). Washington, DC: Police Executive Research Forum.
Bratton, W. (1996). Cutting crime and restoring order: what America can learn from New York’s finest. Speech presented to the Heritage Foundation on October, 15 , 1996.
Ceccato, V. (2013). Moving safely: crime and perceived safety in Stockholm’s subway stations . Lanham: Lexington.
Clarke, Ronald V. 2010. Crime science. In The Sage handbook of criminological theory. , edited by Eugene McLaughlin and Tim Newburn Thousand Oaks, CA: Sage.
Clarke, R., & Eck, J. (2005). Crime analysis for problem solvers in 60 small steps . Washington, DC: Office of Community Oriented Policing.
Cohen, L., & Felson, M. (1979). Social change and crime rate trends: a routine activity approach. American Sociological Review, 44 (4), 588–608.
Clarke, Ronald V. 2002. Thefts of and from cars in parking facilities. Problem-Oriented Guides for Police Series, No. 13 . Washington, DC: U.S. Department of Justice, Office of Community Oriented Policing Services.
Clarke, R., & Eck, J. (2007). Understanding risky facilities. Problem Specific Guide Series . Washington, DC: Office of Community Oriented Policing, U.S. Department of Justice. Clarke, R., & Felson, M. (Eds.).
Cui, Lin., and Walsh, Randall. (2014). Foreclosure, vacancy, and crime. Working Paper 20593, National Bureau of Economic Research, Cambridge, MA. October, 2014.
Drawve, G., Moak, S. C., & Berthelot, E. R. (2016). Predictability of gun crimes: a comparison of hot spot and risk terrain modelling techniques. Policing and Society, 26 (3), 312–331.
Eck, J., Clarke, R., & Guerette, R. (2007). Risky facilities: crime concentration in homogeneous sets of facilities. In Crime prevention studies (Vol. 21). Monsey (New York): Criminal Justice Press.
Farrrell, G., & Pease, K. (1993). Once bitten, twice bitten: repeat victimization and its implications for crime prevention. In Crime prevention unit paper 46 . London, UK: Home Office.
Felson, M. (2003). The process of co-offending. In M. Smith & D. Cornish, Crime prevention studies: theory for practice, in situational crime prevention (Vol. 16,pp. 149–167). Monsey, NY: Criminal Justice Press.
Felson, M., & Boivin, R. (2015). Daily crime flows within a city. Crime Science, 4 (2015), 31.
Gale, J. A., & Coupe, T. (2005). The behavioural, emotional and psychological effects of street robbery on victims. International Review of Victimology, 12 (1), 1–22.
Geographic Online Address Translator. (2016). GOAT User Guide. http://a030-goat.nyc.gov/goat/UserGuide
Groff, E. R. (2011). Exploring ‘near’: characterizing the spatial extent of drinking place influence on crime. Australian and New Zealand Journal of Criminology, 44 (2), 156–179.
Groff, E. R., Weisburd, D., & Yang, S.-M. (2010). Is it important to examine crime trends at a local “micro” level?: a longitudinal analysis of block to block variability in crime trajectories. Journal of Quantitative Criminology, 26 , 7–32.
Harries, K. D. (1991). Alternative denominators in conventional crime rates. Environmental Criminology , P 147–165, 1981, Paul J Brantingham and Patricia L Brantingham, ed. - See NCJ-87681).
Herrmann, Christopher R. (2012a). Risky businesses: a micro-level spatiotemporal analysis of crime, place, & business establishment type. Unpublished PhD Thesis: New York: The City University of New York.
Herrmann, Christopher R., 2012b. Exploring street-level spatiotemporal dimensions of violent crime in Bronx, NY (2006–2010). Crime Modeling and Mapping Using Geospatial Technologies Series . Ed. Leitner, M. Springer, 2012.
Herrmann, Christopher R. (2015). The dynamics of robbery and violence crime hot spots. Special Journal Issue – Spatiotemporal Patterns of Crime: The Dynamics of Shifting Crime Risk in Urban Areas. Crime Science 2015, 4:33. October, 2015.
Irvin-Erickson, Y., & La Vigne, N. G. (2015). A spatio-temporal analysis of crime at Washington, DC metro rail: stations’ crime-generating and crime-attracting characteristics as transportation nodes and places. Crime Science, 2015 (4), 14.
Jeffery, C. R. (1977). Crime prevention through environmental design (Second ed.). Beverly Hills, CA: Sage.
Johnson, R. And Ratcliffe, JH. (2012). When does a drug market become a drug market? Finding the boundaries of illicit event concentrations. In Crime modeling and mapping using geospatial technologies (Vol. 8, pp. 25–48). Springer Netherlands.
King, D. (2011). Developing densely: estimating the effect of subway growth on New York City land uses. Journal of Transport and Land Use, 4 (2). https://doi.org/10.5198/jtlu.v4i2.185 .
Laycock, G. (2001). Hypothesis-based research: the repeat victimization story. Criminology and Criminal Justice, 1 , 59–82.
Lemieux, A. M., & Felson, M. (2012). Risk of violent crime victimization during major daily activities. Violence and Victims, 27 (5), 635.
Levine, Ned (2015). CrimeStat: a spatial statistics program for the analysis of crime incident locations (v 4.02). Ned Levine & Associates, Houston, Texas, and the National Institute of Justice, Washington, D.C.
Loukaitou-Sideris, Anastasia (1999). Hot spots of bus stop crime: the importance of environmental attributes. American Planning Association. Journal of the American Planning Association ; Autumn 1999; 65, 4.
Loukaitou-Sideris, A. (2011). Safe on the move: the importance of the built environment. In: Ceccato V. (Ed), The urban fabric of crime and fear. Dordrecht: Springer.
Madensen, T. D., & Eck, J. E. (2013). Crime places and place management. In F. T. Cullen & P. Wilcox (Eds.), The Oxford handbook of criminological theory (pp. 554–578). New York: Oxford University Press.
Madensen, T, and Eck, J. (2008). Violence in bars: exploring the impact of place manager decision-making. Crime Prevention and Community Safety: An International Journal , 2008, Vol.10(2), p.111.
Newton, Andrew D. (2018). Macro-level generators of crime, including parks, stadiums, and transit stations. In: The Oxford handbook of environmental criminology. Oxford University Press.
Newton, A. D. (2014). Crime on public transport. In Encyclopedia of criminology and criminal justice (pp. 709–720). London: Springer.
Chapter Google Scholar
New York City Police Department. (2017). NYPD crime data warehouse, Computer file
New York City Department of City Planning (2010). City of New York Information Technology Division Geographic Systems Section. Geosupport user guide . Available at https://www1.nyc.gov/assets/planning/download/pdf/data-maps/open-data/upg.pdf?r=16b
Ratcliffe, JH. (2010). Crime mapping: spatial and temporal challenges. In Handbook of quantitative criminology edited by Alex R. Piquero and David Weisburd. Springer Science & Business Media, 2010.
Sedelmaier, C. M. (2015). “Wolves to the door” or “lambs to the slaughter?” crime opportunity searches on a new public transport system. In V. Ceccato & A. Newton (Eds.), Safety and security in transit environments: an interdisciplinary approach . London: Palgrave.
Sherman, L., & Weisburd, D. (1995). General deterrent effects of police patrol in crime ‘hot spots’: a randomized study. Justice Quarterly, 12 (4).
Stults, B. J., & Hasbrouck, M. (2015). The effect of commuting on city-level crime rates. Journal of Quantitative Criminology, 31 (2), 331–350.
Telep, C., Weisburd, D., Gill, C., Vitter, Z., & Teichman, D. (2014). Displacement of crime and diffusion of crime control benefits in large-scale geographic areas: a systematic review. Journal of Experimental Criminology, 10 , 515–548.
Townsley, M. (2008). Visualising space time patterns in crime: the hotspot plot. Crime Patterns and Analysis., 1 https://core.ac.uk/download/pdf/143865798.pdf .
Twinam, T. (2017). Danger zone: land use and the geography of neighborhood crime. Journal of Urban Economics, 2017, 100 (C), 104–119.
Weisburd, D., Wyckoff, L. A., Ready, J., Eck, J. E., Hinkle, J. C., & Gajewski, F. (2006). Does crime just move around the corner? A controlled study of spatial displacement and diffusion of crime control benefits. Criminology, 44 , 549–592.
Weisel, D. L., Smith, W. R., Garson, G. D., Pavlichev, A., & Wartell, J. (2006). Motor vehicle theft: crime and spatial analysis in a non-urban region . Available at http://www.ncjrs.gov/pdffiles1/nij/grants/215179.pdf .
Wheeler, A. P., Kim, D.-Y., & Phillips, S. W. (2018). The effect of housing demolitions on crime in Buffalo, New York. Journal of Research in Crime and Delinquency, 55 (3), 390–424.
Yavus, N., & Welch, E. W. (2010). Addressing fear of crime in public space: gender differences in reaction to safety measures in train transit. Urban Studies Journal, 47 (12), 2491–2515 November 2010.
Yu, S.-s. V. (2011). Do bus stops increase crime opportunities? LFB Scholarly Publishing LLC, El Paso, 2011 .
Download references
The authors would like to acknowledge funding for this research provided by the Research Foundation of the City University of New York (PSC-Award #50).
Author information
Authors and affiliations.
Department of Law & Police Science, CUNY John Jay College of Criminal Justice, 524 West 59th Street, New York, NY, 10019, USA
Christopher R. Herrmann
Department of Environmental, Occupational, and Geospatial Health Sciences, CUNY Graduate School of Public Health and Health Policy, 55 W 125th Street, New York, NY, 10027, USA
Andrew R. Maroko
National Police Foundation, 2550 S Clark Street, Suite 1130, Arlington, VA, 22202, USA
Travis A. Taniguchi
You can also search for this author in PubMed Google Scholar
Corresponding author
Correspondence to Christopher R. Herrmann .
Additional information
Publisher’s note.
Springer Nature remains neutral with regard to jurisdictional claims in published maps and institutional affiliations.
Rights and permissions
Reprints and permissions
About this article
Herrmann, C.R., Maroko, A.R. & Taniguchi, T.A. Subway Station Closures and Robbery Hot Spots in New York City—Understanding Mobility Factors and Crime Reduction. Eur J Crim Policy Res 27 , 415–432 (2021). https://doi.org/10.1007/s10610-020-09476-x
Download citation
Accepted : 21 December 2020
Published : 03 February 2021
Issue Date : September 2021
DOI : https://doi.org/10.1007/s10610-020-09476-x
Share this article
Anyone you share the following link with will be able to read this content:
Sorry, a shareable link is not currently available for this article.
Provided by the Springer Nature SharedIt content-sharing initiative
- Crime reduction
- Crime normalization hypothesis
- Transit crime
- Subway crime
- Subway station
- New York City
- Find a journal
- Publish with us
- Track your research
The Civic Analytics program, led by Professor Constantine Kontokosta, works directly with cities to acquire, analyze, and derive insight from data in order to solve tangible and significant problems of city management, policy, and planning.
The Health, Environment, and Policy program, led by Professor Kevin Cromar, improves health through scientific research, direct policy engagement, and collaboration with agencies at the local, federal, and international levels.
The Human Exploitation and Resilience program, led by Meredith Dank, documents and elevates the voices of the exploited and the vulnerable, highlighting their resilience and perseverance through rigorous, empirical research.
The Litmus program, led by Professor Angela Hawken, works with public agencies and the people they serve to develop and rigorously test new ideas for improving the performance of the public sector.
The Transportation and Land-Use program, led by Professor Eric Goldwyn, examines transit-infrastructure projects, land-use policies, and complementary data sets to understand how public agencies build, manage, and pay for capital projects, like subway expansions, bicycle lanes, and high speed rail.
The Urban Expansion program, led by Professor Shlomo Angel and supported jointly with the NYU Stern Urbanization Project, works with rapidly growing cities to better prepare them for their inevitable growth.
The Director’s Office, led by the Director of NYU Marron Institute, opportunely engages with researchers on urban-focused projects that can develop into full programs if they demonstrate impact and are viable.
Costly Lessons from the Second Avenue Subway
Eric goldwyn writes in the new york review of books.
In the New York Review of Books , Research Scholar Eric Goldwyn’s “Costly Lessons from the Second Avenue Subway” reviews Philip Plotch’s book, Last Subway: The Long Wait for the Next Train in New York City . Goldwyn writes:
In our research on transit-infrastructure construction costs at NYU’s Marron Institute of Urban Management, my colleagues Alon Levy, Elif Ensari Sucuoğlu, and I have collected data on more than five hundred urban rail projects in fifty countries and found that New York’s are consistently the most expensive in the world. Outside of New York, new subways and extensions typically cost between $250-$450 million per mile. While every project is unique, it is not immediately clear why digging a subway on the Upper East Side is twenty times more expensive than in Seoul or ten times more expensive than in Paris.
He offers insights as to why this might be the case:
The incredibly high costs of phase one of the Second Avenue subway highlight three problems that plague transit-infrastructure costs across the country. First, although phasing projects reduces voters’ and the federal government’s initial financial commitment, this incremental approach creates downstream costs. In the case of the Second Avenue subway, expensive work that could have been done once for the entire project, such as launching the tunnel boring machine or carrying out environmental studies, must now be replicated for each phase of construction. Second, the procurement process has not galvanized robust competition to bring down costs. Only two companies bid on the contract to dig the tunnel for phase one of the Second Avenue subway, making the final cost of digging 20 percent more than the initial estimate. Third, the MTA’s efforts to comply with regulations, mollify people who are impacted by the project, and appease other governmental agencies leads to decision-making that often accepts additional costs unrelated to the project, such as sewer line replacement, noise mitigation, alignment changes, or street rebuilding even for those unaffected by construction.
Read the Review
What Should the U.S. Do about High-Speed Rail? A Conversation with Noah Smith
Please fill out the information below to receive our e-newsletter(s). *Indicates required.
- Please correct the following errors:
- - Missing email address
- - Invalid email address
- - Select country
- Could not connect to the registration server. Please try again later.
You've just been sent an email that contains a confirmation link. Please click on that link to activate your subscription.
Unlike New York’s Subway, DC’s Metro perpetually must justify its existence. Why?
October 3, 2018
New York’s Subway and Washington, DC’s Metro are two of the United States’ busiest rapid-transit systems. But people in the two cities use transit differently.
In New York, multimodal transportation is integral to every aspect of city living – both culturally and practically. In DC, the Metro lines – built over 60 years after New York’s system – are primarily used for commuting to work.
I recently wrote about one clear aspect of this contrast: the differing angles from which the New York Times and Washington Post cover transit. But news coverage is just one of many cultural and political factors that underlie New York and DC’s contrasting mobility cultures – cultures that stem largely from how their transportation systems developed.
The New York region grew up around its urban subway and suburban commuter rail systems, making the city dependent on them by design. Meanwhile, DC-area jurisdictions constructed the Metro largely to serve auto-oriented residents traveling into the city, with the rail system substituting for proposed urban interstates that never got built.
Metro must simultaneously serve car-oriented suburbs and walkable city neighborhoods
Like many American cities, DC’s extensive streetcar system was chopped up in the mid-twentieth century. In their wake, highways paved the way to increasingly sprawling suburbs, and it seemed only a matter of time before the highways carved up the urban core of the nation’s capital as well.
However, unlike similar cities that lacked rapid transit systems at the time, DC fought back. Residents successfully stopped construction of the Three Sisters Bridge, which would have opened the highway expansion floodgates, and funding was diverted to transit expansion. As a result, Metro – initially an afterthought to the proposed freeways – became a focal point of the region’s vision for transportation.
Since Metro was built to fulfill the same needs as the canceled urban interstates, it still had to cater to the region’s auto-oriented suburban population. As a result, many Metro stations are surrounded not by dense, vibrant, mixed-use communities, but instead by asphalt on which drivers can store their cars when they ride the train into town. The low-density suburbs those isolated park-and-ride stations serve were planned primarily around the automobile, so multimodal first- and last-mile solutions at outlying stations are limited.
Only 5 percent of households in the DC region are car-free. Meanwhile, 20 percent of New York-area households do not own cars.
This might explain why only around 5 percent of DC-area households get by without cars , overshadowing the relatively high proportion of car-free households in Washington itself. For comparison, over 20 percent of New York-area households – including nearly half in New York City – are car-free. Car-owning residents are likely to attribute their ability to participate in many enjoyable activities – such as family gatherings, little league games, and dinner outings – to perceived freedom that their automobiles allow them.
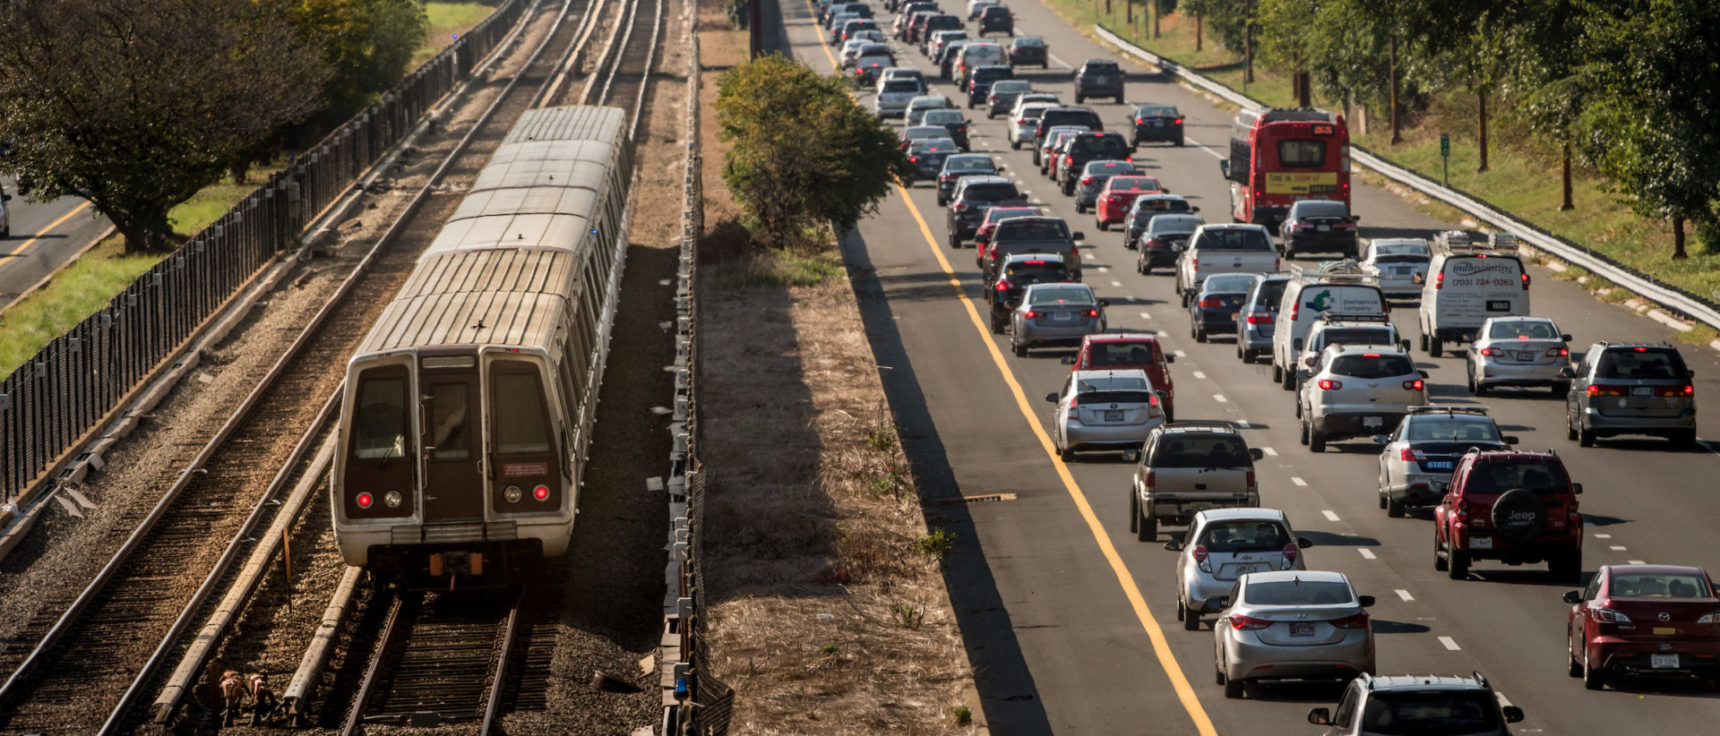
WMATA’s cuts to night and weekend rail service in recent years, which took effect as car-based alternatives such as ride-hailing expanded, have helped bring these problems into DC’s urban core. City-dwelling millennials, despite comprising a plurality of Metro’s riders and shunning car ownership, are using the system somewhat less at all times. But when it comes to millennials’ weekend ridership, which has dropped more than 40 percent since 2016, the bottom has utterly fallen out.
Greater Greater Washington President David Alpert, for example, who lives in DC’s centrally located Dupont Circle neighborhood, pointed out that he is particularly likely to use ride-hailing for night and weekend activities, when he finds transit currently “ just isn’t very dependable .”
Thus, while the trials and tribulations of driving are reduced to little more than funny stories to tell friends and family, the hassles of Metro’s aging infrastructure compound into apocalyptic cataclysms.
When stakeholders in multimodal transportation have to spend valuable time justifying Metro’s very existence, the improvements that would both resolve Metro’s infrastructural issues and make transit more useful for non-work activities become virtually impossible.
New York grew up around transit, and the resulting connections remain essential to daily life
While the few remnants of the abandoned streetcar system that shaped much of DC rot away , the century-old subway system that shaped New York carries nearly 6 million riders each day. Commuter rail lines fan out from subway hubs into the suburbs. Even overseas rail systems struggle to match the incredible rate at which the subway – which includes lines constructed by both public and private entities – expanded in the early part of the 20 th century. New York’s level of 24-hour service still remains unmatched anywhere else in the world.
But New York’s subway did not escape the mid-20 th century transportation dark ages unscathed. As rail infrastructure was allowed to decay, reliability and ridership declined steeply. Important lines were abandoned, including the Second Avenue elevated line that has cost billions to just partially replace. And system expansion slowed to a snail’s pace, never to recover.
However, the essence of the city’s transportation culture held strong. Even when the subway hit rock bottom, with its delayed trains covered in graffiti, millions of riders depended on transit – the nerve supporting all aspects of New York life – every day.
Today, the New York subway system – with all its ups and downs – continues to symbolize topsy-turvy life in the fast-paced city. Even as aging infrastructure continues to cause problems and the powers that be have struggled to come up with badly needed funding for transit, there’s never been a question as to whether the general population is committed to the subway’s success – in contrast to DC.
This has helped motivate riders to organize, giving rise to advocacy groups like the NYPIRG Straphangers . These advocacy organizations may not always praise the subway. But instead of just blindly spreading negativity, they try to amplify riders’ voices and legitimately want the system to improve.
Stewart Mader , a New Jersey resident who serves as chair of the PATH Riders’ Council, explained that, though these organizations run the risk of inadvertently repelling would-be riders if they treat transit agencies as their adversaries, they have great potential to build a strong constituency for multimodal transportation.
“Advocacy organizations are most effective when they help the average customer understand how political decisions can support, or undermine, the quality of their everyday transit experience,” Mader said. “This education helps people recognize – and vote for – candidates for elected office who are making transit a priority.”
Subscribe to Receive Updates on the Latest Mobility Research and Trends
- Share full article
Advertisement
Supported by
Citing Safety, New York Moves Mentally Ill People Out of the Subway
Medical workers and police officers are removing people suffering from psychiatric distress. The most troubled are forced to the hospital.

Inside a subway station in Lower Manhattan, a group of police officers slowly followed a disheveled man in a soiled gray sweatshirt who was stammering and thrashing his arms wildly.
“Please, leave me alone,” he shouted. He thumped his chest with an open palm and then, growing exasperated, sat down on a staircase. “What did I do wrong?”
Mucus had crusted in his beard. A pair of stained pants hung off his slender frame.
“Come on,” one officer, Heather Cicinnati, said as the man stumbled forward, disoriented and agitated. “We’ve got to leave the station.”
The police officers were part of a team led by a medical worker whose job is to move — by force, if needed — mentally ill people, who are often homeless, out of New York City’s transit system. On that brisk March morning, the team handcuffed him and dragged him out of the subway station. Then, they placed a white spit hood over his head.
The intervention teams are part of an expansive effort to make the subway safer after a string of shocking crimes. Part of the plan involves finding solutions to one of the transit system’s most frustrating problems: people experiencing mental health issues and homelessness living on trains and in stations.
Officials with the Metropolitan Transportation Authority, which operates the subway, said they were doing what was necessary to help troubled people while keeping them away from passengers. In survey after survey , riders have said they would use mass transit more often if they saw fewer people behaving erratically and more police officers.
But some advocates for mentally ill people believe the teams use heavy-handed tactics that do more harm than good. Ruth Lowenkron, director of the disability justice program for New York Lawyers for the Public Interest, expressed dismay over the team’s use of a spit hood and called it “an anachronistic tool.”
“This is not who we want to be as a society,” Ms. Lowenkron said. “There’s no reason to do this. And it is not going to make people safer.”
In defense of the method, M.T.A. officials said that the agency’s police officers must sometimes restrain people who are suffering from severe psychiatric distress in order to provide them with critical medical care.
Launched last fall, the program, called Subway Co-Response Outreach, or SCOUT , has removed at least 113 people from the subway. Most go willingly to shelters, or to hospitals for medical treatment, according to transit officials.
Among the people removed from the subway, 16 have been sent to the hospital against their will for psychiatric assessments. Most involuntary detainees were admitted as patients.
“This is the governor and the city and the M.T.A. coming together to do something about it,” Tim Minton, a spokesman for the authority, said as the officers detained the distraught man in March. “To try to help people who need treatment, who need assistance, and not just walk away from it.”
Violent attacks by homeless, mentally ill people are relatively rare, and mentally ill people are more likely to be the victim of a violent crime than to commit one. But some New Yorkers were put on edge by a series of high-profile attacks carried out by mentally ill homeless people in recent months. Crime rates also surged in the transit system early this year before easing.
The SCOUT program is growing — in March, Gov. Kathy Hochul said the state would provide $20 million to expand it from two teams to as many as a dozen by the end of 2025. City and state officials have also flooded the transit system with thousands of police officers and surveillance cameras. In March, Ms. Hochul deployed the National Guard in the system, building up to a force of roughly 3,000 law enforcement officers dedicated to patrolling mass transit. In late 2022, she told the M.T.A. to put cameras in every train car, and today there are about 16,000 systemwide.
Every weekday, the two SCOUT teams, each made up of one medical worker and two to three M.T.A. police officers , roam some of the subway’s busiest stations in search of people who appear to be sheltering there.
Just before the encounter in March at the Fulton Street station in Lower Manhattan, the team’s medical worker, Ameed Ademolu, 41, had already ejected several people from the subway that morning without any resistance.
Mr. Ademolu was carrying a clipboard and wearing an orange vest and face mask when he walked up to the man in the gray sweatshirt. The officers, standing a few yards away as they awaited Mr. Ademolu’s orders, watched in case the man or any onlookers lashed out.
Mr. Ademolu quickly made the call: The officers would need to take the man to a hospital against his will. He resisted for about 20 minutes, ranting and fumbling through his pockets.
State laws allow both the police and medical workers to take people to a hospital by force when their behavior poses a threat of “serious harm” to themselves or others.
Once outside, the officers pressed the handcuffed man against a wall and put the spit hood over his head because, they said, he was spraying mucus onto the officers as he shouted. Then, they strapped him to a gurney for transport to Bellevue Hospital.
Nancy Juarez, 25, from Brooklyn, was walking by the scene with a friend when she stopped and urged the officers to let the man go.
“This is harm,” said Ms. Juarez, who said that she works mostly remotely as a policy analyst at the Center on Juvenile and Criminal Justice, a San Francisco-based nonprofit organization that opposes incarceration. “This causes more trauma.”
But officials said that some people who have been removed from the system have behaved in ways that put themselves and others at risk. One person was known to light fires inside a station. Another was reported to have pushed a rider toward the tracks, and a third said he believed that he was in Iraq and that the outreach team was a group of hostile soldiers.
Sergeant Steven Simmons, 26, who serves on a SCOUT team, said he was frustrated by the reactions of some observers who seemed to misunderstand the team’s intent. He said he believed that the work he was doing was helping people who would otherwise languish on the street.
“We just have to know in our own hearts that we’re getting him the help he needs,” he said. “Sometimes, you can’t please everyone, unfortunately.”
Ana Ley is a Times reporter covering New York City’s mass transit system and the millions of passengers who use it. More about Ana Ley
NYC subways join airports, police in using AI surveillance. Privacy experts are worried.
New York City’s subway system is the latest to implement artificial intelligence-powered surveillance, following an increase of similar software use in airports and police stations across the country.
The Metropolitan Transit Authority, the agency that operates the city’s public transportation, quietly rolled out a third-party technology to help crack down on fare evaders, NBC reported .
The new policy comes weeks after the Transportation Security Administration announced an expansion of facial recognition software use at over 400 airports. Police in Westchester County, a suburb outside of NYC, also recently revealed that they used AI to scan vehicle license plates and examine the driving patterns of vehicles.
What is AI software used for?
The MTA software was deployed to track fare evaders and is in use at seven subway stations, according to a report published by MTA in May. MTA plans to implement the software in “approximately two dozen more stations, with more to follow” by the end of the year.
“The MTA uses this tool to quantify the amount of fare evasion without identifying fare evaders,” Joana Flores, a spokesperson for MTA, told USA TODAY.
The AI software is used to count the number of unpaid entries into subway stations, according to the agency's May report. From there, “an evasion rate can then be calculated by comparing the number of unpaid entries to the number of paid entries,” the report states.
The data will be used to “cross-check” with systemwide estimates of fare evasion. The software– created by AWAIIT, a Spanish company – uses surveillance cameras to scan travelers and send pictures of potential fare evaders to nearby station agents, as shown in a promotional video .
“The MTA thus will develop – for the first time – a much increased ability to pinpoint evasion spikes by station, by day of week, and by time of day,” the MTA report said. “With the technology providing reliable before and after evasion counts, it will be increasingly possible to test new approaches in search of what really works.”
Data privacy experts raise alarms on AI use
MTA reported $690 million in revenue losses because of fare evasion in 2022.
The new policy has drawn many critics. Data and privacy experts said MTA’s new initiative doesn't address the underlying problem that causes fare evasion, which is related to poverty and access.
Instead, the program tries “to use technology to solve a problem in a way that is more or less a Band-Aid,” said Jeramie Scott, senior counsel and director of the Electronic Privacy Information Center (EPIC), a Washington, D.C.-based advocacy, litigation and research center.
Caitlin Seeley George, campaigns and managing director for Fight for the Future, a Massachusetts-based digital rights nonprofit, said she is concerned about policies that contribute to a culture of mass surveillance.
“Facial recognition technology makes it so that the concept of privacy is moot because people’s every movement can be tracked and watched,” George said.
AI becoming a more popular security tool
The use of AI for surveillance and identity detection has risen over the past decade. Although there are no direct federal regulations on the use of AI, about two dozen state or local governments across the United States passed laws restricting or banning facial recognition from 2019 to 2021.
However, certain cities and states, including California, Virginia and New Orleans have since reversed these restrictions over the past year.
Earlier this month, the TSA announced it will be expanding its 25-airport pilot program of facial recognition software to 430 airports across the country over the next several years following an “extremely promising” pilot.
The pilot program utilizes one-to-one matching, which means that a passenger’s picture is only compared to their government-issued ID, including a driver's license or passport.
The TSA facial recognition program is voluntary, and travelers are allowed to opt out in favor of an alternative verification process, a TSA spokesperson told USA TODAY. Data captured by the software is not stored.
"TSA is committed to protecting passenger privacy, civil rights, and civil liberties and ensuring the public’s trust as it seeks to improve the passenger experience through its exploration of identity verification technologies," a TSA spokesperson wrote in a statement to USA TODAY.
Scott, of the Electronic Privacy Information Center, said he fears facial recognition technology use in airports will become mandatory, given that TSA Administrator David Pekoske said that would be the goal during a South by Southwest fireside chat in April.
“I know when I submitted a passport application, I did so to obtain a passport– not for the State Department to retain my photo and then use it for facial recognition,” Scott said. “Taking information provided for one purpose and then using it for a secondary purpose – that is what AI is.”
Westchester County police utilized a database of about 1.6 billion New York license plates to monitor car traffic patterns that exhibited patterns of illegal activity, leading to the arrest of a Massachusetts man for drug trafficking, according to news reports.
In Miami, police confirmed to the BBC that the department uses Clearview, an AI software that allows law enforcement customers to upload a face and match it against billions of images it has collected. Officers use the software about 450 times a year for every type of crime, Miami police told the BBC. Clearview said it had run nearly a million searches for United States police.
Use of AI sparks discrimination concerns
The use of AI by national agencies is particularly troubling because the software is flawed and often discriminates against people of color, said Albert Cahn, executive director of the Surveillance Technology Oversight Project, a nonprofit legal group based in New York City that advocates for privacy rights.
Facial recognition software has been found to be inaccurate in 98% of cases . When used by law enforcement, the software is often unable to distinguish darker faces, leading to racial profiling and false arrests, according to a 2016 study.
A 2018 study by the Massachusetts Institute of Technology also found commercial AI systems had an error rate of 34.7% for dark-skinned women, compared to 0.8% for light-skinned men.
“This technology would be creepy if it worked perfectly, but it’s even more disturbing that it’s been shown to be discriminatory,” Cahn said.
George, of Fight for the Future, also expressed concern that AI use in NYC’s subway stations will lead to mass surveillance and tracking of people’s movements.
“The MTA has said that they’re only using it to count people evading fare but the fact that this system is in place just opens up the possibility that it could be used on all travelers and could become a broader tool of surveillance and policing,” George said.
In March, a group of House and Senate lawmakers reintroduced the Facial Recognition and Biometric Technology Moratorium Act, which would stop the federal government’s use of facial recognition technologies. Data privacy experts have called for federal regulations and oversight of AI to ensure that people’s data is protected and not misused by companies.
“We just can’t predict every way that AI may be used to leverage the information that the federal government already has and there’s a lack of protections in place to prevent the federal government from doing that,” Scott said.
nysubway.com
New York City Subway System

New York Subway Map: Latest Updated Version

Large Print New York Subway Map

Late Night Subway Service Map

Buy The New York Subway Map

Service Animals and the New York Subway

Subway Surfers on the NYC Subway

New York Subway Text and Email Alerts

Senior Citizens on the Subway
Today: new york subway advisories, featured stories.

New York Subway Stations With Pushing Incidents
Criminal Pushing Incidents on the New York Subway – Attempted Murder Recent subway pushing incidents on a New York City

Subway Station Safety Tips

NYC Subway Most Dangerous Stations

New York Subway Performers – MTA Music Program Under New York

New York Subway Questions and Answers

Pay Per Ride MetroCard Compared with Unlimited MetroCard
Attractions.

AirTrain to LaGuardia Airport Planned for 2022

The Best Ways to Get To JFK Airport

Best Ways to Get to Newark Airport

The Best Ways to Get To LaGuardia Airport

Parking at JFK Airport
Can a psychologist stop fare evaders? MTA mulls new strategy to save millions
The mta has offered no timeline of when or if they’ll move forward on the plan, by andrew siff • published june 1, 2024 • updated 4 hours ago.
The MTA wants to take a new approach to curbing fare evasion and numerous failed attempts.
This time, instead of installing gadgets to stop fare beaters, they're considering hiring a psychologist to get into their minds in hopes of "shrinking" the expensive problem.
24/7 New York news stream: Watch NBC 4 free wherever you are
The MTA website is now advertising an RFP — that’s request for proposal — for a “behaviorist” who can dig into the societal trends behind an epidemic of non-payment.
MTA executives have said they're in a high stakes battle. While only 13.6% of subway riders are fare evaders, nearly half of all bus passengers skip paying. It all adds up to a staggering projected loss of $700 million this year.
"We have to win or else the system is gone," MTA CEO Janno Lieber warned at a recent board meeting.
Some riders were skeptical of the psychological approach.
Get Tri-state area news and weather forecasts to your inbox. Sign up for NBC New York newsletters.
“I mean, if the behavior analyst can come up with a solution, I don’t think it’s gonna change the way people think,” said Sheila Sessums, a Bronx resident waiting for an uptown M102 bus in Manhattan.

The MTA's application for an expert seeks someone who can conduct research on the motivations and devise behavioral interventions to stop fare evasion.
2 NYPD officers shot in Queens; suspect wounded
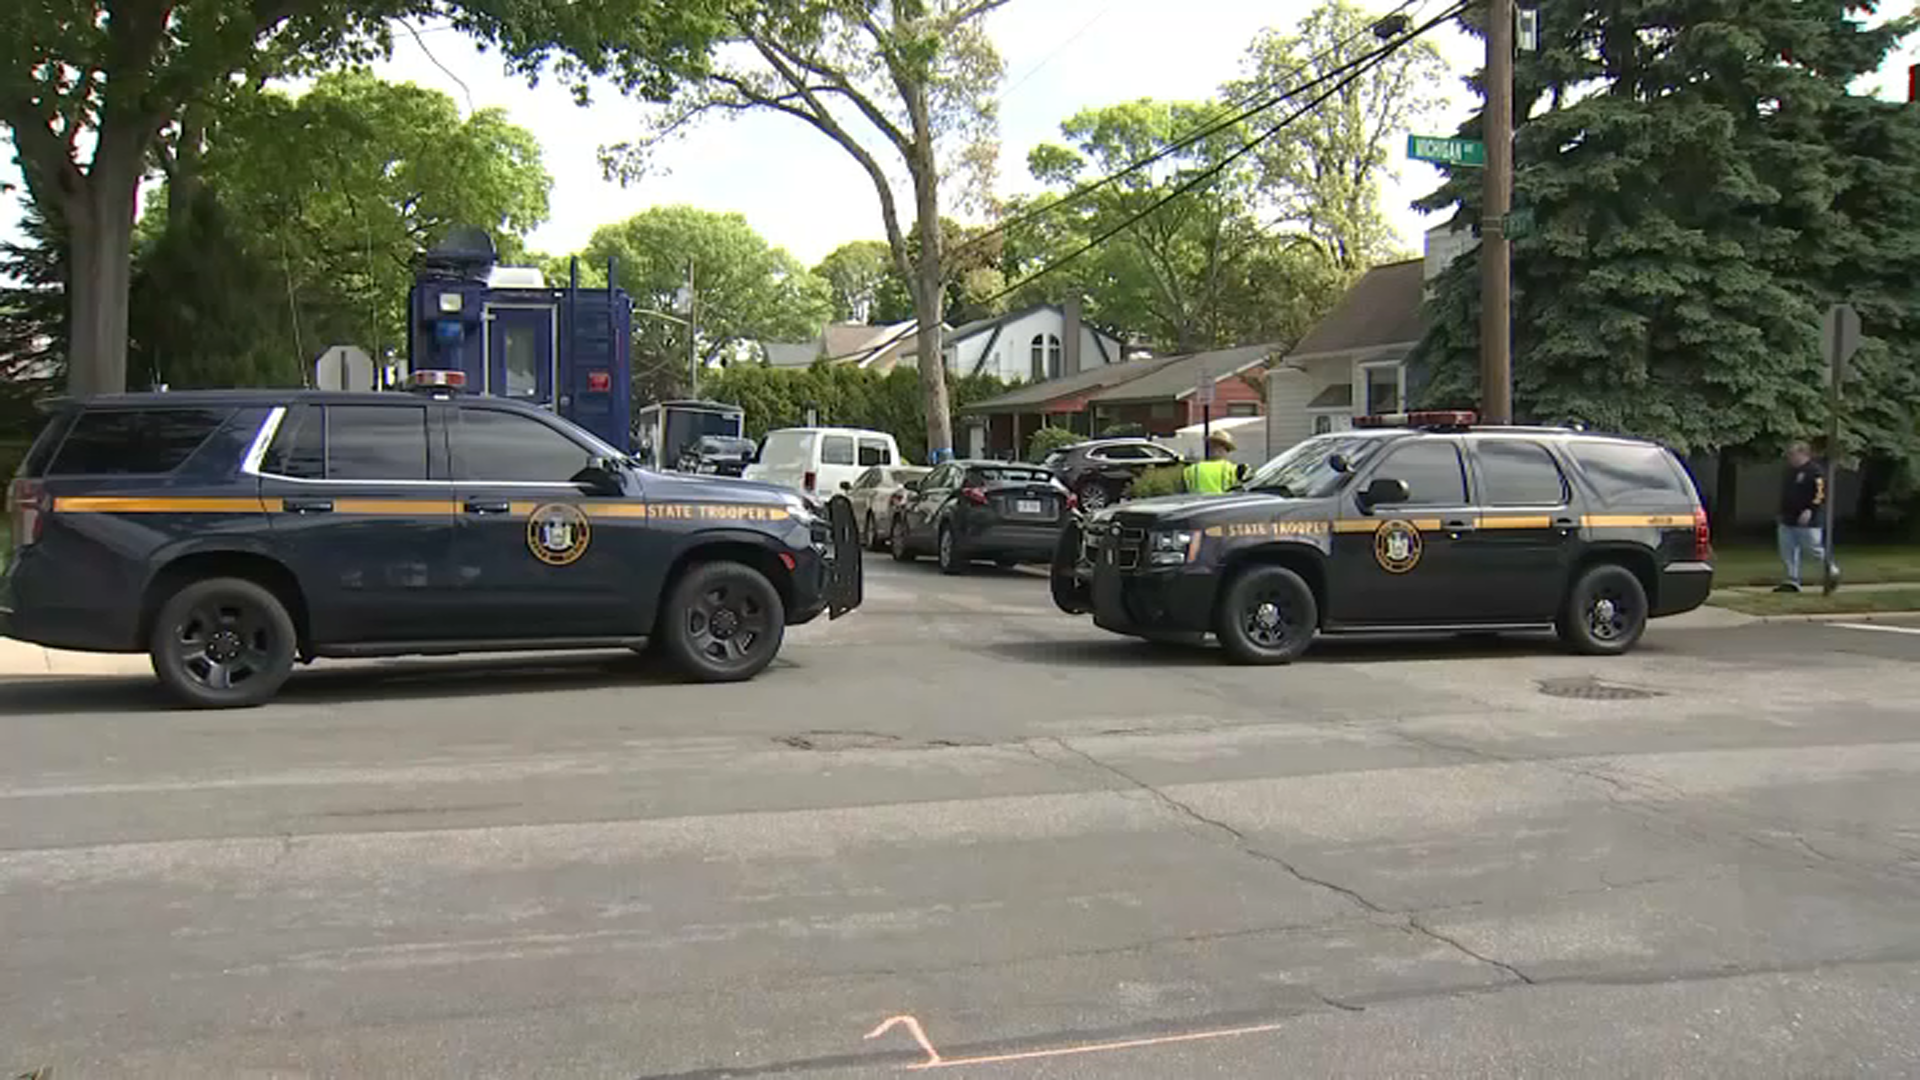
Alleged Gilgo Beach killer facing new murder charge, sources say
The MTA is only thinking about the idea. With the potential of paying the consultant between half-a-million and $1 million over a six-month period.
“The MTA is advancing a holistic approach to address fare evasion that the blue ribbon panel recommended in 2023, including efforts to reinforce the importance of paying your fare and making it easier for customers to pay," an MTA spokesperson told News 4.
But the transit union said making buses free might be a better route than solving rider psychology.
“I don’t know how that’s gonna help a person who can’t pay the fare — telling them to feel good and then telling them get off the bus isn’t gonna really help," JP Patafio, of the Transport Workers Local 100, said Friday.
Transit officials presented the board with analysis on why people evade the fare, and they're already addressing a known weakness: closing open subway gates that have led to what the MTA chairman calls crime of opportunity.
The MTA has offered no timeline of when or if they’ll move forward on the plan.
This article tagged under:
Watch CBS News
Victim of NYC subway station shooting speaks exclusively to CBS New York
IMAGES
VIDEO
COMMENTS
A conservative estimate is that New York City residents and firms pay approximately three-fourths of regional taxes—$3.4 billion of $4.6 billion in 2016—and approximately 45 percent of statewide taxes—$538 million of $1.1 billion in 2016. These "City" contributions total $4.7 billion, in contrast to the $2.1 billion paid by taxpayers ...
The COVID-19 pandemic has yielded disproportionate impacts on communities of color in New York City (NYC). ... research for studies with contemporaneous and co-located data. ... in subway use and ...
New York City subway riders in 2017. From 2015 to 2017, researchers collected samples in 60 cities on six continents and found 4,246 known species of microorganisms. Benjamin Norman for The New ...
In the study, the research team — which includes investigators from five other New York City medical centers and others from around the country and internationally — sought to define the microbiome in New York City's subway system, which in 2013 was used by an average of 5.5 million people per day, according to the city's Metropolitan ...
New York City's Second Avenue Subway, which opened in 2017 after a long and troubled genesis, was a transit milestone for the city — the first major subway expansion in 50 years, and a boon ...
The New York City metropolitan area was hard hit by COVID-19, and the pandemic brought with it unprecedented challenges for New York City Transit. This paper addresses the techniques used to estimate dramatically changing ridership, at a time when previously dependable sources suddenly became unavailable (e.g., local bus payment data, manual ...
The night before, on March 22, the New York State executive order "New York State on PAUSE" went into effect, which ordered nonessential businesses to pause in-office operations. This was a part of a dramatic series of actions by government and private organizations, as well as by individuals, designed to slow the spread of the virus.
When the New York City subway opened in 1904, police had to call in reserves to tame the million-strong crowds clamoring to enter the tunnels. Within weeks, hurtling beneath the earth at speeds never before realized in a dense urban environment had become an utterly ordinary experience. For 120 years, the NYC subway, running 24 […]
The scientists used sterile swabs to collect 1,457 samples across 468 subway stations, covering 24 lines in 5 boroughs. The team sampled turnstiles, wooden and metal benches, stairway handrails, trashcans, emergency exits, and card kiosks. On trains, they sampled doors, poles, handrails, and seats. They also sampled railway stations and public ...
This research aims to evaluate the impact of disruptions on the New York City subway system to passengers in terms of time and financial loss. A network model will be built to represent the New York City subway system, and the passenger flow will be simulated using the shortest-path algorithm. This paper uses the network and the algorithm to check the delay caused by the removal of one or two ...
Jeffrey E. Harris. New York City's multipronged subway system was a major disseminator - if not the principal transmission vehicle - of coronavirus infection during the initial takeoff of the massive epidemic that became evident throughout the city during March 2020. The near shutoff of subway ridership in Manhattan - down by over 90 ...
Investigation of a river-tunnel effect on PM2.5 concentrations in New York City subway stations. Transportation Research Part D: Transport and Environment , 2023; 115: 103579 DOI: 10.1016/j.trd ...
Abstract. Through the use of a Physarum Polycephalum organism and a scaled-down model of the New York Subway System, this study created and analyzed a system of "maximum efficiency". By taking advantage of the capabilities of a Physarum organism, a system reminiscent of the existing subway system was created, with deviations analyzed to find differences in both track usage and overall costs.
This paper takes advantage of a natural experiment involving subway station closures to examine how subway ridership is associated with the impact of robbery victimization within spatial network buffers immediately surrounding subway stations in Bronx (County), New York. The New York City subway system is the busiest in the USA, with an annual ridership estimated at 1.8 billion people. Key ...
New York City's digital subway map. See real-time, nighttime, and weekend subway routes, train arrival times, service alerts, emergency updates, accessible stations, and more.
Outside of New York, new subways and extensions typically cost between $250-$450 million per mile. While every project is unique, it is not immediately clear why digging a subway on the Upper East Side is twenty times more expensive than in Seoul or ten times more expensive than in Paris. He offers insights as to why this might be the case:
A 2022 New York Times analysis of M.T.A. and police statistics showed that the possibility of being the victim of violent crime in the subway was relatively remote.
The Second Avenue Subway Project is a major capital expansion project of the New York City subway that will provide a dedicated line for the east side of Manhattan. The project is approximately 13.7 km long including 16 stations, and its estimated cost is about 17 billion US-$.
On 29 October 2012 hurricane Sandy hit the coast of New York City. This category 1 hurricane had a devastating effect: large parts of the city were flooded and the city was out of business for several days. An estimated total damage of $41.9 billion had occurred of which $5 billion in account of the metro system. The largest damage was to the subway (underground) on Manhattan. The main ...
Since the first subway opened in 1904, the New York Subway system and its trains have provided millions of New Yorkers with cheap, fast, and remarkably reliable transportation. The New York subway system lacks the electronic complexity of such modern operations as the Washington, D.C. Metro or San Francisco's BART, and New Yorkers have few ...
The 120-year-old subway system runs 24 hours a day, 365 days a year, and sees over 4 million passengers daily. Every single day, the New York City subway system moves approximately 4 million ...
Conclude tha t 79% of the nodes in the New York City. subway network have degree 2, the network diameter is 59, more than 90% of the network nodes. have a clustering coefficient of 0, the st ...
The New York subway, prior to opening, is lauded as the "greatest thing of its kind" and is expected to solve the city's transportation problem. October 27, 1904: The New York subway officially opens. November 13, 1904: Health concerns are raised about poor subway ventilation and sanitation, as well as exposure to bacilli.
October 3, 2018. New York's Subway and Washington, DC's Metro are two of the United States' busiest rapid-transit systems. But people in the two cities use transit differently. In New York, multimodal transportation is integral to every aspect of city living - both culturally and practically. In DC, the Metro lines - built over 60 ...
Hiroko Masuike/The New York Times. Inside a subway station in Lower Manhattan, a group of police officers slowly followed a disheveled man in a soiled gray sweatshirt who was stammering and ...
New York City's subway system is the latest to implement artificial intelligence-powered surveillance, following an increase of similar software use in airports and police stations across the ...
New York Subway system transports over 5 million passengers every weekday (3 million on the weekend). This site has the official subway maps, line maps, train and station information, MTA Twitter Feed, MTA contact information, Metrocards, subway safety and popular tourist destinations.
Suspect in custody after man set on fire at subway station 01:25. NEW YORK-- A man is accused of setting a subway rider on fire on Saturday afternoon and the NYPD says he was behind a similar ...
While only 13.6% of subway riders are fare evaders, nearly half of all bus passengers skip paying. It all adds up to a staggering projected loss of $700 million this year.
Police are searching for the gunman who opened fire at an Upper East Side subway station early Sunday morning. The gunfire injured an innocent bystander, who spoke exclusively with CBS New York's ...