- Privacy Policy
Home » Secondary Data – Types, Methods and Examples

Secondary Data – Types, Methods and Examples
Table of Contents

Secondary Data
Definition:
Secondary data refers to information that has been collected, processed, and published by someone else, rather than the researcher gathering the data firsthand. This can include data from sources such as government publications, academic journals, market research reports, and other existing datasets.
Secondary Data Types
Types of secondary data are as follows:
- Published data: Published data refers to data that has been published in books, magazines, newspapers, and other print media. Examples include statistical reports, market research reports, and scholarly articles.
- Government data: Government data refers to data collected by government agencies and departments. This can include data on demographics, economic trends, crime rates, and health statistics.
- Commercial data: Commercial data is data collected by businesses for their own purposes. This can include sales data, customer feedback, and market research data.
- Academic data: Academic data refers to data collected by researchers for academic purposes. This can include data from experiments, surveys, and observational studies.
- Online data: Online data refers to data that is available on the internet. This can include social media posts, website analytics, and online customer reviews.
- Organizational data: Organizational data is data collected by businesses or organizations for their own purposes. This can include data on employee performance, financial records, and customer satisfaction.
- Historical data : Historical data refers to data that was collected in the past and is still available for research purposes. This can include census data, historical documents, and archival records.
- International data: International data refers to data collected from other countries for research purposes. This can include data on international trade, health statistics, and demographic trends.
- Public data : Public data refers to data that is available to the general public. This can include data from government agencies, non-profit organizations, and other sources.
- Private data: Private data refers to data that is not available to the general public. This can include confidential business data, personal medical records, and financial data.
- Big data: Big data refers to large, complex datasets that are difficult to manage and analyze using traditional data processing methods. This can include social media data, sensor data, and other types of data generated by digital devices.
Secondary Data Collection Methods
Secondary Data Collection Methods are as follows:
- Published sources: Researchers can gather secondary data from published sources such as books, journals, reports, and newspapers. These sources often provide comprehensive information on a variety of topics.
- Online sources: With the growth of the internet, researchers can now access a vast amount of secondary data online. This includes websites, databases, and online archives.
- Government sources : Government agencies often collect and publish a wide range of secondary data on topics such as demographics, crime rates, and health statistics. Researchers can obtain this data through government websites, publications, or data portals.
- Commercial sources: Businesses often collect and analyze data for marketing research or customer profiling. Researchers can obtain this data through commercial data providers or by purchasing market research reports.
- Academic sources: Researchers can also obtain secondary data from academic sources such as published research studies, academic journals, and dissertations.
- Personal contacts: Researchers can also obtain secondary data from personal contacts, such as experts in a particular field or individuals with specialized knowledge.
Secondary Data Formats
Secondary data can come in various formats depending on the source from which it is obtained. Here are some common formats of secondary data:
- Numeric Data: Numeric data is often in the form of statistics and numerical figures that have been compiled and reported by organizations such as government agencies, research institutions, and commercial enterprises. This can include data such as population figures, GDP, sales figures, and market share.
- Textual Data: Textual data is often in the form of written documents, such as reports, articles, and books. This can include qualitative data such as descriptions, opinions, and narratives.
- Audiovisual Data : Audiovisual data is often in the form of recordings, videos, and photographs. This can include data such as interviews, focus group discussions, and other types of qualitative data.
- Geospatial Data: Geospatial data is often in the form of maps, satellite images, and geographic information systems (GIS) data. This can include data such as demographic information, land use patterns, and transportation networks.
- Transactional Data : Transactional data is often in the form of digital records of financial and business transactions. This can include data such as purchase histories, customer behavior, and financial transactions.
- Social Media Data: Social media data is often in the form of user-generated content from social media platforms such as Facebook, Twitter, and Instagram. This can include data such as user demographics, content trends, and sentiment analysis.
Secondary Data Analysis Methods
Secondary data analysis involves the use of pre-existing data for research purposes. Here are some common methods of secondary data analysis:
- Descriptive Analysis: This method involves describing the characteristics of a dataset, such as the mean, standard deviation, and range of the data. Descriptive analysis can be used to summarize data and provide an overview of trends.
- Inferential Analysis: This method involves making inferences and drawing conclusions about a population based on a sample of data. Inferential analysis can be used to test hypotheses and determine the statistical significance of relationships between variables.
- Content Analysis: This method involves analyzing textual or visual data to identify patterns and themes. Content analysis can be used to study the content of documents, media coverage, and social media posts.
- Time-Series Analysis : This method involves analyzing data over time to identify trends and patterns. Time-series analysis can be used to study economic trends, climate change, and other phenomena that change over time.
- Spatial Analysis : This method involves analyzing data in relation to geographic location. Spatial analysis can be used to study patterns of disease spread, land use patterns, and the effects of environmental factors on health outcomes.
- Meta-Analysis: This method involves combining data from multiple studies to draw conclusions about a particular phenomenon. Meta-analysis can be used to synthesize the results of previous research and provide a more comprehensive understanding of a particular topic.
Secondary Data Gathering Guide
Here are some steps to follow when gathering secondary data:
- Define your research question: Start by defining your research question and identifying the specific information you need to answer it. This will help you identify the type of secondary data you need and where to find it.
- Identify relevant sources: Identify potential sources of secondary data, including published sources, online databases, government sources, and commercial data providers. Consider the reliability and validity of each source.
- Evaluate the quality of the data: Evaluate the quality and reliability of the data you plan to use. Consider the data collection methods, sample size, and potential biases. Make sure the data is relevant to your research question and is suitable for the type of analysis you plan to conduct.
- Collect the data: Collect the relevant data from the identified sources. Use a consistent method to record and organize the data to make analysis easier.
- Validate the data: Validate the data to ensure that it is accurate and reliable. Check for inconsistencies, missing data, and errors. Address any issues before analyzing the data.
- Analyze the data: Analyze the data using appropriate statistical and analytical methods. Use descriptive and inferential statistics to summarize and draw conclusions from the data.
- Interpret the results: Interpret the results of your analysis and draw conclusions based on the data. Make sure your conclusions are supported by the data and are relevant to your research question.
- Communicate the findings : Communicate your findings clearly and concisely. Use appropriate visual aids such as graphs and charts to help explain your results.
Examples of Secondary Data
Here are some examples of secondary data from different fields:
- Healthcare : Hospital records, medical journals, clinical trial data, and disease registries are examples of secondary data sources in healthcare. These sources can provide researchers with information on patient demographics, disease prevalence, and treatment outcomes.
- Marketing : Market research reports, customer surveys, and sales data are examples of secondary data sources in marketing. These sources can provide marketers with information on consumer preferences, market trends, and competitor activity.
- Education : Student test scores, graduation rates, and enrollment statistics are examples of secondary data sources in education. These sources can provide researchers with information on student achievement, teacher effectiveness, and educational disparities.
- Finance : Stock market data, financial statements, and credit reports are examples of secondary data sources in finance. These sources can provide investors with information on market trends, company performance, and creditworthiness.
- Social Science : Government statistics, census data, and survey data are examples of secondary data sources in social science. These sources can provide researchers with information on population demographics, social trends, and political attitudes.
- Environmental Science : Climate data, remote sensing data, and ecological monitoring data are examples of secondary data sources in environmental science. These sources can provide researchers with information on weather patterns, land use, and biodiversity.
Purpose of Secondary Data
The purpose of secondary data is to provide researchers with information that has already been collected by others for other purposes. Secondary data can be used to support research questions, test hypotheses, and answer research objectives. Some of the key purposes of secondary data are:
- To gain a better understanding of the research topic : Secondary data can be used to provide context and background information on a research topic. This can help researchers understand the historical and social context of their research and gain insights into relevant variables and relationships.
- To save time and resources: Collecting new primary data can be time-consuming and expensive. Using existing secondary data sources can save researchers time and resources by providing access to pre-existing data that has already been collected and organized.
- To provide comparative data : Secondary data can be used to compare and contrast findings across different studies or datasets. This can help researchers identify trends, patterns, and relationships that may not have been apparent from individual studies.
- To support triangulation: Triangulation is the process of using multiple sources of data to confirm or refute research findings. Secondary data can be used to support triangulation by providing additional sources of data to support or refute primary research findings.
- To supplement primary data : Secondary data can be used to supplement primary data by providing additional information or insights that were not captured by the primary research. This can help researchers gain a more complete understanding of the research topic and draw more robust conclusions.
When to use Secondary Data
Secondary data can be useful in a variety of research contexts, and there are several situations in which it may be appropriate to use secondary data. Some common situations in which secondary data may be used include:
- When primary data collection is not feasible : Collecting primary data can be time-consuming and expensive, and in some cases, it may not be feasible to collect primary data. In these situations, secondary data can provide valuable insights and information.
- When exploring a new research area : Secondary data can be a useful starting point for researchers who are exploring a new research area. Secondary data can provide context and background information on a research topic, and can help researchers identify key variables and relationships to explore further.
- When comparing and contrasting research findings: Secondary data can be used to compare and contrast findings across different studies or datasets. This can help researchers identify trends, patterns, and relationships that may not have been apparent from individual studies.
- When triangulating research findings: Triangulation is the process of using multiple sources of data to confirm or refute research findings. Secondary data can be used to support triangulation by providing additional sources of data to support or refute primary research findings.
- When validating research findings : Secondary data can be used to validate primary research findings by providing additional sources of data that support or refute the primary findings.
Characteristics of Secondary Data
Secondary data have several characteristics that distinguish them from primary data. Here are some of the key characteristics of secondary data:
- Non-reactive: Secondary data are non-reactive, meaning that they are not collected for the specific purpose of the research study. This means that the researcher has no control over the data collection process, and cannot influence how the data were collected.
- Time-saving: Secondary data are pre-existing, meaning that they have already been collected and organized by someone else. This can save the researcher time and resources, as they do not need to collect the data themselves.
- Wide-ranging : Secondary data sources can provide a wide range of information on a variety of topics. This can be useful for researchers who are exploring a new research area or seeking to compare and contrast research findings.
- Less expensive: Secondary data are generally less expensive than primary data, as they do not require the researcher to incur the costs associated with data collection.
- Potential for bias : Secondary data may be subject to biases that were present in the original data collection process. For example, data may have been collected using a biased sampling method or the data may be incomplete or inaccurate.
- Lack of control: The researcher has no control over the data collection process and cannot ensure that the data were collected using appropriate methods or measures.
- Requires careful evaluation : Secondary data sources must be evaluated carefully to ensure that they are appropriate for the research question and analysis. This includes assessing the quality, reliability, and validity of the data sources.
Advantages of Secondary Data
There are several advantages to using secondary data in research, including:
- Time-saving : Collecting primary data can be time-consuming and expensive. Secondary data can be accessed quickly and easily, which can save researchers time and resources.
- Cost-effective: Secondary data are generally less expensive than primary data, as they do not require the researcher to incur the costs associated with data collection.
- Large sample size : Secondary data sources often have larger sample sizes than primary data sources, which can increase the statistical power of the research.
- Access to historical data : Secondary data sources can provide access to historical data, which can be useful for researchers who are studying trends over time.
- No ethical concerns: Secondary data are already in existence, so there are no ethical concerns related to collecting data from human subjects.
- May be more objective : Secondary data may be more objective than primary data, as the data were not collected for the specific purpose of the research study.
Limitations of Secondary Data
While there are many advantages to using secondary data in research, there are also some limitations that should be considered. Some of the main limitations of secondary data include:
- Lack of control over data quality : Researchers do not have control over the data collection process, which means they cannot ensure the accuracy or completeness of the data.
- Limited availability: Secondary data may not be available for the specific research question or study design.
- Lack of information on sampling and data collection methods: Researchers may not have access to information on the sampling and data collection methods used to gather the secondary data. This can make it difficult to evaluate the quality of the data.
- Data may not be up-to-date: Secondary data may not be up-to-date or relevant to the current research question.
- Data may be incomplete or inaccurate : Secondary data may be incomplete or inaccurate due to missing or incorrect data points, data entry errors, or other factors.
- Biases in data collection: The data may have been collected using biased sampling or data collection methods, which can limit the validity of the data.
- Lack of control over variables: Researchers have limited control over the variables that were measured in the original data collection process, which can limit the ability to draw conclusions about causality.
About the author

Muhammad Hassan
Researcher, Academic Writer, Web developer
You may also like

Primary Data – Types, Methods and Examples

Qualitative Data – Types, Methods and Examples

Research Data – Types Methods and Examples

Quantitative Data – Types, Methods and Examples

Information in Research – Types and Examples
Root out friction in every digital experience, super-charge conversion rates, and optimize digital self-service
Uncover insights from any interaction, deliver AI-powered agent coaching, and reduce cost to serve
Increase revenue and loyalty with real-time insights and recommendations delivered to teams on the ground
Know how your people feel and empower managers to improve employee engagement, productivity, and retention
Take action in the moments that matter most along the employee journey and drive bottom line growth
Whatever they’re are saying, wherever they’re saying it, know exactly what’s going on with your people
Get faster, richer insights with qual and quant tools that make powerful market research available to everyone
Run concept tests, pricing studies, prototyping + more with fast, powerful studies designed by UX research experts
Track your brand performance 24/7 and act quickly to respond to opportunities and challenges in your market
Explore the platform powering Experience Management
- Free Account
- For Digital
- For Customer Care
- For Human Resources
- For Researchers
- Financial Services
- All Industries
Popular Use Cases
- Customer Experience
- Employee Experience
- Net Promoter Score
- Voice of Customer
- Customer Success Hub
- Product Documentation
- Training & Certification
- XM Institute
- Popular Resources
- Customer Stories
- Artificial Intelligence
Market Research
- Partnerships
- Marketplace
The annual gathering of the experience leaders at the world’s iconic brands building breakthrough business results, live in Salt Lake City.
- English/AU & NZ
- Español/Europa
- Español/América Latina
- Português Brasileiro
- REQUEST DEMO
- Experience Management
- Secondary Research
Try Qualtrics for free
Secondary research: definition, methods, & examples.
19 min read This ultimate guide to secondary research helps you understand changes in market trends, customers buying patterns and your competition using existing data sources.
In situations where you’re not involved in the data gathering process ( primary research ), you have to rely on existing information and data to arrive at specific research conclusions or outcomes. This approach is known as secondary research.
In this article, we’re going to explain what secondary research is, how it works, and share some examples of it in practice.
Free eBook: The ultimate guide to conducting market research
What is secondary research?
Secondary research, also known as desk research, is a research method that involves compiling existing data sourced from a variety of channels . This includes internal sources (e.g.in-house research) or, more commonly, external sources (such as government statistics, organizational bodies, and the internet).
Secondary research comes in several formats, such as published datasets, reports, and survey responses , and can also be sourced from websites, libraries, and museums.
The information is usually free — or available at a limited access cost — and gathered using surveys , telephone interviews, observation, face-to-face interviews, and more.
When using secondary research, researchers collect, verify, analyze and incorporate it to help them confirm research goals for the research period.
As well as the above, it can be used to review previous research into an area of interest. Researchers can look for patterns across data spanning several years and identify trends — or use it to verify early hypothesis statements and establish whether it’s worth continuing research into a prospective area.
How to conduct secondary research
There are five key steps to conducting secondary research effectively and efficiently:
1. Identify and define the research topic
First, understand what you will be researching and define the topic by thinking about the research questions you want to be answered.
Ask yourself: What is the point of conducting this research? Then, ask: What do we want to achieve?
This may indicate an exploratory reason (why something happened) or confirm a hypothesis. The answers may indicate ideas that need primary or secondary research (or a combination) to investigate them.
2. Find research and existing data sources
If secondary research is needed, think about where you might find the information. This helps you narrow down your secondary sources to those that help you answer your questions. What keywords do you need to use?
Which organizations are closely working on this topic already? Are there any competitors that you need to be aware of?
Create a list of the data sources, information, and people that could help you with your work.
3. Begin searching and collecting the existing data
Now that you have the list of data sources, start accessing the data and collect the information into an organized system. This may mean you start setting up research journal accounts or making telephone calls to book meetings with third-party research teams to verify the details around data results.
As you search and access information, remember to check the data’s date, the credibility of the source, the relevance of the material to your research topic, and the methodology used by the third-party researchers. Start small and as you gain results, investigate further in the areas that help your research’s aims.
4. Combine the data and compare the results
When you have your data in one place, you need to understand, filter, order, and combine it intelligently. Data may come in different formats where some data could be unusable, while other information may need to be deleted.
After this, you can start to look at different data sets to see what they tell you. You may find that you need to compare the same datasets over different periods for changes over time or compare different datasets to notice overlaps or trends. Ask yourself: What does this data mean to my research? Does it help or hinder my research?
5. Analyze your data and explore further
In this last stage of the process, look at the information you have and ask yourself if this answers your original questions for your research. Are there any gaps? Do you understand the information you’ve found? If you feel there is more to cover, repeat the steps and delve deeper into the topic so that you can get all the information you need.
If secondary research can’t provide these answers, consider supplementing your results with data gained from primary research. As you explore further, add to your knowledge and update your findings. This will help you present clear, credible information.
Primary vs secondary research
Unlike secondary research, primary research involves creating data first-hand by directly working with interviewees, target users, or a target market. Primary research focuses on the method for carrying out research, asking questions, and collecting data using approaches such as:
- Interviews (panel, face-to-face or over the phone)
- Questionnaires or surveys
- Focus groups
Using these methods, researchers can get in-depth, targeted responses to questions, making results more accurate and specific to their research goals. However, it does take time to do and administer.
Unlike primary research, secondary research uses existing data, which also includes published results from primary research. Researchers summarize the existing research and use the results to support their research goals.
Both primary and secondary research have their places. Primary research can support the findings found through secondary research (and fill knowledge gaps), while secondary research can be a starting point for further primary research. Because of this, these research methods are often combined for optimal research results that are accurate at both the micro and macro level.
Sources of Secondary Research
There are two types of secondary research sources: internal and external. Internal data refers to in-house data that can be gathered from the researcher’s organization. External data refers to data published outside of and not owned by the researcher’s organization.
Internal data
Internal data is a good first port of call for insights and knowledge, as you may already have relevant information stored in your systems. Because you own this information — and it won’t be available to other researchers — it can give you a competitive edge . Examples of internal data include:
- Database information on sales history and business goal conversions
- Information from website applications and mobile site data
- Customer-generated data on product and service efficiency and use
- Previous research results or supplemental research areas
- Previous campaign results
External data
External data is useful when you: 1) need information on a new topic, 2) want to fill in gaps in your knowledge, or 3) want data that breaks down a population or market for trend and pattern analysis. Examples of external data include:
- Government, non-government agencies, and trade body statistics
- Company reports and research
- Competitor research
- Public library collections
- Textbooks and research journals
- Media stories in newspapers
- Online journals and research sites
Three examples of secondary research methods in action
How and why might you conduct secondary research? Let’s look at a few examples:
1. Collecting factual information from the internet on a specific topic or market
There are plenty of sites that hold data for people to view and use in their research. For example, Google Scholar, ResearchGate, or Wiley Online Library all provide previous research on a particular topic. Researchers can create free accounts and use the search facilities to look into a topic by keyword, before following the instructions to download or export results for further analysis.
This can be useful for exploring a new market that your organization wants to consider entering. For instance, by viewing the U.S Census Bureau demographic data for that area, you can see what the demographics of your target audience are , and create compelling marketing campaigns accordingly.
2. Finding out the views of your target audience on a particular topic
If you’re interested in seeing the historical views on a particular topic, for example, attitudes to women’s rights in the US, you can turn to secondary sources.
Textbooks, news articles, reviews, and journal entries can all provide qualitative reports and interviews covering how people discussed women’s rights. There may be multimedia elements like video or documented posters of propaganda showing biased language usage.
By gathering this information, synthesizing it, and evaluating the language, who created it and when it was shared, you can create a timeline of how a topic was discussed over time.
3. When you want to know the latest thinking on a topic
Educational institutions, such as schools and colleges, create a lot of research-based reports on younger audiences or their academic specialisms. Dissertations from students also can be submitted to research journals, making these places useful places to see the latest insights from a new generation of academics.
Information can be requested — and sometimes academic institutions may want to collaborate and conduct research on your behalf. This can provide key primary data in areas that you want to research, as well as secondary data sources for your research.
Advantages of secondary research
There are several benefits of using secondary research, which we’ve outlined below:
- Easily and readily available data – There is an abundance of readily accessible data sources that have been pre-collected for use, in person at local libraries and online using the internet. This data is usually sorted by filters or can be exported into spreadsheet format, meaning that little technical expertise is needed to access and use the data.
- Faster research speeds – Since the data is already published and in the public arena, you don’t need to collect this information through primary research. This can make the research easier to do and faster, as you can get started with the data quickly.
- Low financial and time costs – Most secondary data sources can be accessed for free or at a small cost to the researcher, so the overall research costs are kept low. In addition, by saving on preliminary research, the time costs for the researcher are kept down as well.
- Secondary data can drive additional research actions – The insights gained can support future research activities (like conducting a follow-up survey or specifying future detailed research topics) or help add value to these activities.
- Secondary data can be useful pre-research insights – Secondary source data can provide pre-research insights and information on effects that can help resolve whether research should be conducted. It can also help highlight knowledge gaps, so subsequent research can consider this.
- Ability to scale up results – Secondary sources can include large datasets (like Census data results across several states) so research results can be scaled up quickly using large secondary data sources.
Disadvantages of secondary research
The disadvantages of secondary research are worth considering in advance of conducting research :
- Secondary research data can be out of date – Secondary sources can be updated regularly, but if you’re exploring the data between two updates, the data can be out of date. Researchers will need to consider whether the data available provides the right research coverage dates, so that insights are accurate and timely, or if the data needs to be updated. Also, fast-moving markets may find secondary data expires very quickly.
- Secondary research needs to be verified and interpreted – Where there’s a lot of data from one source, a researcher needs to review and analyze it. The data may need to be verified against other data sets or your hypotheses for accuracy and to ensure you’re using the right data for your research.
- The researcher has had no control over the secondary research – As the researcher has not been involved in the secondary research, invalid data can affect the results. It’s therefore vital that the methodology and controls are closely reviewed so that the data is collected in a systematic and error-free way.
- Secondary research data is not exclusive – As data sets are commonly available, there is no exclusivity and many researchers can use the same data. This can be problematic where researchers want to have exclusive rights over the research results and risk duplication of research in the future.
When do we conduct secondary research?
Now that you know the basics of secondary research, when do researchers normally conduct secondary research?
It’s often used at the beginning of research, when the researcher is trying to understand the current landscape . In addition, if the research area is new to the researcher, it can form crucial background context to help them understand what information exists already. This can plug knowledge gaps, supplement the researcher’s own learning or add to the research.
Secondary research can also be used in conjunction with primary research. Secondary research can become the formative research that helps pinpoint where further primary research is needed to find out specific information. It can also support or verify the findings from primary research.
You can use secondary research where high levels of control aren’t needed by the researcher, but a lot of knowledge on a topic is required from different angles.
Secondary research should not be used in place of primary research as both are very different and are used for various circumstances.
Questions to ask before conducting secondary research
Before you start your secondary research, ask yourself these questions:
- Is there similar internal data that we have created for a similar area in the past?
If your organization has past research, it’s best to review this work before starting a new project. The older work may provide you with the answers, and give you a starting dataset and context of how your organization approached the research before. However, be mindful that the work is probably out of date and view it with that note in mind. Read through and look for where this helps your research goals or where more work is needed.
- What am I trying to achieve with this research?
When you have clear goals, and understand what you need to achieve, you can look for the perfect type of secondary or primary research to support the aims. Different secondary research data will provide you with different information – for example, looking at news stories to tell you a breakdown of your market’s buying patterns won’t be as useful as internal or external data e-commerce and sales data sources.
- How credible will my research be?
If you are looking for credibility, you want to consider how accurate the research results will need to be, and if you can sacrifice credibility for speed by using secondary sources to get you started. Bear in mind which sources you choose — low-credibility data sites, like political party websites that are highly biased to favor their own party, would skew your results.
- What is the date of the secondary research?
When you’re looking to conduct research, you want the results to be as useful as possible , so using data that is 10 years old won’t be as accurate as using data that was created a year ago. Since a lot can change in a few years, note the date of your research and look for earlier data sets that can tell you a more recent picture of results. One caveat to this is using data collected over a long-term period for comparisons with earlier periods, which can tell you about the rate and direction of change.
- Can the data sources be verified? Does the information you have check out?
If you can’t verify the data by looking at the research methodology, speaking to the original team or cross-checking the facts with other research, it could be hard to be sure that the data is accurate. Think about whether you can use another source, or if it’s worth doing some supplementary primary research to replicate and verify results to help with this issue.
We created a front-to-back guide on conducting market research, The ultimate guide to conducting market research , so you can understand the research journey with confidence.
In it, you’ll learn more about:
- What effective market research looks like
- The use cases for market research
- The most important steps to conducting market research
- And how to take action on your research findings
Download the free guide for a clearer view on secondary research and other key research types for your business.
Related resources
Market intelligence 10 min read, marketing insights 11 min read, ethnographic research 11 min read, qualitative vs quantitative research 13 min read, qualitative research questions 11 min read, qualitative research design 12 min read, primary vs secondary research 14 min read, request demo.
Ready to learn more about Qualtrics?
- Search Menu
- Sign in through your institution
- Browse content in Arts and Humanities
- Browse content in Archaeology
- Anglo-Saxon and Medieval Archaeology
- Archaeological Methodology and Techniques
- Archaeology by Region
- Archaeology of Religion
- Archaeology of Trade and Exchange
- Biblical Archaeology
- Contemporary and Public Archaeology
- Environmental Archaeology
- Historical Archaeology
- History and Theory of Archaeology
- Industrial Archaeology
- Landscape Archaeology
- Mortuary Archaeology
- Prehistoric Archaeology
- Underwater Archaeology
- Urban Archaeology
- Zooarchaeology
- Browse content in Architecture
- Architectural Structure and Design
- History of Architecture
- Residential and Domestic Buildings
- Theory of Architecture
- Browse content in Art
- Art Subjects and Themes
- History of Art
- Industrial and Commercial Art
- Theory of Art
- Biographical Studies
- Byzantine Studies
- Browse content in Classical Studies
- Classical History
- Classical Philosophy
- Classical Mythology
- Classical Literature
- Classical Reception
- Classical Art and Architecture
- Classical Oratory and Rhetoric
- Greek and Roman Epigraphy
- Greek and Roman Law
- Greek and Roman Papyrology
- Greek and Roman Archaeology
- Late Antiquity
- Religion in the Ancient World
- Digital Humanities
- Browse content in History
- Colonialism and Imperialism
- Diplomatic History
- Environmental History
- Genealogy, Heraldry, Names, and Honours
- Genocide and Ethnic Cleansing
- Historical Geography
- History by Period
- History of Emotions
- History of Agriculture
- History of Education
- History of Gender and Sexuality
- Industrial History
- Intellectual History
- International History
- Labour History
- Legal and Constitutional History
- Local and Family History
- Maritime History
- Military History
- National Liberation and Post-Colonialism
- Oral History
- Political History
- Public History
- Regional and National History
- Revolutions and Rebellions
- Slavery and Abolition of Slavery
- Social and Cultural History
- Theory, Methods, and Historiography
- Urban History
- World History
- Browse content in Language Teaching and Learning
- Language Learning (Specific Skills)
- Language Teaching Theory and Methods
- Browse content in Linguistics
- Applied Linguistics
- Cognitive Linguistics
- Computational Linguistics
- Forensic Linguistics
- Grammar, Syntax and Morphology
- Historical and Diachronic Linguistics
- History of English
- Language Acquisition
- Language Evolution
- Language Reference
- Language Variation
- Language Families
- Lexicography
- Linguistic Anthropology
- Linguistic Theories
- Linguistic Typology
- Phonetics and Phonology
- Psycholinguistics
- Sociolinguistics
- Translation and Interpretation
- Writing Systems
- Browse content in Literature
- Bibliography
- Children's Literature Studies
- Literary Studies (Asian)
- Literary Studies (European)
- Literary Studies (Eco-criticism)
- Literary Studies (Romanticism)
- Literary Studies (American)
- Literary Studies (Modernism)
- Literary Studies - World
- Literary Studies (1500 to 1800)
- Literary Studies (19th Century)
- Literary Studies (20th Century onwards)
- Literary Studies (African American Literature)
- Literary Studies (British and Irish)
- Literary Studies (Early and Medieval)
- Literary Studies (Fiction, Novelists, and Prose Writers)
- Literary Studies (Gender Studies)
- Literary Studies (Graphic Novels)
- Literary Studies (History of the Book)
- Literary Studies (Plays and Playwrights)
- Literary Studies (Poetry and Poets)
- Literary Studies (Postcolonial Literature)
- Literary Studies (Queer Studies)
- Literary Studies (Science Fiction)
- Literary Studies (Travel Literature)
- Literary Studies (War Literature)
- Literary Studies (Women's Writing)
- Literary Theory and Cultural Studies
- Mythology and Folklore
- Shakespeare Studies and Criticism
- Browse content in Media Studies
- Browse content in Music
- Applied Music
- Dance and Music
- Ethics in Music
- Ethnomusicology
- Gender and Sexuality in Music
- Medicine and Music
- Music Cultures
- Music and Religion
- Music and Media
- Music and Culture
- Music Education and Pedagogy
- Music Theory and Analysis
- Musical Scores, Lyrics, and Libretti
- Musical Structures, Styles, and Techniques
- Musicology and Music History
- Performance Practice and Studies
- Race and Ethnicity in Music
- Sound Studies
- Browse content in Performing Arts
- Browse content in Philosophy
- Aesthetics and Philosophy of Art
- Epistemology
- Feminist Philosophy
- History of Western Philosophy
- Metaphysics
- Moral Philosophy
- Non-Western Philosophy
- Philosophy of Science
- Philosophy of Language
- Philosophy of Mind
- Philosophy of Perception
- Philosophy of Action
- Philosophy of Law
- Philosophy of Religion
- Philosophy of Mathematics and Logic
- Practical Ethics
- Social and Political Philosophy
- Browse content in Religion
- Biblical Studies
- Christianity
- East Asian Religions
- History of Religion
- Judaism and Jewish Studies
- Qumran Studies
- Religion and Education
- Religion and Health
- Religion and Politics
- Religion and Science
- Religion and Law
- Religion and Art, Literature, and Music
- Religious Studies
- Browse content in Society and Culture
- Cookery, Food, and Drink
- Cultural Studies
- Customs and Traditions
- Ethical Issues and Debates
- Hobbies, Games, Arts and Crafts
- Natural world, Country Life, and Pets
- Popular Beliefs and Controversial Knowledge
- Sports and Outdoor Recreation
- Technology and Society
- Travel and Holiday
- Visual Culture
- Browse content in Law
- Arbitration
- Browse content in Company and Commercial Law
- Commercial Law
- Company Law
- Browse content in Comparative Law
- Systems of Law
- Competition Law
- Browse content in Constitutional and Administrative Law
- Government Powers
- Judicial Review
- Local Government Law
- Military and Defence Law
- Parliamentary and Legislative Practice
- Construction Law
- Contract Law
- Browse content in Criminal Law
- Criminal Procedure
- Criminal Evidence Law
- Sentencing and Punishment
- Employment and Labour Law
- Environment and Energy Law
- Browse content in Financial Law
- Banking Law
- Insolvency Law
- History of Law
- Human Rights and Immigration
- Intellectual Property Law
- Browse content in International Law
- Private International Law and Conflict of Laws
- Public International Law
- IT and Communications Law
- Jurisprudence and Philosophy of Law
- Law and Politics
- Law and Society
- Browse content in Legal System and Practice
- Courts and Procedure
- Legal Skills and Practice
- Primary Sources of Law
- Regulation of Legal Profession
- Medical and Healthcare Law
- Browse content in Policing
- Criminal Investigation and Detection
- Police and Security Services
- Police Procedure and Law
- Police Regional Planning
- Browse content in Property Law
- Personal Property Law
- Study and Revision
- Terrorism and National Security Law
- Browse content in Trusts Law
- Wills and Probate or Succession
- Browse content in Medicine and Health
- Browse content in Allied Health Professions
- Arts Therapies
- Clinical Science
- Dietetics and Nutrition
- Occupational Therapy
- Operating Department Practice
- Physiotherapy
- Radiography
- Speech and Language Therapy
- Browse content in Anaesthetics
- General Anaesthesia
- Neuroanaesthesia
- Browse content in Clinical Medicine
- Acute Medicine
- Cardiovascular Medicine
- Clinical Genetics
- Clinical Pharmacology and Therapeutics
- Dermatology
- Endocrinology and Diabetes
- Gastroenterology
- Genito-urinary Medicine
- Geriatric Medicine
- Infectious Diseases
- Medical Toxicology
- Medical Oncology
- Pain Medicine
- Palliative Medicine
- Rehabilitation Medicine
- Respiratory Medicine and Pulmonology
- Rheumatology
- Sleep Medicine
- Sports and Exercise Medicine
- Clinical Neuroscience
- Community Medical Services
- Critical Care
- Emergency Medicine
- Forensic Medicine
- Haematology
- History of Medicine
- Browse content in Medical Dentistry
- Oral and Maxillofacial Surgery
- Paediatric Dentistry
- Restorative Dentistry and Orthodontics
- Surgical Dentistry
- Browse content in Medical Skills
- Clinical Skills
- Communication Skills
- Nursing Skills
- Surgical Skills
- Medical Ethics
- Medical Statistics and Methodology
- Browse content in Neurology
- Clinical Neurophysiology
- Neuropathology
- Nursing Studies
- Browse content in Obstetrics and Gynaecology
- Gynaecology
- Occupational Medicine
- Ophthalmology
- Otolaryngology (ENT)
- Browse content in Paediatrics
- Neonatology
- Browse content in Pathology
- Chemical Pathology
- Clinical Cytogenetics and Molecular Genetics
- Histopathology
- Medical Microbiology and Virology
- Patient Education and Information
- Browse content in Pharmacology
- Psychopharmacology
- Browse content in Popular Health
- Caring for Others
- Complementary and Alternative Medicine
- Self-help and Personal Development
- Browse content in Preclinical Medicine
- Cell Biology
- Molecular Biology and Genetics
- Reproduction, Growth and Development
- Primary Care
- Professional Development in Medicine
- Browse content in Psychiatry
- Addiction Medicine
- Child and Adolescent Psychiatry
- Forensic Psychiatry
- Learning Disabilities
- Old Age Psychiatry
- Psychotherapy
- Browse content in Public Health and Epidemiology
- Epidemiology
- Public Health
- Browse content in Radiology
- Clinical Radiology
- Interventional Radiology
- Nuclear Medicine
- Radiation Oncology
- Reproductive Medicine
- Browse content in Surgery
- Cardiothoracic Surgery
- Gastro-intestinal and Colorectal Surgery
- General Surgery
- Neurosurgery
- Paediatric Surgery
- Peri-operative Care
- Plastic and Reconstructive Surgery
- Surgical Oncology
- Transplant Surgery
- Trauma and Orthopaedic Surgery
- Vascular Surgery
- Browse content in Science and Mathematics
- Browse content in Biological Sciences
- Aquatic Biology
- Biochemistry
- Bioinformatics and Computational Biology
- Developmental Biology
- Ecology and Conservation
- Evolutionary Biology
- Genetics and Genomics
- Microbiology
- Molecular and Cell Biology
- Natural History
- Plant Sciences and Forestry
- Research Methods in Life Sciences
- Structural Biology
- Systems Biology
- Zoology and Animal Sciences
- Browse content in Chemistry
- Analytical Chemistry
- Computational Chemistry
- Crystallography
- Environmental Chemistry
- Industrial Chemistry
- Inorganic Chemistry
- Materials Chemistry
- Medicinal Chemistry
- Mineralogy and Gems
- Organic Chemistry
- Physical Chemistry
- Polymer Chemistry
- Study and Communication Skills in Chemistry
- Theoretical Chemistry
- Browse content in Computer Science
- Artificial Intelligence
- Computer Architecture and Logic Design
- Game Studies
- Human-Computer Interaction
- Mathematical Theory of Computation
- Programming Languages
- Software Engineering
- Systems Analysis and Design
- Virtual Reality
- Browse content in Computing
- Business Applications
- Computer Security
- Computer Games
- Computer Networking and Communications
- Digital Lifestyle
- Graphical and Digital Media Applications
- Operating Systems
- Browse content in Earth Sciences and Geography
- Atmospheric Sciences
- Environmental Geography
- Geology and the Lithosphere
- Maps and Map-making
- Meteorology and Climatology
- Oceanography and Hydrology
- Palaeontology
- Physical Geography and Topography
- Regional Geography
- Soil Science
- Urban Geography
- Browse content in Engineering and Technology
- Agriculture and Farming
- Biological Engineering
- Civil Engineering, Surveying, and Building
- Electronics and Communications Engineering
- Energy Technology
- Engineering (General)
- Environmental Science, Engineering, and Technology
- History of Engineering and Technology
- Mechanical Engineering and Materials
- Technology of Industrial Chemistry
- Transport Technology and Trades
- Browse content in Environmental Science
- Applied Ecology (Environmental Science)
- Conservation of the Environment (Environmental Science)
- Environmental Sustainability
- Environmentalist Thought and Ideology (Environmental Science)
- Management of Land and Natural Resources (Environmental Science)
- Natural Disasters (Environmental Science)
- Nuclear Issues (Environmental Science)
- Pollution and Threats to the Environment (Environmental Science)
- Social Impact of Environmental Issues (Environmental Science)
- History of Science and Technology
- Browse content in Materials Science
- Ceramics and Glasses
- Composite Materials
- Metals, Alloying, and Corrosion
- Nanotechnology
- Browse content in Mathematics
- Applied Mathematics
- Biomathematics and Statistics
- History of Mathematics
- Mathematical Education
- Mathematical Finance
- Mathematical Analysis
- Numerical and Computational Mathematics
- Probability and Statistics
- Pure Mathematics
- Browse content in Neuroscience
- Cognition and Behavioural Neuroscience
- Development of the Nervous System
- Disorders of the Nervous System
- History of Neuroscience
- Invertebrate Neurobiology
- Molecular and Cellular Systems
- Neuroendocrinology and Autonomic Nervous System
- Neuroscientific Techniques
- Sensory and Motor Systems
- Browse content in Physics
- Astronomy and Astrophysics
- Atomic, Molecular, and Optical Physics
- Biological and Medical Physics
- Classical Mechanics
- Computational Physics
- Condensed Matter Physics
- Electromagnetism, Optics, and Acoustics
- History of Physics
- Mathematical and Statistical Physics
- Measurement Science
- Nuclear Physics
- Particles and Fields
- Plasma Physics
- Quantum Physics
- Relativity and Gravitation
- Semiconductor and Mesoscopic Physics
- Browse content in Psychology
- Affective Sciences
- Clinical Psychology
- Cognitive Psychology
- Cognitive Neuroscience
- Criminal and Forensic Psychology
- Developmental Psychology
- Educational Psychology
- Evolutionary Psychology
- Health Psychology
- History and Systems in Psychology
- Music Psychology
- Neuropsychology
- Organizational Psychology
- Psychological Assessment and Testing
- Psychology of Human-Technology Interaction
- Psychology Professional Development and Training
- Research Methods in Psychology
- Social Psychology
- Browse content in Social Sciences
- Browse content in Anthropology
- Anthropology of Religion
- Human Evolution
- Medical Anthropology
- Physical Anthropology
- Regional Anthropology
- Social and Cultural Anthropology
- Theory and Practice of Anthropology
- Browse content in Business and Management
- Business Strategy
- Business Ethics
- Business History
- Business and Government
- Business and Technology
- Business and the Environment
- Comparative Management
- Corporate Governance
- Corporate Social Responsibility
- Entrepreneurship
- Health Management
- Human Resource Management
- Industrial and Employment Relations
- Industry Studies
- Information and Communication Technologies
- International Business
- Knowledge Management
- Management and Management Techniques
- Operations Management
- Organizational Theory and Behaviour
- Pensions and Pension Management
- Public and Nonprofit Management
- Strategic Management
- Supply Chain Management
- Browse content in Criminology and Criminal Justice
- Criminal Justice
- Criminology
- Forms of Crime
- International and Comparative Criminology
- Youth Violence and Juvenile Justice
- Development Studies
- Browse content in Economics
- Agricultural, Environmental, and Natural Resource Economics
- Asian Economics
- Behavioural Finance
- Behavioural Economics and Neuroeconomics
- Econometrics and Mathematical Economics
- Economic Systems
- Economic History
- Economic Methodology
- Economic Development and Growth
- Financial Markets
- Financial Institutions and Services
- General Economics and Teaching
- Health, Education, and Welfare
- History of Economic Thought
- International Economics
- Labour and Demographic Economics
- Law and Economics
- Macroeconomics and Monetary Economics
- Microeconomics
- Public Economics
- Urban, Rural, and Regional Economics
- Welfare Economics
- Browse content in Education
- Adult Education and Continuous Learning
- Care and Counselling of Students
- Early Childhood and Elementary Education
- Educational Equipment and Technology
- Educational Strategies and Policy
- Higher and Further Education
- Organization and Management of Education
- Philosophy and Theory of Education
- Schools Studies
- Secondary Education
- Teaching of a Specific Subject
- Teaching of Specific Groups and Special Educational Needs
- Teaching Skills and Techniques
- Browse content in Environment
- Applied Ecology (Social Science)
- Climate Change
- Conservation of the Environment (Social Science)
- Environmentalist Thought and Ideology (Social Science)
- Natural Disasters (Environment)
- Social Impact of Environmental Issues (Social Science)
- Browse content in Human Geography
- Cultural Geography
- Economic Geography
- Political Geography
- Browse content in Interdisciplinary Studies
- Communication Studies
- Museums, Libraries, and Information Sciences
- Browse content in Politics
- African Politics
- Asian Politics
- Chinese Politics
- Comparative Politics
- Conflict Politics
- Elections and Electoral Studies
- Environmental Politics
- European Union
- Foreign Policy
- Gender and Politics
- Human Rights and Politics
- Indian Politics
- International Relations
- International Organization (Politics)
- International Political Economy
- Irish Politics
- Latin American Politics
- Middle Eastern Politics
- Political Methodology
- Political Communication
- Political Philosophy
- Political Sociology
- Political Behaviour
- Political Economy
- Political Institutions
- Political Theory
- Politics and Law
- Politics of Development
- Public Administration
- Public Policy
- Quantitative Political Methodology
- Regional Political Studies
- Russian Politics
- Security Studies
- State and Local Government
- UK Politics
- US Politics
- Browse content in Regional and Area Studies
- African Studies
- Asian Studies
- East Asian Studies
- Japanese Studies
- Latin American Studies
- Middle Eastern Studies
- Native American Studies
- Scottish Studies
- Browse content in Research and Information
- Research Methods
- Browse content in Social Work
- Addictions and Substance Misuse
- Adoption and Fostering
- Care of the Elderly
- Child and Adolescent Social Work
- Couple and Family Social Work
- Direct Practice and Clinical Social Work
- Emergency Services
- Human Behaviour and the Social Environment
- International and Global Issues in Social Work
- Mental and Behavioural Health
- Social Justice and Human Rights
- Social Policy and Advocacy
- Social Work and Crime and Justice
- Social Work Macro Practice
- Social Work Practice Settings
- Social Work Research and Evidence-based Practice
- Welfare and Benefit Systems
- Browse content in Sociology
- Childhood Studies
- Community Development
- Comparative and Historical Sociology
- Economic Sociology
- Gender and Sexuality
- Gerontology and Ageing
- Health, Illness, and Medicine
- Marriage and the Family
- Migration Studies
- Occupations, Professions, and Work
- Organizations
- Population and Demography
- Race and Ethnicity
- Social Theory
- Social Movements and Social Change
- Social Research and Statistics
- Social Stratification, Inequality, and Mobility
- Sociology of Religion
- Sociology of Education
- Sport and Leisure
- Urban and Rural Studies
- Browse content in Warfare and Defence
- Defence Strategy, Planning, and Research
- Land Forces and Warfare
- Military Administration
- Military Life and Institutions
- Naval Forces and Warfare
- Other Warfare and Defence Issues
- Peace Studies and Conflict Resolution
- Weapons and Equipment

- < Previous chapter
- Next chapter >

28 Secondary Data Analysis
Department of Psychology, Michigan State University
Richard E. Lucas, Department of Psychology, Michigan State University, East Lansing, MI
- Published: 01 October 2013
- Cite Icon Cite
- Permissions Icon Permissions
Secondary data analysis refers to the analysis of existing data collected by others. Secondary analysis affords researchers the opportunity to investigate research questions using large-scale data sets that are often inclusive of under-represented groups, while saving time and resources. Despite the immense potential for secondary analysis as a tool for researchers in the social sciences, it is not widely used by psychologists and is sometimes met with sharp criticism among those who favor primary research. The goal of this chapter is to summarize the promises and pitfalls associated with secondary data analysis and to highlight the importance of archival resources for advancing psychological science. In addition to describing areas of convergence and divergence between primary and secondary data analysis, we outline basic steps for getting started and finding data sets. We also provide general guidance on issues related to measurement, handling missing data, and the use of survey weights.
The goal of research in the social science is to gain a better understanding of the world and how well theoretical predictions match empirical realities. Secondary data analysis contributes to these objectives through the application of “creative analytical techniques to data that have been amassed by others” ( Kiecolt & Nathan, 1985 , p. 10). Primary researchers design new studies to answer research questions, whereas the secondary data analyst uses existing resources. There is a deliberate coupling of research design and data analysis in primary research; however, the secondary data analyst rarely has had input into the design of the original studies in terms of the sampling strategy and measures selected for the investigation. For better or worse, the secondary data analyst simply has access to the final products of the data collection process in the form of a codebook or set of codebooks and a cleaned data set.
The analysis of existing data sets is routine in disciplines such as economics, political science, and sociology, but it is less well established in psychology ( but see Brooks-Gunn & Chase-Lansdale, 1991 ; Brooks-Gunn, Berlin, Leventhal, & Fuligini, 2000 ). Moreover, biases against secondary data analysis in favor of primary research may be present in psychology ( see McCall & Appelbaum, 1991 ). One possible explanation for this bias is that psychology has a rich and vibrant experimental tradition, and the training of many psychologists has likely emphasized this approach as the “gold standard” for addressing research questions and establishing causality ( see , e.g., Cronbach, 1957 ). As a result, the nonexperimental methods that are typically used in secondary analyses may be viewed by some as inferior. Psychological scientists trained in the experimental tradition may not fully appreciate the unique strengths that nonexperimental techniques have to offer and may underestimate the time, effort, and skills required for conducting secondary data analyses in a competent and professional manner. Finally, biases against secondary data analysis might stem from lingering concerns over the validity of the self-report methods that are typically used in secondary data analysis. These can include concerns about the possibility that placement of items in a survey can influence responses (e.g., differences in the average levels of reported marital and life satisfaction when questions occur back to back as opposed to having the questions separated in the survey; see Schwarz, 1999 ; Schwarz & Strack, 1999 ) and concerns with biased reporting of sensitive behaviors ( but see Akers, Massey, & Clarke, 1983 ).
Despite the initial reluctance to widely embrace secondary data analysis as a tool for psychological research, there are promising signs that the skepticism toward secondary analyses will diminish as psychology seeks to position itself as a hub science that plays a key role in interdisciplinary inquiry ( see Mroczek, Pitzer, Miller, Turiano, & Fingerman, 2011 ). Accordingly, there is a compelling argument for including secondary data analysis into the suite of methodological approaches used by psychologists ( see Trzesniewski, Donnellan, & Lucas, 2011 ).
The goal of this chapter is to summarize the promises and pitfalls associated with secondary data analysis and to highlight the importance of archival resources for advancing psychological science. We limit our discussion to analyses based on large-scale and often longitudinal national data sets such as the National Longitudinal Study of Adolescent Health (Add Health), the British Household Panel Study (BHPS), the German Socioeconomic Panel Study (GSOEP), and the National Institute of Child Health and Human Development (NICHD) Study of Early Child Care and Youth Development (SEC-CYD). However, much of our discussion applies to all secondary analyses. The perspective and specific recommendations found in this chapter draw on the edited volume by Trzesniewski et al. (2011 ). Following a general introduction to secondary data analysis, we will outline the necessary steps for getting started and finding data sets. Finally, we provide some general guidance on issues related to measurement, approaches to handling missing data, and survey weighting. Our treatment of these important topics is intended to draw attention to the relevant issues rather than to provide extensive coverage. Throughout, we take a practical approach to the issues and offer tips and guidance rooted in our experiences as data analysts and researchers with substantive interests in personality and life span developmental psychology.
Comparing Primary Research and Secondary Research
As noted in the opening section, it is possible that biases against secondary data analysis exist in the minds of some psychological scientists. To address these concerns, we have found it can be helpful to explicitly compare the processes of secondary analyses with primary research ( see also McCall & Appelbaum, 1991 ). An idealized and simplified list of steps is provided in Table 28.1 . As is evident from this table, both techniques start with a research question that is ideally rooted in existing theory and previous empirical results. The areas of biggest divergence between primary and secondary approaches occur after researchers have identified their questions (i.e., Steps 2 through 5 in Table 28.1 ). At this point, the primary researcher develops a set of procedures and then engages in pilot testing to refine procedures and methods, whereas the secondary analyst searches for data sets and evaluates codebooks. The primary researcher attempts to refine her or his procedures, whereas the secondary analyst determines whether a particular resource is appropriate for addressing the question at hand. In the next stages, the primary researcher collects new data, whereas the secondary data analyst constructs a working data set from a much larger data archive. At these stages, both types of researchers must grapple with the practical considerations imposed by real world constraints. There is no such thing as a perfect single study ( see Hunter & Schmidt, 2004 ), as all data sets are subject to limitations stemming from design and implementation. For example, the primary researcher may not have enough subjects to generate adequate levels of statistical power (because of a failure to take power calculations into account during the design phase, time or other resource constraints during the data collection phase, or because of problems with sample retention), whereas the secondary data analyst may have to cope with impoverished measurement of core constructs. Both sets of considerations will affect the ability of a given study to detect effects and provide unbiased estimates of effect sizes.
Table 28.1 also illustrates the fact that there are considerable areas of overlap between the two techniques. Researchers stemming from both traditions analyze data, interpret results, and write reports for dissemination to the wider scientific community. Both kinds of research require a significant investment of time and intellectual resources. Many skills required in conducting high-quality primary research are also required in conducting high-quality secondary data analysis including sound scientific judgment, attention to detail, and a firm grasp of statistical methodology.
Note: Steps modified and expanded from McCall and Appelbaum (1991 ).
We argue that both primary research and secondary data analysis have the potential to provide meaningful and scientifically valid research findings for psychology. Both approaches can generate new knowledge and are therefore reasonable ways of evaluating research questions. Blanket pronouncements that one approach is inherently superior to the other are usually difficult to justify. Many of the concerns about secondary data analysis are raised in the context of an unfair comparison—a contrast between the idealized conceptualization of primary research with the actual process of a secondary data analysis. Our point is that both approaches can be conducted in a thoughtful and rigorous manner, yet both approaches involve concessions to real-world constraints. Accordingly, we encourage all researchers and reviewers of papers to keep an open mind about the importance of both types of research.
Advantages and Disadvantages of Secondary Data Analysis
The foremost reason why psychologists should learn about secondary data analysis is that there are many existing data sets that can be used to answer interesting and important questions. Individuals who are unaware of these resources are likely to miss crucial opportunities to contribute new knowledge to the discipline and even risk reinventing the proverbial wheel by collecting new data. Regrettably, new data collection efforts may occur on a smaller scale than what is available in large national datasets. Researchers who are unaware of the potential treasure trove of variables in existing data sets risk unnecessarily duplicating considerable amounts of time and effort. At the very least, researchers may wish to familiarize themselves with publicly available data to truly address gaps in the literature when they undertake projects that involve new data collection.
The biggest advantage of secondary analyses is that the data have already been collected and are ready to be analyzed ( see Hofferth, 2005 ), thus conserving time and resources. Existing data sources are often of much larger and higher quality than could be feasibly collected by a single investigator. This advantage is especially pronounced when considering the investments of time and money necessary to collect longitudinal data. Some data sets were collected with scientific sampling plans (such as the GSOEP), which make it possible to generalize the findings to a specific population. Further, many publicly available data sets are quite large, and therefore provide adequate statistical power for conducting many analyses, including hypotheses about statistical interactions. Investigations of interactions often require a surprisingly high number of participants to achieve respectable levels of statistical power in the face of measurement error ( see Aiken & West, 1991 ). 1 Large-scale data sets are also well suited for subgroup analyses of populations that are often under-represented in smaller research studies.
Another advantage of secondary data analysis is that it forces researchers to adopt an open and transparent approach to their craft. Because data are publicly available, other investigators may attempt to replicate findings and specify alternative models for a given research question. This reality encourages transparency and detailed record keeping on the part of the researcher, including careful reporting of analysis and a reasoned justification for all analytic decisions. Freese (2007 ) has provided a useful discussion about policies for archiving material necessary for replicating results, and his treatment of the issues provides guidance to researchers interested in maintaining good records.
Despite the many advantages of secondary data analysis, it is not without its disadvantages. The most significant challenge is simply the flipside of the primary advantage—the data have already been collected by somebody else! Analysts must take advantage of what has been collected without input into design and measurement issues. In some cases, an existing data set may not be available to address the particular research questions of a given investigator without some limitations in terms of sampling, measurement, or other design feature. For example, data sets commonly used for secondary analysis often have a great deal of breadth in terms of the range of constructs assessed (e.g., finances, attitudes, personality, life satisfaction, physical health), but these constructs are often measured with a limited number of survey items. Issues of measurement reliability and validity are usually a major concern. Therefore, a strong grounding in basic and advanced psychometrics is extremely helpful for responding to criticisms and concerns about measurement issues that arise during the peer-review process.
A second consequence of the fact that the data have been collected by somebody else is that analysts may not have access to all of the information about data collection procedures and issues. The analyst simply receives a cleaned data set to use for subsequent analyses. Perhaps not obvious to the user is the amount of actual cleaning that occurred behind the scenes. Similarly, the complicated sampling procedures used in a given study may not be readily apparent to users, and this issue can prevent the appropriate use of survey weights ( Shrout & Napier, 2011 ).
Another significant disadvantage for secondary data analysis is the large amount of time and energy initially required to review data documentation. It can take hours and even weeks to become familiar with the codebooks and to discover which research questions have already been addressed by investigators using the existing data sets. It is very easy to underestimate how long it will take to move from an initial research idea to a competent final analysis. There is a risk that, unbeknownst to one another, researchers in different locations will pursue answers to the same research questions. On the other hand, once a researcher has become familiar with a data set and developed skills to work with the resource, they are able to pursue additional research questions resulting in multiple publications from the same data set. It is our experience that the process of learning about a data set can help generate new research ideas as it becomes clearer how the resource can be used to contribute to psychological science. Thus, the initial time and energy expended to learn about a resource can be viewed as initial investment that holds the potential to pay larger dividends over time.
Finally, a possible disadvantage concerns how secondary data analyses are viewed within particular subdisciplines of psychology and by referees during the peer-review process. Some journals and some academic departments may not value secondary data analyses as highly as primary research. Such preferences might break along Cronbach’s two disciplines or two streams of psychology—correlational versus experimental ( Cronbach, 1957 ; Tracy, Robins, & Sherman, 2009 ). The reality is that if original data collection is more highly valued in a given setting, then new investigators looking to build a strong case for getting hired or getting promoted might face obstacles if they base a career exclusively on secondary data analysis. Similarly, if experimental methods are highly valued and correlational methods are denigrated in a particular subfield, then results of secondary data analyses will face difficulties getting attention (and even getting published). The best advice is to be aware of local norms and to act accordingly.
Steps for Beginning a Secondary Data Analysis
Step 1: Find Existing Data Sets . After generating a substantive question, the first task is to find relevant data sets ( see Pienta, O’Rouke, & Franks, 2011 ). In some cases researchers will be aware of existing data sets through familiarity with the literature given that many well-cited papers have used such resources. For example, the GSOEP has now been widely used to address questions about correlates and developmental course of subjective well-being (e.g., Baird, Lucas, & Donnellan, 2010 ; Gerstorf, Ram, Estabrook, Schupp, Wagner, & Lindenberger, 2008 ; Gerstorf, Ram, Goebel, Schupp, Lindenberger, & Wagner, 2010 ; Lucas, 2005 ; 2007 ), and thus, researchers in this area know to turn to this resource if a new question arises. In other cases, however, researchers will attempt to find data sets using established archives such as the University of Michigan’s Interuniversity Consortium for Political and Social Research (ICPSR; http://www.icpsr.umich.edu/icpsrweb/ICPSR/ ). In addition to ICPSR, there are a number of other major archives ( see Pienta et al., 2011 ) that house potentially relevant data sets. Here are just a few starting points:
The Henry A. Murray Research Archive ( http://www.murray.harvard.edu/ )
The Howard W Odum Institute for Research in Social Science ( http://www.irss.unc.edu/odum/jsp/home2.jsp )
The National Opinion Research Center ( http://norc.org/homepage.htm )
The Roper Center of Public Opinion Research ( http://ropercenter.uconn.edu/ )
The United Kingdom Data Archive ( http://www.data-archive.ac.uk/ )
Individuals in charge of these archives and data depositories often catalog metadata, which is the technical term for information about the constituent data sets. Typical kinds of metadata include information about the original investigators, a description of the design and process of data collection, a list of the variables assessed, and notes about sampling weights and missing data. Searching through this information is an efficient way of gaining familiarity with data sets. In particular, the ICPSR has an impressive infrastructure for allowing researchers to search for data sets through a cataloguing of study metadata. The ICPSR is thus a useful starting point for finding the raw material for a secondary data analysis. The ICPSR also provides a new user tutorial for searching their holdings ( http://www.icpsr.umich.edu/icpsrweb/ICPSR/help/newuser.jsp ). We recommend that researchers search through their holdings to make a list of potential data sets. At that point, the next task is to obtain relevant codebooks to learn more about each resource.
Step 2: Read Codebooks . Researchers interesting in using an existing data set are strongly advised to thoroughly read the accompanying codebook ( Pienta et al., 2011 ). There are several reasons why a comprehensive understanding of the codebook is a critical first step when conducting a secondary data analysis. First, the codebook will detail the procedures and methods used to acquire the data and provide a list of all of the questions and assessments collected. A thorough reading of the codebook can provide insights into important covariates that can be included in subsequent models, and a careful reading will draw the analyst’s attention to key variables that will be missing because no such information was collected. Reading through a codebook can also help to generate new research questions.
Second, high-quality codebooks often report basic descriptive information for each variable such as raw frequency distributions and information about the extent of missing values. The descriptive information in the codebook can give investigators a baseline expectation for variables under consideration, including the expected distributions of the variables and the frequencies of under-represented groups (such as ethnic minority participants). Because it is important to verify that the descriptive statistics in the published codebook match those in the file analyzed by the secondary analyst, a familiarity with the codebook is essential. In addition to codebooks, many existing resources provide copies of the actual surveys completed by participants ( Pienta et al., 2011 ). However, the use of actual pencil-and-paper surveys is becoming less common with the advent of computer assisted interview techniques and Internet surveys. It is often the case that survey methods involve skip patterns (e.g., a participant is not asked about the consequences of her drinking if she responds that she doesn’t drink alcohol) that make it more difficult to assume the perspective of the “typical” respondent in a given study ( Pienta et al., 2011 ). Nonetheless, we recommend that analysts try to develop an understanding for the experiences of the participant in a given study. This perspective can help secondary analysts develop an intuitive understanding of certain patterns of missing data and anticipate concerns about question ordering effects ( see , e.g., Schwarz, 1999 ).
Step 3: Acquire Datasets and Construct a Working Datafile . Although there is a growing availability of Web-based resources for conducting basic analyses using selected data sets (e.g., the Survey Documentation Analysis software used by ICPSR), we are convinced that there is no substitute for the analysis of the raw data using the software packages of preference for a given investigator. This means that the analysts will need to acquire the data sets that they consider most relevant. This is typically a very straightforward process that involves acknowledging researcher responsibilities before downloading the entire data set from a website. In some cases, data are classified as restricted-use, and there are more extensive procedures for obtaining access that may involve submitting a detailed security plan and accompanying legal paperwork before becoming an authorized data user. When data involve children and other sensitive groups, Institutional Review Board approval is often required.
Each data set has different usage requirements, so it is difficult to provide blanket guidance. Researchers should be aware of the policies for using each data set and recognize their ethical responsibility for adhering to those regulations. A central issue is that the researcher must avoid deductive disclosure whereby otherwise anonymous participants are identified because of prior knowledge in conjunction with the personal characteristics coded in the dataset (e.g., gender, racial/ethnic group, geographic location, birth date). Such a practice violates the major ethical principles followed by responsible social scientists and has the potential to harm research participants.
Once the entire set of raw data is acquired, it is usually straightforward to import the files into the kinds of statistical packages used by researchers (e.g., R, SAS, SPSS, and STATA). At this point, it is likely that researchers will want to create smaller “working” file by pulling only relevant variables from the larger master files. It is often too cumbersome to work with a computer file that may have more than a thousand columns of information. The solution is to construct a working data file that has all of the needed variables tied to a particular research project. Researchers may also need to link multiple files by matching longitudinal data sets and linking to contextual variables such as information about schools or neighborhoods for data sets with a multilevel structure (e.g., individuals nested in schools or neighborhoods).
Explicit guidance about managing a working data file can be found in Willms (2011 ). Here, we simply highlight some particularly useful advice: (1) keep exquisite notes about what variables were selected and why; (2) keep detailed notes regarding changes to each variable and reasons why; and (3) keep track of sample sizes throughout this entire process. The guiding philosophy is to create documentation that is clear enough for an outside user to follow the logic and procedures used by the researcher. It is far too easy to overestimate the power of memory only to be disappointed when it comes time to revisit a particular analysis. Careful documentation can save time and prevent frustration. Willms (2011 ) noted that “keeping good notes is the sine qua non of the trade” (p. 33).
Step 4: Conduct Analyses . After assembling the working data file, the researcher will likely construct major study variables by creating scale composites (e.g., the mean of the responses to the items assessing the same construct) and conduct initial analyses. As previously noted, a comparison of the distributions and sample sizes with those in the study codebook is essential at this stage. Any deviations for the variables in the working data file and the codebook should be understood and documented. It is particularly useful to keep track of missing values to make sure that they have been properly coded. It should go without saying that an observed value of-9999 will typically require recoding to a missing value in the working file. Similarly, errors in reverse scoring items can be particularly common (and troubling) so researchers are well advised to conduct through item-level and scale analyses and check to make sure that reverse scoring was done correctly (e.g., examine the inter-item correlation matrix when calculating internal consistency estimates to screen for negative correlations). Willms (2011 ) provides some very savvy advice for the initial stages of actual data analysis: “Be wary of surprise findings” (p. 35). He noted that “too many times I have been excited by results only to find that I have made some mistake” (p. 35). Caution, skepticism, and a good sense of the underlying data set are essential for detecting mistakes.
An important comment about the nature of secondary data analysis is again worth emphasizing: These data sets are available to others in the scholarly community. This means that others should be able to replicate your results! It is also very useful to adopt a self-critical perspective because others will be able to subject findings to their own empirical scrutiny. Contemplate alternative explanations and attempt to conduct analyses to evaluate the plausibility of these explanations. Accordingly, we recommend that researchers strive to think of theoretically relevant control variables and include them in the analytic models when appropriate. Such an approach is useful both from the perspective of scientific progress (i.e., attempting to curb confirmation biases) and in terms of surviving the peer-review process.
Special Issue: Measurement Concerns in Existing Datasets
One issue with secondary data analyses that is likely to perplex psychologists are concerns regarding the measurement of core constructs. The reality is that many of the measures available in large-scale data sets consist of a subset of items derived from instruments commonly used by psychologists ( see Russell & Matthews, 2011 ). For example, the 10-item Rosenberg Self-Esteem scale ( Rosenberg, 1965 ) is the most commonly used measure of global self-esteem in the literature ( Donnellan, Trzesniewski, & Robins, 2011 ). Measures of self-esteem are available in many data sets like Monitoring the Future ( see Trzesniewski & Donnellan, 2010 ) but these measures are typically shorter than the original Rosenberg scale. Similarly, the GSOEP has a single-item rating of subjective well-being in the form of happiness, whereas psychologists might be more accustomed to measuring this construct with at least five items (e.g., Diener, Emmons, Larsen, & Griffin, 1985 ). Researchers using existing data sets will have to grapple with the consequences of having relatively short assessments in terms of the impact on reliability and validity.
For purposes of this chapter, we will make use of a conventional distinction between reliability and validity. Reliability will refer to the degree of measurement error present in a given set of scores (or alternatively the degree of consistency or precision in scores), whereas validity will refer to the degree to which measures capture the construct of interest and predict other variables in ways that are consistent with theory. More detailed but accessible discussions of reliability and validity can be found in Briggs and Cheek (1986 ), Clark and Watson (1995 ), John and Soto (2007 ), Messick (1995 ), Simms (2008 ), and Simms and Watson (2007 ). Widaman, Little, Preacher, and Sawalani (2011 ) have provided a discussion of these issues in the context of the shortened assessments available in existing data sets.
Short Measures and Reliability . Classical Test Theory (e.g., Lord & Novick, 1968 ) is the measurement perspective most commonly used among psychologists. According to this measurement philosophy, any observed score is a function of the underlying attribute (the so-called “true score”) and measurement error. Reliability is conceptualized as any deviation or inconsistency in observed scores for the same attribute across multiple assessments of that attribute. A thought experiment may help crystallize insights about reliability (e.g., Lord & Novick, 1968 ): Imagine a thousand identical clones each completing the same self-esteem instrument simultaneously. The underlying self-esteem attribute (i.e., the true scores) should be the same for each clone (by definition), whereas the observed scores may fluctuate across clones because of random measurement errors (e.g., a single clone misreading an item vs. another clone being frustrated by an extremely hot testing room). The extent of the observed fluctuations in reported scores across clones offers insight into how much measurement error is present in this instrument. If scores are tightly clustered around a single value, then measurement error is minimal; however, if scores are dramatically different across clones, then there is a clear indication of problems with reliability. The measure is imprecise because it yields inconsistent values across the same true scores.
These ideas about reliability can be applied to observed samples of scores such that the total observed variance is attributable to true score variance (i.e., true individual differences in underlying attributes) and variance stemming from random measurement errors. The assumption that measurement error is random means that it has an expected value of zero across observations. Using this framework, reliability can then be defined as the ratio of true score variance to the total observed variance. An assessment that is perfectly reliable (i.e., has no measurement error) will have a ratio of 1.0, whereas an assessment that is completely unreliable will yield a ratio of 0.0 ( see John & Soto, 2007 , for an expanded discussion). This perspective provides a formal definition of a reliability coefficient.
Psychologists have developed several tools to estimate the reliability of their measures, but the approach that is most commonly used is coefficient a ( Cronbach, 1951 ; see Schmitt, 1996 , for an accessible review). This approach considers reliability from the perspective of internal consistency. The basic idea is that fluctuations across items assessing the same construct reflect the presence of measurement error. The formula for the standardized α is a fairly simple function of the average inter-item correlation (a measure of inter-item homogeneity) and the total number of items in a scale. The α coefficient is typically judged acceptable if it is above 0.70, but the justification for this particular cutoff is somewhat arbitrary ( see Lance, Butts, & Michels, 2006 ). Researchers are therefore advised to take a more critical perspective on this statistic. A relevant concern is that α is negatively impacted when the measure is short.
Given concerns with scale length and α, many methodologically oriented researchers recommend evaluating and reporting the average inter-item correlation because it can be interpreted independently of length and thus represents a “more straightforward indicator of internal consistency” ( Clark & Watson, 1995 , p. 316). Consider that it is common to observe an average inter-item correlation for the 10-item Rosenberg Self-Esteem ( Rosenberg, 1965 ) scale around 0.40 (this is based on typically reported a coefficients; see Donnellan et al., 2011 ). This same level of internal homogeneity (i.e., an inter-item correlation of 0.40) yields an α of around 0.67 with a 3-item scale but an α of around 0.87 with 10 items. A measure of a broader construct like Extraversion may generate an average inter-item correlation of 0.20 ( Clark & Watson, 1995 , p. 316), which would translate to an α of 0.43 for a 3-item scale and 0.71 for a 10-item scale. The point is that α coefficients will fluctuate with scale length and the breadth of the construct. Because most scales in existing resources are short, the α coefficients might fall below the 0.70 convention despite having a respectable level of inter-item correlation.
Given these considerations, we recommend that researchers consider the average inter-item correlation more explicitly when working with secondary data sets. It is also important to consider the breadth of the underlying construct to generate expectations for reasonable levels of item homogeneity as indexed by the average inter-item correlation. Clark and Watson (1995 ; see also Briggs & Cheek, 1986 ) recommend values of around 0.40 to 0.50 for measures of fairly narrow constructs (e.g., self-esteem) and values of around 0.15 to 0.20 for measures of broader constructs (e.g., neuroticism). It is our experience that considerations about internal consistency often need to be made explicit in manuscripts so that reviewers will not take an unnecessarily harsh perspective on α’s that fall below their expectations. Finally, we want to emphasize that internal consistency is but one kind of reliability. In some cases, it might be that test—retest reliability is more informative and diagnostic of the quality of a measure ( McCrae, Kurtz, Yamagata, & Terracciano, 2011 ). Fortunately, many secondary data sets are longitudinal so it possible to get an estimate of longer term test-retest reliability from the existing data.
Beyond simply reporting estimates of reliability, it is worth considering why measurement reliability is such an important issue in the first place. One consequence of reliability for substantive research is that measurement imprecision tends to depress observed correlations with other variables. This notion of attenuation resulting from measurement error and a solution were discussed by Spearman as far back as 1904 ( see , e.g., pp. 88–94). Unreliable measures can affect the conclusions drawn from substantive research by imposing a downward bias on effect size estimation. This is perhaps why Widaman et al. (2011 ) advocate using latent variable structural modeling methods to combat this important consequence of measurement error. Their recommendation is well worth considering for those with experience with this technique ( see Kline, 2011 , for an introduction). Regardless of whether researchers use observed variables or latent variables for their analyses, it is important to recognize and appreciate the consequences of reliability.
Short Measures and Validity . Validity, for our purposes, reflects how well a measure captures the underlying conceptual attribute of interest. All discussions of validity are based, in part, on agreement in a field as to how to understand the construct in question. Validity, like reliability, is assessed as a matter of degree rather than a categorical distinction between valid or invalid measures. Cronbach and Meehl (1955 ) have provided a classic discussion of construct validity, perhaps the most overarching and fundamental form of validity considered in psychological research ( see also Smith, 2005 ). However, we restrict our discussion to content validity and criterion-related validity because these two types of validity are particularly relevant for secondary data analysis and they are more immediately addressable.
Content validity describes how well a measure captures the entire domain of the construct in question. Judgments regarding content validity are ideally made by panels of experts familiar with the focal construct. A measure is considered construct deficient if it fails to assess important elements of the construct. For example, if thoughts of suicide are an integral aspect of the concept depression and a given self-report measure is missing items that tap this content, then the measure would be deemed construct-deficient. A measure can also suffer from construct contamination if it includes extraneous items that are irrelevant to the focal construct. For example, if somatic symptoms like a rapid heartbeat are considered to reflect the construct of anxiety and not part of depression, then a depression inventory that has such an item would suffer from construct contamination. Given the reduced length of many assessments, concerns over construct deficiency are likely to be especially pressing. A short assessment may not include enough items to capture the full breadth of a broad construct. This limitation is not readily addressed and should be acknowledged ( see Widaman et al., 2011 ). In particular, researchers may need to clearly specify that their findings are based on a narrower content domain than is normally associated with the focal construct of interest.
A subtle but important point can arise when considering the content of measures with particularly narrow content. Internal consistency will increase when there is redundancy among items in the scale; however, the presence of similar items may decrease predictive power. This is known as the attenuation paradox in psycho metrics ( see Clark & Watson, 1995 ). When items are nearly identical, they contribute redundant information about a very specific aspect of the construct. However, the very specific attribute may not have predictive power. In essence, reliability can be maximized at the expense of creating a measure that is not very useful from the point of view of prediction (and likely explanation). Indeed, Clark and Watson (1995 ) have argued that the “goal of scale construction is to maximize validity rather than reliability” (p. 316). In short, an evaluation of content validity is also important when considering the predictive power of a given measure.
Whereas content validity is focused on the internal attributes of a measure, criterion-related validity is based on the empirical relations between measures and other variables. Using previous research and theory surrounding the focal construct, the researcher should develop an expectation regarding the magnitude and direction of observed associations (i.e., correlations) with other variables. A good supporting theory of a construct should stipulate a pattern of association, or nomological network, concerning those other variables that should be related and unrelated to the focal construct. This latter requirement is often more difficult to specify from existing theories, which tend to provide a more elaborate discussion of convergent associations rather than discriminant validity ( Widaman et al., 2011 ). For example, consider a very truncated nomological network for Agreeableness (dispositional kindness and empathy). Measures of this construct should be positively associated with romantic relationship quality, negatively related to crime (especially violent crime), and distinct from measures of cognitive ability such as tests of general intelligence.
Evaluations of criterion-related validity can be conducted within a data set as researchers document that a measure has an expected pattern of associations with existing criterion-related variables. Investigators using secondary data sets may want to conduct additional research to document the criterion-related validity of short measures with additional convenience samples (e.g., the ubiquitous college student samples used by many psychologists; Sears, 1986 ). For example, there are six items in the Add Health data set that appear to measure self-esteem (e.g., “I have a lot of good qualities” and “I like myself just the way I am”) ( see Russell, Crockett, Shen, &Lee, 2008 ). Although many of the items bear a strong resemblance to the items on the Rosenberg Self-Esteem scale ( Rosenberg, 1965 ), they are not exactly the same items. To obtain some additional data on the usefulness of this measure, we administered the Add Health items to a sample of 387 college students at our university along with the Rosenberg Self-Esteem scale and an omnibus measure of personality based on the Five-Factor model ( Goldberg, 1999 ). The six Add Health items were strongly correlated with the Rosenberg ( r = 0.79), and both self-esteem measures had a similar pattern of convergent and divergent associations with the facets of the Five-Factor model (the two profiles were very strongly associated: r > 0.95). This additional information can help bolster the case for the validity of the short Add Health self-esteem measure.
Special Issue: Missing Data in Existing Data Sets
Missing data is a fact of life in research— individuals may drop out of longitudinal studies or refuse to answer particular questions. These behaviors can affect the generalizability of findings because results may only apply to those individuals who choose to complete a study or a measure. Missing data can also diminish statistical power when common techniques like listwise deletion are used (e.g., only using cases with complete information, thereby reducing the sample size) and even lead to biased effect size estimates (e.g., McKnight & McKnight, 2011 ; McKnight, McKnight, Sidani, & Figuredo, 2007 ; Widaman, 2006 ). Thus, concerns about missing data are important for all aspects of research, including secondary data analysis. The development of specific techniques for appropriately handling missing data is an active area of research in quantitative methods ( Schafer & Graham, 2002 ).
Unfortunately, the literature surrounding missing data techniques is often technical and steeped in jargon, as noted by McKnight et al. (2007 ). The reality is that researchers attempting to understand issues of missing data need to pay careful attention to terminology. For example, a novice researcher may not immediately grasp the classification of missing data used in the literature ( see Schafer & Graham, 2002 , for a clear description). Consider the confusion that may stem from learning that data are missing at random (MAR) versus data are missing completely at random (MCAR). The term MAR does not mean that missing values only occurred because of chance factors. This is the case when data are missing completely at random (MCAR). Data that are MCAR are absent because of truly random factors. Data that are MAR refers to the situation in which the probability that the observations are missing depends only on other available information in the data set. Data that are MAR can be essentially “ignored” when the other factors are included in a statistical model. The last type of missing data, data missing not at random (MNAR), is likely to characterize the variables in many real-life data sets. As it stands, methods for handing data that are MAR and MCAR are better developed and more easily implemented than methods for handling data MNAR. Thus, many applied researchers will assume data are MAR for purposes of statistical modeling (and the ability to sleep comfortably at night). Fortunately, such an assumption might not create major problems for many analyses and may in fact represent the “practical state of the art” ( Schafer & Graham, 2002 , p. 173).
The literature on missing data techniques is growing, so we simply recommend that researchers keep current on developments in this area. McKnight et al. (2007 ) and Widaman (2006 ) both provide an accessible primer on missing data techniques. In keeping with the largely practical bent to the chapter, we suggest that researchers keep careful track of the amount of missing data present in their analyses and report such information clearly in research papers ( see McKnight & McKnight, 2011 ). Similarly, we recommend that researchers thoroughly screen their data sets for evidence that missing values depend on other measured variables (e.g., scores at Time 1 might be associated with Time 2 dropout). In general, we suggest that researchers avoid listwise and pairwise deletion methods because there is very little evidence that these are good practices ( see Jeličić, Phelps, & Lerner, 2009 ; Widaman, 2006 ). Rather, it might be easiest to use direct fitting methods such as the estimation procedures used in conventional structural equation modeling packages (e.g., Full Information Maximum Likelihood; see Allison, 2003 ). At the very least, it is usually instructive to compare results using listwise deletion with results obtained with direct model fitting in terms of the effect size estimates and basic conclusions regarding the statistical significance of focal coefficients.
Special Issue: Sample Weighting in Existing Data Sets
One of the advantages of many existing data sets is that they were collected using probabilistic sampling methods so that researchers can obtain unbiased population estimates. Such estimates, however, are only obtained when complex survey weights are formally incorporated into the statistical modeling procedures. Such weighting schemes can affect the correlations between variables, and therefore all users of secondary data sets should become familiar with sampling design when they begin working with a new data set. A considerable amount of time and effort is dedicated toward generating complex weighting schemes that account for the precise sampling strategies used in the given study, and users of secondary data sets should give careful consideration to using these weights appropriately.
In some cases, the addition of sampling weights will have little substantive implication on findings, so extensive concern over weighting might be overstated. On the other hand, any potential difference is ultimately an empirical question, so researchers are well advised to consider the importance of sampling weights ( Shrout & Napier, 2011 ). The problem is that many psychologists are not well versed in the use of sampling weights ( Shrout & Napier, 2011 ). Thus, psychologists may not be in a strong position to evaluate whether sample weighting concerns are relevant. In addition, it is sometimes necessary to use specialized software packages or add-ons to adjust analytic models appropriately for sampling weights. Programs such as STATA and SAS have such capabilities in the base package, whereas packages like SPSS sometimes require a complex survey model add-on that integrates with its existing capabilities. Whereas the graduate training of the modal sociologist or demographer is likely to emphasize survey research and thus presumably cover sampling, this is not the case with the methodological training of many psychologists ( Aiken, West, & Millsap, 2008 ). Psychologists who are unfamiliar with sample weighting procedures are well advised to seek the counsel of a survey methodologist before undertaking data analysis.
In terms of practical recommendations, it is important for the user of the secondary data set to develop a clear understanding of how the data were collected by reading documentation about the design and sampling procedure ( Shrout & Napier, 2011 ). This insight will provide a conceptual framework for understanding weighting schemes and for deciding how to appropriately weight the data. Once researchers have a clear idea of the sampling scheme and potential weights, actually incorporating available weights into analyses is not terribly difficult, provided researchers have the appropriate software ( Shrout & Napier, 2011 ). Weighting tutorials are often available for specific data sets. For example, the Add Health project has a document describing weighting ( http://www.cpc.unc.edu/projects/addhealth/faqs/aboutdata/weight1.pdf ) as does the Centers for Disease Control and Prevention for use with their Youth Risk Behavior Surveys ( http://www.cdc.gov/HealthyYouth/yrbs/pdf/YRBS_analysis_software.pdf ). These free documents may also provide useful and accessible background even for those who may not use the data from these projects.
Secondary data analysis refers to the analysis of existing data that may not have been explicitly collected to address a particular research question. Many of the quantitative techniques described in this volume can be applied using existing resources. To be sure, strong data analytic skills are important for fully realizing the potential benefits of secondary data sets, and such skills can help researchers recognize the limits of a data set for any given analysis.
In particular, measurement issues are likely to create the biggest hurdles for psychologists conducting secondary analyses in terms of the challenges associated with offering a reasonable interpretation of the results and in surviving the peer-review process. Accordingly, a familiarity with basic issues in psychometrics is very helpful. Beyond such skills, the effective use of these existing resources requires patience and strong attention to detail. Effective secondary data analysis also requires a fair bit of curiosity to seek out those resources that might be used to make important contribution to psychological science.
Ultimately, we hope that the field of psychology becomes more and more accepting of secondary data analysis. As psychologists use this approach with increasing frequency, it is likely that the organizers of major ongoing data collection efforts will be increasingly open to including measures of prime interest to psychologists. The individuals in charge of projects like the BHPS, the GSOEP, and the National Center for Education Statistics ( http://nces.ed.gov/ ) want their data to be used by the widest possible audiences and will respond to researcher demands. We believe that it is time that psychologists join their colleagues in economics, sociology, and political science in taking advantage of these existing resources. It is also time to move beyond divisive discussions surrounding the presumed superiority of primary data collection over secondary analysis. There is no reason to choose one over the other when the field of psychology can profit from both. We believe that the relevant topics of debate are not about the method of initial data collection but, rather, about the importance and intrinsic interest of the underlying research questions. If the question is important and the research design and measures are suitable, then there is little doubt in our minds that secondary data analysis can make a contribution to psychological science.
Author Note
M. Brent Donnellan, Department of Psychology, Michigan State University, East Lansing, MI 48824.
Richard E. Lucas, Department of Psychology, Michigan State University, East Lansing, MI 48824.
One consequence of large sample sizes, however, is that issues of effect size interpretation become paramount given that very small correlations or very small mean differences between groups are likely to be statistically significant using conventional null hypothesis significance tests (e.g., Trzesniewski & Donnellan, 2009 ). Researchers will therefore need to grapple with issues related to null hypothesis significance testing ( see Kline, 2004 ).
Aiken, L. S. , & West, S. G. ( 1991 ). Multiple regression: Testing and interpreting interactions . Newbury Park, CA: Sage.
Google Scholar
Google Preview
Aiken, L. S. , West, S. G. , & Millsap, R. E. ( 2008 ). Doctoral training in statistics, measurement, and methodology in psychology: Replication and extension of Aiken, West, Sechrest, and Reno’s (1990) survey of Ph.D. programs in North America. American Psychologist, 63, 32–50.
Akers, R. L. , Massey, J. , & Clarke, W ( 1983 ). Are self-reports of adolescent deviance valid? Biochemical measures, randomized response, and the bogus pipeline in smoking behavior. Social Forces, 62, 234–251.
Allison, P. D. ( 2003 ). Missing data techniques for structural equation modeling. Journal of Abnormal Psychology, 112, 545–557.
Baird, B. M. , Lucas, R. E. , & Donnellan, M. B. ( 2010 ). Life Satisfaction across the lifespan: Findings from two nationally representative panel studies. Social Indicators Research, 99, 183–203.
Briggs, S. R. , & Cheek, J. M. ( 1986 ). The role of factor analysis in the development and evaluation of personality scales. Journal of Personality 54, 106–148.
Brooks-Gunn, J. , Berlin, L. J. , Leventhal, T. , & Fuligini, A. S. ( 2000 ). Depending on the kindness of strangers: Current national data initiatives and developmental research. Child Development, 71, 257–268.
Brooks-Gunn, J. , & Chase-Lansdale, P. L. ( 1991 ) (Eds.). Secondary data analyses in developmental psychology [Special section]. Developmental Psychology, 27, 899–951.
Clark, L. A. , & Watson, D. ( 1995 ). Constructing validity: Basic issues in objective scale development. Psychological Assessment, 7, 309–319.
Cronbach, L. J. ( 1951 ). Coefficient alpha and the internal structure of tests. Psychometrika, 16, 297–234.
Cronbach, L. J. ( 1957 ). The two disciplines of scientific psychology. American Psychologist, 12, 671–684.
Cronbach, L. J. , & Meehl, P. ( 1955 ). Construct validity in psychological tests. Psychological Bulletin, 52, 281–302.
Diener, E. , Emmons, R. A. , Larsen, R. J. , & Griffin, S. ( 1985 ). The Satisfaction with Life Scale. Journal of Personality Assessment, 49, 71–75.
Donnellan, M. B. , Trzesniewski, K. H. , & Robins, R. W. ( 2011 ). Self-esteem: Enduring issues and controversies. In T Chamorro-Premuzic , S. von Stumm , and A. Furnham (Eds). The Wiley-Blackwell Handbook of Individual Differences (pp. 710–746). New York: Wiley-Blackwell.
Freese, J. ( 2007 ). Replication standards for quantitative social science: Why not sociology? Sociological Methods & Research, 36, 153–172.
Gerstorf, D. , Ram, N. , Estabrook, R. , Schupp, J. , Wagner, G. G. , & Lindenberger, U. ( 2008 ). Life satisfaction shows terminal decline in old age: Longitudinal evidence from the German Socio-Economic Panel Study (SOEP). Developmental Psychology, 44, 1148–1159.
Gerstorf, D. , Ram, N. , Goebel, J. , Schupp, J. , Lindenberger, U. , & Wagner, G. G. ( 2010 ). Where people live and die makes a difference: Individual and geographic disparities in well-being progression at the end of life. Psychology and Aging, 25, 661–676.
Goldberg, L. R. ( 1999 ). A broad-bandwidth, public domain, personality inventory measuring the lower-level facets of several five-factor models. In I Mervielde , I. Deary , F. De Fruyt , & F. Ostendorf (Eds.), Personality psychology in Europe (Vol. 7, pp. 7–28). Tilburg, The Netherlands: Tilburg University Press.
Hofferth, S. L. , ( 2005 ). Secondary data analysis in family research. Journal of Marriage and the Family, 67, 891–907.
Hunter, J. E. , & Schmidt, F. L. ( 2004 ). Methods of meta-analysis: Correcting error and bias in research findings (2nd ed.). Newbury Park, CA: Sage.
Jeličić, H. , Phelps, E. , & Lerner, R. M. ( 2009 ). Use of missing data methods in longitudinal studies: The persistence of bad practices in developmental psychology. Developmental Psychology, 45, 1195–1199.
John, O. P. , & Soto, C. J. ( 2007 ). The importance of being valid. In R. W Robins , R. C. Fraley , and R. F. Krueger (Eds). Handbook of Research Methods in Personality Psychology (pp. 461–494). New York: Guilford Press.
Kiecolt, K. J. & Nathan, L. E. ( 1985 ). Secondary analysis of survey data . Sage University Paper series on Quantitative Applications in the Social Sciences, No. 53). Newbury Park, CA: Sage.
Kline, R. B. ( 2004 ). Beyond significance testing: Reforming data analysis methods in behavioral research . Washington, DC: American Psychological Association.
Kline, R. B. ( 2011 ). Principles and practice of structural equation modeling (3rd ed.). New York: Guildford Press.
Lance, C. E. , Butts, M. M. , & Michels, L. C. ( 2006 ). The sources of four commonly reported cutoff criteria: What did they really say? Organizational Research Methods, 9, 202–220.
Lord, F. , & Novick, M. R. ( 1968 ). Statistical theories of mental test scores . Reading, MA: Addison-Wesley.
Lucas, R. E. ( 2005 ). Time does not heal all wounds. Psychological Science, 16, 945–950.
Lucas, R. E. ( 2007 ). Adaptation and the set-point model of subjective well-being: Does happiness change after major life events? Current Directions in Psychological Science, 16, 75–79.
McCall, R. B. , & Appelbaum, M. I. ( 1991 ). Some issues of conducting secondary analyses. Developmental Psychology, 27, 911–917.
McCrae, R. R. , Kurtz, J. E. , Yamagata, S. , & Terracciano, A. ( 2011 ). Internal consistency, retest reliability, and their implications for personality scale validity. Personality and Social Psychology Review, 15, 28–50.
Messick, S. ( 1995 ). Validity of psychological assessment: Validation of inferences from persons’ responses and performances as scientific inquiry into score meaning. American Psychologist, 50, 741–749.
McKnight, P. E. , & McKnight, K. M. ( 2011 ). Missing data in secondary data analysis. In K. H. Trzesniewski , M. B. Donnellan , & R. E. Lucas (Eds). Secondary data analysis: An introduction for psychologists (pp. 83–101). Washington, DC: American Psychological Association.
McKnight, P. E. , McKnight, K. M. , Sidani, S. , & Figuredo, A. ( 2007 ). Missing data: A gentle introduction . New York: Guilford Press.
Mroczek, D. K. , Pitzer, L. , Miller, L. , Turiano, N. , & Fingerman, K. ( 2011 ). The use of secondary data in adult development and aging research. In K. H. Trzesniewski , M. B. Donnellan , and R. E. Lucas (Eds). Secondary data analysis: An introduction for psychologists (pp. 121–132). Washington, DC: American Psychological Association.
Pienta, A. M. , O’Rourke, J. M. , & Franks, M. M. ( 2011 ). Getting started: Working with secondary data. In K. H. Trzesniewski , M. B. Donnellan , and R. E. Lucas (Eds). Secondary data analysis: An introduction for psychologists (pp. 13–25). Washington, DC: American Psychological Association.
Rosenberg, M. ( 1965 ). Society and adolescent self image , Princeton, NJ: Princeton University.
Russell, S. T. , Crockett, L. J. , Shen, Y-L , & Lee, S-A. ( 2008 ). Cross-ethnic invariance of self-esteem and depression measures for Chinese, Filipino, and European American adolescents. Journal of Youth and Adolescence, 37, 50–61.
Russell, S. T. , & Matthews, E. ( 2011 ). Using secondary data to study adolescence and adolescent development. In K. H. Trzesniewski , M. B. Donnellan , & R. E. Lucas (Eds). Secondary data analysis: An introduction for psychologists (pp. 163–176). Washington, DC: American Psychological Association.
Schafer, J. L. & Graham, J. W ( 2002 ). Missing data: Our view of the state of the art. Psychological Methods, 7, 147–177.
Schmitt, N. ( 1996 ). Uses and abuses of coefficient alpha. Psychological Assessment, 8, 350–353.
Schwarz, N. ( 1999 ). Self-reports: How the questions shape the answers. American Psychologist, 54, 93–105.
Schwarz, N. & Strack, F. ( 1999 ). Reports of subjective well-being: Judgmental processes and their methodological implications. In D. Kahneman , E. Diener , & N. Schwarz (Eds.). Well-being: The foundations of hedonic psychology (pp.61–84). New York: Russell Sage Foundation.
Sears, D. O. ( 1986 ). College sophomores in the lab: Influences of a narrow data base on social psychology’s view of human nature. Journal of Personality and Social Psychology, 51, 515–530.
Shrout, P. E. , & Napier, J. L. ( 2011 ). Analyzing survey data with complex sampling designs. In K. H. Trzesniewski , M. B. Donnellan , & R. E. Lucas (Eds). Secondary data analysis: An introduction for psychologists (pp. 63–81). Washington, DC: American Psychological Association.
Simms, L. J. ( 2008 ). Classical and modern methods of psychological scale construction. Social and Personality Psychology Compass, 2/1, 414–433.
Simms, L. J. , & Watson, D. ( 2007 ). The construct validation approach to personality scale creation. In R. W Robins , R. C. Fraley , & R. F. Krueger (Eds). Handbook of Research Methods in Personality Psychology (pp. 240–258). New York: Guilford Press.
Smith, G. X ( 2005 ). On construct validity: Issues of method and measurement. Psychological Assessment, 17, 396–408.
Tracy, J. L. , Robins, R. W. , & Sherman, J. W. ( 2009 ). The practice of psychological science: Searching for Cronbach’s two streams in social-personality psychology. Journal of Personality and Social Psychology, 96, 1206–1225.
Trzesniewski, K.H. & Donnellan, M. B. ( 2009 ). Re-evaluating the evidence for increasing self-views among high school students: More evidence for consistency across generations (1976–2006). Psychological Science, 20, 920–922.
Trzesniewski, K. H. & Donnellan, M. B. ( 2010 ). Rethinking “Generation Me”: A study of cohort effects from 1976–2006. Perspectives in Psychological Science , 5, 58–75.
Trzesniewski, K. H. , Donnellan, M. B. , & Lucas, R. E. ( 2011 ) (Eds). Secondary data analysis: An introduction for psychologists . Washington, DC: American Psychological Association.
Widaman, K. F. ( 2006 ). Missing data: What to do with or without them. Monographs of the Society for Research in Child Development, 71, 42–64.
Widaman, K. F. , Little, T. D. , Preacher, K. K. , & Sawalani, G. M. ( 2011 ). On creating and using short forms of scales in secondary research. In K. H. Trzesniewski , M. B. Donnellan , & R. E. Lucas (Eds). Secondary data analysis: An introduction for psychologists (pp. 39–61). Washington, DC: American Psychological Association.
Willms, J. D. ( 2011 ). Managing and using secondary data sets with multidisciplinary research teams. In K. H. Trzesniewski , M. B. Donnellan , & R. E. Lucas (Eds). Secondary data analysis: An introduction for psychologists (pp. 27–38). Washington, DC: American Psychological Association.
- About Oxford Academic
- Publish journals with us
- University press partners
- What we publish
- New features
- Open access
- Institutional account management
- Rights and permissions
- Get help with access
- Accessibility
- Advertising
- Media enquiries
- Oxford University Press
- Oxford Languages
- University of Oxford
Oxford University Press is a department of the University of Oxford. It furthers the University's objective of excellence in research, scholarship, and education by publishing worldwide
- Copyright © 2024 Oxford University Press
- Cookie settings
- Cookie policy
- Privacy policy
- Legal notice
This Feature Is Available To Subscribers Only
Sign In or Create an Account
This PDF is available to Subscribers Only
For full access to this pdf, sign in to an existing account, or purchase an annual subscription.
What Is Secondary Data? A Complete Guide
What is secondary data, and why is it important? Find out in this post.
Within data analytics, there are many ways of categorizing data. A common distinction, for instance, is that between qualitative and quantitative data . In addition, you might also distinguish your data based on factors like sensitivity. For example, is it publicly available or is it highly confidential?
Probably the most fundamental distinction between different types of data is their source. Namely, are they primary, secondary, or third-party data? Each of these vital data sources supports the data analytics process in its own way. In this post, we’ll focus specifically on secondary data. We’ll look at its main characteristics, provide some examples, and highlight the main pros and cons of using secondary data in your analysis.
We’ll cover the following topics:
What is secondary data?
- What’s the difference between primary, secondary, and third-party data?
- What are some examples of secondary data?
- How to analyse secondary data
- Advantages of secondary data
- Disadvantages of secondary data
- Wrap-up and further reading
Ready to learn all about secondary data? Then let’s go.
1. What is secondary data?
Secondary data (also known as second-party data) refers to any dataset collected by any person other than the one using it.
Secondary data sources are extremely useful. They allow researchers and data analysts to build large, high-quality databases that help solve business problems. By expanding their datasets with secondary data, analysts can enhance the quality and accuracy of their insights. Most secondary data comes from external organizations. However, secondary data also refers to that collected within an organization and then repurposed.
Secondary data has various benefits and drawbacks, which we’ll explore in detail in section four. First, though, it’s essential to contextualize secondary data by understanding its relationship to two other sources of data: primary and third-party data. We’ll look at these next.
2. What’s the difference between primary, secondary, and third-party data?
To best understand secondary data, we need to know how it relates to the other main data sources: primary and third-party data.
What is primary data?
‘Primary data’ (also known as first-party data) are those directly collected or obtained by the organization or individual that intends to use them. Primary data are always collected for a specific purpose. This could be to inform a defined goal or objective or to address a particular business problem.
For example, a real estate organization might want to analyze current housing market trends. This might involve conducting interviews, collecting facts and figures through surveys and focus groups, or capturing data via electronic forms. Focusing only on the data required to complete the task at hand ensures that primary data remain highly relevant. They’re also well-structured and of high quality.
As explained, ‘secondary data’ describes those collected for a purpose other than the task at hand. Secondary data can come from within an organization but more commonly originate from an external source. If it helps to make the distinction, secondary data is essentially just another organization’s primary data.
Secondary data sources are so numerous that they’ve started playing an increasingly vital role in research and analytics. They are easier to source than primary data and can be repurposed to solve many different problems. While secondary data may be less relevant for a given task than primary data, they are generally still well-structured and highly reliable.
What is third-party data?
‘Third-party data’ (sometimes referred to as tertiary data) refers to data collected and aggregated from numerous discrete sources by third-party organizations. Because third-party data combine data from numerous sources and aren’t collected with a specific goal in mind, the quality can be lower.
Third-party data also tend to be largely unstructured. This means that they’re often beset by errors, duplicates, and so on, and require more processing to get them into a usable format. Nevertheless, used appropriately, third-party data are still a useful data analytics resource. You can learn more about structured vs unstructured data here .
OK, now that we’ve placed secondary data in context, let’s explore some common sources and types of secondary data.
3. What are some examples of secondary data?
External secondary data.
Before we get to examples of secondary data, we first need to understand the types of organizations that generally provide them. Frequent sources of secondary data include:
- Government departments
- Public sector organizations
- Industry associations
- Trade and industry bodies
- Educational institutions
- Private companies
- Market research providers
While all these organizations provide secondary data, government sources are perhaps the most freely accessible. They are legally obliged to keep records when registering people, providing services, and so on. This type of secondary data is known as administrative data. It’s especially useful for creating detailed segment profiles, where analysts hone in on a particular region, trend, market, or other demographic.
Types of secondary data vary. Popular examples of secondary data include:
- Tax records and social security data
- Census data (the U.S. Census Bureau is oft-referenced, as well as our favorite, the U.S. Bureau of Labor Statistics )
- Electoral statistics
- Health records
- Books, journals, or other print media
- Social media monitoring, internet searches, and other online data
- Sales figures or other reports from third-party companies
- Libraries and electronic filing systems
- App data, e.g. location data, GPS data, timestamp data, etc.
Internal secondary data
As mentioned, secondary data is not limited to that from a different organization. It can also come from within an organization itself.
Sources of internal secondary data might include:
- Sales reports
- Annual accounts
- Quarterly sales figures
- Customer relationship management systems
- Emails and metadata
- Website cookies
In the right context, we can define practically any type of data as secondary data. The key takeaway is that the term ‘secondary data’ doesn’t refer to any inherent quality of the data themselves, but to how they are used. Any data source (external or internal) used for a task other than that for which it was originally collected can be described as secondary data.
4. How to analyse secondary data
The process of analysing secondary data can be performed either quantitatively or qualitatively, depending on the kind of data the researcher is dealing with. The quantitative method of secondary data analysis is used on numerical data and is analyzed mathematically. The qualitative method uses words to provide in-depth information about data.
There are different stages of secondary data analysis, which involve events before, during, and after data collection. These stages include:
- Statement of purpose: Before collecting secondary data, you need to know your statement of purpose. This means you should have a clear awareness of the goal of the research work and how this data will help achieve it. This will guide you to collect the right data, then choosing the best data source and method of analysis.
- Research design: This is a plan on how the research activities will be carried out. It describes the kind of data to be collected, the sources of data collection, the method of data collection, tools used, and method of analysis. Once the purpose of the research has been identified, the researcher should design a research process that will guide the data analysis process.
- Developing the research questions: Once you’ve identified the research purpose, an analyst should also prepare research questions to help identify secondary data. For example, if a researcher is looking to learn more about why working adults are increasingly more interested in the “gig economy” as opposed to full-time work, they may ask, “What are the main factors that influence adults decisions to engage in freelance work?” or, “Does education level have an effect on how people engage in freelance work?
- Identifying secondary data: Using the research questions as a guide, researchers will then begin to identify relevant data from the sources provided. If the kind of data to be collected is qualitative, a researcher can filter out qualitative data—for example.
- Evaluating secondary data: Once relevant data has been identified and collates, it will be evaluated to ensure it fulfils the criteria of the research topic. Then, it is analyzed either using the quantitative or qualitative method, depending on the type of data it is.
You can learn more about secondary data analysis in this post .
5. Advantages of secondary data
Secondary data is suitable for any number of analytics activities. The only limitation is a dataset’s format, structure, and whether or not it relates to the topic or problem at hand.
When analyzing secondary data, the process has some minor differences, mainly in the preparation phase. Otherwise, it follows much the same path as any traditional data analytics project.
More broadly, though, what are the advantages and disadvantages of using secondary data? Let’s take a look.
Advantages of using secondary data
It’s an economic use of time and resources: Because secondary data have already been collected, cleaned, and stored, this saves analysts much of the hard work that comes from collecting these data firsthand. For instance, for qualitative data, the complex tasks of deciding on appropriate research questions or how best to record the answers have already been completed. Secondary data saves data analysts and data scientists from having to start from scratch.
It provides a unique, detailed picture of a population: Certain types of secondary data, especially government administrative data, can provide access to levels of detail that it would otherwise be extremely difficult (or impossible) for organizations to collect on their own. Data from public sources, for instance, can provide organizations and individuals with a far greater level of population detail than they could ever hope to gather in-house. You can also obtain data over larger intervals if you need it., e.g. stock market data which provides decades’-worth of information.
Secondary data can build useful relationships: Acquiring secondary data usually involves making connections with organizations and analysts in fields that share some common ground with your own. This opens the door to a cross-pollination of disciplinary knowledge. You never know what nuggets of information or additional data resources you might find by building these relationships.
Secondary data tend to be high-quality: Unlike some data sources, e.g. third-party data, secondary data tends to be in excellent shape. In general, secondary datasets have already been validated and therefore require minimal checking. Often, such as in the case of government data, datasets are also gathered and quality-assured by organizations with much more time and resources available. This further benefits the data quality , while benefiting smaller organizations that don’t have endless resources available.
It’s excellent for both data enrichment and informing primary data collection: Another benefit of secondary data is that they can be used to enhance and expand existing datasets. Secondary data can also inform primary data collection strategies. They can provide analysts or researchers with initial insights into the type of data they might want to collect themselves further down the line.
6. Disadvantages of secondary data
They aren’t always free: Sometimes, it’s unavoidable—you may have to pay for access to secondary data. However, while this can be a financial burden, in reality, the cost of purchasing a secondary dataset usually far outweighs the cost of having to plan for and collect the data firsthand.
The data isn’t always suited to the problem at hand: While secondary data may tick many boxes concerning its relevance to a business problem, this is not always true. For instance, secondary data collection might have been in a geographical location or time period ill-suited to your analysis. Because analysts were not present when the data were initially collected, this may also limit the insights they can extract.
The data may not be in the preferred format: Even when a dataset provides the necessary information, that doesn’t mean it’s appropriately stored. A basic example: numbers might be stored as categorical data rather than numerical data. Another issue is that there may be gaps in the data. Categories that are too vague may limit the information you can glean. For instance, a dataset of people’s hair color that is limited to ‘brown, blonde and other’ will tell you very little about people with auburn, black, white, or gray hair.
You can’t be sure how the data were collected: A structured, well-ordered secondary dataset may appear to be in good shape. However, it’s not always possible to know what issues might have occurred during data collection that will impact their quality. For instance, poor response rates will provide a limited view. While issues relating to data collection are sometimes made available alongside the datasets (e.g. for government data) this isn’t always the case. You should therefore treat secondary data with a reasonable degree of caution.
Being aware of these disadvantages is the first step towards mitigating them. While you should be aware of the risks associated with using secondary datasets, in general, the benefits far outweigh the drawbacks.
7. Wrap-up and further reading
In this post we’ve explored secondary data in detail. As we’ve seen, it’s not so different from other forms of data. What defines data as secondary data is how it is used rather than an inherent characteristic of the data themselves.
To learn more about data analytics, check out this free, five-day introductory data analytics short course . You can also check out these articles to learn more about the data analytics process:
- What is data cleaning and why is it important?
- What is data visualization? A complete introductory guide
- 10 Great places to find free datasets for your next project
- Skip to main content
- Skip to primary sidebar
- Skip to footer
- QuestionPro

- Solutions Industries Gaming Automotive Sports and events Education Government Travel & Hospitality Financial Services Healthcare Cannabis Technology Use Case NPS+ Communities Audience Contactless surveys Mobile LivePolls Member Experience GDPR Positive People Science 360 Feedback Surveys
- Resources Blog eBooks Survey Templates Case Studies Training Help center
Home Market Research
Secondary Research: Definition, Methods and Examples.

In the world of research, there are two main types of data sources: primary and secondary. While primary research involves collecting new data directly from individuals or sources, secondary research involves analyzing existing data already collected by someone else. Today we’ll discuss secondary research.
One common source of this research is published research reports and other documents. These materials can often be found in public libraries, on websites, or even as data extracted from previously conducted surveys. In addition, many government and non-government agencies maintain extensive data repositories that can be accessed for research purposes.
LEARN ABOUT: Research Process Steps
While secondary research may not offer the same level of control as primary research, it can be a highly valuable tool for gaining insights and identifying trends. Researchers can save time and resources by leveraging existing data sources while still uncovering important information.
What is Secondary Research: Definition
Secondary research is a research method that involves using already existing data. Existing data is summarized and collated to increase the overall effectiveness of the research.
One of the key advantages of secondary research is that it allows us to gain insights and draw conclusions without having to collect new data ourselves. This can save time and resources and also allow us to build upon existing knowledge and expertise.
When conducting secondary research, it’s important to be thorough and thoughtful in our approach. This means carefully selecting the sources and ensuring that the data we’re analyzing is reliable and relevant to the research question . It also means being critical and analytical in the analysis and recognizing any potential biases or limitations in the data.
LEARN ABOUT: Level of Analysis
Secondary research is much more cost-effective than primary research , as it uses already existing data, unlike primary research, where data is collected firsthand by organizations or businesses or they can employ a third party to collect data on their behalf.
LEARN ABOUT: Data Analytics Projects
Secondary Research Methods with Examples
Secondary research is cost-effective, one of the reasons it is a popular choice among many businesses and organizations. Not every organization is able to pay a huge sum of money to conduct research and gather data. So, rightly secondary research is also termed “ desk research ”, as data can be retrieved from sitting behind a desk.
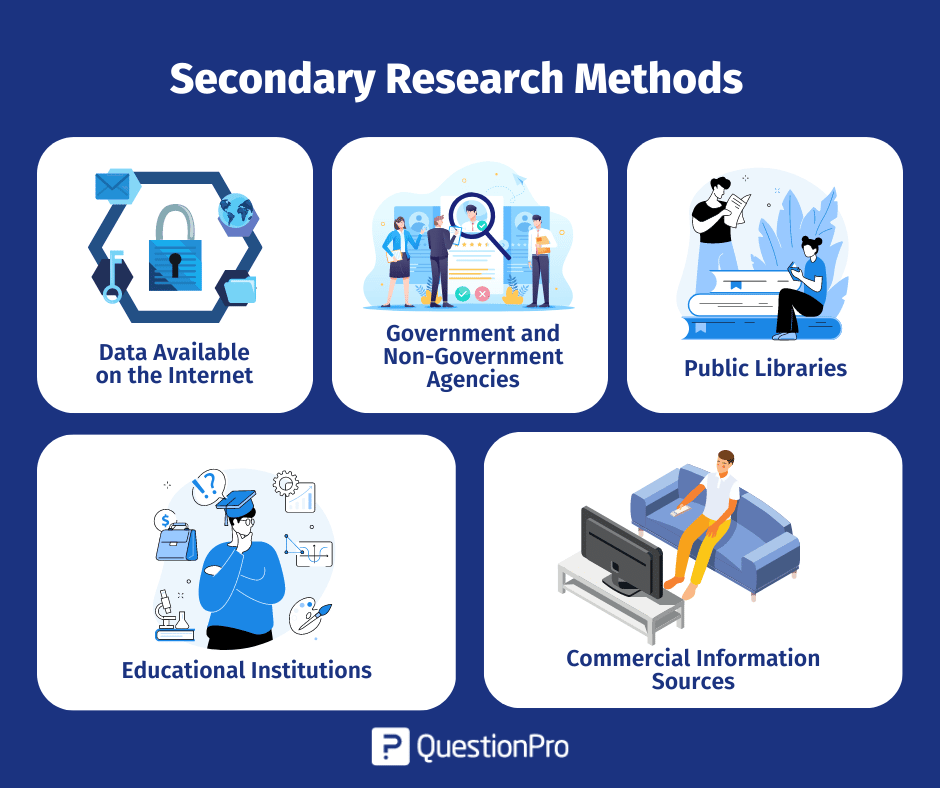
The following are popularly used secondary research methods and examples:
1. Data Available on The Internet
One of the most popular ways to collect secondary data is the internet. Data is readily available on the internet and can be downloaded at the click of a button.
This data is practically free of cost, or one may have to pay a negligible amount to download the already existing data. Websites have a lot of information that businesses or organizations can use to suit their research needs. However, organizations need to consider only authentic and trusted website to collect information.
2. Government and Non-Government Agencies
Data for secondary research can also be collected from some government and non-government agencies. For example, US Government Printing Office, US Census Bureau, and Small Business Development Centers have valuable and relevant data that businesses or organizations can use.
There is a certain cost applicable to download or use data available with these agencies. Data obtained from these agencies are authentic and trustworthy.
3. Public Libraries
Public libraries are another good source to search for data for this research. Public libraries have copies of important research that were conducted earlier. They are a storehouse of important information and documents from which information can be extracted.
The services provided in these public libraries vary from one library to another. More often, libraries have a huge collection of government publications with market statistics, large collection of business directories and newsletters.
4. Educational Institutions
Importance of collecting data from educational institutions for secondary research is often overlooked. However, more research is conducted in colleges and universities than any other business sector.
The data that is collected by universities is mainly for primary research. However, businesses or organizations can approach educational institutions and request for data from them.
5. Commercial Information Sources
Local newspapers, journals, magazines, radio and TV stations are a great source to obtain data for secondary research. These commercial information sources have first-hand information on economic developments, political agenda, market research, demographic segmentation and similar subjects.
Businesses or organizations can request to obtain data that is most relevant to their study. Businesses not only have the opportunity to identify their prospective clients but can also know about the avenues to promote their products or services through these sources as they have a wider reach.
Key Differences between Primary Research and Secondary Research
Understanding the distinction between primary research and secondary research is essential in determining which research method is best for your project. These are the two main types of research methods, each with advantages and disadvantages. In this section, we will explore the critical differences between the two and when it is appropriate to use them.
How to Conduct Secondary Research?
We have already learned about the differences between primary and secondary research. Now, let’s take a closer look at how to conduct it.
Secondary research is an important tool for gathering information already collected and analyzed by others. It can help us save time and money and allow us to gain insights into the subject we are researching. So, in this section, we will discuss some common methods and tips for conducting it effectively.
Here are the steps involved in conducting secondary research:
1. Identify the topic of research: Before beginning secondary research, identify the topic that needs research. Once that’s done, list down the research attributes and its purpose.
2. Identify research sources: Next, narrow down on the information sources that will provide most relevant data and information applicable to your research.
3. Collect existing data: Once the data collection sources are narrowed down, check for any previous data that is available which is closely related to the topic. Data related to research can be obtained from various sources like newspapers, public libraries, government and non-government agencies etc.
4. Combine and compare: Once data is collected, combine and compare the data for any duplication and assemble data into a usable format. Make sure to collect data from authentic sources. Incorrect data can hamper research severely.
4. Analyze data: Analyze collected data and identify if all questions are answered. If not, repeat the process if there is a need to dwell further into actionable insights.
Advantages of Secondary Research
Secondary research offers a number of advantages to researchers, including efficiency, the ability to build upon existing knowledge, and the ability to conduct research in situations where primary research may not be possible or ethical. By carefully selecting their sources and being thoughtful in their approach, researchers can leverage secondary research to drive impact and advance the field. Some key advantages are the following:
1. Most information in this research is readily available. There are many sources from which relevant data can be collected and used, unlike primary research, where data needs to collect from scratch.
2. This is a less expensive and less time-consuming process as data required is easily available and doesn’t cost much if extracted from authentic sources. A minimum expenditure is associated to obtain data.
3. The data that is collected through secondary research gives organizations or businesses an idea about the effectiveness of primary research. Hence, organizations or businesses can form a hypothesis and evaluate cost of conducting primary research.
4. Secondary research is quicker to conduct because of the availability of data. It can be completed within a few weeks depending on the objective of businesses or scale of data needed.
As we can see, this research is the process of analyzing data already collected by someone else, and it can offer a number of benefits to researchers.
Disadvantages of Secondary Research
On the other hand, we have some disadvantages that come with doing secondary research. Some of the most notorious are the following:
1. Although data is readily available, credibility evaluation must be performed to understand the authenticity of the information available.
2. Not all secondary data resources offer the latest reports and statistics. Even when the data is accurate, it may not be updated enough to accommodate recent timelines.
3. Secondary research derives its conclusion from collective primary research data. The success of your research will depend, to a greater extent, on the quality of research already conducted by primary research.
LEARN ABOUT: 12 Best Tools for Researchers
In conclusion, secondary research is an important tool for researchers exploring various topics. By leveraging existing data sources, researchers can save time and resources, build upon existing knowledge, and conduct research in situations where primary research may not be feasible.
There are a variety of methods and examples of secondary research, from analyzing public data sets to reviewing previously published research papers. As students and aspiring researchers, it’s important to understand the benefits and limitations of this research and to approach it thoughtfully and critically. By doing so, we can continue to advance our understanding of the world around us and contribute to meaningful research that positively impacts society.
QuestionPro can be a useful tool for conducting secondary research in a variety of ways. You can create online surveys that target a specific population, collecting data that can be analyzed to gain insights into consumer behavior, attitudes, and preferences; analyze existing data sets that you have obtained through other means or benchmark your organization against others in your industry or against industry standards. The software provides a range of benchmarking tools that can help you compare your performance on key metrics, such as customer satisfaction, with that of your peers.
Using QuestionPro thoughtfully and strategically allows you to gain valuable insights to inform decision-making and drive business success. Start today for free! No credit card is required.
LEARN MORE FREE TRIAL
MORE LIKE THIS

Top 10 Dynata Alternatives & Competitors
May 27, 2024

What Are My Employees Really Thinking? The Power of Open-ended Survey Analysis
May 24, 2024

I Am Disconnected – Tuesday CX Thoughts
May 21, 2024

20 Best Customer Success Tools of 2024
May 20, 2024
Other categories
- Academic Research
- Artificial Intelligence
- Assessments
- Brand Awareness
- Case Studies
- Communities
- Consumer Insights
- Customer effort score
- Customer Engagement
- Customer Experience
- Customer Loyalty
- Customer Research
- Customer Satisfaction
- Employee Benefits
- Employee Engagement
- Employee Retention
- Friday Five
- General Data Protection Regulation
- Insights Hub
- Life@QuestionPro
- Market Research
- Mobile diaries
- Mobile Surveys
- New Features
- Online Communities
- Question Types
- Questionnaire
- QuestionPro Products
- Release Notes
- Research Tools and Apps
- Revenue at Risk
- Survey Templates
- Training Tips
- Uncategorized
- Video Learning Series
- What’s Coming Up
- Workforce Intelligence

An official website of the United States government
The .gov means it’s official. Federal government websites often end in .gov or .mil. Before sharing sensitive information, make sure you’re on a federal government site.
The site is secure. The https:// ensures that you are connecting to the official website and that any information you provide is encrypted and transmitted securely.
- Publications
- Account settings
Preview improvements coming to the PMC website in October 2024. Learn More or Try it out now .
- Advanced Search
- Journal List
- J Adv Pract Oncol
- v.10(4); May-Jun 2019
Secondary Analysis Research
In secondary data analysis (SDA) studies, investigators use data collected by other researchers to address different questions. Like primary data researchers, SDA investigators must be knowledgeable about their research area to identify datasets that are a good fit for an SDA. Several sources of datasets may be useful for SDA, and examples of some of these will be discussed. Advanced practice providers must be aware of possible advantages, such as economic savings, the ability to examine clinically significant research questions in large datasets that may have been collected over time (longitudinal data), generating new hypotheses or clarifying research questions, and avoiding overburdening sensitive populations or investigating sensitive areas. When reading an SDA report, the reader should be able to determine that the authors identified the limitation or disadvantages of their research. For example, a primary dataset cannot “fit” an SDA researcher’s study exactly, SDAs are inherently limited by the inability to definitively examine causality given their retrospective nature, and data may be too old to address current issues.
Secondary analysis of data collected by another researcher for a different purpose, or SDA, is increasing in the medical and social sciences. This is not surprising, given the immense body of health care–related research performed worldwide and the potential beneficial clinical implications of the timely expansion of primary research ( Johnston, 2014 ; Tripathy, 2013 ). Oncology advanced practitioners should understand why and how SDA studies are done, their potential advantages and disadvantages, as well as the importance of reading primary and secondary analysis research reports with the same discriminatory, evaluative eye for possible applicability to their practice setting.
To perform a primary research study, an investigator identifies a problem or question in a particular population that is amenable to the study, designs a research project to address that question, decides on a quantitative or qualitative methodology, determines an adequate sample size and recruits representative subjects, and systematically collects and analyzes data to address specific research questions. On the other hand, an SDA addresses new questions from that dataset previously gathered for a different primary study ( Castle, 2003 ). This might sound “easier,” but investigators who carry out SDA research must have a broad knowledge base and be up to date regarding the state of the science in their area of interest to identify important research questions, find appropriate datasets, and apply the same research principles as primary researchers.
Most SDAs use quantitative data, but some qualitative studies lend themselves to SDA. The researcher must have access to source data, as opposed to secondary source data (e.g., a medical record review). Original qualitative data sources could be videotaped or audiotaped interviews or transcripts, or other notes from a qualitative study ( Rew, Koniak-Griffin, Lewis, Miles, & O’Sullivan, 2000 ). Another possible source for qualitative analysis is open-ended survey questions that reflect greater meaning than forced-response items.
SECONDARY ANALYSIS PROCESS
An SDA researcher starts with a research question or hypothesis, then identifies an appropriate dataset or sets to address it; alternatively, they are familiar with a dataset and peruse it to identify other questions that might be answered by the available data ( Cheng & Phillips, 2014 ). In reality, SDA researchers probably move back and forth between these approaches. For example, an investigator who starts with a research question but does not find a dataset with all needed variables usually must modify the research question(s) based on the best available data.
Secondary data analysis researchers access primary data via formal (public or institutional archived primary research datasets) or informal data sharing sources (pooled datasets separately collected by two or more researchers, or other independent researchers in carrying out secondary analysis; Heaton, 2008 ). There are numerous sources of datasets for secondary analysis. For example, a graduate student might opt to perform a secondary analysis of an advisor’s research. University and government online sites may also be useful, such as the NYU Libraries Data Sources ( https://guides.nyu.edu/c.php?g=276966&p=1848686 ) or the National Cancer Institute, which has many subcategories of datasets ( https://www.cancer.gov/research/resources/search?from=0&toolTypes=datasets_databases ). The Google search engine is useful, and researchers can enter the search term “Archive sources of datasets (add key words related to oncology).”
In one secondary analysis method, researchers reuse their own data—either a single dataset or combined respective datasets to investigate new or additional questions for a new SDA.
Example of a Secondary Data Analysis
An example highlighting this method of reusing one’s own data is Winters-Stone and colleagues’ SDA of data from four previous primary studies they performed at one institution, published in the Journal of Clinical Oncology (JCO) in 2017. Their pooled sample was 512 breast cancer survivors (age 63 ± 6 years) who had been diagnosed and treated for nonmetastatic breast cancer 5.8 years (± 4.1 years) earlier. The investigators divided the cohort, which had no diagnosed neurologic conditions, into two groups: women who reported symptoms consistent with lower-extremity chemotherapy-induced peripheral neuropathy (CIPN; numbness, tingling, or discomfort in feet) vs. CIPN-negative women who did not have symptoms. The objectives of the study were to define patient-reported prevalence of CIPN symptoms in women who had received chemotherapy, compare objective and subjective measures of CIPN in these cancer survivors, and examine the relationship between CIPN symptom severity and outcomes. Objective and subjective measures were used to compare groups for manifestations influenced by CIPN (physical function, disability, and falls). Actual chemotherapy regimens administered had not been documented (a study limitation, but regimens likely included a taxane that is neurotoxic); therefore, investigators could only confirm that symptoms began during chemotherapy and how severely patients rated symptoms.
Up to 10 years after completing chemotherapy, 47% of women who had received chemotherapy were still having significant and potentially life-threatening sensory symptoms consistent with CIPN, did worse on physical function tests, reported poorer functioning, had greater disability, and had nearly twice the rate of falls compared with CIPN-negative women ( Winters-Stone et al., 2017 ). Furthermore, symptom severity was related to worse outcomes, while worsening cancer was not.
Stout (2017) recognized the importance of this secondary analysis in an accompanying editorial published in JCO, remarking that it was the first study that included both patient-reported subjective measures and objective measures of a clinically significant problem. Winter-Stone and others (2017) recognized that by analyzing what essentially became a large sample, they were able to achieve a more comprehensive understanding of the significance and impact of CIPN, and thus to challenge the notion that while CIPN may improve over time, it remains a major cancer survivorship issue. Thus, oncology advanced practitioners must systematically address CIPN at baseline and over time in vulnerable patients, and collaborate with others to implement potentially helpful interventions such as physical and occupational therapy ( Silver & Gilchrist, 2011 ). Other primary or secondary research projects might focus on the usefulness of such interventions.
ADVANTAGES OF SECONDARY DATA ANALYSIS
The advantages of doing SDA research that are cited most often are the economic savings—in time, money, and labor—and the convenience of using existing data rather than collecting primary data, which is usually the most time-consuming and expensive aspect of research ( Johnston, 2014 ; Rew et al., 2000 ; Tripathy, 2013 ). If there is a cost to access datasets, it is usually small (compared to performing the data collection oneself), and detailed information about data collection and statistician support may also be available ( Cheng & Phillips, 2014 ). Secondary data analysis may help a new investigator increase his/her clinical research expertise and avoid data collection challenges (e.g., recruiting study participants, obtaining large-enough sample sizes to yield convincing results, avoiding study dropout, and completing data collection within a reasonable time). Secondary data analyses may also allow for examining more variables than would be feasible in smaller studies, surveys of more diverse samples, and the ability to rethink data and use more advanced statistical techniques in analysis ( Rew et al., 2000 ).
Secondary Data Analysis to Answer Additional Research Questions
Another advantage is that an SDA of a large dataset, possibly combining data from more than one study or by using longitudinal data, can address high-impact, clinically important research questions that might be prohibitively expensive or time-consuming for primary study, and potentially generate new hypotheses ( Smith et al., 2011 ; Tripathy, 2013 ). Schadendorf and others (2015) did one such SDA: a pooled analysis of 12 phase II and phase III studies of ipilimumab (Yervoy) for patients with metastatic melanoma. The study goal was to more accurately estimate the long-term survival benefit of ipilimumab every 3 weeks for greater than or equal to 4 doses in 1,861 patients with advanced melanoma, two thirds of whom had been previously treated and one third who were treatment naive. Almost 89% of patients had received ipilimumab at 3 mg/kg (n = 965), 10 mg/kg (n = 706), or other doses, and about 54% had been followed for longer than 5 years. Across all studies, overall survival curves plateaued between 2 and 3 years, suggesting a durable survival benefit for some patients.
Irrespective of prior therapy, ipilimumab dose, or treatment regimen, median overall survival was 13.5 months in treatment naive patients and 10.7 months in previously treated patients ( Schadendorf et al., 2015 ). In addition, survival curves consistently plateaued at approximately year 3 and continued for up to 10 years (longest follow-up). This suggested that most of the 20% to 26% of patients who reached the plateau had a low risk of death from melanoma thereafter. The authors viewed these results as “encouraging,” given the historic median overall survival in patients with advanced melanoma of 8 to 10 months and 5-year survival of approximately 10%. They identified limitations of their SDA (discussed later in this article). Three-year survival was numerically (but not statistically significantly) greater for the patients who received ipilimumab at 10 mg/kg than at 3 mg/kg doses, which had been noted in one of the included studies.
The importance of this secondary analysis was clearly relevant to prescribers of anticancer therapies, and led to a subsequent phase III trial in the same population to answer the ipilimumab dose question. Ascierto and colleagues’ (2017) study confirmed ipilimumab at 10 mg/kg led to a significantly longer overall survival than at 3 mg/kg (15.7 months vs. 11.5 months) in a subgroup of patients not previously treated with a BRAF inhibitor or immune checkpoint inhibitor. However, this was attained at the cost of greater treatment-related adverse events and more frequent discontinuation secondary to severe ipilimumab-related adverse events. Both would be critical points for advanced practitioners to discuss with patients and to consider in relationship to the particular patient’s ability to tolerate a given regimen.
Secondary Data Analysis to Avoid Study Repetition and Over-Research
Secondary data analysis research also avoids study repetition and over-research of sensitive topics or populations ( Tripathy, 2013 ). For example, people treated for cancer in the United Kingdom are surveyed annually through the National Cancer Patient Experience Survey (NCPES), and questions regarding sexual orientation were first included in the 2013 NCPES. Hulbert-Williams and colleagues (2017) did a more rigorous SDA of this survey to gain an understanding of how lesbian, gay, or bisexual (LGB) patients’ experiences with cancer differed from heterosexual patients.
Sixty-four percent of those surveyed responded (n = 68,737) to the question regarding their “best description of sexual orientation.” 89.3% indicated “heterosexual/straight,” 425 (0.6%) indicated “lesbian or gay,” and 143 (0.2%) indicated “bisexual.” One insight gained from the study was that although the true population proportion of LGB was not known, the small number of self-identified LGB patients most likely did not reflect actual numbers and may have occurred because of ongoing unwillingness to disclose sexual orientation, along with the older mean age of the sample. Other cancer patients who selected “prefer not to answer” (3%), “other” (0.9%), or left the question blank (6%), were not included in the SDA to correctly avoid bias in assuming these responses were related to sexual orientation.
Bisexual respondents were significantly more likely to report that nurses or other health-care professionals informed them about their diagnosis, but that it was subsequently difficult to contact nurse specialists and get understandable answers from them; they were dissatisfied with their interaction with hospital nurses and the care and help provided by both health and social care services after leaving the hospital. Bisexual and lesbian/gay respondents wanted to be involved in treatment decision-making, but therapy choices were not discussed with them, and they were all less satisfied than heterosexuals with the information given to them at diagnosis and during treatment and aftercare—an important clinical implication for oncology advanced practitioners.
Hulbert-Williams and colleagues (2017) proposed that while health-care communication and information resources are not explicitly homophobic, we may perpetuate heterosexuality as “normal” by conversational cues and reliance on heterosexual imagery that implies a context exclusionary of LGB individuals. Sexual orientation equality is about matching care to individual needs for all patients regardless of sexual orientation rather than treating everyone the same way, which does not seem to have happened according to the surveyed respondents’ perceptions. In addition, although LGB respondents replied they did not have or chose to exclude significant others from their cancer experience, there was no survey question that clarified their primary relationship status. This is not a unique strategy for persons with cancer, as LGB individuals may do this to protect family and friends from the negative consequences of homophobia.
Hulbert-Williams and others (2017) identified that this dataset might be useful to identify care needs for patients who identify as LGBT or LGBTQ (queer or questioning; no universally used acronym) and be used to obtain more targeted information from subsequent surveys. There is a relatively small body of data for advanced practitioners and other providers that aid in the assessment and care (including supportive, palliative, and survivorship care) of LGBT individuals—a minority group with many subpopulations that may have unique needs. One such effort is the white paper action plan that came out of the first summit on cancer in the LGBT communities. In 2014, participants from the United States, the United Kingdom, and Canada met to identify LGBT communities’ concerns and needs for cancer research, clinical cancer care, health-care policy, and advocacy for cancer survivorship and LGBT health equity ( Burkhalter et al., 2016 ).
More specifically, Healthy People 2020 now includes two objectives regarding LGBT issues: (1) to increase the number of population-based data systems used to monitor Healthy People 2020 objectives, including a standardized set of questions that identify lesbian, gay, bisexual, and transgender populations; and (2) to increase the number of states and territories that include questions that identify sexual orientation and gender identity on state-level surveys or data systems ( Office of Disease Prevention and Health Promotion, 2019 ). We should help each patient to designate significant others’ (family or friends) degree of involvement in care, while recognizing that LGB patients may exclude their significant others if this process involves disclosing sexual orientation, as this may lead to continued social isolation of cancer patients. This SDA by Hulbert-Williams and colleagues (2017) produced findings in a relatively unexplored area of the overall care experiences of LGB patients.
DISADVANTAGES OF SECONDARY DATA ANALYSIS
Many drawbacks of SDA research center around the fact that a primary investigator collected data reflecting his/her unique perspectives and questions, which may not fit an SDA researcher’s questions ( Rew et al., 2000 ). Secondary data analysis researchers have no control over a desired study population, variables of interest, and study design, and probably did not have a role in collecting the primary data ( Castle, 2003 ; Johnston, 2014 ; Smith et al., 2011 ).
Furthermore, the primary data may not include particular demographic information (e.g., respondent zip codes, race, ethnicity, and specific ages) that were deleted to protect respondent confidentiality, or some other different variables that might be important in the SDA may not have been examined at all ( Cheng & Phillips, 2014 ; Johnston, 2014 ). Although primary data collection takes longer than SDA data collection, identifying and procuring suitable SDA data, analyzing the overall quality of the data, determining any limitations inherent in the original study, and determining whether there is an appropriate fit between the purpose of the original study and the purpose of the SDA can be very time consuming ( Castle, 2003 ; Cheng & Phillips, 2014 ; Rew et al., 2000 ).
Secondary data analysis research may be limited to descriptive, exploratory, and correlational designs and nonparametric statistical tests. By their nature, SDA studies are observational and retrospective, and the investigator cannot examine causal relationships (by a randomized, controlled design). An SDA investigator is challenged to decide whether archival data can be shaped to match new research questions; this means the researcher must have an in-depth understanding of the dataset and know how to alter research questions to match available data and recoded variables.
For example, in their pooled analysis of ipilimumab for advanced melanoma, Schadendorf and colleagues (2015) recognized study limitations that might also be disadvantages of other SDAs. These included the fact that they could not make definitive conclusions about the relationship of survival to ipilimumab dose because the study was not randomized, had no control group, and could not account for key baseline prognostic factors. Other limitations were differences in patient populations in several studies included in the SDA, studies that had been done over 10 years ago (although no other new therapies had improved overall survival during that time), and the fact that treatments received after ipilimumab could have affected overall survival.
READING SECONDARY ANALYSIS RESEARCH
Primary and secondary data investigators apply the same research principles, which should be evident in research reports ( Cheng & Phillips, 2014 ; Hulbert-Williams et al., 2017 ; Johnston, 2014 ; Rew et al., 2000 ; Smith et al., 2011 ; Tripathy, 2013 ).
- ● Did the investigator(s) make a logical and convincing case for the importance of their study?
- ● Is there a clear research question and/or study goals or objectives?
- ● Are there operational definitions for the variables of interest?
- ● Did the authors acknowledge the source of the original data and acquire ethical approval (as necessary)?
- ● Did the authors discuss the strengths and weaknesses of the dataset? For example, how old are the data? Is the dataset sufficiently large to have confidence in the results (adequately powered)?
- ● How well do the data seem to “fit” the SDA research question and design?
- ● Does the methods section allow you, the reader, to “see” how the study was done (e.g., how the sample was selected, the tools/instruments that were used, as well their validity and reliability to measure what was intended, the data collection process, and how the data was analyzed)?
- ● Do the findings, discussion, and conclusions—positive or negative—allow you to answer the “So what?” question, and does your evaluation match the investigator’s conclusion?
Answering these questions allows the advanced practice provider reader to assess the possible value of a secondary analysis (similarly to a primary research) report and its applicability to practice, and to identify further issues or areas for scientific inquiry.
The author has no conflicts of interest to disclose.
- Ascierto P. A., Del Vecchio M., Robert C., Mackiewicz A., Chiarion-Sileni V., Arance A.,…Maio M. (2017). Ipilimumab 10 mg/kg versus ipilimumab 3 mg/kg in patients with unresectable or metastatic melanoma: A randomised, double-blind, multicentre, phase 3 trial . Lancet Oncology , 18 ( 5 ), 611–622. 10.1016/S1470-2045(17)30231-0 [ PubMed ] [ CrossRef ] [ Google Scholar ]
- Burkhalter J. E., Margolies L., Sigurdsson H. O., Walland J., Radix A., Rice D.,…Maingi S. (2016). The National LGBT Cancer Action Plan: A white paper of the 2014 National Summit on Cancer in the LGBT Communities . LGBT Health , 3 ( 1 ), 19–31. 10.1089/lgbt.2015.0118 [ CrossRef ] [ Google Scholar ]
- Castle J. E. (2003). Maximizing research opportunities: Secondary data analysis . Journal of Neuroscience Nursing , 35 ( 5 ), 287–290. Retrieved from https://www.ncbi.nlm.nih.gov/pubmed/14593941 [ PubMed ] [ Google Scholar ]
- Cheng H. G., & Phillips M. R. (2014). Secondary analysis of existing data: Opportunities and implementation . Shanghai Archives of Psychiatry , 26 ( 6 ), 371–375. https://dx.doi.org/10.11919%2Fj.issn.1002-0829.214171 [ PMC free article ] [ PubMed ] [ Google Scholar ]
- Heaton J. (2008). Secondary analysis of qualitative data: An overview . Historical Social Research , 33 ( 3 ), 33–45. [ Google Scholar ]
- Hulbert-Williams N. J., Plumpton C. O., Flowers P., McHugh R., Neal R. D., Semlyen J., & Storey L. (2017). The cancer care experiences of gay, lesbian and bisexual patients: A secondary analysis of data from the UK Cancer Patient Experience Survey . European Journal of Cancer Care , 26 ( 4 ). 10.1111/ecc.12670 [ PubMed ] [ CrossRef ] [ Google Scholar ]
- Johnston M. P. (2014). Secondary data analysis: A method of which the time has come . Qualitative and Quantitative Methods in Libraries (QQML) , 3 , 619–626.r [ Google Scholar ]
- Office of Disease Prevention and Health Promotion. (2019). Lesbian, gay, bisexual, and transgender health . Retrieved from https://www.healthypeople.gov/2020/topics-objectives/topic/lesbian-gay-bisexual-and-transgender-health
- Rew L., Koniak-Griffin D., Lewis M. A., Miles M., & O’Sullivan A. (2000). Secondary data analysis: New perspective for adolescent research . Nursing Outlook , 48 ( 5 ), 223–239. 10.1067/mno.2000.104901 [ PubMed ] [ CrossRef ] [ Google Scholar ]
- Schadendorf D., Hodi F. S., Robert C., Weber J. S., Margolin K., Hamid O.,…Wolchok J. D. (2015). Pooled analysis of long-term survival data from phase II and phase III trials of ipilimumab in unresectable or metastatic melanoma . Journal of Clinical Oncology , 33 ( 17 ), 1889–1894. 10.1200/JCO.2014.56.2736 [ PMC free article ] [ PubMed ] [ CrossRef ] [ Google Scholar ]
- Silver J. K., & Gilchrist L. S. (2011). Cancer rehabilitation with a focus on evidence-based outpatient physical and occupational therapy interventions . American Journal of Physical Medicine & Rehabilitation , 90 ( 5 Suppl 1 ), S5–S15. 10.1097/PHM.0b013e31820be4ae [ PubMed ] [ CrossRef ] [ Google Scholar ]
- Smith A. K., Ayanian J. Z., Covinsky K. E., Landon B. E., McCarthy E. P., Wee C. C., & Steinman M. A. (2011). Conducting high-value secondary dataset analysis: An introductory guide and resources . Journal of General Internal Medicine , 26 ( 8 ), 920–929. 10.1007/s11606-010-1621-5 [ PMC free article ] [ PubMed ] [ CrossRef ] [ Google Scholar ]
- Stout N. L. (2017). Expanding the perspective on chemotherapy-induced peripheral neuropathy management . Journal of Clinical Oncology , 35 ( 23 ), 2593–2594. 10.1200/JCO.2017.73.6207 [ PubMed ] [ CrossRef ] [ Google Scholar ]
- Tripathy J. P. (2013). Secondary data analysis: Ethical issues and challenges (letter) . Iranian Journal of Public Health , 42 ( 12 ), 1478–1479. [ PMC free article ] [ PubMed ] [ Google Scholar ]
- Winters-Stone K. M., Horak F., Jacobs P. G., Trubowitz P., Dieckmann N. F., Stoyles S., & Faithfull S. (2017). Falls, functioning, and disability among women with persistent symptoms of chemotherapy-induced peripheral neuropathy . Journal of Clinical Oncology , 35 ( 23 ) , 2604–2612. 10.1200/JCO.2016 [ PMC free article ] [ PubMed ] [ CrossRef ] [ Google Scholar ]
- What is Secondary Data? + [Examples, Sources, & Analysis]

- Data Collection
Aside from consulting the primary origin or source, data can also be collected through a third party, a process common with secondary data. It takes advantage of the data collected from previous research and uses it to carry out new research.
Secondary data is one of the two main types of data, where the second type is the primary data. These 2 data types are very useful in research and statistics, but for the sake of this article, we will be restricting our scope to secondary data.
We will study secondary data, its examples, sources, and methods of analysis.
What is Secondary Data?
Secondary data is the data that has already been collected through primary sources and made readily available for researchers to use for their own research. It is a type of data that has already been collected in the past.
A researcher may have collected the data for a particular project, then made it available to be used by another researcher. The data may also have been collected for general use with no specific research purpose like in the case of the national census.
Data classified as secondary for particular research may be said to be primary for another research. This is the case when data is being reused, making it primary data for the first research and secondary data for the second research it is being used for.
Sources of Secondary Data
Sources of secondary data include books, personal sources, journals, newspapers, websitess, government records etc. Secondary data are known to be readily available compared to that of primary data. It requires very little research and needs for manpower to use these sources.
With the advent of electronic media and the internet, secondary data sources have become more easily accessible. Some of these sources are highlighted below.
Books are one of the most traditional ways of collecting data. Today, there are books available for all topics you can think of. When carrying out research, all you have to do is look for a book on the topic being researched, then select from the available repository of books in that area. Books, when carefully chosen are an authentic source of authentic data and can be useful in preparing a literature review.
- Published Sources
There are a variety of published sources available for different research topics. The authenticity of the data generated from these sources depends majorly on the writer and publishing company.
Published sources may be printed or electronic as the case may be. They may be paid or free depending on the writer and publishing company’s decision.
- Unpublished Personal Sources
This may not be readily available and easily accessible compared to the published sources. They only become accessible if the researcher shares with another researcher who is not allowed to share it with a third party.
For example, the product management team of an organization may need data on customer feedback to assess what customers think about their product and improvement suggestions. They will need to collect the data from the customer service department, which primarily collected the data to improve customer service.
Journals are gradually becoming more important than books these days when data collection is concerned. This is because journals are updated regularly with new publications on a periodic basis, therefore giving to date information.
Also, journals are usually more specific when it comes to research. For example, we can have a journal on, “Secondary data collection for quantitative data ” while a book will simply be titled, “Secondary data collection”.
In most cases, the information passed through a newspaper is usually very reliable. Hence, making it one of the most authentic sources of collecting secondary data.
The kind of data commonly shared in newspapers is usually more political, economic, and educational than scientific. Therefore, newspapers may not be the best source for scientific data collection.
The information shared on websites is mostly not regulated and as such may not be trusted compared to other sources. However, there are some regulated websites that only share authentic data and can be trusted by researchers.
Most of these websites are usually government websites or private organizations that are paid, data collectors.
Blogs are one of the most common online sources for data and may even be less authentic than websites. These days, practically everyone owns a blog, and a lot of people use these blogs to drive traffic to their website or make money through paid ads.
Therefore, they cannot always be trusted. For example, a blogger may write good things about a product because he or she was paid to do so by the manufacturer even though these things are not true.
They are personal records and as such rarely used for data collection by researchers. Also, diaries are usually personal, except for these days when people now share public diaries containing specific events in their life.
A common example of this is Anne Frank’s diary which contained an accurate record of the Nazi wars.
- Government Records
Government records are a very important and authentic source of secondary data. They contain information useful in marketing, management, humanities, and social science research.
Some of these records include; census data, health records, education institute records, etc. They are usually collected to aid proper planning, allocation of funds, and prioritizing of projects.
Podcasts are gradually becoming very common these days, and a lot of people listen to them as an alternative to radio. They are more or less like online radio stations and are generating increasing popularity.
Information is usually shared during podcasts, and listeners can use it as a source of data collection.
Some other sources of data collection include:
- Radio stations
- Public sector records.
What are the Secondary Data Collection Tools?
Popular tools used to collect secondary data include; bots, devices, libraries, etc. In order to ease the data collection process from the sources of secondary data highlighted above, researchers use these important tools which are explained below.
There are a lot of data online and it may be difficult for researchers to browse through all these data and find what they are actually looking for. In order to ease this process of data collection, programmers have created bots to do an automatic web scraping for relevant data.
These bots are “ software robots ” programmed to perform some task for the researcher. It is common for businesses to use bots to pull data from forums and social media for sentiment and competitive analysis.
- Internet-Enabled Devices
This could be a mobile phone, PC, or tablet that has access to an internet connection. They are used to access journals, books, blogs, etc. to collect secondary data.
This is a traditional secondary data collection tool for researchers. The library contains relevant materials for virtually all the research areas you can think of, and it is accessible to everyone.
A researcher might decide to sit in the library for some time to collect secondary data or borrow the materials for some time and return when done collecting the required data.
Radio stations are one of the secondary sources of data collection, and one needs radio to access them. The advent of technology has even made it possible to listen to the radio on mobile phones, deeming it unnecessary to get a radio.
Secondary Data Analysis
Secondary data analysis is the process of analyzing data collected from another researcher who primarily collected this data for another purpose. Researchers leverage secondary data to save time and resources that would have been spent on primary data collection.
The secondary data analysis process can be carried out quantitatively or qualitatively depending on the kind of data the researcher is dealing with. The quantitative method of secondary data analysis is used on numerical data and is analyzed mathematically, while the qualitative method uses words to provide in-depth information about data.
How to Analyse Secondary Data
There are different stages of secondary data analysis, which involve events before, during, and after data collection. These stages include;
- Statement of Purpose
Before collecting secondary data for analysis, you need to know your statement of purpose. That is, a clear understanding of why you are collecting the data—the ultimate aim of the research work and how this data will help achieve it.
This will help direct your path towards collecting the right data, and choosing the best data source and method of analysis.
- Research Design
This is a written-down plan on how the research activities will be carried out. It describes the kind of data to be collected, the sources of data collection, method of data collection, tools, and even method of analysis.
A research design may also contain a timestamp of when each of these activities will be carried out. Therefore, serving as a guide for the secondary data analysis.
After identifying the purpose of the research, the researcher should design a research process that will guide the data analysis process.
- Developing the Research Questions
It is not enough to just know the research purpose, you need to develop research questions that will help in better identifying Secondary data. This is because they are usually a pool of data to choose from, and asking the right questions will assist in collecting authentic data.
For example, a researcher trying to collect data about the best fish feeds to enable fast growth in fishes will have to ask questions like, What kind of fish is considered? Is the data meant to be quantitative or qualitative? What is the content of the fish feed? The growth rate in fishes after feeding on it, and so on.
- Identifying Secondary Data
After developing the research questions, researchers use them as a guide to identifying relevant data from the data repository. For example, if the kind of data to be collected is qualitative, a researcher can filter out qualitative data.
The suitable secondary data will be the one that correctly answers the questions highlighted above. When looking for the solutions to a linear programming problem, for instance, the solutions will be numbers that satisfy both the objective and the constraints.
Any answer that doesn’t satisfy both, is not a solution.
- Evaluating Secondary Data
This stage is what many classify as the real data analysis stage because it is the point where analysis is actually performed. However, the stages highlighted above are a part of the data analysis process, because they influence how the analysis is performed.
Once a dataset that appears viable in addressing the initial requirements discussed above is located, the next step in the process is the evaluation of the dataset to ensure the appropriateness for the research topic. The data is evaluated to ensure that it really addresses the statement of the problem and answers the research questions.
After which it will now be analyzed either using the quantitative method or the qualitative method depending on the type of data it is.
Advantages of Secondary Data
- Ease of Access
Most of the sources of secondary data are easily accessible to researchers. Most of these sources can be accessed online through a mobile device. People who do not have access to the internet can also access them through print.
They are usually available in libraries, book stores, and can even be borrowed from other people.
- Inexpensive
Secondary data mostly require little to no cost for people to acquire them. Many books, journals, and magazines can be downloaded for free online. Books can also be borrowed for free from public libraries by people who do not have access to the internet.
Researchers do not have to spend money on investigations, and very little is spent on acquiring books if any.
- Time-Saving
The time spent on collecting secondary data is usually very little compared to that of primary data. The only investigation necessary for secondary data collection is the process of sourcing for necessary data sources.
Therefore, cutting the time that would normally be spent on the investigation. This will save a significant amount of time for the researcher
- Longitudinal and Comparative Studies
Secondary data makes it easy to carry out longitudinal studies without having to wait for a couple of years to draw conclusions. For example, you may want to compare the country’s population according to census 5 years ago, and now.
Rather than waiting for 5 years, the comparison can easily be made by collecting the census 5 years ago and now.
- Generating new insights
When re-evaluating data, especially through another person’s lens or point of view, new things are uncovered. There might be a thing that wasn’t discovered in the past by the primary data collector, that secondary data collection may reveal.
For example, when customers complain about difficulty using an app to the customer service team, they may decide to create a user guide teaching customers how to use it. However, when a product developer has access to this data, it may be uncovered that the issue came from and UI/UX design that needs to be worked on.
Disadvantages of Secondary Data
- Data Quality:
The data collected through secondary sources may not be as authentic as when collected directly from the source. This is a very common disadvantage with online sources due to a lack of regulatory bodies to monitor the kind of content that is being shared.
Therefore, working with this kind of data may have negative effects on the research being carried out.
- Irrelevant Data:
Researchers spend so much time surfing through a pool of irrelevant data before finally getting the one they need. This is because the data was not collected mainly for the researcher.
In some cases, a researcher may not even find the exact data he or she needs, but have to settle for the next best alternative.
- Exaggerated Data
Some data sources are known to exaggerate the information that is being shared. This bias may be some to maintain a good public image or due to a paid advert.
This is very common with many online blogs that even go a bead to share false information just to gain web traffic. For example, a FinTech startup may exaggerate the amount of money it has processed just to attract more customers.
A researcher gathering this data to investigate the total amount of money processed by FinTech startups in the US for the quarter may have to use this exaggerated data.
- Outdated Information
Some of the data sources are outdated and there are no new available data to replace the old ones. For example, the national census is not usually updated yearly.
Therefore, there have been changes in the country’s population since the last census. However, someone working with the country’s population will have to settle for the previously recorded figure even though it is outdated.
Secondary data has various uses in research, business, and statistics. Researchers choose secondary data for different reasons, with some of it being due to price, availability, or even needs of the research.
Although old, secondary data may be the only source of data in some cases. This may be due to the huge cost of performing research or due to its delegation to a particular body (e.g. national census).
In short, secondary data has its shortcomings, which may affect the outcome of the research negatively and also some advantages over primary data. It all depends on the situation, the researcher in question, and the kind of research being carried out.
Connect to Formplus, Get Started Now - It's Free!
- advantages of secondary data
- secondary data analysis
- secondary data examples
- sources of secondary data
- busayo.longe
You may also like:
Categorical Data: Definition + [Examples, Variables & Analysis]
A simple guide on categorical data definitions, examples, category variables, collection tools and its disadvantages
What is Numerical Data? [Examples,Variables & Analysis]
A simple guide on numerical data examples, definitions, numerical variables, types and analysis
Primary vs Secondary Data:15 Key Differences & Similarities
Simple guide on secondary and primary data differences on examples, types, collection tools, advantages, disadvantages, sources etc.
Brand vs Category Development Index: Formula & Template
In this article, we are going to break down the brand and category development index along with how it applies to all brands in the market.
Formplus - For Seamless Data Collection
Collect data the right way with a versatile data collection tool. try formplus and transform your work productivity today..
Library Guides
Dissertations 4: methodology: methods.
- Introduction & Philosophy
- Methodology
Primary & Secondary Sources, Primary & Secondary Data
When describing your research methods, you can start by stating what kind of secondary and, if applicable, primary sources you used in your research. Explain why you chose such sources, how well they served your research, and identify possible issues encountered using these sources.
Definitions
There is some confusion on the use of the terms primary and secondary sources, and primary and secondary data. The confusion is also due to disciplinary differences (Lombard 2010). Whilst you are advised to consult the research methods literature in your field, we can generalise as follows:
Secondary sources
Secondary sources normally include the literature (books and articles) with the experts' findings, analysis and discussions on a certain topic (Cottrell, 2014, p123). Secondary sources often interpret primary sources.
Primary sources
Primary sources are "first-hand" information such as raw data, statistics, interviews, surveys, law statutes and law cases. Even literary texts, pictures and films can be primary sources if they are the object of research (rather than, for example, documentaries reporting on something else, in which case they would be secondary sources). The distinction between primary and secondary sources sometimes lies on the use you make of them (Cottrell, 2014, p123).
Primary data
Primary data are data (primary sources) you directly obtained through your empirical work (Saunders, Lewis and Thornhill 2015, p316).
Secondary data
Secondary data are data (primary sources) that were originally collected by someone else (Saunders, Lewis and Thornhill 2015, p316).
Comparison between primary and secondary data
Use
Virtually all research will use secondary sources, at least as background information.
Often, especially at the postgraduate level, it will also use primary sources - secondary and/or primary data. The engagement with primary sources is generally appreciated, as less reliant on others' interpretations, and closer to 'facts'.
The use of primary data, as opposed to secondary data, demonstrates the researcher's effort to do empirical work and find evidence to answer her specific research question and fulfill her specific research objectives. Thus, primary data contribute to the originality of the research.
Ultimately, you should state in this section of the methodology:
What sources and data you are using and why (how are they going to help you answer the research question and/or test the hypothesis.
If using primary data, why you employed certain strategies to collect them.
What the advantages and disadvantages of your strategies to collect the data (also refer to the research in you field and research methods literature).
Quantitative, Qualitative & Mixed Methods
The methodology chapter should reference your use of quantitative research, qualitative research and/or mixed methods. The following is a description of each along with their advantages and disadvantages.
Quantitative research
Quantitative research uses numerical data (quantities) deriving, for example, from experiments, closed questions in surveys, questionnaires, structured interviews or published data sets (Cottrell, 2014, p93). It normally processes and analyses this data using quantitative analysis techniques like tables, graphs and statistics to explore, present and examine relationships and trends within the data (Saunders, Lewis and Thornhill, 2015, p496).
Qualitative research
Qualitative research is generally undertaken to study human behaviour and psyche. It uses methods like in-depth case studies, open-ended survey questions, unstructured interviews, focus groups, or unstructured observations (Cottrell, 2014, p93). The nature of the data is subjective, and also the analysis of the researcher involves a degree of subjective interpretation. Subjectivity can be controlled for in the research design, or has to be acknowledged as a feature of the research. Subject-specific books on (qualitative) research methods offer guidance on such research designs.
Mixed methods
Mixed-method approaches combine both qualitative and quantitative methods, and therefore combine the strengths of both types of research. Mixed methods have gained popularity in recent years.
When undertaking mixed-methods research you can collect the qualitative and quantitative data either concurrently or sequentially. If sequentially, you can for example, start with a few semi-structured interviews, providing qualitative insights, and then design a questionnaire to obtain quantitative evidence that your qualitative findings can also apply to a wider population (Specht, 2019, p138).
Ultimately, your methodology chapter should state:
Whether you used quantitative research, qualitative research or mixed methods.
Why you chose such methods (and refer to research method sources).
Why you rejected other methods.
How well the method served your research.
The problems or limitations you encountered.
Doug Specht, Senior Lecturer at the Westminster School of Media and Communication, explains mixed methods research in the following video:
LinkedIn Learning Video on Academic Research Foundations: Quantitative
The video covers the characteristics of quantitative research, and explains how to approach different parts of the research process, such as creating a solid research question and developing a literature review. He goes over the elements of a study, explains how to collect and analyze data, and shows how to present your data in written and numeric form.

Link to quantitative research video
Some Types of Methods
There are several methods you can use to get primary data. To reiterate, the choice of the methods should depend on your research question/hypothesis.
Whatever methods you will use, you will need to consider:
why did you choose one technique over another? What were the advantages and disadvantages of the technique you chose?
what was the size of your sample? Who made up your sample? How did you select your sample population? Why did you choose that particular sampling strategy?)
ethical considerations (see also tab...)
safety considerations
validity
feasibility
recording
procedure of the research (see box procedural method...).
Check Stella Cottrell's book Dissertations and Project Reports: A Step by Step Guide for some succinct yet comprehensive information on most methods (the following account draws mostly on her work). Check a research methods book in your discipline for more specific guidance.
Experiments
Experiments are useful to investigate cause and effect, when the variables can be tightly controlled. They can test a theory or hypothesis in controlled conditions. Experiments do not prove or disprove an hypothesis, instead they support or not support an hypothesis. When using the empirical and inductive method it is not possible to achieve conclusive results. The results may only be valid until falsified by other experiments and observations.
For more information on Scientific Method, click here .
Observations
Observational methods are useful for in-depth analyses of behaviours in people, animals, organisations, events or phenomena. They can test a theory or products in real life or simulated settings. They generally a qualitative research method.
Questionnaires and surveys
Questionnaires and surveys are useful to gain opinions, attitudes, preferences, understandings on certain matters. They can provide quantitative data that can be collated systematically; qualitative data, if they include opportunities for open-ended responses; or both qualitative and quantitative elements.
Interviews
Interviews are useful to gain rich, qualitative information about individuals' experiences, attitudes or perspectives. With interviews you can follow up immediately on responses for clarification or further details. There are three main types of interviews: structured (following a strict pattern of questions, which expect short answers), semi-structured (following a list of questions, with the opportunity to follow up the answers with improvised questions), and unstructured (following a short list of broad questions, where the respondent can lead more the conversation) (Specht, 2019, p142).
This short video on qualitative interviews discusses best practices and covers qualitative interview design, preparation and data collection methods.
Focus groups
In this case, a group of people (normally, 4-12) is gathered for an interview where the interviewer asks questions to such group of participants. Group interactions and discussions can be highly productive, but the researcher has to beware of the group effect, whereby certain participants and views dominate the interview (Saunders, Lewis and Thornhill 2015, p419). The researcher can try to minimise this by encouraging involvement of all participants and promoting a multiplicity of views.
This video focuses on strategies for conducting research using focus groups.
Check out the guidance on online focus groups by Aliaksandr Herasimenka, which is attached at the bottom of this text box.
Case study
Case studies are often a convenient way to narrow the focus of your research by studying how a theory or literature fares with regard to a specific person, group, organisation, event or other type of entity or phenomenon you identify. Case studies can be researched using other methods, including those described in this section. Case studies give in-depth insights on the particular reality that has been examined, but may not be representative of what happens in general, they may not be generalisable, and may not be relevant to other contexts. These limitations have to be acknowledged by the researcher.
Content analysis
Content analysis consists in the study of words or images within a text. In its broad definition, texts include books, articles, essays, historical documents, speeches, conversations, advertising, interviews, social media posts, films, theatre, paintings or other visuals. Content analysis can be quantitative (e.g. word frequency) or qualitative (e.g. analysing intention and implications of the communication). It can detect propaganda, identify intentions of writers, and can see differences in types of communication (Specht, 2019, p146). Check this page on collecting, cleaning and visualising Twitter data.
Extra links and resources:
Research Methods
A clear and comprehensive overview of research methods by Emerald Publishing. It includes: crowdsourcing as a research tool; mixed methods research; case study; discourse analysis; ground theory; repertory grid; ethnographic method and participant observation; interviews; focus group; action research; analysis of qualitative data; survey design; questionnaires; statistics; experiments; empirical research; literature review; secondary data and archival materials; data collection.
Doing your dissertation during the COVID-19 pandemic
Resources providing guidance on doing dissertation research during the pandemic: Online research methods; Secondary data sources; Webinars, conferences and podcasts;
- Virtual Focus Groups Guidance on managing virtual focus groups
5 Minute Methods Videos
The following are a series of useful videos that introduce research methods in five minutes. These resources have been produced by lecturers and students with the University of Westminster's School of Media and Communication.

Case Study Research
Research Ethics
Quantitative Content Analysis
Sequential Analysis
Qualitative Content Analysis
Thematic Analysis
Social Media Research
Mixed Method Research
Procedural Method
In this part, provide an accurate, detailed account of the methods and procedures that were used in the study or the experiment (if applicable!).
Include specifics about participants, sample, materials, design and methods.
If the research involves human subjects, then include a detailed description of who and how many participated along with how the participants were selected.
Describe all materials used for the study, including equipment, written materials and testing instruments.
Identify the study's design and any variables or controls employed.
Write out the steps in the order that they were completed.
Indicate what participants were asked to do, how measurements were taken and any calculations made to raw data collected.
Specify statistical techniques applied to the data to reach your conclusions.
Provide evidence that you incorporated rigor into your research. This is the quality of being thorough and accurate and considers the logic behind your research design.
Highlight any drawbacks that may have limited your ability to conduct your research thoroughly.
You have to provide details to allow others to replicate the experiment and/or verify the data, to test the validity of the research.
Bibliography
Cottrell, S. (2014). Dissertations and project reports: a step by step guide. Hampshire, England: Palgrave Macmillan.
Lombard, E. (2010). Primary and secondary sources. The Journal of Academic Librarianship , 36(3), 250-253
Saunders, M.N.K., Lewis, P. and Thornhill, A. (2015). Research Methods for Business Students. New York: Pearson Education.
Specht, D. (2019). The Media And Communications Study Skills Student Guide . London: University of Westminster Press.
- << Previous: Introduction & Philosophy
- Next: Ethics >>
- Last Updated: Sep 14, 2022 12:58 PM
- URL: https://libguides.westminster.ac.uk/methodology-for-dissertations
CONNECT WITH US
Comparative effectiveness research methodology using secondary data: A starting user's guide
Affiliations.
- 1 Division of Urological Surgery and Center for Surgery and Public Health, Brigham and Women's Hospital, Harvard Medical School, Boston, MA; The Lank Center for Genitourinary Oncology, Medical Oncology, Dana-Farber Cancer Institute, Harvard Medical School, Boston, MA. Electronic address: [email protected].
- 2 Division of Urological Surgery and Center for Surgery and Public Health, Brigham and Women's Hospital, Harvard Medical School, Boston, MA.
- PMID: 29146037
- DOI: 10.1016/j.urolonc.2017.10.011
Background: The use of secondary data, such as claims or administrative data, in comparative effectiveness research has grown tremendously in recent years.
Purpose: We believe that the current review can help investigators relying on secondary data to (1) gain insight into both the methodologies and statistical methods, (2) better understand the necessity of a rigorous planning before initiating a comparative effectiveness investigation, and (3) optimize the quality of their investigations.
Main findings: Specifically, we review concepts of adjusted analyses and confounders, methods of propensity score analyses, and instrumental variable analyses, risk prediction models (logistic and time-to-event), decision-curve analysis, as well as the interpretation of the P value and hypothesis testing.
Conclusions: Overall, we hope that the current review article can help research investigators relying on secondary data to perform comparative effectiveness research better understand the necessity of a rigorous planning before study start, and gain better insight in the choice of statistical methods so as to optimize the quality of the research study.
Keywords: Comparative effectiveness research; Oncology; Review; Secondary data; Urology.
Copyright © 2017 Elsevier Inc. All rights reserved.
Publication types
- Comparative Effectiveness Research / methods
- Comparative Effectiveness Research / standards*
- Guidelines as Topic
- Logistic Models
- Medical Oncology / methods*
- Medical Oncology / standards
- Propensity Score
- Research Design / standards*
- Risk Assessment / methods
- Urology / methods*
- Urology / standards
Primary Research vs Secondary Research: A Comparative Analysis
Understand the differences between primary research vs secondary research. Learn how they can be used to generate valuable insights.

Primary research and secondary research are two fundamental approaches used in research studies to gather information and explore topics of interest. Both primary and secondary research offer unique advantages and have their own set of considerations, making them valuable tools for researchers in different contexts.
Understanding the distinctions between primary and secondary research is crucial for researchers to make informed decisions about the most suitable approach for their study objectives and available resources.
What is Primary Research?
Primary research refers to the collection and analysis of data directly from original sources. It involves gathering information directly to address specific research objectives and generate new insights. This research method conducts surveys, interviews, observations, experiments, or focus groups to obtain data that is relevant to the research question at hand. By engaging directly with subjects or sources, primary research provides firsthand and up-to-date information, allowing researchers to have control over the data collection process and adjust it to their specific needs.
Types of Primary Research
There are several types of primary research methods commonly used in various fields:
Surveys are the systematic collection of data through questionnaires or interviews, aiming to gather information from a large number of participants. Surveys can be conducted in person, over the phone, through mail, or online.
Interviews entail direct one-on-one or group interactions with individuals or key informants to obtain detailed information about their experiences, opinions, or expertise. Interviews can be structured (using predetermined questions) or unstructured (allowing for open-ended discussions).
Observations
Observational research carefully observes and documents behaviors, interactions, or phenomena in real-life settings. It can be done in a participant or non-participant manner, depending on the level of involvement of the researcher.
Data analysis
Examining and interpreting collected data, data analysis uncovers patterns, trends, and insights, providing a deeper understanding of the research topic. It enables drawing meaningful conclusions for decision-making and guides further research.
Focus groups
Focus groups facilitated group discussions with a small number of participants who shared their opinions, attitudes, and experiences on a specific topic. This method allows for interactive and in-depth exploration of a subject.
Benefits of Primary Research
Original and specific data: Primary research provides first hand data directly relevant to the research objectives, ensuring its freshness and specificity to the research context.
Control over data collection: Researchers have control over the design, implementation, and data collection process, allowing them to adapt the research methods and instruments to suit their needs.
Depth of understanding: Primary research methods, such as interviews and focus groups, enable researchers to gain a deep understanding of participants’ perspectives, experiences, and motivations.
Validity and reliability: By directly collecting data from original sources, primary research enhances the validity and reliability of the findings, reducing potential biases associated with using secondary or existing data.
Challenges of Primary Research
Time and Resource-intensive: Primary research requires careful planning, data collection, analysis, and interpretation. It may require recruiting participants, conducting interviews or surveys, and analyzing data, all of which require time and resources.
Sampling limitations: Primary research often relies on sampling techniques to select participants. Ensuring a representative sample that accurately reflects the target population can be challenging, and sampling biases may affect the generalizability of the findings.
Subjectivity: The involvement of researchers in primary research methods, such as interviews or observations, introduces the potential for subjective interpretations or biases that can influence the data collection and analysis process.
Limited generalizability: Findings from primary research may have limited generalizability due to the specific characteristics of the sample or context. It is essential to acknowledge the scope and limitations of the findings and avoid making broad generalizations beyond the studied sample or context.
What is Secondary Research?
It is a method of research that relies on data that is readily available, rather than gathering new data through primary research methods. Secondary research relies on reviewing and analyzing sources such as published studies, reports, articles, books, government databases, and online resources to extract relevant information for a specific research objective.
Sources of Secondary Research
Published studies and academic journals.
Researchers can review published studies and academic journals to gather information, data, and findings related to their research topic. These sources often provide comprehensive and in-depth analyses of specific subjects.
Reports and white papers
Reports and white papers produced by research organizations, government agencies, and industry associations provide valuable data and insights on specific topics or sectors. These documents often contain statistical data, market research, trends, and expert opinions.
Books and reference materials
Books and reference materials written by experts in a particular field can offer comprehensive overviews, theories, and historical perspectives that contribute to secondary research.
Online databases
Online databases, such as academic libraries, research repositories, and specialized platforms, provide access to a vast array of published research articles, theses, dissertations, and conference proceedings.
Benefits of Secondary Research
Time and Cost-effectiveness: Secondary research saves time and resources since the data and information already exist and are readily accessible. Researchers can utilize existing resources instead of conducting time-consuming primary research.
Wide range of data: Secondary research provides access to a wide range of data sources, including large-scale surveys, census data, and comprehensive reports. This allows researchers to explore diverse perspectives and make comparisons across different studies.
Comparative analyses: Researchers can compare findings from different studies or datasets, allowing for cross-referencing and verification of results. This enhances the robustness and validity of research outcomes.
Ethical considerations: Secondary research does not involve direct interaction with participants, which reduces ethical concerns related to privacy, informed consent, and confidentiality.
Challenges of Secondary Research
Data availability and quality: The availability and quality of secondary data can vary. Researchers must critically evaluate the credibility, reliability, and relevance of the sources to ensure the accuracy of the information used in their research.
Limited control over data: Researchers have limited control over the design, collection methods, and variables included in the secondary data. The data may not perfectly align with the research objectives, requiring careful selection and analysis.
Potential bias and outdated information: Secondary data may contain inherent biases or limitations introduced by the original researchers. Additionally, the data may become outdated, and newer information or developments may not be captured.
Lack of customization: Since secondary data is collected for various purposes, it may not perfectly align with the specific research needs. Researchers may encounter limitations in terms of variables, definitions, or granularity of data.
Comparing Primary and Secondary Research
Primary research vs secondary research, examples of primary and secondary research, examples of primary research.
- Conducting a survey to collect data on customer satisfaction and preferences for a new product directly from the target audience.
- Designing and conducting an experiment to test the effectiveness of a new teaching method by comparing the learning outcomes of students in different groups.
- Observing and documenting the behavior of a specific animal species in its natural habitat to gather data for ecological research.
- Organizing a focus group with potential consumers to gather insights and feedback on a new advertising campaign.
- Conducting interviews with healthcare professionals to understand their experiences and perspectives on a specific medical treatment.
Examples of Secondary Research
- Accessing a market research report to gather information on consumer trends, market size, and competitor analysis in the smartphone industry.
- Using existing government data on unemployment rates to analyze the impact of economic policies on employment patterns.
- Examining historical records and letters to understand the political climate and social conditions during a particular historical event.
- Conducting a meta-analysis of published studies on the effectiveness of a specific medication to assess its overall efficacy and safety.
How to Use Primary and Secondary Research Together
Having explored the distinction between primary research vs secondary research, the integration of these two approaches becomes a crucial consideration. By incorporating primary and secondary research, a comprehensive and well-informed research methodology can be achieved. The utilization of secondary research provides researchers with a broader understanding of the subject, allowing them to identify gaps in knowledge and refine their research questions properly.
Primary research methods, such as surveys or interviews, can then be employed to collect new data that directly address these research questions. The findings from primary research can be compared and validated against the existing knowledge obtained through secondary research. By combining the insights from both types of research, researchers can fill knowledge gaps, strengthen the reliability of their findings through triangulation, and draw meaningful conclusions that contribute to the overall understanding of the subject matter.
Ethical Considerations for Primary and Secondary Research
In primary research, researchers must obtain informed consent from participants, ensuring they are fully aware of the study’s purpose, procedures, and any potential risks or benefits involved. Confidentiality and anonymity should be maintained to safeguard participants’ privacy. Researchers should also ensure that the data collection methods and research design are conducted in an ethical manner, adhering to ethical guidelines and standards set by relevant institutional review boards or ethics committees.
In secondary research, ethical considerations primarily revolve around the proper and responsible use of existing data sources. Researchers should respect copyright laws and intellectual property rights when accessing and using secondary data. They should also critically evaluate the credibility and reliability of the sources to ensure the validity of the data used in their research. Proper citation and acknowledgment of the original sources are essential to maintain academic integrity and avoid plagiarism.
Make Scientifically Accurate Infographics In Minutes
Mind the Graph offers a wide range of pre-designed elements, such as icons, illustrations, graphs, and diagrams, specifically designed for various scientific disciplines. Mind the Graph allows scientists to enhance the visual representation of their research, making it more engaging and accessible to peers, students, policymakers, and the general public.

Subscribe to our newsletter
Exclusive high quality content about effective visual communication in science.
Unlock Your Creativity
Create infographics, presentations and other scientifically-accurate designs without hassle — absolutely free for 7 days!
Content tags
Thank you for visiting nature.com. You are using a browser version with limited support for CSS. To obtain the best experience, we recommend you use a more up to date browser (or turn off compatibility mode in Internet Explorer). In the meantime, to ensure continued support, we are displaying the site without styles and JavaScript.
- View all journals
- My Account Login
- Explore content
- About the journal
- Publish with us
- Sign up for alerts
- Open access
- Published: 27 May 2024
No immediate attentional bias towards or choice bias for male secondary sexual characteristics in Bornean orang-utans ( Pongo pygmaeus )
- Tom S. Roth 1 , 2 , 3 ,
- Iliana Samara 1 , 4 ,
- Juan Olvido Perea-Garcia 1 &
- Mariska E. Kret 1 , 4
Scientific Reports volume 14 , Article number: 12095 ( 2024 ) Cite this article
Metrics details
- Animal behaviour
- Sexual selection
Primate faces provide information about a range of variant and invariant traits, including some that are relevant for mate choice. For example, faces of males may convey information about their health or genetic quality through symmetry or facial masculinity. Because perceiving and processing such information may have bearing on the reproductive success of an individual, cognitive systems are expected to be sensitive to facial cues of mate quality. However, few studies have investigated this topic in non-human primate species. Orang-utans are an interesting species to test mate-relevant cognitive biases, because they are characterised by male bimaturism: some adult males are fully developed and bear conspicuous flanges on the side of their face, while other males look relatively similar to females. Here, we describe two non-invasive computerised experiments with Bornean orang-utans ( Pongo pygmaeus ), testing (i) immediate attention towards large flanges and symmetrical faces using a dot-probe task ( N = 3 individuals; 2F) and (ii) choice bias for pictures of flanged males over unflanged males using a preference test ( N = 6 individuals; 4F). In contrast with our expectations, we found no immediate attentional bias towards either large flanges or symmetrical faces. In addition, individuals did not show a choice bias for stimuli of flanged males. We did find exploratory evidence for a colour bias and energy efficiency trade-offs in the preference task. We discuss our null results and exploratory results in the context of the evolutionary history of Bornean orang-utans, and provide suggestions for a more biocentric approach to the study of orang-utan cognition.
Handicap theory is applied to females but not males in relation to mate choice in the stalk-eyed fly Sphyracephala detrahens

How and why patterns of sexual dimorphism in human faces vary across the world

Male proboscis monkey cranionasal size and shape is associated with visual and acoustic signalling
Introduction.
Primates have a highly specialized visual system that helps them navigate their social environment 1 , 2 . For example, primates attend to faces of conspecifics 3 and discriminate faces based on different characteristics, such as emotional expressions 4 and familiarity 5 , 6 , 7 . Importantly, primate faces can also signal cues that are relevant for mate choice, such as health or dominance 8 . Consequently, primates might have cognitive biases related to sexually relevant facial characteristics. Examples of such traits are sexually dimorphic characteristics and facial symmetry 9 , 10 . However, previous work on this topic has mostly focused on rhesus macaques, and very few studies have studied cognitive biases to sexually relevant facial characteristics in great apes. Therefore, the present paper aims to investigate whether Bornean orang-utans ( Pongo pygmaeus ) have cognitive biases for such facial characteristics using an immediate attention task and a preference task.
Cognitive processes are strongly influenced by evolutionarily relevant contexts, such as mate choice 11 , 12 . Mate choice is one of the most important aspects of a sexually reproducing animal’s life: choosing a suitable mate might ensure a good representation of the individual’s genes in the next generation. Because of this strong incentive to choose a suitable mate, many species have evolved specific mate preferences that guide individuals during the mate choice process 13 , 14 . For humans, it has been established that preferences affect social cognition: several cognitive processes, such as attention 15 , 16 , memory 17 , and motivational drive 18 , are modulated by physical attractiveness. For non-human primates, research on this topic is still relatively scarce. While previous work has mainly focused on looking preferences on a longer timescale (multiple seconds), and how these are modulated by sexual dimorphic traits 19 , 20 , 21 , few studies have investigated other cognitive processes such as immediate attention or choice bias 22 . Furthermore, the studies that investigated this topic are almost exclusively restricted to rhesus macaques ( Macaca mulatta ), although a good understanding of the cognitive processes associated with sexual selection requires investigation of a wide range of species instead of focusing mostly on one species.
Attentional biases towards specific facial characteristics have been found in multiple studies with rhesus macaques. Seminal work by Waitt and colleagues showed that rhesus macaque ( Macaca mulatta ) females have an attentional bias towards bright red male faces when they were paired with paler male faces 21 , while males seemed to prefer bright red female hindquarters, but not faces 23 . Similarly, macaques seem to be biased towards symmetrical faces 24 . Later studies with free-ranging macaques on the island of Cayo Santiago have extended these previous findings by showing attentional biases towards facial photographs of ovulating within-group females in males 25 , while females seem to preferentially attend to more masculine male faces 20 . Furthermore, individuals of both sexes looked longer at dark red male faces than pink male faces, suggesting that red coloration plays a role in both female choice and male competition 19 . In short, these studies collectively provide strong evidence for the notion that macaques selectively attend to specific facial characteristics that are relevant for mate choice.
Orang-utans are a suitable species to study cognitive biases associated with sexual selection. Unique among mammals, orang-utans are characterised by male bimaturism: while some adult males quickly develop secondary sexual characteristics, such as a throat sac, large body size, and conspicuous flanges on the sides of the face, other males experience developmental arrest of these characteristics 26 . These so-called unflanged males are sexually mature and can successfully reproduce, although females prefer to mate with fully developed flanged males when they are fertile 27 . Possibly, female preference for flanged males reflects selection for good genes: the transition from unflanged to flanged male is energetically costly, meaning that males of higher genetic quality would be more likely to develop into flanged males 27 . Furthermore, fierce male-male competition has been described between flanged males, suggesting that flanged males are also at serious risk of being injured during fights 28 . Thus, by mating with flanged males, orang-utan females might ensure that their offspring has higher genetic quality. Consequently, it could be beneficial to have cognitive biases to flanged males.
It important to note that the distinction between unflanged and flanged males is not as binary as it might appear at first glance. Unflanged males will eventually develop into fully flanged males 28 . During this transition, they will slowly start growing a larger body and might already show some early flange growth 29 . At the end of this transition period, the flanges will grow to their maximum size in a relatively short amount of time (~ 1 year, but varying between individuals 28 ). Therefore, there might be several males that have started developing flanges but cannot yet be considered fully flanged. Furthermore, Knott (2009) proposes an additional distinction between past-prime flanged males and prime flanged males 30 . Past-prime flanged males are characterized by reduced flange size and seem to be less preferred by females. In short, while orang-utan males can be broadly categorized in flanged and unflanged males, it is important to realize that there are males with small or intermediate-size flanges because they are either still growing them or are past their prime.
Another trait that is often mentioned with regard to mate choice is facial symmetry, which might reflect the ability to withstand environmental stress during development 31 . Accordingly, humans seem to be more attracted to symmetrical faces than asymmetrical faces 10 , although recent studies are less conclusive 32 . While clear associations between health and facial symmetry have not been established in humans yet 33 , previous work on chimpanzees ( Pan troglodytes ) 29 and rhesus macaques 35 has found that more asymmetrical individuals were also less healthy. In addition, rhesus macaques prefer to look at symmetrical faces of conspecifics 24 , which shows that this facial characteristic might modulate attentional processes. Thus, individuals might have cognitive biases for symmetrical conspecifics, because selecting a mate with a symmetrical face could potentially result in more genetically fit offspring.
In this study, we employ two paradigms to investigate immediate attentional bias towards flanged faces and symmetrical faces, and choice bias for flanged faces. In the dot-probe task 36 , 37 , two different stimuli are simultaneously displayed, each one on a different side of the screen. After a set amount of time, both pictures disappear, and a dot appears on the location of one of the pictures. If the dot appears behind the stimulus that the participant was attending to, the participant can quickly indicate the location of the dot by clicking it. However, if the dot appears behind the stimulus that was not receiving the participant’s attention, they will first need to switch their attention to the dot before they can indicate the location. Thus, if the dot appears behind a stimulus that immediately attracts attention, participants will be faster to respond than when the dot appears behind a less salient stimulus 37 . Recently, the dot-probe task has been used to study emotion perception in different primate species 34 , 35 , 36 , 37 , 38 . In addition, the task has successfully been used in humans to study attractiveness bias 15 , 43 , 44 . In general, these studies have established that individuals immediately attend to evolutionarily relevant stimuli, such as emotional expressions or preferred partners. Therefore, we here employed the dot-probe task to study direct attention towards sexually relevant facial characteristics in orang-utans.
When it comes to choice bias, Watson et al. 22 developed a paradigm to test choice biases in unrestrained primates. In this task, individuals first learn to associate two coloured dots (red and green) with specific categories (e.g., pictures of faces), so that they can predict what they will see on the screen by clicking a specific dot. During the test phase they can choose between the two coloured dots: both choices yield the same reward, but the picture that will appear on the screen is different. The authors successfully used this method to study preference for sex and status in rhesus macaques: they found that rhesus macaques chose to look more at faces of dominant males and perinea of conspecifics, while they were less likely to choose pictures of low-ranking conspecifics. Because this task has been successfully applied to rhesus macaques, here we used an adapted version to study choice bias for flanges in orang-utans.
The present paper reports the results of two studies. These two studies aimed to investigate immediate attentional biases towards flanged and symmetrical faces, and a choice bias for flanged faces in Bornean orang-utans, respectively. Given that the presence of flanges or facial symmetry may be a signal of good genes, we predicted for the dot-probe task that individuals should respond faster on trials where the dot would replace stimuli that depicted males with large flanges or males with symmetrical faces than when the dot replaced stimuli that depicted males with small or no flanges or asymmetrical faces. For the choice task, we expected individuals to more often choose the coloured dot that was associated with pictures of flanged males over the coloured dot that was associated with unflanged males.
Furthermore, for the preference task, we retrospectively decided to explore (i) whether individuals had a colour bias, (ii) whether individuals made choices that might reflect conservation of energy, and (iii) whether individuals showed temporal clustering in their choices, i.e., whether individuals switch between selecting flanged and unflanged stimuli every other trial or whether their choices are more clustered (e.g., multiple choices for one type of stimuli in a row). We investigated colour bias because evolutionary theories of colour vision have suggested that the ability to see red co-evolved with frugivory 45 . With regard to energy conservation, Bornean orang-utans are characterised by extremely low rates of energy use 46 , potentially an adaptation to habitats with long periods of fruit scarcity resulting in negative energy balance 47 , 48 . Potentially, such energy conservation mechanisms could also influence their responses during the task. Lastly, we also investigated temporal clustering, because flanged males are not only preferred mating partners 27 , but might also pose a threat (e.g., risk of infanticide 23 ) or are perceived as threatening 49 . Consequently, individuals may show temporal clustering in their choices during our task, by either opting for a less arousing picture of an unflanged male after seeing a flanged male stimulus (i.e., more switching, temporal dispersion) or by mostly sampling flanged male stimuli, until arousal reaches a certain threshold and individuals switch to unflanged stimuli instead (i.e., fewer switches, temporal clustering). Thus, because it could provide an opportunity to learn more about the relationship between orangutan’s socio-ecology and their cognitive biases, we decided to explore these three topics in addition to our main questions.
Subjects and housing
The animals that participated in this study were part of a population of 9 Bornean orang-utans ( Pongo pygmaeus ) at Apenheul Primate Park, The Netherlands (Table 1 ). They were kept in a fission–fusion housing system consisting of 4 enclosures, meaning that they were in small subgroups with changing composition over time, in order to mimic the natural social system of the species. Some individuals never shared enclosures to avoid conflict (e.g., the two adult males). Each enclosure consisted of an inside part and an outside part. The orang-utans were fed multiple times a day, and had ad libitum access to water. Most of the orang-utans had previously been exposed to touchscreens for a previous dot-probe study 38 , but only two of those orang-utans (Sandy & Samboja) eventually participated in this dot-probe study.
With regard to participation in the experiments described here, three individuals participated in the dot-probe experiments (both flange size and symmetry version), while six individuals participated in the preference test. Table 1 indicated which individuals participated in the experiments.
Touchscreen experiments were conducted via E-Prime 2.0 on a TFT-19-OF1 Infrared touchscreen (19″, 1280 × 1024 pixels). The touchscreen setup was encased in a custom-made setup which was incorporated in one of the orang-utans’ night enclosures. This night enclosure could be made accessible from two of the main enclosures by the animal caretakers. The researchers controlled the sessions on a desktop computer connected to the touchscreen setup and could keep track of the orangutans’ responses on the touchscreen through a monitor that duplicated the touchscreen view. Additionally, the researchers had access to a livestream with a camera that was built in the enclosure, allowing them to observe the participant. Correct responses were rewarded with a sunflower seed on a 100% fixed reinforcement ratio. For most individuals, the rewards were delivered by a custom-built autofeeder linked to the desktop computer, that dropped a reward in a PVC chute. However, Kawan and Baju did not habituate properly to the presence of the feeder, and kept trying to push it over with sticks. Therefore, we decided to reward them manually. The researcher was positioned behind the setup which prevented visual contact between the orangutans and researchers.
Dot-probe task
For the dot-probe task with flange size manipulation, we collected 72 images depicting front-facing Bornean or Sumatran orang-utan males with flanges. The images were collected through image hosting websites and social media groups. Due to the origin of the pictures, and the often-lacking information about the depicted individuals, we cannot be entirely certain that some stimulus combinations depict the same individuals. Furthermore, we often could not find a clear mention of the species depicted, which is why we consider the stimulus set as a combination of Bornean and Sumatran orang-utan males. We expected the species depicted to have little to no influence on our results because (1) facial features of Sumatran and Bornean flanged orang-utans are relatively similar 50 , (2) orang-utans are known to hybridize in captivity 51 and (3) each stimulus would serve as its own control (i.e., we would present two modified stimuli based on the same face) meaning that no combinations of Bornean and Sumatran orang-utans would be shown.
We edited the stimuli in GIMP (v2.10.32). First, we cropped the faces. Second, we consecutively selected the flanges on the left and right side of the face, respectively. We defined the width of the flange as the distance between the horizontally most peripheral point of the face and the most peripheral point of either the eye region or beard. Hereafter, we increased the width of the flanges (measured in pixels) with 15 percent to obtain the stimulus with enlarged flanges, and we decreased the width with 15 percent to obtain the stimulus with reduced flanges. We chose 15 percent to make sure that the stimuli would not become abnormal in terms of flange size. In total, this resulted in 72 combinations of enlarged and reduced stimuli.
Using the same 72 images, we created the stimulus set for the dot-probe with symmetry manipulation. Here, we could only include the images where the faces of the orang-utans appeared to be nearly exactly frontally facing. To determine this, we visually inspected whether the eyes and nostrils were at a similar distance from the vertical midline of the face and whether they were of approximately similar size. This was the case for 49 of the images. Next, we created symmetrical versions of the face by mirroring either the left or the right hemisphere at the vertical midline of the face. Thus, from every stimulus, we obtained two symmetrized versions: one based on the left hemisphere and one based on the right hemisphere. Importantly, in some stimuli we employed an extra step to remove cross-eyedness that resulted from the mirroring. To this effect, we selected one of the eyes, and mirrored it, resulting in more congruent gaze direction of the eyes. Furthermore, some of the mirrored stimuli were characterised by abnormal facial shape, which is a well-known issue in symmetrized stimuli 10 . If this was the case, we excluded the stimulus. In total, we obtained 80 stimulus pairs consisting of one symmetrized face and the original face showing natural variation in symmetry.
Preference task
For the preference task, we used 104 stimuli (52 flanged, 52 unflanged) of Bornean orang-utans. The stimuli were collected from the Internet, mainly from release reports published by Bornean orang-utan reintroduction programs. These were supplemented with portrait pictures taken from semi-wild orang-utans and pictures of zoo-housed orang-utans within the orang-utan EEP. All of the stimuli depict front-facing Bornean orang-utan males. We cropped their faces using GIMP (v2.10.32) and pasted the cropped faces on a light-grey background (#808,080), resulting in stimuli with an 18:13 aspect ratio. From both the flanged and the unflanged stimuli, we randomly selected four stimuli (eight in total) to use as stimuli in the forced-trial phase of the experiment. The remaining 48 stimuli of each category were randomly distributed across three sessions.
The procedure for the dot-probe task was almost identical to the one described in Laméris et al. 38 . In five months prior to the experiment, all individuals were allowed to participate in training sessions. For training, we followed the protocol previously used to train bonobos ( Pan paniscus ) and Bornean orang-utans on the dot-probe task 38 , 52 . We elaborate on the different steps and the individual trajectories of the training period in the Supplementary Materials (Supplementary Methods & Supplementary Table 1 ). Eventually, three individuals fulfilled the training criteria. They participated in the full task.
Regarding the task design, a trial consisted of five phases (Fig. 1 ). First, a 200 × 200-pixel black dot appeared on a random position on the screen and had to be clicked. We added this step to avoid anticipatory responses. Second, the dot appeared in the lower, middle part of the screen. Touching this dot activated presentation of two stimuli (500 × 375 px) that were vertically positioned in the middle of the screen, and horizontally equidistant from the center of the screen (20% vs. 80%). After 300 ms, the stimuli disappeared and only one of the stimuli was replaced by a dot (the probe) that remained on the screen until touched by the subject. Touching the dot resulted in a reward (sunflower seed). After an inter-trial interval of 3 s, a new trial started. The background of screen was white during all steps of the trial.

Schematic depiction of a dot-probe task trial with large and small flanges as competing stimuli. The arrow indicates the temporal progression of the trial.
Trials were presented in randomized order. For the flange size dot-probe, each individual participated in 6 sessions consisting of 24 trials. For the symmetry dot-probe, each individual participated in 8 sessions consisting of 20 trials. All stimuli were presented twice across all sessions: once as probed stimulus (replaced by dot), once as distractor stimulus (not replaced by dot). At the end of the test sessions, we created extra sessions per subject to repeat outlier trials (see Statistical analysis). All data were collected between February and December 2020, with a test stop between March and July 2020 due to COVID-19.
Two of the three participating individuals were already trained on the task for a previous study 38 . They received a few training sessions to check whether they still executed the task correctly, which was the case. For the other individuals, we employed a similar training procedure. Only one of the individuals, Kawan, managed to pass all phases of the training (between July and December 2019). Thus, this resulted in a total sample of three participants.
The procedure of the preference task was adapted from Watson et al. 22 . Each session consisted of two parts (Fig. 2 ): a forced-trial procedure (8 trials) and a choice-trial procedure (16 trials). During all parts of the experiment, the background was silver gray (#c0c0c0). Trials in the forced-trial procedure started with a 300 × 300-pixel black dot that appeared in a random position. This randomly located dot was added at the start of each trial to avoid anticipatory responses. After clicking the dot, a similar dot appeared exactly in the center of the screen. By clicking this dot, individuals would advance to a screen that depicted either a red dot or a green dot. The shades of green (#339,900) and red (#990,000) were almost equal in saturation. Each dot colour was associated with one specific stimulus category within the session (either flanged or unflanged stimuli). Because there was only one dot on the screen (either green or red), they were “forced” to select this one. After their response, they would be presented with a stimulus from the corresponding category for 4 s (820 × 1134 px) and receive a reward, followed by a 2 s inter-trial interval. In total, subjects had to pass 8 forced trials (4 green, 4 red) at the start of each session, in order to probe the association between dot colour and stimulus category within the session.

Schematic depiction of two preference task trials with flanged and unflanged stimuli. The left box shows the design of a forced choice trial, while the right box shows the design of a choice trial. The arrows indicate the temporal progression of the trial.
Hereafter, they were presented with 16 choice trials. The start and end of each choice trial were essentially the same as for the forced trials. However, instead of being presented with one coloured dot, subjects could now choose between the red dot and the green dot, thereby controlling the stimulus category on the screen. The dots were presented in a circular way, equidistant from the center of the screen and always located exactly opposite of each other. Note that this differs from the method that Watson et al. 22 describe, who presented the choice dots always at the same location on the screen. However, we noticed during the familiarisation sessions that the orang-utans would show anticipatory responses because they would know the exact location where the dots would appear. Therefore, we chose to randomize the location of the choice dots in a circular way. Importantly, the coloured dots were always located at the same distance from the center of the screen, where subjects needed to tap to advance to the choice dots.
With regard to training, all individuals were already familiar with clicking dots for a reward. Therefore, we mainly had to familiarise them with the specific task (between July and October 2021). To this effect, all participating subjects fulfilled eight sessions. The first six sessions presented them with pictures of animals and flowers. Importantly, in these sessions we had not yet implemented the randomized location of the choice dots. They were presented on fixed locations, as in the original method 22 . Because we noticed that individuals would sometimes anticipate the appearance of the choice dots by clicking their location repeatedly before onset, we decided to run two final training sessions in which we implemented the randomised circular presentation described above. Subjects could only participate in the experimental sessions after participating in all eight of the familiarisation sessions. In total, six subjects fulfilled this criterion: all individuals except for the two flanged males.
In total, each subject participated in six experimental sessions between September and December 2021, depending on whether the subject already finished the familiarisation phase. In three of the sessions, flanged stimuli were associated with red dots, and in the three other sessions, flanged stimuli were associated with green dots. Subjects were presented with the sessions in blocks based on the colour-stimulus category association, so that they did not have to re-learn the association each session. Thus, three individuals started out with the three sessions where green was associated with flanged stimuli, while the three other individuals started out with the sessions where red was associated with flanged stimuli. Within the 3-session colour blocks, the order of the sessions was randomized between subjects.
Statistical analysis
We performed all of the analyses in R statistics Version 4.2.2. To analyse the data, we used Bayesian mixed models. Bayesian analyses have gained in popularity over the past few years because they have a number of benefits compared to frequentist analyses 53 , 54 . While frequentist methods (e.g., p-value null-hypothesis testing 55 )inform us about the credibility of the data given a hypothesis, Bayesian methods inform us about the credibility of our parameter values given the data that we observed. This is reflected in the different interpretation of frequentist and Bayesian confidence intervals: The first is a range of values that contains the estimate in the long run, while the latter tells which parameter values are most credible based on the data 53 , 56 . Furthermore, Bayesian methods allow for the inclusion of prior expectations in the model, are less prone to Type I errors, and are more robust in small and noisy samples 54 . Altogether, these reasons make Bayesian methods a useful tool for data analysis.
All models were created in the Stan computational framework and accessed using the brms package 57 , 58 , version 2.18.5. All models were run with 4 chains and 6000 iterations, of which 1000 were warmup iterations. We checked model convergence by inspecting the trace plots, histograms of the posteriors, Gelman-Rubin diagnostics, and autocorrelation between iterations 59 . We found no divergences or excessive autocorrelation in any model. Furthermore, we used the package emmeans 60 to obtain posterior draws for contrasts. Below, we discuss the specific statistical models for each experiment.
In line with previous studies 5 , 7 , 38 , 42 we filtered the reaction times (RTs). First, we excluded slow reaction times, because they might reflect low motivation or distraction. Instead of opting for a fixed outlier criterion, we determined the upper limit per subject based on the median absolute deviation (MAD) in RT (i.e., RT = median + 2.5 × MAD; Leys et al., 2013). Second, we excluded reactions times < 200 ms, because they very likely represent anticipatory responses 61 . These unsuccessful trials were afterwards repeated in subject-specific repetition sessions. After the repetition of these unsuccessful trials, we applied the same filtering criteria.
For the flange size dot-probe, we collected 423 trials of which 96 were excluded based on the outlier criteria (22.69%). In the subject-specific repetition sessions that consisted of the unsuccessful trials based on our outlier criterion, we collected 105 trials, 28 of which were excluded based on the outlier criteria (26.67%). Thus, our final dataset for the flange size dot-probe contained 404 trials (Kawan: 133; Samboja: 131; Sandy: 140). For the symmetry dot-probe, we followed the same procedure. In total, we collected 474 trials, 102 of which were excluded based on the outlier criteria (21.61%). In the subject-specific repetition sessions that consisted of the unsuccessful trials based on our outlier criterion, we collected 108 trials, 32 of which were excluded (29.63%). Thus, our final dataset for the symmetry dot-probe contained 448 trials (Kawan: 152; Samboja: 142; Sandy: 154).
For both experiments, we created separate statistical models per subject. We chose to analyze our data at the individual level because of the low number of subjects that participated in this experiment. Given the fact that we had a relatively high number of trials per subject, it was possible to test for the presence of a within-subject effect separately for each subject. Previous work has suggested that this is a suitable approach in case of low subject numbers 62 , 63 .
To test whether the orang-utans had an attentional bias for large flanges, we fitted three Bayesian mixed models with a Student- t family. The Student- t family is ideal for robust linear models, as the model will be influenced less strongly by outliers. We specified mean-centered RT (in ms) as dependent variable, and Congruence (Congruent: probe behind large flange stimulus; Incongruent: probe behind small flange stimulus) as categorical independent variable. We added Probe location (Left/Right) as categorical independent variable to control for possible side biases in RT. Furthermore, we allowed the intercept to vary by Session, so that the statistical model accounted for variation in RT between sessions. We specified a Gaussian prior with M = 0 and SD = 5 for the Intercept of the model. For the independent variables, we specified regularizing Gaussian priors with M = 0 and SD = 10. For the nu parameter of the Student- t distribution, we specified a Gamma prior with k = 2 and θ = 0.1. For all variance parameters, we kept the default half Student’s t priors with 3 degrees of freedom. To test whether orang-utans had an attentional bias for symmetrical faces, we followed the exact same procedure. However, the predictor Congruence now refers to the symmetry of the depicted face (Congruent: probe behind symmetrical stimulus; Incongruent: probe behind original stimulus). We used sum-to-zero coding for all of our categorical independent variables.
For 5 of the 6 subjects we had a complete dataset of 96 choice trials. Only for Kawan we missed 4 trials, because he left twice at the end of an experimental session. Thus, our final dataset consisted of 572 datapoints. Because we had a larger number of subjects in this experiment, we chose to analyze the data in one statistical model. To examine whether the orang-utans preferred seeing a picture of flanged males over unflanged males, we fitted a Bayesian logistic mixed model (Bernoulli family). We specified the binary choice (1 = flanged, 0 = unflanged) as dependent variable. The within-subject categorical variable Colour Flanged, which represent whether the flanged stimuli were associated with the red or the green dot, was added as an independent variable, together with the between-subject variable Order, which represented whether the individual first received the sessions in which the red dot was associated with the flanged stimuli or in which the green dot was associated with the flanged stimuli. To explore the effect of dot location on the screen on probability of selection, we extended the model by adding a continuous predictor that was zero-centered and reflected the location of the dot representing flanged stimuli relative to the vertical middle of the screen (range − 0.35–0.35, with negative values representing the higher portion of the screen).
With regard to the random effects, we allowed the intercept to vary by Subject and allowed the intercept of Session to vary within Subject. Furthermore, we allowed the slope for Colour Flanged to vary by Subject, to take into account potential treatment effects between subjects. We specified a Gaussian prior with M = 0 and SD = 0.5 for the Intercept and independent variables of the model. Note that these priors are specified on the logit scale. For all variance parameters, we kept the default half Student- t priors with 3 degrees of freedom.
To explore temporal clustering and dispersion in the choices of the orang-utans, we developed an R script based on 64 that is essentially a Beta-Binomial model that can be used to assess independence of binary observations. We applied it to each of the sessions independently. The script first counts the number of switches between selected categories within the session (variable T ). Second, we specified a Beta(10, 10) prior on θ , the probability of selecting a flanged male stimulus, emphasizing a relatively strong expectation of 50/50 selection of flanged and unflanged stimuli. Third, we obtained a posterior for θ by updating the Beta(10, 10) prior based on the choices from the session. Fourth, we simulated 10,000 binary series of the same length as the session, based on sampling from the posterior distribution of θ . Note that the binary series consisted of independent samples. Fifth, based on these simulations, we counted the number of switches T in each independent series, and obtained a distribution of T under the assumption of independence. This allowed us to compare the observed T within the sessions with the expected T under the assumption of independence. Consecutively, we checked whether the observed T fell outside of the 95% Highest Density Interval of the expected T , and we calculated the proportion of expected T -samples that was either similar or higher, or similar or lower than the observed T . With regard to the interpretation, an observed T that is low compared to the distribution of expected T reflects fewer switches in a session than expected under the assumption of independence, hence temporal clustering of choices. An observed T that is high compared to the distribution of expected T reflects more switches in a session than expected under the assumption of independence, hence temporal dispersion of choices.
Effect size indices
The effect size indices that we report are based on the posterior distributions of each statistical model. We report multiple quantitative measures to describe the effects. First, we report the median estimate ( b or OR ), and median absolute deviation of the estimate between square brackets. Second, we report an 89% highest density interval of the estimate (89% CrI). We have chosen 89% instead of the conventional 95% to reduce the likelihood that the credible intervals are interpreted as strict hypothesis tests 56 . Instead, the main goal of the credible intervals is to communicate the shape of the posterior distributions. Third, we report the probability of direction ( pd ), i.e., the probability of a parameter being strictly positive or negative, which varies between 50 and 100% 54 .
This study employed only non-invasive methods and animals were never harmed or punished in any way during the study. Participation was completely voluntary, animals were tested in a social setting, and animals were never deprived of food or water. The care and housing of the orangutans was adherent to the guidelines of the EAZA Ex-situ Program (EEP). Furthermore, our research complied with the ASAB guidelines 65 and the ARRIVE guidelines 66 , was carried out in accordance with the national regulations, and was approved by the zoological management of Apenheul Primate Park (Apeldoorn, The Netherlands).
Flange size
In the flange size dot-probe, we found no attentional bias for larger flanges in any of the three participating orang-utans (Fig. 3 A; Supplementary Table 2 ); whether the probe replaced the large or small flange picture had no robust effect on the RT of Kawan ( b congruent = -3.28 [8.50], 89% CrI [− 16.66; 10.49], pd = 0.65), Samboja ( b congruent = 3.90 [9.38], 89% CrI [− 10.68; 19.25], pd = 0.66), and Sandy ( b congruent = 2.08 [9.13], 89% CrI [− 13.05; 16.52], pd = 0.59). We also found no robust effect of probe location (left/right) on RT, indicating that Kawan ( b left = 5.08 [8.66], 89% CrI [− 9.05; 18.41], pd = 0.72), Samboja ( b left = − 6.61 [9.41], 89% CrI [− 21.82; 8.60], pd = 0.76), and Sandy ( b left = 7.58 [9.30], 89% CrI [− 7.33; 22.12], pd = 0.80) did not have a side bias.

Posterior predictions of the difference in RT between trials where the probe replaced ( A ) the stimulus with larger flanges (Congruent) and trials where the probe replaced the stimulus with smaller flanges (Incongruent), or ( B ) replaced the stimulus with symmetrized face (Congruent) and trials where the probe replaced the stimulus with original face (Incongruent). Values under the horizontal null-line mean that the subject was predicted to respond faster to congruent than incongruent trials.
Because we applied a proportional transformation to our stimuli, the absolute width difference between the stimuli was not similar for all stimulus combinations. Therefore, we ran additional sensitivity analyses that explored whether the difference in RT between congruent and incongruent trials varied over the absolute width difference of the stimuli. These analyses are reported in the Supplementary Materials (Supplementary Table 3 ; Supplementary Fig. 1 ). We found no indications that the orang-utans did show a faster response to congruent trials at specific width differences. This suggests that our null results are at least not driven by differential responses to stimuli on the extremes of the width spectrum.
In the symmetry dot-probe, we found no attentional bias for symmetrical faces in any of the three participating orang-utans (Fig. 3 B; Supplementary Table 4 ); whether the probe replaced the large or small flange picture had no robust effect on the RT of Kawan ( b congruent = -3.28 [8.50], 89% CrI [− 16.66; 10.49], pd = 0.65), Samboja ( b congruent = 3.90 [9.38], 89% CrI [-10.68; 19.25], pd = 0.66), and Sandy ( b congruent = 2.08 [9.13], 89% CrI [− 13.05; 16.52], pd = 0.59). Similar to the flange size experiment, we found no robust effect of probe location (left/right) on RT, indicating that Kawan ( b left = 5.08 [8.66], 89% CrI [− 9.05; 18.41], pd = 0.72), Samboja ( b left = − 6.61 [9.41], 89% CrI [− 21.82; 8.60], pd = 0.76), and Sandy ( b left = 7.58 [9.30], 89% CrI [− 7.33; 22.12], pd = 0.80) did not have a side bias.
In the preference test (Supplementary Table 5 ), we found that the orang-utans chose stimuli of flanged and unflanged males exactly at chance level (OR Intercept = 1.00 [0.13], 89%CrI [0.78; 1.25], pd = 0.52). Thus, they did not seem to prefer looking at stimuli of flanged males. This was the case for all individuals (Fig. 4 ): Baju (OR Intercept = 1.13 [0.30], 89%CrI [0.66; 1.61], pd = 0.67), Indah (OR Intercept = 0.85 [0.24]], 89%CrI [0.51; 1.27], pd = 0.72), Kawan (OR Intercept = 1.07 [0.26], 89%CrI [0.68; 1.56], pd = 0.61), Samboja (OR Intercept = 0.93 [0.23], 89%CrI [0.57; 1.31], pd = 0.55), Sandy (OR Intercept = 1.06 [0.25], 89%CrI [0.66; 1.54], pd = 0.59), and Wattana (OR Intercept = 1.00 [0.13], 89%CrI [0.78; 1.25], pd = 0.52).

Posterior predictions of the probability of selecting the flanged male stimulus per subject. The horizontal line indicates chance level.
The between-subject effect of Order did not have a robust effect on the preference of the individuals (OR FlangedRedFirst = 0.88 [0.11], 89%CrI [0.69; 1.07], pd = 0.84). However, the colour of the dot that was associated with flanged males did have an influence on the preference: the orang-utans were more likely to select the flanged male stimulus if these were associated with the red dot (OR Green = 0.67 [0.08], 89%CrI [0.54; 0.83], pd = 0.99), indicating a preference for the colour red (Fig. 5 ). Furthermore, we found very strong evidence for the notion that orang-utans made energy-efficient choices (Supplementary Table 6 ; Fig. 6 ): they were more likely to select the flanged stimulus when the dot associated with it was presented in the lower portion of the screen (OR Height = 17.01 [5.06], 89%CrI [9.42; 25.64], pd = 1.00).

Posterior predictions of the probability of selecting the flanged male stimulus as a function of the colour associated with flanged male stimuli per subject. The horizontal line indicates chance level.

Posterior predictions of the probability of selecting the flanged male stimulus as a function of the vertical position of the dot representing the flanged male on the screen. Negative values indicate that the dot associated with the flanged male stimulus was positioned in the higher portion on the screen, while positive values indicate the lower portion of the screen.
In addition, we explored whether individuals showed temporal clustering in their choices by selecting the same category multiple times in a row. To this effect, we compared the number of switches between categories for every session to a dataset consisting of the number of switches that one would expect under the assumption of independence. We found no evidence for temporal clustering (fewer switches than expected) or temporal dispersal (more switches than expected) in any of the sessions, indicating that previous choices did not influence choices in the next trial.
Even though face perception in primates has been studied extensively, the interplay between facial traits relevant to mate choice and cognition has received relatively little attention, especially in great apes. Therefore, the aim of this study was to investigate whether zoo-housed Bornean orang-utans ( Pongo pygmaeus ) have cognitive biases for males with fully developed secondary sexual traits (flanged males) or males with more symmetrical faces. Across two experiments, measuring either immediate attention bias or choice bias, we found no evidence of cognitive biases towards facial traits that might be relevant for mate choice. This lack of biases was consistent between all participating individuals. Furthermore, we did not find evidence for either temporal clustering or dispersion in the preference test: orang-utans did not seem to alter their choices based on their response in previous trials. However, we did find evidence of (i) a robust colour bias and (ii) an energy conservation strategy in the preference test. Below, we discuss our results in the context of primate literature and orang-utan ecology and consider methodological limitations.
Contrary to our hypotheses, we found no evidence for immediate attentional biases towards either large flanges or symmetrical faces in the dot-probe paradigm, while we expected a bias towards larger flanges and more symmetrical faces. With regard to flanges, previous research has shown that orang-utans spend a substantial amount of time looking at flanges while scanning male faces 3 and orang-utans also showed an attentional bias towards flanged males in an eye-tracking study 67 . Regarding symmetry, we recently reported a similar null result in humans in the exact same task 15 : human participants had no attentional bias towards symmetrical faces. While previous literature has often emphasised the importance of symmetry for mate choice 68 , 69 , recent literature has criticised this notion in humans on the basis that the link between symmetry and attractiveness seems overstated 32 and the link between symmetry and health remains equivocal 33 . Thus, the results for facial symmetry are in accordance with recent null findings and theoretical debates in humans.
While a null result could indicate that orang-utans do not have an immediate attention bias towards larger flanges or symmetrical faces, there are relevant methodological limitations in our dot-probe study that warrant some reflection. First, specifically regarding the symmetry experiment, we presented artificial stimuli (symmetrized versions) paired with the original faces. Therefore, there was a risk that we investigated attention bias to manipulated versus unmanipulated images instead of symmetrical versus asymmetrical faces. It is difficult, however, to envision how this could have led to null results. If the orang-utans indeed showed a clear bias towards either category, this would be a convincing alternative explanation. Unfortunately, no studies have yet investigated whether orang-utans have an attentional bias towards unmanipulated or manipulated stimuli. However, recent studies in rhesus macaques have not found evidence that natural images are attended to in a different way than “uncanny” manipulated stimuli 70 , 71 . Nevertheless, future studies could consider employing morphing techniques 72 to create manipulated versions of both symmetrical and asymmetrical faces. Such methods allow for symmetrizing the shape of the face without changing any other textural or structural parameters.
Moreover, it is possible that the manipulation we used, which involved presenting faces with slightly larger or smaller flanges, did not generate salient enough differences between the stimuli to produce robust variations in reaction times in an immediate attention task. Instead of presenting the orang-utans with pictures of different flanged and unflanged males, we wanted to present the same faces while varying only the size of the flanges. This is a common approach in such studies (e.g. in macaques 19 & humans 73 ) to keep the stimuli as controlled as possible . A more skeptical interpretation would be to question whether the orang-utans could even distinguish between the smaller and larger stimuli or between symmetrical and asymmetrical faces. Previous size discrimination studies showing that primates can distinguish objects that approximately differ 10% in volume 74 and that chimpanzees are able to discriminate between dots that differ < 10% in size 75 . Given that our stimuli differed on average 15% in width and none being < 10%, we think it is unlikely that the orang-utans would not have been able to distinguish between the larger and smaller stimuli. The same applies to facial symmetry: previous studies have shown that different primate species are sensitive to variation in facial symmetry (rhesus macaques 24 & capuchin monkeys, Sapajus apella 72 ). To our knowledge, there are no studies investigating explicit categorizing of symmetrical and asymmetrical faces in primates. However, even if primates were not able to explicitly do so, this would not mean that their attention cannot be implicitly biased differentially by symmetrical and asymmetrical faces. Such contradictions between implicit and explicit cognition can also be found in attentional tasks with humans. For example, people may implicitly avoid attending to specific locations that often contain distractor images while at the same time not being able to explicitly indicate those locations 76 . Altogether, we deem it unlikely that the orang-utans were not able to discriminate between larger and smaller flanges or symmetrized and asymmetrical faces, while at the same time acknowledging that more extreme manipulations of the stimuli might have resulted in an attentional bias. However, this would mean that we would present the orang-utans with extremely unnatural stimuli, which would affect the ecological validity of our results.
Another important limitation is that the experimental paradigm that we used to study immediate attention, the dot-probe paradigm, has been subject to debate in humans due to its relatively poor reliability 77 , 78 . Similarly, some inconsistent results have been observed when applying this paradigm to primates. While the paradigm has successfully shed light on the influence of emotion information on cognition in various primate species 7 , 41 , 42 , 52 , 79 , inconsistencies persist. For example, we have recently shown that Bornean orang-utans do not seem to show the expected attentional bias towards emotions in the dot-probe task 38 . This raises the question of whether such a widely reported bias is genuinely absent in Bornean orang-utans or if the current paradigm fails to capture it adequately. One potential methodological reason for these inconsistencies is that the dot-probe paradigm relies on reaction times, which are inherently noisy 80 . Especially for species with relatively low levels of manual dexterity compared to humans, such as orang-utans 81 , reaction time might not be the most suitable dependent measure in cognitive tasks. Instead, more fine-scaled methods such as non-invasive eye-tracking could be considered to study attentional preferences in primates. These methods are relatively easy to implement in primates 82 , and provide a more direct measure of attention 83 . Correspondingly, we did find an immediate attention bias towards flanged males in an eye-tracking task (Roth et al., in prep.). This suggest that eye-tracking allows us to probe cognitive biases that are potentially too subtle to identify using reaction time tasks, at least in orang-utans.
In the preference task, we used a previously developed paradigm 22 to test whether Bornean orang-utans would choose to be presented with flanged or unflanged stimuli. However, all individuals selected flanged and unflanged stimuli equally often. Our results are in contrast with the results that a previous study found in rhesus macaques 22 , who specifically selected stimuli depicting faces of high-ranking individuals or stimuli showing coloured perinea. While we made some minor adaptations to the original paradigm (longer stimulus presentation, no fixed dot locations to avoid anticipatory responses, no indirect comparison of stimulus categories), we do not consider it likely that these changes explain the null results. One potential explanation relies on the fact that both choices were rewarded equally, meaning that there was no incentive to choose one category over the other in principle. Because Bornean orang-utans are often confronted with long periods of fruit scarcity 48 , they might be especially sensitive to food reward. Potentially, the anticipation of reward during the trial was so salient for them that the means to get to the reward became relatively unimportant. This raises the question whether extrinsically rewarded touchscreen experiments like the one we used here are suitable to study Bornean orang-utan cognition.
We also found that individuals had a higher tendency to choose the flanged male stimulus when it was associated with a red-coloured dot instead of the green-coloured dot, despite the fact that the dots were similar in saturation. This preference for red may indicate a general sensory bias towards the colour red, which could be attributed to the evolutionary pressure on primates to select ripe fruits or young leaves 84 . This bias for red objects might extend beyond fruits, possibly explaining why the individuals in the study were more likely to select the red dot. However, previous reports present conflicting evidence regarding the colour bias in food preferences among orang-utans. While one report suggested a preference for red food in a juvenile orang-utan 85 , a more recent report did not find any colour bias 86 . It is important to note that both reports concern single-subject observations. A more comprehensive study in rhesus macaques demonstrated a bias towards red food items, but this bias did not extend to non-food objects 87 . In conclusion, we found evidence for the notion that orang-utans have a sensory bias towards red objects, although this seems to conflict somewhat with existing literature on colour biases in primates.
In addition, orang-utans were more likely to select the dot associated with flanged male stimuli if it was in the lower portion of the screen, potentially reflecting an energy conservation mechanism. Bornean orang-utans are extremely well-adapted to low fruit availability. This is reflected in their extremely low levels of energy expenditure 46 and their energy-efficient locomotion style 88 , 89 . This inclination to conserve energy may also manifest in their behaviour during our experiment. In the preference tasks, the locations of the dots were randomized in a circular way between trials, with both dots appearing in exact opposite positions equidistant from the center of the screen. While this approach helped to avoid anticipatory clicking by the orang-utans, it did result in differential energy costs associated with the dots. Clicking the dot in the upper portion of the screen required them to lift their arm further compared to clicking the dot in the lower portion of the screen. Consequently, the orang-utans were more inclined to select the dot in the lower portion of the screen. It is important to acknowledge this limitation in our experimental design. Nevertheless, even after accounting for the vertical location of the dots, we found no bias for flanged or unflanged stimuli (Supplementary Table 6 ). Thus, the strong tendency of orang-utans to conserve as much energy as possible may influence their performance during cognitive tasks.
Future studies on orang-utan cognition should consider the aforementioned effects of colour and dot location on choices. These biases underscore the need for a biocentric approach to animal cognition, which takes into account a species' uniquely adapted perceptual system 90 . Interestingly, however, the notion that orang-utans try to conserve energy during cognitive tasks opens up intriguing avenues for further research. If orang-utans are so prone to conserve energy, it might be possible to exploit this tendency by presenting them with an effort task. Previous studies with primates have developed effort paradigms that are relatively easy to use. These paradigms allow individuals to control the presentation of stimuli by holding a button (i.e., exerting effort). For example, previous studies have used this approach to study preferences for different stimulus categories in Japanese macaques ( Macaca fuscata ), finding that they exerted more effort to see stimuli of monkeys 91 or humans 92 . A similar design could be considered for orang-utans: given that energy conservation is such a core strategy for them, using an effort task may be an especially relevant method to induce their preferences for specific stimuli categories.
In conclusion, our findings from two experimental paradigms indicate no immediate attentional bias towards large flanges or symmetrical faces, nor a choice bias for flanged males. However, we did find a preference for the colour red in the preference task. Furthermore, individuals seemed to conserve energy during the preference task by picking the vertically lowest option on the touchscreen. Our results highlight the importance of taking species-typical characteristics into account when designing cognitive experiments. Future studies could leverage the energy-conserving nature of Bornean orang-utans by presenting them with effort tasks, where they need to exert effort to view stimuli. Such an approach may be fruitful to study social cognition, including its interplay with mate choice, in Bornean orang-utans.
Data availability
The datasets and materials generated and/or analysed during the current study are available via DataverseNL: https://doi.org/10.34894/BL87ES .
Barton, R. A. Visual specialization and brain evolution in primates. Proc. Biol. Sci. 265 , 1933–1937 (1998).
Article CAS PubMed PubMed Central Google Scholar
DeCasien, A. R. & Higham, J. P. Primate Mosaic brain evolution reflects selection on sensory and cognitive specialization. Nat. Ecol. Evol. 3 , 1483–1493 (2019).
Article PubMed Google Scholar
Kano, F., Call, J. & Tomonaga, M. Face and eye scanning in gorillas (Gorilla gorilla), orangutans (Pongo abelii), and humans (Homo sapiens): Unique eye-viewing patterns in humans among hominids. J. Comparat. Psychol. 126 , 388–398 (2012).
Article Google Scholar
Pritsch, C., Telkemeyer, S., Mühlenbeck, C. & Liebal, K. Perception of facial expressions reveals selective affect-biased attention in humans and Orangutans. Sci. Rep. 7 , 7782 (2017).
Article ADS PubMed PubMed Central Google Scholar
Leinwand, J. G., Fidino, M., Ross, S. R. & Hopper, L. M. Familiarity mediates apes’ attentional biases toward human faces. Proc. R. Soc. B Biol. Sci. 289 , 20212599 (2022).
Lewis, M. B. Factors affecting the perception of 3d facial symmetry from 2D projections. Symmetry 9 , 243 (2017).
Article ADS Google Scholar
van Berlo, E., Bionda, T. & Kret, M. E. Attention toward emotions is modulated by familiarity with the expressor: A comparison between bonobos and humans. Emot. No Pagin. Spec.-No Pagin. Spec. https://doi.org/10.1037/emo0000882 (2023).
Petersen, R. M. & Higham, J. P. The role of sexual selection in the evolution of facial displays in male non-human primates and men. Adapt. Hum. Behav. Physiol. 6 , 249–276 (2020).
Little, A. C., Jones, B. C. & DeBruine, L. M. Facial attractiveness: Evolutionary based research. Philos. Trans. R. Soc. B Biol. Sci. 366 , 1638–1659 (2011).
Rhodes, G. The evolutionary psychology of facial beauty. Ann. Rev. Psychol. 57 , 199–226 (2006).
Kenrick, D. T., Neuberg, S. L., Griskevicius, V., Becker, D. V. & Schaller, M. Goal-driven cognition and functional behavior: The fundamental-motives framework. Curr. Dir. Psychol. Sci. 19 , 63–67 (2010).
Article PubMed PubMed Central Google Scholar
Schaller, M., Kenrick, D. T., Neel, R. & Neuberg, S. L. Evolution and human motivation: A fundamental motives framework. Soc. Personal. Psychol. Compass 11 , e12319 (2017).
Darwin, C. R. The Descent of Man, and Selection in Relation to Sex (John Murray, 1871).
Book Google Scholar
Manson, J. H. Mate Choice. In Primates in Perspective (eds Campbell, C. C. et al. ) (Oxford University Press, 2011).
Google Scholar
Roth, T. S., Du, X., Samara, I. & Kret, M. E. Attractiveness modulates attention, but does not enhance gaze cueing. Evol. Behav. Sci. 16 , 343–361 (2022).
Roth, T. S., Samara, I., Perea-Garcia, J. O. & Kret, M. E. Individual attractiveness preferences differentially modulate immediate and voluntary attention. Sci. Rep. 13 , 2147 (2023).
Article ADS CAS PubMed PubMed Central Google Scholar
Lin, T., Fischer, H., Johnson, M. K. & Ebner, N. C. The effects of face attractiveness on face memory depend on both age of perceiver and age of face. Cogn. Emot. 34 , 875–889 (2020).
Article CAS PubMed Google Scholar
Levy, B. et al. Gender differences in the motivational processing of facial beauty. Learn. Motiv. 39 , 136–145 (2008).
Dubuc, C. et al. Who cares? Experimental attention biases provide new insights into a mammalian sexual signal. Behav. Ecol. 27 , 68–74 (2016).
Rosenfield, K. A. et al. Experimental evidence that female rhesus macaques (Macaca mulatta) perceive variation in male facial masculinity. R. Soc. Open Sci. 6 , 181415 (2019).
Waitt, C. et al. Evidence from rhesus macaques suggests that male coloration plays a role in female primate mate choice. Proc. R. Soc. London Series B Biol. Sci. 270 , S144–S146 (2003).
Watson, K. K., Ghodasra, J. H., Furlong, M. A. & Platt, M. L. Visual preferences for sex and status in female rhesus macaques. Anim. Cogn. 15 , 401–407 (2012).
Waitt, C., Gerald, M. S., Little, A. C. & Kraiselburd, E. Selective attention toward female secondary sexual color in male rhesus macaques. Am. J Primatol. 68 , 738–744 (2006).
Waitt, C. & Little, A. C. Preferences for Symmetry in Conspecific Facial Shape Among Macaca mulatta. Int. J. Primatol. 27 , 133–145 (2006).
Higham, J. P. et al. Familiarity affects the assessment of female facial signals of fertility by free-ranging male rhesus macaques. Proc. R. Soc. B Biol. Sci. 278 , 3452–3458 (2011).
Kunz, J. A., van Noordwijk, M. A. & van Schaik, C. P. Orangutan Sexual Behavior. In The Cambridge Handbook of Evolutionary Perspectives on Sexual Psychology/Controversies, Applications, and Nonhuman Primate Extensions (ed. Shackelford, T.) (Cambridge University Press, 2022).
Knott, C. D., Emery Thompson, M., Stumpf, R. M. & McIntyre, M. H. Female reproductive strategies in orangutans, evidence for female choice and counterstrategies to infanticide in a species with frequent sexual coercion. Proc. R. Soc. B Biol. Sci. 277 , 105–113 (2009).
Knott, C. D. & Kahlenberg, S. M. Orangutans: Understanding Forced Copulations. In Primates in Perspective (eds Campbell, C. C. et al. ) (Oxford University Press, 2011).
Prasetyo, D. Understanding bimaturism: the influence of social conditions, energy intake, and endocrinological status on flange development in Bornean orangutans (Pongo pygmaeus wurmbii). (Rutgers University—School of Graduate Studies). https://doi.org/10.7282/t3-69nv-7813 . (2019).
Knott, C. D. Orangutans: Sexual coercion without sexual violence. In Sexual Coercion in Primates and Humans: An Evolutionary Perspective on Male Aggression Against Females (ed. Martin, N.) (Harvard University Press, 2009).
Valen, L. V. A study of fluctuating asymmetry. Evolution 16 , 125–142 (1962).
Jones, A. L. & Jaeger, B. Biological bases of beauty revisited: the effect of symmetry, averageness, and sexual dimorphism on female facial attractiveness. Symmetry 11 , 279 (2019).
Pound, N. et al. Facial fluctuating asymmetry is not associated with childhood ill-health in a large British cohort study. Proc. R. Soc. B Biol. Sci. 281 , 20141639 (2014).
Sefcek, J. A. & King, J. E. Chimpanzee facial symmetry: A biometric measure of chimpanzee health. Am. J. Primatol. 69 , 1257–1263 (2007).
Little, A. C., Paukner, A., Woodward, R. A. & Suomi, S. J. Facial asymmetry is negatively related to condition in female macaque monkeys. Behav. Ecol. Sociobiol. 66 , 1311–1318 (2012).
MacLeod, C., Mathews, A. & Tata, P. Attentional bias in emotional disorders. J. Abnormal Psychol. 95 , 15–20 (1986).
Article CAS Google Scholar
van Rooijen, R., Ploeger, A. & Kret, M. E. The dot-probe task to measure emotional attention: A suitable measure in comparative studies?. Psychon. Bull. Rev. 24 , 1686–1717 (2017).
Laméris, D. W., van Berlo, E., Roth, T. S. & Kret, M. E. No evidence for biased attention towards emotional scenes in Bornean orangutans (Pongo pygmaeus). Affec. Sci. 3 , 772–782 (2022).
Kret, M. E., Muramatsu, A. & Matsuzawa, T. Emotion processing across and within species: A comparison between humans (Homo sapiens) and chimpanzees (Pan troglodytes). J. Comp. Psychol. 132 , 395–409 (2018).
Wilson, D. A. & Tomonaga, M. Exploring attentional bias towards threatening faces in chimpanzees using the dot probe task. PLOS One 13 , e0207378 (2018).
King, H. M., Kurdziel, L. B., Meyer, J. S. & Lacreuse, A. Effects of testosterone on attention and memory for emotional stimuli in male rhesus monkeys. Psychoneuroendocrinology 37 , 396–409 (2012).
Lacreuse, A., Schatz, K., Strazzullo, S., King, H. M. & Ready, R. Attentional biases and memory for emotional stimuli in men and male rhesus monkeys. Anim. Cogn. 16 , 861–871 (2013).
Ma, Y., Zhao, G., Tu, S. & Zheng, Y. Attentional biases toward attractive alternatives and rivals: Mechanisms involved in relationship maintenance among Chinese Women. PLOS One 10 , e0136662 (2015).
Ma, Y., Xue, W. & Tu, S. Automatic inattention to attractive alternative partners helps male heterosexual chinese college students maintain romantic relationships. Front. Psychol. https://doi.org/10.3389/fpsyg.2019.01687 (2019).
Bowmaker, J. K., Astell, S., Hunt, D. M. & Mollon, J. D. Photosensitive and Photostable pigments in the retinae of old world Monkeys. J. Exp. Biol. 156 , 1–19 (1991).
Pontzer, H., Raichlen, D. A., Shumaker, R. W., Ocobock, C. & Wich, S. A. Metabolic adaptation for low energy throughput in orangutans. Proc. Natl. Acad. Sci. U S A 107 , 14048–14052 (2010).
O’Connell, C. A. et al. Wild Bornean orangutans experience muscle catabolism during episodes of fruit scarcity. Sci. Rep. 11 , 10185 (2021).
Vogel, E. R. et al. Nutritional ecology of wild Bornean orangutans (Pongo pygmaeus wurmbii) in a peat swamp habitat: Effects of age, sex, and season. Am. J. Primatol. 79 , e22618 (2017).
Beaudrot, L. H., Kahlenberg, S. M. & Marshall, A. J. Why male orangutans do not kill infants. Behav. Ecol. Sociobiol. 63 , 1549–1562 (2009).
Delgado, R. A. & Schaik, C. P. V. The behavioral ecology and conservation of the orangutan (Pongo pygmaeus): A tale of two Islands. Evol. Anthropol. Issues News Rev. 9 , 201–218 (2000).
Cocks, L. Factors affecting mortality, fertility, and well-being in relation to species differences in captive orangutans. Int. J. Primatol. 28 , 421–428 (2007).
Kret, M. E., Jaasma, L., Bionda, T. & Wijnen, J. G. Bonobos (Pan paniscus) show an attentional bias toward conspecifics’ emotions. PNAS 113 , 3761–3766 (2016).
Kruschke, J. K., Aguinis, H. & Joo, H. The time has come: Bayesian methods for data analysis in the organizational sciences. Organ. Res. Methods 15 , 722–752 (2012).
Makowski, D., Ben-Shachar, M. S., Chen, S. H. A. & Lüdecke, D. Indices of effect existence and significance in the bayesian framework. Front. Psychol. https://doi.org/10.3389/fpsyg.2019.02767 (2019).
Wagenmakers, E.-J. A practical solution to the pervasive problems ofp values. Psychonomic Bull. Rev. 14 , 779–804 (2007).
McElreath, R. Statistical Rethinking : A Bayesian Course with Examples in R and Stan (Chapman and Hall/CRC, 2018).
Bürkner, P.-C. brms: An R package for Bayesian multilevel models using Stan. J. Stat. Softw. 80 , 1–28 (2017).
Bürkner, P.-C. Advanced Bayesian multilevel modeling with the r package brms. R. J. 10 , 395–411 (2018).
Depaoli, S. & van de Schoot, R. Improving transparency and replication in Bayesian statistics: The WAMBS-Checklist. Psychol. Methods 22 , 240–261 (2017).
Lenth, R. V. Emmeans: Estimated Marginal Means, Aka Least-Squares Means . (2023).
Whelan, R. Effective analysis of reaction time data. Psychol. Rec. 58 , 475–482 (2008).
Craig, D. P. A. & Abramson, C. I. Ordinal pattern analysis in comparative psychology—A flexible alternative to null hypothesis significance testing using an observation oriented modeling paradigm. Int. J. Compar. Psychol. https://doi.org/10.46867/ijcp.2018.31.01.10 (2018).
Farrar, B. G., Boeckle, M. & Clayton, N. S. Replications in comparative cognition: What should we expect and how can we improve?. Anim. Behav. Cogn. 7 , 1–22 (2020).
Bayesian Data Analysis . Chapman and Hall/CRC, (2004).
ASAB Ethical Committee/ABS Animal Care Committee. Guidelines for the ethical treatment of nonhuman animals in behavioural research and teaching. Anim. Behav. https://doi.org/10.1016/j.anbehav.2022.09.006 (2023).
du Sert, N. P. et al. The ARRIVE guidelines 2.0: Updated guidelines for reporting animal research. PLOS Biol. 18 , e3000410 (2020).
Roth, T. S. Tinder for orang-utans: comparing sexually selective cognition among Bornean orang-utans (Pongo pygmaeus) and humans (Homo sapiens). Leiden University, (2024).
Gangestad, S. W., Thornhill, R. & Yeo, R. A. Facial attractiveness, developmental stability, and fluctuating asymmetry. Ethol. Sociobiol. 15 , 73–85 (1994).
Møller, A. P. & Thornhill, R. Bilateral symmetry and sexual selection: A meta-analysis. Am. Nat. 151 , 174–192 (1998).
Carp, S. B. et al. Monkey visual attention does not fall into the uncanny valley. Sci. Rep. 12 , 11760 (2022).
Wilson, V. A. D. et al. Macaque gaze responses to the Primatar: A virtual macaque head for social cognition research. Front. Psychol. https://doi.org/10.3389/fpsyg.2020.01645 (2020).
Paukner, A., Wooddell, L. J., Lefevre, C., Lonsdorf, E. & Lonsdorf, E. Do capuchin monkeys (Sapajus apella) prefer symmetrical face shapes?. J. Comp. Psychol. 131 , 73–77 (2017).
Garza, R. & Byrd-Craven, J. The role of hormones in attraction and visual attention to facial masculinity. Front. Psychol. https://doi.org/10.3389/fpsyg.2023.1067487 (2023).
Schmitt, V., Kröger, I., Zinner, D., Call, J. & Fischer, J. Monkeys perform as well as apes and humans in a size discrimination task. Anim. Cogn. 16 , 829–838 (2013).
Tomonaga, M. et al. A horse’s eye view: size and shape discrimination compared with other mammals. Biol. Lett. 11 , 20150701 (2015).
Wang, B., Samara, I. & Theeuwes, J. Statistical regularities bias overt attention. Atten Percept Psyc. 81 , 1813–1821 (2019).
Kappenman, E. S., Farrens, J. L., Luck, S. J. & Proudfit, G. H. Behavioral and ERP measures of attentional bias to threat in the dot-probe task: Poor reliability and lack of correlation with anxiety. Front. Psychol. 5 , 1368 (2014).
Rodebaugh, T. L. et al. Unreliability as a threat to understanding psychopathology: The cautionary tale of attentional bias. J. Abnorm Psychol. 125 , 840–851 (2016).
Schino, G., Carducci, P. & Truppa, V. Attention to social stimuli is modulated by sex and exposure time in tufted capuchin monkeys. Animal Behav. 161 , 39–47 (2020).
Morís Fernández, L. & Vadillo, M. A. Flexibility in reaction time analysis: many roads to a false positive?. R. Soc. Open Sci. 7 , 190831 (2020).
Bardo, A., Cornette, R., Borel, A. & Pouydebat, E. Manual function and performance in humans, gorillas, and orangutans during the same tool use task. Am. J. Phys. Anthropol. 164 , 821–836 (2017).
Hopper, L. M. et al. The application of noninvasive, restraint-free eye-tracking methods for use with nonhuman primates. Behav. Res. Methods 53 , 1003–1030 (2021).
Armstrong, T. & Olatunji, B. O. Eye tracking of attention in the affective disorders: A meta-analytic review and synthesis. Clin. Psychol. Rev. 32 , 704–723 (2012).
Fernandez, A. A. & Morris, M. R. Sexual selection and trichromatic color vision in primates: Statistical support for the preexisting-bias hypothesis. Am. Nat. 170 , 10–20 (2007).
Barbiers, R. B. Orangutans’ color preference for food items. Zoo Biol. 4 , 287–290 (1985).
Sauciuc, G.-A., Persson, T., Bååth, R., Bobrowicz, K. & Osvath, M. Affective forecasting in an orangutan: Predicting the hedonic outcome of novel juice mixes. Anim. Cogn. 19 , 1081–1092 (2016).
Skalníková, P., Frynta, D., Abramjan, A., Rokyta, R. & Nekovářová, T. Spontaneous color preferences in rhesus monkeys: What is the advantage of primate trichromacy?. Behav. Process. 174 , 104084 (2020).
Roth, T. S., Bionda, T. R. & Sterck, E. H. M. Recapturing the canopy: stimulating Bornean orang-utan (Pongo pygmaeus) natural locomotion behaviour in a zoo environment. J. Zoo Aqu. Res. 1 , 16–24 (2017).
Thorpe, S. K. S., Crompton, R. H. & Alexander, R. M. Orangutans use compliant branches to lower the energetic cost of locomotion. Biol Lett 3 , 253–256 (2007).
Bräuer, J., Hanus, D., Pika, S., Gray, R. & Uomini, N. Old and new approaches to animal cognition: There Is Not ‘One Cognition’. J. Intell. 8 , 28 (2020).
Tsuchida, J. & Izumi, A. The effects of age and sex on interest toward movies of conspecifics in Japanese macaques (Macaca fuscata). J. Am. Assoc. Lab. Anim. Sci. 48 , 286–291 (2009).
CAS PubMed PubMed Central Google Scholar
Ogura, T. & Matsuzawa, T. Video preference assessment and behavioral management of single-caged Japanese macaques (Macaca fuscata) by movie presentation. J. Appl. Anim. Welf. Sci. 15 , 101–112 (2012).
Download references
Acknowledgements
We would like to thank all the orang-utan caretakers and the zoological staff of Apenheul Primate Park for their invaluable support throughout the study.
This study was supported by donations from Allwetter Zoo, Apenheul Primate Park, Dublin Zoo, Ouwehands Dierenpark, Taipei Zoo, Zoo Barcelona, Zoo Osnabrück, Zoologischer Stadtgarten Karlsruhe, Zoo Zürich & Wilhelma Zoologisch-Botanischer Garten, and a research grant (International Primatological Society, awarded to T.S.R.). M.E.K. was funded by a Dutch Research Council grant (#016.VIDI.185.036), ERC 2020 (H2020 European Research Council) Program for Research and Innovation Grant (#804582), and Templeton World Charity Foundation (the Diverse Intelligences Possibilities Fund; #TWCF0267) grants.
Author information
Authors and affiliations.
Cognitive Psychology Unit, Institute of Psychology, The Faculty of Social and Behavioral Sciences, Leiden University, Wassenaarseweg 52, 2333 AK, Leiden, The Netherlands
Tom S. Roth, Iliana Samara, Juan Olvido Perea-Garcia & Mariska E. Kret
Apenheul Primate Park, J.CWilslaan 21, 7313 HK, Apeldoorn, The Netherlands
Tom S. Roth
Animal Behaviour & Cognition, Department of Biology, Utrecht University, Padualaan 8, 3584 CH, Utrecht, The Netherlands
Leiden Institute of Brain and Cognition (LIBC), Leiden, The Netherlands
Iliana Samara & Mariska E. Kret
You can also search for this author in PubMed Google Scholar
Contributions
Conceptualization, T.S.R., & M.E.K.; Methodology, T.S.R. & I.S.; Investigation, T.S.R.; Analysis, T.S.R. & I.S.; Visualization, T.S.R.; Writing—Original Draft, T.S.R.; Writing—Reviewing and Editing, I.S., J.O.P.G & M.E.K., Supervision, J.O.P.G & M.E.K.
Corresponding author
Correspondence to Tom S. Roth .
Ethics declarations
Competing interests.
The authors declare no competing interests.
Additional information
Publisher's note.
Springer Nature remains neutral with regard to jurisdictional claims in published maps and institutional affiliations.
Supplementary Information
Supplementary information., rights and permissions.
Open Access This article is licensed under a Creative Commons Attribution 4.0 International License, which permits use, sharing, adaptation, distribution and reproduction in any medium or format, as long as you give appropriate credit to the original author(s) and the source, provide a link to the Creative Commons licence, and indicate if changes were made. The images or other third party material in this article are included in the article's Creative Commons licence, unless indicated otherwise in a credit line to the material. If material is not included in the article's Creative Commons licence and your intended use is not permitted by statutory regulation or exceeds the permitted use, you will need to obtain permission directly from the copyright holder. To view a copy of this licence, visit http://creativecommons.org/licenses/by/4.0/ .
Reprints and permissions
About this article
Cite this article.
Roth, T.S., Samara, I., Perea-Garcia, J.O. et al. No immediate attentional bias towards or choice bias for male secondary sexual characteristics in Bornean orang-utans ( Pongo pygmaeus ). Sci Rep 14 , 12095 (2024). https://doi.org/10.1038/s41598-024-62187-9
Download citation
Received : 20 November 2023
Accepted : 14 May 2024
Published : 27 May 2024
DOI : https://doi.org/10.1038/s41598-024-62187-9
Share this article
Anyone you share the following link with will be able to read this content:
Sorry, a shareable link is not currently available for this article.
Provided by the Springer Nature SharedIt content-sharing initiative
By submitting a comment you agree to abide by our Terms and Community Guidelines . If you find something abusive or that does not comply with our terms or guidelines please flag it as inappropriate.
Quick links
- Explore articles by subject
- Guide to authors
- Editorial policies
Sign up for the Nature Briefing newsletter — what matters in science, free to your inbox daily.

- Open access
- Published: 27 May 2024
Patients’ satisfaction with cancer pain treatment at adult oncologic centers in Northern Ethiopia; a multi-center cross-sectional study
- Molla Amsalu 1 ,
- Henos Enyew Ashagrie 2 ,
- Amare Belete Getahun 2 &
- Yophtahe Woldegerima Berhe ORCID: orcid.org/0000-0002-0988-7723 2
BMC Cancer volume 24 , Article number: 647 ( 2024 ) Cite this article
Metrics details
Patient satisfaction is an important indicator of the quality of healthcare. Pain is one of the most common symptoms among cancer patients that needs optimal treatment; rather, it compromises the quality of life of patients.
To assess the levels and associated factors of satisfaction with cancer pain treatment among adult patients at cancer centers found in Northern Ethiopia in 2023.
After obtaining ethical approval, a multi-center cross-sectional study was conducted at four cancer care centers in northern Ethiopia. The data were collected using an interviewer-administered structured questionnaire that included the Lubeck Medication Satisfaction Questionnaire (LMSQ). The severity of pain was assessed by a numerical rating scale from 0 to 10 with a pain score of 0 = no pain, 1–3 = mild pain, 4–6 = moderate pain, and 7–10 = severe pain Binary logistic regression analysis was employed, and the strength of association was described in an adjusted odds ratio with a 95% confidence interval.
A total of 397 cancer patients participated in this study, with a response rate of 98.3%. We found that 70.3% of patients were satisfied with their cancer pain treatment. Being married (AOR = 5.6, CI = 2.6–12, P < 0.001) and being single (never married) (AOR = 3.5, CI = 1.3–9.7, P = 0.017) as compared to divorced, receiving adequate pain management (AOR = 2.4, CI = 1.1–5.3, P = 0.03) as compared to those who didn’t receive it, and having lower pain severity (AOR = 2.6, CI = 1.5–4.8, P < 0.001) as compared to those who had higher level of pain severity were found to be associated with satisfaction with cancer pain treatment.
The majority of cancer patients were satisfied with cancer pain treatment. Being married, being single (never married), lower pain severity, and receiving adequate pain management were found to be associated with satisfaction with cancer pain treatment. It would be better to enhance the use of multimodal analgesia in combination with strong opioids to ensure adequate pain management and lower pain severity scores.
Peer Review reports
Introduction
Pain is defined as an unpleasant sensory and emotional experience associated with, or resembling that associated with, actual or potential tissue damage [ 1 ]. The prevalence of pain in cancer patients is 44.5-66%. with the prevalence of moderate to severe pain ranging from 30 to 38%, and it can persist in 5-10% of cancer survivors [ 2 ]. Using the World Health Organization’s (WHO) cancer pain management guidelines can effectively reduce cancer-related pain in 70-90% of patients [ 3 , 4 ]. Compared to traditional pain states, the mechanism of cancer-related pain is less understood; however, cancer-specific mechanisms, inflammatory, and neuropathic processes have been identified [ 5 ]. Uncontrolled pain can negatively affect patients’ daily lives, emotional health, social relationships, and adherence to cancer treatment [ 6 ]. Patients with moderate to severe pain have a higher fatigue score, a loss of appetite, and financial difficulties [ 7 ]. Patients fear the pain caused by cancer more than dying from the disease since pain affects their physical and mental aspects of life [ 8 ]. A meta-analysis of 30 studies stated that pain was found to be a significant prognostic factor for short-term survival in cancer patients [ 9 ]. Many cancer patients have a very poor prognosis. However, adequate pain treatment prevents suffering and improves their quality of life. Although the WHO suggested non-opioids for mild pain, weak opioids for moderate pain, and strong opioids for severe pain, pain treatment is not yet adequate in one-third of cancer patients [ 10 ].
Patient satisfaction with pain management is a valuable measure of treatment effectiveness and outcome. It could be used to evaluate the quality of care [ 11 , 12 , 13 ]. Patient satisfaction affects treatment compliance and adherence [ 12 ]. Studies have reported that 60-76% of patients were satisfied with pain treatment, and a variety of factors were found associated with levels of satisfaction [ 3 , 14 , 15 , 16 ]. Studies conducted in Ethiopia reported the prevalence of pain ranging from 59.9 to 93.4% [ 17 , 18 ]. These studies indicate that cancer pain is inadequately treated. Assessment of pain treatment satisfaction can help identify appropriate treatment modalities and further its effectiveness. We conducted this study since there was limited research-based evidence on cancer pain management in low-income countries like Ethiopia. Our research questions were: how satisfied are adult cancer patients with pain treatment, and what are the factors associated with the satisfaction of adult cancer patients with pain treatment?
Methodology
Study design, area, period, and population.
A multi-center cross-sectional study was conducted at four cancer care centers in Amhara National Regional State, Northern Ethiopia from March to May 2023. Those cancer care centers were found in the University of Gondar Comprehensive Specialized Hospital (UoGCSH), Felege-Hiwot Comprehensive Specialized Hospital (FHCSH), Tibebe-Ghion Comprehensive Specialised Hospital (TGCSH) and Dessie Comprehensive Specialized Hospital (DCSH). We selected these centers as they were the only institutions providing oncologic care in the region during the study period.
The UoGCSH had 28 beds in its adult oncology ward and serves 450 cancer patients every month. Three specialist oncologists and 12 nurses provide services in the ward. The FHCSH had 22 beds and provides services for 325 cancer patients every month. Two specialist oncologists, two oncologic nurses, and 7 comprehensive nurses provide services. The TGCSH had eight beds and serves 300 cancer patients every month. There were three specialist oncologists and four oncologic nurses at the care center. The cancer care center at DCSH had 10 beds. It serves 350 cancer patients every month. There was one specialist oncologist, three oncologic nurses, and three comprehensive nurses.
All cancer patients who attended those cancer care centers were the source population, and adult (18+) cancer patients who were prescribed pain treatment for a minimum of one month were the study population. Unconscious patients, patients with psychiatric problems, patients with advanced cancer who were unable to cooperate, and patients with oncologic emergencies were excluded from this study.
Variables and operational definitions
The outcome variable was patient satisfaction with cancer pain treatment, which was measured by the Lubeck Medication Satisfaction Questionnaire. The independent variables were sociodemographic (age, sex, marital status, monthly income, and level of education), clinical (site of tumor, stage of cancer, metastasis), cancer treatment (surgery, chemotherapy, radiotherapy), level of pain, and analgesia (type of analgesia, severity of pain, adequacy of pain treatment, adjuvant analgesic).
- Patient satisfaction
perceptions of the patients regarding the outcome of pain management and the extent to which it meets their needs and expectations. It was measured by a 4-point Likert scale (1 = strongly disagree, 2 = disagree, 3 = agree, 4 = strongly agree) using the LMSQ which has 18 items within 6 subscales that have 3 items in each (effectivity, practicality, side-effects, daily life, healthcare providers, and overall satisfaction) [ 19 ]. Final categorization was done by dichotomizing into satisfied and dissatisfied by using the demarcation threshold formula.
\((\frac{\text{T}\text{o}\text{t}\text{a}\text{l}\,\,\text{h}\text{i}\text{g}\text{h}\text{e}\text{s}\text{t}\,\,\text{s}\text{c}\text{o}\text{r}\text{e} - \text{T}\text{o}\text{t}\text{a}\text{l}\,\, \text{l}\text{o}\text{w}\text{e}\text{s}\text{t}\,\, \text{s}\text{c}\text{o}\text{r}\text{e} }{2}\) ) + Total lowest score [ 20 ]. The highest patient satisfaction score was 70 and the lowest satisfaction score was 26. A score < 48 was classified as dissatisfied, and a score ≥ 48 was classified as satisfied.
The Numeric rating scale (NRS) is a validated pain intensity assessment tool that helps to give patients a subjective feeling of pain with a numerical value between 0 and 10, in which 0 = no pain, 1–3 = mild pain, 4–6 = moderate pain, 7–10 = severe pain [ 21 ].
The Adequacy of cancer pain treatment was measured by calculating the Pain Management Index (PMI) according to the recommendations of the WHO pain management guideline [ 22 ]. The PMI was calculated by considering the prescribed most potent analgesic agent and the worst pain reported in the last 24 h [ 23 ]. The prescribed analgesics were scored as follows: 0 = no analgesia, 1 = non-opioid analgesia, 2 = weak opioids, and 3 = strong opioids. The PMI was calculated by subtracting the reported NRS value from the type of most potent analgesics administered. The calculated values of PMI ranged from − 3 (no analgesia therapy for a patient with severe pain) to + 3 (strong opioid for a patient with no pain). Patients with a positive PMI value were considered to be receiving adequate analgesia, whereas those with a negative PMI value were considered to be receiving inadequate analgesia.
Sample size determination and sampling technique
A single population proportion formula was used to determine the sample size by considering 50% satisfaction with cancer pain treatment and a 5% margin of error at a 95% confidence interval (CI). A non-probability (consecutive) sampling technique was employed to attain a sample size within two months of data collection period. After adjusting the proportional allocation for each center and adding 5% none response, a total of 404 study participants were included in the study: 128 from the University of Gondar Comprehensive Specialized Hospital, 99 from Dessie Comprehensive Specialized Hospital, 92 from Felege Hiwot Comprehensive Specialized Hospital, and 85 from Tibebe Ghion Comprehensive Specialized Hospital.
Data collection, processing, and analysis
Ethical approval.
was obtained from the Ethical Review Committee of the School of Medicine at the University of Gondar ( Reference number: CMHS/SM/06/01/4097/2015) . Data were collected using an interviewer-administered structured questionnaire and chart review during outpatient and inpatient hospital visits by four trained data collectors (one for every center). Written informed consent was obtained from each participant after detailed explanations about the study. Informed consent with a fingerprint signature was obtained from patients who could not read or write after detailed explanations by the data collectors as approved by the Ethical Review Committee of the School of Medicine, at the University of Gondar.
Questions to assess the severity of pain and pain relief were taken from the American Pain Society patient outcome questionnaire [ 24 ]. Patients were asked to report the worst and least pain in the past 24 h and the current pain by using a numeric rating scale from 0 to 10, with a pain score of 0 = no pain, 1–3 = mild pain, 4–6 = moderate pain, 7–10 = severe pain.
The Pain Management Index (PMI) based on WHO guidelines, was used to quantify pain management by measuring the adequacy of cancer pain treatment [ 25 ]. The following scores were given (0 = no analgesia, 1 = non-opioid analgesia, 2 = weak opioid 3 = strong opioid). Pain Management Index was calculated by subtracting self-reported pain level from the type of analgesia administered and ranges from − 3 (no analgesic therapy for a patient with severe pain) to + 3 (strong opioid for a patient with no pain). The level of pain was defined as 0 with no pain, 1 for mild pain, 2 for moderate pain, and 3 for severe pain. Patients with negative PMI scores received inadequate analgesia.
The pain treatment satisfaction was measured by the Lübeck Medication Satisfaction Questionnaire (LMSQ) consisting of 18 items [ 19 ]. Lübeck Medication Satisfaction Questionnaire (LMSQ) has six subclasses each consisting of equally waited and similar context of three items. The subclass includes satisfaction with the effectiveness of pain medication, satisfaction with the practicality or form of pain medication, satisfaction with the side effect profile of pain medication, satisfaction with daily life after receiving pain treatment, satisfaction with healthcare providers, and overall satisfaction. Satisfaction was expressed by a four-point Likert scale (4 = Strongly Agree, 3 = Agree, 2 = Disagree, 1 = Strongly Disagree). The side effect subclass was phrased negatively, marked with Asterix, and reverse-scored in STATA before data analysis.
Data were collected with an interviewer-administered questionnaire. The reliability of the questionnaire was assessed by using 40 pretested participants and the reliability coefficient (Cronbach’s alpha value) of the questionnaire was 91.2%. The collected data was checked for completeness, accuracy, and clarity by the investigators. The cleaned and coded data were entered in Epi-data software version 4.6 and exported to STATA version 17. The Shapiro-Wilk test, variance inflation factor, and Hosmer-Lemeshow test were used to assess distribution, multicollinearity, and model fitness, respectively. Descriptive, Chi-square and binary logistic regression analyses were performed to investigate the associations between the independent and dependent variables. The independent variables with a p-value < 0.2 in the bivariable binary logistic regression were fitted to the final multivariable binary logistic regression analysis. Variables with p-value < 0.05 in the final analysis were considered to have a statistically significant association. The strength of associations was described in adjusted odds ratio (AOR) at a 95% confidence interval.
Sociodemographic and clinical characteristics
A total of 397 patients were involved in this study (response rate of 98.3%). Of the participants, 224 (56.4%) were female, and over half were from rural areas ( n = 210, 52.9%). The median (IQR) age was 48 (38–59) years [Table 1 ]. The most common type of cancer was gastrointestinal cancer 114 (28.7%). Most of the study participants, 213 (63.7%), were diagnosed with stage II to III cancer. The majority of the participants were taking chemotherapy alone (292 (73.6%)) [Table 2 ]. Over 90% of patients reported pain; 42.3% reported mild pain, 39.8% reported moderate pain, and 10.1% reported severe pain. Pain treatment adequacy was assessed by self-reports from study participants following pain management guidelines, and 17.1% of patients responded to having inadequate pain treatment. The majority of patients, 132 (33.3%), were prescribed combinations of non-opioid and weak opioid analgesics for cancer pain treatment. Only 34 (8.6%) cancer patients used either strong opioids alone or in combination with non-opioid analgesics.
Patients’ satisfaction with cancer pain treatment and correlation among the subscales
Most participants strongly agree (243, (61.2%)) with item LMSQ18 in the “overall satisfaction” subscale and strongly disagree (206, (51.9%)) for item LMSQ2 in the “side-effect” subscale respectively [Table 3 ]. The highest satisfaction score was observed in the side-effect subscale, with a median (IQR) of 10 (9–11) [Table 4 ].
Two hundred and seventy-nine (70.3%) cancer patients were found to be satisfied with cancer pain treatment (CI = 65.6−74.6%). The highest satisfaction rate was observed in the “side-effects” subscale, to which 343 (86.4%) responded satisfied [Fig. 1 ]. A Spearman’s correlation test revealed that there were correlations among the subscales of LMSQ; and the strongest positive correlation was observed between effectivity and healthcare workers subscale (r s = 0.7, p < 0.0001). The correlation among the subscales is illustrated in a heatmap [Fig. 2 ].

Patient satisfaction with cancer pain treatment with each LMSQ subclass, n = 397

A heatmap showing the Spearman correlation of each subclass of pain treatment satisfaction, n = 397
Factors associated with patient satisfaction with cancer pain treatment
In the bivariable binary logistic regression analysis, marital status, stage of cancer, types of cancer treatment, severity of pain in the last 24 h, current pain severity, types of analgesics, and pain management index met the threshold of P-value < 0.2 to be included into the final multivariable binary logistic regression analysis. In the final analysis, marital status, current pain severity, and pain management index were significantly associated with patient satisfaction (P-value < 0.05). Married and single cancer patients had higher odds of being satisfied with cancer pain treatment compared to divorced patients (AOR = 5.6, CI, 2.6–12.0, P < 0.001), (AOR = 3.5, CI = 1.3–9.7, P = 0.017), respectively. The odds of being satisfied with cancer pain treatment among patients who received adequate pain management were more than two times greater than those who received inadequate pain management (AOR = 2.4, CI = 1.1–5.3, P = 0.03). Patients who reported a lesser severity of current pain were nearly three times more likely to be satisfied with cancer pain treatment (AOR = 2.6, CI = 1.5–4.8, P < 0.001) [Table 5 ].
The objective of the present study was to assess patients’ satisfaction with cancer pain treatment at adult oncologic centers. Our study revealed that most cancer patients (70.3%) have been satisfied with cancer pain treatment. This is consistent with studies done by Kaggwa et al. and Mazzotta et al. [ 16 , 26 ]. Whereas, it is a higher rate of satisfaction compared to other studies that reported 33.0% [ 27 ] and 47.7% [ 28 ] of satisfaction. The differences might be possibly explained by the use of different pain and satisfaction assessment tools, the greater inclusion (about 70%) of patients with advanced stages of cancer, the duration of cancer pain treatment, and the adequacy of pain management. In the current study, only 19.6% of patients have been diagnosed with stage IV cancer: patients should take treatment at least for a month, and over 80% of patients have received adequate pain management according to PMI. However, some studies have reported higher rates of satisfaction with cancer pain treatment [ 15 , 29 ]. The possible reason for the discrepancy might be the greater (over 40%) use of strong opioid analgesics in the previous studies. Strong opioids were prescribed only for 8.6% of patients in our study. Due to the complex pathophysiology, cancer pain involves multiple pain pathways. Hence, multimodal analgesia in combination with strong opioids is vital in cancer pain management [ 30 ]. Furthermore, the use of epidural analgesia could be another reason for higher rates of satisfaction [ 29 ].
Regarding satisfaction with subscales of LMSQ, about 80% of patients were satisfied with the information provided by the healthcare providers [ 27 ]. In our study; 67.8% of patients were satisfied with the education provided by healthcare providers about their disease and treatment. In contrast, a higher proportion of participants were satisfied with information provision in a study conducted by Kharel et al. [ 29 ]. Furthermore, we observed the lowest satisfaction rate in the daily life subscale. About 48% of cancer patients were not satisfied with their daily lives after receiving analgesic treatment for cancer pain.
Married and single (never married) cancer patients were found to have higher odds of being satisfied with cancer pain treatment as compared to divorced cancer patients. These findings could be explained by the presence of better social support from family or loved ones. Better social support can enhance positive coping mechanisms, increase a sense of well-being, and decrease anxiety and depression. It also improves a sense of societal vitality and results in higher patient’ satisfaction [ 31 , 32 ].
Patients who had a lower pain score were satisfied compared to those who reported a higher pain score, and this is supported by multiple previous studies [ 16 , 26 , 27 , 29 , 33 , 34 ]. This could be explained by the negative impacts of pain on physical function, sleep, mood, and wellbeing [ 35 ]. Moreover, higher pain severity scores could increase financial expenses because of unnecessary or avoidable emergency department visits; and has a consequence of dissatisfaction [ 23 ]. On the contrary, there are studies that state pain severity does not affect patients’ satisfaction [ 36 , 37 ].
Positive PMI scores were significantly associated with cancer pain treatment satisfaction. Patients who received adequate pain management were highly likely to be satisfied with cancer pain treatment. This finding is similar to that of a study done in Taiwan [ 38 ]. However, a study conducted by Kaggwa et al. has denied any association between PMI scores and cancer pain satisfaction [ 16 ].
Satisfaction with healthcare workers and effectivity of analgesics
This study showed that there was a moderately positive correlation between satisfaction with healthcare workers and satisfaction with patients’ perceived effectiveness of analgesics. This might be explained by a positive relationship between healthcare professionals and patients receiving cancer pain treatment. Healthcare providers who provide health education regarding the effectiveness of analgesics may improve patients’ adherence to the prescribed analgesic agent and improve patients’ perceived satisfaction with the effectiveness of analgesics. A systematic review showed that the hope and positivity of healthcare professionals were important for patients to cope with cancer and increase satisfaction with care [ 39 ]. Increased patient satisfaction with care provided by healthcare workers may change attitude of patients who accepted cancer pain as God’s wisdom or punishment and create a positive attitude toward the effectiveness of analgesics [ 40 ]. Another study supported this finding and stated that healthcare providers who deliver health education regarding the prevention of drug addiction, side effects of analgesics, timing, and dosage of analgesics improve patient attitude and cancer pain treatment [ 41 ].
Correlation of each subclass of cancer pain treatment satisfaction
A Spearman correlation was run to assess the correlation of each subclass of LMSQ using the total sample. There was strong positive correlation (r s = 0.5–0.64) between most of LMSQ subclass at p < 0.01.
A cross-sectional study stated that the effectiveness of analgesic, efficacy of medication and patient healthcare provider communication were associated with patient satisfaction [ 42 ]. In this study, 58.2% of patients were satisfied with the practicability of analgesic medications. Comparable to this study, a cross-sectional study stated that patients who were prescribed convenient, fast-acting medications were more satisfied [ 43 ]. Another study stated that 100% of patients who received sufficient information on analgesic treatment and 97.9% of patients who received sufficient information about the side effects of analgesic treatment were satisfied with cancer pain management [ 44 ]. Patients who were satisfied with their pain levels reported statistically lower mean pain scores (2.26 ± 1.70) compared to those not satisfied (4.68 ± 2.07) or not sure (4.21 ± 2.21) [ 27 ]. This may be explained by the impact of pain on daily activity. Patients who report a lower average pain score may have a lower impact of pain on physical activity compared to those who report a higher mean pain score. Another study also supports this evidence and states that patients who reported a severe pain score and lower quality of life had lower satisfaction with the treatment received [ 45 ].
As a secondary outcome, only 16% of patients were diagnosed to have stage I cancer. This finding could indirectly indicate that there were delays in cancer diagnosis at earlier stage. Further studies may be required to underpin this finding.
In this study, baseline pain before analgesic treatment was not assessed and documented. As a cross-sectional study, we could not draw a cause-and-effect conclusion. Since questions that were used to measure oncologic pain treatment satisfaction were self-reported, answers to each question might not be trustful. The expectation and opinion of the interviewer also might affect the result of the study. These could be potential limitations of the study.
Conclusions
Despite the fact that most cancer patients reported moderate to severe pain, there was a high rate of satisfaction with cancer pain treatment. It would be better if hospitals, healthcare professionals, and administrators took measures to enhance the use of multimodal analgesia in combination with strong opioids to ensure adequate pain management, lower pain severity scores, and better daily life. We also urge the arrangement of better social support mechanisms for cancer patients, the improvement of information provision, and the deployment of professionals who have trained in pain management discipline at cancer care centres.
Data availability
Data and materials used in this study are available and can be presented by the corresponding author upon reasonable request.
Abbreviations
Adjusted Odds Ratio
Crude Odds Ratio
Confidence Interval
Dessie Compressive and Specialized Hospital
Felege-Hiwot Compressive and Specialized Hospital
Inter-quartile Range
Lubeck Medication Satisfaction Questionnaire
Numerical Rating Scale
Pain Management Index
Standard Deviation
Tibebe-Ghion Compressive and Specialized Hospital
University of Gondar Compressive and Specialized Hospital
World health organization
Raja SN, Carr DB, Cohen M, Finnerup NB, Flor H, Gibson S, et al. The revised International Association for the study of Pain definition of pain: concepts, challenges, and compromises. Pain. 2020;161(9):1976–82.
Article PubMed PubMed Central Google Scholar
Brown MR, Ramirez JD, Farquhar-Smith P. Pain in cancer survivors. Br J pain. 2014;8(4):139–53.
Hochstenbach LM, Joosten EA, Tjan-Heijnen VC, Janssen DJ. Update on Prevalence of Pain in Patients With Cancer: Systematic Review and Meta-Analysis. Journal of pain and symptom management. 2016;51(6):1070-90.e9.
Snijders RAH, Brom L, Theunissen M, van den Beuken-van Everdingen MHJ. Update on Prevalence of Pain in patients with Cancer 2022: a systematic literature review and Meta-analysis. Cancers. 2023;15(3).
Falk S, Dickenson AH. Pain and nociception: mechanisms of cancer-induced bone pain. J Clin Oncol. 2014;32(16):1647–54.
Article CAS PubMed Google Scholar
Gibson S, McConigley R. Unplanned oncology admissions within 14 days of non-surgical discharge: a retrospective study. Support Care Cancer. 2016;24:311–7.
Article PubMed Google Scholar
Oliveira KG, von Zeidler SV, Podestá JRV, Sena A, Souza ED, Lenzi J, et al. Influence of pain severity on the quality of life in patients with head and neck cancer before antineoplastic therapy. BMC Cancer. 2014;14(1):39.
Smith MD, Meredith PJ, Chua SY. The experience of persistent pain and quality of life among women following treatment for breast cancer: an attachment perspective. Psycho-oncology. 2018;27(10):2442–9.
Zylla D, Steele G, Gupta P. A systematic review of the impact of pain on overall survival in patients with cancer. Support Care Cancer. 2017;25(5):1687–98.
Greco MT, Roberto A, Corli O, Deandrea S, Bandieri E, Cavuto S, et al. Quality of cancer pain management: an update of a systematic review of undertreatment of patients with cancer. J Clin Oncol. 2014;32(36):4149–54.
Baker TA, Krok-Schoen JL, O’Connor ML, Brooks AK. The influence of pain severity and interference on satisfaction with pain management among middle-aged and older adults. Pain Research and Management. 2016;2016.
Baker TA, O’Connor ML, Roker R, Krok JL. Satisfaction with pain treatment in older cancer patients: identifying variants of discrimination, trust, communication, and self-efficacy. J Hospice Palliat Nursing: JHPN: Official J Hospice Palliat Nurses Association. 2013;15(8).
Naidu A. Factors affecting patient satisfaction and healthcare quality. Int J Health care Qual Assur. 2009.
Davies A, Zeppetella G, Andersen S, Damkier A, Vejlgaard T, Nauck F, et al. Multi-centre European study of breakthrough cancer pain: pain characteristics and patient perceptions of current and potential management strategies. Eur J Pain. 2011;15(7):756–63.
Thinh DHQ, Sriraj W, Mansor M, Tan KH, Irawan C, Kurnianda J et al. Patient and physician satisfaction with analgesic treatment: findings from the analgesic treatment for cancer pain in Southeast Asia (ACE) study. Pain Research and Management. 2018;2018.
Kaggwa AT, Kituyi PW, Muteti EN, Ayumba RB. Cancer-related Bone Pain: patients’ satisfaction with analgesic Pain Control. Annals Afr Surg. 2022;19(3):144–52.
Article Google Scholar
Adugna DG, Ayelign AA, Woldie HF, Aragie H, Tafesse E, Melese EB et al. Prevalence and associated factors of cancer pain among adult cancer patients evaluated at the Oncology unit in the University of Gondar Comprehensive Specialized Hospital, Northwest Ethiopia. Front Pain Res.3:231.
Tuem KB, Gebremeskel L, Hiluf K, Arko K, Hailu HG. Adequacy of cancer-related pain treatments and factors affecting proper management in Ayder Comprehensive Specialized Hospital, Mekelle, Ethiopia. Journal of Oncology. 2020;2020.
Matrisch L, Rau Y, Karsten H, Graßhoff H, Riemekasten G. The Lübeck medication satisfaction Questionnaire—A Novel Measurement Tool for Therapy satisfaction. J Personalized Med. 2023;13(3):505.
Bayable SD, Ahmed SA, Lema GF, Yaregal Melesse D. Assessment of Maternal Satisfaction and Associated Factors among Parturients Who Underwent Cesarean Delivery under Spinal Anesthesia at University of Gondar Comprehensive Specialized Hospital, Northwest Ethiopia, 2019. Anesthesiology research and practice. 2020;2020:8697651.
Breivik H, Borchgrevink P-C, Allen S-M, Rosseland L-A, Romundstad L, Breivik Hals E, et al. Assessment of pain. BJA: Br J Anaesth. 2008;101(1):17–24.
Tegegn HG, Gebreyohannes EA. Cancer Pain Management and Pain Interference with Daily Functioning among Cancer patients in Gondar University Hospital. Pain Res Manage. 2017;2017:5698640.
Shen W-C, Chen J-S, Shao Y-Y, Lee K-D, Chiou T-J, Sung Y-C, et al. Impact of undertreatment of cancer pain with analgesic drugs on patient outcomes: a nationwide survey of outpatient cancer patient care in Taiwan. J Pain Symptom Manag. 2017;54(1):55–65. e1.
Gordon DB, Polomano RC, Pellino TA, Turk DC, McCracken LM, Sherwood G, et al. Revised American Pain Society Patient Outcome Questionnaire (APS-POQ-R) for quality improvement of pain management in hospitalized adults: preliminary psychometric evaluation. J Pain. 2010;11(11):1172–86.
Thronæs M, Balstad TR, Brunelli C, Løhre ET, Klepstad P, Vagnildhaug OM, et al. Pain management index (PMI)—does it reflect cancer patients’ wish for focus on pain? Support Care Cancer. 2020;28:1675–84.
Mazzotta M, Filetti M, Piras M, Mercadante S, Marchetti P, Giusti R. Patients’ satisfaction with breakthrough cancer pain therapy: A secondary analysis of IOPS-MS study. Cancer Manage Res. 2022:1237–45.
Golas M, Park CG, Wilkie DJ. Patient satisfaction with Pain Level in patients with Cancer. Pain Manage Nursing: Official J Am Soc Pain Manage Nurses. 2016;17(3):218–25.
Tang ST, Tang W-R, Liu T-W, Lin C-P, Chen J-S. What really matters in pain management for terminally ill cancer patients in Taiwan. J Palliat Care. 2010;26(3):151–8.
Kharel S, Adhikari I, Shrestha K. Satisfaction on Pain Management among Cancer patient in selected Cancer Care Center Bhaktapur Nepal. Int J Med Sci Clin Res Stud. 2023;3(4):597–603.
Breivik H, Eisenberg E, O’Brien T. The individual and societal burden of chronic pain in Europe: the case for strategic prioritisation and action to improve knowledge and availability of appropriate care. BMC Public Health. 2013;13:1–14.
Gonzalez-Saenz de Tejada M, Bilbao A, Baré M, Briones E, Sarasqueta C, Quintana J, et al. Association between social support, functional status, and change in health‐related quality of life and changes in anxiety and depression in colorectal cancer patients. Psycho‐oncology. 2017;26(9):1263–9.
Yoo H, Shin DW, Jeong A, Kim SY, Yang H-k, Kim JS, et al. Perceived social support and its impact on depression and health-related quality of life: a comparison between cancer patients and general population. Jpn J Clin Oncol. 2017;47(8):728–34.
Hanna MN, González-Fernández M, Barrett AD, Williams KA, Pronovost P. Does patient perception of pain control affect patient satisfaction across surgical units in a tertiary teaching hospital? Am J Med Qual. 2012;27(5):411–6.
Naveh P. Pain severity, satisfaction with pain management, and patient-related barriers to pain management in patients with cancer in Israel. Number 4/July 2011. 2011;38(4):E305–13.
Google Scholar
Black B, Herr K, Fine P, Sanders S, Tang X, Bergen-Jackson K, et al. The relationships among pain, nonpain symptoms, and quality of life measures in older adults with cancer receiving hospice care. Pain Med. 2011;12(6):880–9.
Kelly A-M. Patient satisfaction with pain management does not correlate with initial or discharge VAS pain score, verbal pain rating at discharge, or change in VAS score in the emergency department. J Emerg Med. 2000;19(2):113–6.
Lin J, Hsieh RK, Chen JS, Lee KD, Rau KM, Shao YY, et al. Satisfaction with pain management and impact of pain on quality of life in cancer patients. Asia-Pac J Clin Oncol. 2020;16(2):e91–8.
Su W-C, Chuang C-H, Chen F-M, Tsai H-L, Huang C-W, Chang T-K, et al. Effects of Good Pain Management (GPM) ward program on patterns of care and pain control in patients with cancer pain in Taiwan. Support Care Cancer. 2021;29(4):1903–11.
Prip A, Møller KA, Nielsen DL, Jarden M, Olsen M-H, Danielsen AK. The patient–healthcare professional relationship and communication in the oncology outpatient setting: a systematic review. Cancer Nurs. 2018;41(5):E11.
Orujlu S, Hassankhani H, Rahmani A, Sanaat Z, Dadashzadeh A, Allahbakhshian A. Barriers to cancer pain management from the perspective of patients: a qualitative study. Nurs open. 2022;9(1):541–9.
Uysal N. Clearing barriers in Cancer Pain Management: roles of nurses. Int J Caring Sci. 2018;11(2).
Beck SL, Towsley GL, Berry PH, Lindau K, Field RB, Jensen S. Core aspects of satisfaction with pain management: cancer patients’ perspectives. J Pain Symptom Manag. 2010;39(1):100–15.
Wada N, Handa S, Yamamoto H, Higuchi H, Okamoto K, Sasaki T, et al. Integrating Cancer patients’ satisfaction with Rescue Medication in Pain assessments. Showa Univ J Med Sci. 2020;32(3):181–91.
Antón A, Montalar J, Carulla J, Jara C, Batista N, Camps C, et al. Pain in clinical oncology: patient satisfaction with management of cancer pain. Eur J Pain. 2012;16(3):381–9.
Valero-Cantero I, Casals C, Espinar-Toledo M, Barón-López FJ, Martínez-Valero FJ, Vázquez-Sánchez MÁ. Cancer Patients’ Satisfaction with In-Home Palliative Care and Its Impact on Disease Symptoms. Healthcare. 2023;11(9):1272.
Download references
Acknowledgements
We would like to acknowledge the University of Gondar Comprehensive Specialized Hospital, Tibebe-Ghion Comprehensive Specialized Hospital, Felege-Hiwot Comprehensive Specialized Hospital, Dessie Comprehensive Specialized Hospital. We would also want to acknowledge Ludwig Matrisch from the Department of Rheumatology and Clinical Immunology, Universität zu Lübeck, 23562 Lübeck, Germany for supporting us on the utilization of the Lübeck Medication Satisfaction Questionnaire (LMSQ) [email protected],
This study was supported by University of Gondar and Debre Birhan University with no conflict of interest. The support did not include publication charges.
Author information
Authors and affiliations.
Department of Anesthesia, Debre Birhan University, Debre Birhan, Ethiopia
Molla Amsalu
Department of Anaesthesia, University of Gondar, Gondar, Ethiopia
Henos Enyew Ashagrie, Amare Belete Getahun & Yophtahe Woldegerima Berhe
You can also search for this author in PubMed Google Scholar
Contributions
‘’M.A. has conceptualized the study and objectives; and developed the proposal. Y.W.B., H.E.A., and A.B.G. criticized the proposal. All authors had participated in the data management and statistical analyses. Y.W.B, M.A., and H.E.A. have prepared the final manuscript. All authors read and approved the final manuscript.‘’.
Corresponding author
Correspondence to Yophtahe Woldegerima Berhe .
Ethics declarations
Ethics approval and consent to participate.
Ethical approval was obtained from the Ethical Review Committee of the School of Medicine, at the University of Gondar ( Reference number: CMHS/SM/06/01/4097/2015, Date: March 24, 2023 ). Permission support letters were obtained from FHCSH, TGCSH, and DCSH. Written informed consent was obtained from each participant after detailed explanations about the study. Informed consent with a fingerprint signature was obtained from patients who could not read or write after detailed explanations by the data collectors as approved by the Ethical Review Committee of the School of Medicine, at the University of Gondar.
Consent for publication
Not applicable; this article does not include any personal details of any participant.
Competing interests
The authors declare no competing interests.
Additional information
Publisher’s note.
Springer Nature remains neutral with regard to jurisdictional claims in published maps and institutional affiliations.
Rights and permissions
Open Access This article is licensed under a Creative Commons Attribution 4.0 International License, which permits use, sharing, adaptation, distribution and reproduction in any medium or format, as long as you give appropriate credit to the original author(s) and the source, provide a link to the Creative Commons licence, and indicate if changes were made. The images or other third party material in this article are included in the article’s Creative Commons licence, unless indicated otherwise in a credit line to the material. If material is not included in the article’s Creative Commons licence and your intended use is not permitted by statutory regulation or exceeds the permitted use, you will need to obtain permission directly from the copyright holder. To view a copy of this licence, visit http://creativecommons.org/licenses/by/4.0/ . The Creative Commons Public Domain Dedication waiver ( http://creativecommons.org/publicdomain/zero/1.0/ ) applies to the data made available in this article, unless otherwise stated in a credit line to the data.
Reprints and permissions
About this article
Cite this article.
Amsalu, M., Ashagrie, H.E., Getahun, A.B. et al. Patients’ satisfaction with cancer pain treatment at adult oncologic centers in Northern Ethiopia; a multi-center cross-sectional study. BMC Cancer 24 , 647 (2024). https://doi.org/10.1186/s12885-024-12359-7
Download citation
Received : 17 October 2023
Accepted : 08 May 2024
Published : 27 May 2024
DOI : https://doi.org/10.1186/s12885-024-12359-7
Share this article
Anyone you share the following link with will be able to read this content:
Sorry, a shareable link is not currently available for this article.
Provided by the Springer Nature SharedIt content-sharing initiative
- Cancer pain treatment
- Treatment satisfaction
- Cancer pain
ISSN: 1471-2407
- Submission enquiries: [email protected]
- General enquiries: [email protected]
Development of an integrated machine-learning and data assimilation framework for NO x emission inversion
- Chen, Yiang
- Fung, Jimmy C. H.
- Yuan, Dehao
- Chen, Wanying
- Lu, Xingcheng
As major air pollutants, nitrogen oxides (NO x , mainly comprising NO and NO 2 ) not only have adverse effects on human health but also contribute to the formation of secondary pollutants, such as ozone and particulate nitrate. To acquire reasonable NO x simulation results for further analysis, a reasonable emission inventory is needed for three-dimensional chemical transport models (3D-CTMs). In this study, a comprehensive emission adjustment framework for NO x emission, which integrates the simulation results of the 3D-CTM, surface NO 2 measurements, the three-dimensional variational data assimilation method, and an ensemble back propagation neural network, was proposed and applied to correct NO x emissions over China for the summers of 2015 and 2020. Compared with the simulation using prior NO x emissions, the root-mean-square error, normalized mean error, and normalized mean bias decreased by approximately 40 %, 40 %, and 60 % in NO 2 simulation using posterior NO x emissions corrected by the framework proposed in this work. Compared with the emissions for 2015, the NO x emission generally decreased by an average of 5 % in the simulation domain for 2020, especially in Henan and Anhui provinces, where the percentage reductions reached 24 % and 19 %, respectively. The proposed framework is sufficiently flexible to correct emissions in other periods and regions. The framework can provide reliable and up-to-date emission information and can thus contribute to both scientific research and policy development relating to NO x pollution.
- NO<SUB loc="post">x</SUB> emissions;
- Emission inversion;
- 3D-Var data assimilation method;
- Machine learning;
IMAGES
VIDEO
COMMENTS
Whilst using secondary data is often associated with limited knowledge of the data collection procedure and difficulties of "verification" of the data (Heaton, 2008) as well as limited "fidelity" of secondary data (Thorne, 1998), Heaton (2008) questions whether qualitative data can actually be ever verified, whether primary or secondary ...
Revised on January 12, 2024. Secondary research is a research method that uses data that was collected by someone else. In other words, whenever you conduct research using data that already exists, you are conducting secondary research. On the other hand, any type of research that you undertake yourself is called primary research.
Data may be incomplete or inaccurate: Secondary data may be incomplete or inaccurate due to missing or incorrect data points, data entry errors, or other factors. Biases in data collection: The data may have been collected using biased sampling or data collection methods, which can limit the validity of the data.
Secondary research, also known as desk research, is a research method that involves compiling existing data sourced from a variety of channels. This includes internal sources (e.g.in-house research) or, more commonly, external sources (such as government statistics, organizational bodies, and the internet).
Secondary data analysis is a valuable research approach that can be used to advance knowledge across many disciplines through the use of quantitative, qualitative, or mixed methods data to answer new research questions ( Polit & Beck, 2021 ). This research method dates to the 1960s and involves the utilization of existing or primary data ...
Secondary dataset analysis is a well-established methodology. Secondary analysis is particularly valuable for junior investigators, who have limited time and resources to demonstrate expertise and productivity. ... The same basic research principles that apply to studies using primary data apply to secondary data analysis, including the ...
Step 3: Design your research process. After defining your statement of purpose, the next step is to design the research process. For primary data, this involves determining the types of data you want to collect (e.g. quantitative, qualitative, or both) and a methodology for gathering them. For secondary data analysis, however, your research ...
Abstract. Secondary data analysis refers to the analysis of existing data collected by others. Secondary analysis affords researchers the opportunity to investigate research questions using large-scale data sets that are often inclusive of under-represented groups, while saving time and resources.
5. Advantages of secondary data. Secondary data is suitable for any number of analytics activities. The only limitation is a dataset's format, structure, and whether or not it relates to the topic or problem at hand. When analyzing secondary data, the process has some minor differences, mainly in the preparation phase.
So, rightly secondary research is also termed " desk research ", as data can be retrieved from sitting behind a desk. The following are popularly used secondary research methods and examples: 1. Data Available on The Internet. One of the most popular ways to collect secondary data is the internet.
Common secondary research methods include data collection through the internet, libraries, archives, schools and organizational reports. Online Data. Online data is data that is gathered via the internet. In recent times, this method has become popular because the internet provides a large pool of both free and paid research resources that can ...
Example of a Secondary Data Analysis. An example highlighting this method of reusing one's own data is Winters-Stone and colleagues' SDA of data from four previous primary studies they performed at one institution, published in the Journal of Clinical Oncology (JCO) in 2017. Their pooled sample was 512 breast cancer survivors (age 63 ± 6 years) who had been diagnosed and treated for ...
Secondary analysis of qualitative data is a topic unto itself and is not discussed in this volume. The interested reader is referred to references such as James and Sorenson (2000) and Heaton (2004). Advantages and Disadvantages of Secondary Data Analysis. The choice of primary or secondary data need not be an either/or ques-tion.
Purpose. We believe that the current review can help investigators relying on secondary data to (1) gain insight into both the methodologies and statistical methods, (2) better understand the necessity of a rigorous planning before initiating a comparative effectiveness investigation, and (3) optimize the quality of their investigations.
Sources of Secondary Data. Sources of secondary data include books, personal sources, journals, newspapers, websitess, government records etc. Secondary data are known to be readily available compared to that of primary data. It requires very little research and needs for manpower to use these sources.
Secondary analysis is a research methodology by which researchers use pre-existing data in order to investigate new questions or for the verification of the findings of previous works (Heaton, 2019).
In this article, we define what secondary data in research methodology is, explain the differences between primary and secondary data, list secondary data research methods, provide examples of secondary research, offer a step-by-step guide detailing how to use secondary data in research and discuss the advantages and disadvantages of using it.
Quantitative methods can be difficult, expensive and time consuming (especially if using primary data, rather than secondary data). Suitable when the phenomenon is relatively simple, and can be analysed according to identified variables.
In simple terms, secondary data is every. dataset not obtained by the author, or "the analysis. of data gathered b y someone else" (Boslaugh, 2007:IX) to be more sp ecific. Secondary data may ...
Background: The use of secondary data, such as claims or administrative data, in comparative effectiveness research has grown tremendously in recent years. Purpose: We believe that the current review can help investigators relying on secondary data to (1) gain insight into both the methodologies and statistical methods, (2) better understand the necessity of a rigorous planning before ...
Despite the many advantages associated with the use of secondary data, there are some. disadvantages: Inappropriateness of the data. Data collected by a researcher (primary data) are. collected ...
09/01/2023. Primary research and secondary research are two fundamental approaches used in research studies to gather information and explore topics of interest. Both primary and secondary research offer unique advantages and have their own set of considerations, making them valuable tools for researchers in different contexts.
Altogether, these reasons make Bayesian methods a useful tool for data analysis. All models were created in the Stan computational framework and accessed using the brms package 57 , 58 , version 2 ...
Pain is defined as an unpleasant sensory and emotional experience associated with, or resembling that associated with, actual or potential tissue damage [].The prevalence of pain in cancer patients is 44.5-66%. with the prevalence of moderate to severe pain ranging from 30 to 38%, and it can persist in 5-10% of cancer survivors [].Using the World Health Organization's (WHO) cancer pain ...
A bacterial strain (WM-37) was isolated from soil and identified as Streptomyces rectiviolaceus on the basis of morphological, physiological, biochemical, and 16S rRNA characteristics. The strain was screened regarding its potential use for controlling the pathogen causing peony southern blight. To enhance the secondary metabolite yield, submerged fermentation was conducted according to a ...
As major air pollutants, nitrogen oxides (NO<SUB loc="post">x</SUB>, mainly comprising NO and NO<SUB loc="post">2</SUB>) not only have adverse effects on human health but also contribute to the formation of secondary pollutants, such as ozone and particulate nitrate. To acquire reasonable NO<SUB loc="post">x</SUB> simulation results for further analysis, a reasonable emission inventory is ...