
How to Create an Outstanding Report Presentation!
A report presentation is a daily necessity for most companies. Employees are constantly working on compiling data and facts about their company and department and presenting them in PowerPoint presentations. But often, the presentation design fails to impress.
In this article, you’ll learn how to visualize hard data into an appealing and engaging report presentation for your audience.
What exactly is a report?
A business report is a formal document that communicates corporate information clearly and concisely .
In a report presentation, a company presents data, facts and information, quarterly balance sheets, turnover, HR developments , and so on.
Why report presentations are so important
Report presentations are essential to the success of your business . Why? It’s simple.
Report presentations provide a coherent overview of your company’s performance : What is the current status quo? Which strategic decisions need to be made in the future? How are resources being allocated?
This clear presentation forms the basis for future fact-based decisions . This means it must present facts transparently and answer any business-related questions .
What does a good report presentation look like?
A report presentation has to be clear and concise – after all, you want your audience to understand what you’re saying.
Reporting on data is often very dry. You need to present it in the most visually interesting way possible . An attractive report design will help your audience understand your key messages immediately, without having to delve into specific corporate figures . Keep reading for tips on how to do this.
How to create an engaging report presentation: 5 tips
Report presentations are usually time-limited, so focus on the essential information . The key is to communicate facts clearly and concisely .
Give your information visual interest. Microsoft PowerPoint offers numerous possibilities for enhancing the look of your presentation. Below we have compiled 5 tips for you on how to create an appealing report.
Tip 1: Prepare properly

Preparation lays the foundation for a successful report presentation. Think carefully about how you want to present specific facts and data. Know what you want to say and what your goals are – that’s key for a great report presentation layout. Each slide must have a specific purpose . Only include data that is essential to convey your message .
Give your slides variety but don’t overload them with information or graphics. Less is often more. Try out the unique features of PowerPoint and see which option best suits your presentation.
Focus on the most important key figures and avoid unnecessary details . A good report presentation should make your key statements understandable without your audience having to delve deeper into the company’s key figures.
For 11 helpful tips on preparing your presentations, check out our post, Preparing a PowerPoint Presentation .
Tip 2: Chose the right charts and diagrams
Charts and diagrams are the best way to visualize figures and data. Not only are they visually appealing, but they also summarize your statements in a way that is easy to understand .
PowerPoint offers a wide range of charts and diagrams . You can choose from pie charts, bar charts and area charts, as well as other customizable diagram options. We’ve summarized an overview of the best diagram styles and when to use them in our article, 10 Chart Types: Which One Is Right for My Data?
Some chart types are more suited to specific data . For example, a pie chart is a terrific way to show gender distribution in your company. Bar or column charts can be used to visualize sales, balance sheets and profits.
If you want to illustrate aspects that have happened over a longer period of time, area charts, line charts and of course timelines are ideal.
Feel free to combine several chart types . Let your creativity run free. You can also add icons to your diagrams. The possibilities are endless! Just keep it simple and don’t overload your slides. You can find professionally designed icons in our shop . Take a look at these:
Once you’ve found the right type of chart or diagram, it’s time to highlight the most vital information in it . This helps your audience understand your key messages and quickly identify the most important aspects of your report presentation. If you need to, you can further explain these aspects as you go along.
You’ll find professionally designed slide templates for various charts in our shop . For example, this template:

Tip 3: Reuse layouts
Certain topics often reappear in report presentations. A good example of this is quarterly figures or annual financial statements. With these kinds of topics, it makes sense to the invest time in creating an optimal layout that you can reuse .
If you want to compare quarterly figures or annual financial statements, using the same layout makes any differences clear and obvious to your audience.
You can find out how to create your own layouts and other tips & tricks here .
Tip 4: Other design elements
You can also use additional design elements to enhance your report presentation . There are unlimited, creative options to choose from. Think carefully about which elements will visually support your statements.
Try to include transparent images . These are more attractive than normal images and set visual accents when combined with text or graphics. Transparent images are also effective as customized backgrounds, like on title slides. We’ve put together more information on transparent images for you here .
Another design idea is icons . These small images help to break up blocks of text and reduce presentation content to a bare minimum. The simple messages behind icons are universally understood and save space on slides. More information can be found here .
Tip 5: Practice, practice, practice
Ideally, a report presentation should need little accompanying information – your slides should speak for themselves . But that doesn’t mean you don’t need to practice. Especially with diagrams, extra information can further support the infographics. Put particular focus on getting your key messages across.
Think about any questions that your audience may have. Even when your report presentation covers only key content, it’s still important to know and convey more in-depth background information on data, facts and figures in case of follow-up questions .
Of course, there’s so much more that goes into a convincing presentation. Here are some articles with helpful tips:
- 16 Ways to Kick-Start Your Presentation
- Body Language in PPT Presentations: 8 Tips & Tricks
- Rhetoric Skills: How to Speak and Present Effectively
- Presentation Hack: Always Focus on Your Audience’s Needs
- Because First Impressions Aren’t Everything: 20 Tips and Ideas to End Your Presentation in Style
You can find more helpful articles in our blog. ► To the blog
Create expert report presentations
Report presentations are a common part of day-to-day business. With their clear graphic elements, reports communicate unambiguous information that is essential for a company’s success.
No doubt your next report presentation is already in your business calendar. Take our tips to heart and try them in your next report.
Do you have questions about report presentations or general questions about PowerPoint? Feel free to contact us at [email protected] . We’re here to help!
Are you looking for professionally designed slide templates for your report presentation? Take a look around our shop. We have a wide variety of slide templates on numerous (business) topics. You’re sure to find the right slide set for your needs. For example, here’s one for your financial report:

You can find more templates here ► To the shop
These articles might also interest you:
- The Right Way to Use Pie Charts in PowerPoint
- PowerPoint Layout: Tips & Tricks Plus 6 Modern Ideas for Your Slide Layout!
- Make a PowerPoint Image Transparent: The Pro Guide
- Icons: An Amazing Way to Improve Your Content
- Preparing a PowerPoint Presentation: 11 Tips for Guaranteed Success!
- 10 Chart Types: Which One Is Right for My Data?
Share this post
- share
- save

Design Thinking: Problem Solving with a Difference

Why Corporate Mission Statements Are So Important

7 Tips & Learnings from the Apple Keynote
Presentation Guru
What makes a great business report presentation.

A large number of consultant report presentations fail to make an impact but it is fair to say, as Daniel Tay does in his very comprehensive guide, 25 Powerful Report Presentations And How To Make Your Own :
The elements that make a consultant’s report presentation great are almost the same that make any presentation great. At the end of the day, keep your audience at the centre, be creative and thoughtful of their needs; use design and visuals to your advantage and integrate them early on, not as an afterthought. And remember: Sometimes, less is more.
He has compiled 25 great examples from some of the world’s leading business consultancies to illustrate how to make an impact. What is particularly useful, is the way he has broken them down to demonstrate the key tips:
Make your Data Digestible
The less is more principle – use data to back your insights, rather than make the data the focus of the slide.
Clean Up Your Slides
Clean and simple slides remove distraction and place emphasis on your message.
Choose the Right Fonts
A good rule of thumb in your report presentation is to use clear, minimally-styled fonts so your message doesn’t get lost in a web of visual distraction.
Make Use of Visuals
Good, relevant visuals amplify your message because they elicit emotional responses, helping your audience retain key points.
Stay organized
A clear flow to the presentation – perhaps even with a tracking tool on each slide to follow progress – will help the audience’s retention rate.
Speak TO Your Audience – Not AT Your Audience
Using an active voice connects better with the audience. And the use of poll questions keeps your audience engaged. For some suggestions on useful tools to use, go to 5 More Ways to Get Instant Feedback from your Audience
Break it Down
Breaking down your solution step-by-step is the best way to increase the effectiveness of your presentation.
Give Actionable Insight
Personalise it to give tailored advice to the stakeholders. What makes a great consultant is his or her ability to go beyond surface data to give clients real, actionable insight.
Keep it Short and Sweet
Bitesize can still be meaty. Remember, quality over quantity.
Don’t Forget to Take Credit
Your photo will help them remember who you are.
You can check out all the great examples at 25 Powerful Report Presentations And How To Make Your Own.
- Latest Posts
Rosie Hoyland
Latest posts by rosie hoyland ( see all ).
- Now Is the Time to Look at Webinars - 13th March 2020
- The Only PowerPoint Templates You’ll Ever Need - 26th March 2019
- 12 Tips for the Technologically Challenged Speaker - 25th March 2019
- The Best Way to Protect Yourself from Misleading Graphs - 17th January 2019
- 3 Tips to Boost Your Confidence - 13th September 2018
Your email address will not be published. Required fields are marked *
Follow The Guru

Join our Mailing List
Join our mailing list to get monthly updates and your FREE copy of A Guide for Everyday Business Presentations

The Only PowerPoint Templates You’ll Ever Need
Anyone who has a story to tell follows the same three-act story structure to...

How to get over ‘Impostor Syndrome’ when you’re presenting
Everybody with a soul feels like an impostor sometimes. Even really confident and experienced...
👀 Turn any prompt into captivating visuals in seconds with our AI-powered design generator ✨ Try Piktochart AI!
- Piktochart Visual
- Video Editor
- AI Design Generator
- Infographic Maker
- Banner Maker
- Brochure Maker
- Diagram Maker
- Flowchart Maker
- Flyer Maker
- Graph Maker
- Invitation Maker
- Pitch Deck Creator
- Poster Maker
- Presentation Maker
- Report Maker
- Resume Maker
- Social Media Graphic Maker
- Timeline Maker
- Venn Diagram Maker
- Screen Recorder
- Social Media Video Maker
- Video Cropper
- Video to Text Converter
- Video Views Calculator
- AI Brochure Maker
- AI Document Generator
- AI Flyer Generator
- AI Infographic
- AI Instagram Post Generator
- AI Newsletter Generator
- AI Report Generator
- AI Timeline Generator
- For Communications
- For Education
- For eLearning
- For Financial Services
- For Healthcare
- For Human Resources
- For Marketing
- For Nonprofits
- Brochure Templates
- Flyer Templates
- Infographic Templates
- Newsletter Templates
- Presentation Templates
- Resume Templates
- Business Infographics
- Business Proposals
- Education Templates
- Health Posters
- HR Templates
- Sales Presentations
- Community Template
- Explore all free templates on Piktochart
- Course: What is Visual Storytelling?
- The Business Storyteller Podcast
- User Stories
- Video Tutorials
- Need help? Check out our Help Center
- Earn money as a Piktochart Affiliate Partner
- Compare prices and features across Free, Pro, and Enterprise plans.
- For professionals and small teams looking for better brand management.
- For organizations seeking enterprise-grade onboarding, support, and SSO.
- Discounted plan for students, teachers, and education staff.
- Great causes deserve great pricing. Registered nonprofits pay less.
How to Write a Report (2023 Guide & Free Templates)

You have a report due in a few days, but you’re still procrastinating like a pro.
Sounds familiar?
If you’ve been staring at a blank page, wondering how to write a report the best way possible, you’re not alone. For many, writing a report, especially for the first time, can feel like rolling a giant boulder uphill.
The good news is that from a first draft to creating reports that people love to read is a skill you can develop and polish over time.
Whether you’re a student, a professional, or someone who wants to up their report-writing game, keep reading for a 2023 guide and step-by-step instructions on how to write a report. Plus, learn about the basic report format.
You’ll also get access to report templates that you can edit and customize immediately and learn about a tool to make reports online (no need to download software!). You can also jump right into customizing templates by creating a free account .
What is report writing?
Report writing is a way of communicating information, data, insight, or analysis. It’s an essential skill that will come in handy in various settings, from academic research or diving into historical events to business meetings.
But creating a report can be a bit intimidating at first.
In its simplest form, report writing starts with researching and gathering all the information, analyzing your findings, and presenting it in a way that’s easy for your audience to understand.
Sounds easy enough, right?
Well, there’s a bit more to it than that. We’ll guide you through every step of the process to write an entire report from a rough draft and data in the next section.
But first, let’s get to know the different types of reports.
Types of reports
Reports come in all shapes and sizes, and the type of report you write will depend on your specific goals and audience. Each type of report has its unique purpose, format, and style.

The most common types of reports are:
- Academic report – These include school reports, book reports, thesis reports, or analytical reports between two opposing ideas.
- Business report – Business reports range from annual reports to SWOT analyses . The goal of business reports is to communicate ideas, information, or insights in a business setting.
- Research report – Research reports are often more scientific or methodological in nature. They can take the form of case studies or research papers.
Learn more : 20 Types of Reports and When to Use Them (Plus Templates)
How to write a report without feeling overwhelmed
Breaking down the report writing process into three stages can make it much more manageable for you, especially if it’s your first time to create one.
These three stages are:
- Pre-writing stage
- Writing stage
- Post-writing stage
Let’s take a look at the steps for each stage and how to write a good report in 2023 that you can be proud of.
Stage 1: Pre-writing
The pre-writing stage is all about preparation. Take some time to gather your thoughts and organize your main idea. Write a summary first.
Here are important steps to help you deal with the overwhelm of creating an insightful report.
Understand the purpose of your report
Knowing your purpose will help you focus and stay on track throughout the process. Dig into the why of your report through these questions:
- Who is your intended reader? Are you familiar with your audience’s language and how they think?
- What are you trying to achieve with your report? Are you trying to inform, persuade, or recommend a course of action to the reader?
Research your topic
It’s time to gather as much information as you can about your topic. This might involve reading books, articles, and other reports. You might also need to conduct interviews with subject matter experts.
Pro tip on how to write a report : Pick reputable sources like research papers, recently-published books, and case studies by trustworthy authors.
Make a report outline
An outline is a roadmap for your report. It covers your title, introduction, thesis statement, main points, and conclusion. Organizing your thoughts this way will help you keep focus and ensure you cover all the necessary information.

While you can create a report without creating an outline, you could write a better report with an outline. An outline helps you organize your facts and important points on paper.
Stage 2: Writing
Once you have completed the pre-writing stage, it’s time to write your report.
Follow the proper report writing format
You will feel a lot of resistance at this point because this is where most of the tedious work of report writing happens. However, the process can be a breeze if you follow a proper structure and report writing format.
The structure of your report can vary depending on the type of report you’re creating, but the report writing format below can serve as a guide for anyone.
- Title page. This is the first page of your report and should include the report’s title, the author’s name, the date of presentation or submission, and any other relevant information, such as your name or the organization’s name.
- Table of Contents (TOC ). This section contains subsections of your report and their corresponding page numbering. A well-written TOC will help readers navigate your report easily and find the information they need.
- Brief summary . This part provides an overview of the report’s particular purpose, subject, methodology, key findings, and recommendations. This section is often called the executive summary in corporate reports.
- Introduction . The introduction should provide background information about the topic and explain why the report was written. It should also state the aims and objectives of your report and give an overview of the methodology used to gather and analyze the data. Make sure you include a powerful topic sentence.
- Main body. The main body of the report should be divided into subsections, each dealing with a specific aspect of the topic. These sections should be clearly labeled and organized in a logical order. In most reports, this is also the part where you explain and present your findings, analysis, and recommendations.
- Conclusion. Summarize the main points of your report and provide a final summary, thought, or suggestions. Review your thesis statement. The conclusion also includes any limitations of the study and areas for further research or future action.
- References . This section should include a list of all the sources cited in the report, like books, journal articles, websites, and any other sources used to gather information on your subject.
- Appendices . In the appendices section, you should include any additional information relevant to the report but not in the article’s main body. This might consist of raw data, event details, graphs, charts, or tables.
With all these key report elements, your readers can look forward to an informative, well-organized, and easy-to-read report.
Pro tips: Remember to use clear and concise language in your essay. It is also required to follow a specific type of formatting set by your organization or instructor.
Plus, use the active voice when you can because it helps improve clarity. To write a report essay in a passive voice makes it sound less concise.
Reports should usually be written in the third person.
Edit and proofread the article
Once you have completed your first essay draft, take some time to edit and proofread your work. Look for spelling mistakes and grammar errors, as well as any areas where the flow of your article could be improved. Review your topic sentence.
If hiring a professional editor isn’t possible, have a colleague or someone else read your rough draft and provide feedback. You can also use tools like Grammarly and the Hemingway App .
Stage 3: Post-writing
You’re almost there! This stage is about finalizing your report and ensuring it is ready to be shared.
Format your report
Ensure your report is formatted correctly, with clear and easy-to-read fonts, headings, and subheadings.
Incorporate visuals
Adding visuals to your report article is another great way to help your audience understand complex information more easily.
From charts to illustrations, the right visual can help highlight and explain key points, events, trends, and patterns in your data, making it easier for the reader to interpret the information.

Want to check out more templates? Get access to the template gallery today .
However, it’s important to use visuals sparingly and ensure they are relevant and effectively support the texts. You will learn more about effectively incorporating visuals into your report as you scroll down below to the next sections.
Share your report
Once your report is complete, share it with your audience. This might involve submitting it to your boss, presenting it to a group, or sharing it online.
A final note for this section: Remember to take your time, stay organized, and most importantly, have fun! Writing a report can be a rewarding experience, especially if you get positive feedback when you present.
How to add visuals to your report
Adding visuals to your report is more than just putting a graph or chart for every piece of information.
There are no hard and fast rules but use the pointers below as guidelines:
- Each visual in your report should have a purpose. Don’t just add a pie chart or bar graph for the sake of adding one. Your visual of choice should offer clarity to readers that’s impossible to achieve with words alone. Piktochart’s report maker lets you search for free stock images and illustrations to add to any page with drag and drop.
- Add captions, legends, or arrows to your visuals when possible. For more technical reports, graphics are either Tables or Figures. Number them in order of appearance (Figure 1, Figure 2, Table 1, etc.) and give each a descriptive title.
- Place the visual close to the relevant text on the page.
- Document the source of the visual, citing it in both the caption and references section if necessary.
- Make the graphic stand out with colors, borders, boxes, spacing, and frames.

Learn more : How to Improve Your Data Visualization Design in 6 Steps
Write reports like a pro with Piktochart’s easy-to-edit report templates
Creating reports from scratch can be time-consuming. The great news is you don’t have to make reports from scratch like how it used to be in the 90s and early 2000s. Organizations of all shapes and sizes now understand that you can also create the perfect report with the help of templates.
For example, Piktochart offers a variety of fully customizable templates, allowing you to easily add your branding, colors, and text within the online editor. You can visualize your thesis statement and first draft in less than an hour. It’s also possible to start writing directly in the tool, adding graphics page by page.
These templates range from reports for school presentations to sales reports. By editing them, you can create professional-looking reports without the hassle of formatting and design.
Here are some examples of Piktochart’s professionally-designed templates. If you can’t pick one that matches your report writing format and needs, create a free Piktochart account to get access to more templates.
Survey report template
This survey report template includes clear visualizations, making your report findings easier to understand. From customer surveys to employee satisfaction reports, this template is quite versatile.

Research report template
This research report template is perfect for anyone looking to create a thorough and professional research report. The template includes all the necessary sections to help you easily organize your research and present your findings in a concise document.

Corporate report template
Looking for a corporate report template example with an editable table of contents and foreword? This template is the perfect fit!
Whether you’re presenting to investors or sharing information with your team, this corporate report template will help you create a polished and informative executive summary for any corporate organization.

Case study report template
Whether you’re conducting a business case study or an academic case study, this case study report template can help you earn your readers’ trust. This template is specifically designed with fashion as its main theme, but you can edit the photos and details to make it more on-brand with your niche.

Marketing report template
Use this template to create comprehensive marketing reports. The template includes editable sections for social media, data from search engines, email marketing, and paid ads.

Financial report template
With this customizable finance report template, you don’t need to make a financial report from scratch. Once you’ve written your content, save your report in PDF or PNG formats.

Annual report template
This annual report template is the right template for creating a professional and informative executive summary of your organization’s performance over the past year. This template was designed for HR annual reports, but you can also repurpose it for other types of yearly reports.

See more report templates by creating a free Piktochart account .
Quick checklist for better report writing
Before you submit or present your report, use the quick checklist below to help ensure that your report is well-structured, accurate, clear, and properly cited. Most of all, you must ensure that your report meets your audience’s expectations and has all the information and details they need.
Purpose and audience
- Does the report address its purpose and meet the needs of the intended audience?
Structure and organization
- Is the material appropriately arranged in sections?
- Have irrelevant details been removed?
Accuracy and analysis
- Has all the material been checked for accuracy?
- Are graphs and tables clearly labeled? Check the page numbers too.
- Is the data in graphs or tables analyzed and explained in words?
- Does the discussion or conclusion show how the results relate to the objectives mentioned in the introduction?
- Have the results been compared with existing research from the literature survey?
Writing style and clarity
- Is the report written in a tone that’s indicated in the brand style guide (for corporate reports)? Does it avoid colloquialisms or contractions?
- Does it follow the organization’s specific guidelines for writing style?
- Is it jargon-free and clearly written? Have you translated technical terms into simpler words?
- Use the active voice when you can because it helps improve clarity. A written report in a passive voice may make it sound less concise.
Acknowledgment and citation
- Have all ideas and event data taken from or inspired by someone else’s work been acknowledged with a reference?
- Have all illustrations and figures taken from someone else’s work been cited correctly?
Proofreading
- Has the report been carefully proofread for typos, spelling errors, and grammatical mistakes?
Make engaging and effective reports quickly with Piktochart
Writing a report is a must-have skill for anyone looking to communicate more effectively in their personal and professional lives.
With the steps we’ve provided in this guide, anyone can learn how to write a report that is informative, engaging, and comprehensive.
Plus, the free templates we highlighted are valuable for individuals looking to create reports quickly and efficiently. They can also be used to transform a longer report filled with texts into something more engaging and easy to digest.
Sign up for a free Piktochart account today, and look forward to writing reports with its library of modern, customizable report templates.
Piktochart offers professionally designed templates for all your visual communication needs. It is your one-stop shop for presentations , posters , logos , email signatures , infographics , and more. Customize all templates according to your brand assets in seconds. Get started for free today.

Other Posts
10 Best Sales Report Templates for Tracking Revenue, KPIs & Growth

10 Types of HR Reports (With Templates and Examples)

7 Captivating Report Design Ideas And Tips (With Templates and Examples)
How To Write A Presentation 101 | Step-by-Step Guides with Best Examples | 2024 Reveals
Jane Ng • 05 April, 2024 • 11 min read
Is it difficult to start of presentation? You’re standing before a room full of eager listeners, ready to share your knowledge and captivate their attention. But where do you begin? How do you structure your ideas and convey them effectively?
Take a deep breath, and fear not! In this article, we’ll provide a road map on how to write a presentation covering everything from crafting a script to creating an engaging introduction.
So, let’s dive in!
Table of Contents
What is a presentation , what should be in a powerful presentation.
- How To Write A Presentation Script
- How to Write A Presentation Introduction
Key Takeaways
Tips for better presentation.
- How to start a presentation
- How to introduce yourself

Start in seconds.
Get free templates for your next interactive presentation. Sign up for free and take what you want from the template library!
Presentations are all about connecting with your audience.
Presenting is a fantastic way to share information, ideas, or arguments with your audience. Think of it as a structured approach to effectively convey your message. And you’ve got options such as slideshows, speeches, demos, videos, and even multimedia presentations!
The purpose of a presentation can vary depending on the situation and what the presenter wants to achieve.
- In the business world, presentations are commonly used to pitch proposals, share reports, or make sales pitches.
- In educational settings, presentations are a go-to for teaching or delivering engaging lectures.
- For conferences, seminars, and public events—presentations are perfect for dishing out information, inspiring folks, or even persuading the audience.
That sounds brilliant. But, how to write a presentation?

- Clear and Engaging Introduction: Start your presentation with a bang! Hook your audience’s attention right from the beginning by using a captivating story, a surprising fact, a thought-provoking question, or a powerful quote. Clearly state the purpose of your presentation and establish a connection with your listeners.
- Well-Structured Content: Organize your content logically and coherently. Divide your presentation into sections or main points and provide smooth transitions between them. Each section should flow seamlessly into the next, creating a cohesive narrative. Use clear headings and subheadings to guide your audience through the presentation.
- Compelling Visuals: Incorporate visual aids, such as images, graphs, or videos, to enhance your presentation. Make sure your visuals are visually appealing, relevant, and easy to understand. Use a clean and uncluttered design with legible fonts and appropriate color schemes.
- Engaging Delivery: Pay attention to your delivery style and body language. You should maintain eye contact with your audience, use gestures to emphasize key points, and vary your tone of voice to keep the presentation dynamic.
- Clear and Memorable Conclusion: Leave your audience with a lasting impression by providing a strong closing statement, a call to action, or a thought-provoking question. Make sure your conclusion ties back to your introduction and reinforces the core message of your presentation.

How To Write A Presentation Script (With Examples)
To successfully convey your message to your audience, you must carefully craft and organize your presentation script. Here are steps on how to write a presentation script:
1/ Understand Your Purpose and Audience
- Clarify the purpose of your presentation. Are you informing, persuading, or entertaining?
- Identify your target audience and their knowledge level, interests, and expectations.
- Define what presentation format you want to use
2/ Outline the Structure of Your Presentation
Strong opening.
Start with an engaging opening that grabs the audience’s attention and introduces your topic. Some types of openings you can use are:
- Start with a Thought-Provoking Question: “Have you ever…?”
- Begin with a Surprising Fact or Statistic: “Did you know that….?”
- Use a Powerful Quote: “As Maya Angelou once said,….”
- Tell a Compelling Story : “Picture this: You’re standing at….”
- Start with a Bold Statement: “In the fast-paced digital age….”
Main Points
Clearly state your main points or key ideas that you will discuss throughout the presentation.
- Clearly State the Purpose and Main Points: Example: “In this presentation, we will delve into three key areas. First,… Next,… Finally,…. we’ll discuss….”
- Provide Background and Context: Example: “Before we dive into the details, let’s understand the basics of…..”
- Present Supporting Information and Examples: Example: “To illustrate…., let’s look at an example. In,…..”
- Address Counterarguments or Potential Concerns: Example: “While…, we must also consider… .”
- Recap Key Points and Transition to the Next Section: Example: “To summarize, we’ve… Now, let’s shift our focus to…”
Remember to organize your content logically and coherently, ensuring smooth transitions between sections.
You can conclude with a strong closing statement summarizing your main points and leaving a lasting impression. Example: “As we conclude our presentation, it’s clear that… By…., we can….”
3/ Craft Clear and Concise Sentences
Once you’ve outlined your presentation, you need to edit your sentences. Use clear and straightforward language to ensure your message is easily understood.
Alternatively, you can break down complex ideas into simpler concepts and provide clear explanations or examples to aid comprehension.
4/ Use Visual Aids and Supporting Materials
Use supporting materials such as statistics, research findings, or real-life examples to back up your points and make them more compelling.
- Example: “As you can see from this graph,… This demonstrates….”
5/ Include Engagement Techniques
Incorporate interactive elements to engage your audience, such as Q&A sessions , conducting live polls, or encouraging participation. You can also spin more funs into group, by randomly dividing people into different groups to get more diverse feedbacks!
6/ Rehearse and Revise
- Practice delivering your presentation script to familiarize yourself with the content and improve your delivery.
- Revise and edit your script as needed, removing any unnecessary information or repetitions.
7/ Seek Feedback
You can share your script or deliver a practice presentation to a trusted friend, colleague, or mentor to gather feedback on your script and make adjustments accordingly.
More on Script Presentation

How to Write A Presentation Introduction with Examples
How to write presentations that are engaging and visually appealing? Looking for introduction ideas for the presentation? As mentioned earlier, once you have completed your script, it’s crucial to focus on editing and refining the most critical element—the opening of your presentation – the section that determines whether you can captivate and retain your audience’s attention right from the start.
Here is a guide on how to craft an opening that grabs your audience’s attention from the very first minute:
1/ Start with a Hook
To begin, you can choose from five different openings mentioned in the script based on your desired purpose and content. Alternatively, you can opt for the approach that resonates with you the most, and instills your confidence. Remember, the key is to choose a starting point that aligns with your objectives and allows you to deliver your message effectively.
2/ Establish Relevance and Context
Then you should establish the topic of your presentation and explain why it is important or relevant to your audience. Connect the topic to their interests, challenges, or aspirations to create a sense of relevance.
3/ State the Purpose
Clearly articulate the purpose or goal of your presentation. Let the audience know what they can expect to gain or achieve by listening to your presentation.
4/ Preview Your Main Points
Give a brief overview of the main points or sections you will cover in your presentation. It helps the audience understand the structure and flow of your presentation and creates anticipation.
5/ Establish Credibility
Share your expertise or credentials related to the topic to build trust with the audience, such as a brief personal story, relevant experience, or mentioning your professional background.
6/ Engage Emotionally
Connect emotional levels with your audience by appealing to their aspirations, fears, desires, or values. They help create a deeper connection and engagement from the very beginning.
Make sure your introduction is concise and to the point. Avoid unnecessary details or lengthy explanations. Aim for clarity and brevity to maintain the audience’s attention.
For example, Topic: Work-life balance
“Good morning, everyone! Can you imagine waking up each day feeling energized and ready to conquer both your personal and professional pursuits? Well, that’s exactly what we’ll explore today – the wonderful world of work-life balance. In a fast-paced society where work seems to consume every waking hour, it’s vital to find that spot where our careers and personal lives harmoniously coexist. Throughout this presentation, we’ll dive into practical strategies that help us achieve that coveted balance, boost productivity, and nurture our overall well-being.
But before we dive in, let me share a bit about my journey. As a working professional and a passionate advocate for work-life balance, I have spent years researching and implementing strategies that have transformed my own life. I am excited to share my knowledge and experiences with all of you today, with the hope of inspiring positive change and creating a more fulfilling work-life balance for everyone in this room. So, let’s get started!”
🎉 Check out: How to Start a Presentation?

Whether you’re a seasoned speaker or new to the stage, understanding how to write a presentation that conveys your message effectively is a valuable skill. By following the steps in this guide, you can become a captivating presenter and make your mark in every presentation you deliver.
Additionally, AhaSlides can significantly enhance your presentation’s impact. With AhaSlides, you can use live polls , quizzes , and word cloud to turn your presentation into an engaging and interactive experience. Let’s take a moment to explore our vast template library !
Frequently Asked Questions
How to write a presentation step by step .
You can refer to our step-by-step guide on How To Write A Presentation Script: Understand Your Purpose and Audience Outline the Structure of Your Presentation Craft Clear and Concise Sentences Use Visual Aids and Supporting Material Include Engagement Techniques Rehearse and Revise Seek Feedback
How do you start a presentation?
You can start with an engaging opening that grabs the audience’s attention and introduces your topic. Consider using one of the following approaches: Start with a Thought-Provoking Question: “Have you ever…?” Begin with a Surprising Fact or Statistic: “Did you know that….?” Use a Powerful Quote: “As Maya Angelou once said,….” Tell a Compelling Story : “Picture this: You’re standing at….” Start with a Bold Statement: “In the fast-paced digital age….”
What are the five parts of a presentation?
When it comes to presentation writing, a typical presentation consists of the following five parts: Introduction: Capturing the audience’s attention, introducing yourself, stating the purpose, and providing an overview. Main Body: Presenting main points, evidence, examples, and arguments. Visual Aids: Using visuals to enhance understanding and engage the audience. Conclusion: Summarizing main points, restating key message, and leaving a memorable takeaway or call to action. Q&A or Discussion: Optional part for addressing questions and encouraging audience participation.

A writer who wants to create practical and valuable content for the audience
Tips to Engage with Polls & Trivia
More from AhaSlides

How to make a great presentation
Stressed about an upcoming presentation? These talks are full of helpful tips on how to get up in front of an audience and make a lasting impression.

The secret structure of great talks

The beauty of data visualization

TED's secret to great public speaking

How to speak so that people want to listen

How great leaders inspire action

How it works
Transform your enterprise with the scalable mindsets, skills, & behavior change that drive performance.
Explore how BetterUp connects to your core business systems.
We pair AI with the latest in human-centered coaching to drive powerful, lasting learning and behavior change.
Build leaders that accelerate team performance and engagement.
Unlock performance potential at scale with AI-powered curated growth journeys.
Build resilience, well-being and agility to drive performance across your entire enterprise.
Transform your business, starting with your sales leaders.
Unlock business impact from the top with executive coaching.
Foster a culture of inclusion and belonging.
Accelerate the performance and potential of your agencies and employees.
See how innovative organizations use BetterUp to build a thriving workforce.
Discover how BetterUp measurably impacts key business outcomes for organizations like yours.
A demo is the first step to transforming your business. Meet with us to develop a plan for attaining your goals.

- What is coaching?
Learn how 1:1 coaching works, who its for, and if it's right for you.
Accelerate your personal and professional growth with the expert guidance of a BetterUp Coach.
Types of Coaching
Navigate career transitions, accelerate your professional growth, and achieve your career goals with expert coaching.
Enhance your communication skills for better personal and professional relationships, with tailored coaching that focuses on your needs.
Find balance, resilience, and well-being in all areas of your life with holistic coaching designed to empower you.
Discover your perfect match : Take our 5-minute assessment and let us pair you with one of our top Coaches tailored just for you.

Research, expert insights, and resources to develop courageous leaders within your organization.
Best practices, research, and tools to fuel individual and business growth.
View on-demand BetterUp events and learn about upcoming live discussions.
The latest insights and ideas for building a high-performing workplace.
- BetterUp Briefing
The online magazine that helps you understand tomorrow's workforce trends, today.
Innovative research featured in peer-reviewed journals, press, and more.
Founded in 2022 to deepen the understanding of the intersection of well-being, purpose, and performance
We're on a mission to help everyone live with clarity, purpose, and passion.
Join us and create impactful change.
Read the buzz about BetterUp.
Meet the leadership that's passionate about empowering your workforce.
For Business
For Individuals
How to give a good presentation that captivates any audience

Jump to section
What are the main difficulties when giving presentations?
How to create an effective presentation, after that, how do i give a memorable presentation, how to connect with the audience when presenting.
If you’ve ever heard someone give a powerful presentation, you probably remember how it made you feel. Much like a composer, a good speaker knows precisely when each note should strike to captivate their audience’s attention and leave them with a lasting impression.
No one becomes a great public speaker or presenter without practice. And almost everyone can recall a time one of their presentations went badly — that’s a painful part of the learning process.
Whether you’re working within a small creative team or a large organization, public speaking and presentation skills are vital to communicating your ideas. Knowing how to present your vision can help you pitch concepts to clients, present ideas to your team, and develop the confidence to participate in team meetings.
If you have an upcoming presentation on the horizon and feel nervous, that’s normal. Around 15-30% of the general population experience a fear of public speaking . And, unfortunately, social anxiety is on the rise, with a 12% increase in adults over the last 20 years .
Learning how to give a good presentation can dismantle your fears and break down these barriers, ensuring you’re ready to confidently share your point of view.
It’s the week before your presentation, and you’re already feeling nervous . Maybe there’ll be an important mentor in the room you need to impress, or you’re looking for an opportunity to show your boss your value. Regardless of your countless past presentations, you still feel nervous.
Sharing your vision and ideas with any sized group is intimidating. You’re likely worrying about how you’ll perform as a presenter and whether the audience will be interested in what you offer. But nerves aren’t inherently negative — you can actually use this feeling to fuel your preparation.

It’s helpful to identify where your worries are coming from and address your fears. Here are some common concerns when preparing for an upcoming presentation:
Fear of public speaking: When you share your ideas in front of a group, you’re placing yourself in a vulnerable position to be critiqued on your knowledge and communication skills . Maybe you feel confident in your content, but when you think about standing in front of an audience, you feel anxious and your mind goes blank.
It’s also not uncommon to have physical symptoms when presenting . Some people experience nausea and dizziness as the brain releases adrenaline to cope with the potentially stressful situation . Remember to take deep breaths to recenter yourself and be patient, even if you make a mistake.
Losing the audience’s attention: As a presenter, your main focus is to keep your audience engaged. They should feel like they’re learning valuable information or following a story that will improve them in life or business.
Highlight the most exciting pieces of knowledge and ensure you emphasize those points in your presentation. If you feel passionate about your content, it’s more likely that your audience will experience this excitement for themselves and become invested in what you have to say.
Not knowing what content to place on presentation slides: Overloading presentation slides is a fast way to lose your audience’s attention. Your slides should contain only the main talking points and limited text to ensure your audience focuses on what you have to say rather than becoming distracted by the content on your slides.
Discomfort incorporating nonverbal communication: It’s natural to feel stiff and frozen when you’re nervous. But maintaining effective body language helps your audience stay focused on you as you speak and encourages you to relax.
If you struggle to incorporate body language into your presentations, try starting small by making hand gestures toward your slides. If you’re working with a large audience, use different parts of the stage to ensure everyone feels included.
Each presenter has their own personal brand and style. Some may use humor to break the ice, while others might appeal to the audience’s emotional side through inspiring storytelling.
Watching online presentations, such as TED talks, is an excellent way to expose yourself to various presentation styles and develop your own. While observing others, you can note how they carry themselves on stage and learn new ways to keep your audience engaged.
Once you’ve addressed what’s causing your fears, it’s time to prepare for a great presentation. Use your past experience as inspiration and aim to outshine your former self by learning from your mistakes and employing new techniques. Here are five presentation tips to help you create a strong presentation and wow your audience:
1. Keep it simple
Simple means something different to everyone.
Before creating your presentation, take note of your intended audience and their knowledge level of your subject. You’ll want your content to be easy for your intended audience to follow.
Say you’re giving a presentation on improving your company’s operational structure. Entry-level workers will likely need a more straightforward overview of the content than C-suite leaders, who have significantly more experience.
Ask yourself what you want your audience to take away from your presentation and emphasize those important points. Doing this ensures they remember the most vital information rather than less important supporting ideas. Try organizing these concepts into bullet points so viewers can quickly identify critical takeaways.
2. Create a compelling structure
Put yourself in your audience member’s shoes and determine the most compelling way to organize your information. Your presentation should be articulate , cohesive, and logical, and you must be sure to include all necessary supporting evidence to strengthen your main points.
If you give away all of your answers too quickly, your audience could lose interest. And if there isn’t enough supporting information, they could hit a roadblock of confusion. Try developing a compelling story that leads your audience through your thought processes so they can experience the ups and downs alongside you.
By structuring your presentation to lead up to a final conclusion, you’re more likely to keep listeners’ attention. Once you’ve reached that conclusion, you can offer a Q&A period to put any of their questions or concerns to rest.
3. Use visual aids
Appealing to various learning styles is a great way to keep everyone on the same page and ensure they absorb your content. Visual aids are necessary for visual learners and make it easier for people to picture your ideas.
Aim to incorporate a mixture of photos, videos, and props to engage your audience and convey your key points. For instance, if you’re giving a presentation on anthropology subject matter, you could show your audience an artifact to help them understand how exciting a discovery must have been.
If your presentation is long, including a video for your audience to watch is an excellent way to give yourself a break and create new jumping-off points for your speech.
4. Be aware of design techniques and trends
Thanks to cutting-edge technology and tools, you have numerous platforms at your disposal to create a good presentation. But keep in mind that although color, images, and graphics liven things up, they can cause distraction when misused.
Here are a few standard pointers for incorporating visuals on your slides:
- Don’t place blocks of small text on a single slide
- Use a minimalistic background instead of a busy one
- Ensure text stands out against the background color
- Only use high-resolution photos
- Maintain a consistent font style and size throughout the presentation
- Don’t overuse transitions and effects
5. Try the 10-20-30 rule
Guy Kawasaki, a prominent venture capitalist and one of the original marketing specialists for Apple, said that the best slideshow presentations are less than 10 slides , last at most 20 minutes, and use a font size of 30. Following this strategy can help you condense your information, eliminate unnecessary ideas, and maintain your audience’s focus more efficiently.
Once you’re confident in creating a memorable presentation, it’s time to learn how to give one. Here are some valuable tips for keeping your audience invested during your talk:
Tip #1: Tell stories
Sharing an anecdote from your life can improve your credibility and increase your relatability. And when an audience relates to you, they’re more likely to feel connected to who you are as a person and encouraged to give you their full attention, as they would want others to do the same.
Gill Hicks utilized this strategy well when she shared her powerful story, “ I survived a terrorist attack. Here’s what I learned .” In her harrowing tale, Hicks highlights the importance of compassion, unconditional love, and helping those in need.
If you feel uncomfortable sharing personal stories, that’s okay. You can use examples from famous individuals or create a fictional account to demonstrate your ideas.
Tip #2: Make eye contact with the audience
Maintaining eye contact is less intimidating than it sounds. In fact, you don’t have to look your audience members directly in their eyes — you can focus on their foreheads or noses if that’s easier.
Try making eye contact with as many people as possible for 3–5 seconds each. This timing ensures you don’t look away too quickly, making the audience member feel unimportant, or linger too long, making them feel uncomfortable.
If you’re presenting to a large group, direct your focus to each part of the room to ensure no section of the audience feels ignored.

Tip #3: Work on your stage presence
Although your tone and words are the most impactful part of your presentation, recall that body language keeps your audience engaged. Use these tips to master a professional stage presence:
- Speak with open arms and avoid crossing them
- Keep a reasonable pace and try not to stand still
- Use hand gestures to highlight important information
Tip #4: Start strong
Like watching a movie trailer, the first seconds of your talk are critical for capturing your audience’s attention. How you start your speech sets the tone for the rest of your presentation and tells your audience whether or not they should pay attention. Here are some ways to start your presentation to leave a lasting impression:
- Use a quote from a well-known and likable influential person
- Ask a rhetorical question to create intrigue
- Start with an anecdote to add context to your talk
- Spark your audience’s curiosity by involving them in an interactive problem-solving puzzle or riddle
Tip #5: Show your passion
Don’t be afraid of being too enthusiastic. Everyone appreciates a speaker who’s genuinely excited about their field of expertise.
In “ Grit: The Power of Passion and Perseverance ,” Angela Lee Duckworth discusses the importance of passion in research and delivery. She delivers her presentation excitedly to show the audience how excitement piques interest.
Tip #6: Plan your delivery
How you decide to deliver your speech will shape your presentation. Will you be preparing a PowerPoint presentation and using a teleprompter? Or are you working within the constraints of the digital world and presenting over Zoom?
The best presentations are conducted by speakers who know their stuff and memorize their content. However, if you find this challenging, try creating notes to use as a safety net in case you lose track.
If you’re presenting online, you can keep notes beside your computer for each slide, highlighting your key points. This ensures you include all the necessary information and follow a logical order.

Tip #7: Practice
Practice doesn’t make perfect — it makes progress. There’s no way of preparing for unforeseen circumstances, but thorough practice means you’ve done everything you can to succeed.
Rehearse your speech in front of a mirror or to a trusted friend or family member. Take any feedback and use it as an opportunity to fine-tune your speech. But remember: who you practice your presentation in front of may differ from your intended audience. Consider their opinions through the lens of them occupying this different position.
Tip #8: Read the room
Whether you’re a keynote speaker at an event or presenting to a small group of clients, knowing how to read the room is vital for keeping your audience happy. Stay flexible and be willing to move on from topics quickly if your listeners are uninterested or displeased with a particular part of your speech.
Tip #9: Breathe
Try taking deep breaths before your presentation to calm your nerves. If you feel rushed, you’re more likely to feel nervous and stumble on your words.
The most important thing to consider when presenting is your audience’s feelings. When you approach your next presentation calmly, you’ll put your audience at ease and encourage them to feel comfortable in your presence.
Tip #10: Provide a call-to-action
When you end your presentation, your audience should feel compelled to take a specific action, whether that’s changing their habits or contacting you for your services.
If you’re presenting to clients, create a handout with key points and contact information so they can get in touch. You should provide your LinkedIn information, email address, and phone number so they have a variety of ways to reach you.
There’s no one-size-fits-all template for an effective presentation, as your unique audience and subject matter play a role in shaping your speech. As a general rule, though, you should aim to connect with your audience through passion and excitement. Use strong eye contact and body language. Capture their interest through storytelling and their trust through relatability.
Learning how to give a good presentation can feel overwhelming — but remember, practice makes progress. Rehearse your presentation for someone you trust, collect their feedback , and revise. Practicing your presentation skills is helpful for any job, and every challenge is a chance to grow.
Enhance your presentation skills
Discover coaching that transforms your public speaking and boosts your confidence in presenting.
Elizabeth Perry, ACC
Elizabeth Perry is a Coach Community Manager at BetterUp. She uses strategic engagement strategies to cultivate a learning community across a global network of Coaches through in-person and virtual experiences, technology-enabled platforms, and strategic coaching industry partnerships. With over 3 years of coaching experience and a certification in transformative leadership and life coaching from Sofia University, Elizabeth leverages transpersonal psychology expertise to help coaches and clients gain awareness of their behavioral and thought patterns, discover their purpose and passions, and elevate their potential. She is a lifelong student of psychology, personal growth, and human potential as well as an ICF-certified ACC transpersonal life and leadership Coach.
6 presentation skills and how to improve them
How to make a presentation interactive and exciting, 3 stand-out professional bio examples to inspire your own, tell a story they can't ignore these 10 tips will teach you how, how to write a speech that your audience remembers, reading the room gives you an edge — no matter who you're talking to, writing an elevator pitch about yourself: a how-to plus tips, 18 effective strategies to improve your communication skills, your guide to what storytelling is and how to be a good storyteller, similar articles, how to pitch ideas: 8 tips to captivate any audience, the 11 tips that will improve your public speaking skills, 30 presentation feedback examples, fear of public speaking overcome it with these 7 tips, how to not be nervous for a presentation — 13 tips that work (really), stay connected with betterup, get our newsletter, event invites, plus product insights and research..
3100 E 5th Street, Suite 350 Austin, TX 78702
- Platform Overview
- Integrations
- Powered by AI
- BetterUp Lead™
- BetterUp Manage™
- BetterUp Care®
- Sales Performance
- Diversity & Inclusion
- Case Studies
- Why BetterUp?
- About Coaching
- Find your Coach
- Career Coaching
- Communication Coaching
- Life Coaching
- News and Press
- Leadership Team
- Become a BetterUp Coach
- BetterUp Labs
- Center for Purpose & Performance
- Leadership Training
- Business Coaching
- Contact Support
- Contact Sales
- Privacy Policy
- Acceptable Use Policy
- Trust & Security
- Cookie Preferences
How to create attractive, informative report presentations
Got a big presentation coming up? These resources will help you refine and polish your report presentation for both internal and external audiences.
Get started growing your business with a B12 website.

7 Ways to Structure Your Presentation to Keep Your Audience Wanting More
- "This TED talk by David McCandless about the The Beauty of Data Visualization is a perfect example of the Fact and Story structure."
- "A presentation that follows this structure could turn out to be quite short, if only the facts are presented, but that would leave the audience feeling like “is that it?” Adding an interesting story to help the audience relate makes the overall presentation more effective."
- "This TED talk by Adam Galinsky about how to speak up for yourself is a perfect example of the Situation — Opportunity — Resolution presentation structure."
- "The presentation ends with an inspiring quote by the speaker’s father which leaves the audience feeling like they will know exactly when it’s the perfect time to speak up, or not."
- "Now that we’ve looked at the seven different ways that you can structure your presentation with storytelling techniques, it’s time to make a storyboard."
How to make an information report and presentation
Transcript: Hello everybody this is Joel from medium magpie Kirpal and today i'm going to talk to you about how to make an information report and presentation so these days are reports and presentations are very common business communication they are used for office proposals they're also used in a different format for academic reasons that academic presentations academic reports doing presentations is good practice for formal speaking and and writing reports is good for your writing practice any kind of public speaking is good practice as well if you're studying another language it's good to build your confidence and even if you're a native speaker public speaking is good for building your confidence and ability to interact socially with other people and this sort of speaking exercise of doing a presentation is good to practice your pronunciation pace pause and tone I will before I go into this topic I will make a note though that there are many different kinds of reports so something there's like a police report or a medical report which is basically giving a report about something that happened and you might need to do that if you're working in childcare and there's an accident... See more →
10 Tips For Creating Effective Business Reports - Marketing And Growth Hacking
- "Nevertheless, there are several factors that are worth considering in the process of preparing a persuasive presentation of your accomplishments: 1)the recipients will be more and longer focused on you and your report if it is designed perfectly; 2) the information is accepted and processed faster if it has been structured and looks great 3) you have to structure the data properly, think about the suitable type of chart for this data."
- "Use Easy-To-Understand Visualization Typically we prepare business reports to view and summarize some data obtained in the process of work."
- "Opt for Business Infographic Presentation PowerPoint Template! Pay Attention to Color Palette In most cases colors are used to highlight the information presented in table rows or charts."
- "For instance, if you use various pictures throughout your presentation, it is better to opt for a solid color background."
- "In any case, the issue with the background can be solved easily with our Business Infographic — PowerPoint Template."
- "Or you may save your time and just use Amazing Tables & Dates — PowerPoint Template for your business report."
How to give the BEST PowerPoint presentation!
Transcript: Do you have to makepresentations? Do you hate presentations?I like presentations, but one thing that you are probably maybe goodat with presentations are making PowerPoint presentations, because you have visual aidsto help you so you don't really have to talk as much, if you're nervous about talking.Presentation skills is something that you can work on. We have videos on www.engvid.comto help you with presentation skills. So, go and check those out for learninghow to speak during presentations. But what we're going to focus on today isthe visual aspect of presentations, so your PowerPoint things. Some things to do, and somethings not to do. So, here we are, presentation skills. The first thing and one of the thingsthat makes these presentations so fun are pictures. But we have to be careful. The templatesthat you have already included in your presentation software, they're boring. People use them allthe time. So, I suggest you try and download some other pictures to make your presentationmore interesting. And with that, make sure that on one slide you have one image.Make it interesting. Do not have a split screen. So, don't have twoimages on one slide. Do not have a collage, that's insane. A collage is... See more →
How to create a better research poster in less time (including templates) — #betterposter PART 1
Transcript: Every year, at hotels all over the world,scientists from every field in science flock to these giant academic conferences. They're like WOODSTOCK for geeks in that field. Scientists go to these conferences to learn about the new research going on in their field, and to share the work they're doing with everybody else. And to drink and hang out with friends from other universities who they don't get to see very often. So it's like a big, social knowledge update for the whole field. And at most all of these conferences there's something called a poster session. And poster sessions are where researchers share findings that didn't fit into bigger sessions or bigger presentations. Scientists take some new research finding some new truth about the world... ...and they try to explain it on this giant poster. These poster sessions are one of the main ways that scientists share knowledge with each other. And they have the potential to bethis really great experience... ...for both the person presenting the poster, and the person walking around looking at all the posters. But in reality scientists havemixed feelings about poster sessions. A lot of us go into poster sessionsfeeling like, kind of optimistic,... See more →
The Best Annual Report Presentation Templates For Your Boss’ Admiration
- "To make your data look juicy you can choose bright colors, creative elements, and high-quality graphics."
- "Shaping your business achievements into a single presentation that will impress the audience may take a lot of time."
- "Annual Report template includes all the unique slides you may need to create a compelling presentation."
- "The strict color scheme makes every slide look professional and a mass of infographics is pretty clear and understandable."
- "If you want to present your business to a partner or a client — you need this template."
- "It has all the slides you could use to impress the audience and make it understand you are worth working with."
How to Make an Infographic on Google Slides Using a Template
- "In this article, we are going to learn how to make an infographic on Google Slides using a template."
- "I recommend that you check out TemplateMonster’s Google Slides Themes or Infographic elements."
- "But after you’ve done that, you need to upload it into Google Slides."
- "So now is exactly the time to upload your template into this blank presentation."
- "At this point, you can choose what slides you want to include in your infographic."
- "As I have a template, I don’t need this first blank slide, so I’m deleting it."
How to Write a Company Profile: the first company presentation you should design
Transcript: Most small businesses don't spend time buildinga company profile template... until they need it. While these profiles are sometimes designedas a one-pager document or even an infographic, we continue to defend that the slide presentationformat is probably the best. The challenge with one-pagers and infographicsis that once built, adding or removing information is complicated. With a presentation, on the other hand, youcan add, or hide slides to be able to tailor the company to whoever is receiving it. When we initially designed these slides, wecalled them 'Public Company Intro Template,' since they were meant to be a sort of publicinvestor deck that the companies could embed on their websites (we still think that's agood idea, BTW). Depending on the type of website your companyhas, a company intro in presentation form might be a good way to get people engagedin what to do. All Slidebean presentations are embeddable,all you need to do is copy a code snippet and the frame will automatically adapt to the width of yoursite and the device where it's been loaded. Still, we've revamped the deck to be morefitting for a short company profile that could be shared as a standalone presentation, orincluded as an introduction to... See more →
10 tips on how to make slides that communicate your idea, from TED’s in-house expert
- "At TED2014, David Epstein created a clean, informative slide deck to support his talk on the changing bodies of athletes."
- "Photo: James Duncan Davidson/TED Aaron Weyenberg is the master of slide decks."
- "Our UX Lead creates Keynote presentations that are both slick and charming — the kind that pull you in and keep you captivated, but in an understated way that helps you focus on what’s actually being said."
- "Here, 10 tips for making an effective slide deck, split into two parts: the big, overarching goals, and the little tips and tricks that make your presentation sing."
- "Aaron used this image of a New Zealand disaster to kick off a slide deck from TED’s tech team — all about how they prepares for worst-case scenarios."
- "The big picture… Here, a lovely image from a slidedeck Aaron created about the redesign of TED.com."
What customers & experts say

“B12’s AI draft dramatically reduces my time traditionally spent working on content structure. As a B12 web expert, I can focus more time on creating a beautiful website and UX that fits the customer’s content and goals.”

“I like that someone is monitoring my website every month and making suggestions for how to improve it.”

“I think it's great that B12 is watching out for me. I'm reminded to update my website and I get ideas. I like that I'm not in it alone.”

“The B12 website editor is so simple to use. I added a bunch of images, reworked text, linked my products, adjusted form links, and even got an animation flying around my footer. The experience with B12 has been amazing. Building a quality website is now fast and affordable.”

“I was always intimidated by my perceived difficulty of building a website but my experience with B12 was pretty smooth. I especially appreciate the quick response time to any requests I’ve sent the B12 team, and I also like the flexibility and ability to design the website ourselves. Since building my website, I’ve received a significant increase in the number of page views and email requests from the page.”

“Designing a website in just a couple of hours is actually possible. Thanks to B12's simple-to-use website editor, I'm able to create professional designs that would normally cost thousands of dollars.”

“B12 was able to give us the flexibility we needed to play around with website elements while guiding us in our first attempt at building a website.”

“B12's goal is to provide the best customer experiences and I am so happy to be a part of that mission. Helping customers create a website that brings their vision to life is, by far, the best part of being here.”

“B12 is amazing! You get a high-quality design for the price of DIY. It's really remarkable.”

“The value of the B12 website was there from the very start. I noticed more traffic coming in immediately, which is hugely important for me. Knowing that B12’s tools are constantly optimizing my website for search engines offers me peace of mind. It helps me focus on running my business instead of trying to figure out how to run a website.”

“My B12 website looks great, I am truly satisfied with the outcome. I love the responsiveness of our new website, plus it's incredibly light and fast. The team did an incredible job with the styles and the designs really popped for me.”

“What I appreciate most about B12 is its user-friendly interface. Not only do they build websites that look modern and great, but they’re also incredibly easy to manage and update. Whenever I have information that needs changing on my website, I can do it easily on my own.”

“It was such a pleasure to work with B12. Their technology made the web design process easy and the B12 team helped us launch a website we love! We're proud to be an investor and a client.”

“We pride ourselves on excellent customer service. I love how customer-centric we are, and the technology we use to speed up the website creation process has helped us to deliver professional sites in a shorter span of time.”

“B12 has positively impacted my business with its wide variety of integrations, such as the bookings integration! I’ve been getting more emails from potential customers who are able to book online and schedule consultations with me easily. I’m not tech savvy, so if you’re like me, having a company like B12 to work with is incredibly helpful.”
Ready to grow your business online?
Join the tens of thousands of professionals who’ve found success with a B12 website, SEO, blogging, and more!
Home Blog Presentation Ideas How to Create and Deliver a Research Presentation
How to Create and Deliver a Research Presentation

Every research endeavor ends up with the communication of its findings. Graduate-level research culminates in a thesis defense , while many academic and scientific disciplines are published in peer-reviewed journals. In a business context, PowerPoint research presentation is the default format for reporting the findings to stakeholders.
Condensing months of work into a few slides can prove to be challenging. It requires particular skills to create and deliver a research presentation that promotes informed decisions and drives long-term projects forward.
Table of Contents
What is a Research Presentation
Key slides for creating a research presentation, tips when delivering a research presentation, how to present sources in a research presentation, recommended templates to create a research presentation.
A research presentation is the communication of research findings, typically delivered to an audience of peers, colleagues, students, or professionals. In the academe, it is meant to showcase the importance of the research paper , state the findings and the analysis of those findings, and seek feedback that could further the research.
The presentation of research becomes even more critical in the business world as the insights derived from it are the basis of strategic decisions of organizations. Information from this type of report can aid companies in maximizing the sales and profit of their business. Major projects such as research and development (R&D) in a new field, the launch of a new product or service, or even corporate social responsibility (CSR) initiatives will require the presentation of research findings to prove their feasibility.
Market research and technical research are examples of business-type research presentations you will commonly encounter.
In this article, we’ve compiled all the essential tips, including some examples and templates, to get you started with creating and delivering a stellar research presentation tailored specifically for the business context.
Various research suggests that the average attention span of adults during presentations is around 20 minutes, with a notable drop in an engagement at the 10-minute mark . Beyond that, you might see your audience doing other things.
How can you avoid such a mistake? The answer lies in the adage “keep it simple, stupid” or KISS. We don’t mean dumbing down your content but rather presenting it in a way that is easily digestible and accessible to your audience. One way you can do this is by organizing your research presentation using a clear structure.
Here are the slides you should prioritize when creating your research presentation PowerPoint.
1. Title Page
The title page is the first thing your audience will see during your presentation, so put extra effort into it to make an impression. Of course, writing presentation titles and title pages will vary depending on the type of presentation you are to deliver. In the case of a research presentation, you want a formal and academic-sounding one. It should include:
- The full title of the report
- The date of the report
- The name of the researchers or department in charge of the report
- The name of the organization for which the presentation is intended
When writing the title of your research presentation, it should reflect the topic and objective of the report. Focus only on the subject and avoid adding redundant phrases like “A research on” or “A study on.” However, you may use phrases like “Market Analysis” or “Feasibility Study” because they help identify the purpose of the presentation. Doing so also serves a long-term purpose for the filing and later retrieving of the document.
Here’s a sample title page for a hypothetical market research presentation from Gillette .

2. Executive Summary Slide
The executive summary marks the beginning of the body of the presentation, briefly summarizing the key discussion points of the research. Specifically, the summary may state the following:
- The purpose of the investigation and its significance within the organization’s goals
- The methods used for the investigation
- The major findings of the investigation
- The conclusions and recommendations after the investigation
Although the executive summary encompasses the entry of the research presentation, it should not dive into all the details of the work on which the findings, conclusions, and recommendations were based. Creating the executive summary requires a focus on clarity and brevity, especially when translating it to a PowerPoint document where space is limited.
Each point should be presented in a clear and visually engaging manner to capture the audience’s attention and set the stage for the rest of the presentation. Use visuals, bullet points, and minimal text to convey information efficiently.

3. Introduction/ Project Description Slides
In this section, your goal is to provide your audience with the information that will help them understand the details of the presentation. Provide a detailed description of the project, including its goals, objectives, scope, and methods for gathering and analyzing data.
You want to answer these fundamental questions:
- What specific questions are you trying to answer, problems you aim to solve, or opportunities you seek to explore?
- Why is this project important, and what prompted it?
- What are the boundaries of your research or initiative?
- How were the data gathered?
Important: The introduction should exclude specific findings, conclusions, and recommendations.

4. Data Presentation and Analyses Slides
This is the longest section of a research presentation, as you’ll present the data you’ve gathered and provide a thorough analysis of that data to draw meaningful conclusions. The format and components of this section can vary widely, tailored to the specific nature of your research.
For example, if you are doing market research, you may include the market potential estimate, competitor analysis, and pricing analysis. These elements will help your organization determine the actual viability of a market opportunity.
Visual aids like charts, graphs, tables, and diagrams are potent tools to convey your key findings effectively. These materials may be numbered and sequenced (Figure 1, Figure 2, and so forth), accompanied by text to make sense of the insights.

5. Conclusions
The conclusion of a research presentation is where you pull together the ideas derived from your data presentation and analyses in light of the purpose of the research. For example, if the objective is to assess the market of a new product, the conclusion should determine the requirements of the market in question and tell whether there is a product-market fit.
Designing your conclusion slide should be straightforward and focused on conveying the key takeaways from your research. Keep the text concise and to the point. Present it in bullet points or numbered lists to make the content easily scannable.

6. Recommendations
The findings of your research might reveal elements that may not align with your initial vision or expectations. These deviations are addressed in the recommendations section of your presentation, which outlines the best course of action based on the result of the research.
What emerging markets should we target next? Do we need to rethink our pricing strategies? Which professionals should we hire for this special project? — these are some of the questions that may arise when coming up with this part of the research.
Recommendations may be combined with the conclusion, but presenting them separately to reinforce their urgency. In the end, the decision-makers in the organization or your clients will make the final call on whether to accept or decline the recommendations.

7. Questions Slide
Members of your audience are not involved in carrying out your research activity, which means there’s a lot they don’t know about its details. By offering an opportunity for questions, you can invite them to bridge that gap, seek clarification, and engage in a dialogue that enhances their understanding.
If your research is more business-oriented, facilitating a question and answer after your presentation becomes imperative as it’s your final appeal to encourage buy-in for your recommendations.
A simple “Ask us anything” slide can indicate that you are ready to accept questions.
1. Focus on the Most Important Findings
The truth about presenting research findings is that your audience doesn’t need to know everything. Instead, they should receive a distilled, clear, and meaningful overview that focuses on the most critical aspects.
You will likely have to squeeze in the oral presentation of your research into a 10 to 20-minute presentation, so you have to make the most out of the time given to you. In the presentation, don’t soak in the less important elements like historical backgrounds. Decision-makers might even ask you to skip these portions and focus on sharing the findings.
2. Do Not Read Word-per-word
Reading word-for-word from your presentation slides intensifies the danger of losing your audience’s interest. Its effect can be detrimental, especially if the purpose of your research presentation is to gain approval from the audience. So, how can you avoid this mistake?
- Make a conscious design decision to keep the text on your slides minimal. Your slides should serve as visual cues to guide your presentation.
- Structure your presentation as a narrative or story. Stories are more engaging and memorable than dry, factual information.
- Prepare speaker notes with the key points of your research. Glance at it when needed.
- Engage with the audience by maintaining eye contact and asking rhetorical questions.
3. Don’t Go Without Handouts
Handouts are paper copies of your presentation slides that you distribute to your audience. They typically contain the summary of your key points, but they may also provide supplementary information supporting data presented through tables and graphs.
The purpose of distributing presentation handouts is to easily retain the key points you presented as they become good references in the future. Distributing handouts in advance allows your audience to review the material and come prepared with questions or points for discussion during the presentation.
4. Actively Listen
An equally important skill that a presenter must possess aside from speaking is the ability to listen. We are not just talking about listening to what the audience is saying but also considering their reactions and nonverbal cues. If you sense disinterest or confusion, you can adapt your approach on the fly to re-engage them.
For example, if some members of your audience are exchanging glances, they may be skeptical of the research findings you are presenting. This is the best time to reassure them of the validity of your data and provide a concise overview of how it came to be. You may also encourage them to seek clarification.
5. Be Confident
Anxiety can strike before a presentation – it’s a common reaction whenever someone has to speak in front of others. If you can’t eliminate your stress, try to manage it.
People hate public speaking not because they simply hate it. Most of the time, it arises from one’s belief in themselves. You don’t have to take our word for it. Take Maslow’s theory that says a threat to one’s self-esteem is a source of distress among an individual.
Now, how can you master this feeling? You’ve spent a lot of time on your research, so there is no question about your topic knowledge. Perhaps you just need to rehearse your research presentation. If you know what you will say and how to say it, you will gain confidence in presenting your work.
All sources you use in creating your research presentation should be given proper credit. The APA Style is the most widely used citation style in formal research.
In-text citation
Add references within the text of your presentation slide by giving the author’s last name, year of publication, and page number (if applicable) in parentheses after direct quotations or paraphrased materials. As in:
The alarming rate at which global temperatures rise directly impacts biodiversity (Smith, 2020, p. 27).
If the author’s name and year of publication are mentioned in the text, add only the page number in parentheses after the quotations or paraphrased materials. As in:
According to Smith (2020), the alarming rate at which global temperatures rise directly impacts biodiversity (p. 27).
Image citation
All images from the web, including photos, graphs, and tables, used in your slides should be credited using the format below.
Creator’s Last Name, First Name. “Title of Image.” Website Name, Day Mo. Year, URL. Accessed Day Mo. Year.
Work cited page
A work cited page or reference list should follow after the last slide of your presentation. The list should be alphabetized by the author’s last name and initials followed by the year of publication, the title of the book or article, the place of publication, and the publisher. As in:
Smith, J. A. (2020). Climate Change and Biodiversity: A Comprehensive Study. New York, NY: ABC Publications.
When citing a document from a website, add the source URL after the title of the book or article instead of the place of publication and the publisher. As in:
Smith, J. A. (2020). Climate Change and Biodiversity: A Comprehensive Study. Retrieved from https://www.smith.com/climate-change-and-biodiversity.
1. Research Project Presentation PowerPoint Template
A slide deck containing 18 different slides intended to take off the weight of how to make a research presentation. With tons of visual aids, presenters can reference existing research on similar projects to this one – or link another research presentation example – provide an accurate data analysis, disclose the methodology used, and much more.
Use This Template
2. Research Presentation Scientific Method Diagram PowerPoint Template
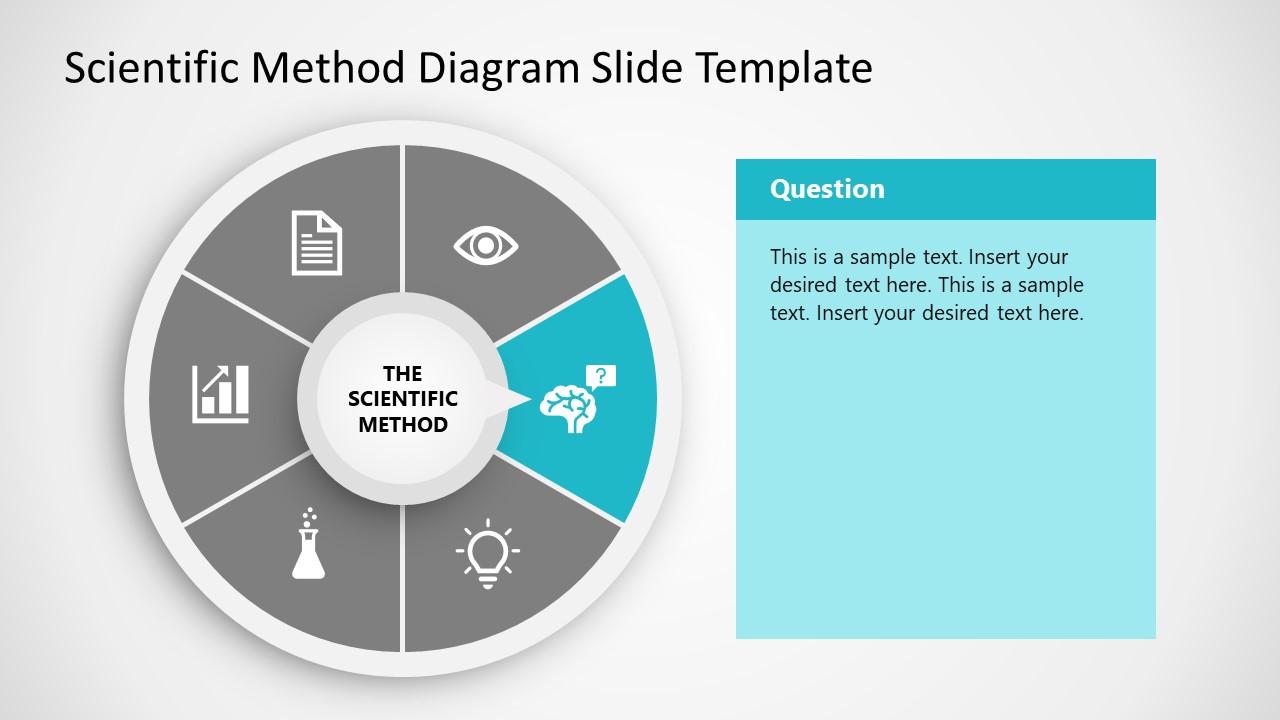
Whenever you intend to raise questions, expose the methodology you used for your research, or even suggest a scientific method approach for future analysis, this circular wheel diagram is a perfect fit for any presentation study.
Customize all of its elements to suit the demands of your presentation in just minutes.
3. Thesis Research Presentation PowerPoint Template

If your research presentation project belongs to academia, then this is the slide deck to pair that presentation. With a formal aesthetic and minimalistic style, this research presentation template focuses only on exposing your information as clearly as possible.
Use its included bar charts and graphs to introduce data, change the background of each slide to suit the topic of your presentation, and customize each of its elements to meet the requirements of your project with ease.
4. Animated Research Cards PowerPoint Template
Visualize ideas and their connection points with the help of this research card template for PowerPoint. This slide deck, for example, can help speakers talk about alternative concepts to what they are currently managing and its possible outcomes, among different other usages this versatile PPT template has. Zoom Animation effects make a smooth transition between cards (or ideas).
5. Research Presentation Slide Deck for PowerPoint
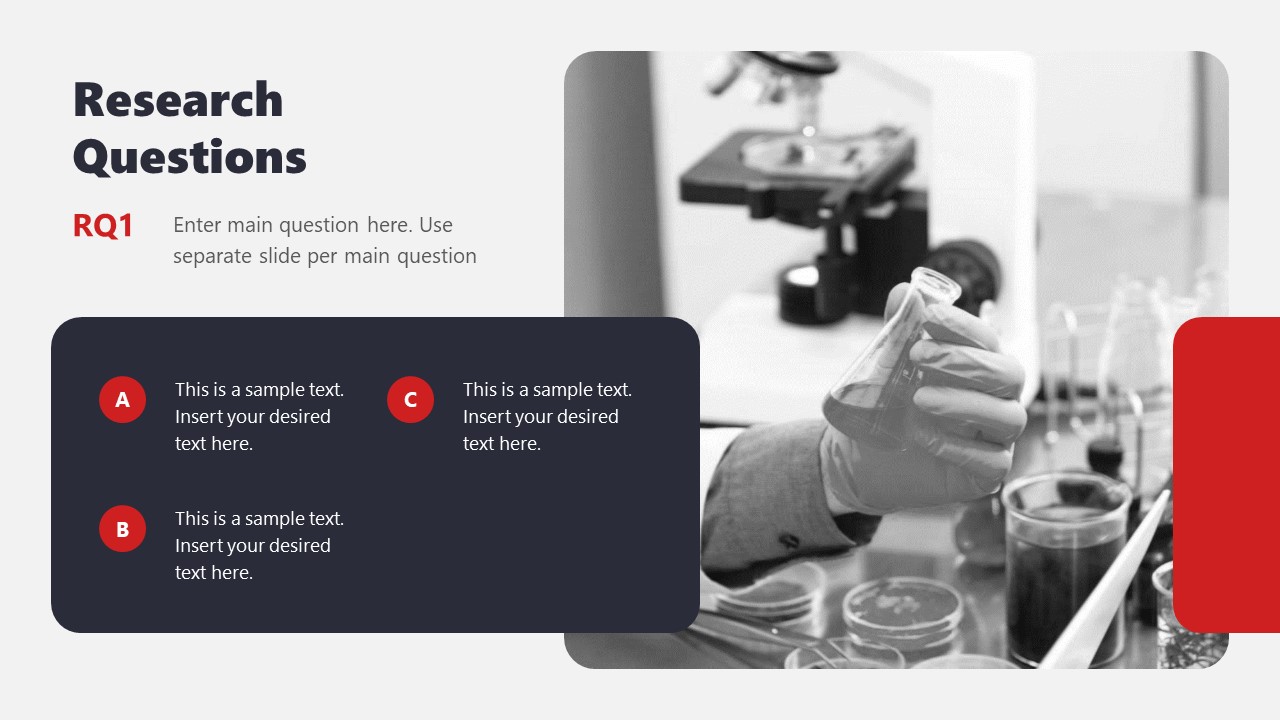
With a distinctive professional style, this research presentation PPT template helps business professionals and academics alike to introduce the findings of their work to team members or investors.
By accessing this template, you get the following slides:
- Introduction
- Problem Statement
- Research Questions
- Conceptual Research Framework (Concepts, Theories, Actors, & Constructs)
- Study design and methods
- Population & Sampling
- Data Collection
- Data Analysis
Check it out today and craft a powerful research presentation out of it!
A successful research presentation in business is not just about presenting data; it’s about persuasion to take meaningful action. It’s the bridge that connects your research efforts to the strategic initiatives of your organization. To embark on this journey successfully, planning your presentation thoroughly is paramount, from designing your PowerPoint to the delivery.
Take a look and get inspiration from the sample research presentation slides above, put our tips to heart, and transform your research findings into a compelling call to action.

Like this article? Please share
Academics, Presentation Approaches, Research & Development Filed under Presentation Ideas
Related Articles

Filed under Design • March 27th, 2024
How to Make a Presentation Graph
Detailed step-by-step instructions to master the art of how to make a presentation graph in PowerPoint and Google Slides. Check it out!

Filed under Presentation Ideas • February 29th, 2024
How to Make a Fundraising Presentation (with Thermometer Templates & Slides)
Meet a new framework to design fundraising presentations by harnessing the power of fundraising thermometer templates. Detailed guide with examples.

Filed under Presentation Ideas • February 15th, 2024
How to Create a 5 Minutes Presentation
Master the art of short-format speeches like the 5 minutes presentation with this article. Insights on content structure, audience engagement and more.
Leave a Reply
We use essential cookies to make Venngage work. By clicking “Accept All Cookies”, you agree to the storing of cookies on your device to enhance site navigation, analyze site usage, and assist in our marketing efforts.
Manage Cookies
Cookies and similar technologies collect certain information about how you’re using our website. Some of them are essential, and without them you wouldn’t be able to use Venngage. But others are optional, and you get to choose whether we use them or not.
Strictly Necessary Cookies
These cookies are always on, as they’re essential for making Venngage work, and making it safe. Without these cookies, services you’ve asked for can’t be provided.
Show cookie providers
- Google Login
Functionality Cookies
These cookies help us provide enhanced functionality and personalisation, and remember your settings. They may be set by us or by third party providers.
Performance Cookies
These cookies help us analyze how many people are using Venngage, where they come from and how they're using it. If you opt out of these cookies, we can’t get feedback to make Venngage better for you and all our users.
- Google Analytics
Targeting Cookies
These cookies are set by our advertising partners to track your activity and show you relevant Venngage ads on other sites as you browse the internet.
- Google Tag Manager
- Infographics
- Daily Infographics
- Popular Templates
- Accessibility
- Graphic Design
- Graphs and Charts
- Data Visualization
- Human Resources
- Beginner Guides
Blog Business How to Present a Case Study like a Pro (With Examples)
How to Present a Case Study like a Pro (With Examples)
Written by: Danesh Ramuthi Sep 07, 2023

Okay, let’s get real: case studies can be kinda snooze-worthy. But guess what? They don’t have to be!
In this article, I will cover every element that transforms a mere report into a compelling case study, from selecting the right metrics to using persuasive narrative techniques.
And if you’re feeling a little lost, don’t worry! There are cool tools like Venngage’s Case Study Creator to help you whip up something awesome, even if you’re short on time. Plus, the pre-designed case study templates are like instant polish because let’s be honest, everyone loves a shortcut.
Click to jump ahead:
What is a case study presentation?
What is the purpose of presenting a case study, how to structure a case study presentation, how long should a case study presentation be, 5 case study presentation examples with templates, 6 tips for delivering an effective case study presentation, 5 common mistakes to avoid in a case study presentation, how to present a case study faqs.
A case study presentation involves a comprehensive examination of a specific subject, which could range from an individual, group, location, event, organization or phenomenon.
They’re like puzzles you get to solve with the audience, all while making you think outside the box.
Unlike a basic report or whitepaper, the purpose of a case study presentation is to stimulate critical thinking among the viewers.
The primary objective of a case study is to provide an extensive and profound comprehension of the chosen topic. You don’t just throw numbers at your audience. You use examples and real-life cases to make you think and see things from different angles.

The primary purpose of presenting a case study is to offer a comprehensive, evidence-based argument that informs, persuades and engages your audience.
Here’s the juicy part: presenting that case study can be your secret weapon. Whether you’re pitching a groundbreaking idea to a room full of suits or trying to impress your professor with your A-game, a well-crafted case study can be the magic dust that sprinkles brilliance over your words.
Think of it like digging into a puzzle you can’t quite crack . A case study lets you explore every piece, turn it over and see how it fits together. This close-up look helps you understand the whole picture, not just a blurry snapshot.
It’s also your chance to showcase how you analyze things, step by step, until you reach a conclusion. It’s all about being open and honest about how you got there.
Besides, presenting a case study gives you an opportunity to connect data and real-world scenarios in a compelling narrative. It helps to make your argument more relatable and accessible, increasing its impact on your audience.
One of the contexts where case studies can be very helpful is during the job interview. In some job interviews, you as candidates may be asked to present a case study as part of the selection process.
Having a case study presentation prepared allows the candidate to demonstrate their ability to understand complex issues, formulate strategies and communicate their ideas effectively.

The way you present a case study can make all the difference in how it’s received. A well-structured presentation not only holds the attention of your audience but also ensures that your key points are communicated clearly and effectively.
In this section, let’s go through the key steps that’ll help you structure your case study presentation for maximum impact.
Let’s get into it.
Open with an introductory overview
Start by introducing the subject of your case study and its relevance. Explain why this case study is important and who would benefit from the insights gained. This is your opportunity to grab your audience’s attention.

Explain the problem in question
Dive into the problem or challenge that the case study focuses on. Provide enough background information for the audience to understand the issue. If possible, quantify the problem using data or metrics to show the magnitude or severity.

Detail the solutions to solve the problem
After outlining the problem, describe the steps taken to find a solution. This could include the methodology, any experiments or tests performed and the options that were considered. Make sure to elaborate on why the final solution was chosen over the others.

Key stakeholders Involved
Talk about the individuals, groups or organizations that were directly impacted by or involved in the problem and its solution.
Stakeholders may experience a range of outcomes—some may benefit, while others could face setbacks.
For example, in a business transformation case study, employees could face job relocations or changes in work culture, while shareholders might be looking at potential gains or losses.
Discuss the key results & outcomes
Discuss the results of implementing the solution. Use data and metrics to back up your statements. Did the solution meet its objectives? What impact did it have on the stakeholders? Be honest about any setbacks or areas for improvement as well.

Include visuals to support your analysis
Visual aids can be incredibly effective in helping your audience grasp complex issues. Utilize charts, graphs, images or video clips to supplement your points. Make sure to explain each visual and how it contributes to your overall argument.
Pie charts illustrate the proportion of different components within a whole, useful for visualizing market share, budget allocation or user demographics.
This is particularly useful especially if you’re displaying survey results in your case study presentation.

Stacked charts on the other hand are perfect for visualizing composition and trends. This is great for analyzing things like customer demographics, product breakdowns or budget allocation in your case study.
Consider this example of a stacked bar chart template. It provides a straightforward summary of the top-selling cake flavors across various locations, offering a quick and comprehensive view of the data.

Not the chart you’re looking for? Browse Venngage’s gallery of chart templates to find the perfect one that’ll captivate your audience and level up your data storytelling.
Recommendations and next steps
Wrap up by providing recommendations based on the case study findings. Outline the next steps that stakeholders should take to either expand on the success of the project or address any remaining challenges.
Acknowledgments and references
Thank the people who contributed to the case study and helped in the problem-solving process. Cite any external resources, reports or data sets that contributed to your analysis.
Feedback & Q&A session
Open the floor for questions and feedback from your audience. This allows for further discussion and can provide additional insights that may not have been considered previously.
Closing remarks
Conclude the presentation by summarizing the key points and emphasizing the takeaways. Thank your audience for their time and participation and express your willingness to engage in further discussions or collaborations on the subject.

Well, the length of a case study presentation can vary depending on the complexity of the topic and the needs of your audience. However, a typical business or academic presentation often lasts between 15 to 30 minutes.
This time frame usually allows for a thorough explanation of the case while maintaining audience engagement. However, always consider leaving a few minutes at the end for a Q&A session to address any questions or clarify points made during the presentation.
When it comes to presenting a compelling case study, having a well-structured template can be a game-changer.
It helps you organize your thoughts, data and findings in a coherent and visually pleasing manner.
Not all case studies are created equal and different scenarios require distinct approaches for maximum impact.
To save you time and effort, I have curated a list of 5 versatile case study presentation templates, each designed for specific needs and audiences.
Here are some best case study presentation examples that showcase effective strategies for engaging your audience and conveying complex information clearly.
1 . Lab report case study template
Ever feel like your research gets lost in a world of endless numbers and jargon? Lab case studies are your way out!
Think of it as building a bridge between your cool experiment and everyone else. It’s more than just reporting results – it’s explaining the “why” and “how” in a way that grabs attention and makes sense.
This lap report template acts as a blueprint for your report, guiding you through each essential section (introduction, methods, results, etc.) in a logical order.

Want to present your research like a pro? Browse our research presentation template gallery for creative inspiration!
2. Product case study template
It’s time you ditch those boring slideshows and bullet points because I’ve got a better way to win over clients: product case study templates.
Instead of just listing features and benefits, you get to create a clear and concise story that shows potential clients exactly what your product can do for them. It’s like painting a picture they can easily visualize, helping them understand the value your product brings to the table.
Grab the template below, fill in the details, and watch as your product’s impact comes to life!

3. Content marketing case study template
In digital marketing, showcasing your accomplishments is as vital as achieving them.
A well-crafted case study not only acts as a testament to your successes but can also serve as an instructional tool for others.
With this coral content marketing case study template—a perfect blend of vibrant design and structured documentation, you can narrate your marketing triumphs effectively.

4. Case study psychology template
Understanding how people tick is one of psychology’s biggest quests and case studies are like magnifying glasses for the mind. They offer in-depth looks at real-life behaviors, emotions and thought processes, revealing fascinating insights into what makes us human.
Writing a top-notch case study, though, can be a challenge. It requires careful organization, clear presentation and meticulous attention to detail. That’s where a good case study psychology template comes in handy.
Think of it as a helpful guide, taking care of formatting and structure while you focus on the juicy content. No more wrestling with layouts or margins – just pour your research magic into crafting a compelling narrative.

5. Lead generation case study template
Lead generation can be a real head-scratcher. But here’s a little help: a lead generation case study.
Think of it like a friendly handshake and a confident resume all rolled into one. It’s your chance to showcase your expertise, share real-world successes and offer valuable insights. Potential clients get to see your track record, understand your approach and decide if you’re the right fit.
No need to start from scratch, though. This lead generation case study template guides you step-by-step through crafting a clear, compelling narrative that highlights your wins and offers actionable tips for others. Fill in the gaps with your specific data and strategies, and voilà! You’ve got a powerful tool to attract new customers.

Related: 15+ Professional Case Study Examples [Design Tips + Templates]
So, you’ve spent hours crafting the perfect case study and are now tasked with presenting it. Crafting the case study is only half the battle; delivering it effectively is equally important.
Whether you’re facing a room of executives, academics or potential clients, how you present your findings can make a significant difference in how your work is received.
Forget boring reports and snooze-inducing presentations! Let’s make your case study sing. Here are some key pointers to turn information into an engaging and persuasive performance:
- Know your audience : Tailor your presentation to the knowledge level and interests of your audience. Remember to use language and examples that resonate with them.
- Rehearse : Rehearsing your case study presentation is the key to a smooth delivery and for ensuring that you stay within the allotted time. Practice helps you fine-tune your pacing, hone your speaking skills with good word pronunciations and become comfortable with the material, leading to a more confident, conversational and effective presentation.
- Start strong : Open with a compelling introduction that grabs your audience’s attention. You might want to use an interesting statistic, a provocative question or a brief story that sets the stage for your case study.
- Be clear and concise : Avoid jargon and overly complex sentences. Get to the point quickly and stay focused on your objectives.
- Use visual aids : Incorporate slides with graphics, charts or videos to supplement your verbal presentation. Make sure they are easy to read and understand.
- Tell a story : Use storytelling techniques to make the case study more engaging. A well-told narrative can help you make complex data more relatable and easier to digest.

Ditching the dry reports and slide decks? Venngage’s case study templates let you wow customers with your solutions and gain insights to improve your business plan. Pre-built templates, visual magic and customer captivation – all just a click away. Go tell your story and watch them say “wow!”
Nailed your case study, but want to make your presentation even stronger? Avoid these common mistakes to ensure your audience gets the most out of it:
Overloading with information
A case study is not an encyclopedia. Overloading your presentation with excessive data, text or jargon can make it cumbersome and difficult for the audience to digest the key points. Stick to what’s essential and impactful. Need help making your data clear and impactful? Our data presentation templates can help! Find clear and engaging visuals to showcase your findings.
Lack of structure
Jumping haphazardly between points or topics can confuse your audience. A well-structured presentation, with a logical flow from introduction to conclusion, is crucial for effective communication.
Ignoring the audience
Different audiences have different needs and levels of understanding. Failing to adapt your presentation to your audience can result in a disconnect and a less impactful presentation.
Poor visual elements
While content is king, poor design or lack of visual elements can make your case study dull or hard to follow. Make sure you use high-quality images, graphs and other visual aids to support your narrative.
Not focusing on results
A case study aims to showcase a problem and its solution, but what most people care about are the results. Failing to highlight or adequately explain the outcomes can make your presentation fall flat.
How to start a case study presentation?
Starting a case study presentation effectively involves a few key steps:
- Grab attention : Open with a hook—an intriguing statistic, a provocative question or a compelling visual—to engage your audience from the get-go.
- Set the stage : Briefly introduce the subject, context and relevance of the case study to give your audience an idea of what to expect.
- Outline objectives : Clearly state what the case study aims to achieve. Are you solving a problem, proving a point or showcasing a success?
- Agenda : Give a quick outline of the key sections or topics you’ll cover to help the audience follow along.
- Set expectations : Let your audience know what you want them to take away from the presentation, whether it’s knowledge, inspiration or a call to action.
How to present a case study on PowerPoint and on Google Slides?
Presenting a case study on PowerPoint and Google Slides involves a structured approach for clarity and impact using presentation slides :
- Title slide : Start with a title slide that includes the name of the case study, your name and any relevant institutional affiliations.
- Introduction : Follow with a slide that outlines the problem or situation your case study addresses. Include a hook to engage the audience.
- Objectives : Clearly state the goals of the case study in a dedicated slide.
- Findings : Use charts, graphs and bullet points to present your findings succinctly.
- Analysis : Discuss what the findings mean, drawing on supporting data or secondary research as necessary.
- Conclusion : Summarize key takeaways and results.
- Q&A : End with a slide inviting questions from the audience.
What’s the role of analysis in a case study presentation?
The role of analysis in a case study presentation is to interpret the data and findings, providing context and meaning to them.
It helps your audience understand the implications of the case study, connects the dots between the problem and the solution and may offer recommendations for future action.
Is it important to include real data and results in the presentation?
Yes, including real data and results in a case study presentation is crucial to show experience, credibility and impact. Authentic data lends weight to your findings and conclusions, enabling the audience to trust your analysis and take your recommendations more seriously
How do I conclude a case study presentation effectively?
To conclude a case study presentation effectively, summarize the key findings, insights and recommendations in a clear and concise manner.
End with a strong call-to-action or a thought-provoking question to leave a lasting impression on your audience.
What’s the best way to showcase data in a case study presentation ?
The best way to showcase data in a case study presentation is through visual aids like charts, graphs and infographics which make complex information easily digestible, engaging and creative.
Don’t just report results, visualize them! This template for example lets you transform your social media case study into a captivating infographic that sparks conversation.

Choose the type of visual that best represents the data you’re showing; for example, use bar charts for comparisons or pie charts for parts of a whole.
Ensure that the visuals are high-quality and clearly labeled, so the audience can quickly grasp the key points.
Keep the design consistent and simple, avoiding clutter or overly complex visuals that could distract from the message.
Choose a template that perfectly suits your case study where you can utilize different visual aids for maximum impact.
Need more inspiration on how to turn numbers into impact with the help of infographics? Our ready-to-use infographic templates take the guesswork out of creating visual impact for your case studies with just a few clicks.
Related: 10+ Case Study Infographic Templates That Convert
Congrats on mastering the art of compelling case study presentations! This guide has equipped you with all the essentials, from structure and nuances to avoiding common pitfalls. You’re ready to impress any audience, whether in the boardroom, the classroom or beyond.
And remember, you’re not alone in this journey. Venngage’s Case Study Creator is your trusty companion, ready to elevate your presentations from ordinary to extraordinary. So, let your confidence shine, leverage your newly acquired skills and prepare to deliver presentations that truly resonate.
Go forth and make a lasting impact!
Discover popular designs

Infographic maker

Brochure maker

White paper online

Newsletter creator

Flyer maker

Timeline maker

Letterhead maker

Mind map maker

Ebook maker
Weekly Report Presentation
Just as an annual report reviews the past year’s goals, projects, and progress, a weekly report presentation examines the past week completely. Your weekly report should quickly recap what was completed in the past week, what you’re working on now, and plans for the week ahead.
Your weekly report also needs to be concise and comprehensive. A reporting presentation template can keep your accomplishments, tasks, and strategies organized for your next meeting.
Use our weekly report presentation template to:
- Share progress on an ongoing project
- Demonstrate how challenges were handled
- Show weekly sales and revenue performance
Customize your Weekly Report Presentation
Keep your projects and tasks moving along efficiently with a weekly report presentation. Make each slide informative and eye-catching by adding flowcharts, timelines, images, bullet lists, and any other graphic that will transform your text. Consider including these slides in your reporting presentation template:

Pro Tips for a Reporting Presentation Template
Consider these tips when creating a weekly report presentation.
Long blocks of text are tough to read. Use bullet lists, headings, and short paragraphs to make your report readable.
A weekly report presentation template saves you time on design, but don’t forget to proofread! You don’t want to present outdated information from last week’s report.
Make your presentation easy to read by including plenty of white space. When used thoughtfully, color can draw attention to text or elements on your slides.
End your weekly report with actionable takeaways or next steps for your team members.
More Popular Templates

Marketing Plan Template
Create a full-stack marketing plan with this fully customizable marketing plan template.

Facebook Pitch Deck
The 2004 Facebook pitch deck was a media kit used to (successfully) secure potential advertisers. We reworked and refreshed it in Beautiful.ai.

Design Sprint Presentation Template
Learn how Beautiful.ai’s design sprint presentation template can help your answer critical business questions and introduce new solutions.

Consultant Pitch Template
Learn how Beautiful.ai’s consultant pitch presentation template can help professionals land new clients and grow their business.

Project Retrospective Presentation Template
Learn how Beautiful.ai’s project retrospective template can help your team reflect on a completed project and learn from the successes and failures.

Lean Coffee Presentation Template
Learn how Beautiful.ai’s lean coffee template can help you run a structured meeting without a formal agenda..
How-To Geek
6 ways to create more interactive powerpoint presentations.
Engage your audience with cool, actionable features.
Quick Links
- Add a QR code
- Embed Microsoft Forms (Education or Business Only)
- Embed a Live Web Page
- Add Links and Menus
- Add Clickable Images to Give More Info
- Add a Countdown Timer
We've all been to a presentation where the speaker bores you to death with a mundane PowerPoint presentation. Actually, the speaker could have kept you much more engaged by adding some interactive features to their slideshow. Let's look into some of these options.
1. Add a QR code
Adding a QR code can be particularly useful if you want to direct your audience to an online form, website, or video.
Some websites have in-built ways to create a QR code. For example, on Microsoft Forms , when you click "Collect Responses," you'll see the QR code option via the icon highlighted in the screenshot below. You can either right-click the QR code to copy and paste it into your presentation, or click "Download" to add it to your device gallery to insert the QR code as a picture.
In fact, you can easily add a QR code to take your viewer to any website. On Microsoft Edge, right-click anywhere on a web page where there isn't already a link, and left-click "Create QR Code For This Page."
You can also create QR codes in other browsers, such as Chrome.
You can then copy or download the QR code to use wherever you like in your presentation.
2. Embed Microsoft Forms (Education or Business Only)
If you plan to send your PPT presentation to others—for example, if you're a trainer sending step-by-step instruction presentation, a teacher sending an independent learning task to your students, or a campaigner for your local councilor sending a persuasive PPT to constituents—you might want to embed a quiz, questionnaire, pole, or feedback survey in your presentation.
In PowerPoint, open the "Insert" tab on the ribbon, and in the Forms group, click "Forms". If you cannot see this option, you can add new buttons to the ribbon .
As at April 2024, this feature is only available for those using their work or school account. We're using a Microsoft 365 Personal account in the screenshot below, which is why the Forms icon is grayed out.
Then, a sidebar will appear on the right-hand side of your screen, where you can either choose a form you have already created or opt to craft a new form.
Now, you can share your PPT presentation with others , who can click the fields and submit their responses when they view the presentation.
3. Embed a Live Web Page
You could always screenshot a web page and paste that into your PPT, but that's not a very interactive addition to your presentation. Instead, you can embed a live web page into your PPT so that people with access to your presentation can interact actively with its contents.
To do this, we will need to add an add-in to our PPT account .
Add-ins are not always reliable or secure. Before installing an add-in to your Microsoft account, check that the author is a reputable company, and type the add-in's name into a search engine to read reviews and other users' experiences.
To embed a web page, add the Web Viewer add-in ( this is an add-in created by Microsoft ).
Go to the relevant slide and open the Web Viewer add-in. Then, copy and paste the secure URL into the field box, and remove https:// from the start of the address. In our example, we will add a selector wheel to our slide. Click "Preview" to see a sample of the web page's appearance in your presentation.
This is how ours will look.
When you or someone with access to your presentation views the slideshow, this web page will be live and interactive.
4. Add Links and Menus
As well as moving from one slide to the next through a keyboard action or mouse click, you can create links within your presentation to direct the audience to specific locations.
To create a link, right-click the outline of the clickable object, and click "Link."
In the Insert Hyperlink dialog box, click "Place In This Document," choose the landing destination, and click "OK."
What's more, to make it clear that an object is clickable, you can use action buttons. Open the "Insert" tab on the ribbon, click "Shape," and then choose an appropriate action button. Usefully, PPT will automatically prompt you to add a link to these shapes.
You might also want a menu that displays on every slide. Once you have created the menu, add the links using the method outlined above. Then, select all the items, press Ctrl+C (copy), and then use Ctrl+V to paste them in your other slides.
5. Add Clickable Images to Give More Info
Through PowerPoint's animations, you can give your viewer the power to choose what they see and when they see it. This works nicely whether you're planning to send your presentation to others to run through independently or whether you're presenting in front of a group and want your audience to decide which action they want to take.
Start by creating the objects that will be clickable (trigger) and the items that will appear (pop-up).
Then, select all the pop-ups together. When you click "Animations" on the ribbon and choose an appropriate animation for the effect you want to achieve, this will be applied to all objects you have selected.
The next step is to rename the triggers in your presentation. To do this, open the "Home" tab, and in the Editing group, click "Select", and then "Selection Pane."
With the Selection Pane open, select each trigger on your slide individually, and rename them in the Selection Pane, so that they can be easily linked to in the next step.
Finally, go back to the first pop-up. Open the "Animations" tab, and in the Advanced Animation group, click the "Trigger" drop-down arrow. Then, you can set the item to appear when a trigger is clicked in your presentation.
If you want your item to disappear when the trigger is clicked again, select the pop-up, click "Add Animation" in the Advanced Animation group, choose an Exit animation, and follow the same step to link that animation to the trigger button.
6. Add a Countdown Timer
A great way to get your audience to engage with your PPT presentation is to keep them on edge by adding a countdown timer. Whether you're leading a presentation and want to let your audience stop to discuss a topic, or running an online quiz with time-limit questions, having a countdown timer means your audience will keep their eye on your slide throughout.
To do this, you need to animate text boxes or shapes containing your countdown numbers. Choose and format a shape and type the highest number that your countdown clock will need. In our case, we're creating a 10-second timer.
Now, with your shape selected, open the "Animations" tab on the ribbon and click the animation drop-down arrow. Then, in the Exit menu, click "Disappear."
Open the Animation Pane, and click the drop-down arrow next to the animation you've just added. From there, choose "Timing."
Make sure "On Click" is selected in the Start menu, and change the Delay option to "1 second," before clicking "OK."
Then, with this shape still selected, press Ctrl+C (copy), and then Ctrl+V (paste). In the second box, type 9 . With the Animation Pane still open and this second shape selected, click the drop-down arrow and choose "Timing" again. Change the Start option to "After Previous," and make sure the Delay option is 1 second. Then, click "OK."
We can now use this second shape as our template, as when we copy and paste it again, the animations will also duplicate. With this second shape selected, press Ctrl+C and Ctrl+V, type 8 into the box, and continue to do the same until you get to 0 .
Next, remove the animations from the "0" box, as you don't want this to disappear. To do this, click the shape, and in the Animation Pane drop-down, click "Remove."
You now need to layer them in order. Right-click the box containing number 1, and click "Bring To Front." You will now see that box on the top. Do the same with the other numbers in ascending order.
Finally, you need to align the objects together. Click anywhere on your slide and press Ctrl+A. Then, in the Home tab on the ribbon, click "Arrange." First click "Align Center," and then bring the menu up again, so that you can click "Align Middle."
Press Ctrl+A again to select your timer, and you can then move your timer or copy and paste it elsewhere.
Press F5 to see the presentation in action, and when you get to the slide containing the timer, click anywhere on the slide to see your countdown timer in action!
Now that your PPT presentation is more interactive, make sure you've avoided these eight common presentational mistakes before you present your slides.
- SUGGESTED TOPICS
- The Magazine
- Newsletters
- Managing Yourself
- Managing Teams
- Work-life Balance
- The Big Idea
- Data & Visuals
- Reading Lists
- Case Selections
- HBR Learning
- Topic Feeds
- Account Settings
- Email Preferences
How to Present to an Audience That Knows More Than You
- Deborah Grayson Riegel

Lean into being a facilitator — not an expert.
What happens when you have to give a presentation to an audience that might have some professionals who have more expertise on the topic than you do? While it can be intimidating, it can also be an opportunity to leverage their deep and diverse expertise in service of the group’s learning. And it’s an opportunity to exercise some intellectual humility, which includes having respect for other viewpoints, not being intellectually overconfident, separating your ego from your intellect, and being willing to revise your own viewpoint — especially in the face of new information. This article offers several tips for how you might approach a roomful of experts, including how to invite them into the discussion without allowing them to completely take over, as well as how to pivot on the proposed topic when necessary.
I was five years into my executive coaching practice when I was invited to lead a workshop on “Coaching Skills for Human Resource Leaders” at a global conference. As the room filled up with participants, I identified a few colleagues who had already been coaching professionally for more than a decade. I felt self-doubt start to kick in: Why were they even here? What did they come to learn? Why do they want to hear from me?
- Deborah Grayson Riegel is a professional speaker and facilitator, as well as a communication and presentation skills coach. She teaches leadership communication at Duke University’s Fuqua School of Business and has taught for Wharton Business School, Columbia Business School’s Women in Leadership Program, and Peking University’s International MBA Program. She is the author of Overcoming Overthinking: 36 Ways to Tame Anxiety for Work, School, and Life and the best-selling Go To Help: 31 Strategies to Offer, Ask for, and Accept Help .
Partner Center
Got any suggestions?
We want to hear from you! Send us a message and help improve Slidesgo
Top searches
Trending searches

holy spirit
35 templates

11 templates

business pitch
598 templates

ai technology
169 templates

21 templates

environmental science
36 templates
News Report Writing Tips for Students
It seems that you like this template, news report writing tips for students presentation, free google slides theme and powerpoint template.
Download the News Report Writing Tips for Students presentation for PowerPoint or Google Slides. The education sector constantly demands dynamic and effective ways to present information. This template is created with that very purpose in mind. Offering the best resources, it allows educators or students to efficiently manage their presentations and engage audiences. With its user-friendly and useful features, everyone will find it easy to customize and adapt according to their needs. Whether for a lesson presentation, student report, or administrative purposes, this template offers a unique solution for any case!
Features of this template
- 100% editable and easy to modify
- Different slides to impress your audience
- Contains easy-to-edit graphics such as graphs, maps, tables, timelines and mockups
- Includes 500+ icons and Flaticon’s extension for customizing your slides
- Designed to be used in Google Slides and Microsoft PowerPoint
- Includes information about fonts, colors, and credits of the resources used
How can I use the template?
Am I free to use the templates?
How to attribute?
Attribution required If you are a free user, you must attribute Slidesgo by keeping the slide where the credits appear. How to attribute?
Related posts on our blog.

How to Add, Duplicate, Move, Delete or Hide Slides in Google Slides

How to Change Layouts in PowerPoint

How to Change the Slide Size in Google Slides
Related presentations.

Premium template
Unlock this template and gain unlimited access

- Skip to main
- Skip to footer
- Board of Directors
- Walmart History
- New Home Office
- Working at Walmart
- Sam's Club
- Location Facts
- Contact Walmart
- Media Library
- Contact Media Relations
- Opportunity
- Sustainability
- Ethics & Integrity
- Belonging, Diversity, Equity & Inclusion
- Philanthropy
- ESG Reporting
- Health & Wellness
- Stock Information
- Financial Information
- Corporate Governance
- ESG Investors
- Investor Resources
- Supplier Requirements
- Apply to be a Supplier
- Supplier Inclusion
- Sustainability for Suppliers
- Investing In American Jobs
- Sam's Club Suppliers
- Walmart Growth Summits
- Ask Walmart
Walmart Releases Q1 FY25 Earnings
May 16, 2024

Press Center
We're building on our strengths ..
"Our team delivered a great quarter. Around the world, our goal is simple - we’re focused on saving our customers both money and time. It’s inspiring to see how our associates are simultaneously executing the fundamentals and innovating to make shopping with us more enjoyable and convenient. We’re people-led and tech-powered, and that combination is propelling our business."

Doug McMillon
President & CEO, Walmart
Global eCommerce sales
Strength in store-fulfilled pickup and delivery
Global advertising 5
Growth across all segments
Return on assets
Scaling growth investments
Return on investment 6
Disciplined execution on cost
Global inventory
Lower inventory on higher revenue
And, we're delivering
solid earnings growth .
We’re building customer trust by designing convenient, enjoyable omnichannel experiences that deliver what our customers want and need. We’re focused on the clear drivers of value, which is sustaining strength across multiple areas of the business. We’re maintaining the pace of our investments, using automation and operating discipline to drive higher returns.
Our strong results this quarter clearly demonstrate the power of our global omni-retail capabilities and the team’s ability to execute with discipline. As we continue to reshape our business model, we’re focused on strategically investing in areas that reinforce our purpose and growth strategy.

John David Rainey
Executive Vice President & Chief Financial Officer, Walmart

Award text would go here
Lorem ipsum dolor sit amet, consectetuer adipiscing elit. Aenean commodo ligula eget dolor.
1 Adjusted EPS is a non-GAAP measure. See additional information at the end of the release regarding non-GAAP financial measures. 2 Adjusted Operating Income is a non-GAAP measure. See additional information at the end of the release regarding non-GAAP financial measures. 3 Comp sales for the 13-week period ended April 26th, 2024 compared to the 13-week period ended April 28th, 2023, and excludes fuel. 4 Constant Currency is a non-GAAP measure. See additional information at the end of the release regarding non-GAAP financial measures. 5 Our global advertising business is recorded in either net sales or as a reduction to cost of sales, depending on the nature of the advertising arrangement. 6 Calculated for the trailing-twelve months ended April 30, 2024. ROI is a non-GAAP measure. See additional information at the end of the release regarding non-GAAP financial measures.
Full Report
Download Full Report
A .gov website belongs to an official government organization in the United States.
A lock ( ) or https:// means you've safely connected to the .gov website. Share sensitive information only on official, secure websites.
- About Adverse Childhood Experiences
- Risk and Protective Factors
- Program: Essentials for Childhood: Preventing Adverse Childhood Experiences through Data to Action
- Adverse childhood experiences can have long-term impacts on health, opportunity and well-being.
- Adverse childhood experiences are common and some groups experience them more than others.

What are adverse childhood experiences?
Adverse childhood experiences, or ACEs, are potentially traumatic events that occur in childhood (0-17 years). Examples include: 1
- Experiencing violence, abuse, or neglect.
- Witnessing violence in the home or community.
- Having a family member attempt or die by suicide.
Also included are aspects of the child’s environment that can undermine their sense of safety, stability, and bonding. Examples can include growing up in a household with: 1
- Substance use problems.
- Mental health problems.
- Instability due to parental separation.
- Instability due to household members being in jail or prison.
The examples above are not a complete list of adverse experiences. Many other traumatic experiences could impact health and well-being. This can include not having enough food to eat, experiencing homelessness or unstable housing, or experiencing discrimination. 2 3 4 5 6
Quick facts and stats
ACEs are common. About 64% of adults in the United States reported they had experienced at least one type of ACE before age 18. Nearly one in six (17.3%) adults reported they had experienced four or more types of ACEs. 7
Preventing ACEs could potentially reduce many health conditions. Estimates show up to 1.9 million heart disease cases and 21 million depression cases potentially could have been avoided by preventing ACEs. 1
Some people are at greater risk of experiencing one or more ACEs than others. While all children are at risk of ACEs, numerous studies show inequities in such experiences. These inequalities are linked to the historical, social, and economic environments in which some families live. 5 6 ACEs were highest among females, non-Hispanic American Indian or Alaska Native adults, and adults who are unemployed or unable to work. 7
ACEs are costly. ACEs-related health consequences cost an estimated economic burden of $748 billion annually in Bermuda, Canada, and the United States. 8
ACEs can have lasting effects on health and well-being in childhood and life opportunities well into adulthood. 9 Life opportunities include things like education and job potential. These experiences can increase the risks of injury, sexually transmitted infections, and involvement in sex trafficking. They can also increase risks for maternal and child health problems including teen pregnancy, pregnancy complications, and fetal death. Also included are a range of chronic diseases and leading causes of death, such as cancer, diabetes, heart disease, and suicide. 1 10 11 12 13 14 15 16 17
ACEs and associated social determinants of health, such as living in under-resourced or racially segregated neighborhoods, can cause toxic stress. Toxic stress, or extended or prolonged stress, from ACEs can negatively affect children’s brain development, immune systems, and stress-response systems. These changes can affect children’s attention, decision-making, and learning. 18
Children growing up with toxic stress may have difficulty forming healthy and stable relationships. They may also have unstable work histories as adults and struggle with finances, jobs, and depression throughout life. 18 These effects can also be passed on to their own children. 19 20 21 Some children may face further exposure to toxic stress from historical and ongoing traumas. These historical and ongoing traumas refer to experiences of racial discrimination or the impacts of poverty resulting from limited educational and economic opportunities. 1 6
Adverse childhood experiences can be prevented. Certain factors may increase or decrease the risk of experiencing adverse childhood experiences.
Preventing adverse childhood experiences requires understanding and addressing the factors that put people at risk for or protect them from violence.
Creating safe, stable, nurturing relationships and environments for all children can prevent ACEs and help all children reach their full potential. We all have a role to play.
- Merrick MT, Ford DC, Ports KA, et al. Vital Signs: Estimated Proportion of Adult Health Problems Attributable to Adverse Childhood Experiences and Implications for Prevention — 25 States, 2015–2017. MMWR Morb Mortal Wkly Rep 2019;68:999-1005. DOI: http://dx.doi.org/10.15585/mmwr.mm6844e1 .
- Cain KS, Meyer SC, Cummer E, Patel KK, Casacchia NJ, Montez K, Palakshappa D, Brown CL. Association of Food Insecurity with Mental Health Outcomes in Parents and Children. Science Direct. 2022; 22:7; 1105-1114. DOI: https://doi.org/10.1016/j.acap.2022.04.010 .
- Smith-Grant J, Kilmer G, Brener N, Robin L, Underwood M. Risk Behaviors and Experiences Among Youth Experiencing Homelessness—Youth Risk Behavior Survey, 23 U.S. States and 11 Local School Districts. Journal of Community Health. 2022; 47: 324-333.
- Experiencing discrimination: Early Childhood Adversity, Toxic Stress, and the Impacts of Racism on the Foundations of Health | Annual Review of Public Health ( annualreviews.org).
- Sedlak A, Mettenburg J, Basena M, et al. Fourth national incidence study of child abuse and neglect (NIS-4): Report to Congress. Executive Summary. Washington, DC: U.S. Department of Health an Human Services, Administration for Children and Families.; 2010.
- Font S, Maguire-Jack K. Pathways from childhood abuse and other adversities to adult health risks: The role of adult socioeconomic conditions. Child Abuse Negl. 2016;51:390-399.
- Swedo EA, Aslam MV, Dahlberg LL, et al. Prevalence of Adverse Childhood Experiences Among U.S. Adults — Behavioral Risk Factor Surveillance System, 2011–2020. MMWR Morb Mortal Wkly Rep 2023;72:707–715. DOI: http://dx.doi.org/10.15585/mmwr.mm7226a2 .
- Bellis, MA, et al. Life Course Health Consequences and Associated Annual Costs of Adverse Childhood Experiences Across Europe and North America: A Systematic Review and Meta-Analysis. Lancet Public Health 2019.
- Adverse Childhood Experiences During the COVID-19 Pandemic and Associations with Poor Mental Health and Suicidal Behaviors Among High School Students — Adolescent Behaviors and Experiences Survey, United States, January–June 2021 | MMWR
- Hillis SD, Anda RF, Dube SR, Felitti VJ, Marchbanks PA, Marks JS. The association between adverse childhood experiences and adolescent pregnancy, long-term psychosocial consequences, and fetal death. Pediatrics. 2004 Feb;113(2):320-7.
- Miller ES, Fleming O, Ekpe EE, Grobman WA, Heard-Garris N. Association Between Adverse Childhood Experiences and Adverse Pregnancy Outcomes. Obstetrics & Gynecology . 2021;138(5):770-776. https://doi.org/10.1097/AOG.0000000000004570 .
- Sulaiman S, Premji SS, Tavangar F, et al. Total Adverse Childhood Experiences and Preterm Birth: A Systematic Review. Matern Child Health J . 2021;25(10):1581-1594. https://doi.org/10.1007/s10995-021-03176-6 .
- Ciciolla L, Shreffler KM, Tiemeyer S. Maternal Childhood Adversity as a Risk for Perinatal Complications and NICU Hospitalization. Journal of Pediatric Psychology . 2021;46(7):801-813. https://doi.org/10.1093/jpepsy/jsab027 .
- Mersky JP, Lee CP. Adverse childhood experiences and poor birth outcomes in a diverse, low-income sample. BMC pregnancy and childbirth. 2019;19(1). https://doi.org/10.1186/s12884-019-2560-8.
- Reid JA, Baglivio MT, Piquero AR, Greenwald MA, Epps N. No youth left behind to human trafficking: Exploring profiles of risk. American journal of orthopsychiatry. 2019;89(6):704.
- Diamond-Welch B, Kosloski AE. Adverse childhood experiences and propensity to participate in the commercialized sex market. Child Abuse & Neglect. 2020 Jun 1;104:104468.
- Shonkoff, J. P., Garner, A. S., Committee on Psychosocial Aspects of Child and Family Health, Committee on Early Childhood, Adoption, and Dependent Care, & Section on Developmental and Behavioral Pediatrics (2012). The lifelong effects of early childhood adversity and toxic stress. Pediatrics, 129(1), e232–e246. https://doi.org/10.1542/peds.2011-2663
- Narayan AJ, Kalstabakken AW, Labella MH, Nerenberg LS, Monn AR, Masten AS. Intergenerational continuity of adverse childhood experiences in homeless families: unpacking exposure to maltreatment versus family dysfunction. Am J Orthopsych. 2017;87(1):3. https://doi.org/10.1037/ort0000133.
- Schofield TJ, Donnellan MB, Merrick MT, Ports KA, Klevens J, Leeb R. Intergenerational continuity in adverse childhood experiences and rural community environments. Am J Public Health. 2018;108(9):1148-1152. https://doi.org/10.2105/AJPH.2018.304598.
- Schofield TJ, Lee RD, Merrick MT. Safe, stable, nurturing relationships as a moderator of intergenerational continuity of child maltreatment: a meta-analysis. J Adolesc Health. 2013;53(4 Suppl):S32-38. https://doi.org/10.1016/j.jadohealth.2013.05.004 .
Adverse Childhood Experiences (ACEs)
ACEs can have a tremendous impact on lifelong health and opportunity. CDC works to understand ACEs and prevent them.
- Get 7 Days Free
BW LPG Limited - Q1 2024 Financial Report Release and Earnings Presentation on 30 May 2024
BW LPG Limited (“BW LPG”, the “Company”, OSE ticker code: “BWLPG.OL”, NYSE ticker code: “BWLP”) will release its Q1 2024 Financial Report at approximately 0700hrs CET/ 0100hrs EDT on 30 May 2024.
This press release features multimedia. View the full release here: https://www.businesswire.com/news/home/20240515801136/en/

Very Large Gas Carrier BW Magellan (Photo: Business Wire)
In connection with this release, BW LPG will hold an Earnings Presentation with Kristian Sørensen (CEO) and Samantha Xu (CFO). The details are as follows:
Date: Thursday, 30 May 2024
The financial results presentation will be held live via webcast and conference call. To attend the webcast, please register in advance at the link below:
https://events.q4inc.com/attendee/878685784
Details to dial into the conference call are as follows: Access code: 204800 Norway: +47 815 03 308 USA: +1 646 664 1960 Singapore: +65 3163 4602
Other location dial in details: https://tinyurl.com/bwlpgconcall2024
A recording of the presentation will also be available after the event on the Company’s website at https://www.investor.bwlpg.com .
About BW LPG
BW LPG is the world's leading owner and operator of LPG vessels, owning and operating Very Large Gas Carriers (VLGC) with a total carrying capacity of over 3 million CBM. With five decades of operating experience in LPG shipping, experienced employees and an in-house LPG trading division, BW LPG offers an integrated, flexible, and reliable service to customers. More information about BW LPG can be found at www.bwlpg.com .
BW LPG is associated with BW Group, a leading global maritime company involved in shipping, floating infrastructure, deepwater oil & gas production, and new sustainable technologies. Founded in 1955 by Sir YK Pao, BW controls a fleet of over 490 vessels transporting oil, gas and dry commodities, with its 200 LNG and LPG ships constituting the largest gas fleet in the world. In the renewables space, the group has investments in solar, wind, batteries, biofuels and water treatment.
This information is subject to disclosure requirements pursuant to Section 5-12 of the Norwegian Securities Trading Act.
Kristian Sørensen, CEO Samantha Xu, CFO E-mail: [email protected]
View source version on businesswire.com: https://www.businesswire.com/news/home/20240515801136/en/
Market Updates
5 stocks to buy while they’re trading at big discounts, markets brief: tech stocks lead ahead of nvidia earnings, how anti-obesity drugs are innovating the healthcare market, what’s happening in the markets this week, why immigration has boosted job gains and the economy, what to invest in during high inflation, never mind market efficiency: are the markets sensible, starbucks stock could use a pick-me-up after big selloff; is it a buy, stock picks, should you buy and hold an artificial intelligence portfolio, 3 cheap and dependable dividend-growth stocks to buy, the best bank stocks to buy, after earnings, is roblox stock a buy, sell, or fairly valued, after earnings, is lyft stock a buy, a sell, or fairly valued, 8 stock picks in the apparel industry, baidu earnings: advertising weakness offset by continued growth in cloud business, going into earnings, is target stock a buy, a sell, or fairly valued, sponsor center.
IMAGES
VIDEO
COMMENTS
Learn how to write, plan, format, design and give a report presentation in PowerPoint with tips and templates. Find out how to choose a topic, create an outline, use slides, and avoid common mistakes.
Learn how to visualize hard data into an appealing and engaging report presentation for your audience. Find tips on preparation, charts, diagrams, layouts, design elements and practice.
Summary. A strong presentation is so much more than information pasted onto a series of slides with fancy backgrounds. Whether you're pitching an idea, reporting market research, or sharing ...
Learn the 10 qualities of a good presentation and follow the step-by-step guide to prepare an effective one. Find out how to use Venngage's presentation templates, features and tips to create stunning slides and deliver a memorable presentation.
Make use of white space and clean graphics to get your point across more effectively. This consulting deck does what most report presentations neglect, which is to highlight key takeaways (and bolding the important points) to avoid cluttering the audience with too much information. 6. Getting ready for IFRS 16 by KPMG.
Learn from the examples of leading business consultancies how to create a great report presentation that engages your audience and delivers your message. Find out the key tips on data, design, visuals, flow, insight and more.
It should also state the aims and objectives of your report and give an overview of the methodology used to gather and analyze the data. Make sure you include a powerful topic sentence. Main body. The main body of the report should be divided into subsections, each dealing with a specific aspect of the topic.
Learn from a Silicon Valley CEO and a Harvard instructor how to deliver effective and memorable business presentations. Find out how to be concise, use images, vary your voice, and practice your skills.
Learn how to write a presentation with a clear structure, engaging introduction, compelling visuals, and engaging delivery. Follow the step-by-step guide with examples and tips from AhaSlides, a tool for interactive presentations.
The secret structure of great talks. From the "I have a dream" speech to Steve Jobs' iPhone launch, many great talks have a common structure that helps their message resonate with listeners. In this talk, presentation expert Nancy Duarte shares practical lessons on how to make a powerful call-to-action. 18:00.
Visualize Data Instead of Writing Them. When adding facts and figures to your research presentation, harness the power of data visualization. Add interactive charts and graphs to take out most of the text. Text with visuals causes a faster and stronger reaction than words alone, making your presentation more memorable.
Here are five presentation tips to help you create a strong presentation and wow your audience: 1. Keep it simple. Simple means something different to everyone. Before creating your presentation, take note of your intended audience and their knowledge level of your subject. You'll want your content to be easy for your intended audience to follow.
The Best Annual Report Presentation Templates For Your Boss' Admiration. Key quotes: "To make your data look juicy you can choose bright colors, creative elements, and high-quality graphics." "Shaping your business achievements into a single presentation that will impress the audience may take a lot of time."
Learn how to plan, structure, and design a research report and a presentation based on your project. This document provides tips, examples, and guidelines for different sections and formats of your report and presentation.
This report format follows a formal writing style and dives into a topic related to the student's academic studies. Create your own Presentation Report with this easy-to-edit template! Edit and Download. For more report examples you can learn from, check out our guide on Report Examples With Sample Templates.
In the case of a research presentation, you want a formal and academic-sounding one. It should include: The full title of the report. The date of the report. The name of the researchers or department in charge of the report. The name of the organization for which the presentation is intended.
To save you time and effort, I have curated a list of 5 versatile case study presentation templates, each designed for specific needs and audiences. Here are some best case study presentation examples that showcase effective strategies for engaging your audience and conveying complex information clearly. 1. Lab report case study template.
Download the "Marketing Project Progress Report" presentation for PowerPoint or Google Slides and take your marketing projects to the next level. This template is the perfect ally for your advertising strategies, launch campaigns or report presentations. Customize your content with ease, highlight your ideas and captivate your audience with a...
Learn how to choose a subject, collect and organize information, determine your objective, consider your audience, and write an outline for a presentation report. Find tips on how to write an introduction, body, and conclusion, and use visuals to enhance your report.
Weekly Report Presentation. Use This Template. Just as an annual report reviews the past year's goals, projects, and progress, a weekly report presentation examines the past week completely. Your weekly report should quickly recap what was completed in the past week, what you're working on now, and plans for the week ahead.
With Visme's Presenter Studio, you can record your presentation and share it with your audience. Record your screen, audio, and video, or switch off your camera for an audio-only presentation. Present asynchronously on your own time, at your own pace. Let your colleagues watch it at their convenience. Create Your Presentation.
Click anywhere on your slide and press Ctrl+A. Then, in the Home tab on the ribbon, click "Arrange." First click "Align Center," and then bring the menu up again, so that you can click "Align Middle." Press Ctrl+A again to select your timer, and you can then move your timer or copy and paste it elsewhere.
Summary. What happens when you have to give a presentation to an audience that might have some professionals who have more expertise on the topic than you do? While it can be intimidating, it can ...
Free Google Slides theme and PowerPoint template. Download the News Report Writing Tips for Students presentation for PowerPoint or Google Slides. The education sector constantly demands dynamic and effective ways to present information. This template is created with that very purpose in mind. Offering the best resources, it allows educators or ...
We walk you through five easy steps to create a report right in Visme, making it as easy as possible for you to get started creating your own report right away. Log into your Visme dashboard and create a new project. Choose a report template to jumpstart your design.
Free online map maker. Make a custom map. Easy to create and customize. Professionally designed and formatted. Millions of photos, icons and illustrations. Easily download or share. Design stunning custom maps with ease. No art background or design software necessary. Use Canva's free online map maker and create your maps you can add to ...
2 Adjusted Operating Income is a non-GAAP measure. See additional information at the end of the release regarding non-GAAP financial measures. 3 Comp sales for the 13-week period ended April 26th, 2024 compared to the 13-week period ended April 28th, 2023, and excludes fuel. 4 Constant Currency is a non-GAAP measure.
Adverse childhood experiences, or ACEs, are potentially traumatic events that occur in childhood (0-17 years). Examples include: 1. Experiencing violence, abuse, or neglect. Witnessing violence in the home or community. Having a family member attempt or die by suicide.
Go ahead and select Documents and then click Reports. From here, you'll find different themes and templates to work with. Just find a template that works for you and start creating your quarterly reports. Remember the colors, images, and other page elements in our templates are customizable.
In connection with this release, BW LPG will hold an Earnings Presentation with Kristian Sørensen (CEO) and Samantha Xu (CFO). The details are as follows: Date: Thursday, 30 May 2024